Embed Size (px)
Citation preview
The Role of Canopy Structure in the Spectral Variation of Transmission andAbsorption of Solar Radiation in Vegetation Canopies
Oleg Panferov, Yuri Knyazikhin, Ranga B. Myneni, Jörg Szarzynski,
Stefan Engwald, Karl G. Schnitzler, and Gode Gravenhorst
O. Panferov, K.-G. Schnitzler, and G. Gravenhorst are with the Institute of Bioclimatology
University Göttingen, Büsgenweg 2, D-37077, Göttingen, Germany (e−mail: [email protected];
[email protected]; [email protected]).
Y. Knyazikhin and R. B. Myneni are with the Department of Geography, Boston University, 675
Commonwealth Avenue, Boston, MA 022150 (e−mail: [email protected];
J. Szarzynski is with Geographical Institute, Mannheim University, L9, 1-2, D−68131Mannheim,
Germany (e−mail: [email protected]).
S. Engwald is with Botanical Institute, Bonn University, Meckenheimer Allee 170, D−53115
Bonn, Germany (e−mail: [email protected]).
CorrespondenceYuri Knyazikhin
Department of Geography, Boston University675 Commonwealth Avenue
Boston, MA 022150Tel.: 617-353-8843Fax: 617-353-8399
E-mail: [email protected]
Submitted for publication inIEEE Transactions on Geoscience and Remote Sensing
August, 1999
page 2 of 30
Abstract−This paper presents empirical and theoretical analyses of spectral hemisphericalreflectances and transmittances of individual leaves and the entire canopy sampled at two sitesrepresentative of equatorial rainforests and temperate coniferous forests. The empirical analysisindicates that some simple algebraic combinations of leaf and canopy spectral transmittances andreflectances eliminate their dependencies on wavelength through the specification of two canopyspecific wavelength independent variables. These variables and leaf optical properties govern theenergy conservation in vegetation canopies at any given wavelength of the solar spectrum. Thepresented theoretical development indicates that these canopy specific wavelength independentvariables characterize the capacity of the canopy to intercept and transmit solar radiation undertwo extreme situations, namely, when individual leaves (1) are completely absorptive, and (2)totally reflect and/or transmit the incident radiation. The interactions of photons with the canopyat red and near-infra red spectral bands well approximate these extreme situations. Thus, if onetreats the vegetation canopy as a dynamical system and the canopy spectral interception andtransmission as dynamical variables, the system has two independent states, namely, canopieswith totally absorbing and totally scattering leaves. Any intermediate state is a superposition ofthese pure states. Such an interpretation provides a powerful means of accurately specifyingchanges in canopy structure both from ground-based measurements and remotely sensed data.This concept underlies the operational algorithm of global leaf area index and fraction ofphotosynthetically active radiation absorbed by vegetation developed for the MODIS (moderateresolution imaging spectroradiometer) and MISR (multiangle imaging spectroradiometer)instruments of the Earth Observing System Terra mission.
Index Terms−radiative transfer, vegetation remote sensing, MODIS, MISR, EOS Terra,leaf area index.
I. INTRODUCTION
Land surface processes are important components of the terrestrial climate system. Anaccurate description of interactions between the surface and the atmosphere requires reliablequantitative information on the fluxes of mass and momentum over terrestrial areas, where theyare closely associated with the rates of evapotranspiration and photosynthesis. The vegetationcanopy is a special type of surface not only due to its role in the Earth’s energy balance but alsodue to its impact on the global carbon cycle. The problem of accurately evaluating the exchangeof carbon between the atmosphere and the terrestrial vegetation has received not only scientific[1] but also political attention [2].
The solar energy that transits through the atmosphere to the vegetation canopy is madeavailable to the atmosphere by reflectance and transformation of radiant energy absorbed byplants and soil into fluxes of sensible and latent heat and thermal radiation through a complicatedseries of bio-physiological, chemical and physical processes. Therefore, to quantitatively predictthe vegetation and atmospheric interactions, it is important to specify those environmentalvariables that drive the short-wave energy conservation in vegetation canopies; that is,partitioning of the incoming radiation between canopy absorption, transmission and reflection.Many studies investigated the interaction of solar radiation with vegetation canopies throughcanopy radiation models (see, for example, reviews [3]−[4]). Most of them, however, wereaimed at examining the scattering behavior of various types of vegetation which is correlated
page 3 of 30
with vegetation−atmosphere processes [5]−[6]. In the case of forests, for example, theinteractions of photons with the rough and rather thin surface of tree crowns and also with theground exposed through gaps between the crowns determine the observed variation in thedirectional reflectance distribution. On the other hand, it is the radiation regime within thecanopy that triggers bio-physiological, chemical and physical processes, which to a high degreeinfluence the exchange of energy, water, and carbon with the atmosphere [6]. Therefore, modelsthat account only for the scattering properties of vegetation, although accurate, are not sufficientto describe the radiation regime within the vegetation canopies.
The concept of characterizing the state of vegetation canopies via the law of energyconservation arises in the context of remote sensing of leaf area index (LAI) and fraction ofabsorbed photosynthetically active radiation (fAPAR) [7]−[8]. Recently, an algorithm for theestimation of LAI and fAPAR based on the law of energy conservation has been developed foroperational use with MODIS (moderate resolution imaging spectroradiometer) and MISR(multiangle imaging spectroradiometer) data expected during the Earth Observing System (EOS)Terra mission [9]−[10]. A key idea in incorporating the energy conservation law for the retrievalof LAI and fAPAR is the use of eigenvalues of the transport equation to relate optical propertiesof individual leaves to vegetation canopy transmittance, absorptance and reflectance. Althoughthis approach was theoretically justified [9]−[10] and prototyped with available satellite data[11]−[12], no direct evidence of its validity was presented. Our primary objective in this article isto demonstrate that the theoretically derived relationships between the eigenvalues of thetransport equation, leaf and canopy optical properties are consistent with those derived frommeasurements. Eigenvalues that drive the short-wave energy conservation in vegetation canopiesare measurable parameters. Therefore, our secondary objective is to demonstrate the importanceof including systematic measurements of leaf and canopy spectral properties in ground-basedobservation programs at research stations. Such data can be used to accurately specify dynamicsof canopy structure changes.
II. EXPERIMENTAL SITES, INSTRUMENTATION AND MEASUREMENTS
The hemispherical canopy transmittance (reflectance) for nonisotropic incident radiation isthe ratio of the mean downward radiation flux density at the canopy bottom (mean upwardradiation flux density at the canopy top) to the downward radiation flux density above thecanopy. The hemispherical leaf transmittance (reflectance) is the portion of radiation flux densityincident on the leaf surface that the leaf transmits (reflects). The hemispherical leaf albedo is thesum of the hemispherical leaf transmittance and reflectance. All these variables are wavelengthdependent. The reflectance and transmittance of an individual leaf depends on the tree species,growth conditions, leaf age and its location in the canopy space. Two sites were chosen tomeasure leaf and canopy optical properties, and these are described below.
A. Sites and Instruments
1) Forêt des Abeilles site: This site is an equatorial rainforest at the border of Réserve de LaLopé-Okanda, Gabon (Forêt des Abeilles; 0°40′82′′S and 11°54′65′′E; altitude: 215 ma.s.l.). The measurements were made during an Operation Canopy La Makande’99campaign (www.radeau-des-cimes.com). The dominant vegetation type is “Marantaceae-forest” [13]−[14] containing typical climbing species of Marantacee (e.g., Haumania
page 4 of 30
liebrechtsiana, Hypselodelphis violaceae, or Ataenidia conferta) in the understory. Theforest is clearly stratified into three main layers, namely, (i) the understory, up to 10 mhigh; (ii) the lower tree layer (lower canopy), 15 to 20 m, with species like Trichoscyphaspp. (Anacardiaceae), Enantia chlorantha and Polyalthia suaveolens (both Annonaceae)as well as various Lauraceae (Ocotea gabonensis) and Rubiaceae; (iii) the upper treelayer (upper canopy), 30 m and higher (up to 60 m). The mean tree height is about 45 m.The predominant species are Burseraceae Aucoumea klaineana (Okoumé). Otherimportant species are Dacryoides buettneri (Burseraceae, Irvingia gabonensis and I.grandifolia (Irvingiaceae), various Dialium species (Caesalpiniaceae) and otherLeguminoses or the giant Ongokea gore (Olacaceae).
2) Solling Site: This site is a coniferous (Picea abies (L.) Karst) forest in Sollingapproximately 50 km North-West of Göttingen, Germany (“F1 Fläche;” 52.770N and9.580E, Altitude: 500 m a.s.l.). The forest is about 110 yrs old. The trees on the averageare 29 m of height, with an average crown height of about 11 m. The tree density is 467trees/ha. The ground beneath the canopy is a dark soil with litter-fall. A one-year shoot ofsize 5-7 cm was taken as the basic foliage element (“needle leaf”) in this study. This sitewas selected in 1966 as an experimental region for a “Solling Project” within the EUProgram “Experimental Ecology” [15].
3) Instruments: The LI−1800 Spectroradiometer with Standard Cosine Receptor was used tomeasure canopy spectral transmittances and to determine the spectral composition ofincoming radiation in the region from 400 nm to 1100 nm, at 1 nm resolution. Theinstrument was mounted on a tripod with a specially constructed holder to keep theLI−1800 horizontal at about 1 m above the forest floor. The LI−1800−12 ExternalIntegrating Sphere was mounted on LI−1800 to measure the leaf spectral hemisphericaltransmittances and reflectances. The Spectroradiometer was calibrated by means of theLI−1800-02 Optical Radiation Calibrator. In Solling, the canopy spectral hemisphericalreflectances were also measured.
B. Field Measurements
All measurements at the Forêt des Abeilles site (Gabon) were carried out with one LI−1800instrument. A rope system was mounted between an Irvinia grandifolia tree and a raft [16] thatwas located on the crown of a Dialium sp. The instrument was pulled up and the spectralvariation of incident radiation flux at the top (non−obscured by tree crowns) was measured first;then it was pulled down and measurements of spectral downward radiation fluxes wereperformed at six different points located 1 m above the forest floor. The average of these sixmeasurements was taken as the mean downward radiation flux at the canopy bottom. To accountfor changes in sun position during ground measurements and consequent changes in spectralcomposition of the incident radiation, a second measurement of the incident spectral flux at thetop was made immediately following the ground measurements. The mean of the twomeasurements was used to specify the incident spectral flux in the canopy. The mean canopytransmittance was evaluated as the ratio between mean fluxes of transmitted and incidentradiation fields. These measurements were carried out on March 3, 1999 between 10:00 and11:00, and March 4, 1999, between 11:20 and 12:20, under clear sky conditions.
Five leaves from each layer were sampled and their spectral transmittances and reflectanceswere measured one hour later under laboratory conditions using the same LI−1800 and the
page 5 of 30
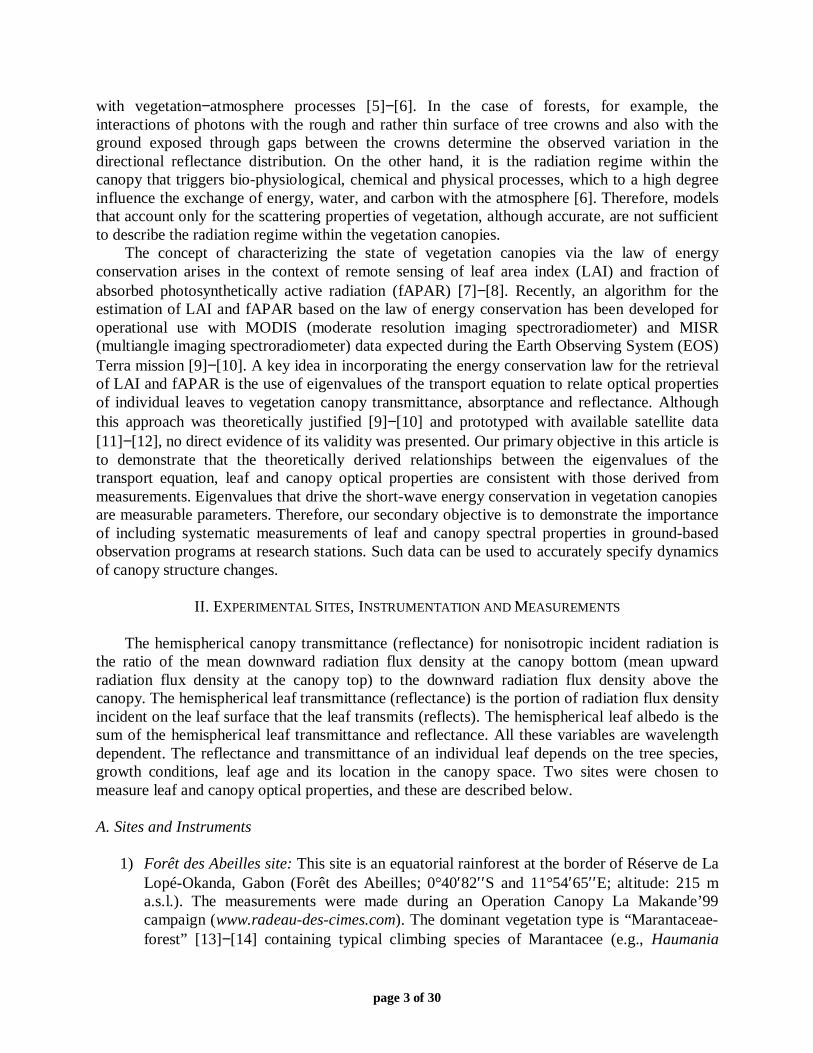
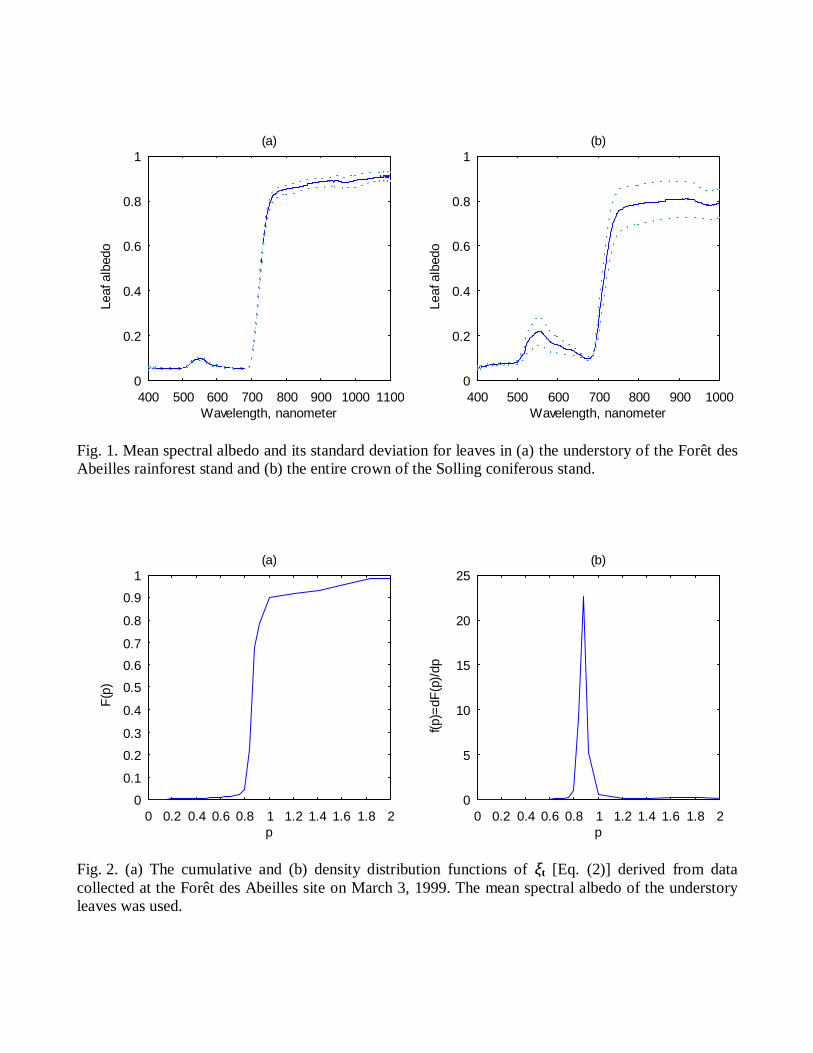
External LI−1800 Integrating Sphere. For each layer, a pattern of leaf spectral transmittance andreflectance is taken as the average of the five measurements. Figure 1a shows the leaf spectralalbedo (leaf transmittance plus leaf reflectance) and its standard deviation for leaves in theunderstory of the Forêt des Abeilles rainforest stand.
In Solling, two LI−1800s calibrated to one another were used to measure the canopy spectraltransmittances. The first one was mounted on the top of a 50 m tower [17]. It was programmed tosample the spectral composition of the downward radiation flux every 3 min. The secondinstrument was used to measure the spectral variation of downward radiation fluxes at sixdifferent points from a height of 1m above the forest floor. Six simultaneous measurements ofincident and transmitted radiation fluxes were performed on June 4, 1998 between 15:30 and16:00, and June 6, 1998 between 11:30 and 12:00, under clear sky conditions. For each day,mean spectral downward radiation fluxes at the canopy top and bottom were evaluated, usingthese six simultaneous measurements. The mean canopy transmittance was evaluated as the ratiobetween mean fluxes of transmitted and incident radiation. On June 4, 1998, the second LI−1800was mounted on the top of the tower to measure the upward radiation flux. The spectral variationof upward fluxes was collected between 13:00 and 13:30. The ratio between upward anddownward radiation fluxes above the canopy was taken as canopy reflectance.
One-year shoots of size 5-7 cm with needles of different ages (current year and second year)were sampled from sun and shade parts of crowns. Their spectral transmittances and reflectanceswere measured one hour later in a laboratory, using the second LI−1800 with the LI−1800−12External Integrating Sphere. We followed the standard measurement methodology [18]; thoughno geometrical corrections were done [19]. The spectral curves were separated into four groupswith respect to the location of the shoot in the canopy space (sun and shade crown) and needleage (current year and last year). Each group was represented by five spectral curves. From thesedata, three patterns of mean leaf spectral transmittance and reflectance were derived. They wereassumed to represent the optical properties of the leaves in the sun, shade and the entire crown.Figure 1b demonstrates the mean spectral albedo and its standard deviation of leaves in thewhole crown.
III. CANOPY SPECTRAL TRANSMITTANCE AND ABSORPTANCE: DATA ANALYSIS
Let t(λ), r(λ) and a(λ) be the canopy transmittance, reflectance and absorptance atwavelength λ. These variables are the three basic components of the law of energy conservation.If reflectance of the ground below the vegetation is zero, this law can be expressed as
t(λ) + r(λ) + a(λ) = 1; (1)
that is, radiation absorbed, transmitted, and reflected by the canopy is equal to radiation incidenton the canopy. Let leaf transmittance, reflectance and albedo at wavelength λ be denoted by τ(λ),ρ(λ) and ω(λ), respectively. They are related as
ω(λ) = τ(λ) + ρ(λ) .
Let i(λ) be the canopy absorption a(λ) normalized by leaf absorption 1−ω(λ), i.e.,
page 6 of 30
)(1
)()(1
)(1
)()(
λωλλ
λωλλ
−−−=
−= rta
i .
For a vegetation canopy bounded at the bottom by a black surface, this variable is the meannumber of photon interactions with leaves at wavelength λ before either being absorbed orexiting the canopy. We term this variable canopy interception.
A. Spectral Invariant
We begin the data analysis by examining the variable
)()()()(
)()(),(
1100
1010 λχλωλχλω
λχλχλλξχ −−= , (2)
where χ represents either the canopy transmittance, t(λ), canopy interception, i(λ), or canopyreflectance, r(λ). Note that ξχ, χ=t, i, r , are symmetrical functions with respect to the spectralvariables λ0 and λ1; that is, ξχ(λ0,λ1)= ξχ(λ1,λ0). These functions are undefined when λ0=λ1.Thus, we consider the case when λ0>λ1. For each day and site, the spaces Dχ, χ=t, i, r , ofrealizations of ξχ(λ0,λ1) were created; that is, values of the function ξχ(λ0,λ1) corresponding to allcombinations of λ0 and λ1 for which λ0>λ1 were calculated. In order to avoid division by zeroin (2), values of ξχ(λ0,λ1) corresponding to couples (λ0,λ1) for which the difference|ω(λ0)χ(λ0)−ω(λ1)χ(λ1)| > 5⋅10-4 were used. For the Solling site, Dχ included values of ξχ(λ0,λ1)which corresponding to the to mean spectral albedos of leaves in sun, shade and the wholecrown. For the Forêt des Abeilles site, patterns of mean albedos representing different verticallayers and the entire canopy were used to define Dχ. For each pattern of leaf albedo, histogramsof ξχ(λ0,λ1) were derived. Finally, the cumulative distribution functions, Fχ(p) (probability thatξχ<p; 0≤Fχ(p)≤1), and density distribution functions, fχ(p)=dFχ(p)/dp, were derived from thesehistograms.
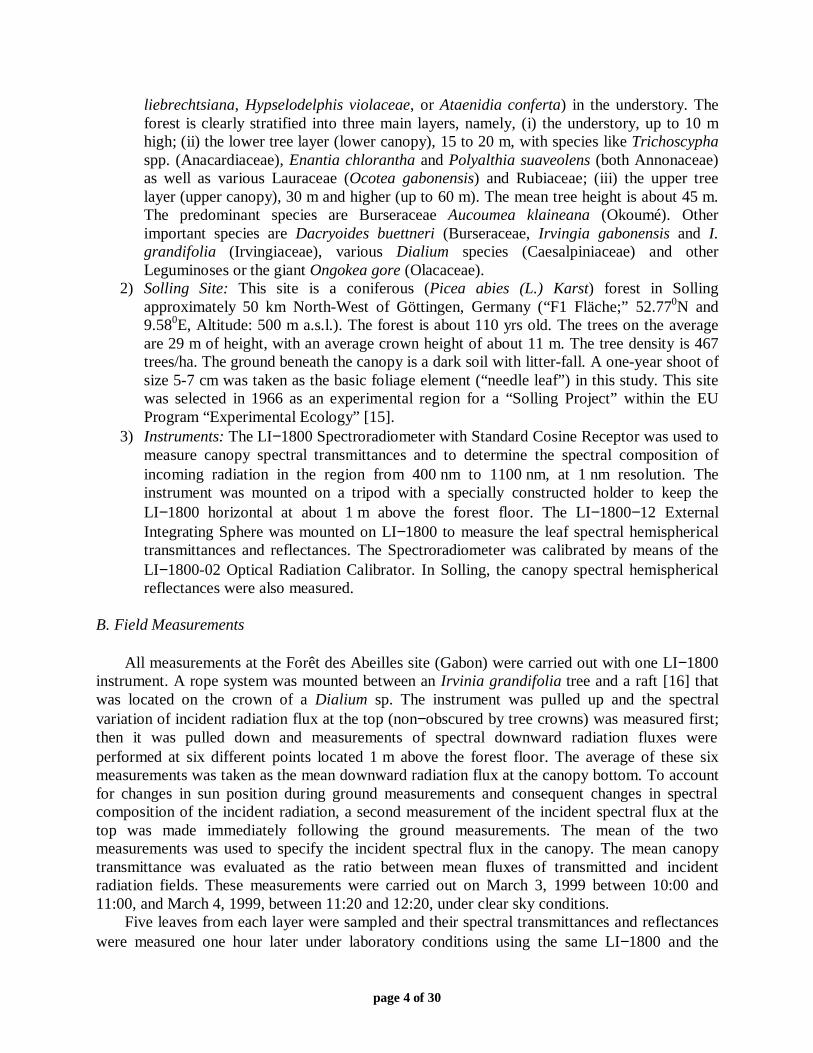
The cumulative and density distribution functions Ft(p) and ft(p) derived from data collectedat the Forêt des Abeilles site on March 3, 1999, are shown in Fig. 2. A subset of Dt
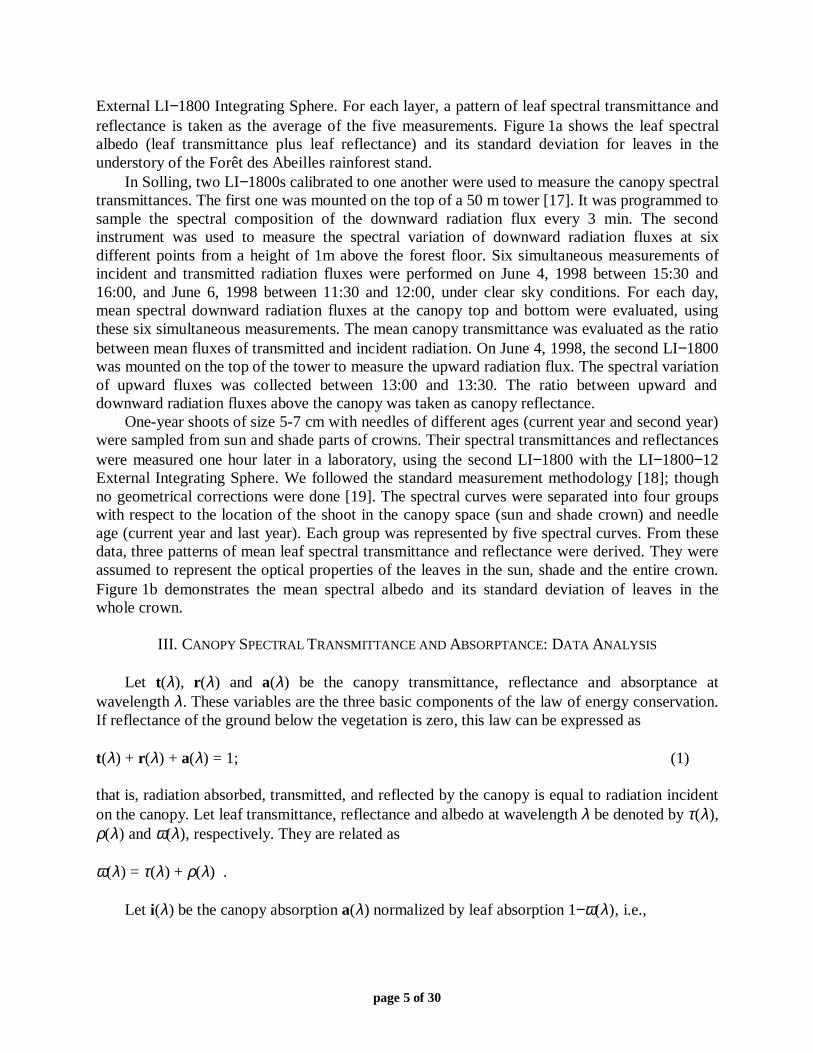
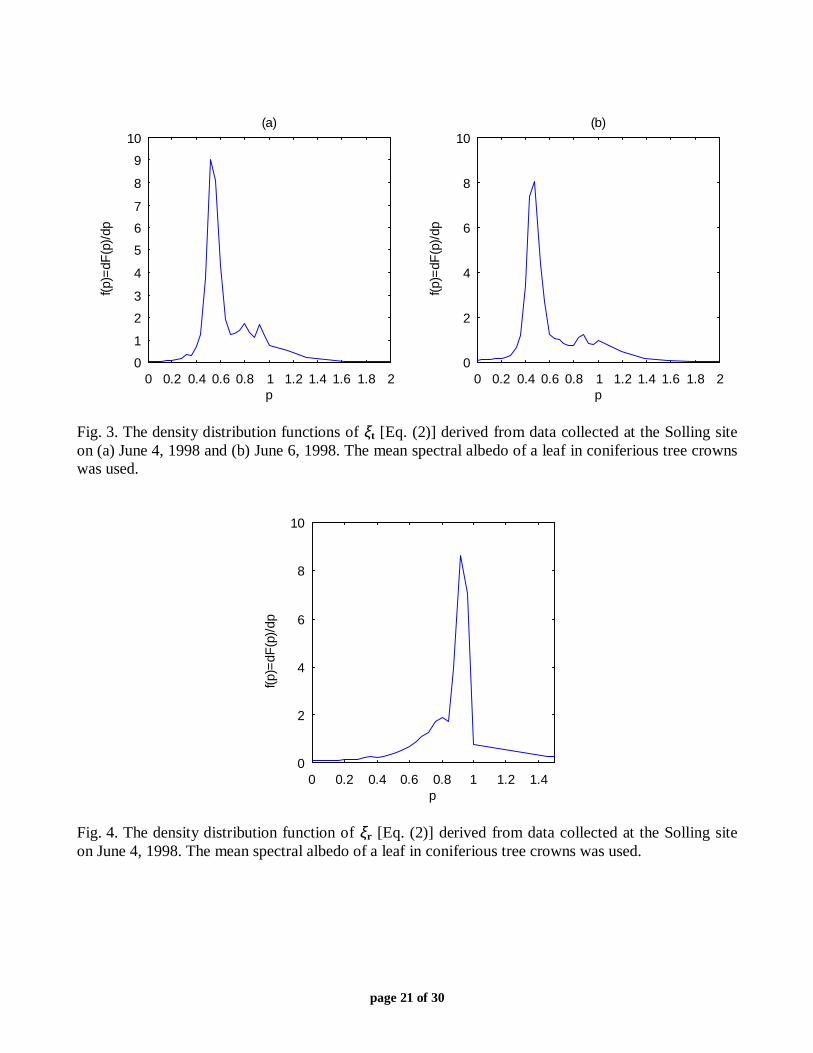
corresponding to this spectral albedo contained 213341 values of (2). One can see that Ft(p) isvery close to the Heaviside function, with a sharp jump from zero to 1 at pt of about 0.88. Thedensity distribution function ft(p) behaves as the Dirac delta-function, i.e., dFt(p)/dp≈δ(p−pt).Indeed, 74% of the 213341 values fell in the interval [0.84, 0.96); 4% and 22% of these valueswere below 0.84 and above 0.96, respectively. The density distribution function achieved itsmaximum at pt=0.88. The distribution functions Ft(p) and ft(p) corresponding to the same meanalbedo and derived from data collected on March 4, 1999, exhibited similar behavior. However,the maximum of ft(p) was at pt=0.96. The density distribution functions ft(p) derived from datacollected at the Solling site on June 4, 1998 between 15:30 and 16:00 and June 6, 1998 between11:30 and 12:00 are shown in Fig. 3. The space Dt was formed from values of ξt(λ0,λ1)corresponding to spectral variables from the interval [550 nm, 1000nm]. Values of pt at whichthe density distribution functions reached their maximum were 0.52 (June 4, 1998) and 0.48(June 6, 1998). Thus, the most probable value of ξt is strongly sensitive to the canopy structureand slightly to sun position. Figure 4 demonstrates the density distribution function fr(p) for the
page 7 of 30
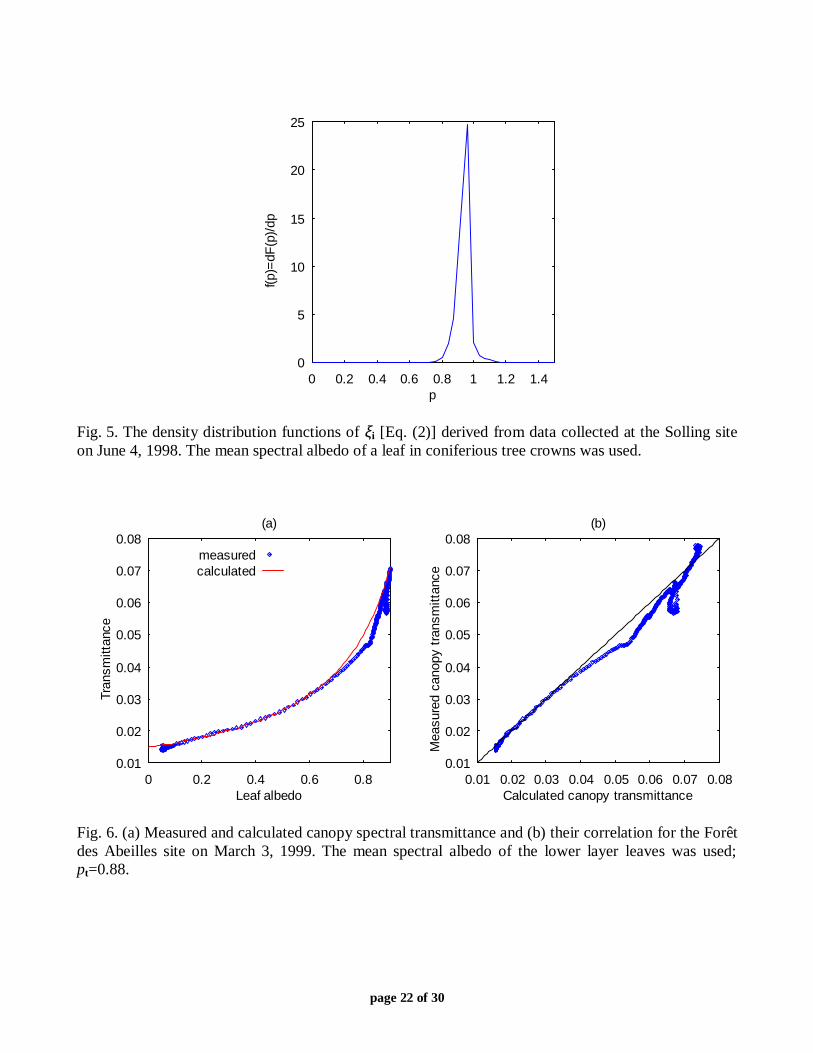
canopy reflectance derived from Solling data. Combinations of (λ0,λ1) were formed from theinterval [550 nm, 1000nm], and the mean spectral albedo of leaves in the entire crown was used.The maximum of fr(p) was at pr=0.92. Figure 5 shows the density distribution function fi(p) forcanopy interception derived from Solling data (June 4, 1998) using the same pattern of leafspectral albedo and the spectral interval [400 nm, 1000nm]. The interval [0.92,1] contained 79%of 170405 values in the space Di; maximum of fi(p) was at pi=0.94. Thus, with a high probability,the variables (2) are wavelength independent, i.e., ξχ is invariant with respect to the wavelength.
B. Spectral Variation of Canopy Transmittance and Absorptance
Results presented in section III.A indicate that simple algebraic combinations of leaf andcanopy spectral transmittances and reflectances are only slightly sensitive to the wavelength. Letpχ, χ=t, i, r , be mathematical expectations of ξχ. Resolving (2) with respect to χ(λ), one obtainsthe most probable canopy spectral transmittance (χ=t), interception (χ=i) and reflectance (χ=r)as
)()(1
)(1)( 0
0 λχλωλω
λχχ
χ
p
p
−−
= . (3)
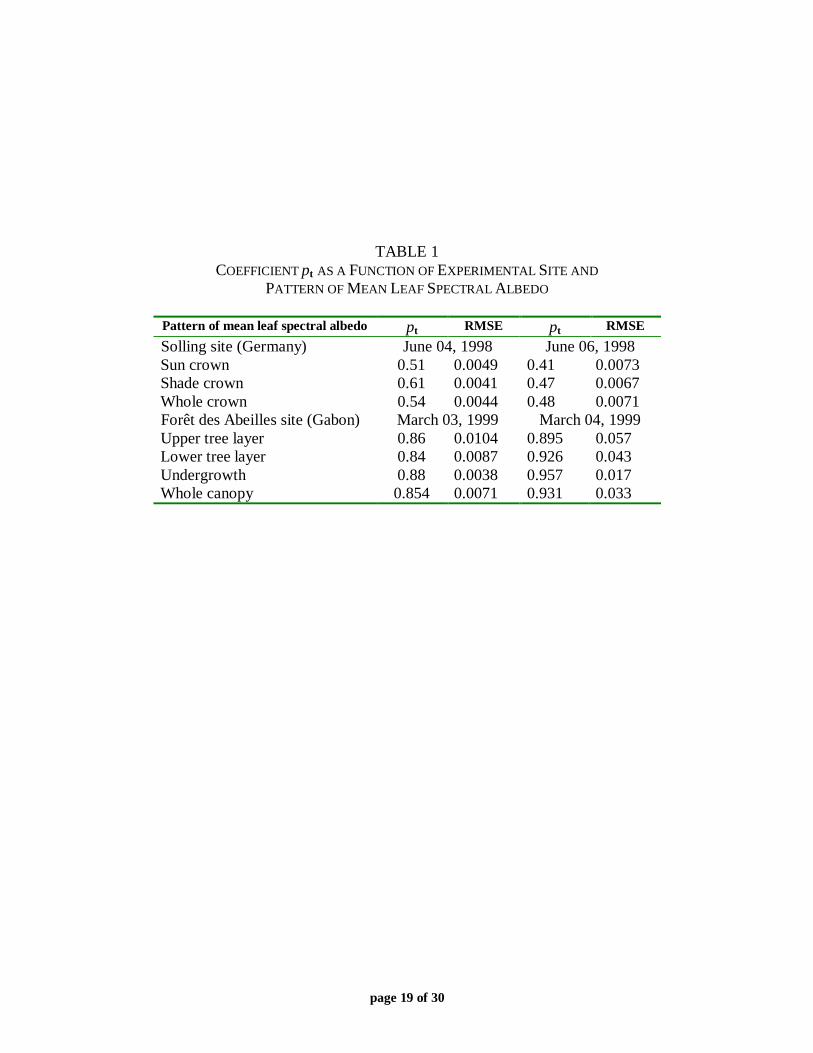
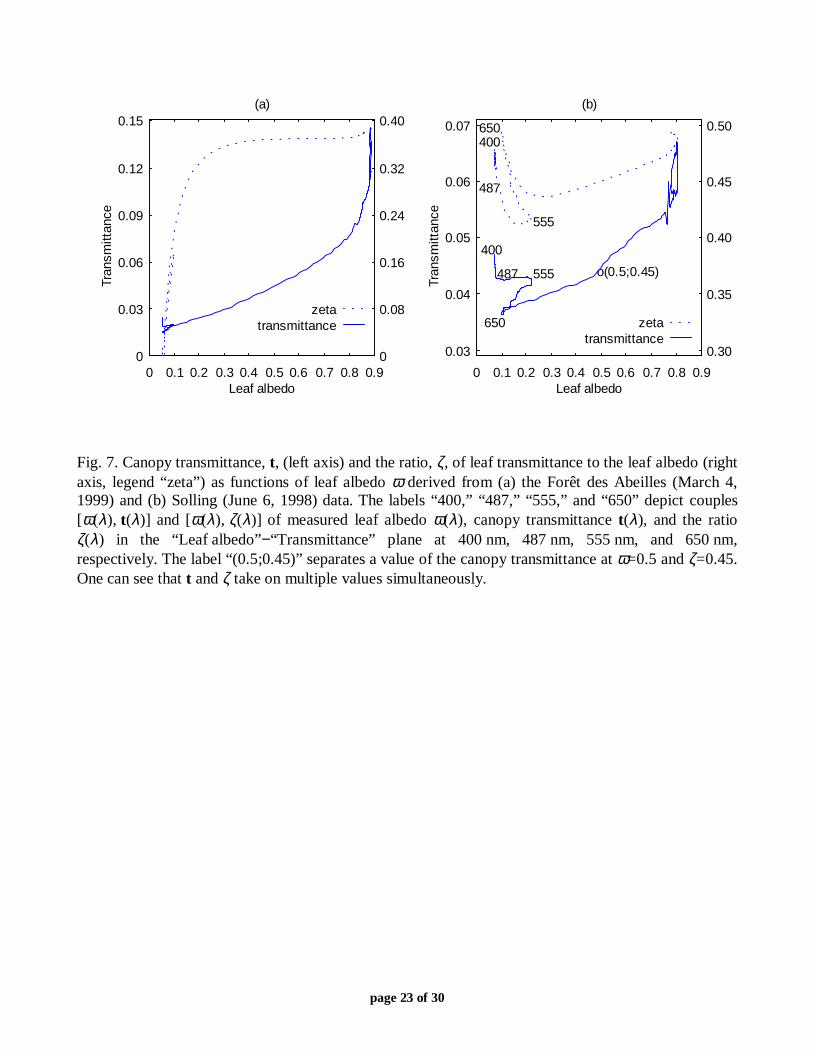
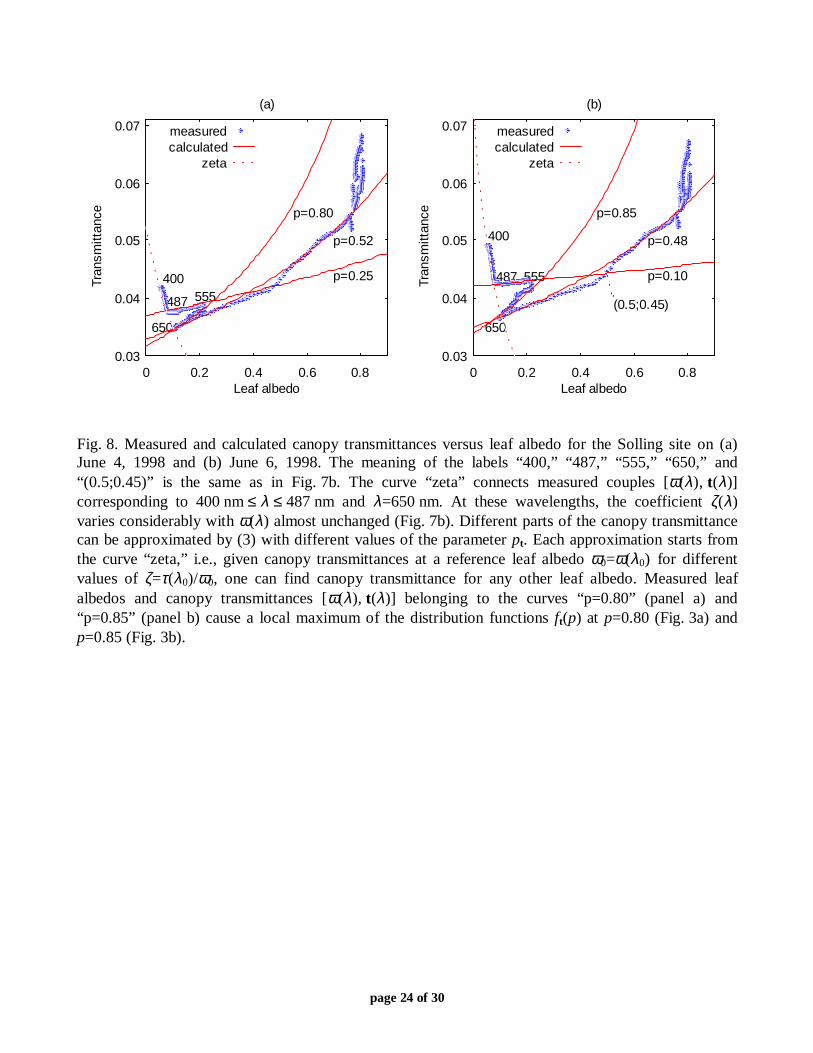
If our hypothesis about the invariance of (2) is correct, one can evaluate canopy transmittance,reflectance and absorptance a(λ)=[1−ω(λ)]i(λ) at any wavelength once these variables areknown at a reference wavelength λ0. It will be shown in this subsection that equation (3) can beused to evaluate canopy transmittance and interception (and, consequently, canopy absorptance),but not canopy reflectance. For each experimental site, we solved the following problem: giventhe pattern of mean leaf spectral albedo (defined in section II.B) find pχ such that thedisagreement between measured values of χ(λ) and those evaluated with (3) is minimized. Table1 presents coefficient pt as a function of the site and pattern of mean leaf spectral albedo. For theSolling site, the best value of pt was 0.54 (June 4, 1998) and 0.48 (June 6, 1998). Both of thesecorrespond to the needle mean spectral albedo averaged over the entire tree crown. Meanspectral albedo of understory leaves provided best agreement between measured and evaluatedcanopy spectral transmittances in the case of the Forêt des Abeilles site. Values of pt were 0.88(March 3, 1999) and 0.957 (March 4, 1999). Figure 6 demonstrates measured and calculatedcanopy spectral transmittances and their correlation for the Forêt des Abeilles site on March 3,1999. A one-to-one correspondence between leaf albedo and canopy transmittance can be seenfor almost all values of leaf albedo. Each plot in Fig. 7 contains two curves; the first with the leftvertical axis shows the transmittance of the Solling forest on June 6, 1998 as a function of leafalbedo, while the second with the right vertical axis presents the ratio ζ of leaf transmittance τ toleaf albedo, i.e., ζ=τ/ω, as a function of leaf albedo. One can see that the functions t and ζ takeon multiple values simultaneously. However, if canopy transmittances at a reference leaf albedoω0= ω(λ0) for different values of ζ=τ(λ0)/ω0 are known one can easily find canopy transmittanceat any other leaf albedo (Figure 8). For example, a value of the canopy transmittance at ω=0.5and ζ=0.45 (the point labeled as “(0.5;0.45)” in Fig. 8b) can be evaluated with (3) using canopytransmittance at ω=0.5 and ζ=0.45 (the point labeled as “487” in Fig. 8b) and the parameterpt=0.10 (the curve “p=0.10” in Fig. 8b).
page 8 of 30
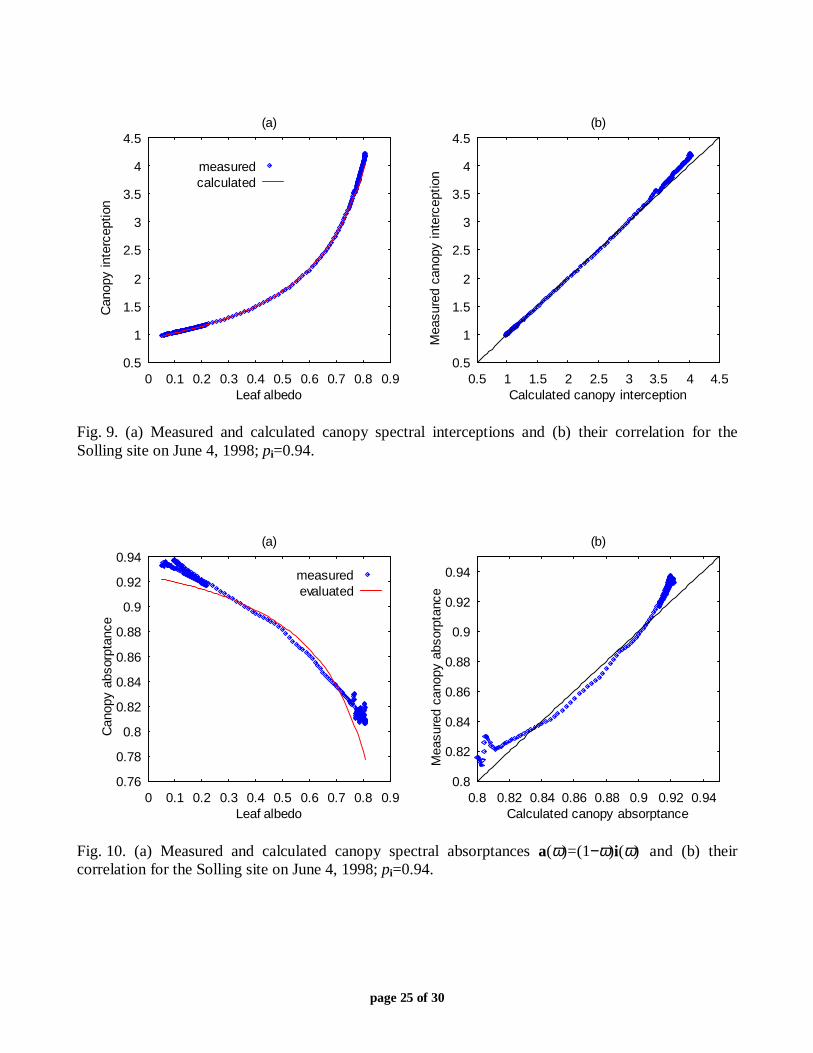
Figure 9 demonstrates measured and calculated canopy spectral interceptions and theircorrelation for the Solling site on March 3, 1999. One can see that equation (3) approximates thecanopy spectral interception very accurately. Given canopy interception, canopy spectralabsorptance can be evaluated as a(λ)=[1−ω(λ)]i(λ). Substituting this expression into (3), oneobtains the following formula for canopy spectral absorptance [9]
)()(1
)(1
)(1
)(1)( 0
0
0 λλωλω
λωλωλ aa
i
i
−−
−−=
p
p. (4)
Figure 10 shows measured and calculated canopy spectral absorptances and their correlation forthe Solling site on March 3, 1999.
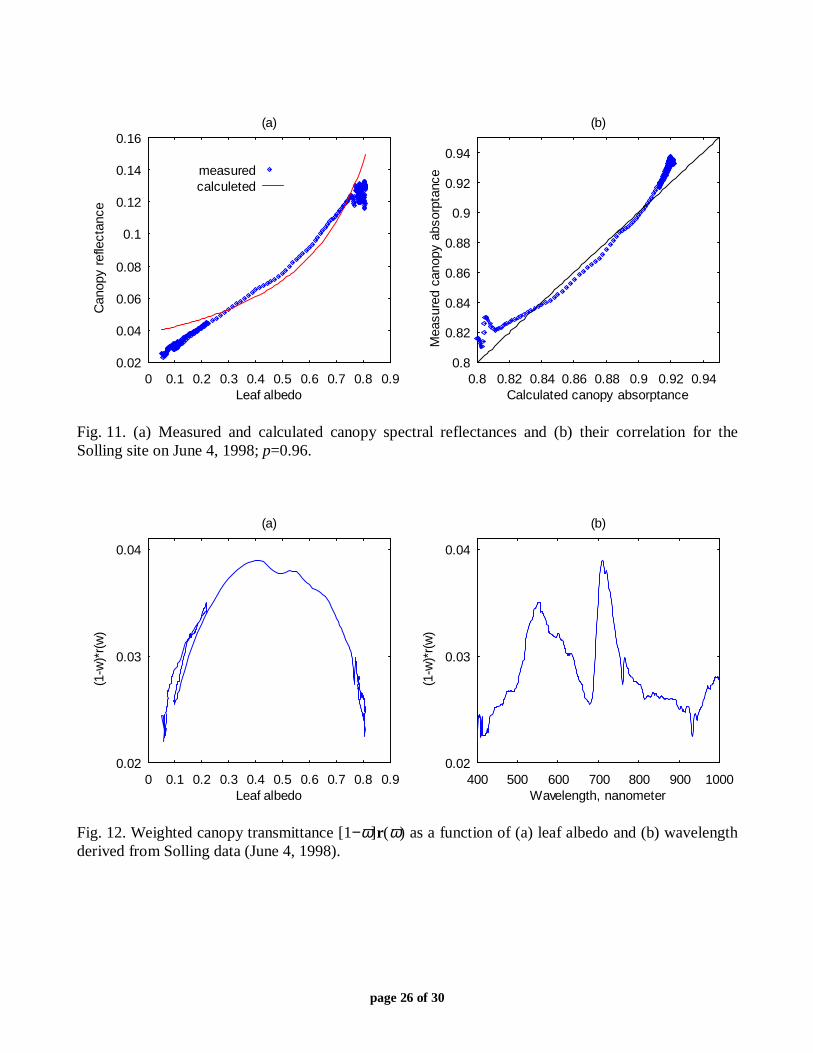
Calculations presented in sub-section III.A indicate that the density distribution functionfr(p) for canopy reflectance localizes some values of ξr (Fig. 4). Figure 11 demonstratesmeasured and calculated canopy spectral reflectances and their correlation for the Solling site onMarch 3, 1999. Although the measured and calculated curves are sufficiently close to each other,equation (3) can not be used to approximate canopy spectral reflectance. Indeed, let us assumethat this equation describes the physics of the radiative transfer process correctly. It follows fromthis assumption that (1−ω)r(ω) is either a decreasing (if pr<1) or increasing (if pr>1) functionwith respect to ω. Figure 12a shows the function (1−ω)r(ω) derived from Solling data (March 4,1999). One can see that our assumption contradicts the measurements. Thus, the use of (3) tosimulate spectral variation of canopy reflectance can lead to a wrong interpretation of theradiative transfer process in vegetation canopies.
Why does the density distribution function fr(p) localize to some values of ξr? One can seefrom Fig. 12a that (1−ω)r(ω) is a nearly symmetrical function relative to ω≈0.4; that is, it takesapproximately the same values at 0.4+ω and 0.4−ω. Equation (2) can be rewritten in anequivalent form, namely,
)()()()](1[)()](1[
)()(),(
100011
1010 λλλλωλλω
λλλλξrrrr
rrr −+−−−
−= .
It follows from this equation that ξr takes a value of about 1 if |0.4−ω(λ0)|≈|0.4+ω(λ1)|. Abouthalf of couples [ω(λ1),ω(λ2)] corresponding to different (λ0, λ1) satisfy this condition (Fig. 12b).As a result, about 52% of ξr values fall in the interval [0.92, 1). Thus, in this particular case, thesymmetry of (1−ω)r(ω) results in a localization of ξr values. This example demonstrates that agood fit between measured and modeled canopy reflectances is not a sufficient argument torelate such a model to the physical process; that is, such a model can still violate the law ofenergy conservation. The canopy spectral interception, absorptance and transmittance data areconsistent with the behavior of (1−ω)χ(ω), χ=t, i, indicated by (2) (Figs. 10, 13a and 13b).
It will be recalled that the upward flux of canopy leaving radiation was measured at onespatial point above the forest stand (section II.B), leading to a rather high uncertainty in themeasured canopy spectral reflectance [17]. The effect of this uncertainty on the canopy spectralabsorptance is not quit discernable (Fig. 13b) because the contribution of canopy reflectance, r ,to the evaluation of the measured canopy absorptance a=1−t−r is rather small (Figs. 8a, 10a, and11a). However, values of (1−ω)r(ω) derived from a particular measurement of canopy spectralreflectance can greatly differ from those obtained by resolving the energy conservation law (1)
page 9 of 30
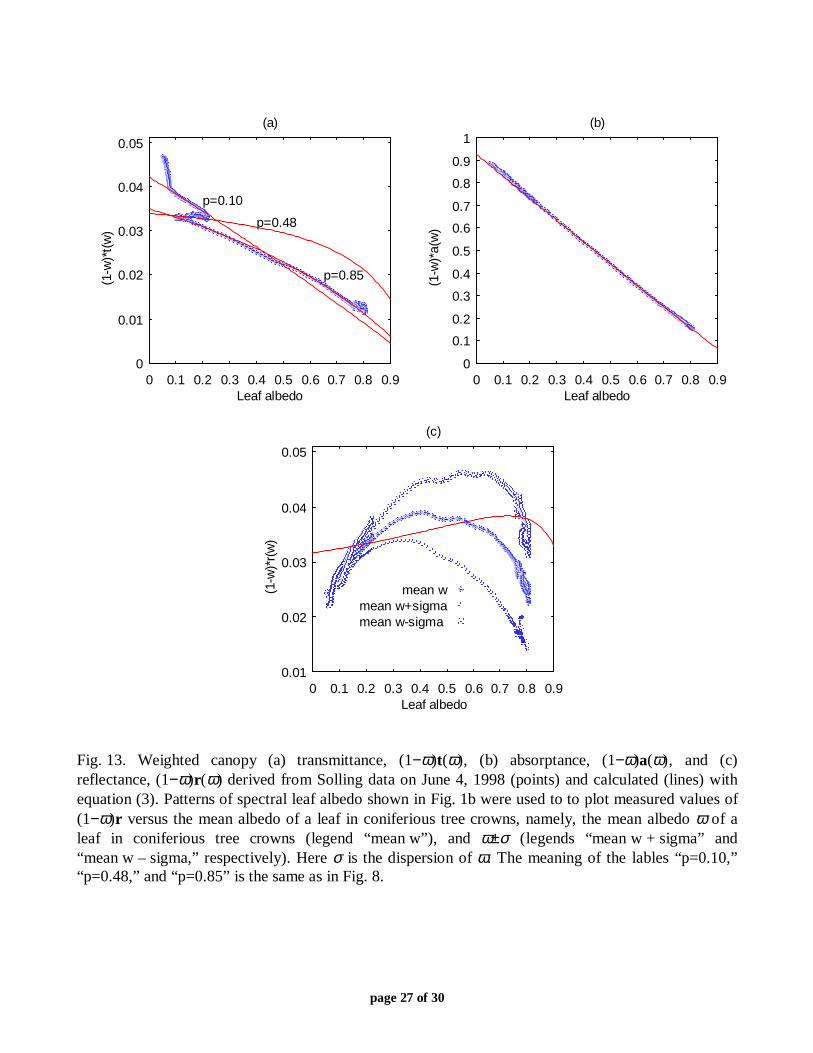
with respect to r and using (2) to evaluate canopy spectral transmittance and absorptance. Figure13c shows the weighted canopy reflectances (1−ω)r(ω) versus the mean albedo of a leaf inconiferous tree crowns for three patterns of the weight (1−ω) derived from the Solling data(March 03, 1999). Essential variations in the shape of (1−ω)r(ω) and consequently in the pointsat which (1−ω)r(ω) reaches its maximum can be clearly seen. Although not enough data werecollected to evaluate the mean canopy reflectance accurately, the canopy reflectance calculatedwith equations (1) and (2) reflects the correct tendency in the behavior of data; that is, (1−ω)r( ω)is not a monotonic function with respect to the leaf albedo ω (Fig. 13c). This finding suggeststhat focusing on the development of canopy radiation models without accounting for canopytransmittance and absorptance (which are sensitive to the within-canopy radiation regime) canlead to an incorrect interpretation of measured data.
Thus, the energy conservation in vegetation canopies at a given band of the solar spectrum isdriven by optical properties of individual leaves at this spectral band and two wavelengthindependent structural parameters. Simple algebraic combinations of leaf and canopy spectraltransmittances and reflectances which eliminate their dependencies on wavelength determine thestructural variables. Given canopy optical properties of an individual leaf, two structuralvariables and canopy transmittance and absorptance at a reference wavelength, the correctproportion of canopy absorptance, transmittance and reflectance can be found at any wavelengthof the solar spectrum. The following section presents a theoretical justification of this statement.
IV. CANOPY SPECTRAL TRANSMITTANCE AND ABSORPTANCE: THEORY
Analysis presented in section III indicates that the cumulative distribution functions ofrandom variables ξχ, χ=t, i, can be described by the Heaviside function. It means that theexpression (2) do not depend on wavelength; that is, they are invariant with respect to thespectral variable. In this section, we develop theoretical arguments to interpret the physicalmeaning of the points at which the cumulative distribution functions of ξχ, χ=t, i, jump from zeroto 1. The analysis is based on the following mathematical concept: the measurement of adynamical variable must result in an eigenvalue of a linear operator representing that dynamicalvariable. The state in which the dynamical variable has that value is represented by thecorresponding eigenvector [20]. In the case of canopy transmittance, an operator which assignsdownward radiances at the canopy bottom to incoming radiation can be taken as the linearoperator representing the transmittance process. An operator which sets in correspondence to theincoming radiation, a three-dimensional radiation field within the canopy can be taken torepresent the interception process. The equation of radiative transfer in the vegetation canopy[21] is used to specify these operators.
A. Radiative Transfer Problem for Vegetation Media
Consider a vegetation canopy in the layer 0 < z < H. The top z = 0 and bottom z = Hsurfaces form its upper and lower boundaries. The position vector r denotes the Cartesian triplet(x,y,z) with its origin at the top of the canopy. Assume that photons interact with phytoelementsonly; that is, photon interactions with the optically active elements of the atmosphere inside thelayer 0 < z < H are ignored. The radiation field within the layer can be described by the three-dimensional transport equation [22]−[24], namely,
page 10 of 30
Ω′Ω′Ω→Ω′Γ=ΩΩ+Ω∇•Ω ∫ drIrrurIrGrurI L ),(),(1
)(),(),()(),(4
L
πλλλλ π
. (5)
Here Iλ is the monochromatic radiance which depends on wavelength λ, location r and directionΩ. The unit vector Ω is expressed in spherical coordinates with respect to (−Z) axis and cos-1µand φ are its polar angle and azimuth; uL is the leaf area density distribution function; G is theprojection of leaf normals at r onto a plane perpendicular to the direction Ω; and Γλ is the areascattering phase function [22]. A precise description of these variables can be found in [22]−[23].Below, the formulation of [23] is adopted.
The equation of transfer (5) is a statement of the energy conservation law in the phasespace (r,Ω); that is, the first term characterizes the change in radiance along Ω at r, the otherterms show whether the changes take place at the expense of absorption and scattering in thevegetation canopy (second term), at the expense of the scattering from other direction into Ω(third term). The wavelength independent function σ(r,Ω)=uL(r)G(r,Ω) is the total interactioncross-section (attenuation coefficient); that is, σds is the probability that a photon will bescattered or absorbed while traveling an elementary distance ds along the direction Ω. Thiscross-section is the sum of the wavelength dependent scattering, σs,λ(r,Ω), and absorption,σa,λ(r,Ω), coefficients, i.e.,
σ(r,Ω) = σs,λ(r,Ω) + σa,λ(r,Ω) . (6)
The scattering coefficient is defined [21]
∫ Ω′Ω′→ΩΓ=Ωπ
λλ πσ
4
Ls, ),(1
)(),( drrur .
Here the integration is performed over the whole sphere 4π; σsds is the probability that a photonwill be scattered while travelling an elementary distance ds along the direction Ω. The absorptioncoefficient then can be specified from equation (6). The magnitude of scattering by the elementsof the vegetation canopy is described using the hemispherical leaf albedo,
),(
),(1
),(),(
),(),( 4
a,s,
s,
Ω
Ω′Ω′→ΩΓ=
Ω+ΩΩ
=Ω∫
rG
dr
rr
rr π
λ
λλ
λλ πσσ
σω . (7)
An individual leaf is assumed to reflect and transmit the intercepted energy in a cosinedistribution about the leaf normal. In this case, the hemispherical leaf albedo ωλ does not dependon the angular variable Ω; the area scattering phase function Γλ is a symmetrical function withrespect to angular variables [25] and the reciprocity property, Γλ(r,Ω′→Ω)=Γλ(r,−Ω′→−Ω), islocally valid.
Let a parallel beam and diffuse radiation be incident on the upper boundary. Reflectance ofthe ground underneath the vegetation canopy is assumed to be zero. This case is given by thefollowing boundary conditions
Iλ(r0,Ω) = jλ(Ω) (for downward directions); (8)
page 11 of 30
Iλ(rH,Ω) = 0 (for upward directions). (9)
Here r0 and rH denote points on the upper and lower boundaries, respectively, and jλ is theintensity of incident (direct and diffuse) radiation. The solution of the boundary value problemexpressed by (5) and the boundary conditions (8) and (9), describes the radiation field in three-dimensional forests [24], [26].
Field measurements described in section II provided the spatial distribution of thefollowing variables: (i) spectral variation of downward (F↓
0,λ) and upward (F↑0,λ) radiation fluxes
above the forest; that is,
∫<
↓ ΩΩ=0
,0 )(µ
λλ µ djF , ∫>
↑ ΩΩ=0
0,0 ),(µ
λλ µ drIF ,
where Iλ(r,Ω) is the solution of the boundary value problem (5), (8)-(9); (ii) spectral variation ofdownward radiation flux F↓
H,λ at the canopy bottom; that is,
∫<
↓ ΩΩ=0
HH,H ),()(µ
λλ µ drIrF , (10)
and (iii) hemispherical spectral leaf albedo ωλ(r). In terms of these notations, canopytransmittance, t, reflectance, r , and interception, i, can be expressed as
λ
λλ,0
HH,H )()(
↓
↓ ><=F
rFt ,
λ
λλ,0
0,0)(
↓
↑ ><=F
Fr ,
λ
πλσ
λ,0
4
0 ),(),(
)(↓
∫∫ ΩΩΩ=
F
drdrIrVi .
Here < >H and < >0 denote the mean over the bottom and top canopy boundary. Thus, all themeasured variables are related via the energy conservation law [i.e., the transport equation (5)and boundary conditions (8) and (9)]. Our goal is to explain the empirical relations derived insection III using this basic physical principle.
B. Scattering Process in Vegetation Media
Assumptions formulated in the previous subsection are sufficient to precisely derivespectral variation of canopy interception from the three-dimensional transport equations; that is,equation (2) for χ= i does not depend on spectral variables [9]. Although a similar statement wasformulated earlier for canopy transmittance [9], no theoretical justification of its validity waspresented. The aim of this subsection is to formulate certain additional assumptions that allowthe derivation of the spectral variation of canopy transmittance.
A simple but realistic model of the area scattering phase function is used to describescattering process in vegetation canopies, namely [22],
page 12 of 30
∫+
ΩΩ→Ω′ΩΩ•ΩΩ=Ω→Ω′Γπ
λλ γ2
LLL,LLL ),,(),(5.0),( drrgr .
Here the integration is performed over the upper hemisphere 2π+; ΩL is the outward normal tothe leaf surface; gL is the probability density of the leaf’s normal distribution over the upperhemisphere; γL,λ is the leaf scattering phase function. For simplicity, specular reflection by leavesis ignored in our analysis which is not critical to the following analysis. Under theseassumptions, the area scattering phase function can be expressed as [21]
.))((),(),,(2
1
))()(,(),,(2
1),(
0))((
LLLLL,L
0))((
LLLLL,L
LL
LL
∫
∫
<Ω•Ω′Ω•Ω
>Ω•Ω′Ω•Ω
ΩΩ•Ω′Ω•ΩΩΩΩ′+
ΩΩ•Ω′Ω•ΩΩΩΩ′=Ω→Ω′Γ
drgrr
drgrtr
λ
λλ
π
π
Here rL,λ and tL,λ are the bi-directional reflectance and transmittance factors of an individual leafwhich are supposed Lambertian; that is, rL,λ(r,Ω′,Ω)=ρ(λ,r) and tL,λ(r,Ω′,Ω)=τ(λ,r) where ρ andτ are the leaf hemispherical reflectance and transmittance, respectively. These variables weremeasured at both the sites described in section II. With these assumptions, the area scatteringphase function can be expressed as
Γλ(r,Ω′→Ω) = ρ(λ,r)Γ +(r,Ω′→Ω) + τ(λ,r)Γ −(r,Ω′→Ω) , (11)
where Γ + and Γ − are wavelength independent functions defined as
∫>Ω•Ω′Ω•Ω±
± ΩΩ•Ω′Ω•ΩΩ=Ω→Ω′Γ0))((
LLLLL
LL
))()(,(2
1),( drgr
π .
It follows from (7) and (11) that the hemispherical leaf albedo can be expressed as [21]
ωλ(r) = ρ(λ,r) + τ(λ,r) .
The spectral leaf reflectance and transmittance are assumed independent of the spatial variable r.Differentiating equation (5) and boundary conditions (8)-(9) with respect to ρ and τ and
accounting for (11), one can obtain that the function
ττ
ρρτρ λλ
∂Ω∂
+∂
Ω∂=Ω
),(),(),;,(
rIrIrv ,
satisfies the equation
Ω′Ω′Ω→Ω′Γ
∂∂+
∂∂=Ω+∇•Ω ∫ drIrruvrGruv L ),(),(
1)(),()(
4
L
πλλπτ
τρ
ρ , (12)
page 13 of 30
and the boundary conditions v(r0,Ω; ρ,τ)=0 for downward directions, and v(rH,Ω; ρ,τ)=0 forupward directions.
C. Eigenvalues and Eigenvectors of the Transport Equation
An eigenvalue of the transport equation is a number θ such that there exists a function ϕwhich satisfies
[ ] ∫ Ω′Ω′Ω→Ω′=ΩΩ+Ω∇•Ωπ
ϕϕσϕθ4
),(),(),(),(),( drrqrrr , (13)
with vacuum boundary conditions. Here q denotes π−1uLΓλ. Under some general conditions [27],the set of eigenvalues θk, k=0,1,2, … and eigenvectors ϕk(r,Ω), k=0,1,2, … is a discrete set; theeigenvectors satisfy the condition of orthogonality. The transport equation has a unique positiveeigenvalue which corresponds to a unique positive eigenvector. This eigenvalue is greater thanthe absolute magnitudes of the remaining eigenvalues. This means that only one eigenvector, sayϕ0, takes on positive values for any r and Ω.
We expand the solution of the transport equation in eigenvectors, namely,
∑∞
=
↓ Ω+Ω=Ω1
00,0 ),;,(),(),;,(),(/),(k
kk raraFrI τρϕτρτρϕτρλλ , (14)
where the coefficients ak do not depend on spatial or angular variables. Here we separate thepositive eigenvector ϕ0 into the first summand. Substituting (14) into equation (12) andaccounting for (13), results in
[ ]∑∞
==
∂−∂
+∂
−∂Ω+∇•Ω
0
0)1()1(
),(k
kkkkkk aar
τϕθτ
ρϕθρσ .
Here θk(ρ,τ) is the eigenvalue corresponding to the eigenvector ϕk. It follows from this equationthat
,2,1,0,0)1()1(
==∂
−∂+∂
−∂k
aa kkkkkk
τϕθτ
ρϕθρ . (15)
The general solution of the first-order partial equation (15) with respect to the function(1−θk)akϕk can be expressed as [28]
[1-θk(ρ,τ)]ak(ρ,τ)ϕk(r,Ω;ρ,τ) = fk(ρ/τ) , (16)
where ρ/τ=const is the characteristic curve of (15), and fk is an arbitrary function of one variable.Letting x=ρ/τ and ω0=ρ+τ, one can specify this function as
page 14 of 30
)1
,1
1()
1,
1
1()
1,
1
1(1)( 000000 ++++
++−=
x
x
xx
x
xa
x
x
xxf kkkk ωωϕωωωωθ .
Substituting this function into (15) one obtains
,))1(,())1(,(),(1
))1(,(1
),(1
)/(),(),(
000000 ωςςωϕωςςω
τρθωςςωθ
τρθτρτρϕτρ
−−−
−−=
−=
kkk
k
k
kkk
a
fa
where ζ=τ(λ0)/(τ(λ0)+ρ(λ0))=τ(λ0)/ω(λ0). The spectral variation of the coefficients ζcorresponding to two different experimental sites is shown in Fig. 7. Thus, if the kth summand ofthe expansion (14) at a reference leaf albedo, ω0=ω(λ0), for different values of parameter ζ isknown, the summand for any other ω(λ) can be easily found. Note that it follows fromorthogonality of the eigenvectors that ϕk does not depend on either τ or ρ. To prove it, oneexponentiates the left and right side of (16) by two and integrates the equation obtained overspatial and angular variables. The maximum positive eigenvalue θ0 corresponding to the positiveeigenvector, can be estimated as [21]
θ0(ρ,τ) = pωλ = [ρ(λ) + τ(λ)] p . (17)
Here p=1-exp(−K) where K is a wavelength independent constant.Substituting (14) into (10) and accounting for (16) and (17), one obtains an expansion for
the canopy transmittance, namely,
H10H
000H0
0 ),;(),(1
))1(,(1),;(
1
1),( ∑
∞
= −−−
+−−
=k
kk
k rTrTp
p ωςτρθ
ωςςωθωςωωτρt . (18)
Here
,2,1,0,),())1(,(),;(0
H000H =ΩΩ−= ∫<
kdrarT kkk
µ
µϕωςςωως
Values of Tk depend on the reference hemispherical leaf albedo ω0, the value of ζ at the referenceleaf albedo, the direction of direct solar radiance Ω0, and the points rH. Let us consider the firstterm of the series (18) as a function of ρ(λ) and τ(λ); that is,T0(ρ,τ)=T0(ζω0,(1−ζ)ω0)(1−pω0)/(1−pω). Resolving this equation with respect to p results in (2)with χ=T0. The cumulative distribution function of p is the Heaviside function. Thus, ift(ρ,τ)=<T0(ρ,τ)>H then the variable (2) is distributed in accordance with the Heaviside function;if the influence of remaining summands in (18) is sufficiently small, i.e., t(ρ,τ)≈<T0(ρ,τ)>H, thenthe cumulative distribution function of p is close to the Heaviside function. Analysis presented insection III indicates that t(ρ,τ)≈<T0(ρ,τ)>H. It means that averaging the canopy transmittanceover the angular variable and the ground surface results in the term sub-scripted by 0 to be
page 15 of 30
dominant in the expansion (14). However, variations in the summands caused by variation in thedirection of incident solar radiation make the coefficient p sensitive to the conditions of canopyilluminations and ζ. Model calculations presented in [9] support these arguments. Thus, if thecanopy transmittance at a reference leaf albedo, ω0=ω(λ0), for different values of parameterζ=τ(λ0)/ω(λ0) is known, the transmittance for any other ω(λ) can be found (Fig. 8b).
It was demonstrated in section III.B that such an interpretation is not valid for the canopyreflectance. A possible explanation is that the downward radiances result from the sum of tworadiation fields. The first is the incident radiation (direct and/or diffuse) that has not interacted inthe canopy, and the second is the intensity of photons scattered one or more times in the canopy(the scattered component). The upward radiation field is represented by the scattered componentonly. Therefore, the linear operators describing canopy reflectance and transmittance aredifferent. Clearly these arguments are not precise, and merit further consideration.
Multiplying (14) by σ and integrating over spatial and angular variables, one obtains aformula for canopy interception. It was shown [9] that the integration procedure results in onlythe positive term containing a0ϕ0. Moreover, the dependence of a0 on the coefficient ζ disappearsin this case. Thus, the canopy interception, i(λ), and absorption, a(λ), depend on the maximumeigenvalue θ0=piω(λ0) and can be expressed by (2) and (4), respectively. Thus, canopyabsorptance is a function of the wavelength independent coefficient p and the hemispherical leafalbedo. Resolving (4) with respect to pi, one obtains the cumulative distribution function of ξi
which is the Heaviside function. Equation (4) describing the spectral variation of canopyabsorptance can be derived as in section III.B.
The following interpretation of the coefficient pi=1-exp(−K) can be given. Taking ω(λ0)=0and ω(λ)=1 in (3), one obtains the following relationship between canopy interception and thecoefficient pi
∫∫∫∫
ΩΩΩ
ΩΩΩ=
===−
=
=
πω
πω
σ
σ
λωλω
4
01
4
00
0
),(),(
),(),(
)1)((
)0)((1
drdrIr
drdrIr
p
V
V
ii
i .
The right side can be evaluated, e.g., using Monte Carlo technique [29], as the ratio N1/N2, whereN1 and N2 are counts of photon interactions with absorbing (ω=0) and scattering (ω=ρ+τ =1)leaves, respectively. For example, if the canopy is idealized as a “big horizontal leaf” thenN1=N2=1, i.e., p=0. The ratio a(λ)/a(λ0) coincides with the ratio [1−ω(λ0)]/[1−ω(λ)] of leafabsorptances at two wavelengths. A deviation of canopy structure from the “big leaf” modelinvolves the dependence of a(λ)/a(λ0) on p. Therefore, models based on the “big leaf” conceptmust be corrected for the effect of canopy structure.
The point pi, at which the cumulative distribution function for the canopy interceptionshows a sharp increase, characterizes the two states of the vegetation canopy; that is, canopywith absorbing and scattering leaves, respectively. All intermediate states can be quantified bythe wavelength dependent maximum eigenvalue piωλ. Thus, an actual state of a given vegetationcanopy is determined by the hemispherical leaf albedo and canopies of the same structure withabsorbing and scattering leaves. The interpretation of the coefficient pt for canopy transmittanceis similar.
page 16 of 30
V. CONCLUSIONS
This paper presents empirical and theoretical analyses of spectral hemisphericalreflectances and transmittances of individual leaves and vegetation canopies. The results showthat spectral variations of canopy absorptance and transmittance are mainly influenced by opticalproperties (spectral leaf transmittance and reflectance) of individual leaves and two wavelengthindependent structural variables. In the case of canopy absorptance, the structural variable isdetermined by the capacity of the canopy of given architecture to intercept incoming solarradiation under two extreme situations, namely, leaves which (1) totally absorb and (2) totallyreflect and/or transmit the incident radiation. The canopy interception capacity is quantified bythe ratio N1/N2 where N1 and N2 are counts of photon interactions with absorbing and scatteringleaves, respectively. In the case of canopy transmittance, this structural variable is the ratiobetween radiation transmitted under the same extreme conditions of completely absorbing andscattering leaves. Canopy absorptance and transmittance at red and near-infrared spectral bandswell approximate these extreme situations. Both structural variables, therefore, are measurableparameters, i.e., they can be estimated from field measurements. An actual capacity of thecanopy to transmit and absorb the incoming radiation at a given wavelength is uniquelydetermined by the product of the mean hemispherical leaf albedo at this wavelength and thecorresponding structural variable. Simple functions which relates optical properties of individualleaves and structural variables to canopy absorptance and transmittance have been derived bothfrom an empirical and theoretical point of view.
The canopy reflectance is related to the canopy transmittance and transmittance via the lawof energy conservation; that is, radiation absorbed, transmitted, and reflected by the canopy isalways equal to radiation incident on the canopy. It follows from this basic physical principlethat canopy reflectance is a function of the optical properties of an individual leaves and twostructural parameters. Therefore, the energy conservation of solar radiation at a given wavelengthis governed by the optical properties (spectral leaf transmittance and reflectance) of individualleaf at this wavelength and two structure-dependent and wavelength-independent variables. Thisfeature of the shortwave energy conservation in vegetation canopies provides a powerful meansfor accurately specifying changes in canopy structure both from ground-based measurements andremotely sensed data [30].
ACKNOWLEDGMENTS
O. Panferov’s research was supported by Bundesministerium für Bildung and Forshung(BMBF), Germany. Y. Knyazikhin’s and R. Myneni’s participation is made possible by theNational Aeronautics and Space Administration (NASA), USA, under contract NAS5-96061.The field campaign in Forèt des Abeilles was supported by the A.F.W Schimper-Foundationfrom H. and E. Walter, Hohenheim, Germany. We are grateful to Prof. Fransis Hallé and histeam “Radeau des Cimes” for organizing the field campaign, technical help and support. Wegreatly acknowledge the encouragement of Prof. Dr. Wilhelm Barthlott (University of Bonn) andPriv. Doz. Dr. Dieter Anhuf (University of Mannheim). Our special thanks also to Prof. DavidLee, Florida State University for technical and scientific help.
page 17 of 30
REFERENCES
[1] J. T. Houghton, L. G. Meira Filho, B. A. Callander, N. Harris, A. Kattenberg, and K.Maskell, Eds., Climate Change: Report of the Intergovernmental Panel on Climate Change(IPCC), Cambridge, Cambridge Univ. Press, 1995.
[2] W. Steffen, I. Noble, J. Canadell, M. Apps, E. D. Schulze, P.G. Jarvis, D. Baldocchi, P.Ciais, W. Cramer, J. Ehleringer, G. Farquhar, C. B. Field, A. Ghazi, R. Gifford, M.Heimann, R. Houghton, P. Kabat, C. Korner, E. Lambin, S. Linder, H. A. Mooney, D.Murdiyarso, W. M. Post, I. C. Prentice, M.R. Raupach, D. S. Schimel, A. Shvidenko, andR. Valentini, “The terrestrial carbon cycle: Implications for the Kyoto Protocol,” Science,vol. 280, pp. 1393-1397, 1998.
[3] R. B. Myneni, J. Ross, and G. Asrar, “A review on the theory of photon transport in leafcanopies in slab geometry,” Agric. For. Meteorol., vol. 45, pp. 1-165, 1989.
[4] J. Ross, Y. Knyazikhin, A. Kuusk, A. Marshak, and T. Nilson, Mathematical Modeling ofthe Solar Radiation Transfer in Plant Canopies, St. Peterburg, Russia: Gidrometeoizdat,1992.
[5] D. S. Kimes, P, J. Sellers, and D. J. Dinner, “Extraction of spectral hemisphericalreflectance (albedo) of surfaces from nadir and directional reflectance data,” Int. J. Rem.Sens., vol. 8, pp. 1727-1746, 1987.
[6] P. J. Sellers, R. E. Dickinson, D. A. Randall, A. K. Betts, F. G. Hall, J. A. Berry, G. J.Collatz, A. S. Denning, H. A. Mooney, C. A. Nobre, N. Sato, C. B. Field, A. Henderson-Sellers, “Modeling the exchanges of energy, water, and carbon between continents and theatmosphere,” Science, vol. 275, pp. 502-509, 1997.
[7] C. O. Justice, E. Vermote, J.R.G. Townshed, R. Defries, D. P. Roy, D.K. Hall., V.V.Salomonson, J. L. Privette, G. Riggs, A. Strahler, W. Lucht, R.B. Myneni, Y. Knyazikhin,S. W. Running, R. R. Nemani, Z. Wan, A. R. Heute, W. van Leeuwen, R. E. Wolfe, L.Giglio, J.-P. Muller, P. Lewis, and M. J. Barnsley, “The moderate resolution imagingspectroradiometer (MODIS): Land remote sensing for global research,” IEEE Trans.Geosci. Remote Sens., vol. 36, pp. 1228-1249, 1998.
[8] J. V. Martonchik, D. J. Diner, B. Pinty, M. M. Verstraete, R. B.Myneni, Y. Knyazikhin,and H. R. Gordon, “Determination of land and ocean reflective, radiative and biophysicalproperties using multi-angle imaging,” IEEE Trans. Geosci. Remote Sens., vol. 36, pp.1266-1281, 1998.
[9] Y. Knyazikhin, J. V. Martonchik, R. B. Myneni, D. J. Diner, and S. W. Running,“Synergistic algorithm for estimating vegetation canopy leaf area index and fraction ofabsorbed photosynthetically active radiation from MODIS and MISR data,” J. Geophys.Res., vol. 103, pp. 32257-32275, 1998.
[10] Y. Knyazikhin, J. V. Martonchik, D. J.Diner, R. B. Myneni, M. M. Verstraete, B. Pinty,and N. Gobron, “Estimation of vegetation canopy leaf area index and fraction of absorbedphotosynthetically active radiation from atmosphere-corrected MISR data,” J. Geophys.Res., vol. 103, pp. 32239-32256, 1998.
[11] Y. Zhang, Y. Tian, Y. Knyazikhin, J. V. Martonchick, D. J. Diner, M. Leroy, and R. B.Myneni, “Prototyping of MISR LAI and FPAR algorithm with POLDER data over Africa,”IEEE Trans. Geosci. Remote Sens., 1999 (submitted for publication).
page 18 of 30
[12] Y. Tian, Y. Zhang, Y. Knyazikhin, R.B.Myneni, J.M. Glassy, D. Dedieu, andS.W.Running, “Prototyping of MODIS LAI and FPAR algorithm with LASUR andLANDSAT data,” IEEE Trans. Geosci. Remote Sens., 1999 (submitted for publication).
[13] White and K. Abernethy, Guide to the Vegetation of the Lope Reseve Gabon, ECOFACGabon, Libreville: Multipress-Gabon, 1987.
[14] S. Engwald, J. Szarzynski, and O. Panferov, “Biodiversity of epiphytes, forest structure andlight regime of an equatorial rainforest in Gabon, Central Africa,” Biologie d´une canopéede forêt tropicale équatoriale - IV. Rapport de la mission: radeau des cimes janvier/mars,Forêt des Abeilles, Gabon, F. Hallé, Ed., 1999 (in preparation).
[15] H. Ellenberg, R. Mayer, and J. Schauermann, Eds., Ökosystemforschung. Ergebnisse desSollingprojektes 1966-1986. Stuttgart, Germany: Verlag Eugen Ulmer, 1986.
[16] F. Hallé, and O. Pascal, Eds., Biologie dúne canopée de foret tropicale équatoriale - II.Rapport de la mission: radeau des cimes octobre/novembre 1991, Réserve de Campo,Cameroun, Opération Canopée & Fondation elf, Lyon, 1992.
[17] O. Panferov, Y. Knyazikhin, J. Kranigk, G. Mießen, G. Gravenhorst, and K.-G. Schnitzler,“Is forest albedo measured correctly,” Meteorologische Zeitschrift, 1999 (in press).
[18] C. S. T. Daughtry, L. L. Biehl, and K. J. Ranson, “A new technique to measure the spectralproperties of conifer needles,” Remote Sens. Environ., vol. 27, pp. 81-91, 1989.
[19] E. M. Middleton, S. S. Chan, R. J. Rusin, and S. K. Mitchell, “Optical Properties of BlackSpruce and Jack Pine Needles at BOREAS Sites in Saskatchewan,” Canadian J. of RemoteSensing, vol. 23, Nr. 2, pp. 108-119, 1997.
[20] P. R. Wallace, Mathematical Analysis of Physical Problems. New York: Dover, 1984.[21] Y. Knyazikhin, and A. Marshak, “Fundamental equations of radiative transfer in leaf
canopies and iterative methods for their solution,” Photon-Vegetation Interactions:Applications in Plant Physiology and Optical Remote Sensing, R. B. Myneni and J. Ross,Eds., New York: Springer-Verlag, 1991. pp. 9-43.
[22] J. Ross, The Radiation Regime and Architecture of Plant Stands, Norwell, Mass.: Dr. W.Junk, 1981.
[23] R.B. Myneni, “Modeling radiative transfer and photosynthesis in three-dimensionalvegetation canopies,” Agric. For. Meteorol., vol. 55, pp. 323-344, 1991.
[24] Y. Knyazikhin, G. Miessen, O. Panfyorov, and G. Gravenhorst, “Small-scale study ofthree-dimensional distribution of photosynthetically active radiation in a forest,” Agric.For. Meteorol., vol. 88, pp. 215-239, 1997.
[25] J. K. Shultis, and R. B. Myneni, “Radiative transfer in vegetation canopies with anisotropicscattering,” J. Quant. Spectrosc. Radiat. Transfer, vol. 39, 2, pp. 115-129, 1988.
[26] J. Kranigk, Ein Model für den Strahlungstransport in Fichtenbeständen, Göttingen,Germany: Cuvillier, 1996.
[27] V. S. Vladimirov, “Mathematical problems in the one-velocity theory of particle transport,”Tech. Rep. AECL-1661, At. Energy of Can. Ltd., Chalk River, Ontario, 1963.
[28] P. I. Richards, Manual of Mathematical Physics. New York: A Pergamon Press Book,1959.
[29] J. Ross, and A. Marshak, “Calculation of canopy bidirectional reflectance using the MonteCarlo method,” Remote Sens. Environ., vol. 24, pp. 213-225, 1998.
[30] R. B. Myneni, C. D. Keeling, C. J. Tucker, G. Asrar, and R. R. Nemani, “Increased plantgrowth in the northern high latitudes from 1981 to 1991,” Nature, vol. 386, 698-702, 1997.
page 19 of 30
TABLE 1COEFFICIENT pt AS A FUNCTION OF EXPERIMENTAL SITE AND
PATTERN OF MEAN LEAF SPECTRAL ALBEDO
Pattern of mean leaf spectral albedo pt RMSE pt RMSE
Solling site (Germany) June 04, 1998 June 06, 1998Sun crown 0.51 0.0049 0.41 0.0073Shade crown 0.61 0.0041 0.47 0.0067Whole crown 0.54 0.0044 0.48 0.0071Forêt des Abeilles site (Gabon) March 03, 1999 March 04, 1999Upper tree layer 0.86 0.0104 0.895 0.057Lower tree layer 0.84 0.0087 0.926 0.043Undergrowth 0.88 0.0038 0.957 0.017Whole canopy 0.854 0.0071 0.931 0.033
0
0.2
0.4
0.6
0.8
1
400 500 600 700 800 900 1000 1100
Leaf
alb
edo
Wavelength, nanometer
(a)
0
0.2
0.4
0.6
0.8
1
400 500 600 700 800 900 1000
Leaf
alb
edo
Wavelength, nanometer
(b)
Fig. 1. Mean spectral albedo and its standard deviation for leaves in (a) the understory of the Forêt desAbeilles rainforest stand and (b) the entire crown of the Solling coniferous stand.
0
0.1
0.2
0.3
0.4
0.5
0.6
0.7
0.8
0.9
1
0 0.2 0.4 0.6 0.8 1 1.2 1.4 1.6 1.8 2
F(p
)
p
(a)
0
5
10
15
20
25
0 0.2 0.4 0.6 0.8 1 1.2 1.4 1.6 1.8 2
f(p)=
dF(p
)/dp
p
(b)
Fig. 2. (a) The cumulative and (b) density distribution functions of ξt [Eq. (2)] derived from datacollected at the Forêt des Abeilles site on March 3, 1999. The mean spectral albedo of the understoryleaves was used.
page 21 of 30
0
1
2
3
4
5
6
7
8
9
10
0 0.2 0.4 0.6 0.8 1 1.2 1.4 1.6 1.8 2
f(p)=
dF(p
)/dp
p
(a)
0
2
4
6
8
10
0 0.2 0.4 0.6 0.8 1 1.2 1.4 1.6 1.8 2
f(p)=
dF(p
)/dp
p
(b)
Fig. 3. The density distribution functions of ξt [Eq. (2)] derived from data collected at the Solling siteon (a) June 4, 1998 and (b) June 6, 1998. The mean spectral albedo of a leaf in coniferious tree crownswas used.
0
2
4
6
8
10
0 0.2 0.4 0.6 0.8 1 1.2 1.4
f(p)=
dF(p
)/dp
p
Fig. 4. The density distribution function of ξr [Eq. (2)] derived from data collected at the Solling siteon June 4, 1998. The mean spectral albedo of a leaf in coniferious tree crowns was used.
page 22 of 30
0
5
10
15
20
25
0 0.2 0.4 0.6 0.8 1 1.2 1.4
f(p)=
dF(p
)/dp
p
Fig. 5. The density distribution functions of ξi [Eq. (2)] derived from data collected at the Solling siteon June 4, 1998. The mean spectral albedo of a leaf in coniferious tree crowns was used.
0.01
0.02
0.03
0.04
0.05
0.06
0.07
0.08
0 0.2 0.4 0.6 0.8
Tran
smitt
ance
Leaf albedo
(a)
measuredcalculated
0.01
0.02
0.03
0.04
0.05
0.06
0.07
0.08
0.01 0.02 0.03 0.04 0.05 0.06 0.07 0.08
Mea
sure
d ca
nopy
tra
nsm
ittan
ce
Calculated canopy transmittance
(b)
Fig. 6. (a) Measured and calculated canopy spectral transmittance and (b) their correlation for the Forêtdes Abeilles site on March 3, 1999. The mean spectral albedo of the lower layer leaves was used;pt=0.88.
page 23 of 30
0
0.03
0.06
0.09
0.12
0.15
0 0.1 0.2 0.3 0.4 0.5 0.6 0.7 0.8 0.9
Tran
smitt
ance
Leaf albedo
(a)
0.08
0.16
0.24
0.32
0.40
0
zetatransmittance
0.03
0.04
0.05
0.06
0.07
0 0.1 0.2 0.3 0.4 0.5 0.6 0.7 0.8 0.9
Tran
smitt
ance
Leaf albedo
(b)
0.30
0.35
0.40
0.45
0.50
400
487 555
650
400
487
555
650
o(0.5;0.45)
zetatransmittance
Fig. 7. Canopy transmittance, t, (left axis) and the ratio, ζ, of leaf transmittance to the leaf albedo (rightaxis, legend “zeta”) as functions of leaf albedo ω derived from (a) the Forêt des Abeilles (March 4,1999) and (b) Solling (June 6, 1998) data. The labels “400,” “487,” “555,” and “650” depict couples[ω(λ), t(λ)] and [ω(λ), ζ(λ)] of measured leaf albedo ω(λ), canopy transmittance t(λ), and the ratioζ(λ) in the “Leaf albedo”−“Transmittance” plane at 400 nm, 487 nm, 555 nm, and 650 nm,respectively. The label “(0.5;0.45)” separates a value of the canopy transmittance at ω=0.5 and ζ=0.45.One can see that t and ζ take on multiple values simultaneously.
page 24 of 30
0.03
0.04
0.05
0.06
0.07
0 0.2 0.4 0.6 0.8
Tran
smitt
ance
Leaf albedo
(a)
p=0.52
555
650
487
p=0.80
p=0.25400
measuredcalculated
zeta
0.03
0.04
0.05
0.06
0.07
0 0.2 0.4 0.6 0.8
Tran
smitt
ance
Leaf albedo
(b)
p=0.85
p=0.48
p=0.10
400
487 555
650
(0.5;0.45)
measuredcalculated
zeta
Fig. 8. Measured and calculated canopy transmittances versus leaf albedo for the Solling site on (a)June 4, 1998 and (b) June 6, 1998. The meaning of the labels “400,” “487,” “555,” “650,” and“(0.5;0.45)” is the same as in Fig. 7b. The curve “zeta” connects measured couples [ω(λ), t(λ)]corresponding to 400 nm ≤ λ ≤ 487 nm and λ=650 nm. At these wavelengths, the coefficient ζ(λ)varies considerably with ω(λ) almost unchanged (Fig. 7b). Different parts of the canopy transmittancecan be approximated by (3) with different values of the parameter pt. Each approximation starts fromthe curve “zeta,” i.e., given canopy transmittances at a reference leaf albedo ω0=ω(λ0) for differentvalues of ζ=τ(λ0)/ω0, one can find canopy transmittance for any other leaf albedo. Measured leafalbedos and canopy transmittances [ω(λ), t(λ)] belonging to the curves “p=0.80” (panel a) and“p=0.85” (panel b) cause a local maximum of the distribution functions ft(p) at p=0.80 (Fig. 3a) andp=0.85 (Fig. 3b).
page 25 of 30
0.5
1
1.5
2
2.5
3
3.5
4
4.5
0 0.1 0.2 0.3 0.4 0.5 0.6 0.7 0.8 0.9
Can
opy
inte
rcep
tion
Leaf albedo
(a)
measuredcalculated
0.5
1
1.5
2
2.5
3
3.5
4
4.5
0.5 1 1.5 2 2.5 3 3.5 4 4.5
Mea
sure
d ca
nopy
inte
rcep
tion
Calculated canopy interception
(b)
Fig. 9. (a) Measured and calculated canopy spectral interceptions and (b) their correlation for theSolling site on June 4, 1998; pi=0.94.
0.76
0.78
0.8
0.82
0.84
0.86
0.88
0.9
0.92
0.94
0 0.1 0.2 0.3 0.4 0.5 0.6 0.7 0.8 0.9
Can
opy
abso
rpta
nce
Leaf albedo
(a)
measuredevaluated
0.8
0.82
0.84
0.86
0.88
0.9
0.92
0.94
0.8 0.82 0.84 0.86 0.88 0.9 0.92 0.94
Mea
sure
d ca
nopy
abs
orpt
ance
Calculated canopy absorptance
(b)
Fig. 10. (a) Measured and calculated canopy spectral absorptances a(ω)=(1−ω)i(ω) and (b) theircorrelation for the Solling site on June 4, 1998; pi=0.94.
page 26 of 30
0.02
0.04
0.06
0.08
0.1
0.12
0.14
0.16
0 0.1 0.2 0.3 0.4 0.5 0.6 0.7 0.8 0.9
Can
opy
refle
ctan
ce
Leaf albedo
(a)
measuredcalculeted
0.8
0.82
0.84
0.86
0.88
0.9
0.92
0.94
0.8 0.82 0.84 0.86 0.88 0.9 0.92 0.94
Mea
sure
d ca
nopy
abs
orpt
ance
Calculated canopy absorptance
(b)
Fig. 11. (a) Measured and calculated canopy spectral reflectances and (b) their correlation for theSolling site on June 4, 1998; p=0.96.
0.02
0.03
0.04
0 0.1 0.2 0.3 0.4 0.5 0.6 0.7 0.8 0.9
(1-w
)*r(
w)
Leaf albedo
(a)
0.02
0.03
0.04
400 500 600 700 800 900 1000
(1-w
)*r(
w)
Wavelength, nanometer
(b)
Fig. 12. Weighted canopy transmittance [1−ω]r(ω) as a function of (a) leaf albedo and (b) wavelengthderived from Solling data (June 4, 1998).
page 27 of 30
0
0.01
0.02
0.03
0.04
0.05
0 0.1 0.2 0.3 0.4 0.5 0.6 0.7 0.8 0.9
(1-w
)*t(
w)
Leaf albedo
(a)
p=0.10
p=0.48
p=0.85
0
0.1
0.2
0.3
0.4
0.5
0.6
0.7
0.8
0.9
1
0 0.1 0.2 0.3 0.4 0.5 0.6 0.7 0.8 0.9
(1-w
)*a(
w)
Leaf albedo
(b)
0.01
0.02
0.03
0.04
0.05
0 0.1 0.2 0.3 0.4 0.5 0.6 0.7 0.8 0.9
(1-w
)*r(
w)
Leaf albedo
(c)
mean wmean w+sigmamean w-sigma
Fig. 13. Weighted canopy (a) transmittance, (1−ω)t(ω), (b) absorptance, (1−ω)a(ω), and (c)reflectance, (1−ω)r(ω) derived from Solling data on June 4, 1998 (points) and calculated (lines) withequation (3). Patterns of spectral leaf albedo shown in Fig. 1b were used to to plot measured values of(1−ω)r versus the mean albedo of a leaf in coniferious tree crowns, namely, the mean albedo ω of aleaf in coniferious tree crowns (legend “mean w”), and ω±σ (legends “mean w + sigma” and“mean w – sigma,” respectively). Here σ is the dispersion of ω. The meaning of the lables “p=0.10,”“p=0.48,” and “p=0.85” is the same as in Fig. 8.
page 28 of 30
AUTHOR BIOGRAPHIES
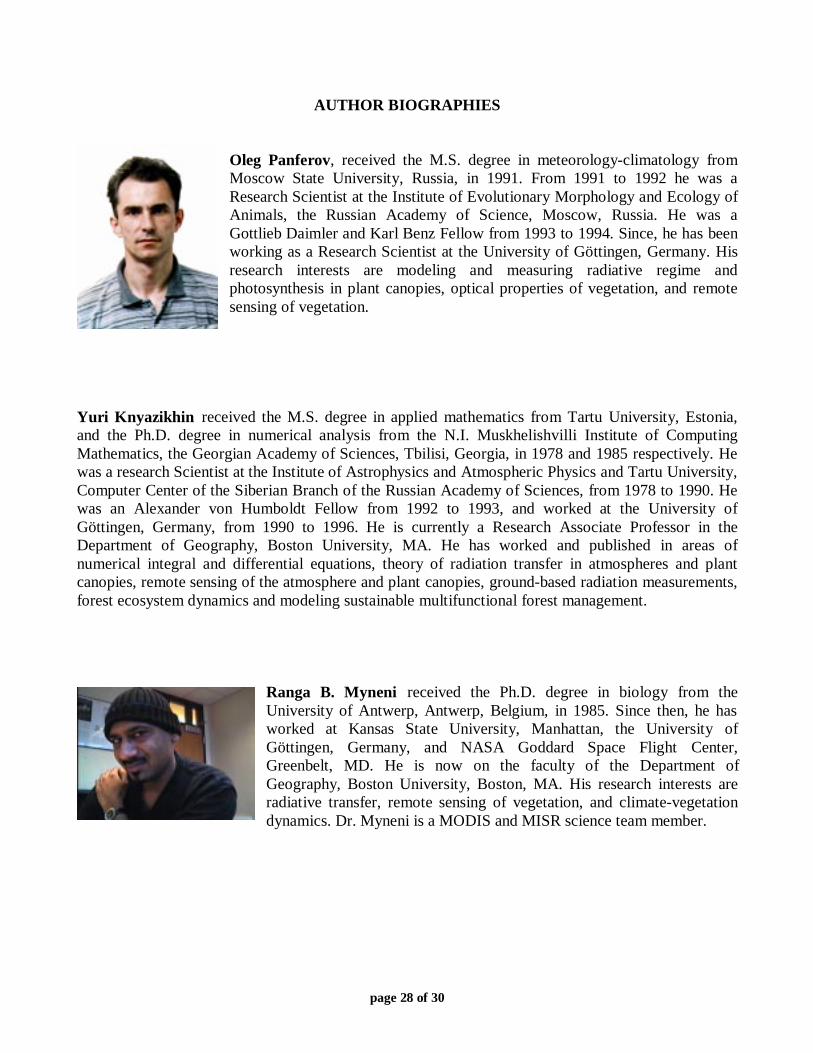
Oleg Panferov, received the M.S. degree in meteorology-climatology fromMoscow State University, Russia, in 1991. From 1991 to 1992 he was aResearch Scientist at the Institute of Evolutionary Morphology and Ecology ofAnimals, the Russian Academy of Science, Moscow, Russia. He was aGottlieb Daimler and Karl Benz Fellow from 1993 to 1994. Since, he has beenworking as a Research Scientist at the University of Göttingen, Germany. Hisresearch interests are modeling and measuring radiative regime andphotosynthesis in plant canopies, optical properties of vegetation, and remotesensing of vegetation.
Yuri Knyazikhin received the M.S. degree in applied mathematics from Tartu University, Estonia,and the Ph.D. degree in numerical analysis from the N.I. Muskhelishvilli Institute of ComputingMathematics, the Georgian Academy of Sciences, Tbilisi, Georgia, in 1978 and 1985 respectively. Hewas a research Scientist at the Institute of Astrophysics and Atmospheric Physics and Tartu University,Computer Center of the Siberian Branch of the Russian Academy of Sciences, from 1978 to 1990. Hewas an Alexander von Humboldt Fellow from 1992 to 1993, and worked at the University ofGöttingen, Germany, from 1990 to 1996. He is currently a Research Associate Professor in theDepartment of Geography, Boston University, MA. He has worked and published in areas ofnumerical integral and differential equations, theory of radiation transfer in atmospheres and plantcanopies, remote sensing of the atmosphere and plant canopies, ground-based radiation measurements,forest ecosystem dynamics and modeling sustainable multifunctional forest management.
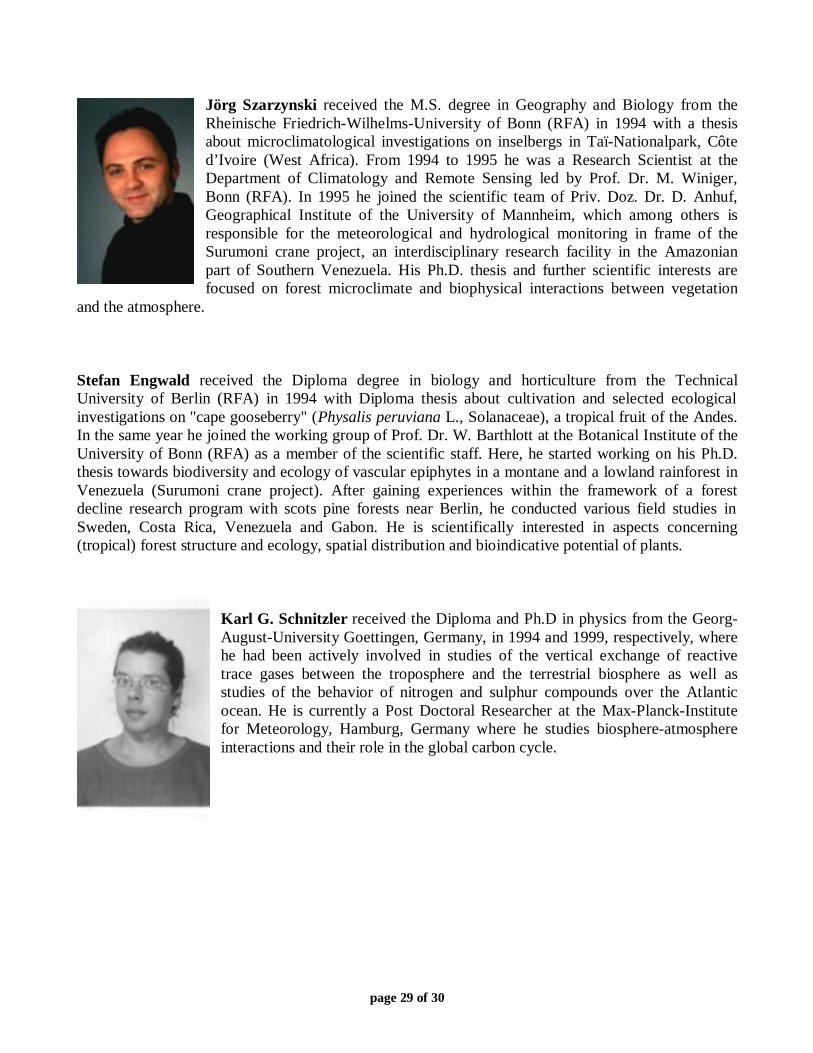
Ranga B. Myneni received the Ph.D. degree in biology from theUniversity of Antwerp, Antwerp, Belgium, in 1985. Since then, he hasworked at Kansas State University, Manhattan, the University ofGöttingen, Germany, and NASA Goddard Space Flight Center,Greenbelt, MD. He is now on the faculty of the Department ofGeography, Boston University, Boston, MA. His research interests areradiative transfer, remote sensing of vegetation, and climate-vegetationdynamics. Dr. Myneni is a MODIS and MISR science team member.
page 29 of 30
Jörg Szarzynski received the M.S. degree in Geography and Biology from theRheinische Friedrich-Wilhelms-University of Bonn (RFA) in 1994 with a thesisabout microclimatological investigations on inselbergs in Taï-Nationalpark, Côted’Ivoire (West Africa). From 1994 to 1995 he was a Research Scientist at theDepartment of Climatology and Remote Sensing led by Prof. Dr. M. Winiger,Bonn (RFA). In 1995 he joined the scientific team of Priv. Doz. Dr. D. Anhuf,Geographical Institute of the University of Mannheim, which among others isresponsible for the meteorological and hydrological monitoring in frame of theSurumoni crane project, an interdisciplinary research facility in the Amazonianpart of Southern Venezuela. His Ph.D. thesis and further scientific interests arefocused on forest microclimate and biophysical interactions between vegetation
and the atmosphere.
Stefan Engwald received the Diploma degree in biology and horticulture from the TechnicalUniversity of Berlin (RFA) in 1994 with Diploma thesis about cultivation and selected ecologicalinvestigations on "cape gooseberry" (Physalis peruviana L., Solanaceae), a tropical fruit of the Andes.In the same year he joined the working group of Prof. Dr. W. Barthlott at the Botanical Institute of theUniversity of Bonn (RFA) as a member of the scientific staff. Here, he started working on his Ph.D.thesis towards biodiversity and ecology of vascular epiphytes in a montane and a lowland rainforest inVenezuela (Surumoni crane project). After gaining experiences within the framework of a forestdecline research program with scots pine forests near Berlin, he conducted various field studies inSweden, Costa Rica, Venezuela and Gabon. He is scientifically interested in aspects concerning(tropical) forest structure and ecology, spatial distribution and bioindicative potential of plants.
Karl G. Schnitzler received the Diploma and Ph.D in physics from the Georg-August-University Goettingen, Germany, in 1994 and 1999, respectively, wherehe had been actively involved in studies of the vertical exchange of reactivetrace gases between the troposphere and the terrestrial biosphere as well asstudies of the behavior of nitrogen and sulphur compounds over the Atlanticocean. He is currently a Post Doctoral Researcher at the Max-Planck-Institutefor Meteorology, Hamburg, Germany where he studies biosphere-atmosphereinteractions and their role in the global carbon cycle.

page 30 of 30
Gode Gravenhorst, received his M.S. and Ph.D. degrees in meteorology from the J.W. GoetheUniversity, Frankfurt, Germany. He worked at research institutes in USA, France and Germany ontrace substances in the atmosphere and their interactions with biosphere. Now he is the head ofInstitute of Bioclimatology at the Faculty for Forestry and Ecosystem Research, University ofGöttingen, Germany and the head of the Center for Tropical and Subtropical Agriculture and Forestry.He was acting lead of the Research Center for Forest Ecosystems. His research interests are nowenergy and mass exchange between forests and atmosphere and its influence on functioning of forestecosystems and atmospheric boundary layer.


![Seasonal dynamics of spectral vegetation indices at leaf ... · Leaf level: Norway spruce [-] /g] [-] /g] Date of 2017 Top canopy Low canopy • PRI (and CCI) showed clearly seasonal](https://img.pdfslide.us/doc/110x75/5f132e7f65f3fa1b0213dea8/seasonal-dynamics-of-spectral-vegetation-indices-at-leaf-leaf-level-norway.jpg)