Embed Size (px)
Citation preview
The Role of Aluminum within MnOx(s)-Coated Filtration Media in
Drinking Water Treatment
Andrew Jones
Thesis submitted to the faculty of the Virginia Polytechnic Institute and State University in
partial fulfillment of the requirements for the degree of
Master of Science
in
Environmental Engineering
William R. Knocke
Michael F. Hochella
John C. Little
February 22nd
2012
Blacksburg, Virginia
Keywords:
MnOx(s)-Coated Media, Manganese, Aluminum

The Role of Aluminum within MnOx(s)-Coated Filtration Media in
Drinking Water Treatment
Andrew Jones
ABSTRACT
The Mn oxide (MnOx(s)) surfaces of water treatment filtration media are known to aid in the
capture of dissolved Mn species, but the discovery of significant deposits of Al within these
coatings raised several questions about the MnOx(s) surface. A series of experiments and
analyses were performed to examine the presence of Al within MnOx(s) coatings formed on water
treatment filtration media. It was hypothesized that the presence of Al within the MnOx(s)
coatings might have an impact on the capture of Mn by the MnOx(s) surface. A 2008 study of
oxide coated filtration media found that Mn and Al are present in nearly equimolar quantities
within the oxide coatings. This led to questions of how and why the Al became incorporated into
the surface. This phenomenon was analyzed by conducting a series of bench-scale column
studies, treatment plant data collection, and analysis of the MnOx(s) surface utilizing an electron
microscope. The results confirm that Al deposits onto the MnOx(s) media surface by two separate
mechanisms; adsorption of dissolved Al species and the deposition of colloidal and particulate
Al(OH)3(s) precipitate species onto the surface. Analysis of the MnOx(s) coating by electron
microscopy shows a heterogeneous surface composed of a mix of crystalline Mn oxides existing
alongside amorphous Al(OH)3(s) species. The deposition of Al onto the media surface does not
have any significant effect on the removal of soluble Mn, but the potential impact that Al might
have on the capture of other dissolved species should be explored further.

iii
Dedicated to my father, who inspired me to become an engineer

iv
ACKNOWLEDGMENTS
I would like to thank several individuals who were instrumental in making this research project
possible. It is difficult to express it properly in so few words, but it’s striking to reflect on just
how many of the people involved in the various facets of this research effort started out as
colleagues and coworkers and ended up being close friends of mine. I’m grateful to all of them
for all of their contributions to this project.
I would specifically like to thank Dr. Michael Hochella, and Dr. John Little for their insights and
their time spent on this project. I would like to extend a special thanks to my primary faculty
advisor Dr. Knocke for his leadership and guidance throughout this project. For their financial
support of this research effort, I also want to thank the Sussman Foundation.
Additionally, I’d like to recognize the operators of the Blacksburg-Christiansburg-VPI Water
Authority for their assistance in gathering media samples and for their expert knowledge in the
operation of the treatment plant; Julie Petruska and Jody Smiley for their hard work and
assistance in making the laboratory analyses possible; Jose Cerrato for mentoring me and helping
me start this project; Victoria Wheaton for her efforts during her time spent as a laboratory
assistant, without who’s help I could not possibly have compiled nearly as much laboratory data;
Jeff Parks for his assistance and patience when guiding me through the use of the ICP-MS
instrument; Boejong Kim for her knowledge and careful work in preparing samples for TEM
analysis; William Wu and Ya Peng Yu for their help in preparing my column media samples for
TEM and SEM analysis; and Dr. Mitsu Murayama for his guidance and assistance in the use of
the TEM.
Finally, I’d like to thank my family for their love and support. Without the strong positive
influence that my family has had in my life, I would not have been able to accomplish even a
fraction of what I have.
v
Table of Contents
ABSTRACT ................................................................................................................................... iv
ACKNOWLEDGMENTS ............................................................................................................. iv
LIST OF TABLES ....................................................................................................................... viii
LIST OF FIGURES ....................................................................................................................... ix
INTRODUCTION .......................................................................................................................... 1
LITERATURE REVIEW ............................................................................................................... 3
Mn as an Aesthetic Concern........................................................................................................ 3
Health Effects of Mn ................................................................................................................... 4
Traditional Methods of Mn Treatment ........................................................................................ 4
Removal of Soluble Mn by MnOx(s)-Coated Filtration Media .................................................... 6
Al Incorporation into MnOx(s)-Coated Media ............................................................................. 9
Aesthetic and Health Effects of Al ............................................................................................ 10
Previous Electron Microscopy Analysis of the MnOx(s) Surface .............................................. 11
Energy Dispersive Spectroscopy (EDS) ................................................................................... 13
Transmission Electron Microscope (TEM) Analysis ................................................................ 13
EXPERIMENTAL DESIGN AND METHODS .......................................................................... 15
Bench-Scale Column Experiments............................................................................................ 15
Experiments Applying ‘Soluble’ Al Species ............................................................................ 16
Defining ‘Soluble’ ................................................................................................................. 16
Bench-Scale Study of Al Solubility....................................................................................... 17
Experimental Setup – Soluble Al Experiments ..................................................................... 17
Stock Solutions ...................................................................................................................... 20
Feed Water Preparation ......................................................................................................... 21
Varying Media Source ........................................................................................................... 21
Varying Mn Concentrations .................................................................................................. 23
Varying Al Concentrations .................................................................................................... 23
Experiments Applying Insoluble Al Species ............................................................................ 23
Feed Water Preparation ......................................................................................................... 28
Particle Size Study ................................................................................................................. 28

vi
Batch Studies of Al and Mn ...................................................................................................... 30
Analytical Methods ................................................................................................................... 30
Extraction Analysis................................................................................................................ 30
Atomic Absorbance Spectroscopy ......................................................................................... 31
Inductively Coupled Plasma – Mass Spectrometry (ICP-MS) .............................................. 31
pH .......................................................................................................................................... 31
Free Chlorine ......................................................................................................................... 32
Scanning Electron Microscope (SEM) Sample Preparation .................................................. 32
Transmission Electron Microscope (TEM) Sample Preparation ........................................... 33
Diffraction Pattern Analysis .................................................................................................. 35
Energy Dispersive Spectroscopy (EDS) Line Scan Analysis ................................................ 37
EXPERIMENTAL RESULTS...................................................................................................... 40
Adsorption of Soluble Mn and Al onto MnOx(s)-Coated Media ............................................... 40
Effect of Al on the Adsorption of Mn ................................................................................... 40
Effect of Media Type on the Adsorption of Soluble Mn and Al ........................................... 42
Effect of Mn on the Adsorption of Al ................................................................................... 46
Particulate Al(OH)3(s) Deposition onto MnOx(s)-Coated Media ................................................ 46
Al Size Study ......................................................................................................................... 52
Effluent Mn and Al Data ....................................................................................................... 54
Media Extraction Data ........................................................................................................... 54
Mn Loading and Al Capture .................................................................................................. 58
Scanning Electron Microscopy Images ..................................................................................... 63
MnOx(s)-Coated Media Surface Images ................................................................................. 63
EDS Mapping ........................................................................................................................ 63
TEM Images .............................................................................................................................. 74
High Resolution TEM ........................................................................................................... 77
TEM – Diffraction Pattern Analysis ...................................................................................... 77
DISCUSSION ............................................................................................................................... 80
Soluble Al Study ....................................................................................................................... 80
Insoluble Al Study ..................................................................................................................... 82
Comparison of Bench-Scale Experimental Results Against Observed Al:Mn Ratios .............. 84
Electron Microscope Analysis of the MnOx(s) Surface .............................................................. 85
CONCLUSIONS........................................................................................................................... 87

vii
Future Research ......................................................................................................................... 88
Table of Abbreviations ................................................................................................................. 89
REFERENCES ............................................................................................................................. 90
APPENDIX ................................................................................................................................... 94

viii
LIST OF TABLES
Table 1 - Oxidation States of Mn (Adapted from Tobiason et. al, 2008) ....................................... 5
Table 2 - Stoichiometric Oxidation of Mn by Various Oxidants - Adapted from (Philip C.
Singer, 2011) .................................................................................................................. 6
Table 3 - Summary Table of Parameters in Employed in Soluble Al Experiments ..................... 18
Table 4 - Varying Level of MnOx(s) in Coated Media Utilized In Column Experiments ............. 22
Table 5 - Summary Table of Particulate Al Experimental Parameters ......................................... 25
Table 6 - Calculated Mass Uptake of Al and Mn onto a Synthetic MnOx(s) Coating - Varying
pH, Mn Loading ........................................................................................................... 51
Table 7 - Calculated Mass Uptake of Al and Mn onto Pyrolusite Media - Varying pH, Mn
Loading ........................................................................................................................ 51
Table 8 - Molar Metal Ratios for Harwood's Mill WTP (Tobiason et. al. 2008) ......................... 57
Table 9 - Molar Ratio Ranges of Selected Treatment Facilities Surveyed in 2008 AWWARF
Study (Tobiason et al, 2008) ........................................................................................ 81
Table 10 - Adsorptive Molar Ratios Generated During Laboratory Studies Applying Soluble
Al to MnOx(s)-Coated Media ........................................................................................ 81

ix
LIST OF FIGURES
Figure 1 - Extractable Mn and Measured Surface Area for MnOx(s)-Coated Media Samples
(Tobiason et al., 2008) ................................................................................................... 8
Figure 2 - SEM Image of an Anthracite Coal Particle from a Water Treatment Plant in
Newport News, VA (© 1996-2012 Water Research Foundation.) .............................. 12
Figure 3 - Schematic Showing Laboratory Setup for Experiments Applying Soluble Species
of Al to MnOx(s)-Coated Media .................................................................................... 19
Figure 4 - Schematic Showing Laboratory Setup for Experiments Applying Soluble and
Insoluble Species of Al to MnOx(s)-Coated Media ....................................................... 27
Figure 5 - Size Characterization of Influent Al for Insoluble Al Species Column Study ............ 29
Figure 6 - Transmission Electron Microscope - Nanoscale Characterization and Fabrication
Laboratory, Virginia Tech ............................................................................................ 34
Figure 7 - Formation of a Diffraction Pattern in Transmission Electron Microscopy (Plan
and Profile views) ........................................................................................................ 36
Figure 8 - Computer Analysis of Selected Area Diffraction Pattern to Acquire d-Spacing
Values ........................................................................................................................... 39
Figure 9 - Adsorptive Uptake of Mn onto Blacksburg MnOx(s)-Coated Anthracite Media
(pH 7.2, HLR = 4.0 gpm/ft2, No HOCl Added) ........................................................... 43
Figure 10 - Adsorptive Uptake of Al onto Blacksburg MnOx(s)-Coated Anthracite Media
(pH 7.2, HLR = 4.0 gpm/ft2, No HOCl Added) ........................................................... 43
Figure 11 - Adsorptive Uptake of Mn onto Blacksburg MnOx(s)-Coated Anthracite Media
(pH 6.3, HLR = 4.0 gpm/ft2, No HOCl Added) ........................................................... 44
Figure 12 - Adsorptive Uptake of Al onto Blacksburg MnOx(s)-Coated Anthracite Media
(pH 6.3, HLR = 4.0 gpm/ft2, No HOCl Added) ........................................................... 44
Figure 13 - Adsorptive Uptake of Mn onto a Synthetic MnOx(s) Coating (pH 7.2, HLR = 4.0
gpm/ft2, No HOCl Added) ........................................................................................... 47
Figure 14 - Adsorptive Uptake of Al onto a Synthetic MnOx(s) Coating (pH 7.2, HLR = 4.0
gpm/ft2, No HOCl Added) ........................................................................................... 47
Figure 15 - Adsorptive Uptake of Mn onto a Synthetic MnOx(s) Coating (pH 6.3, HLR = 4.0
gpm/ft2, No HOCl Added) ........................................................................................... 48

x
Figure 16 - Adsorptive Uptake of Al onto a Synthetic MnOx(s) Coating (pH 6.3, HLR = 4.0
gpm/ft2, No HOCl Added) ........................................................................................... 48
Figure 17 - Adsorptive Uptake of Mn onto Pyrolusite Media (pH 7.2, HLR = 4.0 gpm/ft2,
No HOCl Added) ......................................................................................................... 49
Figure 18 - Adsorptive Uptake of Al onto Pyrolusite Media (pH 7.2, HLR = 4.0 gpm/ft2, No
HOCl Added) ............................................................................................................... 49
Figure 19 - Adsorptive Uptake of Mn onto Pyrolusite Media (pH 6.3, HLR = 4.0 gpm/ft2,
No HOCl Added) ......................................................................................................... 50
Figure 20 - Adsorptive Uptake of Al onto Pyrolusite Media (pH 6.3, HLR = 4.0 gpm/ft2, No
HOCl Added) ............................................................................................................... 50
Figure 21 - Blacksburg Al Size Fractionation of Pre-Filter Al Species ....................................... 53
Figure 22 - Size Fractionation of Influent Al for Particulate Al(OH)3(s) Column Study .............. 53
Figure 23 - Effluent Al During Particulate Al Column Study - Varying Mn Loadings (4.0
gpm/ft2, pH 6.8-7.1, [HOCl] = 2-3 mg/L) .................................................................... 55
Figure 24 - Effluent Mn During Particulate Al Column Study - Varying Mn Loadings (4.0
gpm/ft2, pH 6.8-7.1, [HOCl] = 2-3 mg/L) .................................................................... 56
Figure 25 - Molar Ratio of Al:Mn In the MnOx(s)-Coated Media Over Time - Particulate
Al(OH)3(s) Column Study, Varying Soluble Mn Loadings (50 ppb - 400 pbb) ........... 59
Figure 26 - Al Content of MnOx(s)-Coated Media Over Time (mg Al / gram of Dry Media) -
Particulate Al Column Study, Varying Soluble Mn Loadings (50 ppb - 400 ppb) ...... 59
Figure 27 - Percentage of Influent Al Species Captured During Filtration as a Function of
Mn Loading (50 ppb - 400 ppb) ................................................................................... 60
Figure 28 - Measured Particle Breakthrough Behavior with Varying Mn Loading ..................... 62
Figure 29 - SEM Image of Column Media Sand Grain With Minimal MnOx(s) Coating Prior
To Mn Loading - 150x ................................................................................................. 65
Figure 30 - SEM Image of Column Media Sand Grain, 500x (Feed Water [Mn] = 0.4 mg/L) ... 66
Figure 31 - SEM Image of Column Media Sand Grain, 10,000x (Feed Water [Mn] = 0.4
mg/L) ............................................................................................................................ 67
Figure 32 - EDS Map of Thin Section of MnOx(s)-Coated Sand in Resin (Feed Water [Mn] =
0.4 mg/L) ...................................................................................................................... 68
Figure 33 - EDS Backscatter Images of Thin Section of MnOx(s) Separated by Element ............ 68

xi
Figure 34 - EDS Map of Thin Section of MnOx(s)-Coated Sand Particles in Resin (Feed
Water [Mn] = 0.4 mg/L) .............................................................................................. 69
Figure 35 - Backscatter Images of Thin MnOx(s)-Coated Particles Separated By Element EDS
Line Scan Analysis ....................................................................................................... 69
Figure 36 - ESEM Image - Coating Cross Section of Cleaved Sand Grain (Feed Water [Mn]
= 0.05 mg/L) ................................................................................................................ 71
Figure 37 - EDS Line Scan of Coating - Mn and Al Counts (Feed Water [Mn] = 0.05 mg/L) .... 71
Figure 38 - ESEM Image of Coating Cross Section (Feed Water [Mn] = 0.2 mg/L) ................... 72
Figure 39 - EDS Line Scan of Coating - Mn and Al Counts (Feed Water [Mn] = 0.2 mg/L) ...... 72
Figure 40 - ESEM Map of MnOx(s) Surface (Feed Water [Mn] = 0.4 mg/L) ................................ 73
Figure 41 - Line Scan of Coating Mn and Al Counts (Feed Water [Mn] = 0.4 mg/L) ................. 73
Figure 42 - TEM Image of Pulverized MnOx(s) Coating (Scaled as Shown) ................................ 75
Figure 43 - TEM Image of Pulverized MnOx(s) Coating (Scaled as Shown) ................................ 76
Figure 44 - High Resolution TEM Image of Nano-Size MnOx(s) Crystals ................................... 78
Figure 45 - Diffraction Pattern of MnOx(s) Coating (Feed Water [Mn] = 0.4 mg/L, 200-220
ppb Al) ......................................................................................................................... 79
Figure 46 - Diatom Entrained in MnOx(s) Coating – Durham, NC (Merkle, 1995) ...................... 83
Figure 47 - Diatom Entrained in MnOx(s) Coating – Durham, NC (Merkle, 1995) ...................... 83
Figure 48 - EDS Data - Mn Counts vs. Al Counts Measured for an Experimentally Produced
MnOx(s) Coating ([Mn] = 0.4 mg/L) ............................................................................. 86
Figure 49 - EDS Data - Mn Counts vs. Al Counts Measured for an Experimentally Produced
MnOx(s) Coating ([Mn] = 0.05 mg/L) ........................................................................... 86

1
INTRODUCTION
The use of Aluminum (Al)-based coagulants has been standard practice in municipal drinking
water treatment processes for decades. Al serves as a highly effective coagulant aiding in the
capture of solids through sedimentation and filtration processes (Amirtharajah, 1990).
The addition of Al in water treatment has several intended and well-studied effects on the final
water quality of the treated effluent, but one unexpected outcome of Al addition has not been
previously studied in detail and is the subject of this research study. A 2008 study on drinking
water Manganese (Mn) control suggested the potential for a previously unrecognized chemical
relationship between Mn and Al (Tobiason et al., 2008). The questions raised by this study
provided the impetus for this new research study, which sought to more closely examine how the
Mn and Al might interact in a water treatment setting and what effect Al might have on the
capture of soluble Mn by Mn oxide coated filtration media.
It is not uncommon for water treatment plants to apply a dosage of free chlorine (HOCl) across
their filters in order to achieve a high degree of Mn removal in drinking water. This practice
allows for the capture of soluble Mn by adsorption and then subsequent oxidation on the surface
of the filtration media. Oxidation by the free chlorine converts the adsorbed soluble Mn (Mn+2
)
to an insoluble Mn oxide (MnOx(s)) which is then incorporated into the oxide coating. The
formation of an oxide coating has been observed on several different types of media, including
anthracite coal and sand filtration media (Knocke et al., 1988, Coffey et al., 1993, Islam et al.,
2010).
The 2008 AWWARF report on drinking water Mn control gathered filtration media from several
Mid-Atlantic region surface water treatment facilities. Several of the facilities that participated
in the study applied free chlorine across their filters in order to achieve Mn control. During the
study, samples were collected and the accumulated MnOx(s) coatings of the filtration media were
extracted in order to quantitatively measure the metal composition of the coatings. The
extraction analysis of the MnOx(s) coatings yielded an unexpectedly high Al content. Even more
surprising was the relatively consistent molar ratio of Al to Mn found in the coatings. A similar
molar ratio between the two metals was observed even when comparing media from different
depths in a particular filter, media from different treatment plants, and/or media exposed to
differing Mn loadings. The reported molar ratios of Al and Mn in media coatings analyzed in the
study generally ranged from 1.0 to 2.0 (moles Al/mole Mn) (Tobiason et al., 2008).
The fact that the two elements existed in nearly equal molar quantities was perplexing; in plants
that utilize Al based coagulants the concentration of Al generally exceeds the concentration of
Mn by orders of magnitude in the water in direct contact with the filter media. This led to

2
speculation that there might be a relationship between the mechanism that drives the deposition
of Mn and the mechanism that drives the deposition of Al onto the coatings.
The reason for the presence of Al within the MnOx(s) surface has not been identified to date.
Knowledge of how and why the Al becomes integrated into the surface could have practical
implications regarding both soluble Mn removal and finished water Al levels. The specific
objectives of this study are as follows:
1. To determine whether Al impacts the uptake of soluble Mn onto MnOx(s)-coated filtration
media by comparing uptake in the presence and absence of Al;
2. To determine the physical or chemical mechanism that leads to the integration of Al
within the MnOx(s) surface; and,
3. To analyze an MnOx(s) surface and to observe the state of Al and Mn solids present within
the surface.
These objectives were achieved by analyzing data produced by conducting numerous controlled
bench scale filtration column studies, analyzing measurements taken at a local water treatment
facility, and by conducting an analysis of MnOx(s)-coated media using electron microscopy.

3
LITERATURE REVIEW
This literature review will focus principally on issues and studies related to the chemistry of Al
and Mn. Though this research study was focused primarily on Al, the initial motivation for this
work was to determine what effect the presence of Al in MnOx(s) coated filtration media might
have on the removal of soluble Mn. Therefore, an understanding of the motivations for Mn
treatment and the mechanisms of Mn oxidation in a water treatment setting are important to
include in a discussion of the chemical relationship between Al and Mn.
Mn as an Aesthetic Concern
Many different metals, chemical compounds and biological organisms are monitored in public
drinking water in order to protect the health of public water consumers. Chronic exposure to
even low levels of some contaminants can result in serious adverse health effects. For these
types of contaminants the EPA has outlined enforceable Maximum Contaminant Levels (MCLs)
in order to reduce the public's exposure. There is currently no MCL for Mn. Instead, a non-
enforceable Secondary Maximum Contaminant Level (SMCL) of 0.05 mg/L has been defined
for Mn. This guideline is meant to define a suggested maximum concentration for Mn in order
to avoid potential aesthetic effects that can result from high levels of Mn (EPA, 1979).
In a public drinking water distribution system, Mn can build up on the inner diameters of pipe
walls and can contribute to the formation of metal oxide scales. In extreme cases these scales can
contribute to a reduction in the pipeline cross section and result in significant head losses
(Kothari, 1988, Peng et al., 2010). Excessive build-up of Mn within pipeline distribution systems
can lead to a phenomenon known as black water. Black water can occur when reduced Mn
adsorbs to the inner walls of the distribution pipe and accumulates over time. There are
documented cases in which a sudden increase in water demand coupled with the accumulation of
Mn in pipe scales led to a blackwater event (Roscoe, 2002). A change in the flow or water
quality conditions can cause the accumulated Mn to slough off of the pipe walls and arrive at the
water user's tap as a black precipitate. The result is the staining of fixtures and laundry. The
sudden deterioration of water quality results in a spike of consumer complaints and an erosion of
consumer confidence in the safety of the drinking water (Sly et al., 1990).
Some research suggests that in order to avoid aesthetic issues such as black water, finished water
Mn concentrations should not exceed 0.02 mg/L (Casale et al., 2002). Other researchers believe
that Mn concentrations should be maintained below 0.01 mg/L in order to avoid aesthetic issues
(Sly et al., 1990).

4
Health Effects of Mn
Several factors determine whether or not a particular compound is harmful to human health. In
the case of Mn exposure in humans, research has demonstrated that an individual's age, the route
of exposure, and diet are all important in determining how the compound will be absorbed by the
body (Lönnerdal et al., 1987). In humans, the intake of Mn in very low levels is necessary for
enzymatic processes in the body. However, because Mn is found naturally in such a wide variety
of foods, the incidence of health complications resulting from a lack of Mn is believed to be rare
(W.H.O., 2011). A condition known as manganism, with symptoms similar to Parkinson's
disease, occurs in individuals that are exposed to high levels of Mn dioxide via inhalation (Cook
et al., 1974). Historically, Mn exposure via oral ingestion in drinking water has been regarded as
benign (Bull and Craun, 1977, Wong, 1984), but emerging research is challenging this idea.
A number of studies released in the last decade are changing how Mn exposure in drinking water
is viewed, most notably in the potential impact on children. A 2005 study demonstrated a
statistical correlation between high levels of drinking water Mn and decreased cognitive abilities
in children (Liu, 2005). A 2011 study also identified a decrease in the cognitive ability of both
mothers and children related to elevated drinking water Mn exposure from the use of a well
water source (Menezes-Filho et al., 2011). One group of researchers calls into question the basis
upon which World Health Organization (WHO) Mn drinking water health standards were
established and calls for a reevaluation of the standards in light of the apparent exposure risk to
vulnerable populations such as children (Ljung and Vahter, 2007). These studies illustrate that
Mn exposure through drinking water deserves more scrutiny as a public health concern than has
been previously acknowledged.
Traditional Methods of Mn Treatment
Mn commonly occurs in natural waters, especially in groundwater. A recent report by the USGS
surveyed groundwater sources from all over the United States and found that 31% the raw
groundwaters sampled for the study exceeded the SMCL for Mn (Ayotte et al., 2011). Mn
issues are certainly not exclusive to groundwater sources, but the concentrations of Mn in
groundwater can potentially exceed those of a typical surface water source by orders of
magnitude (Von Gunten et al., 1991). Issues of elevated Mn concentrations in surface waters
tend to be more seasonally based, especially in lakes and reservoirs that are subject to thermal
stratification. In these situations removal of Mn is often required for only part of the year
(typically summer and/or fall months). Oxidation of Mn from a soluble to an insoluble form is
one of the most commonly applied strategies for removal in drinking water treatment (Knocke et
al., 2010). However, the large number of possible oxidation states of Mn can make removal
challenging. Table 1 shows the various oxidation states of Mn that have been found to occur in
nature (Tobiason et al., 2008).

5
Table 1 - Oxidation States of Mn (Adapted from Tobiason et. al, 2008)
Oxidation State Mn Compound
0 Mn
2 Mn2+
2.67 Mn3O4(s)
3 Mn2O3(s)
4 MnO2(s)
5 MnO
6 MnO
7 MnO
When discussing the treatment of drinking water contaminants, iron (Fe) and Mn are often paired
together. The pairing is due to their numerous similarities; both are metal contaminants that have
the potential to cause aesthetic issues, both are abundant, and both can be removed by oxidation
processes. Fe and Mn enter the treatment process in either reduced or oxidized form. Since both
Fe and Mn are insoluble in their oxidized forms, an oxidant dosage is determined in order to
oxidize all of the Fe and Mn in solution. Once all of the Fe and Mn oxidized a coagulant is
applied in order to capture the oxidized metal particles and allow the particles to aggregate. The
aggregated particles then either settle out or go on to be captured by filtration processes (Singer
and Reckhow, 1999).
Fe can be readily oxidized in the bulk solution, even by relatively weak oxidants such as oxygen.
However, Mn often requires much stronger oxidants such as ozone or permanganate (MnO4-) to
be effectively oxidized in the bulk solution under typical surface water pH conditions. Chlorine
can be used to oxidize Mn in the bulk solution, but only under alkaline pH conditions or in
conjunction with a dosage of permanganate. The fact that Al-based coagulation processes are
best conducted at somewhat acidic pH conditions renders Mn removal by chlorine in the bulk
solution incompatible with coagulation processes (Knocke et al., 1987, Knocke et al., 1988).
Chlorine dioxide (ClO2) is a stronger oxidant than chlorine and is extremely effective at
oxidizing Mn under a variety of pH conditions (Knocke et al., 1991b). However, the necessity
for onsite generation and the added risks of generating regulated compounds such as chlorate and
chlorite make it at least somewhat undesirable for some applications (Haas, 1999). The
equations in Table 2 characterize the theoretical stoichiometry necessary to achieve oxidation of
Mn by permanganate, ozone, and chlorine dioxide. Once the Mn is oxidized to an insoluble for
such as Mn dioxide (MnO2(s)), it can then be removed by subsequent solids separation processes.
3
4
2
4
4
6
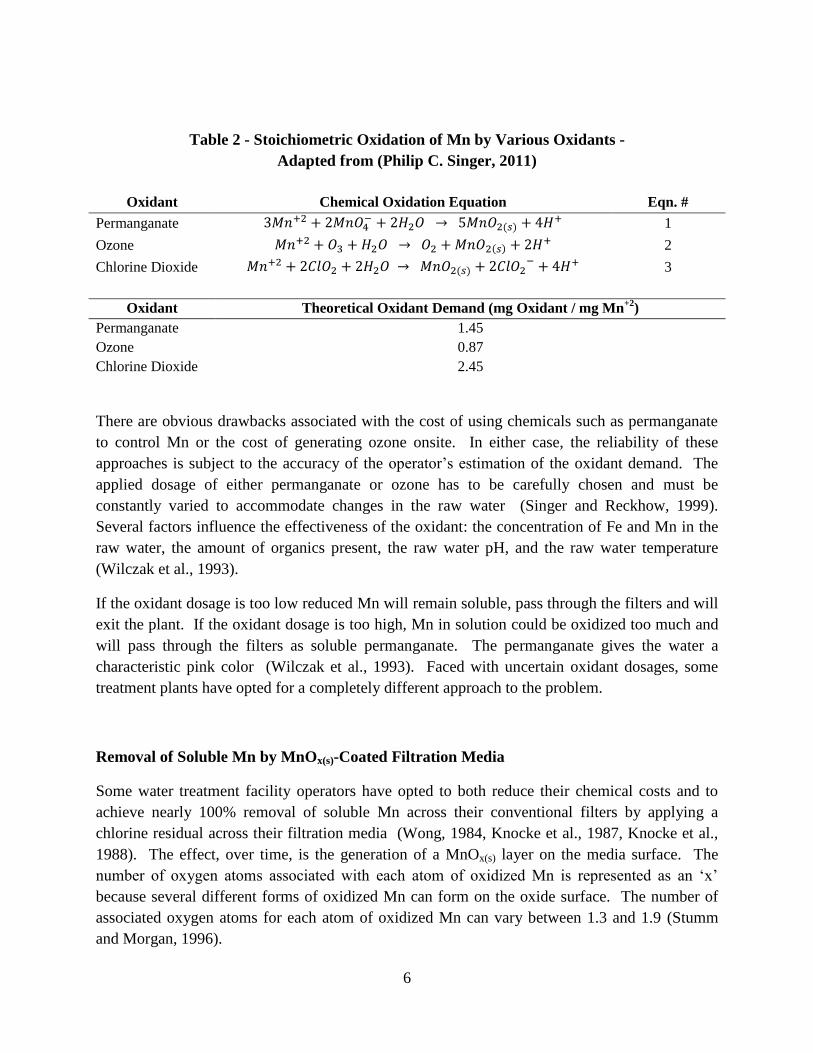
Table 2 - Stoichiometric Oxidation of Mn by Various Oxidants -
Adapted from (Philip C. Singer, 2011)
Oxidant Chemical Oxidation Equation Eqn. #
Permanganate 1
Ozone 2
Chlorine Dioxide 3
Oxidant Theoretical Oxidant Demand (mg Oxidant / mg Mn+2
)
Permanganate 1.45
Ozone 0.87
Chlorine Dioxide 2.45
There are obvious drawbacks associated with the cost of using chemicals such as permanganate
to control Mn or the cost of generating ozone onsite. In either case, the reliability of these
approaches is subject to the accuracy of the operator’s estimation of the oxidant demand. The
applied dosage of either permanganate or ozone has to be carefully chosen and must be
constantly varied to accommodate changes in the raw water (Singer and Reckhow, 1999).
Several factors influence the effectiveness of the oxidant: the concentration of Fe and Mn in the
raw water, the amount of organics present, the raw water pH, and the raw water temperature
(Wilczak et al., 1993).
If the oxidant dosage is too low reduced Mn will remain soluble, pass through the filters and will
exit the plant. If the oxidant dosage is too high, Mn in solution could be oxidized too much and
will pass through the filters as soluble permanganate. The permanganate gives the water a
characteristic pink color (Wilczak et al., 1993). Faced with uncertain oxidant dosages, some
treatment plants have opted for a completely different approach to the problem.
Removal of Soluble Mn by MnOx(s)-Coated Filtration Media
Some water treatment facility operators have opted to both reduce their chemical costs and to
achieve nearly 100% removal of soluble Mn across their conventional filters by applying a
chlorine residual across their filtration media (Wong, 1984, Knocke et al., 1987, Knocke et al.,
1988). The effect, over time, is the generation of a MnOx(s) layer on the media surface. The
number of oxygen atoms associated with each atom of oxidized Mn is represented as an ‘x’
because several different forms of oxidized Mn can form on the oxide surface. The number of
associated oxygen atoms for each atom of oxidized Mn can vary between 1.3 and 1.9 (Stumm
and Morgan, 1996).

7
As was mentioned previously, this oxide layer is composed primarily of Mn and has the potential
to adsorb multivalent metal cations onto its surface. In the case of Mn, the adsorbed cation is
then oxidized by free chlorine in the water flowing through the filter. The adsorbed, reduced Mn
becomes oxidized and becomes part of the MnOx(s) surface. The recently oxidized Mn in then
available as a sorption site for Mn+2
and the process repeats itself (Knocke, 1991).
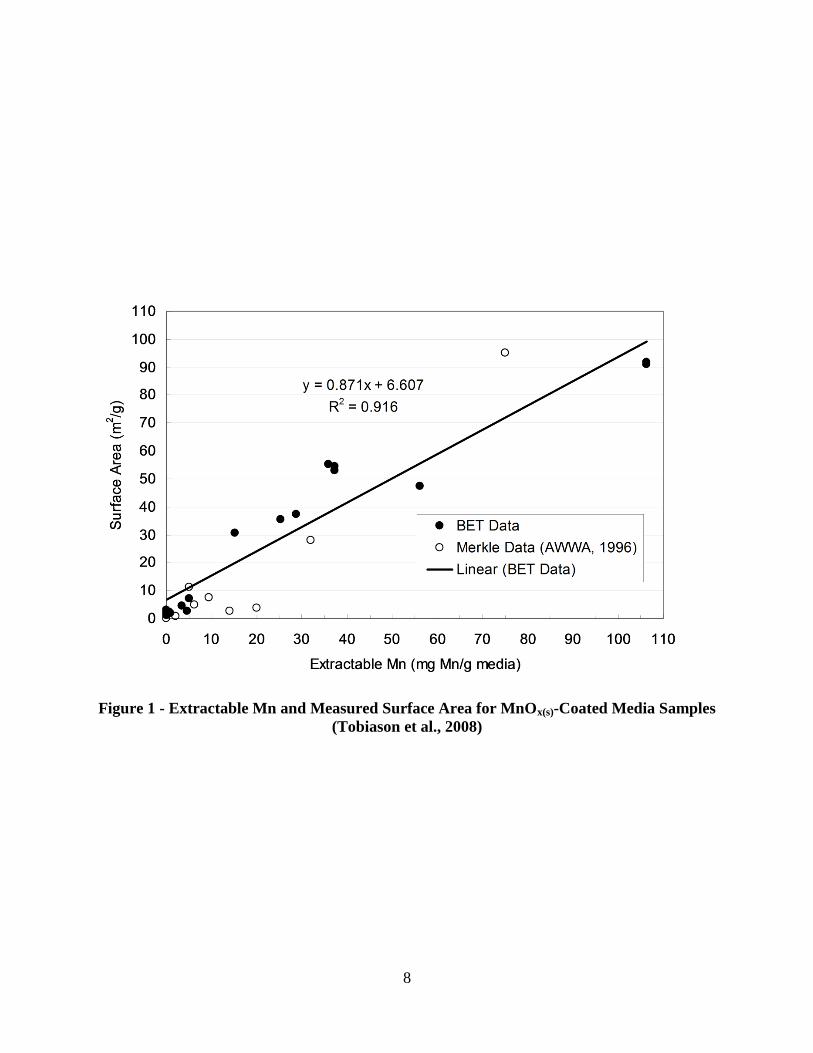
The nature of the MnOx(s) surface is complex; also, the high surface area provides numerous sites
for Mn adsorption (Merkle, 1996). Previous laboratory studies have demonstrated that a greater
level of MnOx(s) coating has a greater absorptive capacity for Mn (Knocke et al., 1991a,
Tobiason et al., 2008). It is important to understand how the high surface area of the MnOx(s)
plays a role in this process. A higher surface area allows for much more adsorption and thus
more potential reaction sites for free chlorine to come into contact with the adsorbed reduced
species of Mn. Data presented in Figure 1 demonstrate the correlation between the extractable
Mn content of the MnOx(s) surface and the measured surface area of the media per gram of dry
media. In effect, the surface catalyzes the oxidation reaction between absorbed Mn+2
and free
chlorine (Morgan and Stumm, 1964). In general, free chlorine does not react very quickly with
dissolved Mn in the bulk solution where nucleation sites are scarce. The two will interact and
reduced Mn will oxidize given enough time, but the kinetics are so slow that it is generally
regarded as impractical as a means of Mn removal in a water treatment setting (Knocke et al.,
1987). However, if a media with a high surface area is available to catalyze the reaction, it
greatly increases the number of nucleation sites and thus increases the potential for interactions
between the reduced Mn and the chlorine.
A group of researchers sought to analyze the role that the high surface area of MnOx(s) coated
media plays in Mn oxidation. MnOx(s)-coated media was allowed to adsorb reduced Mn species
in the absence of a strong oxidant. A subsequent analysis of the oxidation state of Mn species
within that MnOx(s) surface was conducted using a technique called X-ray Photoelectron
Spectroscopy (XPS). The authors found that while the predominant oxidation states of the
surface Mn were Mn(II) and Mn(IV), the detected presence of Mn(III) on the surface suggested
that the surface itself had catalyzed the oxidation of reduced Mn species (Cerrato et al., 2011).
Previous studies on MnOx(s)-coated filtration media have clearly demonstrated that the ability of
metal cations like reduced Mn to adsorb to the surface is highly dependent on pH (Morgan and
Stumm, 1964). The MnOx(s) surface bears a slight negative charge which helps to account for
the surface’s affinity for multivalent cations (Morgan and Stumm, 1964). The ability of the
MnOx(s) surface to adsorb metal cations is pH dependent because the metal cations in solution
compete with the hydronium ion (H3O+) for sorption sites. As the pH of the water decreases, the
concentration of hydronium increases. The high surface area of the MnOx(s)-coated media
provides a large number of sorption sites that are rapidly saturated by the sorption of H3O+.
Reduced Mn+2
that adsorbs to the MnOx(s) surface will have to compete with H3O+ for adsorption
sites. When the pH is low, the concentration of H3O+ is high and the adsorption of Mn is less
favorable. When the pH is high, the adsorption of Mn+2
is much more favorable because there is
8
Figure 1 - Extractable Mn and Measured Surface Area for MnOx(s)-Coated Media Samples
(Tobiason et al., 2008)
9
much less competition for adsorptive sites. The competition with H3O+ has been demonstrated
by previous researchers who observed a decrease in pH that corresponded with decreased Mn+2
sorption (Morgan and Stumm, 1964, Knocke et al., 1991a).
Al Incorporation into MnOx(s)-Coated Media
A review of water research publications was conducted in an effort to seek out any previously
performed study related to the presence of Al in MnOx(s)-coated water treatment filtration media.
Despite the lengthy search, no such study was found. The only publication that made any
mention of the presence of Al within MnOx(s)-coated media was the recent AWWARF study
(Tobiason et al., 2008) on MnOx(s)-coated filtration media which was the inspiration for this
study.
One study related to the treatment of coal mine drainage (CMD) did confirm that Al deposited
along with Mn during the treatment of the CMD (Tan et al., 2010). The authors of this study
conducted an analysis of MnOx(s) formed during the treatment of CMD. The authors used
electron microscopy and other techniques that confirmed the presence of Al in the environmental
deposits of oxidized Mn.
Another study examined naturally deposited MnOx(s) coatings on pebbles in a riverbed. The
coatings were likely the result of Mn oxidizing bacteria. That study did note that small amounts
Al were found in the coatings, but the researchers felt that Al was bound up in silicate minerals
and found that Fe and silicon were much more abundant than Al in the MnOx(s) coating (Seyama
et al., 2008).
Several published papers have focused on the potential for MnOx(s) to adsorb and sequester heavy
metals onto the MnOx(s) surface (Gray, 1981, Bajpai, 1999, Lisha et al., 2010, Tan et al., 2010).
One study examined the adsorptive capacity of various Mn oxides for lead. The authors found
that the adsorptive capacity varied significantly between the different types of natural and
synthetically prepared MnOx(s) samples examined in the study (O'Reilly and Hochella, 2003).
This has obvious potential implications for industrial waste streams or contaminated waters, but
surprisingly even in municipal drinking water treatment MnOx(s)-coated filter media appears to
have some capacity to remove heavy metals from solution in the presence of a chlorine residual.
The researchers involved with the 2008 AWWARF report found, through chemical extraction
and microprobe analysis of the coatings, that the coatings were composed not just of Mn, but a
variety of different heavy metals. Significant amounts of heavy metals such as copper, lead, and
chromium were found in the coatings (Tobiason et al., 2008).
The specific origins of the heavy metals are not always clear, but it is reasonable to assume that
one source of these heavy metals is the raw water influent in which they are present in very low
concentrations. For instance, drinking water facilities represented in the 2008 AWWARF study

10
that utilized a reservoir for their raw water source showed significantly higher concentrations of
copper in their MnOx(s)-coated filtration media. This is almost certainly due to the fact that
copper sulfate was used as an algaecide in the raw water reservoir (Tobiason et al., 2008).
Another group of researchers showed that the presence of heavy metals in water treatment is
often a consequence of utilizing contaminated water treatment chemicals (Eyring et al., 2002).
In any case, it is clear that a wide range of dissolved metal cations have an affinity for the Mn
oxide surface; they adsorb, oxidize and are then sequestered within the surface by the continued
precipitation of Mn oxides. For MnOx(s) coatings generated in water treatment facilities the
majority of the coating is composed of Mn and Al, while heavier metals have always been shown
to compose only a small portion of the total metals present in the coating.
Redox active metals such as Fe and Mn are thought to adsorb to the surface in a reduced state
and then utilize the surface as a means to react with chlorine and oxidize to a more insoluble
form. This cannot be the case for Al since the element is rarely if ever found outside of its
trivalent (+3) redox state in nature. Al is only redox active under much more extreme
environmental conditions (Srinivasan et al., 1999), conditions that would not be present in a
water treatment setting. This seems to indicate that the mechanism of Al incorporation into the
MnOx(s) surface must be different from that of Fe or Mn.
Data collected by the authors of the 2008 AWWARF study seem to confirm that the MnOx(s)
surface has a strong affinity for Al species even when Al is not added to the treatment process.
A significant quantity of Al was found to be present in the MnOx(s)-coated media in each of the
facilities surveyed that applied free chlorine across their filtration media. Interestingly,
significant concentrations of Al occurred not only in the MnOx(s) coatings of one treatment plant
that utilized Al-based coagulants but also in a facility that applied an Fe-based coagulant
(Tobiason et al., 2008).
If any determination is to be made about how Al becomes incorporated within the MnOx(s)
surface, an understanding of the solution chemistry of Al is necessary. Al chemistry is highly
complex. While it is generally not redox active in nature, the various hydrolysis products formed
are highly dependent on solution pH. The pH of the solution has a large role in determining
whether the Al hydroxide species present in solution is cationic, anionic, or neutral in charge.
Additionally, at elevated concentrations of Al, there is a high potential to form polymeric,
colloidal, and particulate species (Smith, 1996).
Aesthetic and Health Effects of Al
The fact that Al does appear to integrate into the MnOx(s) coatings of water treatment filtration
media seems to suggest a potential for the coatings to impact finished water Al levels. The
motivation for a reduction in finished water Al is driven by both aesthetic and health concerns
that result from the accumulation of Al in a drinking water distribution system (Costello, 1984).

11
The concerns over Al in drinking water can be at least partially attributed to potential health
effects; or at least addressing public perceptions about health concerns. Al has been
demonstrated to be a neurotoxicant in laboratory animals that were exposed to high dosages. In
past decades, it had been speculated by some that there was a link between the ingestion of Al
and Alzheimer’s disease (Ganrot, 1986, Srinivasan et al., 1999).
Today, research seems to be somewhat divided on whether or not the link between Al exposure
and Alzheimer’s disease has any validity. Many researchers feel that the link between Al
exposure in drinking water and Alzheimer’s is unfounded (Reiber and Kukull, 1996). One
group of researchers hypothesized that exposure to Al through the use of consumer products
might be correlated to Alzheimer’s disease. However, the data were ultimately inconclusive and
did not show a definitive connection (Graves et al., 1990).
Regardless of whether or not there is a link between the two, the perceptions and fears of the
public may be a greater driver to reduce finished water Al levels than any potential health
effects. The EPA regulates Al under its list of secondary drinking water regulations. In the
interest of preventing water discoloration the suggested maximum effluent concentration is listed
as high as 0.2 mg/L.
Previous Electron Microscopy Analysis of the MnOx(s) Surface
Tranmission Electron Microscopy (TEM) and Scanning Electron Microscopy (SEM) analysis of
the MnOx(s) surface are important components of this research. Along with laboratory
experiments, an analysis of the surface itself on a nano scale is necessary in order to show the
type of Al present in the surface. If the chemistry and structure of the Al on the surface can be
accurately characterized then it becomes possible to make intelligent conjectures about the
possible mechanism(s) by which the Al integrates into the surface. Images of the MnOx(s) surface
generated by previous researchers investigating the NGE led to speculation that an analysis of
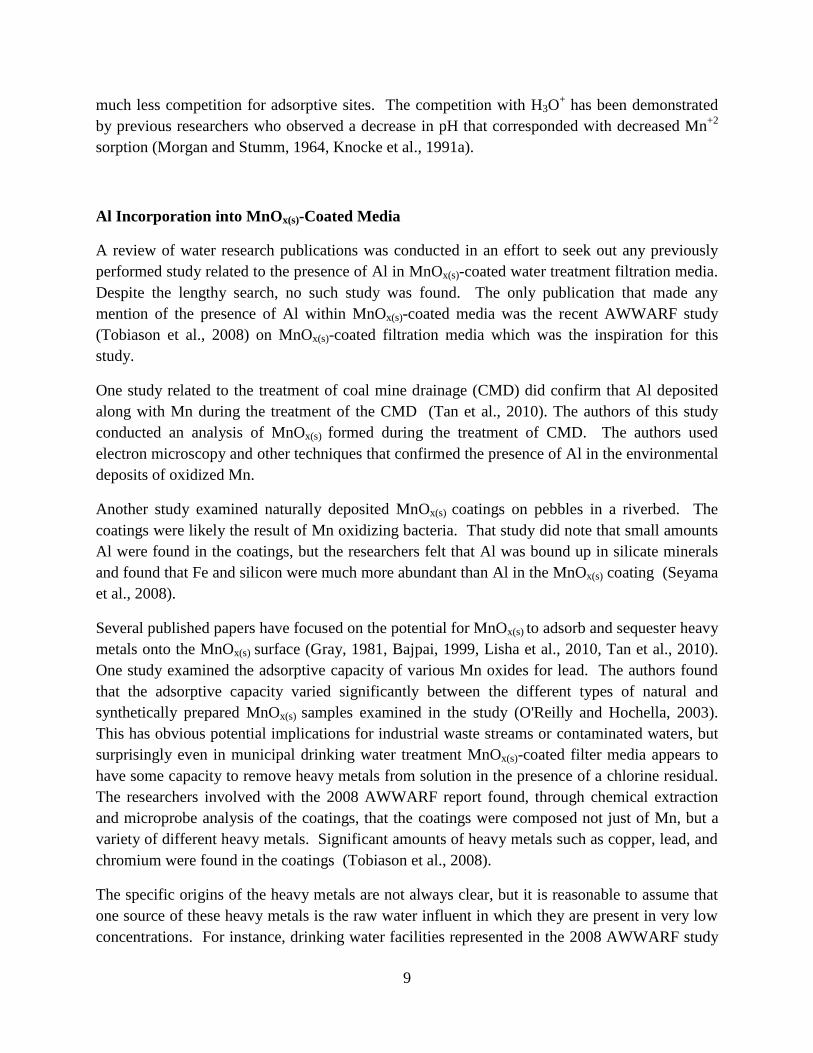
the surface might assist in determining this mechanism. Figure 2 shows an SEM image of an
MnOx(s)-coated anthracite coal media grain from a treatment plant filter (Tobiason et al., 2008).
Visual inspection of Figure 2 indicates that the surface is not entirely homogeneous. The cross
section cut actually resembles the rings of a tree. The ring pattern of deposition onto the surface
is most likely indicative of changes in water chemistry over time. Because many surface water
treatment plants experience seasonal variations in Mn loadings, it stands to reason that the
deposition behavior onto the surface also varies by season and produces this ring pattern when
the coating is viewed in cross section.
MnOx(s) coatings have been shown to occur in nature even in the absence of a strong oxidant. A
2008 study of Mn oxide coatings on pebbles within riverbed sediments was conducted in order to
12
Figure 2 - SEM Image of an Anthracite Coal Particle from a Water Treatment Plant in
Newport News, VA
(© 1996-2012 Water Research Foundation.)

13
characterize the surface. The researchers employed methods very similar to those utilized in this
research study including mapping of the oxide surface using SEM (Seyama et al., 2008).
Energy Dispersive Spectroscopy (EDS)
By utilizing an Environmental Scanning Electron Microscope (ESEM) to perform a scan of the
MnOx(s) surface it is possible to quantify the elemental composition of the surface at several
points along the MnOx(s) surface. This is accomplished by measuring the response of a high
energy (5 - 20kV) electron beam when it comes into contact with a specific point on the surface.
When an electron beam makes contact with the surface several interactions take place. The path
that each individual electron takes is complex, but the resulting X-rays produced can indicate the
elemental composition of the sample. The energetic electrons in the beam serve to excite other
electrons in the atoms of the sample from their ground state to a higher energy state. For an atom
that comes into contact with an electron from the beam the result is the ejection of the ground
state electron from the sample along with a characteristic X-ray. These ejected X-rays travel in
all directions, but a select few are cast back up at the EDS detector. The unique characteristics of
each X-ray can be detected and matched to a specific element. In this way, the backscatter
detector on the SEM allows for an elemental characterization of a sample. If this analysis is
repeated thousands of times over the surface of a sample, the result is a map of the sample
showing the elemental composition. If the analysis is conducted at several points in a straight
line, the result is a plot showing the number of times the presence of a specific type of element
was detected (Goldstein et al., 1981).
Transmission Electron Microscope (TEM) Analysis
Alternatively, by performing an analysis in a TEM it is possible to identify not only the
elemental composition of a sample, but the specific crystal structure of the compound present at
one point within the sample. This is possible though electron diffraction, which has been an
important aspect of TEM ever since it was first developed in 1939 (Goldstein et al., 1981). More
specific information on the methods utilized for the electron diffraction analysis can be found in
the methods chapter. The resolution of the microscope is a function of several contributing
factors: the wavelength of the incident electron (which is in turn a function of the energy of the
electron beam), the quality of the electron lenses, and the properties of the analyzed sample itself
(thickness, morphology etc.) (Williams and Carter, 2009).
In the case of this current laboratory study, a determination about whether Al within the oxide
coating is crystalline, amorphous, or bound up in conjunction with Mn in a mineral form
provides important clues about how the Al arrived on the MnOx(s) surface in the first place.
Whether the Al becomes integrated into the surface by adhering to the surface in its solid phase
14
or if dissolved Al interacts with the surface and adheres in conjunction was unclear prior to TEM
analysis.
Though previous researchers did generate SEM images of the MnOx(s) surface, the mineral state
of the Al on the surface was never analyzed using TEM. Researchers working in the fields of
materials science and chemical engineering have utilized various electron microscopy techniques
to examine Mn oxides from both natural and laboratory environments (Hochella et al., Junta and
Hochella, 1994, O'Reilly and Hochella, 2003). Analysis of Mn oxides from water treatment
facilities was conducted by the authors of the 2008 AWWARF study who utilized X-ray
diffraction on select samples of coated media. The resulting output was compared to published
data in order to determine to attempt to identify a mineral phase containing both Al and Mn, but
no such phase could be definitively identified within the MnOx(s) surface (Tobiason et al., 2008).
15
EXPERIMENTAL DESIGN AND METHODS
The following section details the methods used to quantify the interactions of Mn and Al with the
MnOx(s) surface during the research study. The bench-scale experiments conducted can be
broken down into several categories: soluble Al studies, particulate Al(OH)3(s) studies, and batch
studies. This section also describes the analytical methods and sample preparation techniques
that were used to examine the chemical composition of the MnOx(s) surface through the use of
electron microscopy.
Bench-Scale Column Experiments
It was important to simulate conditions present in a treatment facility on a smaller scale in the
laboratory so that the process could be monitored with some analytical precision. This precision
was necessary in order to effectively characterize the behavior of the MnOx(s)-coated filtration
media. The analysis was carried out by pumping prepared feed water through short beds of
filtration media (3.5” or 6”) enclosed in small diameter glass columns (7/16” ID). The metals
content of the influent and effluent of each column was carefully monitored throughout all of the
experimental trials.
All of the column studies utilized similar materials and equipment in the construction of each
experimental apparatus. Peristaltic pumps (Cole-Parmer Masterflex) were used to convey
carefully prepared feed water from bulk storage vessels (five gallon HDPE buckets), through the
column media until the water was discharged to the sink. Short lengths of polyethylene tubing
(1/4” ID / 3/8” OD) were used to transport the feed water through the experimental setup. The
short beds of media were enclosed within small glass tubes (7/16” ID). Glass was chosen over
plastic for ease of cleaning between experiments. PVC connectors were used to connect pieces
of polyethylene tubing to the peristaltic pump tubing, to connect any feed lines that were needed,
and to connect to the column containing the short media bed. A small (1/2”) plug of glass wool
was placed at the bottom of the column media in order to act as a support bed for the column
media. Glass wool was chosen as a support media because it was thought to be inert and would
therefore not interfere with the effluent metal concentrations. The specific setup of each
experimental configuration is described where appropriate, but the materials described above
were common to each experiment.

16
Experiments Applying ‘Soluble’ Al Species
Defining ‘Soluble’
It is worth clarifying certain aspects of the nomenclature that will be used throughout this thesis
to describe the experiments conducted for this research study. Specifically, it is important to
clearly define what is meant when a chemical species is designated as ‘soluble’. Essentially,
there is a discrepancy between what could be termed as an ‘operational’ definition of soluble and
the ‘academic’ definition of the term. The operational definition is primarily the consequence of
a desire to quantitatively describe a water sample when faced with limited analytical techniques,
while the academic definition has much more to do with the physical/chemical behavior of a
substance in solution. The two definitions can potentially be at odds with one another.
A worker at a water treatment facility might apply an ‘operational’ definition of solubility by
filtering a sample of water through a 0.45 µm glass fiber filter in order to comply with existing
water treatment monitoring regulations. From the worker’s perspective, anything passing
through the filter could be reported as ‘soluble’ material. However, this definition of soluble
would tend to over-estimate the amount of soluble material present in an ‘academic’ sense of the
word.
From an academic standpoint, the definition of soluble has to do with the behavior of a particular
chemical species in solution. Reported values for solubility are the subject of disagreement
among academics, but it is clear that questions of whether or not a substance is truly soluble in
an academic sense go beyond a simple discussion of particle size (Dyer et al., 1998). In the case
of supersaturated solutions of Al, colloidal particles of Al(OH)3(s) exist in solution which are
smaller than 0.45 µm. These materials would pass through a 0.45 µm filter, but would not be
truly soluble (Lai et al., 2007).
The purpose of this discussion is simply to address the fact that at least two different
interpretations of the word ‘soluble’ are used frequently in discussions of water treatment. For
the purposes of the Al column experiments applying soluble Al, a dosage was chosen in order to
satisfy both definitions of the term. The dosage chosen was lower than academically reported
solubility limits of Al in solution. A brief bench-scale study of Al was also performed in order to
consider the equilibrium that exists between the amorphous Al(OH)3(s) solid phase that is
characteristically formed in water treatment coagulation processes and soluble Al species. The
published values for Al solubility as well as the bench-scale study results were considered when
the Al dosage was chosen. In experiments that applied soluble dosages of Al, the dosage chosen
was less than both values (published values were determined to be ~27 ppb as Al at pH 6.3 and
~85 ppb as Al at pH 7.2) (Vanbenschoten and Edzwald, 1990).

17
Bench-Scale Study of Al Solubility
A brief study was conducted in order to experimentally verify the solubility of Al hydroxides
under varying pH conditions. Five 250 mL flasks were filled with 200 mL of Blacksburg tap
water. Each container was then dosed with a small volume of a concentrated stock solution of Al
sulfate in order to produce solutions that each contained roughly 500 ppb of Al. Finally, using a
1M stock solution of NaOH, each flask was pH adjusted to a different pH value (pH 5.5 - pH
8.0). Stoppers were then inserted into the flasks in order to prevent interactions with the
atmosphere and any resulting changes in pH. The samples were placed on a shake table and
gently shaken for 4 hours. Finally, a 10 mL sample was taken from each flask and filtered
through a 0.2 µm glass fiber filter. The resulting filtrate was analyzed using ICP-MS and the
concentration of filtered Al was reported for a range of pH values. The resulting experimentally
determined values of Al solubility were comparable to published values reported in the literature.
Experimental Setup – Soluble Al Experiments
Several columns were operated in parallel during each of the experimental trials in which soluble
Al was applied to MnOx(s)-coated filtration media. Several important experimental parameters
are summarized in Table 3. The flow of feed water to each column was driven by a single pump
head on a peristaltic pump. Materials described previously were used to construct the
experimental apparatus shown in the schematic in Figure 3.
The media used in each of the experimental trials was ‘regenerated’ prior to being loaded into the
glass column. It was important to ensure that the MnOx(s) surface was free of absorbed Mn
species. This was achieved by placing the media into an Erlenmeyer flask and contacting it for
at least 12 hours with a solution composed of deionized water and sodium hypochlorite (NaOCl)
which yielded a free chlorine concentration of 100 mg/L. After the media was rinsed with DI
water it was ready to be placed into the column.
In selected experimental trials a free chlorine residual was applied to the column media. NaOCl
was dosed from a feed stock solution and was introduced just upstream of the glass column
shown in Figure 3 using a PVC tee connection. This minimized the oxidation of Mn in the bulk
solution by minimizing the contact time with free chlorine in the bulk solution.
The use of peristaltic pumps ensured that the columns received a consistent flow of water. In
each of the experimental trials the hydraulic loading rate was set at 3.8 – 4.0 gpm/ft2 to
approximate the loading rate present in a conventional treatment plant filter. In each
experimental trial the flow rate was measured a minimum of three times and averaged to attain a
single value for the flow rate. The column effluent was discharged into a nearby sink. The
outlet into the sink was placed above the level of the column media bed in an effort to prevent
any potential suction that might have resulted from a significant head differential between the

18
Table 3 - Summary Table of Parameters in Employed in Soluble Al Experiments
Parameter Numerical Value Notes / Description
Hydraulic Loading Rate 3.8 – 4.0 gpm/ft2
Loading rate was selected to simulate that of a
conventional filtration plant
Media Bed Depth 3.5” Short bed of media
pH 6.3 Low pH condition
7.2 High pH condition
Mn Concentration 0 – 0.3 mg/L Concentrations were selected to model
seasonal Mn loadings in treatment plants
Al Concentration
0.0 mg/L Adsorption of Mn in the absence of Al
‘Saturated’
Soluble Al dosage was adjusted for pH
conditions (pH 6.3, 12 to 16 ppb; pH 7.2, 35
to 43 ppb)
Free Chlorine
0.0 mg/L Free chlorine was absent during soluble Al
and Mn adsorption experiments.
1.0 mg/L Effluent free chlorine was maintained for non-
adsorption experiments

19
Figure 3 - Schematic Showing Laboratory Setup for Experiments Applying Soluble Species of Al to MnOx(s)-Coated Media
20
media bed and the outlet. During the course of the experiment samples were collected by
collecting the drips of the column effluent in capped 16 mL polystyrene ICP sample tubes.
The time at which these samples were collected was recorded in order to quantify the volume of
water that had passed through the column by that time. That is, the product of the flow rate and
the time of operation yielded the volume of feed water passed through the column. Analysis of
the concentration of metals in both the feed water and the effluent for each column was
calculated several times during the column operation. The amount of each metal taken up by the
column media was calculated using the following equation.
( ) Equation 4
This allowed for a calculation of the mass of each metal taken up by the column media under
varying experimental conditions. A similar approach was used in order to quantify the uptake of
Al onto the column media. These results could then be graphed and analyzed in order to
compare the uptake of Mn and Al under a variety of experimental conditions.
Stock Solutions
Stock solutions of both Mn and Al were utilized during all of the column trials. During all of the
experimental trials, the Mn stock was prepared using a hydrated powder of Mn(II) chloride
(MnCl2•4H2O). The dry powder was placed on a weigh boat and then added to a volume of
nanopure water that had been measured in a volumetric flask. This mixture was then placed in a
labelled polypropylene Nalgene bottle. After vigorously shaking the solution of Mn, the
concentration of the stock solution was verified on the AA instrument. As discussed previously,
the kinetics of Mn oxidation by oxygen are extremely unfavorable, especially in acidic
environments. Though the pH of the un-buffered stock solution was generally less than 5, the
Mn stock solution was changed bi-weekly in order to minimize experimental errors that would
have resulted from partial oxidation of the Mn in the stock.
The Al stock was prepared in a similar manner. Al sulfate octadecahydrate hydrate
(Al2(SO4)3•(18H2O)) was weighed and added to a precisely measured volume of nanopure water.
The need to periodically replace the Al stock solution was motivated by concern over the
continued solubility of the Al in solution rather than redox concerns. The pH of the stock
solution was maintained below 3 in order to prevent the formation of insoluble Al species such
as Al(OH)3(s). The Al stock solution’s interaction with the atmosphere over time may have
affected the solubility of the Al in solution and thus it was important to change the solution
periodically. Al is not redox active under typical environmental conditions, but the Al stock

21
solution was changed with the same frequency as the Mn stock in order to ensure consistency.
Each time a stock solution was prepared, the concentration of Al present in the solution was
verified using the ICP-MS.
Feed Water Preparation
Water for the columns was prepared in order to observe the uptake of soluble Mn and Al onto the
surface. The pH of the water, the alkalinity, and specific metals available to the columns were
carefully controlled. The feed was prepared by adding alkalinity and hardness to the water at
levels considered typical of a Mid-Atlantic surface water source. Sodium bicarbonate (NaHCO3)
was added in order to apply 1.0 meq/L of alkalinity to the water. Calcium chloride (CaCl2) was
added to achieve a total hardness of 0.5 meq/L. After alkalinity and hardness were added to the
water, the pH of the water was adjusted. This was achieved by the careful addition of a 1M
stock solution of nitric acid (HNO3) or a 1M stock solution of sodium hydroxide (NaOH) as was
needed. After pH adjustment the appropriate doses of Mn and Al were applied to the water.
Because the added amounts of Al and Mn were so small, stock solutions of alum and Mn were
prepared in order to more accurately dose the chemicals rather than adding hydrated salts of the
metals directly to the water. The Mn stock was prepared using a hydrated powder of Mn(II)
chloride (MnCl2•4H2O). The Al stock solution was prepared using Al sulfate octadecahydrate
hydrate (Al2(SO4)3•(18H2O)).
During pH adjustment the use of strong acids and bases has the tendency to create temporary
areas of extremely high or extremely low pH. It was important to adjust the pH of the solution
prior to the addition of Mn because of the tendency of reduced Mn (Mn+2
) to oxidize to Mn
dioxide (MnO2(s)) under highly alkaline (>9) pH conditions. Thus, if certain areas of the solution
saw momentary pH conditions that were highly basic, reduced Mn might have oxidized in the
bulk solution by even trace levels of dissolved oxygen present. Oxidized Mn present in the feed
water would not have been able to adsorb to the oxide surface of the media in the same way as
reduced Mn and would have introduced an error into the analysis.
Varying Media Source
In order to observe differences in the adsorptive behavior of the columns, several different media
types were used. The media used in the experiments were selected for their variable amount of
MnOx(s) coating present in each of the media samples. Based on the work of previous
researchers, it was thought that a media with a greater amount of MnOx(s) coating would possess
a greater adsorptive capacity for soluble Mn (Knocke et al., 1991a, Tobiason et al., 2008).

22
Table 4 shows the various media sources utilized during the column experiments and the
different levels of oxide coating present on each. The method for determining the amount of
coating present on each media is described later in this chapter.
Table 4 - Varying Level of MnOx(s) in Coated Media Utilized In Column Experiments
Media Type Approximate MnOx(s) Coating
(mg Mn/dry gram media)
Virgin Anthracite Coal < 0.1
Blacksburg, Christiansburg, VPI Water Authority 5
Harwood’s Mill WTP (Newport News, VA) 37
Synthetically Coated Anthracite Coal 0.2
Lee Hall WTP (Newport News, VA) < 0.1
Pure Pyrolusite 100% MnO2(s)
The Blacksburg, Christiansburg, VPI Water Treatment Facility (BCVPIWTF) provided both
MnOx(s)-coated anthracite coal media from their filters as well as anthracite coal not yet used in
the filter. Media from the Harwood’s Mill (Newport News, VA) treatment facility arrived with a
significant coating on the surface of the anthracite coal. This was due to the fact that the media
had been exposed to free chlorine and significant concentrations of raw water Mn over the
course of years. Another media sample from the Lee Hall (Newport News, VA) treatment
facility was also obtained for the column studies. The Lee Hall anthracite had not been exposed
to free chlorine and had not developed any significant MnOx(s) coating.
Two types of media, commercially produced pyrolusite and synthetically coated anthracite coal,
were also gathered for use in the column studies. Pyrolusite was analyzed for chemical
composition by chemical extraction and was found to be almost entirely composed of Mn oxides
with minimal impurities. The synthetically coated anthracite coal was prepared utilizing a
coating method developed by Merkle et al. (1997). Following this method of coating, 500 grams
of uncoated anthracite was first rinsed with tap water. This washed anthracite was then placed in
a continuously mixed 10 liter glass carboy containing 9.0 liters of water. To this mixture was
added 13.25 g MnCl2•4H2O and 36 mg SnCl2•2H2O. Two stock solutions were also prepared; an
oxidant solution comprised of a dilute (0.11%) solution of sodium hypochlorite (NaOCl) and a
6200 mg/L sodium bicarbonate (NaHCO3) solution. The two solutions were added to the stirred
mixture of media according to a dosing schedule outline in the procedure. The result was a
media with a light MnOx(s) coating (~ 0.2mg/g).
23
Varying Mn Concentrations
The influent concentrations of Mn were varied between column experiments in order to observe
differences in the adsorptive behavior of soluble Al species as a function of the concentration of
Mn present in solution. Prior to conducting the experimental trials it was hypothesized that Al
and Mn might compete for adsorptive sites on the MnOx(s) surface. Previous work on the subject
has confirmed that Mn adsorption is impacted by the adsorption of H3O+ and this is why the
adsorptive behavior of Mn varies with the solution pH (Morgan and Stumm, 1964, Tobiason et
al., 2008). It was thought that cationic Al species in solution could potentially compete in a
similar fashion.
Varying the influent dose of Mn allowed for the adsorptive uptake of Al under differing feed
water conditions to be compared in order to confirm or reject the hypothesis that soluble Al
species compete for adsorption sites with reduced Mn.
Varying Al Concentrations
The concentration of Al that each column was exposed to did vary between each of the different
experimental trials. Some trials were conducted in the presence of soluble Al while others were
conducted in the absence of Al. It is important to note that the solubility of Al is highly
dependent on the pH. Two different concentrations of feed water Al were chosen based on
published data (Vanbenschoten and Edzwald, 1990) and laboratory bench tests described in the
methods chapter. The various hydrolysis products that Al forms serve to complicate its
solubility. Since the column experiments were conducted at two different pH conditions, the
amount of Al that could be designated as soluble varied between to the two pH conditions. At
pH 6.3 the influent Al concentration was 12-16 ppb and 35-43 ppb at pH 7.2. In both cases the
applied dose of Al could be considered nearly ‘saturated’, but the exact dosage of Al varied for
each pH condition.
Experiments Applying Insoluble Al Species
After completing an extensive analysis of the way in which soluble Al species interact with the
MnOx(s) surface, it was important to conduct a similar study on how particulate species of
Al(OH)3(s) interact with the surface in order to characterize the interaction of all species of Al
with the surface. Rather than contacting the MnOx(s) surface with an under-saturated dose of Al,
the dose of Al was increased in order to facilitate the creation of Al(OH)3(s) colloids and particles
in solution.
Ultimately, each column received a super-saturated dosage of Al (200- 220 ppb) that resulted in
the formation of Al(OH)3(s) colloidal materials in the bulk solution. A free chlorine residual was

24
also applied to the columns in order to oxidize the adsorbed Mn onto the surface of the coated
media. The primary difference between each of the columns in the particulate Al experimental
trials was the dosage of reduced Mn applied to each column.
Each column contained a bed of media that was six inches deep. The column media was a
commercially produced MnOx(s)-coated sand that was donated by Siemens (Ames, IA). The sand
grains had been previously sieved and were between 0.45 and 0.55 mm in diameter. Based on an
extraction of the coated media prior to use in the columns, the measured Mn content of the
coating was determined to be approximately 0.11 mg Mn/gram of dry media at the beginning of
the experiment. The bed of coated sand media was supported inside of the glass column by a
small (1/2”) plug of glass wool.
The materials used to construct the experimental apparatus were similar to those used in the
soluble Al experiments, but the configuration of this series of experiments was different in
several respects. While previously the entire system had been closed, the particulate loading to
the columns made that approach impractical and would not have been representative of the
behavior that the experiment was meant to replicate. Instead, in order to simulate the particulate
loading in a typical filter, the head in the column was allowed to increase over time as particulate
Al(OH)3(s) deposition caused the head on the filter to increase. The range of experimental
parameters applied during the insoluble Al column studies are summarized in Table 5.

25
Table 5 - Summary Table of Particulate Al Experimental Parameters
Parameter Numerical Value Notes / Description
Hydraulic Loading Rate 3.8 – 4.0 gpm/ft2
Loading rate was selected to simulate that of a
conventional filtration plant
pH 6.9 – 7.2 Experimental pH condition
Mn Concentration 0 – 0.4 mg/L Concentrations were selected to model seasonal
Mn loadings in treatment plants
Al Concentration 200 – 220 µg/L Saturated dosage of Al to produce amorphous
Al(OH)3(s) particles
Free Chlorine > 1.0 mg/L Allowed for continuous surface oxidation of Mn

26
Two primary feed waters were applied to each of the columns shown in Figure 4. The bulk of
the feed solution was prepared by combining 30 gallons of Blacksburg tap water with stock
solutions of Al sulfate and chlorine in the form of sodium hypochlorite (NaOCl). This feed
solution was common to each of the columns and the feed lines of all three columns drew from
this feed solution at a rate of 13 mL/min per column. The secondary feed solution (13 mL/min)
was prepared for each column and consisted of deionized water and a small amount of a stock
solution of Mn chloride (MnCl2). This feed water was prepared in batches inside of ten liter
glass carboys and was added to each feed reservoir as needed during the experimental trial. The
two solutions were pumped with peristaltic pumps and were combined using a PVC ‘tee’ fitting.
This solution was then allowed to drip into the water above the column media bed. After
filtering through the column media the effluent discharged into the sink where samples of the
effluent could be taken. As in the previous experimental trial, the column effluent port was
positioned above the column media bed in order to ensure that the head on the column was
always higher than the top of the media bed.
Influent samples were collected from the 'tee' fitting near the air gap shown in Figure 4 and
effluent samples were collected from the effluent tubing at the sink. All samples were collected
in capped 16 mL polystyrene ICP analysis tubes. Periodic backwashing was necessary to
remove solids accumulated in the filtration media in order to prevent excessive head from
building up on the filters. This was accomplished by attaching a larger peristaltic pump to the
effluent of each column and forcing Blacksburg tap water back through the column media at a
backwash rate of 16 gpm/ft2. Backwashing was performed when the head on the column
exceeded 2 feet above the media bed and effluent port.
The experiments were allowed to continue for a much longer time period than the previous
experiments in order to monitor the development of the MnOx(s) coating on the media over the
course of the experiment (4 - 8 weeks). The development of the coating was tracked over time
by removing a small amount (~0.2 grams) of media from each of the columns for extraction
analysis. This analysis was performed every seven to fourteen days. The extraction analytical
procedure is described later in this section.

27
Figure 4 - Schematic Showing Laboratory Setup for Experiments Applying Soluble and Insoluble Species of Al to MnOx(s)-
Coated Media

28
Feed Water Preparation
Figure 4 shows that the feed water for the columns was prepared in two different feed reservoirs
and combined just before entering the small diameter column. Because the columns required
both free chlorine and reduced Mn, it was necessary to have the Mn separated from the free
chlorine to prevent premature oxidation of the Mn prior contact with the MnOx(s) coated media.
Though free chlorine has been shown to be a relatively poor oxidizer of Mn in bulk solution
under the hydraulic retention times in a typical water treatment facility (Knocke et al., 1987), the
hydraulic retention time of the prepared feed water would be much longer.
The Al and free chlorine feed solution was prepared by mixing 30 gallons of Blacksburg tap
water with 25 mL of a stock solution of Al sulfate.
A small volume (10 – 15 mL) of a NaOCl solution was also added to the feed solution. The
necessary dosage of sodium hypochlorite was determined using a breakpoint chlorination trial.
Blacksburg tap water was gradually dosed with a NaOCl stock solution. As the NaOCl was
added, the concentration of free chlorine was measured in order to produce a breakpoint
chlorination curve. The appropriate dosage of free chlorine was determined from the curve and
the data was used to determine the appropriate dosage of NaOCl for the 30 gallon volume. The
free chlorine content of the feed solution was verified each time feed solution was prepared. The
amount of added NaOCl varied because the amount of free chlorine in the NaOCl stock solution
diminished over time. The NaOCl solution was refrigerated at 6oC in an effort to slow this decay
process, but the stock had to be replaced bi-weekly. In an effort to minimize variation resulting
from differences in water temperature, the water taken from the tap was allowed to sit at room
temperature for at least 24 hours before being mixed and added to the feed solution.
The Mn feed solution was prepared by combining ten liters of distilled water with a small
volume (1.25 – 5 mL) of a Mn stock solution. This secondary feed solution was stored in 5
gallon buckets.
Particle Size Study
It was important to ensure that the prepared feed water that the column media was exposed to
was comparable to the water found in a typical surface water treatment plant. It was therefore
necessary to attempt to duplicate a similar size distribution Al species in the feed water. This
was achieved by filtering the raw feed water through a number of different filters of varying pore
sizes. By comparing the amount of Al that was captured by a filter of one pore size to the
amount captured by a different filter pore size, a size distribution of Al particles could be
generated. Typical results are shown in Figure 5. Three quantifications of the influent Al size
species were conducted in the laboratory. The average concentration of Al passing through each
of the pore sizes shown on the x-axis is indicated by the blue bar. The minimum and maximum

29
Figure 5 - Size Characterization of Influent Al for Insoluble Al Species Column Study
0
50
100
150
200
250
300
Raw 20µm 8µm 2.5µm 0.45µm 300K UF 10K UF
[Al]
Pas
sin
g Th
rou
gh F
ilte
r (p
pb
)
Filter Pore Size

30
concentration passing through the filters are indicated by the upper and lower bounds of the error
bars.
Batch Studies of Al and Mn
It was initially hypothesized that perhaps the particulate Al(OH)3(s) species themselves played a
role in the oxidation of Mn. It seemed plausible that small particles of oxidized Mn were
adsorbed by colloidal or particulate Al species and the Al(OH)3(s) flocs themselves provided a
nucleation site for further reaction.
The experiment was conducted using Blacksburg tap water in order to effectively simulate the
alkalinity typical of a mid-Atlantic surface water source. The alkalinity helped to stabilize the
pH over the course of the experimental trial. A small volume of a stock solution of Al sulfate
was added to the tap water in order to achieve an Al concentration of roughly 200 ppb as Al.
After measuring the pH of the solution, the prepared solution of Al spiked tape water was
distributed to eight different flasks. Each flask contained 250 mL of the water. Four of the
flasks were then spiked with a stock solution of sodium hypochlorite until a free chlorine
residual of 1.0 mg/L was present in each. The remaining four flasks did not receive chlorine.
Each set of four flasks, chlorinated and unchlorinated, were then spiked with a stock solution of
Mn chloride (MnCl2). Small volumes of the Mn stock were added in order to produce four
different concentrations of Mn in the batch reactors. Each of the two sets of reactors contained
Mn concentrations of 20, 50, 100, and 200 ppb of Mn.
The flasks were then sealed and placed on a shake table in order to gently mix the solutions for
several hours. At two time intervals (four hours and ten hours) each of the eight batch reactors
were sampled. For each sampling event, 10 mL of solution was collected from each reactor and
another 10mL was collected and filtered through a 0.45 µm filter.
By comparing the raw sample to the filtered sample, it was then possible to measure the
adsorption of Mn onto the alum. The difference in measured Mn concentration between the
filtered and unfiltered sample was regarded as the concentration of Mn adsorbed to the surface of
Al particles.
Analytical Methods
Extraction Analysis
Knocke et al. (1990) developed a method for the analysis of the extractable metals content of
coated media. A small amount of MnOx(s)-coated media was dried and weighed (~ 1 gram). The

31
weighed media was then placed into a 250 mL of nanopure water. Nitric acid was then added to
this volume of water in order to create a 2% acid solution. Finally, 300 mg of a reducing agent
called Hydroxyl Amine Sulfate was applied in order to reduce the oxidized metals in the coating
and solubilize them into solution. A portion of the solution was then analyzed on an ICP-MS
instrument (Thermo Electron Corp. X Series ICP-MS, X-0458) and the metals content was
reported in mg/L. With a known volume of water and a known mass of dry media used in the
extraction it was then possible to characterize the amount of each metal present in the coating in
terms of mg of metal per dry gram of media. A complete description of the method can be found
elsewhere (Knocke, 1990).
Atomic Absorbance Spectroscopy
An atomic absorbance spectrometer was utilized in order to measure Mn in some of the
laboratory procedures according to Standard Methods 3111 B (21st ed. 2005). The instrument
was manufactured by Perkin-Elmer and utilized both compressed air from the laboratory as well
as acetylene gas.
Acidified precision Mn standards were obtained from Fisher Scientific and were diluted in order
to produce a four-point calibration curve between 0.00 mg/L and 0.50 mg/L for the instrument.
Once the calibration curve relating absorbance intensity to Mn concentration, samples were
analyzed in the same manner as the calibration standards and the concentration of the samples
was recorded by hand after the machine produced the result.
Inductively Coupled Plasma – Mass Spectrometry (ICP-MS)
Inductively Coupled Plasma Mass Spectrometry (ICP-MS) was utilized for all of the reported
Mn measurements and Al measurements. All measurements conformed to the ICP-MS method
outlined in Standard Methods 3125-B (21st ed. 2005). All samples prepared for measurement on
the ICP-MS were first collected in capped 16 mL polypropylene ICP tubes. Exactly 10 mL of
sample was collected in the tubes and 200 µL of concentrated nitric acid was added to the sample
in order to preserve the samples and to ensure that all of the metals present in the sample
remained soluble.
pH
The solution pH was measured using a probe produced by Accumet© (Cat. No. 13-620-221) and
a meter produced by Oakton© pH/mV/OC (110 Series, RS232). Two different calibration buffer
standard solutions were used prior to each measurement and were used in accordance with the

32
instructions for the pH probe. Both the pH 4 and pH 7 buffer solutions were produced by Fisher
Scientific (Cat. No. SB101-4 and SB107-4, respectively). The probe was stored in a pH 4 buffer
solution and was rinsed between measurements with distilled water.
Free Chlorine
A Hach DR 2400 instrument was used to quantify free chlorine using the DPD method (Hach
Method 8021 – DPD). The low-range detection of 0.02 – 2.00 mg/L was used to measure free
chlorine throughout the laboratory experimental trials. In accordance with the method, 10mL of
sample was collected and analyzed in the sample cell as a blank. After the instrument was
zeroed, the reagent was added and mixed for 30 seconds. The sample was again placed in the
sample cell and analyzed. The instrument then reported the free chlorine concentration in mg/L.
Scanning Electron Microscope (SEM) Sample Preparation
Sand media samples subjected to analysis by SEM were first allowed to air dry. A small silicon
wafer was selected in order to provide a site on which to mount the media sample. A short
length of double-sided carbon adhesive tape was placed on top of the silicon wafer. Then several
grains of media were sprinkled on the surface of the tape. After carefully pressing the grains into
the tape, canned compressed air was used to blow away any grains that were not properly
attached to the surface. This was a precautionary measure to ensure that the sample would not
fall off of the silicon wafer while the sample was in chamber of the SEM instrument. This
method of preparation is one of several commonly applied methods for the analysis of mineral
samples in SEM. A lengthier description of this and other sample preparation methods can be
found in the literature (Goodhew, 1972, Goldstein et al., 1981).
After the sample was secured to the silicon wafer the sample was coated in order to minimize the
effects of charging. Charging can distort the surface image and thus interfere with image
generation. This conductive coating was applied in order to allow the sample to more effectively
ground itself during the analysis and prevented a charge from building up on the surface. A
coating composed of gold and platinum nanoparticles was applied for samples that were
analyzed to produce images. Gold and platinum were most effective at reducing surface charge
and were chosen in order to generate the sharpest possible image. The nanoparticles were
applied to the surface using a procedure that is commonly referred to as 'sputter coating'. The
sample was placed into an evacuated chamber and was subjected to bombardment by high
energy nanoparticles. After several minutes, the thickness of the applied coating was several
nanometers thick and the sample was ready for analysis. In some cases a coating of carbon
nanoparticles was applied to the SEM samples rather than gold and platinum nanoparticles.
Carbon was chosen as a coating medium for the chemical analysis of the surface because it was

33
thought that the introduction of a significant concentration of other metals onto the surface might
interfere with the measurement of the metals of interest on the surface. A full description and
discussion on sputter coating theory and methodology can be found elsewhere (Goldstein et al.,
1981, Bozzola and Russell, 1992).
Finally the sample was ready to be placed into the instrument. Once the sample(s) were placed
in the appropriate sample holder, the instrument was closed and a vacuum was applied. The
voltage used for image generation was generally low (only 5-10 kV). The voltage used for
chemical analysis however, was higher (20 kV or more). The reason for this is that the voltage
must be adequate to excite an electron to produce a measurable response. The required voltage
for a measurable backscatter response is different for each element, but it was higher than the
voltage necessary to produce an image. A detailed guide on the use of an ESEM instrument and
the theory of electron microscopy can be found elsewhere (Goldstein et al., 1981).
Transmission Electron Microscope (TEM) Sample Preparation
A sample of media was placed in a small glass vial. Once the vial was partially filled with water
the vial was capped and the sample was vigorously shaken by hand. The intended result was to
cause the MnOx(s) coating to flake off of the sand grains. The resulting solution was a dark
brown suspension of very small pieces of media. This sample was then allowed to settle for
roughly one minute in order to allow the much larger particles to settle to the bottom of the vial.
Then a small dropper was used to draw up less than a milliliter of the solution from the top of the
vial.
A single drop of the suspension of pulverized media contained in the dropper was then placed
onto a carbon coated copper TEM grid. The grid was placed inside of a desiccator for 24 hours
in order to remove any residual moisture from the sample. The media was then placed into the
TEM shown in Figure 6.

34
Figure 6 - Transmission Electron Microscope - Nanoscale Characterization and
Fabrication Laboratory, Virginia Tech

35
Diffraction Pattern Analysis
Several samples of pulverized media were analyzed with a TEM in order to produce a Selected
Area Diffraction Pattern (SADP). The specific crystal structure of a given solid is characteristic
of that solid. Even solids that have the same chemical composition may have differing
crystalline forms. Using TEM, an analysis of the way in which a solid interacts with an electron
beam can be used to identify not only the chemical composition of a substance, but also its
specific crystalline structure (Beeston et al., 1972).
When a beam of electrons penetrates a thin crystalline sample the beam is partially deflected by
the crystal structure. This elastic scattering creates a pattern that is recorded by the instrument.
This resulting image is called a diffraction pattern. Because the sample is so thin (often less than
50 nanometers) the majority of the beam penetrates the sample. However, a portion of the
electron beam is deflected by the crystal lattice structure of the solid sample, much like a prism.
The specific way in which the beam is deflected can be determined using Bragg’s Law.
(Goldstein et al., 1981) Figure 7 shows both a profile view of the electron beam and a plan view
of the resulting image on the detector film.
If the selected area (or spot size) is sufficiently small to cover only a single crystal, the structure
of the crystal is uniform within the selected area. Thus, the beam is diffracted in several specific
angles and a dotted pattern consisting of a series of spots in a regular array is produced on the
detector film. However, if several smaller crystals of the same type are present in the selected
area, the result is what is known as a polycrystalline diffraction pattern which appears as a series
of rings. The ring pattern is the result of the electron beam interacting with crystals of the same
type in many different orientations. (Beeston et al., 1972)
The distance from the sample to the detector film (or camera length) is a constant and is set by
the operator of the instrument. The distances on the image produced by the detector are
calibrated to a specific camera length. In the case of this analysis, gold nanoparticles of a known
crystal structure were analyzed in order to calibrate the camera length.
The first step in the calibration procedure was to view the gold nanoparticles using the same
camera length that was used for the analyzed sample. A pattern was produced for the gold
nanoparticles. The ring pattern shown on the detector film was then analyzed by measuring the
length from the center of the electron beam to the first ring.
This distance was recorded for each ring compared to a database of known values for gold
nanoparticles. Using image processing software, the number of pixels from the center of the
electron beam to the ring produced was established. This resulted in a correlation between the
width of the ring on the detector and the number of pixels on the screen. The length of several
rings was calibrated in this fashion.
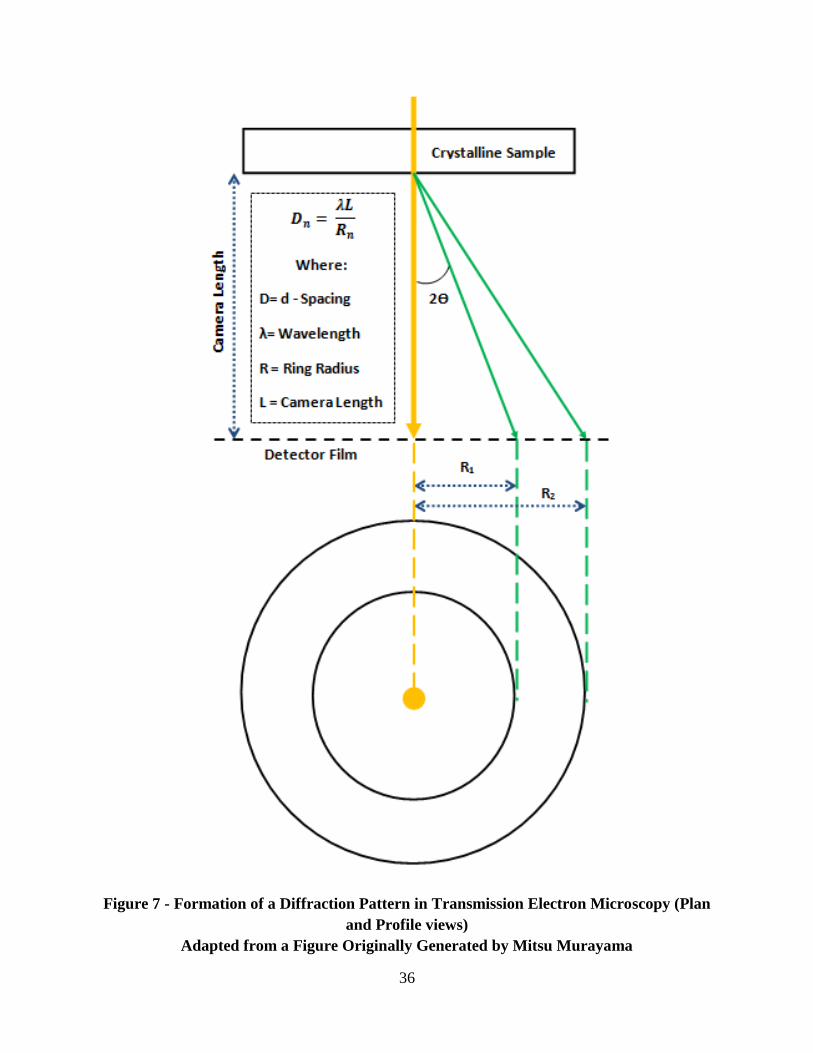
36
Figure 7 - Formation of a Diffraction Pattern in Transmission Electron Microscopy (Plan
and Profile views)
Adapted from a Figure Originally Generated by Mitsu Murayama

37
This distance from the center of the ring to the ring's edge corresponds to a d-spacing, each
mineral structure has a series of d-spacings which arises based on the specific crystal structure of
the mineral that can aid in the identification of the mineral structure. A screenshot of this
process is shown in Figure 8. Utilizing basic trigonometry, the angle of each deflection can be
determined. For a given diffraction pattern, the set of angles can then be compared against a
database of values and the specific mineral can then be identified.
Energy Dispersive Spectroscopy (EDS) Line Scan Analysis
An analysis of the coated media surface was conducted using the SEM. The purpose was to
determine how the composition of the MnOx(s) surface varied with the depth of coating. Since
the operating conditions of each of the columns had remained the same during the coating
deposition it was initially hypothesized that the composition of the coating would be uniform
regardless of depth. However, after considering the issue and the possibility of chemical
reactions within the surface itself, it seemed possible that redox reactions and even chemical
substitutions may have occurred within the MnOx(s) surface on the media.
The media was prepared in two different ways in order to get a cross section of the media
surface. One way was to prepare the media in exactly the same way as it had been for the initial
analysis in the SEM, except that this time the sand grains would be cleaved in order to split the
sand grain and hopefully create a clean cut of the coating as well. Sand grains were placed on a
clean portion of the lab bench and were then pressed with a flat piece of steel until several sand
grains were crushed. The resulting pulverized and cleaved grains were then placed onto silicon
wafers with a carbon tape backing and placed into the SEM for analysis (Goodhew, 1972).
The second method aimed to create a thin cross-section of media suspended in an epoxy resin.
This was accomplished by mixing two components of an epoxy resin together and combining
that with several dozen grains of MnOx(s)-coated sand. That mixture was then carefully inserted
into a small diameter brass tube. The epoxy mixture was heated for 30 minutes at 135OC in
order to harden the resin.
A small diamond saw was then used to cut the tube containing the hardened resin and coated
media into several lengths that were 5 mm long or less. The sections were then ground down
using several different types of sandpaper; beginning with a coarse grain and gradually
decreasing to a finer grain. The result was a thin section 100 µm thick with a small section of
coating clearly visible around each sand crystal. This provided a clear cross section of the
coating that could then be viewed on the ESEM.
Once the two different types of samples were prepared they were placed into the ESEM
instrument chamber and the sample chamber was placed in a vacuum prior to analysis. After

38
selecting a region of the media for analysis, a line scan of the chemical composition was
conducted. The resulting output can be found in the results chapter.

39
Figure 8 - Computer Analysis of Selected Area Diffraction Pattern to Acquire d-Spacing Values

40
EXPERIMENTAL RESULTS
The primary purpose of this section is to present and to interpret the results of several different
experiments and analyses that were conducted in the laboratory. The experiments were designed
with the objective of discovering how Al interacts with the MnOx(s) surface under carefully
controlled and monitored conditions similar to those that would typically be present in a
conventional surface water treatment plant. The conducted experiments were broken down into
distinct categories, each attempting to identify and analyze the interaction of Al with the MnOx(s)
surface utilizing slightly varied experimental conditions. The first section details experiments
that analyzed the adsorptive interaction of ‘soluble’ Al with the MnOx(s) surface by varying the
solution pH, the type of media, and the applied dosage of Mn. The next set of experiments
sought to quantify the interaction of both soluble Al and particulate Al(OH)3(s) species with the
MnOx(s) surface and to track the development of the MnOx(s) surface over time. Finally, the
MnOx(s) surface was characterized using several different electron microscopy techniques.
Selected imagery and analytical results from these analyses are presented in a later section of this
chapter.
Adsorption of Soluble Mn and Al onto MnOx(s)-Coated Media
As was described previously, the first set of bench-scale column experiments sought to explore
the adsorption of soluble Mn and Al onto an MnOx(s) coating. The purpose was to
experimentally verify or refute that the primary mechanism of Al incorporation onto the MnOx(s)
surface was the adsorption of soluble Al species. The amount of soluble Al and Mn was
quantified by comparing the concentration of the two metals in both the influent and effluent of
the column. The two metals were dosed to the column media in their soluble forms; therefore
any difference between the influent and the effluent concentration was presumed to be the result
of adsorptive uptake of the metal by the MnOx(s) surface.
Effect of Al on the Adsorption of Mn
All experimental trials that utilized an MnOx(s)-coated media and soluble Mn showed adsorptive
uptake of Mn. The amount of Mn adsorption in a given experimental trial was dependent on
two primary factors: the amount of MnOx(s) coating on the media and the pH of the applied water.
The quantity of MnOx(s) coating present on the media determined the number of available
adsorptive sites. The correlation between the level of MnOx(s) coating and the potential for
adsorptive uptake of Mn has already been well established by previous research efforts
(Tobiason et al., 2008). When comparing two column trials using two different types of media,

41
the media with the greatest amount of MnOx(s) coating showed the greatest amount of Mn
adsorption. The effect of pH on the adsorptive uptake of Mn on the MnOx(s) surface has been
characterized in previous studies as well (Knocke et al., 1991a, Morgan and Stumm, 1964).
These studies have demonstrated that the adsorptive capacity of the surface is largely a function
of the solution pH. This is due to the adsorptive competition of Mn+2
with H3O+ (Morgan and
Stumm, 1964).
In the case of Al, a change in the solution pH has an effect on the dominant form of Al present in
solution. The dominant soluble Al species can vary from cationic, to neutral, to anionic
(Srinivasan et al., 1999). If Al incorporation into the MnOx(s) surface is adsorptive, then it stands
to reason that the behavior of that adsorption might be affected by the solution pH.
It was initially hypothesized that the potential adsorptive uptake of soluble Al onto the surface
might compete with Mn adsorption. Therefore, experimental trials were conducted in order to
compare the adsorptive uptake of Mn onto the MnOx(s) surface in the presence and absence of
soluble Al. The effluent Mn concentrations shown in Figure 9 show minimal difference in the
adsorption of soluble Mn whether soluble Al species are present or absent at pH 7.2. In the
presence of soluble Al species, the adsorptive uptake of Mn was quantified to be 1.48 mg. In the
absence of soluble Al species 1.47 mg absorbed to the surface. This demonstrates that the
presence of soluble Al does not have any significant effect on the adsorptive uptake of soluble
Mn onto the MnOx(s) surface.
The effluent data also seem to reveal an interesting phenomenon between the surface and the
bulk solution. Data presented in Figure 10 show a measurable concentration of Al in the effluent
of the column that did not receive any Al in the influent. With no significant Al in the influent
feed water, it appears that Al is leaving the surface of the media gradually over time. Two
possible explanations can be postulated for this behavior:
1. The MnOx(s) surface is behaving as a pseudo ion-exchange media and Al is being
desorbed from the surface in favor of replacement by adsorbed Mn.
2. The MnOx(s) surface of this treatment plant media was formed in the presence of super-
saturated concentrations of Al due to the practice of alum coagulation. Taking this media
and exposing it to a feed water without any soluble Al may have caused the Al to leave
the surface as the MnOx(s) surface attempted to establish a ‘new’ equilibrium between the
soluble Al in the bulk solution and the surface Al.
The first explanation is implausible simply because there is no difference in the effluent behavior
of Mn whether Al is present or not. If Mn was being adsorbed as Al was being desorbed, it
would be expected that more Mn would be absorbed in the column that did not receive a soluble
dosage of Al.
Data presented in Figure 11 and Figure 12 show the effluent concentrations of Mn and Al for
columns that received an added dosage of soluble Al and columns that did not. During this

42
experiment the effluent concentrations of Mn in each column approached the influent
concentration much faster at pH 6.3 than at pH 7.2. This indicated that the surface’s adsorptive
capactity for Mn was saturated much more quickly at pH 6.3 than at 7.2 and led to a decrease in
the total amount of Mn adsorbed to the surface during the experimental trial. This was most
likely due to the increased cationic competition on the MnOx(s) surface between Mn and H3O+. A
change in the solution pH also likely caused a change in the abundance of certain species of
soluble Al. A decrease in pH would have increased the concentration of cationic soluble Al
hydroxides, specifically Al(OH)2+. From these data sets alone it is difficult to saw what effect, if
any, this change had on the adsorptive competition with Mn+2
on the MnOx(s) surface as the
measured uptake of Al during the experimental trial was negligible. Data presented in Figure 12
show that the effluent concentration of Al was similar to the influent concentration of Al for
most of the experimental trial. In the presence of soluble Al species at pH 6.3 the surface
adsorbed 0.32 mg of Mn and adsorbed 0.60 mg in the absence of soluble Al species. In both
cases the quantity of Mn taken up by the surface was very slight. The effluent behavior of the
columns seems to again confirm that the presence or absence of soluble Al does not have any
significant effect on the adsorption of soluble Mn onto the surface.
Effect of Media Type on the Adsorption of Soluble Mn and Al
The type of media used in the experiments was varied in order to quantify any variability in the
potential for adsorptive uptake by the media. Most of the experimental trials utilized column
media that was taken from treatment facilities that applied a free chlorine residual across their
filtration media in order to achieve soluble Mn control. These media samples were selected
because they already contained a significant MnOx(s) coating that could be used to quantify
adsorptive uptake of soluble Mn during bench-scale column experimental trials. Not all of the
experiments conducted used media from treatment facilities. Some experimental trials were
conducted using either a synthetically coated media or commercially produced MnO2(s) in the
form of pyrolusite. The important distinction between these types media and the media taken
from treatment facilities was the initial Al content already present in the media coating.
Unlike the media taken from treatment facilities, the pyrolusite media and the media possessing a
synthetically prepared MnOx(s) coating did not contain a significant amount of Al. Analysis by
chemical extraction showed that both the pyrolusite and the synthetically prepared MnOx(s)
coating contained more than 100 times more Mn than Al by weight. This meant that the uptake
on the media could be quantified and compared against the uptake onto media taken from water
treatment facilities which did contain a significant amount of Al. The synthetically generated
MnOx(s) coating on anthracite media was prepared in accordance with the method developed by
Merkle (Merkle et al., 1997). The variation in the adsorptive behavior between the various types
of media allowed for important inferences to be made about the interactions between soluble Mn,
soluble Al and the MnOx(s) surface.

43
Figure 9 - Adsorptive Uptake of Mn onto Blacksburg MnOx(s)-Coated Anthracite Media
(pH 7.2, HLR = 4.0 gpm/ft2, No HOCl Added)
Figure 10 - Adsorptive Uptake of Al onto Blacksburg MnOx(s)-Coated Anthracite Media
(pH 7.2, HLR = 4.0 gpm/ft2, No HOCl Added)
0
20
40
60
80
100
120
0 10 20 30 40 50 60 70 80
Man
gan
ese
(p
pb
)
Volume of Water Passed Through Column Media (L)
Effluent Mn - No Added Al
Influent Mn - No Added Al
Effluent Mn - Saturated Influent Al
Influent Mn - Saturated Influent Al
0
5
10
15
20
25
30
35
40
45
50
0 10 20 30 40 50 60 70 80
Alu
min
um
(p
pb
)
Volume of Water Passed Through Column Media (L)
Effluent Al - No Added Al
Influent Al - No Added Al
Effluent Al - Saturated Influent Al
Influent Al - Saturated Influent Al

44
Figure 11 - Adsorptive Uptake of Mn onto Blacksburg MnOx(s)-Coated Anthracite Media
(pH 6.3, HLR = 4.0 gpm/ft2, No HOCl Added)
Figure 12 - Adsorptive Uptake of Al onto Blacksburg MnOx(s)-Coated Anthracite Media
(pH 6.3, HLR = 4.0 gpm/ft2, No HOCl Added)
0
10
20
30
40
50
60
70
80
90
100
0 10 20 30 40 50 60
Man
gan
ese
(p
pb
)
Volume of Water Passed Through Column Media (L)
Effluent Mn - No Added Al
Influent Mn - No Added Al
Effluent Mn - Saturated Influent Al
Influent Mn - Saturated Influent Al
0
5
10
15
20
25
30
0 10 20 30 40 50 60
Alu
min
um
(p
pb
)
Volume of Water Passed Through Column Media (L)
Effluent Al - No Added Al
Influent Al - No Added Al
Effluent Al - Saturated Influent Al
Influent Al - Saturated Influent Al

45
Data presented in Figure 13 show the adsorption of soluble Mn species onto synthetically coated
anthracite coal at pH 7.2. The amount of MnOx(s) coating present on the synthetic media
(approximately 0.2 mg Mn per gram of dry media) was much less than the amount on the
samples of media taken from treatment facilities which accounts for the lower adsorptive
capacity for Mn.
Data presented in Figure 13 show that the uptake of Mn onto the synthetically generated MnOx(s)
surface is minimal compared to other column trials (0.42 mg for an influent [Mn] of 100 ppb and
0.74 mg for an influent [Mn] of 200 ppb). However, data presented in Figure 14 show that the
uptake of Al during that same experimental trial is significant (0.47 mg for an influent [Mn] of
100 ppb and 0.57 mg for an influent [Mn] of 200 ppb). The uptake of Mn onto the media is
quickly exhausted and the effluent concentrations of Mn become almost equivalent to the
influent concentrations. Interestingly, the results show that the adsorption of soluble Al species
continues even after the adsorptive capacity for Mn has been exhausted.
A similar result is observed when this experiment is repeated under a lower pH condition as is
shown in Figure 15 and Figure 16. At pH 6.3 the uptake capacity for soluble Mn is again rapidly
exhausted. The effluent concentration of Mn even appears to exceed the influent briefly. Thus
no measurable adsorption of Mn was observed during the column trials at pH 6.3. Again the
influent concentration seemed to have no effect on the amount of Al adsorbed by the column
media. (0.41 mg for an influent [Mn] of 100 ppb and 0.43 mg for an influent [Mn] of 200 ppb).
It is important to note that for all of the experimental trials in which a synthetic MnOx(s) coating
was utilized soluble Al continued to adsorb onto the surface long after the Mn adsorption
behavior has ceased. These results indicate that the mechanism for soluble Al incorporation may
not be competitive with manganese. If the two were competitive then it would be expected that
the adsorption of one would be accompanied by the release of the other.
Pure MnO2(s) in the form of pyrolusite was also used in one set of the adsorption column studies.
The fact that the media was pure MnOx(s) rather than a coated media afforded the media surface a
very large adsorptive capacity for Mn. Data presented in Figure 17 show the influent and
effluent concentrations of Mn that flowed through the column media at pH 7.2. The data show a
steady effluent concentration of Mn throughout the column trial. This suggests that the hydraulic
loading rate and the short media bed allowed for only a portion of the influent Mn to be adsorbed
during the time the media was in contact with the bed of media. The Mn in the effluent was not
given enough contact time with the media bed to adsorb and the Mn that did not adsorb exited
the column. Previous researchers studying the adsorption of Mn onto an MnOx(s) surface
generated concentration profiles within an filter containing MnOx(s)-coated media. The
researchers showed how the adsorptive behavior of Mn in a filter varied with filter media depth
and the hydraulic loading rate (Knocke et al., 2010). Based on their results, it is likely that a
deeper bed of filtration media would have yielded a lower effluent concentration of Mn.

46
By the end of the experimental trial the pyrolusite media was far from being saturated with
soluble Mn. This is evidenced by the large and unchanging discrepancy between the influent and
effluent concentrations. The Al data do not follow a similar pattern. Data in Figure 18 show the
corresponding Al adsorptive behavior by presenting the influent and effluent concentration of Al.
As the experimental trial progressed, the effluent Al concentrations appear to have gradually
increased towards the influent concentration as the media approached its adsorptive capacity for
Al. Similar behavior was observed when the experiment was repeated at the lower pH condition
of 6.3. Data for this lower pH condition are presented in Figure 19 and Figure 20.
Despite the vast differences (orders of magnitude) in the amount of Mn present in the MnOx(s)
surface of the synthetically prepared MnOx(s) coating and the pyrolusite, the capacity for the
uptake of soluble Al was similar. Thus, the type of media (or more accurately, the level of
MnOx(s) coating) makes a significant difference in the adsorptive uptake of Mn, but makes almost
no difference in the adsorptive uptake of Al.
Effect of Mn on the Adsorption of Al
The concentration of Mn in the feed water was varied in an effort to further explore the
possibility of competitive adsorptive behavior between Mn and Al in solution. Figure 14 and
Figure 16 show the performance of two columns containing a media with a synthetic MnOx(s)
coating at pH 7.2 and pH 6.3 respectively. In each of the paired columns shown in the figures
the Mn concentration in one of the columns was twice that of the other. Despite the difference in
the Mn fed to each column, the observed adsorption of Al was similar in both cases.
Figure 18 and Figure 20 summarize the data regarding the adsorption of Al by comparing
columns containing pyrolusite media and feed water in which Mn was present and absent at pH
7.2 and 6.3 respectively. Table 6 and Table 7 summarize the mass of Al and Mn adsorbed
during the experimental trials involving pyrolusite and a synthetically generated MnOx(s) coating.
Again, the adsorptive behavior of Al in each column was similar despite one column having a
significant concentration of Mn in the feed while the other contained no added Mn.
Particulate Al(OH)3(s) Deposition onto MnOx(s)-Coated Media
The experimental procedures in which a soluble dosage of Al was applied confirmed the
adsorptive uptake of ‘soluble’ species of Al onto MnOx(s)-coated media. However, this quantity
of Al alone was insufficient to account for the amount of Al present in MnOx(s) coatings found on
coated media from water treatment facilities (Tobiason et al., 2008). This meant that some other
mechanism of Al deposition was at work in order to account for the remainder of the Al present
in these MnOx(s) coatings from full-scale treatment facilities.

47
Figure 13 - Adsorptive Uptake of Mn onto a Synthetic MnOx(s) Coating
(pH 7.2, HLR = 4.0 gpm/ft2, No HOCl Added)
Figure 14 - Adsorptive Uptake of Al onto a Synthetic MnOx(s) Coating
(pH 7.2, HLR = 4.0 gpm/ft2, No HOCl Added)
0
50
100
150
200
250
300
0 10 20 30 40 50 60
Man
gan
ese
(p
pb
)
Volume of Water Passed Through Column Media (L)
Influent Mn=0.1ppm, Sat Al
Influent Mn=0.2ppm, Sat Al
Feed Water Mn=0.1ppm, Sat Al
Feed Water Mn=0.2ppm, Sat Al
0
5
10
15
20
25
30
35
40
45
0 10 20 30 40 50 60
Alu
min
um
(p
pb
)
Volume of Water Passed Through Column Media (L)
Influent Mn=0.1ppm, Sat Al
Influent Mn=0.2ppm, Sat Al
Feed Water Mn=0.1ppm, Sat Al
Feed Water Mn=0.2ppm, Sat Al

48
Figure 15 - Adsorptive Uptake of Mn onto a Synthetic MnOx(s) Coating
(pH 6.3, HLR = 4.0 gpm/ft2, No HOCl Added)
Figure 16 - Adsorptive Uptake of Al onto a Synthetic MnOx(s) Coating
(pH 6.3, HLR = 4.0 gpm/ft2, No HOCl Added)
0
50
100
150
200
250
300
0 10 20 30 40 50 60
Man
gan
ese
(p
pb
)
Volume of Water Passed Through Column Media (L)
Influent Mn=0.1ppm, Sat Al
Influent Mn=0.2ppm, Sat Al
Feed Water Mn=0.1ppm, Sat Al
Feed Water Mn=0.2ppm, Sat Al
0
5
10
15
20
25
0 10 20 30 40 50 60
Alu
min
um
(p
pb
)
Volume of Water Passed Through Column Media (L)
Influent Mn=0.1ppm, Sat Al
Influent Mn=0.2ppm, Sat Al
Feed Water Mn=0.1ppm, Sat Al
Feed Water Mn=0.2ppm, Sat Al

49
Figure 17 - Adsorptive Uptake of Mn onto Pyrolusite Media
(pH 7.2, HLR = 4.0 gpm/ft2, No HOCl Added)
Figure 18 - Adsorptive Uptake of Al onto Pyrolusite Media
(pH 7.2, HLR = 4.0 gpm/ft2, No HOCl Added)
0
20
40
60
80
100
120
0 10 20 30 40 50 60 70
Man
gan
ese
(p
pb
)
Volume of Water Passed Through Column Media (L)
Pyrolusite Media Mn = 0.1ppm , Sat Al
Pyrolusite Media Mn = 0ppm, Sat Al
Feed Water Mn=0.1ppm, Sat Al
Feed Water Mn=0ppm, Sat Al
0
5
10
15
20
25
30
35
40
45
0 10 20 30 40 50 60 70
Alu
min
um
(p
pb
)
Volume of Water Passed Through Column Media (L)
Pyrolusite Media Mn = 0.1ppm , Sat Al
Pyrolusite Media Mn = 0ppm, Sat Al
Feed Water Mn=0.1ppm, Sat Al
Feed Water Mn=0ppm, Sat Al

50
Figure 19 - Adsorptive Uptake of Mn onto Pyrolusite Media
(pH 6.3, HLR = 4.0 gpm/ft2, No HOCl Added)
Figure 20 - Adsorptive Uptake of Al onto Pyrolusite Media
(pH 6.3, HLR = 4.0 gpm/ft2, No HOCl Added)
0
20
40
60
80
100
120
0 10 20 30 40 50 60 70 80
Man
gan
ese
(p
pb
)
Volume of Water Passed Through Column Media (L)
Pyrolusite Media Mn=0.1ppm, Sat Al
Pyrolusite Media Mn=0 ppm, Sat Al
Feed Water Mn=0.1ppm, Sat Al
Feed Water Mn=0ppm, Sat Al
0
5
10
15
20
25
0 10 20 30 40 50 60 70 80
Alu
min
um
(p
pb
)
Volume of Water Passed Through Column Media (L)
Pyrolusite Media Mn=0.1ppm, Sat Al
Pyrolusite Media Mn=0 ppm, Sat Al
Feed Water Mn=0.1ppm, Sat Al
Feed Water Mn=0ppm, Sat Al
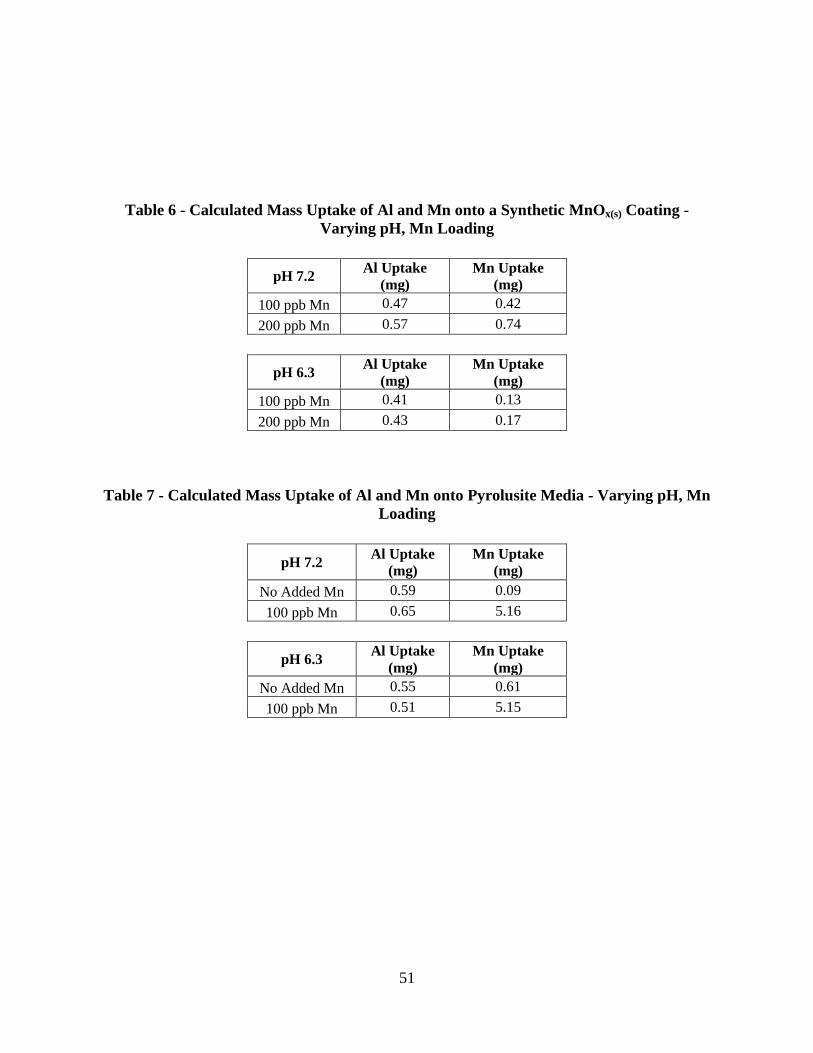
51
Table 6 - Calculated Mass Uptake of Al and Mn onto a Synthetic MnOx(s) Coating -
Varying pH, Mn Loading
pH 7.2 Al Uptake
(mg) Mn Uptake
(mg)
100 ppb Mn 0.47 0.42
200 ppb Mn 0.57 0.74
pH 6.3 Al Uptake
(mg) Mn Uptake
(mg)
100 ppb Mn 0.41 0.13
200 ppb Mn 0.43 0.17
Table 7 - Calculated Mass Uptake of Al and Mn onto Pyrolusite Media - Varying pH, Mn
Loading
pH 7.2 Al Uptake
(mg) Mn Uptake
(mg)
No Added Mn 0.59 0.09
100 ppb Mn 0.65 5.16
pH 6.3 Al Uptake
(mg) Mn Uptake
(mg)
No Added Mn 0.55 0.61
100 ppb Mn 0.51 5.15

52
A new set of bench-scale experimental trials involving columns with short beds of media was
conducted. This study differed from the previous adsorptive study of soluble Al and Mn in two
important ways. First, a supersaturated dosage of Al was applied to the column media in order to
monitor the deposition of both soluble Al and particulate Al(OH)3(s) onto the MnOx(s)-coated
media over time. Secondly, a free chlorine residual (~2-3 mg/L free chlorine) was applied in the
feed water in order act as an oxidant to continually regenerate the MnOx(s) surface.
Al Size Study
A characterization of the Al that comes into contact with the media surface was crucial to
understanding how and why Al incorporates into the MnOx(s) surface. For a treatment plant that
utilizes Al coagulation, the MnOx(s) surface of the filter media is undoubtedly in contact with Al
in both insoluble and soluble forms. The size ranges of colloidal and particulate species of Al
are diverse. Particles observed in treatment facilities range in size from several nanometers to
several millimeters in diameter.
Measurements of Al in both the column feed water and the water upstream of the dual media
filters at the BCVPIWTF were acquired in order to separate the Al into size fractions. The
various species of Al were separated into different size ranges by filtering the water containing
particles of Al through a series of different membrane filters and ultrafilters. In this way it was
possible to separate the Al into different size ranges. The concentration of Al passing through
one filter was subtracted from the concentration passing through the next smaller filter. The
result is a visual representation of the Al species with respect to size.
Figure 21 shows the measured sizes of Al species taken directly upstream of the filters of the
BCVPIWTF. The large concentration of Al species greater than 20 µm is due to the large
particulates created by the coagulation process at the treatment facility; particulates that
unfortunately did not settle out in the previous sedimentation processes. Figure 22 shows the
typical Al species present in the column feed water sampled directly above the column filter
media used in these laboratory studies. The purpose of comparing the two was simply to verify
that the Al loadings in the laboratory columns successfully generated Al species in a wide range
of sizes. It was not possible to load the columns with the same total concentration of Al that
would be typical of a facility like the BCVPIWTF. Likewise, in a real-world treatment situation
the particulate Al loading to the filters would be experience a certain amount of variation due to
the changing effectiveness of upstream processes used to remove particulate Al species from one
day to the next. Unlike the BCVPIWTF, the media bed of the laboratory columns was a
composed of a single type of media. The higher loading of Al coupled with the small void
spaces of the media bed would have rendered column operation impossible due to frequent
backwashing.
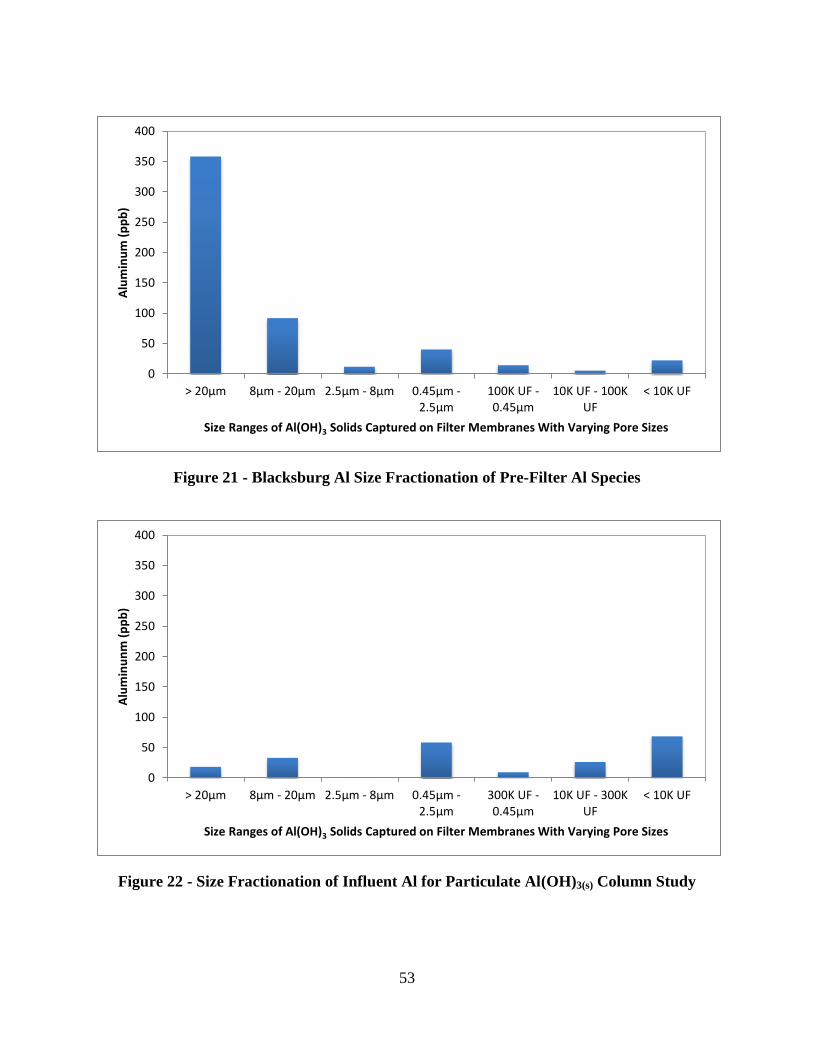
53
Figure 21 - Blacksburg Al Size Fractionation of Pre-Filter Al Species
Figure 22 - Size Fractionation of Influent Al for Particulate Al(OH)3(s) Column Study
0
50
100
150
200
250
300
350
400
> 20µm 8µm - 20µm 2.5µm - 8µm 0.45µm -2.5µm
100K UF -0.45µm
10K UF - 100KUF
< 10K UF
Alu
min
um
(p
pb
)
Size Ranges of Al(OH)3 Solids Captured on Filter Membranes With Varying Pore Sizes
0
50
100
150
200
250
300
350
400
> 20µm 8µm - 20µm 2.5µm - 8µm 0.45µm -2.5µm
300K UF -0.45µm
10K UF - 300KUF
< 10K UF
Alu
min
un
m (
pp
b)
Size Ranges of Al(OH)3 Solids Captured on Filter Membranes With Varying Pore Sizes

54
Effluent Mn and Al Data
Effluent samples were taken during the experiment in order to track the Al and Mn capture
performance of the MnOx(s)-coated media over the entire course of the experiment. Data
presented in Figure 23 show the effluent concentrations of Al varying as a function of the Mn
loading. The data show the effluent concentrations of Al for a variety of different Mn loadings
during the parallel column study in which short beds of MnOx(s)-coated sand media were loaded
with soluble Mn, free chlorine and particulate Al(OH)3(s). The only significant difference in the
effluent behavior in terms of Al species occurred in the column media loaded with background
levels of Mn ([Mn] < 10 ppb). This column showed significant variation in the effluent Al
concentration that was likely the result of particulate breakthrough of Al(OH)3(s). Columns with
applied dosages of Mn showed little variability in their effluent behavior with regard to Al.
Whether this consistent capture of Al for columns loaded with Mn can be attributed to a property
of the MnOx(s) coating itself, an interaction with the entrained Al solids within the media bed, or
a combination of both is difficult to say from this data set alone.
Effluent Mn data presented in Figure 24 indicate that the ability of the MnOx(s) coated media to
sequester Mn rapidly improved in just a few days. In each experimental trial, an effluent
concentration of Mn of less than 5 ppb was achieved within 10 days of column operation. In a
practical sense, these data seem to indicate that a filtration media seeded with a very modest
initial MnOx(s) coating can effectively capture soluble Mn within a few days.
Media Extraction Data
In their investigation of Mn uptake by filtration media, Tobiason et al. (2008) performed
chemical extraction analyses of media coatings from a variety of different treatment facilities in
order to characterize the metal content of the MnOx(s) coating. A procedure developed by
Knocke et al. (1990) was used to extract the MnOx(s) coating from the media in order to measure
the metals content. This was necessary in order to compare the results of the laboratory study of
particulate Al(OH)3(s) species to the results of the 2008 AWWARF study. The specific method
can be found in the methods chapter of this document. Table 8 is a selection of the results
obtained by Tobiason et al. (2008) showing an Al:Mn molar ratio typical of the plants included
in the study. The data show how the amount of Mn and Al present in the MnOx(s) coatings on
filtration media taken from a core sample of a bed of filtration media. The authors also presented
the calculated molar ratio of Al:Mn. While the data represented in Table 8 are taken from a
single core sample from a single plant, data in Table 9 in the discussion chapter provide a
summary of Al:Mn molar ratios from surface water treatment facilities surveyed in the 2008
AWWARF study.

55
Figure 23 - Effluent Al During Particulate Al Column Study - Varying Mn Loadings
(4.0 gpm/ft2, pH 6.8-7.1, [HOCl] = 2-3 mg/L)
0
20
40
60
80
100
120
140
160
180
200
0 5 10 15 20 25 30
Effl
ue
nt
Alu
min
um
(p
pb
)
Column Operation Time (Days)
400 ppb Mn
200 ppb Mn
100 ppb Mn
100 ppb Mn '
50 ppb Mn
< 10 ppb Mn

56
Figure 24 - Effluent Mn During Particulate Al Column Study - Varying Mn Loadings
(4.0 gpm/ft2, pH 6.8-7.1, [HOCl] = 2-3 mg/L)
0
20
40
60
80
100
120
140
160
180
200
0.00 2.00 4.00 6.00 8.00 10.00 12.00 14.00 16.00 18.00 20.00
Effl
ue
nt
Man
gan
ese
(p
pb
)
Column Operation Time (days)
400 ppb Mn
200 ppb Mn
100 ppb Mn
100 ppb Mn'
50 ppb Mn
< 10 ppb Mn

57
Table 8 - Molar Metal Ratios for Harwood's Mill WTP (Tobiason et. al. 2008)
Average
Depth
(in)
Mn Coating
(mg/g)
Al
Coating
(mg/g)
Al:Mn
Molar
Ratio
3 37.7 27.8 1.50
9 28.1 21.4 1.55
15 29.8 21.6 1.47
21 30.4 23.8 1.59
27 9.25 9.03 1.99
33 0.675 1.20 3.61

58
Figure 25 characterizes the molar ratio of Al to Mn within the MnOx(s) coating during the
experiment. All of the columns were exposed to a similar concentration of Al (200 - 220 ppb),
but each column was loaded with feed water containing a different concentration of soluble Mn.
The data show that the molar ratio of Al:Mn decreased as the amount of soluble Mn in the feed
water increased. As the amount of Mn loaded to the columns decreases to 50 ppb, the ratio of
Al:Mn increases to a value typical of MnOx(s)-coated samples from surface water treatment
facilities.
These results demonstrate that it is possible to produce a molar ratio of Al to Mn in the coating
similar to that observed in the MnOx(s)-coated media found on the media of surface water
treatment plants presented in the 2008 AWWARF study. Unlike the Mn loadings that were
applied in the laboratory, treatment plant filtration media is usually subjected to seasonally
varied loadings of Mn. Additionally, treatment plants with very high Mn loadings will remove a
significant fraction of the influent Mn by applying strong oxidants. In any case, the
concentration of soluble Mn that reaches the filtration media is typically much lower than many
of the experimental conditions tested in the laboratory.
The chemical extraction data presented in Figure 26 show the Al content of the MnOx(s) coatings
in each of the columns operated during the particulate Al experimental trials. The amount of Al
is expressed in units of mg of Al per dry gram of filtration media. The data cover a variety of
different Mn loadings (< 10 ppb – 400 ppb). In each of the columns in which added dosage of
soluble Mn was applied, the column media did accumulate Al within the MnOx(s) surface. The
only column media that did not accumulate a significant amount of Al was the column which did
not receive an added dosage of Mn (“< 10 ppb Mn”). The data show that in the Al deposition
onto MnOx(s)-coated media only occurs with the continued deposition of soluble Mn.
Mn Loading and Al Capture
A study was conducted in which the influent and effluent concentrations of Al were compared
for three parallel columns with varying loadings of Mn in an effort to further quantify the capture
of Al. The fraction of the influent Al for each size fraction that was captured as the feed water
passed through the filtration media was quantified and the data are presented in Figure 27.
Samples were collected of the influent feed water and were filtered through a series of filters of
various pore sizes. The filtrate from each filter size was sampled and measured on the ICP-MS.
This analysis was repeated three times; once for each of the three column influent waters. The
resulting Al concentrations were then averaged (because the column feed waters were identical
except for their added Mn concentrations) to produce a single value for each size filter size.

59
Figure 25 - Molar Ratio of Al:Mn In the MnOx(s)-Coated Media Over Time - Particulate
Al(OH)3(s) Column Study, Varying Soluble Mn Loadings (50 ppb - 400 pbb)
Figure 26 - Al Content of MnOx(s)-Coated Media Over Time (mg Al / gram of Dry Media) -
Particulate Al Column Study, Varying Soluble Mn Loadings (50 ppb - 400 ppb)
0
0.2
0.4
0.6
0.8
1
1.2
1.4
1.6
1.8
2
0 5 10 15 20 25 30
Mo
lar
Rat
io o
f A
l:M
n In
Me
dia
Co
atin
g
Column Operation Time (Days)
400 ppb Mn
200 ppb Mn
100 ppb Mn
100 ' ppb Mn
50 ppb Mn
0.0
0.5
1.0
1.5
2.0
2.5
3.0
0 5 10 15 20 25 30
Alu
min
um
Co
nte
nt
of
Mn
Ox
Co
atin
g (m
g A
l/g)
Column Operation Time (Days)
400 ppb Mn
200 ppb Mn
100 ppb Mn
100 ' ppb Mn
50 ppb Mn
< 10 ppb Mn

60
Figure 27 - Percentage of Influent Al Species Captured During Filtration as a Function of
Mn Loading (50 ppb - 400 ppb)
0%
10%
20%
30%
40%
50%
60%
70%
80%
Total 20 µm 8 µm 2.5 µm 0.45 µm 300K UF 10K UF 5K UF
Pe
rce
nta
ge o
f In
flu
en
t A
l Sp
eci
es
Cap
ture
d B
y C
olu
mn
Me
dia
Filter Pore Size
200 ppb Mn
100 ppb Mn
50 ppb Mn

61
Then two effluent samples were collected from each column and filtered through the same series
of filter sizes that were applied to the influent samples. One effluent sample was taken near the
beginning of the filter cycle and another was taken just prior to filter backwash in order to
capture any variability that may have occurred during the filter cycle. These two values were
then averaged to produce a single value. Finally, the difference between the concentration of Al
passing through a filter of a given pore size in the influent sample and the concentration of Al
pass through that same filter size in the effluent was computed for each column and each filter
size.
Across every size category, the amount of Al captured increased as the soluble Mn loading to the
MnOx(s)-coated media increased. It is impossible to say with certainty the specific reason why
higher Mn loadings increase the Al capture efficiency. It cannot be stated whether this enhanced
capture of Al occurs on the MnOx(s) surface, on the backwash solids present within the media
bed, or a combination of both. However, what can be stated is the presence of a greater amount
of Mn deposition the capture of particulate Al species is enhanced.
In addition, several detailed sampling trials were conducted during a single filter run cycle. Data
presented in Figure 28 show the effluent Al concentrations from several columns beginning with
the initial backwash of the media until the accumulated head on the column media exceeded the
limits of the experimental apparatus and data collection ceased. The data suggest a relationship
between the loading of Mn and the breakthrough of particulate Al.
The column loaded with only background levels of tap water Mn experiences a significant
increase in Al particles larger than 0.45 µm near the end of the filter cycle. The two columns
that contained additional dosages of Mn (100 ppb, 400 ppb) show little or no change between the
filtered and unfiltered Al concentrations during the filter run. The discrepancy between the
effluent samples that were unfiltered and the samples that were filtered through a 0.45 µm filter
can be thought of as the ‘particulate’ fraction of Al in the effluent. The column with the highest
loading of Mn (400 ppb) had to be `taken offline earlier than the other two columns because the
head on the filter reached a level that was beyond the capacity of the apparatus.
The length of the filter run does not appear to have any impact on the capture of species of Al
less than 0.45 µm. As the filter cycle progresses from time zero (filter backwash) to the end of
the data collection, there appears to be little or no change in the effluent Al species less than 0.45
µm in any of the columns during the filter run.

62
Figure 28 - Measured Particle Breakthrough Behavior with Varying Mn Loading
0
50
100
150
200
250
0.00 0.10 0.20 0.30 0.40 0.50 0.60 0.70 0.80 0.90 1.00
Co
lum
n E
fflu
en
t A
lum
inu
m (
pp
b)
Column Operation Time After Backwash (Days)
Inf Mn = 400 ppb - (Unfiltered)
Inf Mn = 400 ppb - (0.45µm)
Inf Mn = 100 ppb - (Unfiltered)
Inf Mn = 100 ppb - (0.45µm)
Inf Mn = < 10 ppb - (Unfiltered)
Inf Mn = < 10 ppb - (0.45µm)

63
Scanning Electron Microscopy Images
Several samples of filter media were prepared and analyzed using the ESEM instrument of the
Nanoscale Characterization and Fabrication Laboratory (NCFL) at Virginia Tech. The analysis
yielded both qualitative and quantitative information about the MnOx(s) surface composition.
Several different analyses are presented in the following subsection.
MnOx(s)-Coated Media Surface Images
Figure 29 shows a sample of sand media prior to being loaded into the bench scale column
experiment in which soluble Mn and a mixture of soluble and insoluble Al species were applied
to the media. The sand media was donated by Siemens (Ames, IA) and possessed a light
MnOx(s) coating.
Figure 30 shows a sample of sand media that was used during the particulate Al loading column
study. The original MnOx(s)-coated sand grain was exposed to feed water containing a high
concentration of Mn ([Mn] = 0.4 mg/L) and a supersatured dosage of Al. The resulting coating
appeared rough in texture and covered the entire sand grain. An image of the surface of the same
piece of media at a higher magnification is shown in Figure 31. The higher magnification
revealed crevices and voids on the surface of the media that were only a few micrometers wide.
In a qualitative sense this provided a physical representation of the enormous surface area of the
MnOx(s) coating. Additionally, the multitude of small crevices suggested the potential for small
insoluble particles of Al(OH)3(s) to bind to the surface and entrain themselves within the MnOx(s)
surface.
EDS Mapping
Several different prepared samples of sand media were placed into the ESEM instrument and
analyzed using EDS for a qualitative analysis of the elemental composition of the coating. This
analysis helped to describe the composition of the samples and was utilized in selecting sections
for further analysis using EDS line scans.
Results presented in Figure 32 and Figure 33 show a sample of MnOx(s)-coated media (feed water
[Mn] = 0.4 mg/L) suspended in a resin prepared by a method described in the EDS line scan
analysis section of the methods chapter. Figure 32 is a presentation of the normal ESEM image
of the sample combined with the backscatter response of the sample by element (each element is
designated by a different color), whereas Figure 33 is the same image segregated by element. In
both images, the silicon sand base of the media was clearly visible and was contrasted by the Mn
and Al of the coating that compose of MnOx(s) coating. While this analysis did qualitatively
demonstrate the elemental content of the coating, it could not be used to quantify the coating

64
content. This sample was placed into the ESEM and a small corner was selected for analysis.
The base material showed a very high silicon signal and was surrounded by the MnOx(s) coating
that was generated during the particulate Al column study. The image of the coating does not
appear to show any silicon, but does show a strong presence of Mn and Al. Line scans of this
sample are presented in the appendix.
The same sample of media was analyzed again at a lower magnification. At this magnification,
the broken pieces of sand media contained in the resin can be observed. The sample was in the
process of being prepared for TEM analysis, but it was abandoned for TEM analysis when a thin
slice of sand media broke and fell out of the resin. The residual coating of that sand was left
behind on the resin and can be identified by the strong signal of Mn and Al in the upper left
corner of Figure 34. The individual signals produced by Mn and Al are shown in Figure 35. The
image of Mn shown in the lower left portion of the figure clearly shows the outlines of the coated
sand.
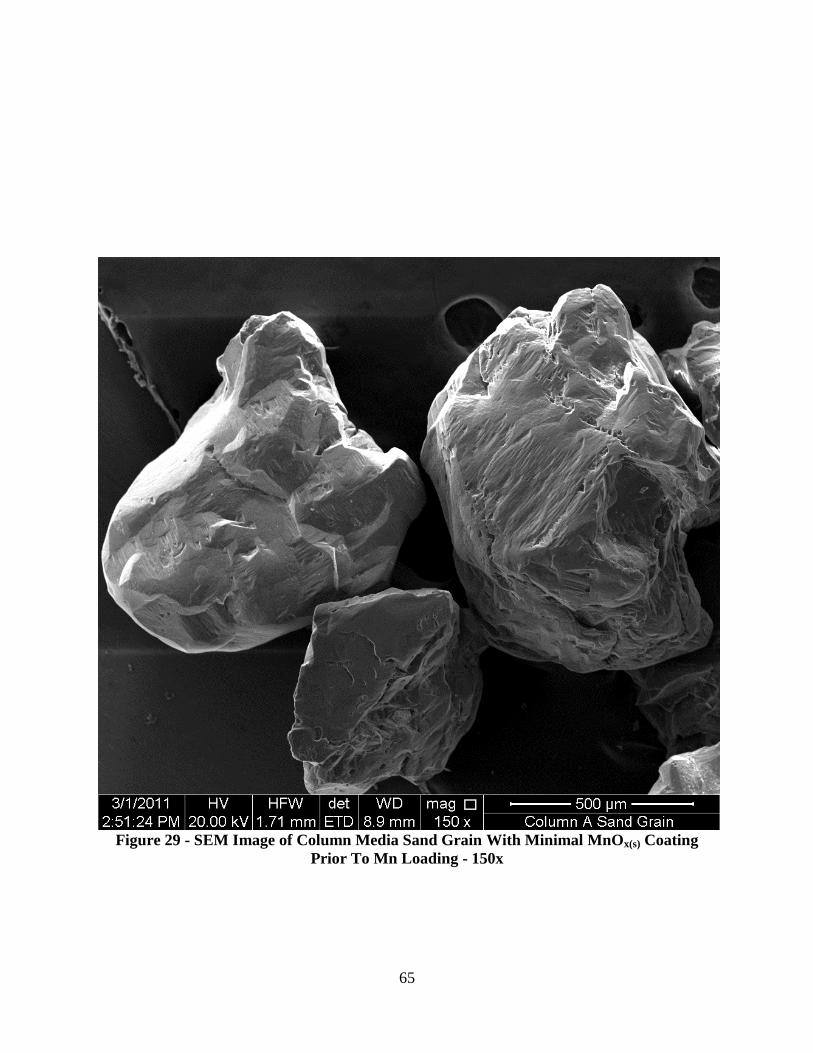
65
Figure 29 - SEM Image of Column Media Sand Grain With Minimal MnOx(s) Coating
Prior To Mn Loading - 150x

66
Figure 30 - SEM Image of Column Media Sand Grain, 500x
(Feed Water [Mn] = 0.4 mg/L)

67
Figure 31 - SEM Image of Column Media Sand Grain, 10,000x
(Feed Water [Mn] = 0.4 mg/L)

68
Figure 32 - EDS Map of Thin Section of MnOx(s)-Coated Sand in Resin
(Feed Water [Mn] = 0.4 mg/L)
Blue Silicon Oxide Sand Particle Surrounded By An MnOx(s) Coating Shown in Red and
Green
Figure 33 - EDS Backscatter Images of Thin Section of MnOx(s) Separated by Element

69
Figure 34 - EDS Map of Thin Section of MnOx(s)-Coated Sand Particles in Resin
(Feed Water [Mn] = 0.4 mg/L)
MnOx(s) Surace Is Visible Along The Edges Of The Sand Particles
Figure 35 - Backscatter Images of Thin MnOx(s)-Coated Particles Separated By Element
EDS Line Scan Analysis

70
The ESEM was also used to apply EDS to line scans across sections of the coating that was
produced during the laboratory analysis. The analysis was similar in concept to the previous
EDS analyses, but instead of a map showing the elemental composition of a region, a short
length was chosen for analysis. At several points along the defined length, the elemental
composition was quantified by detecting the response of the surface to the applied electron beam.
This process was applied to several samples of column media that were used during the
particulate Al study. Each media sample had been exposed to a different Mn loading (50, 200,
and 400 ppb). The samples were prepared by cleaving samples of the MnOx(s)-coated sand
media and attempting to scan across the exposed cross section of the coating. Several plots
showing the measured counts of Al and Mn across the length of the scan were compiled.
Representative results are presented here, with others in the appendix.
Figure 36 shows the direction of the scan across the media MnOx(s) coating with the lowest feed
water Mn concentration (50 ppb). The instrument was able to roughly quantify the abundance of
each element by detecting the response of the media surface to a high energy electron beam.
When the beam was focused on a specific area, an X-ray was produced. The intensity and
energy of this X-ray can be interpreted by the detector to a specific element. Each time a
characteristic X-ray of a certain element is detected, a single count is registered. The counts of
both Al and Mn (shown in Figure 37) were lowest in the region of the scan covering the silicon
oxide sand base of the coated media. In the portion of the scan covering the MnOx(s) coating the
number of detected counts of Al consistently exceed that of Mn, but an increase in one was
almost always matched by an increase in the other. Figure 38 shows another MnOx(s)-coated
media loaded with a higher concentration of Mn (200 ppb). The counts of Al still exceeded
those of Mn in the scan of the MnOx(s) coating shown in Figure 39, but the discrepancy in the
counts is less than was observed in Figure 37.
The EDS Map shown in Figure 40 shows how the topography of the MnOx(s) surface hinders the
instrument’s ability to detect the counts of Mn and Al (Goldstein et al., 1981). The media shown
was exposed to a feed water containing a high concentration of Mn (400 ppb). The backscatter
response of both Mn and Al drop off in the crevices of the surface, evidenced by the darker
regions of Figure 40. Figure 41 shows an EDS scan conducted across that same surface.
The limitations of this type of analysis make it difficult to make quantitative statements about the
composition of the surface. In order to speculate about the composition of the surface in terms of
mass, assumptions have to be made about the form of each element. The number of oxygen
atoms assumed for each detected atom of Mn or Al can have a significant impact on the
estimation of the mass composition of the surface.
However, the EDS line scans confirm that Al and Mn are present together throughout the media
surface as opposed to existing in localized deposits. This yields important information about
how the Mn and Al are deposited onto the MnOx(s) surface.

71
Figure 36 - ESEM Image - Coating Cross Section of Cleaved Sand Grain (Feed Water [Mn]
= 0.05 mg/L)
Arrow Indicates the Line Scan Pathway
Figure 37 - EDS Line Scan of Coating - Mn and Al Counts (Feed Water [Mn] = 0.05 mg/L)
# o
f C
ounts
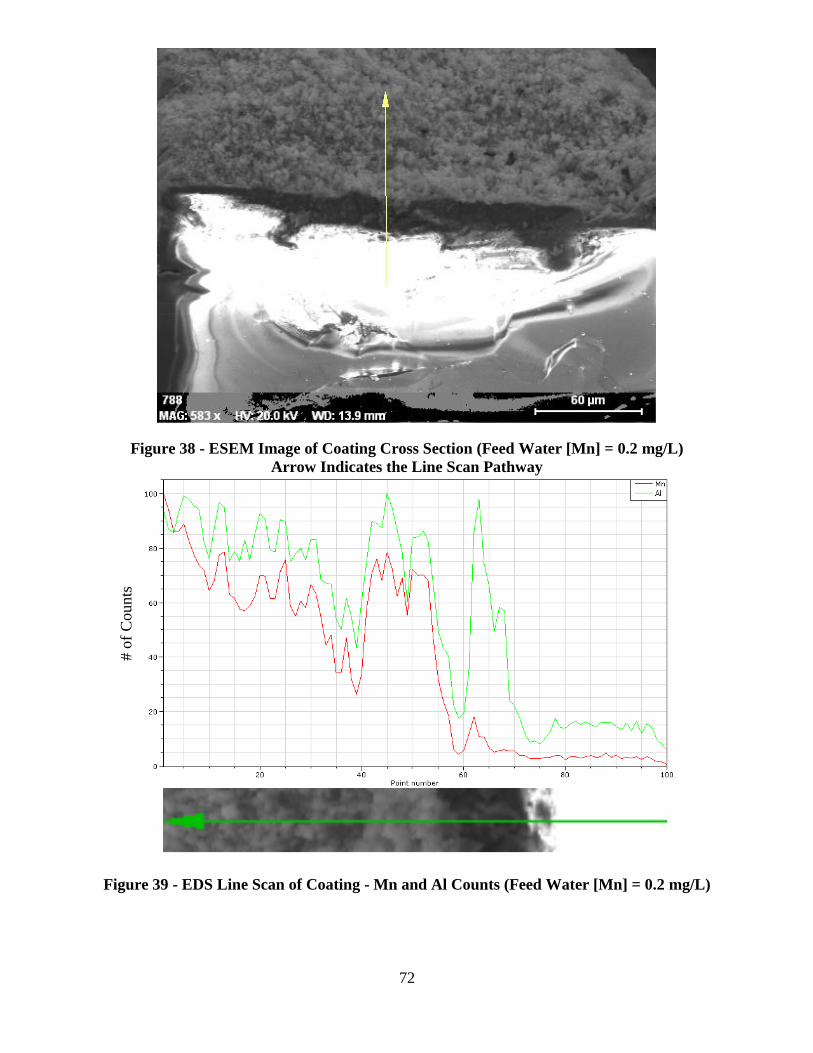
72
Figure 38 - ESEM Image of Coating Cross Section (Feed Water [Mn] = 0.2 mg/L)
Arrow Indicates the Line Scan Pathway
Figure 39 - EDS Line Scan of Coating - Mn and Al Counts (Feed Water [Mn] = 0.2 mg/L)
# o
f C
ounts

73
Figure 40 - ESEM Map of MnOx(s) Surface (Feed Water [Mn] = 0.4 mg/L)
Figure 41 - Line Scan of Coating Mn and Al Counts (Feed Water [Mn] = 0.4 mg/L)
Variation in Detected Counts Is Likely The Result of Variation In Surface Topography
# o
f C
ounts

74
TEM Images
An analysis using a Transmission Electron Microscope (TEM) was completed in order to further
characterize the MnOx(s) surface. Previous work conducted on MnOx(s) surfaces utilized a
chemical extraction procedure to characterize the MnOx(s) coating (Knocke, 1990). Analysis of
the media surface by chemical extraction does yield important about metals content of the
surface, but does not provide any information beyond the total chemical composition of the
MnOx(s) surface. As previously discussed, seasonal loadings of Mn in water treatment facilities
result in the formation of layered depositions of Al and Mn. When a piece of coated media from
a treatment plant is examined in cross section under an electron microscope the media coating
structure resembles that of tree rings. Each layer embodies a deposition representative of the
bulk water solution at a given time that the media was being used at the plant. When the MnOx(s)
surface is fully extracted and averaged the information contained in the layered deposits is lost.
Though the cost and time investment for TEM analysis is much greater than simple chemical
extractions, the information obtained is much greater. TEM analysis characterizes not only the
chemical composition of the surface, but also yields the potential to determine the specific
mineral composition of the surface.
The samples of media selected for analysis were pulverized using a method described in the
TEM sample preparation section of the methods chapter. A visual inspection of cross section
images of the MnOx(s) surface in Figure 42 shows a surface that is far from homogeneous. The
surface appears to be composed of a mix of weakly crystalline and amorphous structures. Figure
42 and Figure 43 are images of the same sample of MnOx(s) coating. Both images show a
heterogeneous mixture of particles. The sample appears to consist of a mixture of small, dense
crystalline structures accompanied by less dense amorphous or weakly crystalline structures.
From these images alone it is not possible to say with certainty that the darker areas are
necessarily Mn oxide crystals and that the lighter areas are amorphous Al. The contrast between
light and dark in the image is not always indicative of differences in chemical composition or
physical state. Contrast in the image can be caused by several factors including differences in
the topography of the sample and variability in the thickness of the sample (Goldstein et al.,
1981). Careful preparation of the sample and careful selection of the analyzed particle can
reduce this variability. When the sample is relatively uniform in topography and thickness, the
variability in image contrast can be attributed to differences in the sample composition(Goldstein
et al., 1981).
The composition of the TEM samples was verified using SADP. Using the diffraction pattern
analysis, a specific crystal structure can be analyzed in detail. When the electron beam was
focused on the sample a ring pattern was produced.

75
Figure 42 - TEM Image of Pulverized MnOx(s) Coating (Scaled as Shown)

76
Figure 43 - TEM Image of Pulverized MnOx(s) Coating (Scaled as Shown)

77
High Resolution TEM
One analysis was conducted using a different TEM than the one that was used in the laboratory
at Virginia Tech. Several images were generated and scans for elemental composition were
conducted. The image shown in Figure 44 is so sharp that the lattice structures of Mn oxide
crystals a few nanometers wide can be observed. The crystalline structures appear as clusters of
parallel lines within the image. Different clusters show different orientations of lattices
indicating the presence of many different nano-sized crystals rather than a larger crystalline
structure.
TEM – Diffraction Pattern Analysis
One of the key motivations for pursuing a TEM analysis of the coating was the potential to
gather information about the specific mineral phase of the coating rather than simply its chemical
composition. The TEM produces an image of the sample by illuminating the sample with a
focused high energy (~120kV) electron beam. Alternatively, the beam can focus on a much
smaller area of the sample in order to produce a diffraction pattern. The result in this case was a
series of rings. Each ring’s distance from the center of the image was analyzed in order to
measure a d-spacing.
Figure 45 represents a diffraction pattern that was typical of the analysis of several coated media
surfaces. The collected diffraction patterns were analyzed using a computer in order to measure
several d-spacings. After analyzing several diffraction patterns 3 or 4 values of d-spacings
appeared consistent through many of the images. These values were then analyzed using a
database in order to confirm the crystalline structure of the constituent phases in the TEM.
Using a computer database and assuming that Mn was part of the chemical composition, the
mineral was successfully identified as a weakly crystalline Mn oxide.
None of the d-spacings could be matched to known Al minerals or crystalline structures. This is
likely because the Al on the MnOx(s) surface was probably amorphous and lacked a lattice
structure that would have produced a measurable response from this analytical method.
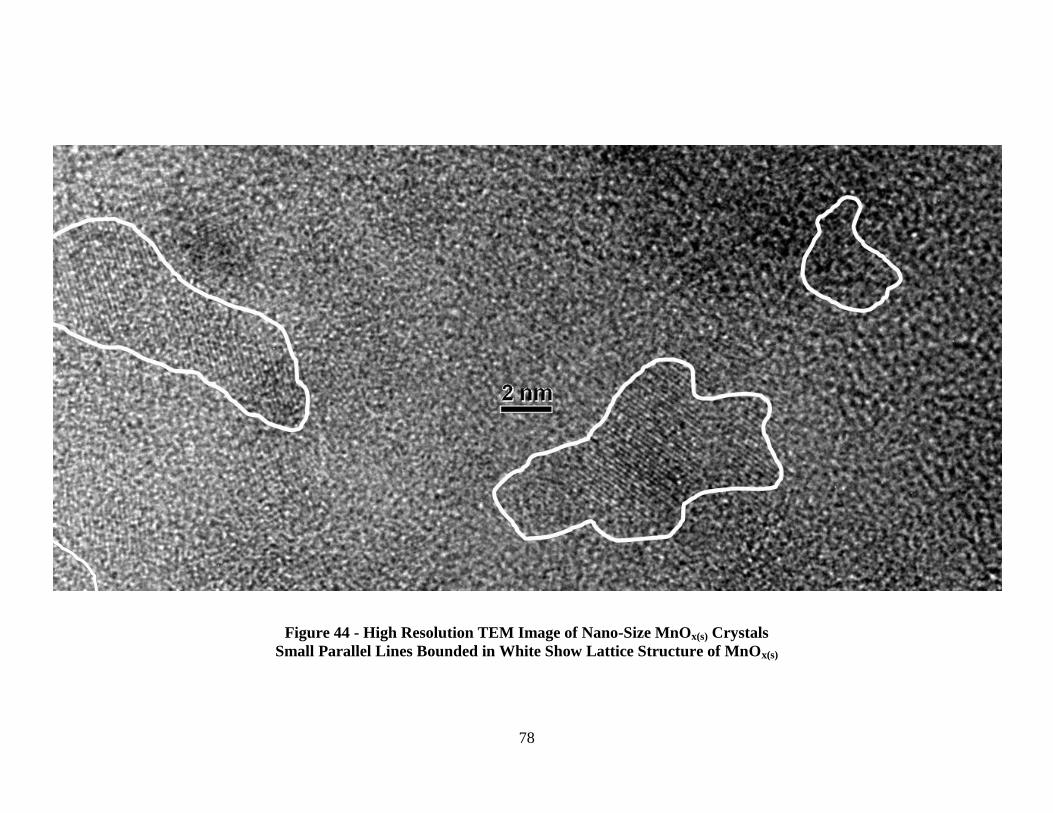
78
Figure 44 - High Resolution TEM Image of Nano-Size MnOx(s) Crystals
Small Parallel Lines Bounded in White Show Lattice Structure of MnOx(s)
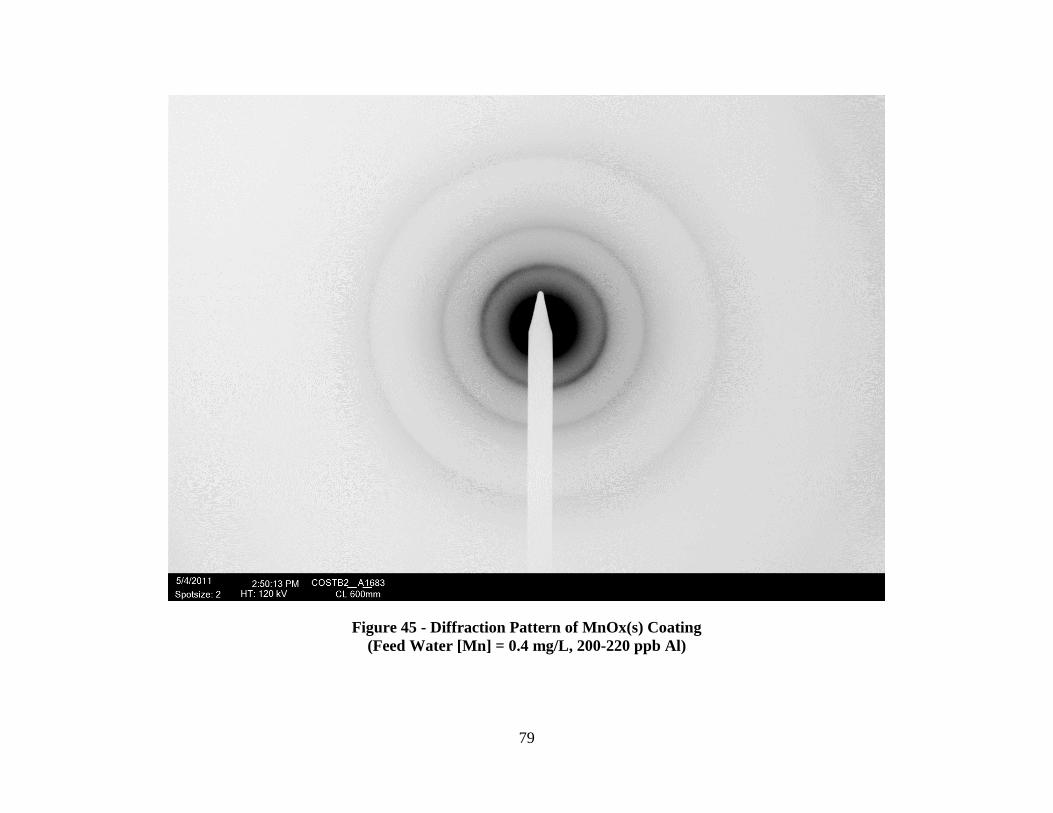
79
Figure 45 - Diffraction Pattern of MnOx(s) Coating
(Feed Water [Mn] = 0.4 mg/L, 200-220 ppb Al)
80
DISCUSSION
Soluble Al Study
The results of the adsorptive bench-scale column studies demonstrated the potential of the
MnOx(s) surface to adsorb soluble Al species. This adsorptive behavior did not appear to be
impacted by the concurrent adsorption of reduced Mn. Similarly, the presence or absence of
soluble species of Al did not impact the adsorptive uptake of Mn onto the MnOx(s) surface. This
proved to be true under all of the experimental conditions tested. Experiments were conducted
under two pH conditions (6.3 and 7.2) and with several different types of MnOx(s)-coated
filtration media. Comparative analysis of effluent data from the each of the experimental trials
shows that the presence or absence of one species (Al or Mn) had no effect on the adsorption of
the other onto an MnOx(s)-coated surface.
One of the initial motivations for conducting this study of the interaction of Al with the MnOx(s)
surface was the molar ratios of Al to Mn observed in the MnOx(s) coatings of filtration media in
surface water treatment plants surveyed for the 2008 AWWARF study on Mn removal. The fact
that the ratio was relatively consistent (1.0 - 2.0 Al:Mn) across several different water treatment
facilities suggested some sort of functional relationship between the two metals (Tobiason et al.,
2008). The measured molar ratio of Al:Mn within the MnOx(s) coatings of several facilities that
applied chlorine across their filtration media is presented in Table 9.
Interestingly, one facility (Cantref) showed a significant accumulation of Al on the MnOx(s)
media despite the fact that the facility did not apply Al-based coagulants. The Al present in the
MnOx(s) coatings of that media most likely came from low levels of Al present in the raw source
water. Though the ratio of Al:Mn present in the MnOx(s) coatings of that media is less than other
MnOx(s)-coated media, it seems to suggest that Al possesses a strong affinity for the MnOx(s)
surface.
Initial experiments conducted in the laboratory focused on the adsorption of soluble Al species
onto the MnOx(s) surface under a variety of different experimental conditions. In each case, the
uptake of Al onto the MnOx(s) surface was compared against the uptake of Mn onto the surface.
Table 10 presents observed molar ratios of absorptive uptake (Al:Mn) for the experiments in
which soluble Al species were applied to MnOx(s)-coated media.
Comparing the experimentally generated data in Table 10 to the Al:Mn ratios observed in the
2008 AWWARF study presented in Table 9, excepting the facility that applied Fe-based
coagulants, none of the experimental trials were successful in producing Al:Mn ratios to match
those observed in water treatment facilities. This led to an important conclusion; namely that the
Al content of the MnOx(s) coating could not be explained solely by the uptake of soluble species
of Al. Thus, some amount of particulate Al uptake by the surface must also occur.

81
Table 9 - Molar Ratio Ranges of Selected Treatment Facilities Surveyed in 2008 AWWARF
Study (Tobiason et al, 2008)
Facility Name
Observed Al:Mn
Molar Ratio
Range
Average MnOx(s)
Coating (mg Mn/g
Media)
Notes
Cantref (UK) 0.14 - 0.37 3.41 Uses Fe-Based
Coagulants
Carno (UK) 1.03 - 1.33 4.97 --
Warner (VA) 1.96 - 2.16 11.0 --
Harwood's Mill (VA) 1.28 - 2.09 30.8 --
Table 10 - Adsorptive Molar Ratios Generated During Laboratory Studies Applying
Soluble Al to MnOx(s)-Coated Media
Pure MnO2(s)
Blacksburg Treatment
Plant Media
Average MnOx(s) Coating (mg Mn/g
Media) 100% Mn 5.3
Molar Al:Mn in Original Coating N/A (No Al Present) 1.3
Observed Molar Adsorption Ratio
(Al:Mn) 0.20, 0.25 0.26, 0.49, 0.15, 0.18, 0.51
82
Insoluble Al Study
A second set of experimental trials was conducted in which a super-saturated dosage of Al was
applied to MnOx(s)-coated column media in order to facilitate the formation of insoluble Al
hydroxide (Al(OH)3(s)). The MnOx(s)-coated media was exposed to a combination of soluble
species of Al, insoluble species of Al, varying dosages of Mn, and free chlorine. This series of
bench-scale experiments that monitored formation of an MnOx(s) coating under varying influent
concentrations of Mn successfully demonstrated the incorporation of Al into an MnOx(s) coating.
Effluent concentrations of Al species were monitored along with extraction data of the generated
MnOx(s) surfaces themselves in order to characterize the phenomenon of Al incorporation onto
the MnOx(s) surface.
Periodic chemical extraction of the surface showed that the molar ratio of Al:Mn decreased as
the influent Mn increased. The measured molar ratio of Al:Mn in the coating was determined to
be 1.3 when the Mn loading was 50 ppb. This ratio fell to 0.6 as the Mn loading increased to 400
ppb. Effluent Mn and Al concentrations were measured throughout the experiment.
Analysis of this effluent data demonstrated a relationship between the capture of Al species and
the amount of Mn loaded to the column media. Data presented in Figure 28 show the
breakthrough of particles larger than 0.45μm breaking through the bed of filtration media on the
column with the lowest Mn loading. Another set of data shown in Figure 27 illustrates a
comparative analysis of the influent and effluent Al species for columns loaded with varying
amounts of Mn. Both sets of data indicate a relationship between the loading of Mn and the
potential to capture Al species. When the loading of Mn was increased, the ability of the media
to capture Al across every size range was improved. This result leads to the question of whether
or not the MnOx(s) surface enhances the capture of other species as well.
A study published in 2011 surveyed several different treatment facilities applying a wide range
of different treatment techniques and filter hydraulic loading rates in order to characterize the
influent and effluent particle sizes. The authors tracked the capture of both organic and
inorganic solids across the filters of each facility by separating the particles into size
classifications. In one case, the researchers attempted to draw a correlation between the
breakthrough of organic carbon and Al particles. Ultimately no such correlation could be
determined (Brant et al., 2011). Several operational variables and varying treatment techniques
of the treatment plants were considered in the study, but the authors did not consider the surface
of the filtration media itself. In light of the results of this study which demonstrate enhanced Al
capture with increased Mn loading, it would be interesting to study the effect of the measured
MnOx(s) media surface area on the capture of sub-micron particles.
The SEM micrographs shown in Figure 46 and Figure 47 were generated by a previous
researcher. These images of an MnOx(s) surface from a treatment facility in Durham, NC were

83
Figure 46 - Diatom Entrained in MnOx(s) Coating – Durham, NC (Merkle, 1995)
Figure 47 - Diatom Entrained in MnOx(s) Coating – Durham, NC (Merkle, 1995)

84
generated using an ESEM. Here we can observe several diatoms that became entrained into the
MnOx(s) surface.
Comparison of Bench-Scale Experimental Results Against Observed Al:Mn Ratios
Bench-scale experiments in which soluble Al species were applied confirmed that soluble Al
alone was insufficient to account for the molar ratios observed in MnOx(s)-coated media from
treatment facilities. Bench-scale experiments in which both soluble and insoluble Al species
were applied to MnOx(s)-coated media produced MnOx(s) coatings with a molar ratio of Al:Mn
comparable to the treatment facilities. The varied Al:Mn molar ratios of the MnOx(s) coatings
produced in the laboratory study which applied insoluble Al species indicate that the extent of Al
incorporation into the MnOx(s) surface is primarily a function of the Mn loading.
The authors of the 2008 AWWARF study noted the relative consistency in the composition of
the MnOx(s) coating across a number of different facilities, but were unable to identify a reason
for the presence of Al. The relative consistency of the molar ratio of Al:Mn in the coating
suggested the possibility of a functional relationship between the two metals. This does not
appear to be the case. Though the data from the 2008 AWWARF report showed molar ratios
Al:Mn that generally ranged from 1.0 to 2.0, experimental trials successfully produced ratios
well-outside of this range. Data presented in Figure 26 from this new research effort seem to
have succeeded in proving that Al incorporation depends on the concurrent deposition of Mn
onto the MnOx(s) coating. The data show that the column that did not receive an added dosage of
Mn did not accumulate a significant amount of Al.
A supposition about the reason for the relative consistency in the ratios of Al:Mn in MnOx(s)-
coated media can be made based upon a combination of laboratory data and analysis of media
samples taken from treatment facilities conducted by previous researchers. Laboratory data
produced in this study show that under a constant loading of Mn, the molar ratio of Al:Mn in the
coating remains relatively constant. In a real treatment plant this is not necessarily the case.
Loadings of Mn, especially in plants that utilize a reservoir as a source water, are subject to
significant seasonal variability.
In a water treatment plant setting when the loadings of Mn are high, the amount of Mn deposited
onto the surface is high. Laboratory data confirm that when Mn loadings are higher that the
Al:Mn ratio drops as the deposition of Mn outpaces the deposition of Al. During periods of
lower Mn loadings however, the effect is reversed as the deposition of Al outpaces that of Mn. If
these two processes occurred cyclically for years on end, the results would be a heterogeneous
coating. The MnOx(s) coating cross section of coated anthracite coal generated by Merkle et al in
Figure 2 shows a ring pattern of deposition.

85
In effect, this seems to suggest that the relatively consistent ratio of Al:Mn in the coatings of
plants surveyed in the 2008 AWWARF report is more likely a consequence of cyclical loadings
of Mn rather than an indication of a functional relationship between the two elements.
Electron Microscope Analysis of the MnOx(s) Surface
Several analyses of the MnOx(s) surface were conducted using various electron microscopy
techniques. The analyses provided insight into the physical and chemical composition of the
surface. The analyses show that the surface is homogeneous in a macroscopic sense, but is
heterogeneous on the nanoscale. In a qualitative sense, the ESEM images shown in Figure 30
and Figure 31 provide a visual explanation for why the MnOx(s) surface possesses such a high
surface area.
Analysis of the surface using an SEM and EDS shows a strong correlation between the observed
counts of Al and Mn on the MnOx(s) surface. The correlation varied depending on the Mn
loading of the media sample. In Figure 48 it’s clear that the counts of Al are similar to the
counts of Mn. Though the magnitude of the counts varied, an increase in the counts of Mn was
generally accompanied by an increase in the counts of Al. In Figure 49 however, the sample
analyzed experienced a lower loading of Mn. The red line in each of the figures is meant to
show where a perfect 1:1 correlation in the counts of Mn and Al would occur.
Though the ratio of counts for Al and Mn shown here are different, the consistency of the ratio of
counts seems to confirm that the sample is homogeneous on even a very small scale. Only when
applying a much higher magnification during TEM analysis was it possible to see the
heterogeneous nature of the surface.
When the MnOx(s) surface was analyzed using a TEM, the resulting output showed a
heterogeneous mixture of very small Mn oxide crystals (5-10 nanometers) along with amorphous
materials (20-30 nanometers). These materials were presumed to be Al hydroxide species, but
could not be verified using diffraction pattern analyses because they lacked a crystalline
structure. Analysis of the diffraction patterns generated by the TEM showed that the crystalline
structures observed in the TEM image to be Mn oxides.
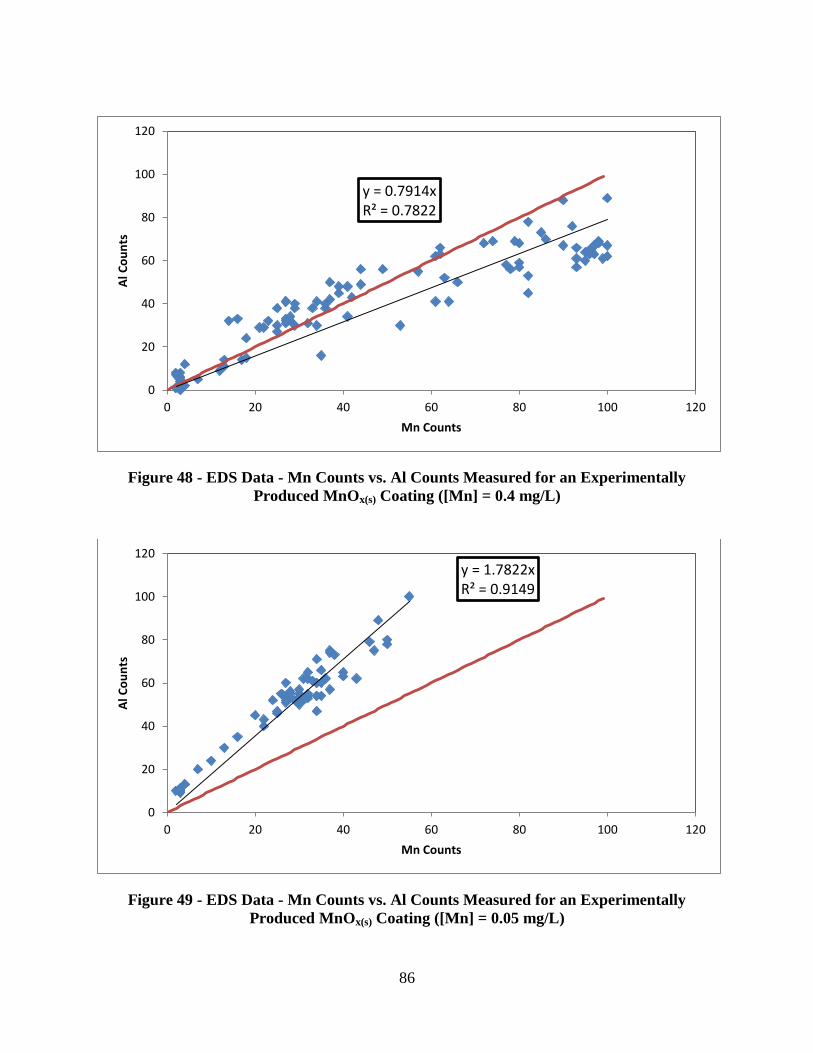
86
Figure 48 - EDS Data - Mn Counts vs. Al Counts Measured for an Experimentally
Produced MnOx(s) Coating ([Mn] = 0.4 mg/L)
Figure 49 - EDS Data - Mn Counts vs. Al Counts Measured for an Experimentally
Produced MnOx(s) Coating ([Mn] = 0.05 mg/L)
y = 0.7914x R² = 0.7822
0
20
40
60
80
100
120
0 20 40 60 80 100 120
Al C
ou
nts
Mn Counts
y = 1.7822x R² = 0.9149
0
20
40
60
80
100
120
0 20 40 60 80 100 120
Al C
ou
nts
Mn Counts

87
CONCLUSIONS
The presence of Al within MnOx(s)-coated water treatment filtration media was analyzed in a
laboratory research study that applied a number of analytical techniques in an effort to
characterize the interaction of Al with the MnOx(s) surface. Small diameter glass columns loaded
with short beds of MnOx(s)-coated media were used to study the interaction of Al and Mn on the
MnOx(s) surface. The media produced in several of the column studies was then subjected to
further analysis by electron microscopy techniques. By combining the work of many previous
researchers with the results of this new research study several important conclusions regarding
the presence of Al within the MnOx(s) surface can be stated:
1. The soluble adsorption of Al species onto the MnOx(s) surface was confirmed
experimentally.
2. The ability of the MnOx(s) surface to take up Mn does not appear to be impacted in any
way by the concurrent adsorptive uptake of Al. This was confirmed by bench-scale
laboratory experiments under a variety of different experimental conditions. The uptake
of Al by the surface does not appear to augment nor hinder the uptake of Mn by the
surface.
3. The Al content of MnOx(s)-coated media observed in water treatment settings cannot be
accounted for by the adsorption of soluble species of Al alone. Thus, the mechanism of
Al incorporation must include the capture of insoluble or particulate species of Al as well
as soluble species.
4. Column experiments applying both soluble Al and insoluble Al(OH)3(s) species
demonstrated that the incorporation of Al into the MnOx(s) surface is highly dependent on
the deposition of Mn. This was observed by comparing two different columns; one
column was given a relatively high dose of Mn while the other received only trace
amounts of Mn. Only the column media that continuously deposited Mn was able to
incorporate a significant amount of Al into the MnOx(s) surface. This demonstrated that
significant Al deposition only occurs with concurrent Mn deposition.
5. Analysis of the MnOx(s) surface using a TEM showed that the surface was composed of a
mixture of both very small Mn oxide crystals (5-10 nanometers) and amorphous materials
(20-30 nanometers) assumed to be Al(OH)3(s).
6. In general, though the continued deposition of Mn does appear to reduce the amount of
Al in the filtration effluent, the amount of Al removed is not enough to make a significant
impact on the finished water Al. The high Mn loadings necessary to make a significant
impact on finished water Al levels would make it completely impractical as a control
strategy.

88
Future Research
It would be interesting to conduct a series of parallel column experiments in which all of the
different columns deposited a similar Mn coating, but each MnOx(s)-coated media sample would
contain a different amount of Al. A comparison of the measured surface area of each of the
various media coatings would effectively demonstrate how much of the media’s surface area
could be attributed to the media’s Al content and how much could be attributed to the oxidized
Mn. This information would undoubtedly lead to important conclusions about the coated
media’s performance for particle capture.
Al may have an impact on the media coating's surface area, but there is also the potential for Al
to play a role in the MnOx(s) surface’s ability to capture charged particles. It has been well
established that the slight negative charge of the MnOx(s) surface gives the surface an affinity for
metal cations, but could the Al contained in the media give that same surface the ability to attract
anionic species?
Research work should be also be conducted on the MnOx(s) surface to determine what effect, if
any, the presence of Al in the MnOx(s) coating may have on the performance of a filtration media
possessing an MnOx(s) coating in the capture of particles. The role of the MnOx(s) surface in the
enhanced capture of particulate and dissolved species has been studied in some detail in this
research effort and in the literature but has generally not been given the consideration and
attention it deserves in practice.
89
Table of Abbreviations
AA Atomic Absorbance
Al Aluminum
AWWARF American Water Works Association Research Foundation
BCVPIWTF Blacksburg, Christiansburg, VPI Water Treatment Facility
CMD Coal Mine Drainage
EDS Energy Dispersive Spectroscopy
EPA Environmental Protection Agency
ESEM Environmental Scanning Electron Microscope/Microscopy
Fe Iron
ICP-MS Inductively Coupled Plasma – Mass Spectrometry
L Liter
MCL Maximum Contaminant Level
mg milligram
Mn Manganese
MnOx(s) Manganese Oxide (General Term for Various Oxide Species)
NCFL Nanoscale Characterization and Fabrication Laboratory
SADP Selected Area Diffraction Pattern
SEM Scanning Electron Microscope/Microscopy
SMCL Secondary Maximum Contaminant Level
TEM Transmission Electron Microscope/Microscopy

90
REFERENCES
AMIRTHARAJAH, A. 1990. Coagulation Processes: Destabilization, Mixing , and Flocculation.
Water Quality and Treatment - Fourth Edition. 4 ed.
AYOTTE, J. D., GRONBERG, J. A. M. & APODACA, L. E. 2011. Trace Elements and Radon
in Groundwater Across the United States. US Geological Survey Scientific Investigations
Report, 115.
BAJPAI, S. 1999. Removal of arsenic from ground water by manganese dioxide-coated sand.
Journal of environmental engineering (New York, N.Y.), 125, 782-784.
BEESTON, B. E. P., HORNE, R. W. & MARKHAM, R. 1972. Electron Diffraction and Optical
Diffraction Techniques. Practical Methods in Electron Microscopy.
BOZZOLA, J. J. & RUSSELL, L. D. 1992. Electron Microscopy Principles and Techniques for
Biologists, Boston, Jones and Bartlett Publishers.
BRANT, J. A., KOYUNCU, H. & VEERAPANENI, S. V. 2011. Occurence and Composition of
Particulates in Filter Process Streams. Journal - American Water Works Association, 103.
BULL, R. J. & CRAUN, G. F. 1977. Health effects associated with manganese in drinking
water. Journal / American Water Works Association, 69, 662-663.
CASALE, R. J., LECHEVALLIER, M. W. & PONTIUS, F. W. 2002. Review of manganese
control and related manganese issues, Denver, CO, AWWA Research Foundation and
American Water Works Association.
CERRATO, J. M., KNOCKE, W. R., HOCHELLA JR, M. F., DIETRICH, A. M., JONES, A. &
CROMER, T. F. 2011. Application of XPS and solution chemistry analyses to investigate
soluble manganese removal by MnOx(s)-coated media. Environmental Science and
Technology, 45, 10068-10074.
COFFEY, B. M., GALLAGHER, D. L. & KNOCKE, W. R. 1993. MODELING SOLUBLE
MANGANESE REMOVAL BY OXIDE-COATED FILTER MEDIA. Journal of
Environmental Engineering-Asce, 119, 679-694.
COOK, D. G., FAHN, S. & BRAIT, K. A. 1974. Chronic Manganese Intoxication. Arch Neurol,
30, 59-64.
COSTELLO, J. J. 1984. Postprecipitation in Distribution Systems. AWWA, 76, 46-49.
DYER, J. A., SCRIVNER, N. C. & DENTEL, S. K. 1998. Practical guide for determining the
solubility of metal hydroxides and oxides in water. Environmental Progress, 17, 1-8.
EPA 1979. National Secondary Drinking Water Regulations. 143.3.
EYRING, A. M., WEINBERG, H. S. & SINGER, P. C. 2002. Measurement and effect of trace
element contaminants in alum. Journal / American Water Works Association, 94, 135-
146.
GANROT, P. O. 1986. Metabolism and Possible Health Effects of Aluminum. Environmental
health perspectives, 65, 363-441.
GOLDSTEIN, J. I., NEWBURY, D. E. & AL., E. 1981. Scanning Electron Microscopy and X-
Ray Microanalysis, New York, Plenum.
GOODHEW, P. J. 1972. Specimen Preparation in Materials Science. Practical Methods in
Electron Microscopy.
GRAVES, A. B., WHITE, E., KOEPSELL, T. D., REIFLER, B. V., VAN BELLE, G. &
LARSON, E. B. 1990. The association between aluminum-containing products and
Alzheimer's disease. Journal of Clinical Epidemiology, 43, 35-44.

91
GRAY, M. J. 1981. Manganese dioxide as an adsorbant for heavy metals. Effluent & Water
Treatment Journal, 21, 201-202.
HAAS, C. N. 1999. Ch. 14 Disinfection. Water Quality and Treatment - A Handbook of
Community Water Supplies. 5th ed.
HOCHELLA, M. F., KASAMA, T., PUTNIS, A., PUTNIS, C. V. & MOORE, J. N.
Environmentally important, poorly crystalline Fe/Mn hydrous oxides: Ferrihydrite and a
possibly new vernadite-like mineral from the Clark Fork River Superfund Complex.
American Mineralogist, 90, 718-724.
ISLAM, A. A., GOODWILL, J. E., BOUCHARD, R., TOBIASON, J. E. & KNOCKE, W. R.
2010. Characterization of filter media MnOX(S) surfaces and Mnremoval capability.
Journal / American Water Works Association, 102, 71-83.
JUNTA, J. & HOCHELLA, M. F. 1994. MANGANESE(II) OXIDATION AT MINERAL
SURFACES - A MICROSCOPIC AND SPECTROSCOPIC STUDY. Geochimica et
Cosmochimica Acta, 58, 4985-4999.
KNOCKE, W. 1990. Removal of Soluble Manganese from Water by Oxide-Coated Filter Media,
Denver, CO.
KNOCKE, W. R. 1991. Removal of soluble manganese by oxide-coated filter media: sorption
rate and removal mechanism issues. Journal - American Water Works Association, 83,
64.
KNOCKE, W. R., HAMON, J. R. & THOMPSON, C. P. 1988. Soluble manganese removal on
oxide-coated filter media. Journal / American Water Works Association, 80, 65-70.
KNOCKE, W. R., HOEHN, R. C. & SINSABAUGH, R. L. 1987. Using alternative oxidants to
remove dissolved manganese from water laden with organics. Journal / American Water
Works Association, 79, 75-79.
KNOCKE, W. R., OCCIANO, S. C. & HUNGATE, R. 1991a. Removal of soluble manganese
by oxide-coated filter media. Sorption rate and removal mechanism issues. Journal /
American Water Works Association, 83, 64-69.
KNOCKE, W. R., VAN BENSCHOTEN, J. E., KEARNEY, M. J., SOBORSKI, A. W. &
RECKHOW, D. A. 1991b. Kinetics of manganese and iron oxidation by potassium
permanganate and chlorine dioxide. Journal / American Water Works Association, 83,
80-87.
KNOCKE, W. R., ZURAVNSKY, L., LITTLE, J. C. & TOBIASON, J. E. 2010. Adsorptive
contactors for removal of soluble manganese during drinking water treatment. Journal /
American Water Works Association, 102, 64-75.
KOTHARI, N. 1988. Groundwater, iron and manganese an unwelcome trio. Journal Name:
Water Engineering and Management; (USA); Journal Volume: 135:2, Medium: X; Size:
Pages: 25-26.
LAI, X., ZHENG, Y., IPSEN, H., JACOBSEN, S., LARSEN, J. N., LØWENSTEIN, H. &
SØNDERGAARD, I. 2007. Particle Size Determination in Aluminum Hydroxide
Suspensions Using Near-Infrared Transmittance Spectroscopy. Appl. Spectrosc., 61,
1184-1190.
LISHA, K. P., MALIYEKKAL, S. M. & PRADEEP, T. 2010. Manganese dioxide nanowhiskers:
A potential adsorbent for the removal of Hg(II) from water. Chemical Engineering
Journal, 160, 432-439.
LIU, X. 2005. Water Manganese Exposure and Children’s Intellectual Function in Araihazar,
Bangladesh. Environmental health perspectives, 114, 124.

92
LJUNG, K. & VAHTER, M. 2007. Time to re-evaluate the guideline value for manganese in
drinking water? Environmental health perspectives, 115, 1533-8.
LÖNNERDAL, B., KEEN CARL, L., BELL, J. G. & SANDSTRÖM, B. 1987. Manganese
Uptake and Retention. Nutritional Bioavailability of Manganese. American Chemical
Society.
MENEZES-FILHO, J. A., NOVAES, C. D. O., MOREIRA, J. C., SARCINELLI, P. N. &
MERGLER, D. 2011. Elevated manganese and cognitive performance in school-aged
children and their mothers. Environmental Research, 111, 156-163.
MERKLE, P. B. 1996. Characterizing filter media mineral coatings. Journal - American Water
Works Association, 88, 62.
MERKLE, P. B., KNOCKE, W. R. & GALLAGHER, D. L. 1997. Method for coating filter
media with synthetic manganese oxide. Journal of Environmental Engineering-Asce, 123,
642-649.
MORGAN, J. J. & STUMM, W. 1964. Colloid-chemical properties of manganese dioxide.
Journal of Colloid Science, 19, 347-359.
O'REILLY, S. E. & HOCHELLA, M. F. 2003. Lead sorption efficiencies of natural and
synthetic Mn and Fe-oxides. Geochimica et Cosmochimica Acta, 67, 4471-4487.
PENG, C.-Y., KORSHIN, G. V., VALENTINE, R. L., HILL, A. S., FRIEDMAN, M. J. &
REIBER, S. H. 2010. Characterization of elemental and structural composition of
corrosion scales and deposits formed in drinking water distribution systems. Water
Research, 44, 4570-4580.
PHILIP C. SINGER, D. A. R. 2011. Water Quality & Treatment, McGraw Hill.
REIBER, S. H. & KUKULL, W. A. 1996. Aluminum, drinking water, and Alzheimer's disease,
AWWAResearch Foundation.
ROSCOE, J. 2002. Simple Solutions To Manganese Problems. 65th Annual Water Industry
Engineers and Operators Conference.
SEYAMA, H., TANI, Y., MIYATA, N., SOMA, M. & IWAHORI, K. 2008. Characterization of
pebble surfaces coated with biogenic manganese oxides by SIMS, XPS and SEM.
Applied Surface Science, 255, 1509-1511.
SINGER, P. C. & RECKHOW, D. A. 1999. Ch. 12 Chemical Oxidation. Water Quality and
Treatment - A Handbook of Community Water Supplies. 5th ed.
SLY, L. I., HODGKINSON, M. C. & ARUNPAIROJANA, V. 1990. Deposition of manganese
in a drinking water distribution system. Appl. Environ. Microbiol., 56, 628-639.
SMITH, R. W. 1996. Kinetic aspects of aqueous aluminum chemistry: environmental
implications. Coordination Chemistry Reviews, 149, 81-93.
SRINIVASAN, P. T., VIRARAGHAVAN, T. & SUBRAMANIAN, K. S. 1999. Aluminium in
drinking water: An overview. Water SA, 25, 47-55.
STUMM, W. & MORGAN, J. J. 1996. Aquatic Chemistry, 3rd ed., by W. Stumm and J. J.
Morgan. Geochimica et Cosmochimica Acta, 60, 5158-5158.
TAN, H., ZHANG, G., HEANEY, P. J., WEBB, S. M. & BURGOS, W. D. 2010.
Characterization of manganese oxide precipitates from Appalachian coal mine drainage
treatment systems. Applied Geochemistry, 25, 389-399.
TOBIASON, J. E., FOUNDATION, A. R. & UNITED STATES. ENVIRONMENTAL
PROTECTION, A. 2008. Characterization and performance of filter media for
manganese control, Denver, Colo.; [London], Awwa Research Foundation : distributed
by American Water Works Association ; distributed by IWA Publishing.

93
VANBENSCHOTEN, J. E. & EDZWALD, J. K. 1990. CHEMICAL ASPECTS OF
COAGULATION USING ALUMINUM SALTS .1. HYDROLYTIC REACTIONS OF
ALUM AND POLYALUMINUM CHLORIDE. Water Research, 24, 1519-1526.
VON GUNTEN, H. R., KARAMETAXAS, G., KRÄHENBÜHL, U., KUSLYS, M.,
GIOVANOLI, R., HOEHN, E. & KEIL, R. 1991. Seasonal biogeochemical cycles in
riverborne groundwater. Geochimica et Cosmochimica Acta, 55, 3597-3609.
W.H.O. 2011. Manganese in Drinking Water. Geneva, Switzerland.
WILCZAK, A., KNOCKE, W. R., HUBEL, R. E. & AIETA, E. M. 1993. Manganese control
during ozonation of water containing organic compounds. Journal / American Water
Works Association, 85, 98-104.
WILLIAMS, D. B. & CARTER, C. B. 2009. The Transmission Electron Microscope
Transmission Electron Microscopy. Springer US.
WONG, J. M. 1984. Chlorination-filtration for iron and manganese removal. Journal - American
Water Works Association, 76, 76.

94
APPENDIX
APPENDIX FIGURES
Appendix A – Soluble Al Study
Figure-A-1 Uptake of Mn onto Blacksburg Media in the Presence of Free Chlorine (pH 7.2,
HLR = 4.0 gpm/ft2, 1.0 mg/L HOCl) ........................................................................... 96
Figure-A-2 Uptake of Al onto Blacksburg Media in the Presence of Free Chlorine (pH 7.2,
HLR = 4.0 gpm/ft2, 1.0 mg/L HOCl) ........................................................................... 96
Figure-A-3 Adsorptive Uptake of Mn by MnOx(s)-Coated and Uncoated Media (pH 6.3,
HLR = 4.0 gpm/ft2, 0.0 mg/L HOCl) ........................................................................... 97
Figure-A-4 Adsorptive Uptake of Al by MnOx(s)-Coated and Uncoated Media (pH 6.3, HLR
= 4.0 gpm/ft2, 0.0 mg/L HOCl) .................................................................................... 97
Figure-A-6 ESEM Image of MnOx(s) Coating Pieces Removed From Sand Media Surface ........ 98
Appendix B - ESEM Images
Figure-A-7 EDS Map of Cleaved Sand Media (Feed Water [Mn] = 0.4 mg/L) .......................... 99
Appendix C - ESEM EDS Mapping
Figure-A-8 EDS Map of Cleaved Sand Media 2 (Feed Water [Mn] = 0.4 mg/L) ..................... 100
Figure-A-9 ESEM Image of MnOx(s)-Coated Media Sample In Resin - Showing Location of
EDS Line Scan (Feed Water [Mn] = 0.4 mg/L) ........................................................ 101
Figure-A-10 EDS Analysis Showing Counts and Calculated Mass Percentages for Mn, Al,
Si - Scan Shown in Figure-A-9 .................................................................................. 102
Appendix D - EDS Line Scans
Figure-A-11 ESEM Image of MnOx(s)-Coated Media Sample In Resin - Showing Location
of EDS Line Scan 2 (Feed Water [Mn] = 0.4 mg/L) ................................................ 103
Figure-A-12 EDS Analysis Showing Counts and Calculated Mass Percentages for Mn, Al,
Si - Scan Shown in Figure-A-11 ................................................................................ 104

95
Figure-A-13 ESEM Image of MnOx(s)-Coated Media Sample in Resin - Showing Location of
EDS Line Scan 3 (Feed Water [Mn] = 0.4 mg/L) ..................................................... 105
Figure-A-14 EDS Analysis Showing Counts for Scan Shown in Figure-A-13 .......................... 106
Figure-A-15 ESEM Image of MnOx(s)-Coated Media Sample - Showing Location of EDS
Line Scan (Feed Water [Mn] = 0.2 mg/L) ................................................................ 107
Figure-A-16 EDS Analysis Showing Counts and Calculated Mass Percentages for Mn, Al -
Scan Shown in Figure-A-15 ....................................................................................... 108
Appendix E - TEM Images
Figure-A-17 TEM Image of Pulverized Piece of MnOx(s) Coating (Scaled as Shown) .............. 109
Figure-A-18 TEM Image of Pulverized Piece of MnOx(s) Coating 2 (Scaled as Shown) ........... 110
Appendix F - TEM Diffraction Patterns
Figure-A-19 Diffraction Pattern of Sample Shown In Figure-A-17 (Feed Water [Mn] = 0.4
mg/L, 200-220 ppb Al) .............................................................................................. 111
Figure-A-20 Diffraction Pattern of Sample Shown in Figure-A-18 (Feed Water [Mn] = 0.4
mg/L, 200-220 ppb Al) .............................................................................................. 112
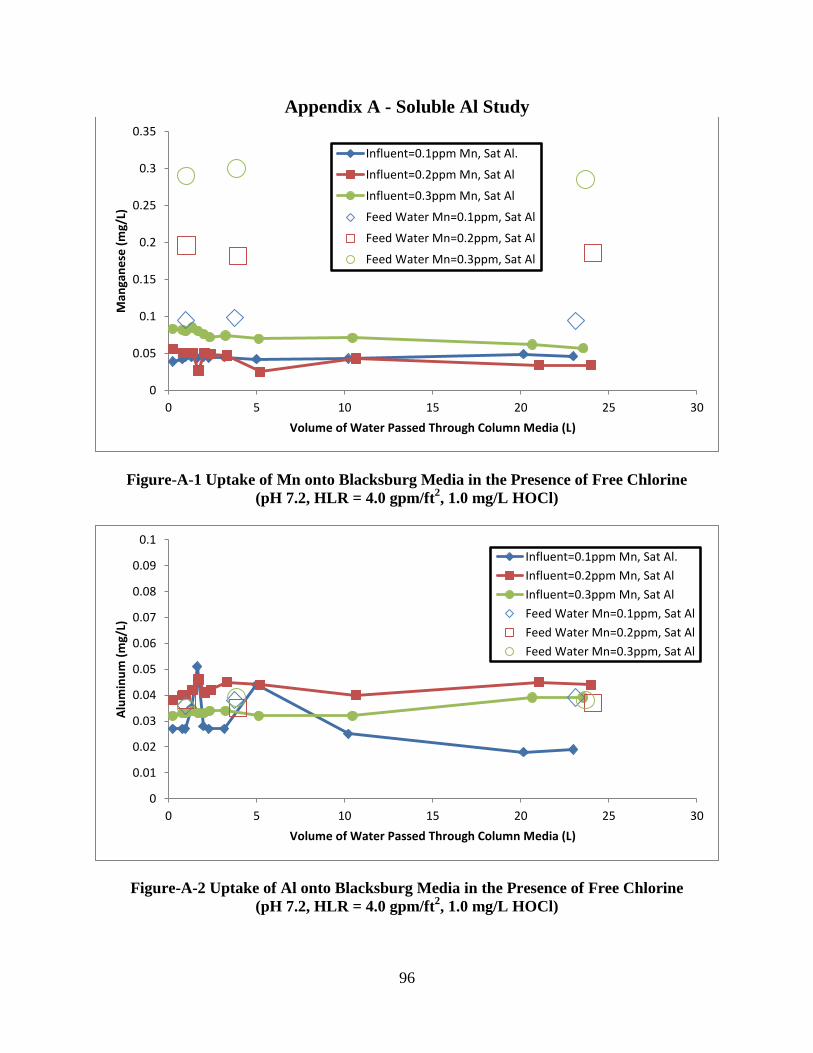
96
Appendix A - Soluble Al Study
Figure-A-1 Uptake of Mn onto Blacksburg Media in the Presence of Free Chlorine
(pH 7.2, HLR = 4.0 gpm/ft2, 1.0 mg/L HOCl)
Figure-A-2 Uptake of Al onto Blacksburg Media in the Presence of Free Chlorine
(pH 7.2, HLR = 4.0 gpm/ft2, 1.0 mg/L HOCl)
0
0.05
0.1
0.15
0.2
0.25
0.3
0.35
0 5 10 15 20 25 30
Man
gan
ese
(m
g/L)
Volume of Water Passed Through Column Media (L)
Influent=0.1ppm Mn, Sat Al.
Influent=0.2ppm Mn, Sat Al
Influent=0.3ppm Mn, Sat Al
Feed Water Mn=0.1ppm, Sat Al
Feed Water Mn=0.2ppm, Sat Al
Feed Water Mn=0.3ppm, Sat Al
0
0.01
0.02
0.03
0.04
0.05
0.06
0.07
0.08
0.09
0.1
0 5 10 15 20 25 30
Alu
min
um
(m
g/L)
Volume of Water Passed Through Column Media (L)
Influent=0.1ppm Mn, Sat Al.
Influent=0.2ppm Mn, Sat Al
Influent=0.3ppm Mn, Sat Al
Feed Water Mn=0.1ppm, Sat Al
Feed Water Mn=0.2ppm, Sat Al
Feed Water Mn=0.3ppm, Sat Al

97
Figure-A-3 Adsorptive Uptake of Mn by MnOx(s)-Coated and Uncoated Media
(pH 6.3, HLR = 4.0 gpm/ft2, 0.0 mg/L HOCl)
Figure-A-4 Adsorptive Uptake of Al by MnOx(s)-Coated and Uncoated Media
(pH 6.3, HLR = 4.0 gpm/ft2, 0.0 mg/L HOCl)
0
0.02
0.04
0.06
0.08
0.1
0.12
0 10 20 30 40 50 60
Man
gan
ese
(m
g/L)
Volume Passed Through Column (L)
Lee Hall Media (Uncoated) - Inf Mn = 0.1ppm, Sat Al
Blacksburg Media (Coated)- Inf Mn = 0.1ppm, Sat Al
Feed Water - Lee Hall Media - Inf Mn = 0.1ppm, Sat Al
Feed Water - Blacksburg Media - Inf Mn = 0.1ppm, Sat Al
0
0.005
0.01
0.015
0.02
0.025
0 10 20 30 40 50 60
Alu
min
um
(m
g/L)
Volume Passed Through Column (L)
Lee Hall Media (Uncoated) - Inf Mn = 0.1ppm, Sat Al
Blacksburg Media (Coated)- Inf Mn = 0.1ppm, Sat Al
Feed Water - Lee Hall Media - Inf Mn = 0.1ppm, Sat Al
Feed Water - Blacksburg Media - Inf Mn = 0.1ppm, Sat Al

98
Appendix B - ESEM Images
Figure-A-5 ESEM Image of MnOx(s) Coating Pieces Removed From Sand Media Surface

99
Appendix C - ESEM EDS Mapping
Figure-A-6 EDS Map of Cleaved Sand Media
(Feed Water [Mn] = 0.4 mg/L)

100
Figure-A-7 EDS Map of Cleaved Sand Media 2
(Feed Water [Mn] = 0.4 mg/L)

101
Appendix D - EDS Line Scans
Figure-A-8 ESEM Image of MnOx(s)-Coated Media Sample In Resin - Showing Location of
EDS Line Scan
(Feed Water [Mn] = 0.4 mg/L)
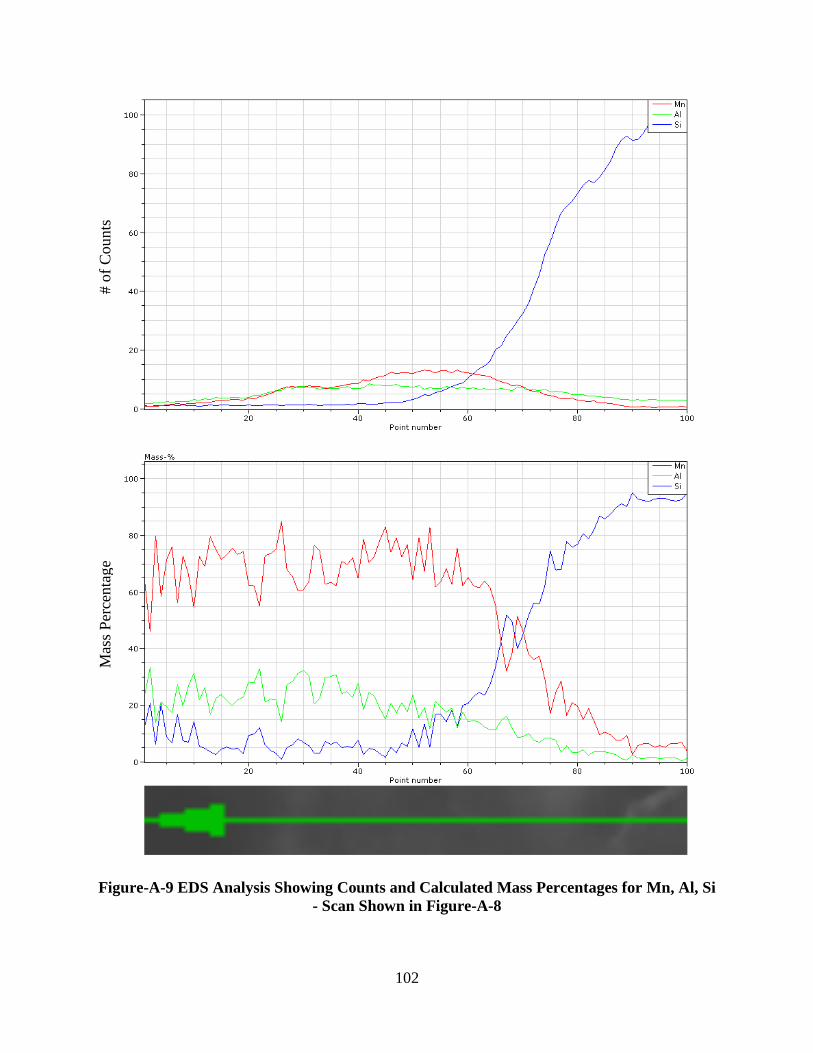
102
Figure-A-9 EDS Analysis Showing Counts and Calculated Mass Percentages for Mn, Al, Si
- Scan Shown in Figure-A-8
# o
f C
ounts
M
ass
Per
centa
ge

103
Figure-A-10 ESEM Image of MnOx(s)-Coated Media Sample In Resin - Showing Location
of EDS Line Scan 2
(Feed Water [Mn] = 0.4 mg/L)
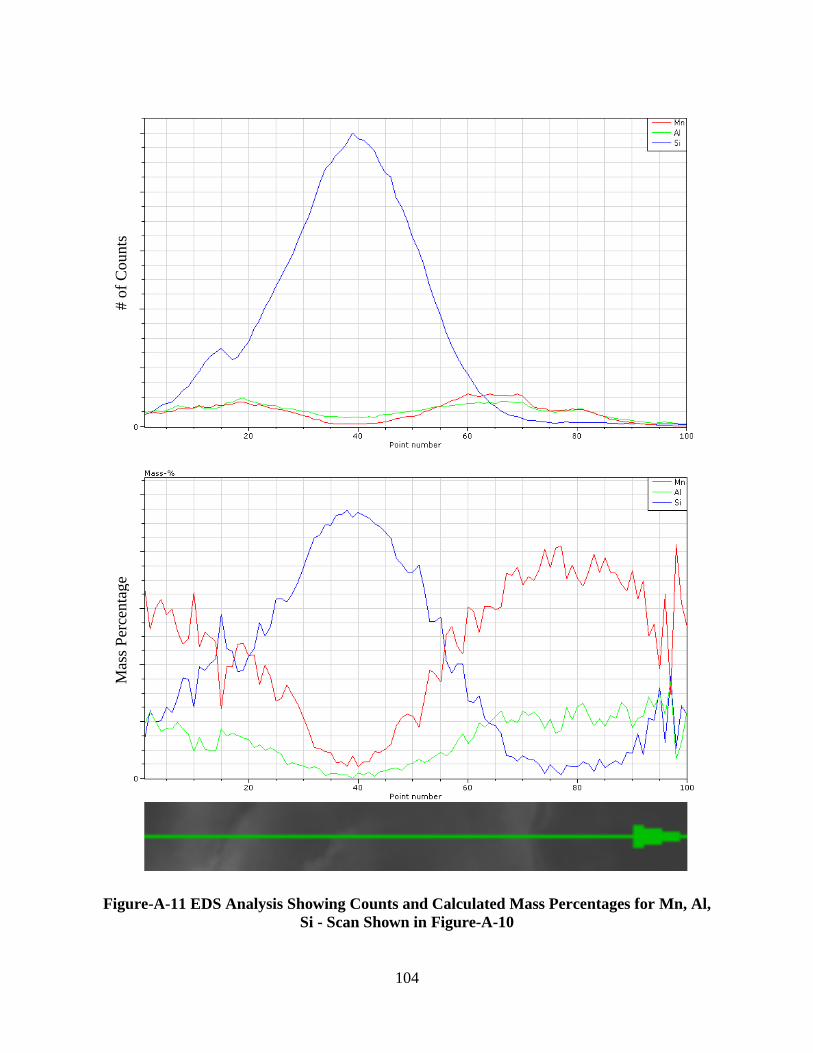
104
Figure-A-11 EDS Analysis Showing Counts and Calculated Mass Percentages for Mn, Al,
Si - Scan Shown in Figure-A-10
# o
f C
ounts
M
ass
Per
centa
ge

105
Figure-A-12 ESEM Image of MnOx(s)-Coated Media Sample in Resin - Showing Location of
EDS Line Scan 3
(Feed Water [Mn] = 0.4 mg/L)

106
Figure-A-13 EDS Analysis Showing Counts for Scan Shown in Figure-A-12
# o
f C
ounts

107
Figure-A-14 ESEM Image of MnOx(s)-Coated Media Sample - Showing Location of EDS
Line Scan
(Feed Water [Mn] = 0.2 mg/L)

108
Figure-A-15 EDS Analysis Showing Counts and Calculated Mass Percentages for Mn, Al -
Scan Shown in Figure-A-14
# o
f C
ounts
M
ass
Per
centa
ge

109
Appendix E- TEM Images
Figure-A-16 TEM Image of Pulverized Piece of MnOx(s) Coating (Scaled as Shown)

110
Figure-A-17 TEM Image of Pulverized Piece of MnOx(s) Coating 2 (Scaled as Shown)

111
Appendix F - TEM Diffraction Patterns
Figure-A-18 Diffraction Pattern of Sample Shown In Figure-A-16
(Feed Water [Mn] = 0.4 mg/L, 200-220 ppb Al)
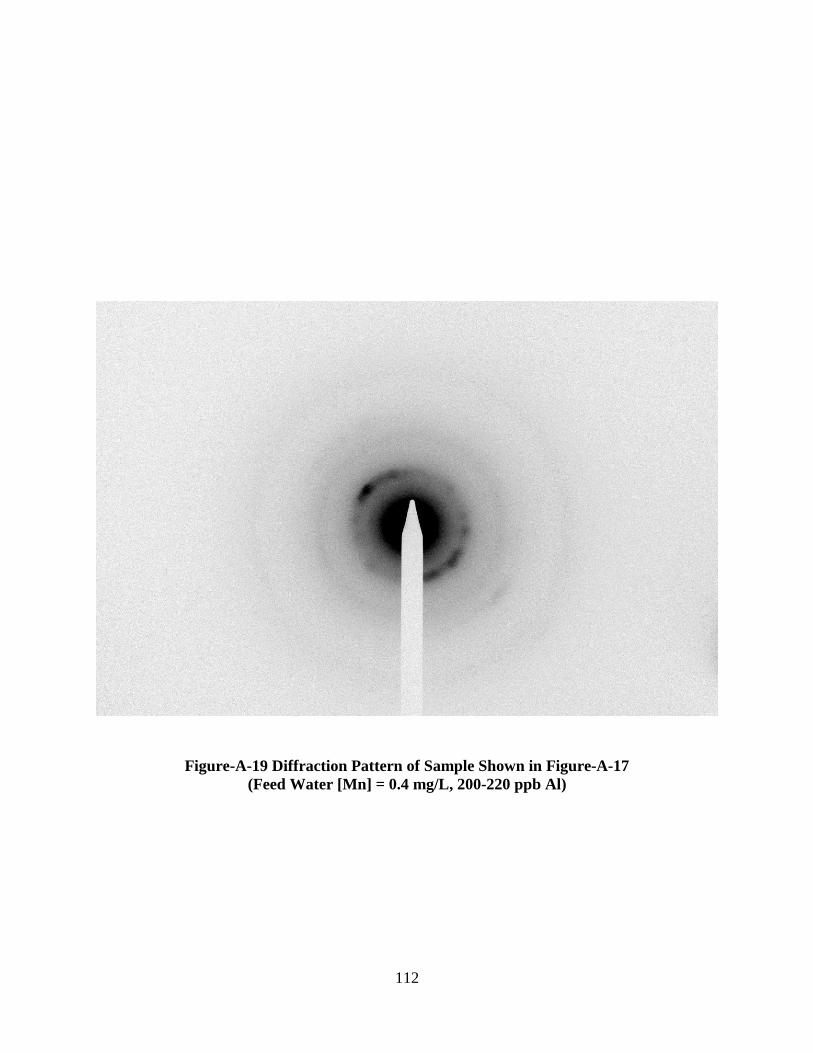
112
Figure-A-19 Diffraction Pattern of Sample Shown in Figure-A-17
(Feed Water [Mn] = 0.4 mg/L, 200-220 ppb Al)