Embed Size (px)
Citation preview
Journal of Agricultural and Resource Economics 24(1):266-280Copyright 1999 Western Agricultural Economics Association
The Role of Agriculture in Oregon'sEconomic Base: Findings from a
Social Accounting Matrix
Edward C. Waters, Bruce A. Weber,and David W. Holland
Most studies of a state's economic base count as "basic" only the "traditional" exports
of goods, federal spending, and business investment. "Nontraditional" elements ofthe economic base (including exports of services, federal transfers to state/local gov-
ernments and households, and extraregional property income) are typically ignored.We construct a social accounting matrix (SAM) for Oregon and estimate Oregon'seconomic base accounting for both traditional and nontraditional elements. Almost
20% of Oregon's jobs depend on extraregional income to households (includinggovernment transfers and outside property income), 11% depend on lumber and wood
and paper products, and 8% depend on agriculture.
Key words: agriculture, economic base, employment dependency, export base,IMPLAN, social accounting matrix
Introduction
People have an enduring interest in understanding the importance of their work in thelarger scheme of things. This fascination seems to be especially pronounced among thoseworking in industries whose economic contributions are increasing or decreasing andwhose "rank" is being challenged. The flurry of recent studies on the importance of high-technology industries is one example of this one phenomenon (Charney and Leones; Beyersand Lindahl). Natural resource industries also have shown a particularly strong interestin understanding their contributions to the larger economy. Leones, Schluter, and
Goldman identified 27 state-level studies completed between 1987 and 1994 that
examined the role of agriculture in their state economies, not counting studies focusing
on subsectors within agriculture.The conceptual underpinning of these studies is economic base theory-the notion
that what drives the regional ecoonomy is "basic" economic activity. The economic or
"export" base is defined as activity that creates an inflow of money from outside the
region, usually in return for goods or services sold to buyers outside the region. Export
dollars received by basic activities are assumed to purchase productive inputs of goods
Waters is an economist with the Oregon Legislative Revenue Office, and courtesy assistant professor in the Department ofAgricultural and Resource Economics, Oregon State University; Weber is a professor in the Department of Agricultural andResource Economics, Oregon State University; and Holland is a professor in the Department of Agricultural Economics,Washington State University.
Financial support for this research was provided by the Oregon Agricultural Experiment Station Project 814, and by theAgricultural Research Foundation, Corvallis, Oregon. This is Oregon Agricultural Experiment Station Technical Paper No.11492. The authors are grateful for the thoughtful comments of Stephen Cooke, University of Idaho.
The Role of Agriculture in Oregon's Economic Base 267
and services, including labor and capital. The degree to which regional producers andhouseholds supply these goods and services determines the amount of nonbasic activitygenerated. It is assumed that nonbasic activity is induced, and therefore could not existwithout basic activity. In this sense, then, the entire regional economy is "dependent"on the export base. There is an extensive and contentious literature on economic basetheory dating back to the 1950s (Andrews 1954a, 1954b, 1955, 1956; Archibald; Crosson;Farness; Greenhut; Isserman; Leven; Merrifield; Romanoff; Tiebout). A more recentassessment of the history and significance of the economic base literature is providedby Krikelas. The formal identity of multipliers derived from the economic base modeland the input-output model was established in 1969 (Billings).
Many studies examining the role of a given sector in the economy (or the dependenceof the economy on a given sector) use input-output (I-O) models. About half of thosestudies identified by Leones, Schluter, and Goldman used input-output models. Thesemodels provide a consistent accounting framework that allows tracing the impact ofchanges in final demand for agricultural products through the various nonagriculturalsectors of the economy. Input-output models have been criticized both on conceptualgrounds and because of methodological problems in model construction. Conceptualcriticisms point to the static nature, fixed-price production technology, and "perfectlyelastic supply of factors" assumptions. Methodological critiques emphasize the short-comings of techniques to estimate the trade flows and production relationships in themodels.
These criticisms have merit and, in some cases, undoubtedly produce some inaccuracyin the estimates of the contribution of any given sector to a region's economic base.However, we believe that a more significant flaw in the I-O estimation of the contri-bution of a sector to a state's economy lies in the inability of I-O models to account forthe growing importance of federal transfer payments to households and extraregionalproperty income to a state's economic base. Given their exogenous nature, these sourcesshould be included properly in any estimate of the regional economic base. The logic is
that these flows indirectly contribute to the demand for nonbasic goods and services inmuch the same way that commodity exports do. While the theoretical importance ofthese elements of the economic base has been recognized for some time (Farness),empirical work has failed to incorporate the theory.1
In this analysis, we use a social accounting matrix (SAM)2 to estimate the "economicbase" of the state of Oregon and to show the contribution of agriculture in a context thatincludes "nontraditional" components of the economic base. In the next section of thearticle, we describe the 1993 Oregon SAM and discuss how it is used to construct our"employment dependency indices" measures of the relative contribution of eachcomponent of the economic base. This is followed by a presentation of our findings aboutthe economic base of Oregon. The study concludes with a discussion of the policy impli-cations of this view of Oregon's economy.
1Farness identified several components of what he calls the "nontraditional" economic base: (a) production for independentnonresident visitors, and (b) production for residents who finance their purchases with independent, extraregional sourcesof legal and illegal income.
2A social accounting matrix is a table showing industry sales to and purchases from other industries in a region along withtransactions involving the income and expenditures of regional households and government. The industry-commodity portionof a SAM is derived from industry-commodity input-output accounts.
Waters, Weber, and Holland
Journal ofAgricultural and Resource Economics
The 1993 Oregon SAM andEmployment Dependency Indices
A set of input-output accounts for the Oregon economy was constructed using IMPLAN 3
(Alward et al.). Sectors of interest such as livestock, crops, nurseries, logging, wood andpaper products, and high-tech manufacturing were maintained as separate sectors. TheIMPLAN accounts were augmented and verified using data from other sources [the U.S.Department of Commerce/Bureau of Economic Analysis (BEA), and the State of OregonEmployment Department] to produce an Oregon regional SAM that is consistent withthe BEA Regional Economic Information System (REIS) data and State of Oregongovernment accounts (refer to appendix table Al). Special attention was given to therevenue and expenditure accounts for state and local governments to bring them intoagreement with estimates from the State of Oregon Legislative Revenue Office. Specialattention was also given to estimation of the agricultural production sectors (livestock,crops, and nurseries). Data on farm sales from the Economic Information Office atOregon State University, Department of Agricultural and Resource Economics, providedthe base for output estimates for these sectors.
The 1993 Oregon SAM includes 34 aggregate industry categories, three factor types,three household income classifications, 4 two state and local government accounts, andseveral categories of exogenous demand and income including the following: domesticexports, foreign exports, business investment expenditures, federal government expendi-tures on regional goods and services, federal transfers to households, other propertyincome payments, federal grants to state and local government, and "outside" revenuesof state and local government.
The IMPLAN-based input-output accounts were used to calculate the proportionof total exports (foreign and domestic) of regionally produced goods and servicesaccounted for by livestock, crops, nurseries, logging, wood and paper products, and otherindustries-which are the traditional elements of the regional economic base.
Model Closure-The Missing Links
A major problem with the input-output accounts is that they do not trace either placeof work factor payments or indirect business taxes to their respective place of residencehousehold and government institutional accounts. As a result, it is impossible to closean input-output model based on such accounts by treating either household spendingor government spending as endogenous variables. A number of alternative "closures"have emerged to simulate the missing linkage (Robison and Miller; Romanoff). IMPLANuses a population-driven Type III closure that simulates the population/householdincome/consumption relationship. Other economists have approximated an economicbase closure by assuming that the sum of household consumption, private investment,and government spending was a function of regional value-added. In such a model,the value-added row is included with the industry rows, and a column is added to the
3 IMPLAN (Alward et al.) is an economic modeling system and continuously updated regional database. Using IMPLAN,it is possible to construct an internally consistent set of current economic flow accounts for any region (defined as an aggre-gation of counties) in the U.S.
4 Refer to appendix table A2 for a description of the distribution of Oregon households by income category.
268 July 1999
The Role ofAgriculture in Oregon's Economic Base 269
industry columns representing the sum of household consumption, state and localgovernment spending, and private investment. Such an approach fails to account forregional leakage of savings, taxes, and profits, and overstates regional consumption andgovernment effects.
The SAM accounts help trace factor payments and tax payments by place of work toinstitutional spending accounts by place of residence. From the Oregon SAM accounts,an "economic base" SAM model was constructed. The SAM model was "closed" bytreating expenditures by regional households, state and local government, andresidential investment as endogenous. Household income is assumed to drive householdconsumption. State and local government revenues are assumed to drive state and localgovernment expenditures.
In industries where proprietors' income is a relatively large component of value-added, we assumed that "other property income" accrues to households in the region. Inother words, if the capital stock in a given industry seems likely to be owned by Oregonresidents (as evidenced by a large proportion of proprietors' earnings), then that entiresector's other property income, net of depreciation allowances and retained earnings,was allocated to Oregon households. This is in contrast to an IMPLAN Type II input-output model closure where only returns to labor and proprietors are consideredendogenous.
Although some economists would quarrel with these assumptions, perhaps a moredebatable issue involves the model's treatment of investment. In order to achieve an eco-nomic base closure, we have incorporated that portion of private investment most likelyto be influenced by regional economic flows: residential construction. In the Oregon eco-nomic base SAM model, residential construction is assumed to be driven by householdsaving, which is in turn an endogenous function of household income and expenditure.5
Exogenous Demand: Traditional andNontraditional Economic Base
Spending by the federal government and by firms for business investment is assumedto be determined largely outside the state and was treated as exogenous. In contrast tostate and local taxes, revenue derived from federal grants and financial and naturalcapital (rents, royalties, and interest received from public trusts and investments) wastreated as exogenous income to state and local government. These "nontraditional"revenues tend to be ignored in standard economic base analysis. However, they supportimportant components of state and local government demand, including public employeeretirement pensions, public assistance payments, and economic development andnatural resource management initiatives.
Essentially the same treatment was accorded the nonemployment income of house-holds. Such income consists of federal government transfers and that portion of property
5 Other approaches to an economic base type model (Robison) also close the model with a portion of investment treated asendogenous, but they are ambiguous regardingjust what portion. Although we have included residential construction, invest-ment in the form of commercial and retail buildings is arguably largely endogenous. The problem comes in identifying thistype of investment in the input-output accounts. IMPLAN identifies commercial and industrial construction (IMPLAN sector49), but does not distinguish commercial construction from industrial construction. Since industrial construction is, in ourview, not endogenously determined, we left the entire account as exogenous. The impact of the feedback effect from invest-ment in our model is likely conservative.
Waters, Weber, and Holland
Journal of Agricultural and Resource Economics
income (interest, dividends, and rent) originating outside the region. Exogenous income
payments to households, largely ignored in standard economic base analysis, have
emerged as a major component of personal income. This is especially true in Oregon
since it has become an important retirement destination.The following accounts were treated as exogenous: total exports of goods and services,
federal government expenditures, federal transfers to households, business investment,
exogenous household income, federal transfers to state and local government, and
"other" revenues of state and local government. The sum of these components gives the
total exogenous "demand" or economic base for goods and services produced in Oregon.
In the IMPLAN accounts, the value of trade and transportation margins is shown in
the various trade and transportation sectors. Thus, these margins are not included in
the export value of the various sectors that produce for export, even though the
purchaser's price includes the margin. While this accounting practice accurately
captures the value that these sectors individually add to the regional economy, it does
not recognize the extent to which trade and transportation sectors are dependent on the
various exporting sectors, and thus understates the contribution of the exporting sectors
to the regional economy. We attempted to correct this by adding a trade and transpor-
tation margin (from the IMPLAN accounts for each sector) to the total value of exports
in the various goods exporting sectors.6
Employment Dependency Indices
The Oregon economic base SAM model, constructed using the aforementioned specifi-
cation, was used to estimate the total (direct, indirect, and induced) output and employ-
ment generated by the exogenous sources of demand. Total employment attributable to
economic activity generated in supplying each industry's final demand was expressed
as a percentage of total state employment. These "employment dependency indices" are
economically sound (defensible on theoretical and empirical grounds) and represent
what we believe to be the best estimate of the contribution of any given industry or
exogenous payment to total employment in Oregon.
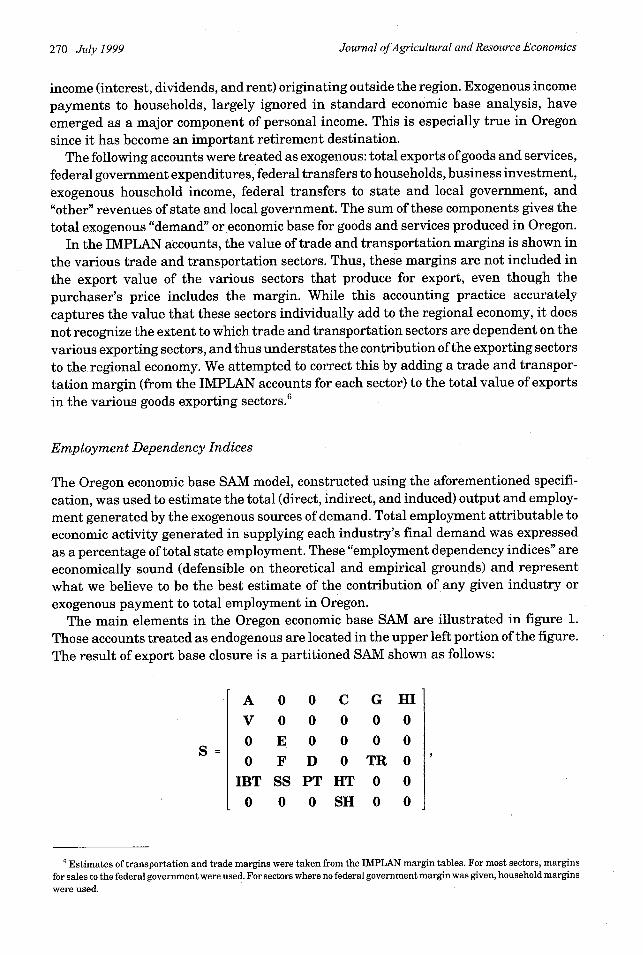
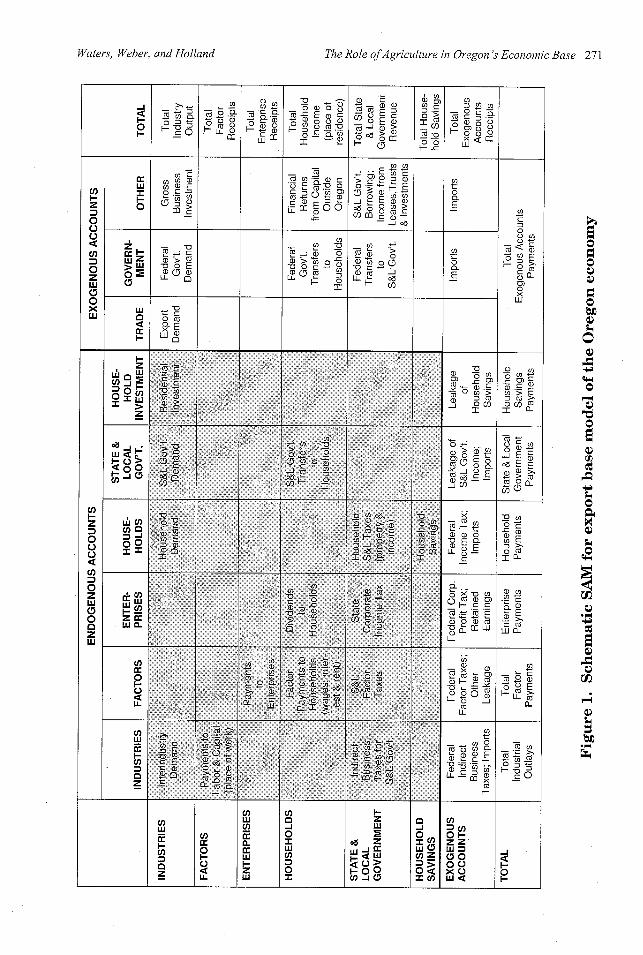
The main elements in the Oregon economic base SAM are illustrated in figure 1.
Those accounts treated as endogenous are located in the upper left portion of the figure.
The result of export base closure is a partitioned SAM shown as follows:
A 0 0 C G HI
V O O0 0
0 E 0 0 0
0 F D0 TR 0
IBT SS PT HT0 0
0 0 0 SH 0 0
6 Estimates of transportation and trade margins were taken from the IMPLAN margin tables. For most sectors, marginsfor sales to the federal government were used. For sectors where no federal government margin was given, household marginswere used.
270 July 1999
s = 9
Waters, Weber, and Holland
-J
0
z
0
0
0
0xw
cn)
z
00
0z
zw
W
-L0
1
wZ_>
U
0
0I-
U) 0C
0 4-~O -I a)coC:
_0, > C
r O Ea) (D a)H s)
I"
o CZQ EU a)
r)
U)
t0 .2, o.
i L a
The Role ofAgriculture in Oregon's Economic Base 271
(2)U) cn
LLI
-0 ,+- Q)0) 0,Q
ed a E 0,
H a)0. U)
I
. C c- ~C.) _0 0
0~0I+
U)a V -c-
_: 0
0 0o ,
I -
t-a) C
H 0
(n 0,
3 *: a) - EJ oO
0 M M c
-d 50
LL- a)H) C-i
I I iZ
U)
I00- zo o
M s
Z
Il
I 0
Is
n-
O
0>
II
a:Q
bU
cn
0
1-
u)
Cl
z
cn
oLL .
c)LU
WUZ
z
Cl
-j0ILUn
oI
1-zw
o 221O Z
Cl)
a-j0
= (ncl)Z
1(l)
U)
CO(1 0 a)
X' 1
w
X < CE,Lij
(n
0)
E
U)
0Q.E
. CO /
m 0 ' _
I
Ea
0) ) 0
> < C
0, 0)o H
-C0 rrCO
L-
- 0) a)
O -
LLm
CO
Hx a
O/)0D lzz-O 00 0x ou :
/)
C
"£ E
0c-
a
0) >co
0xLLJI
0 U)
cn>E
CO >o
0c Cd
O r
S D
>|
CO O
U)
. -
OE
I °nCO 0
0) B
I -
o
I n
LC
1 >.
IO
-0
0OOC.
O0
cD
O
It0
O
C4
4^0)
t
Q
OPM4
c 0
.
1
I .--I I I I I~~~~~~~~~~~~~~~~~~I II II
I
Journal ofAgricultural and Resource Economics
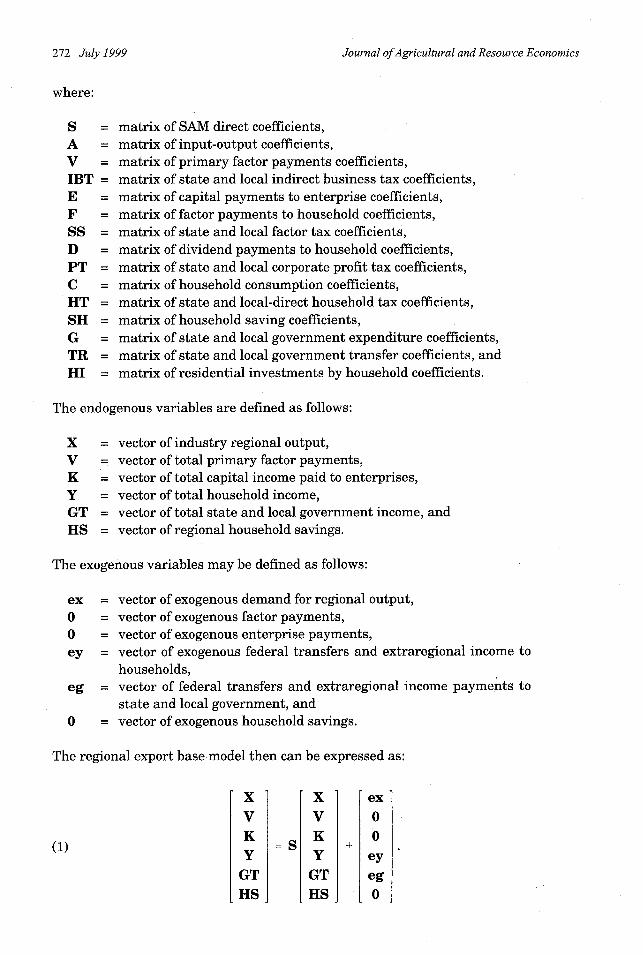
where:
S = matrix of SAM direct coefficients,A = matrix of input-output coefficients,V = matrix of primary factor payments coefficients,IBT = matrix of state and local indirect business tax coefficients,E = matrix of capital payments to enterprise coefficients,F = matrix of factor payments to household coefficients,SS = matrix of state and local factor tax coefficients,D = matrix of dividend payments to household coefficients,PT = matrix of state and local corporate profit tax coefficients,C = matrix of household consumption coefficients,HT = matrix of state and local-direct household tax coefficients,SH = matrix of household saving coefficients,G = matrix of state and local government expenditure coefficients,TR = matrix of state and local government transfer coefficients, andHI = matrix of residential investments by household coefficients.
The endogenous variables are defined as follows:
X = vector of industry regional output,V = vector of total primary factor payments,K = vector of total capital income paid to enterprises,Y = vector of total household income,GT = vector of total state and local government income, andHS = vector of regional household savings.
The exogenous variables may be defined as follows:
ex = vector of exogenous demand for regional output,0 = vector of exogenous factor payments,0 = vector of exogenous enterprise payments,ey = vector of exogenous federal transfers and extraregional income to
households,eg = vector of federal transfers and extraregional income payments to
state and local government, andO = vector of exogenous household savings.
The regional export base model then can be expressed as:
(1)
xVKY
GTHS
= S
XVKY
GTHS
+
ex
0
0
eyeg0
272 July 1999
The Role ofAgriculture in Oregon's Economic Base 273
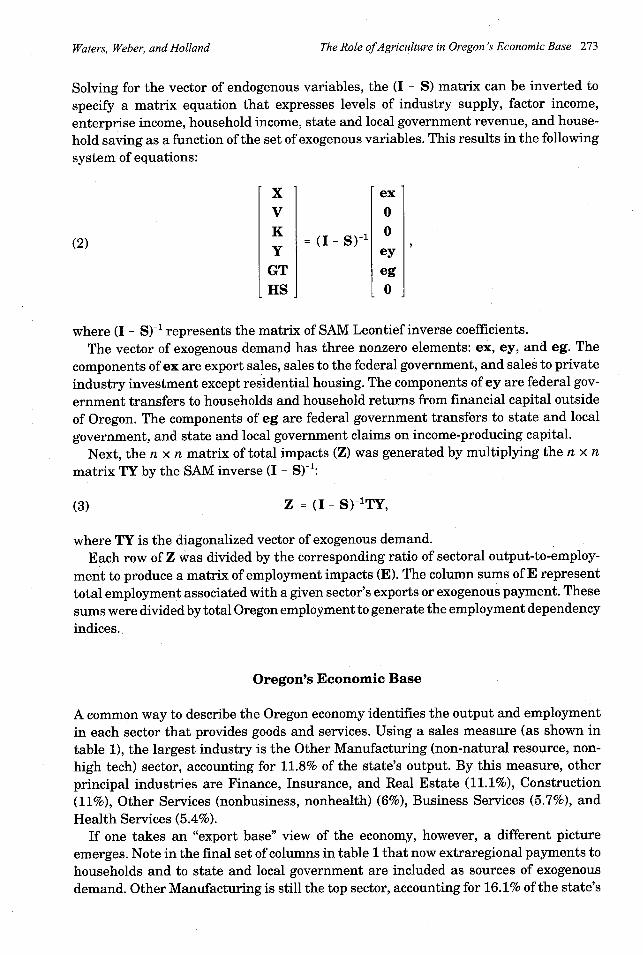
Solving for the vector of endogenous variables, the (I - S) matrix can be inverted to
specify a matrix equation that expresses levels of industry supply, factor income,
enterprise income, household income, state and local government revenue, and house-
hold saving as a function of the set of exogenous variables. This results in the following
system of equations:
(2)
XVKY
GTHS
= (I-S)-1
ex00
eyeg0
where (I - S)- 1 represents the matrix of SAM Leontief inverse coefficients.The vector of exogenous demand has three nonzero elements: ex, ey, and eg. The
components of ex are export sales, sales to the federal government, and sales to privateindustry investment except residential housing. The components of ey are federal gov-ernment transfers to households and household returns from financial capital outsideof Oregon. The components of eg are federal government transfers to state and local
government, and state and local government claims on income-producing capital.Next, the n x n matrix of total impacts (Z) was generated by multiplying the n x n
matrix TY by the SAM inverse (I - S)-1:
(3) Z = (I - S)-1TY,
where TY is the diagonalized vector of exogenous demand.Each row of Z was divided by the corresponding ratio of sectoral output-to-employ-
ment to produce a matrix of employment impacts (E). The column sums of E representtotal employment associated with a given sector's exports or exogenous payment. Thesesums were divided by total Oregon employment to generate the employment dependencyindices.
Oregon's Economic Base
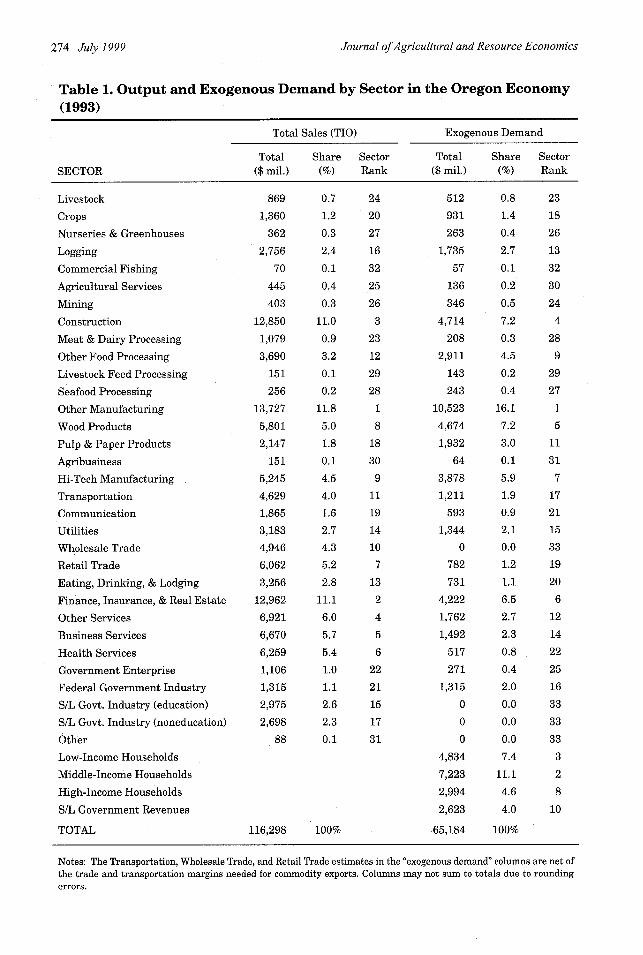
A common way to describe the Oregon economy identifies the output and employmentin each sector that provides goods and services. Using a sales measure (as shown intable 1), the largest industry is the Other Manufacturing (non-natural resource, non-
high tech) sector, accounting for 11.8% of the state's output. By this measure, other
principal industries are Finance, Insurance, and Real Estate (11.1%), Construction
(11%), Other Services (nonbusiness, nonhealth) (6%), Business Services (5.7%), and
Health Services (5.4%).If one takes an "export base" view of the economy, however, a different picture
emerges. Note in the final set of columns in table 1 that now extraregional payments to
households and to state and local government are included as sources of exogenous
demand. Other Manufacturing is still the top sector, accounting for 16.1% of the state's
Waters, Weber, and Holland
Journal ofAgricultural and Resource Economics
Table 1. Output and Exogenous Demand by Sector in the Oregon Economy(1993)
Total Sales (TIO) Exogenous Demand
Total Share Sector Total Share SectorSECTOR ($ mil.) (%) Rank ($ mil.) (%) Rank
Livestock 869 0.7 24 512 0.8 23
Crops 1,360 1.2 20 931 1.4 18
Nurseries & Greenhouses 362 0.3 27 263 0.4 26
Logging 2,756 2.4 16 1,735 2.7 13
Commercial Fishing 70 0.1 32 57 0.1 32
Agricultural Services 445 0.4 25 136 0.2 30
Mining 403 0.3 26 346 0.5 24
Construction 12,850 11.0 3 4,714 7.2 4
Meat & Dairy Processing 1,079 0.9 23 208 0.3 28
Other Food Processing 3,690 3.2 12 2,911 4.5 9
Livestock Feed Processing 151 0.1 29 143 0.2 29
Seafood Processing 256 0.2 28 243 0.4 27
Other Manufacturing 13,727 11.8 1 10,523 16.1 1
Wood Products 5,801 5.0 8 4,674 7.2 5
Pulp & Paper Products 2,147 1.8 18 1,932 3.0 11
Agribusiness 151 0.1 30 64 0.1 31
Hi-Tech Manufacturing 5,245 4.5 9 3,878 5.9 7
Transportation 4,629 4.0 11 1,211 1.9 17
Communication 1,865 1.6 19 593 0.9 21
Utilities 3,183 2.7 14 1,344 2.1 15
Wholesale Trade 4,946 4.3 10 0 0.0 33
Retail Trade 6,062 5.2 7 782 1.2 19
Eating, Drinking, & Lodging 3,256 2.8 13 731 1.1 20
Finance, Insurance, & Real Estate 12,962 11.1 2 4,222 6.5 6
Other Services 6,921 6.0 4 1,762 2.7 12
Business Services 6,670 5.7 5 1,492 2.3 14
Health Services 6,259 5.4 6 517 0.8 22
Government Enterprise 1,106 1.0 22 271 0.4 25
Federal Government Industry 1,315 1.1 21 1,315 2.0 16
S/L Govt. Industry (education) 2,975 2.6 15 0 0.0 33
S/L Govt. Industry (noneducation) 2,698 2.3 17 0 0.0 33
Other 88 0.1 31 0 0.0 33
Low-Income Households 4,834 7.4 3
Middle-Income Households 7,223 11.1 2
High-Income Households 2,994 4.6 8
S/L Government Revenues 2,623 4.0 10
TOTAL 116,298 100% 65,184 100%
Notes: The Transportation, Wholesale Trade, and Retail Trade estimates in the "exogenous demand" columns are net ofthe trade and transportation margins needed for commodity exports. Columns may not sum to totals due to roundingerrors.
274 July 1999
The Role ofAgriculture in Oregon's Economic Base 275
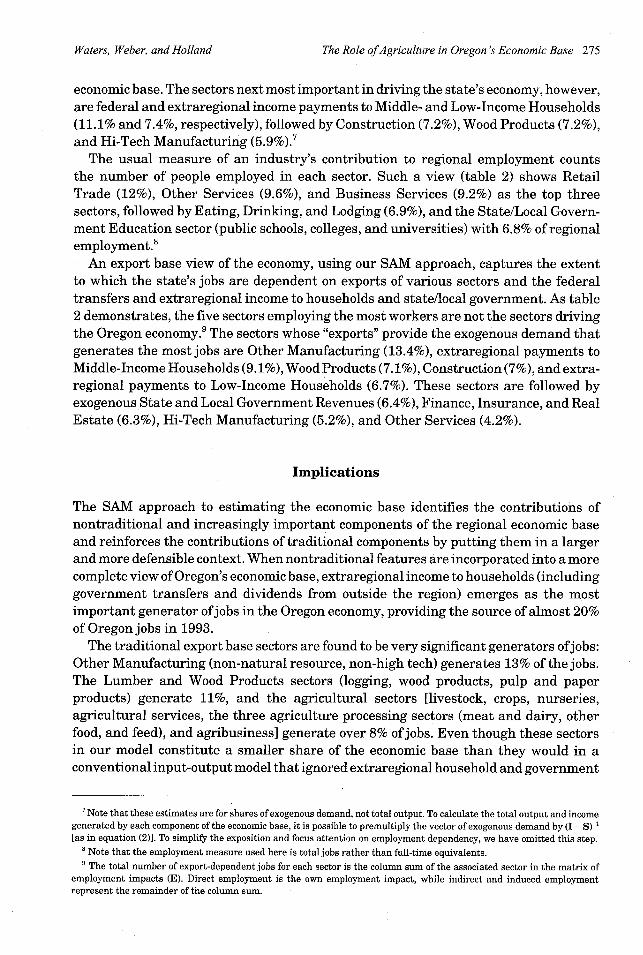
economic base. The sectors next most important in driving the state's economy, however,are federal and extraregional income payments to Middle- and Low-Income Households(11.1% and 7.4%, respectively), followed by Construction (7.2%), Wood Products (7.2%),and Hi-Tech Manufacturing (5.9%).7
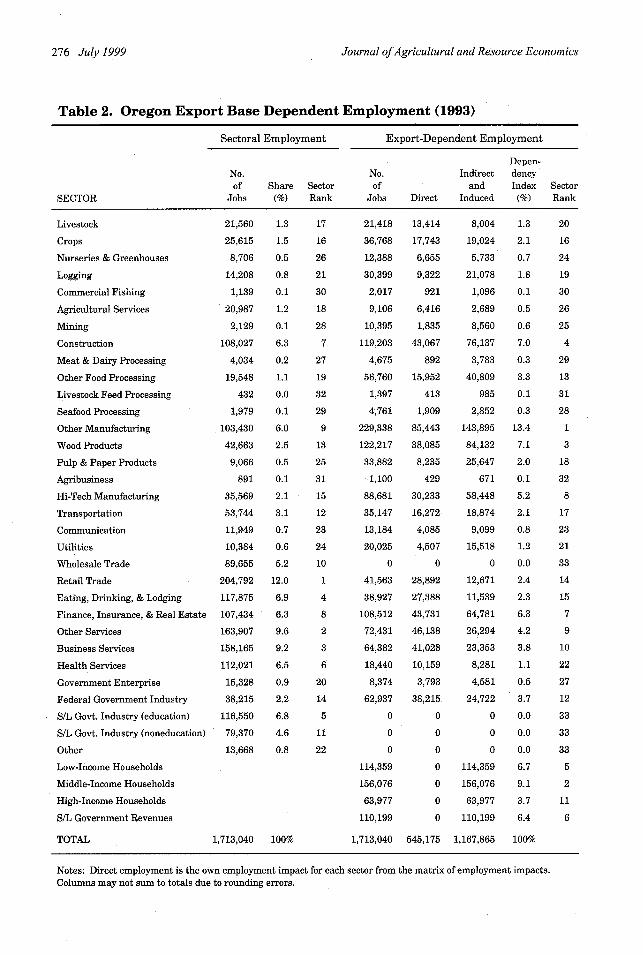
The usual measure of an industry's contribution to regional employment countsthe number of people employed in each sector. Such a view (table 2) shows RetailTrade (12%), Other Services (9.6%), and Business Services (9.2%) as the top threesectors, followed by Eating, Drinking, and Lodging (6.9%), and the State/Local Govern-ment Education sector (public schools, colleges, and universities) with 6.8% of regionalemployment. 8
An export base view of the economy, using our SAM approach, captures the extentto which the state's jobs are dependent on exports of various sectors and the federaltransfers and extraregional income to households and state/local government. As table2 demonstrates, the five sectors employing the most workers are not the sectors drivingthe Oregon economy. 9 The sectors whose "exports" provide the exogenous demand thatgenerates the most jobs are Other Manufacturing (13.4%), extraregional payments toMiddle-Income Households (9.1%), Wood Products (7.1%), Construction (7%), and extra-regional payments to Low-Income Households (6.7%). These sectors are followed byexogenous State and Local Government Revenues (6.4%), Finance, Insuranenrace, and RealEstate (6.3%), Hi-Tech Manufacturing (5.2%), and Other Services (4.2%).
Implications
The SAM approach to estimating the economic base identifies the contributions ofnontraditional and increasingly important components of the regional economic baseand reinforces the contributions of traditional components by putting them in a largerand more defensible context. When nontraditional features are incorporated into a morecomplete view of Oregon's economic base, extraregional income to households (includinggovernment transfers and dividends from outside the region) emerges as the mostimportant generator of jobs in the Oregon economy, providing the source of almost 20%of Oregon jobs in 1993.
The traditional export base sectors are found to be very significant generators ofjobs:Other Manufacturing (non-natural resource, non-high tech) generates 13% of the jobs.The Lumber and Wood Products sectors (logging, wood products, pulp and paperproducts) generate 11%, and the agricultural sectors [livestock, crops, nurseries,agricultural services, the three agriculture processing sectors (meat and dairy, otherfood, and feed), and agribusiness] generate over 8% of jobs. Even though these sectorsin our model constitute a smaller share of the economic base than they would in aconventional input-output model that ignored extraregional household and government
7 Note that these estimates are for shares of exogenous demand, not total output. To calculate the total output and incomegenerated by each component of the economic base, it is possible to premultiply the vector of exogenous demand by (I - S)-1[as in equation (2)]. To simplify the exposition and focus attention on employment dependency, we have omitted this step.
8Note that the employment measure used here is total jobs rather than full-time equivalents.9 The total number of export-dependent jobs for each sector is the column sum of the associated sector in the matrix of
employment impacts (E). Direct employment is the own employment impact, while indirect and induced employmentrepresent the remainder of the column sum.
Waters, Weber, and Holland
Journal ofAgricultural and Resource Economics
Table 2. Oregon Export Base Dependent Employment (1993)
Sectoral Employment Export-Dependent Employment
Depen-No. No. Indirect dencyof Share Sector of and Index Sector
SECTOR Jobs (%) Rank Jobs Direct Induced (%) Rank
Livestock 21,560 1.3
Crops 25,615 1.5
Nurseries & Greenhouses 8,706 0.5
Logging 14,208 0.8
Commercial Fishing 1,139 0.1
Agricultural Services 20,987 1.2
Mining 2,129 0.1
Construction 108,027 6.3
Meat & Dairy Processing 4,034 0.2
Other Food Processing 19,548 1.1
Livestock Feed Processing 432 0.0
Seafood Processing 1,979 0.1
Other Manufacturing 103,430 6.0
Wood Products 42,663 2.5
Pulp & Paper Products 9,066 0.5
Agribusiness 891 0.1
Hi-Tech Manufacturing 35,569 2.1
Transportation 53,744 3.1
Communication 11,949 0.7
Utilities 10,384 0.6
Wholesale Trade 89,655 5.2
Retail Trade 204,792 12.0
Eating, Drinking, & Lodging 117,875 6.9
Finance, Insurance, & Real Estate 107,434 6.3
Other Services 163,907 9.6
Business Services 158,165 9.2
Health Services 112,021 6.5
Government Enterprise 15,328 0.9
Federal Government Industry 38,215 2.2
S/L Govt. Industry (education) 116,550 6.8
S/L Govt. Industry (noneducation) 79,370 4.6
Other 13,668 0.8
Low-Income Households
Middle-Income Households
High-Income Households
S/L Government Revenues
TOTAL 1,713,040 100%
17
16
26
21
30
18
28
7
27
19
32
29
9
13
25
31
15
12
23
24
10
1
4
8
2
3
6
20
14
5
11
22
21,418 13,414
36,768 17,743
12,388 6,655
30,399 9,322
2,017 921
9,106 6,416
10,395 1,835
119,203 43,067
4,675 892
56,760 15,952
1,397 413
4,761 1,909
229,338 85,443
122,217 38,085
33,882 8,235
1,100 429
88,681 30,233
35,147 16,272
13,184 4,085
20,025 4,507
0 0
41,563 28,892
38,927 27,388
108,512 43,731
72,431 46,138
64,382 41,028
18,440 10,159
8,374 3,793
62,937 38,215
0 0
0 0
0 0
114,359 0
156,076 0
63,977 0
110,199 0
1,713,040 545,175 1,167,865 100%
Notes: Direct employment is the own employment impact for each sector from the matrix of employment impacts.Columns may not sum to totals due to rounding errors.
8,004 1.3
19,024 2.1
5,733 0.7
21,078 1.8
1,096 0.1
2,689 0.5
8,560 0.6
76,137 7.0
3,783 0.3
40,809 3.3
985 0.1
2,852 0.3
143,895 13.4
84,132 7.1
25,647 2.0
671 0.1
58,448 5.2
18,874 2.1
9,099 0.8
15,518 1.2
0 0.0
12,671 2.4
11,539 2.3
64,781 6.3
26,294 4.2
23,353 3.8
8,281 1.1
4,581 0.5
24,722 3.7
0 0.0
0 0.0
0 0.0
114,359 6.7
156,076 9.1
63,977 3.7
110,199 6.4
20
16
24
19
30
26
25
4
29
13
31
28
1
3
18
32
8
17
23
21
33
14
15
7
9
10
22
27
12
33
33
33
5
2
11
6
276 July 1999
The Role ofAgriculture in Oregon's Economic Base 277
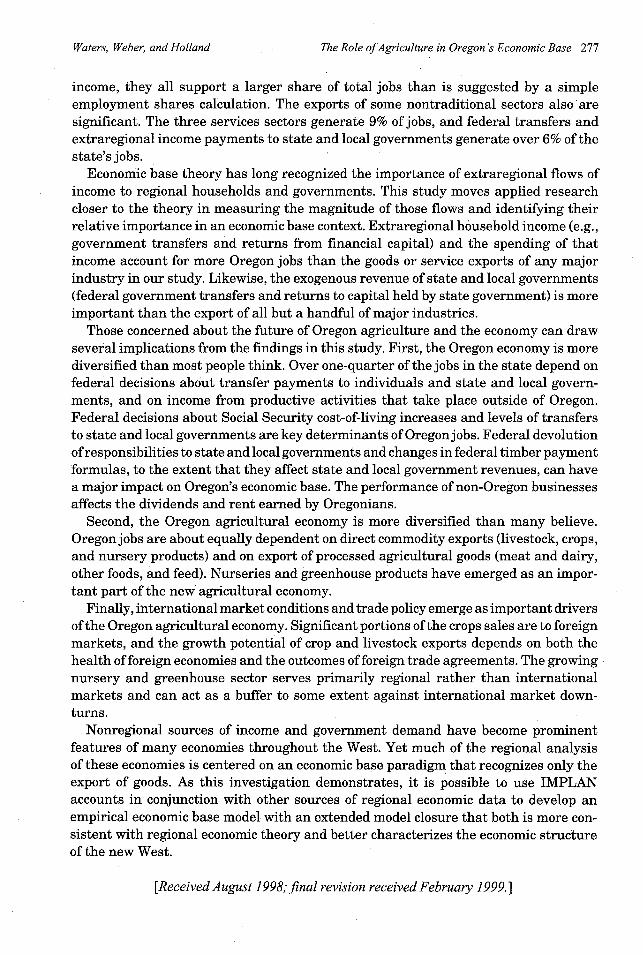
income, they all support a larger share of total jobs than is suggested by a simpleemployment shares calculation. The exports of some nontraditional sectors also'aresignificant. The three services sectors generate 9% of jobs, and federal transfers andextraregional income payments to state and local governments generate over 6% of thestate's jobs.
Economic base theory has long recognized the importance of extraregional flows ofincome to regional households and governments. This study moves applied researchcloser to the theory in measuring the magnitude of those flows and identifying theirrelative importance in an economic base context. Extraregional household income (e.g.,government transfers and returns from financial capital) and the spending of thatincome account for more Oregon jobs than the goods or service exports of any majorindustry in our study. Likewise, the exogenous revenue of state and local governments(federal government transfers and returns to capital held by state government) is moreimportant than the export of all but a handful of major industries.
Those concerned about the future of Oregon agriculture and the economy can drawseveral implications from the findings in this study. First, the Oregon economy is morediversified than most people think. Over one-quarter of the jobs in the state depend onfederal decisions about transfer payments to individuals and state and local govern-ments, and on income from productive activities that take place outside of Oregon.Federal decisions about Social Security cost-of-living increases and levels of transfersto state and local governments are key determinants of Oregonjobs. Federal devolutionof responsibilities to state and local governments and changes in federal timber paymentformulas, to the extent that they affect state and local government revenues, can havea major impact on Oregon's economic base. The performance of non-Oregon businessesaffects the dividends and rent earned by Oregonians.
Second, the Oregon agricultural economy is more diversified than many believe.Oregon jobs are about equally dependent on direct commodity exports (livestock, crops,and nursery products) and on export of processed agricultural goods (meat and dairy,other foods, and feed). Nurseries and greenhouse products have emerged as an impor-tant part of the new agricultural economy.
Finally, international market conditions and trade policy emerge as important driversof the Oregon agricultural economy. Significant portions of the crops sales are to foreignmarkets, and the growth potential of crop and livestock exports depends on both thehealth of foreign economies and the outcomes of foreign trade agreements. The growingnursery and greenhouse sector serves primarily regional rather than internationalmarkets and can act as a buffer to some extent against international market down-turns.
Nonregional sources of income and government demand have become prominentfeatures of many economies throughout the West. Yet much of the regional analysisof these economies is centered on an economic base paradigm that recognizes only theexport of goods. As this investigation demonstrates, it is possible to use IMPLANaccounts in conjunction with other sources of regional economic data to develop anempirical economic base model with an extended model closure that both is more con-sistent with regional economic theory and better characterizes the economic structureof the new West.
[Received August 1998; final revision received February 1999.]
Waters, Weber, and Holland
Journal ofAgricultural and Resource Economics
References
Alward, G., E. Siverts, 0. Olsen, J. Wagner, 0. Senf, and S. Lindall. Micro IMPLAN Software Manual.USDA, Forest Service Land Management Planning Staff, Fort Collins CO, 1989.
Andrews, R. B. "Mechanics of the Urban Economic Base: The Problem of Base Measurement." Land
Econ. XXX, 1(February 1954a):51-60.. "Mechanics of the Urban Economic Base: The Problem of Base Area Delineation." Land Econ.
XXX, 4(November 1954b):309-19.. "Mechanics of the Urban Economic Base: Causes and Effects of Change in the Base Ratios and
the Ratio Elements (I)." Land Econ. XXXI, 2(May 1955):144-55.. "Mechanics of the Urban Economic Base: The Base Concept and the Planning Process." Land
Econ. XXXII, 1(February 1956):69-84.Archibald, G. C. "Regional Multiplier Effects in the U.K." Oxford Econ. Papers, New Series 19(1967):
22-45.Beyers, W. B., and D. P. Lindahl. "The Economic Impact of Technology-Based Industries on Washing-
ton State." Report prepared for the Technology Alliance, Seattle WA, January 1997.Billings, B. R. "The Mathematical Identity of the Multipliers Derived from the Economic Base Model
and the Input-Output Model." J. Regional Sci. 9(1969):471-72.Charney, A., and J. Leones. "Impact of High Technology Industry on the Arizona Economy." College
of Business and Public Administration and College of Agriculture, University of Arizona, Tucson,October 1995.
Crosson, P. R. "Further Comment on Economic Base Theory." Land Econ. XXXVI, 2(May 1960):197-201.
Farness, D. H. "Detecting the Economic Base: New Challenges." Internat. Regional Sci. Rev. 12(1989):319-28.
Greenhut, M. L. "Comments on Economic Base Theory." Land Econ. XXXV, 1(February 1959): 71-75.Isserman, A. M. "Estimating Export Activity in a Regional Economy: A Theoretical and Empirical
Analysis of Alternative Methods." Internat. Regional Sci. Rev. 5(1980):155-84.Krikelas, A. C. "Why Regions Grow: A Review of Research on the Economic Base Model." Federal
Reserve Bank of Atlanta, Econ. Rev. 77,4(1992):16-29.Leones, J., G. Schluter, and G. Goldman. "Redefining Agriculture in Interindustry Analysis." Amer.
J. Agr. Econ. 76,5(December 1994):1123-29.Leven, C. L. "An Appropriate Unit for Measuring the Urban Economic Base." Land Econ. XXX,
4(November 1954):369-71.Merrifield, J. A. "Neoclassical Anatomy of the Economic Base Multiplier." J. Regional Sci. 27,2(1987):
283-94.Robison, M. H. "Community Input-Output Models for Rural Area Analysis with an Example from
Central Idaho." Annals Regional Sci. 31(1997):325-51.Robison, M. H., and J. Miller. "A Technique for Constructing a Non-Survey Regional Economic Base,
Input-Output Model." Unpub. pap., University of Idaho, Moscow, September 1989.Romanoff, R. "The Economic Base Model: A Very Special Case of Input-Output Analysis." J. Regional
Sci. 14,1(1974):121-29.State of Oregon, Employment Department. Oregon Covered Employment and Payrolls for 1990-1994.
Employment Dept./Research, Tax, and Analysis Div., Salem OR, 1990-94.Tiebout, C. M. "The Community Economic Base Study." Supplementary Pap. No. 16, Committee for
Economic Development, New York, December 1962.U.S. Department of Commerce, Bureau of Economic Analysis. Regional Economic Information System
(REIS), Employment and Income Data for Oregon Counties. CD ROM. Washington DC: U.S.Government Printing Office, 1995.
278 July 1999
The Role ofAgriculture in Oregon's Economic Base 279
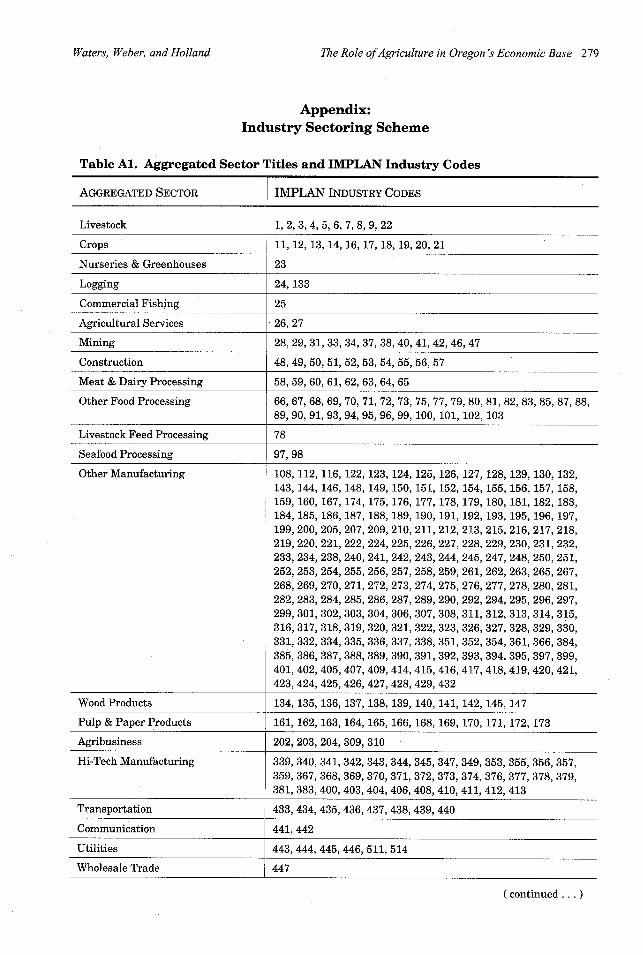
Appendix:Industry Sectoring Scheme
Table Al. Aggregated Sector Titles and IMPLAN Industry Codes
AGGREGATED SECTOR IMPLAN INDUSTRY CODES
Livestock 1,2,3,4, 5, 6, 7, 8, 9, 22
Crops 11, 12, 13, 14, 16, 17, 18, 19, 20, 21
Nurseries & Greenhouses 23
Logging 24, 133
Commercial Fishing 25
Agricultural Services 26, 27
Mining 28, 29, 31, 33, 34, 37, 38, 40, 41, 42, 46, 47
Construction 48, 49, 50, 51, 52, 53, 54, 55, 56, 57
Meat & Dairy Processing 58, 59, 60, 61, 62, 63, 64, 65
Other Food Processing 66, 67, 68, 69, 70, 71, 72, 73, 75, 77, 79, 80, 81, 82, 83, 85, 87, 88,89, 90, 91, 93, 94, 95, 96, 99, 100, 101, 102, 103
Livestock Feed Processing 78
Seafood Processing 97, 98
Other Manufacturing 108, 112, 116, 122, 123, 124, 125, 126, 127, 128, 129, 130, 132,143, 144, 146, 148, 149, 150, 151, 152, 154, 155, 156, 157, 158,159, 160, 167, 174, 175, 176, 177, 178, 179, 180, 181, 182, 183,184, 185, 186, 187, 188, 189, 190, 191, 192, 193, 195, 196, 197,199, 200, 205, 207, 209, 210, 211, 212, 213, 215, 216, 217, 218,219, 220, 221, 222, 224, 225, 226, 227, 228, 229, 230, 231, 232,233, 234, 238, 240, 241, 242, 243, 244, 245, 247, 248, 250, 251,252, 253, 254, 255, 256, 257, 258, 259, 261, 262, 263, 265, 267,268, 269, 270, 271, 272, 273, 274, 275, 276, 277, 278, 280, 281,282, 283, 284, 285, 286, 287, 289, 290, 292, 294, 295, 296, 297,299, 301, 302, 303, 304, 306, 307, 308, 311, 312, 313, 314, 315,316, 317, 318, 319, 320, 321, 322, 323, 326, 327, 328, 329, 330,331, 332, 334, 335, 336, 337, 338, 351, 352, 354, 361, 366, 384,385, 386, 387, 388, 389, 390, 391, 392, 393, 394, 395, 397, 399,401, 402, 405,407, 409, 414, 415, 416, 417, 418, 419, 420, 421,423,424, 425, 426, 427, 428, 429, 432
Wood Products 134, 135, 136, 137, 138, 139, 140, 141, 142, 145, 147
Pulp & Paper Products 161, 162, 163, 164, 165, 166, 168, 169, 170, 171, 172, 173
Agribusiness 202, 203, 204, 309, 310
Hi-Tech Manufacturing 339, 340, 341, 342, 343, 344, 345, 347, 349, 353, 355, 356, 357,359, 367, 368, 369, 370, 371, 372, 373, 374, 376, 377, 378, 379,381, 383, 400, 403, 404, 406, 408, 410, 411, 412, 413
Transportation 433, 434, 435, 436, 437, 438, 439, 440
Communication 441, 442
Utilities 443, 444, 445, 446, 511, 514
Wholesale Trade 447
(continued...)
Waters, Weber, and Holland
Journal ofAgricultural and Resource Economics
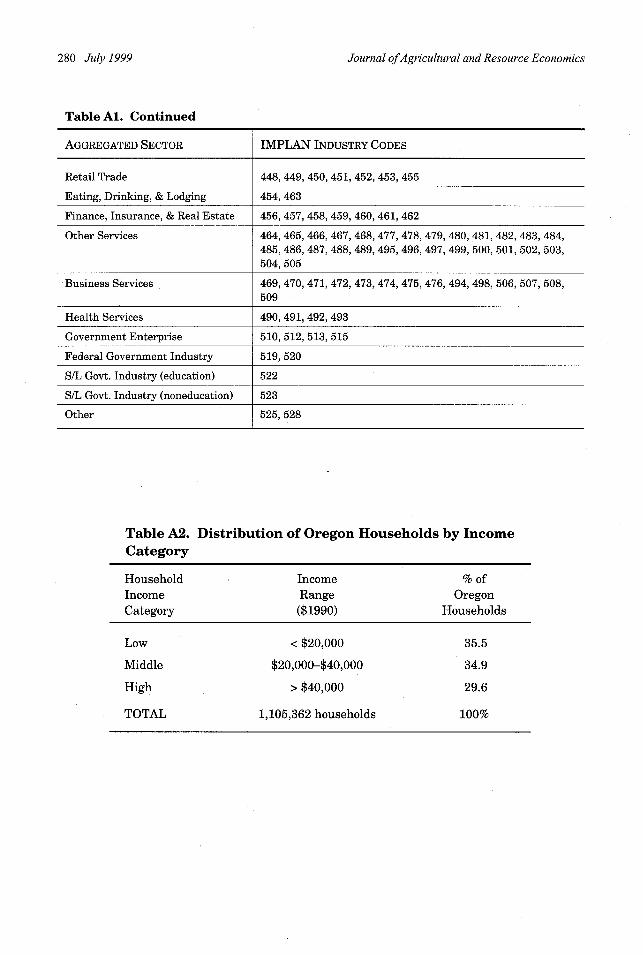
Table Al. Continued
AGGREGATED SECTOR IMPLAN INDUSTRY CODES
Retail Trade 448, 449, 450, 451, 452, 453, 455
Eating, Drinking, & Lodging 454, 463
Finance, Insurance, & Real Estate 456, 457, 458, 459, 460, 461, 462
Other Services 464, 465, 466, 467, 468, 477, 478, 479, 480, 481, 482, 483, 484,485,486, 487, 488, 489, 495, 496, 497, 499, 500, 501, 502, 503,504, 505
Business Services 469, 470, 471, 472, 473, 474, 475, 476, 494, 498, 506, 507, 508,509
Health Services 490, 491, 492, 493
Government Enterprise 510, 512, 513, 515
Federal Government Industry 519, 520
S/L Govt. Industry (education) 522
S/L Govt. Industry (noneducation) 523
Other 525, 528
Table A2. Distribution of Oregon Households by IncomeCategory
Household Income % ofIncome Range OregonCategory ($1990) Households
Low < $20,000 35.5
Middle $20,000-$40,000 34.9
High > $40,000 29.6
TOTAL 1,105,362 households 100%
280 July 1999