Embed Size (px)
Citation preview
Pacific Earthquake EngineeringResearch Center
PEER 2002/03aUGUST 2002
Pacific Earthquake EngineeringResearch Center
PEER 2001/06APRIL 1999
Pacific Earthquake EngineeringResearch Center
PEER 2001/06APRIL 1999
Pacific Earthquake EngineeringResearch Center
PEER 2001/07AUG. 2001
Pacific Earthquake EngineeringResearch Center
Pacific Earthquake EngineeringResearch Center
PEER 2001/07AUG. 2001
The Rocking Spectrum andthe Shortcomings of Design Guidelines
Nicos Makris
Associate ProfessorDepartment of Civil and Environmental Engineering
University of California, Berkeley
and
Dimitrios Konstantinidis
Department of Civil and Environmental EngineeringUniversity of California, Berkeley
The Rocking Spectrum andthe Shortcomings of Design Guidelines
Nicos Makris
Associate ProfessorDepartment of Civil and Environmental Engineering
University of California, Berkeley
and
Dimitrios Konstantinidis
Department of Civil and Environmental EngineeringUniversity of California, Berkeley
PEER Report 2001/07Pacific Earthquake Engineering Research Center
College of Engineering
August 2001

iii
ABSTRACT
This report is concerned with the superficial similarities and fundamental differences between
the oscillatory response of a single-degree-of-freedom (SDOF) oscillator (regular pendulum)
and the rocking response of a slender rigid block (inverted pendulum). The study examines
the distinct characteristics of the rocking spectrum and compares the observed trends with
those of the response spectrum. It is shown that the rocking spectrum complements the
response spectrum as an indicator of the shaking potential of earthquakes since it reflects
kinematic characteristics of the ground motions that are not identifiable by the response
spectrum. The study investigates systematically the fundamental differences in the mechani-
cal structure of the two dynamical systems of interest and concludes that rocking structures
cannot be replaced by “equivalent” single-degree-of-freedom-oscillators. The study proceeds
by examining the validity of a simple, approximate design methodology, initially proposed in
the late 70’s and now recommended in design guidelines to compute rotations of slender
structures by performing iteration either on the true displacement response spectrum or on the
design spectrum. This report shows that the abovementioned simple design approach is
inherently flawed and should be abandoned, in particular for smaller, less slender blocks. The
study concludes that the exact rocking spectrum emerges as a distinct, irreplaceable indicator
of the shaking potential of ground motions and should be adopted by the profession as a
valuable analysis and design tool.
v
TABLE OF CONTENTS
ABSTRACT ...........................................................................................................iii
TABLE OF CONTENTS ................................................................................................ v
LIST OF FIGURES ......................................................................................................vii
LIST OF TABLES......................................................................................................... xi
ACKNOWLEDGEMENTS..........................................................................................xiii
CHAPTER 1: INTRODUCTION ...............................................................................1
CHAPTER 2: DEFINITIONS, ASSUMPTIONS AND JUSTIFICATIONS ...............5
CHAPTER 3: REVIEW OF THE EARTHQUAKE RESPONSE OF VISCOUSLYDAMPED OSCILLATOR...................................................................7
CHAPTER 4: REVIEW OF THE ROCKING RESPONSE OF A RIGID BLOCK... 11
CHAPTER 5: ROCKING SPECTRA....................................................................... 17
CHAPTER 6: A NEW MEASURE OF EARTHQUAKE SHAKING....................... 27
CHAPTER 7: FREE VIBRATIONS OF ROCKING BLOCK .................................. 31
CHAPTER 8: ESTIMATION OF UPLIFT USING THE RESPONSE SPECTRA.... 37
CHAPTER 9: THE FEMA 356 GUIDELINES ........................................................ 53
CHAPTER 10: CONCLUSIONS ............................................................................... 57
REFERENCES .......................................................................................................... 59

vii
LIST OF FIGURES
Figure 1.1 Schematic of a single-degree-of-freedom oscillator (top left) and of a free-standing block in rocking motion (top right); together with the associated force-displacement (bottom left) and moment-rotation (bottom right) diagrams........ 3
Figure 4.1 Rocking response of rigid block: p=2.0 rad/sec, α=15o [h=1.77 m, b=0.48 m,R=1.84 m, r=0.81], subjected to Type-B pulse with Tp = 2 sec. ...................... 15
Figure 4.2 Rocking response of rigid block: p=1.0 rad/sec, α=15o [h=7.11 m, b= 1.90 m,R=7.35 m, r=0.81 m], subjected to Type-B pulse with Tp=2 sec..................... 16
Figure 5.1 True response spectra of a linear viscously damped oscillator (left) and rockingspectra of a rigid slender block (right) when subjected to the Pacoima Dammotion recorded during the 1971 San Fernando Earthquake. ......................... 20
Figure 5.2 True response spectra of a linear viscously damped oscillator (left) and rockingspectra of a rigid slender block (right) when subjected to the FN component ofthe Array #5 motion recorded during the 1979 Imperial Valley earthquake.... 21
Figure 5.3 True response spectra of a linear viscously damped oscillator (left) and rockingspectra of a rigid slender block (right) when subjected to the Los Gatos motionrecorded during the 1989 Loma Prieta earthquake. ........................................ 22
Figure 5.4 True response spectra of a linear viscously damped oscillator (left) and rockingspectra of a rigid slender block (right) when subjected to the Rinaldi motionrecorded during the 1994 Northridge earthquake. .......................................... 23
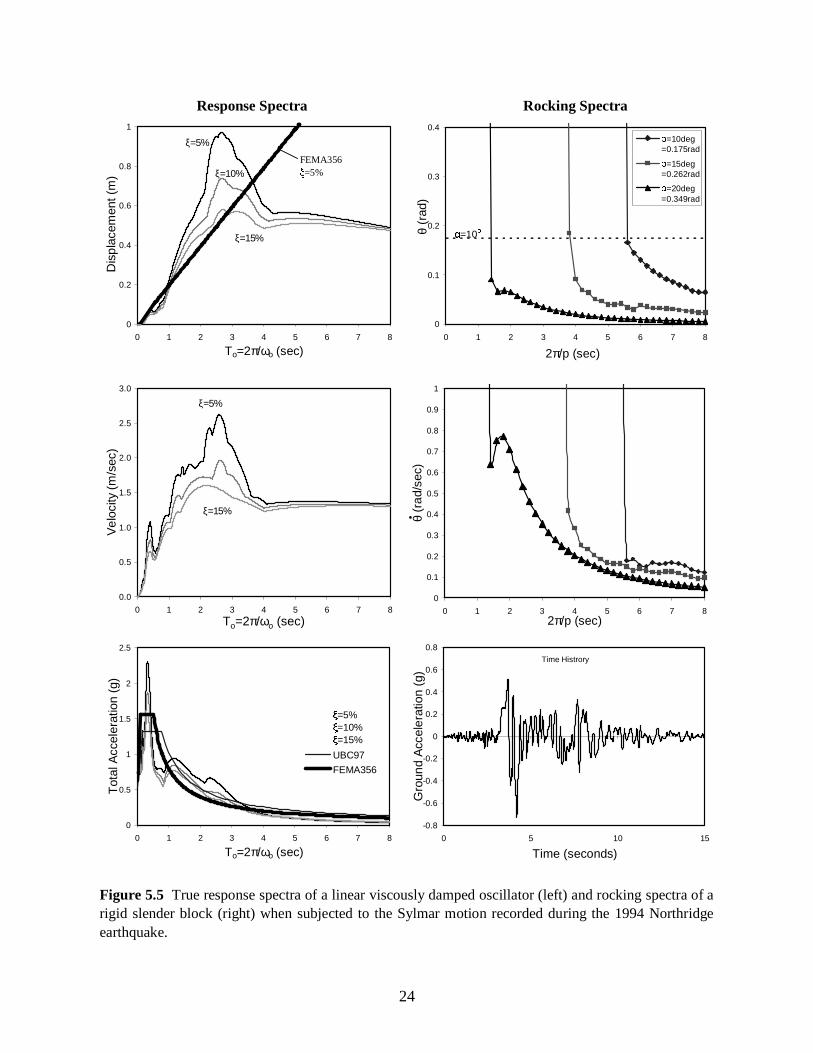
Figure 5.5 True response spectra of a linear viscously damped oscillator (left) and rockingspectra of a rigid slender block (right) when subjected to the Sylmar motionrecorded during the 1994 Northridge earthquake. .......................................... 24
Figure 5.6 True response spectra of a linear viscously damped oscillator (left) and rockingspectra of a rigid slender block (right) when subjected to 1992 Erzinkan,Turkey, earthquake........................................................................................ 25
Figure 5.7 True response spectra of a linear viscously damped oscillator (left) and rockingspectra of a rigid slender block (right) when subjected to the Takatori motionrecorded during the 1995 Kobe, Japan, earthquake. ....................................... 26
Figure 7.1 Equivalent viscous damping, β, of a rocking block as results from (a) thePriestley et al. (1978) analogy (Equation 7.9), (light solid lines); (b) theempirical Equation (7.10), (heavy solid lines); and (c) the FEMA 356 formula,(dashed line).................................................................................................. 35
Figure 7.2 Response of SDOF oscillator: ωo=2.0 rad/sec, %2.7)81.0ln(34.0 =−=ξ ,subjected to Type-B pulse with Tp=2 sec. ...................................................... 36

viii
Figure 8.1 Comparison of exact and approximate uplift spectra (center column) that havebeen computed with the Priestley et al. (1978) method using the truedisplacement response spectrum (top left). The converged period thatcorresponds to the estimated uplift is shown in the right column. GroundMotion: Pacoima Dam, 1971 San Fernando................................................... 42
Figure 8.2 Selected time histories and durations of rocking cycles of rigid blocks withslenderness, α=10ο (left), α=15ο (center), and α=20ο (right) when subjected tothe Pacoima Dam record................................................................................ 43
Figure 8.3 Comparison of exact and approximate uplift spectra (center column) that havebeen computed with the Priestley et al. (1978) method using the truedisplacement response spectrum (top left). The converged period thatcorresponds to the estimated uplift is shown in the right column. GroundMotion: El Centro Array #5, 1979 Imperial Valley. ....................................... 44
Figure 8.4 Comparison of exact and approximate uplift spectra (center column) that havebeen computed with the Priestley et al. (1978) method using the truedisplacement response spectrum (top left). The converged period thatcorresponds to the estimated uplift is shown in the right column. GroundMotion: Los Gatos, 1989 Loma Prieta. .......................................................... 45
Figure 8.5 Selected time histories and durations of rocking cycles of rigid blocks withslenderness, α=10ο (left), α=15ο (center), and α=20ο (right) when subjected tothe Los Gatos record...................................................................................... 46
Figure 8.6 Comparison of exact and approximate uplift spectra (center column) that havebeen computed with the Priestley et al. (1978) method using the truedisplacement response spectrum (top left). The converged period thatcorresponds to the estimated uplift is shown in the right column. GroundMotion: Rinaldi, 1994 Northridge.................................................................. 47
Figure 8.7 Selected time histories and durations of rocking cycles of rigid blocks withslenderness, α=10ο (left), α=15ο (center), and α=20ο (right) when subjected tothe Rinaldi record.......................................................................................... 48
Figure 8.8 Comparison of exact and approximate uplift spectra (center column) that havebeen computed with the Priestley et al. (1978) method using the truedisplacement response spectrum (top left). The converged period thatcorresponds to the estimated uplift is shown in the right column. GroundMotion: Sylmar, 1994 Northridge.................................................................. 49
Figure 8.9 Selected time histories and durations of rocking cycles of rigid blocks withslenderness, α=10ο (left), α=15ο (center), and α=20ο (right) when subjected tothe Sylmar record. ......................................................................................... 50
Figure 8.10 Comparison of exact and approximate uplift spectra (center column) that havebeen computed with the Priestley et al. (1978) method using the truedisplacement response spectrum (top left). The converged period that
ix
corresponds to the estimated uplift is shown in the right column. GroundMotion: 1992 Erzinkan, Turkey..................................................................... 51
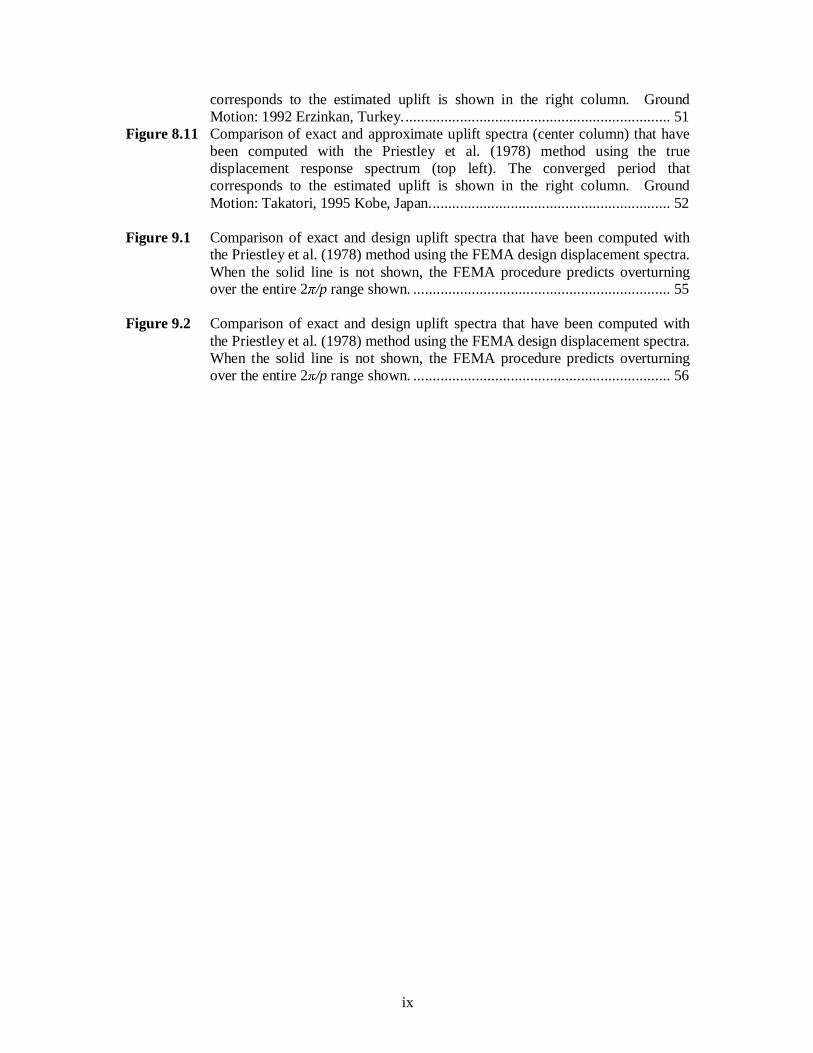
Figure 8.11 Comparison of exact and approximate uplift spectra (center column) that havebeen computed with the Priestley et al. (1978) method using the truedisplacement response spectrum (top left). The converged period thatcorresponds to the estimated uplift is shown in the right column. GroundMotion: Takatori, 1995 Kobe, Japan.............................................................. 52
Figure 9.1 Comparison of exact and design uplift spectra that have been computed withthe Priestley et al. (1978) method using the FEMA design displacement spectra.When the solid line is not shown, the FEMA procedure predicts overturningover the entire 2π/p range shown. .................................................................. 55
Figure 9.2 Comparison of exact and design uplift spectra that have been computed withthe Priestley et al. (1978) method using the FEMA design displacement spectra.When the solid line is not shown, the FEMA procedure predicts overturningover the entire 2π/p range shown. .................................................................. 56

xi
LIST OF TABLES
Table 3.1 Parameters Used to Construct the FEMA Acceleration Design Spectra. ............ 8
Table 5.1 Peak Ground Accelerations (PGA), Peak Ground Velocities (PGV) andApproximate Main Pulse Periods of Selected Earthquake Motions Next toValues of Block-Slenderness of Interest.......................................................... 18
Table 5.2 Selective Characteristics and Parameters of the Two One-Degree-of- FreedomSystems of Interest.......................................................................................... 19

xiii
ACKNOWLEDGEMENTS
This work was conducted during a one-semester-long sabbatical leave of the senior author
from the University of California at Berkeley. Partial financial support for this study was
provided by the Pacific Gas and Electric Company under Grant PG&E-UCB-0095 and by
Simpson Gumpertz & Heger Inc., Consulting Engineers.
This work made use of Pacific Earthquake Engineering Research Center shared facilities
supported by the Earthquake Engineering Research Center Program of the National Science
Foundation under award number EEC-9701568.
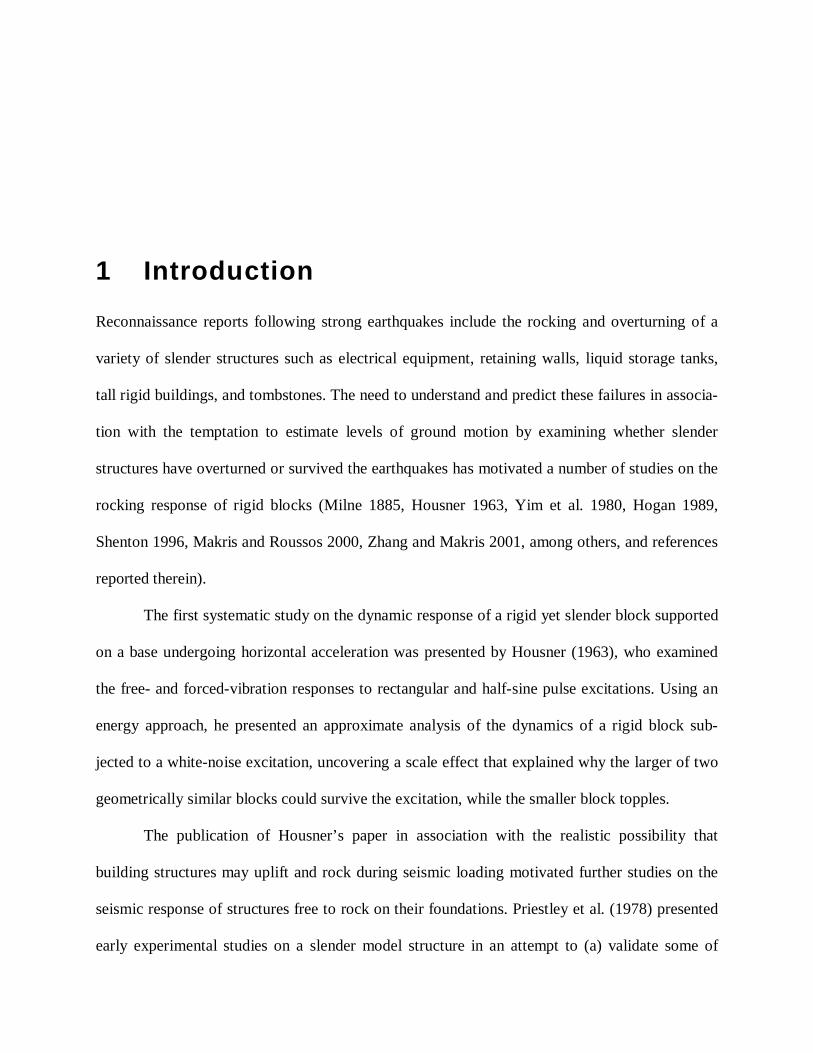
1 Introduction
Reconnaissance reports following strong earthquakes include the rocking and overturning of a
variety of slender structures such as electrical equipment, retaining walls, liquid storage tanks,
tall rigid buildings, and tombstones. The need to understand and predict these failures in associa-
tion with the temptation to estimate levels of ground motion by examining whether slender
structures have overturned or survived the earthquakes has motivated a number of studies on the
rocking response of rigid blocks (Milne 1885, Housner 1963, Yim et al. 1980, Hogan 1989,
Shenton 1996, Makris and Roussos 2000, Zhang and Makris 2001, among others, and references
reported therein).
The first systematic study on the dynamic response of a rigid yet slender block supported
on a base undergoing horizontal acceleration was presented by Housner (1963), who examined
the free- and forced-vibration responses to rectangular and half-sine pulse excitations. Using an
energy approach, he presented an approximate analysis of the dynamics of a rigid block sub-
jected to a white-noise excitation, uncovering a scale effect that explained why the larger of two
geometrically similar blocks could survive the excitation, while the smaller block topples.
The publication of Housner’s paper in association with the realistic possibility that
building structures may uplift and rock during seismic loading motivated further studies on the
seismic response of structures free to rock on their foundations. Priestley et al. (1978) presented
early experimental studies on a slender model structure in an attempt to (a) validate some of

2
Housner’s (1963) theoretical results and (b) to develop a practical methodology to compute
displacements of the center of gravity of the structure due to rocking motion by using standard
displacement and acceleration response spectra. Unfortunately, the Priestley et al. study is based
on the sweeping—and, as will be shown, erroneous—assumption that “it is possible to represent
a rocking block as a single-degree-of-freedom oscillator with constant damping, whose period
depends on the amplitude of rocking.” The unsubstantiated analogies and oversimplified meth-
odologies proposed in the Priestley et al. (1978) paper are revisited herein in depth, since they
have been adopted without sufficient scrutiny by the FEMA 356 document: Prestandard and
Commentary for the Seismic Rehabilitation of Buildings.
Figure 1.1 (top) shows the schematic of the two SDOF structures at their deformed con-
figurations when subjected to ground shaking. The response quantities of interest for the SDOF
oscillator are its relative displacement, u, and its time derivatives. The corresponding quantities
of interest for the rocking block are its rotation, θ , and its first time derivative—that is the
angular velocity, θ& . In parallel to the response spectra, the report advances the concept of the
rocking spectra which are plots of the maximum rotation, θ, and maximum angular velocity, θ& ,
versus the frequency parameter (or its inverse) of geometrically similar blocks (with same width-
to-height ratio). Rocking spectra can be used directly to estimate the uplift or overturning of a
variety of structures that tend to engage into rocking motion, ranging from tombstones to stiff
bridge towers. The report shows that the rocking spectrum is a distinct and valuable indicator of
the shaking potential of earthquakes and offers information on the earthquake shaking that is not
identifiable by the response spectrum.

3
m
k, c
uθ
ü g ü g
g
b
h
R
α
F
u θ
MmgRsinα
α
O' O
2h
2b
=
=
−
h
b
R
gp
1tan
4
3
α
o
o
m
cm
k
ωξ
ω
2=
=
Figure 1.1 Schematic of a single-degree-of-freedom oscillator (top left) and of afree-standing block in rocking motion (top right); together with the associatedforce-displacement (bottom left) and moment-rotation (bottom right) diagrams.

2 Definitions, Assumptions, andJustifications
In this study, the term oscillations is used solely for the response of the linear single-degree-of-
freedom oscillator, whereas the term vibrations is used for the rocking response of a rigid block.
This subtle distinction is introduced to differentiate between the free-vibration response of the
SDOF oscillator that is described by trigonometric functions and the solution of the linearized
equations that govern the free-vibration response of a rocking block that is described by hyper-
bolic functions.
When a rigid block is rocking, it is assumed that the rotation continues smoothly from
point O to O′. This constraint in association with conservation of momentum requires an energy
loss during impact that emerges from the requirement that the block sustains rocking motion.
The energy loss during impact depends on the slenderness of the block. An energy loss during
impact that is greater than the minimum energy loss required for the realization of rocking
motion will result in more rapid decay of the vibrations. Conversely, an energy loss during
impact that is less than the aforementioned minimum energy loss will induce a lift that distorts
the pure rocking assumption. The finite energy loss during impact results in an instantaneous
reduction of the angular velocity when the rotation reverses—therefore, in theory, the angular
velocity history is non-differentiable. In reality, during impact, there is a local plastic deforma-
tion at the pivot point that results in large but finite angular accelerations, which are not

6
computed in this analysis. Regardless of what the exact value of the angular acceleration is, the
existence of rocking motion is inherently associated with damping. Hence the rocking response
of a rigid block is compared with the oscillatory response of a damped oscillator. In this study,
we focus on the viscously damped oscillator, although other damping mechanisms could be
assumed without difficulty. Within the context of constitutive relations, the restoring mechanism
of the SDOF oscillator originates from the elasticity of the structure, while the restoring mecha-
nism of the rocking block originates from gravity. Figure 1.1 (bottom) shows the force-
displacement and moment-rotation relations of the two elementary structures of interest. Some of
the fundamental differences in the mechanical structure of these two systems become apparent.
The SDOF oscillator has a positive and finite stiffness, k, and energy is dissipated as the force-
displacement curve forms closed loops. In contrast, the rocking block has infinite stiffness until
the magnitude of the applied moment reaches mgRsinα, and once the block is rocking, its stiff-
ness assumes a negative value and decreases monotonically, reaching zero when θ=α=block
slenderness.

3 Review of the Earthquake Response ofViscously Damped Oscillator
The dynamic equilibrium of the mass, m, shown at the top left of Figure 1.1 gives
where c and k are the damping and stiffness constants, and üg is the ground-induced horizontal
acceleration. Using the standard notation k=mωo2 and c=2ξmωo, where ωo=2π/To is the un-
damped natural frequency, and ξ is the damping ratio, Equation (3.1) becomes
Equation (3.1), or (3.2), and its solution have been treated in several books of structural dynam-
ics (Chopra 2000, Clough and Penzien 1993, among others). Alternatively, the solution of
Equation (3-2) can be computed with a state-space formulation, where the state vector of the
system is merely
and the time derivative vector is
)()()()( tumtkutuctum g&&&&& −=++
)()()(2)( 2 tutututu goo &&&&& −=++ ωξω
{ }
=)(
)()(
tu
tuty
&
{ }
−−−=
)()()(2
)()( 2 tututu
tutf
goo &&&
&
ωξω
(3.1)
(3.2)
(3.3)
(3.4)

8
The integration of Equation (3.2), or (3.4), yields the earthquake response of the SDOF oscilla-
tor. Traditionally, it has been presented in terms of response maxima as a function of the
fundamental period of the oscillator, To =2π/ωo, and the damping ratio, ξ=c/(2mωο).
Figure 5.1 (left) plots the true displacement, velocity, and acceleration spectra of the
linear, viscously damped oscillator for values of damping ξ=5%, 10%, and 15%, subjected to the
fault-normal component of the Pacoima Dam motion recorded during the 1971 San Fernando
earthquake. The bottom-left graph also shows the ξ=5% UBC97 (type-D soil is assumed for all
UBC spectra in this report) and FEMA 356 acceleration design spectra tailored for the specific
site. Table 3.1 shows the parameters used to construct the FEMA 356 design acceleration spectra
for the U.S. ground motions appearing in this study. The reference acceleration values of Sxs and
Sx1 that define the shape of the design spectrum are obtained by modifying the mapped Ss and S1
values for the appropriate site class.
Table 3.1 Parameters Used to Construct the FEMA Design Acceleration Spectra
Ground MotionSite
Class Sxs (g) Sx1 (g)
San Fernando, 1971Pacoima Dam
B 1.59 0.50
Imperial Valley, 1979El Centro #5
D 1.34 0.81
Loma Prieta, 1989Los Gatos
D 1.94 1.83
Northridge, 1994Rinaldi FN
C 1.56 0.69
Northridge, 1994Sylmar FN
D 1.56 0.80

9
The FEMA design displacement spectra shown in the top-left graphs of Figures 5.1 to 5.5 are
computed with the design formula
as recommended in Chapter 4, Foundations and Geologic Site Hazards, of the FEMA 356
document. Clearly, the spectral displacement values resulting from Equation (3.5) do not con-
verge at long periods to the actual peak ground displacements. In contrast, the true displacement
spectra shown in the top left of Figure 5.1 initially increase with the structural period and even-
tually converge to the peak ground displacement. Similar trends are observed in Figures 5.2 to
5.7 that plot true response spectra for other major historic earthquakes.
2
2
4πo
ad
TgSS = (3.5)

4 Review of the Rocking Response of aRigid Block
We consider the rigid block shown on the right of Figure 1.1. The block can pivot about the
centers of rotation O and O′ when it is set to rocking. Depending on the level and form of the
ground acceleration, the block may translate with the ground, slide, rock, or slide-rock. Before
1996, the mode of rigid body motion that prevailed was determined by comparing the available
static friction to the width-to-height ratio of the block, irrespective of the magnitude of the
horizontal ground acceleration. Shenton (1996) indicated that in addition to pure sliding and pure
rocking, there is a slide-rock mode, and its manifestation depends not only on the width-to-height
ratio and the static friction coefficient, but also on the magnitude of the base acceleration.
Assuming that the coefficient of friction is large enough so that there is no sliding, under
a positive horizontal acceleration that is sufficiently large, a rigid block will initially rotate with a
negative rotation, 0<θ , and, if it does not overturn, it will eventually assume a positive rotation;
and so on.
The equations that govern the rocking motion under a horizontal ground acceleration üg(t)
are
and
0,)cos()()sin()( <−−−=−−+ θθαθαθ RtummgRtI go &&
&&
0,)cos()()sin()( >−−=−+ θθαθαθ RtummgRtI go &&
&&
(4.1)
(4.2)

12
where Io is the moment of inertia of the rigid block. Equations (4.1) and (4.2) are well known in
the literature (Yim et al. 1980, Makris and Roussos 2000, among others) and are valid for
arbitrary values of the angle α=tan-1(b/h). For rectangular blocks, 234 mRIo = , Equations (4.1)
and (4.2) can be expressed in the compact form
where ( )Rgp 43= is the frequency parameter of a rectangular block. The larger the block
(larger R), the smaller p. The vibration frequency of a rigid block under free vibration is not
constant since it depends on the vibration amplitude (Housner 1963). Nevertheless, when two
geometrically similar blocks (same α) of different size (different p) experience free vibrations
with the same initial conditions, oθ and 0=oθ& , each response-cycle of the larger block (smaller
p) is longer than the corresponding response-cycle of the smaller block (larger p). Accordingly,
the quantity p is a measure of the dynamic characteristic of the block. It depends on the size of
the block, R, and the intensity of the gravitational field, g. The solution of Equation (4.3) is
obtained numerically via a state-space formulation where the state vector of the system is
and the time-derivative vector f(t) is
The numerical integration of (4.5) and (3.4) is performed with standard ODE solvers available in
MATLAB (1999). The solution of (4.5) is constructed by accounting for the energy loss at every
impact. When the angle of rotation reverses, it is assumed that the rotation continues smoothly
[ ][ ] [ ][ ]
−+−−= )()(sgncos)()(sgnsin)( 2 ttg
uttpt g θθαθθαθ
&&
&&
{ }
=)(
)()(
t
tty
θθ&
{ } { } [ ][ ] [ ][ ]
−+−−==)()(sgncos)()(sgnsin
)()()( 2 tt
g
uttp
ttytf g θθαθθα
θ&&
&
&
(4.3)
(4.4)
(4.5)

13
from point O to O′. Conservation of momentum about point O′ just before the impact and
immediately after the impact gives (Housner 1963)
where 1θ& is the angular velocity just prior to the impact, and 2θ& is the angular velocity right after
the impact. The ratio of the kinetic energy after and before the impact is
which means that the angular velocity after the impact is only r times the velocity before the
impact. Substitution of (4.7) into (4.6) gives
The value of the coefficient of restitution given by (4.8) is the maximum value of r under which
a block with slenderness α will undergo rocking motion. Consequently, in order to observe
rocking motion, the impact has to be inelastic. The less slender a block (larger α), the more
energy has to be lost during impact in order to observe rocking motion. Therefore, the slender-
ness of a rocking block is a measure of the minimum damping of the system.
The integration of (4.5) in association with the constraint expressed by (4.6) yields time
histories of the rotation and angular velocities. Figure 4.1 shows the computed rotation and
angular velocity histories of a rigid block with frequency parameter p=2.0 rad/sec (2π/p=3.14
sec) and slenderness α=15ο [h=1.78m (70”), b=0.48m (18.76”), r=0.81] subjected to three
different levels of a 2-sec-long one-cosine (Type-B) pulse (Makris and Roussos 2000).
(4.9)
211 sin2 θαθθ &&
oo IbRmI =−
21
22
θθ&
&
=r
22 )(sin
2
31
−= αr
(4.6)
(4.7)
(4.8)
,0),cos()( pppg Tttatu ≤≤= ω&&

14
where ppT ωπ /2= is the period and duration of the pulse. The left column of Figure 4.1 shows
the block response when ap=0.310g. Following the expiration of the pulse, the block experiences
more than 20 impacts within the 8 subsequent seconds. The center column of Figure 4.1 shows
the block response on the verge of overturning. Note that just a 1.6% increase in the acceleration
amplitude of the excitation pulse alters drastically the response that exhibits only 7 impacts
within the 8 subsequent seconds. The right column of Figure 4.1 shows the block response when
it overturns, which happens for an acceleration amplitude ap=0.316g. Note that when the block
does not overturn (left and center columns), the frequency of vibration during the free-vibration
regime increases as the rotation amplitude decreases.
Figure 4.2 shows the rotation and angular velocity histories of a rigid block with fre-
quency parameter p=1.0 rad/sec (2π/p=6.28 sec) and slenderness α=15ο—that is the same as the
slenderness of the smaller block of Figure 4.1—subjected to three levels of a 2-sec-long one-
cosine pulse. The amplitude of the excitation pulse in the first column, ap=0.410g is tuned so that
the peak rotation of the larger block (p=1.0 rad/sec) after the expiration of the pulse is θ/α=0.38,
which is equal to the peak rotation of the smaller block (p=2.0 rad/sec—see Figure 4.1) that
happens after the expiration of the 2-sec-long pulse. In comparing Figures 4.1 and 4.2, one
observes that while the two different size blocks with same slenderness α=15ο experience free
vibrations with the same initial conditions (θ/α=0.38, 0=θ& ), each vibration period of the larger
block (p=1.0 rad/sec) is longer than the corresponding vibration period of the smaller block. The
center and right columns of Figure 4.2 plot the response of the large block on the verge of
overturning.

15
01
23
45
67
89
10−
0.50
0.5
Ground Acceleration (g)a p=
0.31
0g
01
23
45
67
89
10−
0.50
0.5
Ground Acceleration (g)
a p=0.
315g
01
23
45
67
89
10−
0.50
0.5
Ground Acceleration (g)
a p=0.
316g
01
23
45
67
89
10−
1
−0.
50
0.51
θ/α
01
23
45
67
89
10−
0.50
0.5
θ/p
Tim
e (s
ec)
01
23
45
67
89
10−
1
−0.
50
0.51
θ/α
01
23
45
67
89
10−
0.50
0.5
θ/p
Tim
e (s
ec)
01
23
45
67
89
10−
1
−0.
50
0.51
θ/α
01
23
45
67
89
10−
0.50
0.5
θ/p
Tim
e (s
ec)
1.80
1.32
−0.
38
Fig
ure
4.1
Roc
king
resp
onse
ofri
gid
bloc
k:p=
2.0
rad/
sec,α
=15
o[h
=1.
77m
,b=
0.48
m,
R=
1.84
m,
r=0.
81],
subj
ecte
dto
Typ
e-B
puls
ew
ithT
p=
2se
c.
..
.

16
01
23
45
67
89
10−
1
−0.
50
0.51
Ground Acceleration (g)a p=
0.41
0g
01
23
45
67
89
10−
1
−0.
50
0.51
Ground Acceleration (g)
a p=0.
531g
01
23
45
67
89
10−
1
−0.
50
0.51
Ground Acceleration (g)
a p=0.
532g
01
23
45
67
89
10−
1
−0.
50
0.51
θ/α
01
23
45
67
89
10−
0.50
0.5
θ/p
Tim
e (s
ec)
01
23
45
67
89
10−
1
−0.
50
0.51
θ/α
01
23
45
67
89
10−
0.50
0.5
θ/p
Tim
e (s
ec)
01
23
45
67
89
10−
1
−0.
50
0.51
θ/α
01
23
45
67
89
10−
0.50
0.5
θ/p
Tim
e (s
ec)
3.55
2.62
−0.
38
Fig
ure
4.2
Roc
king
resp
onse
ofri
gid
bloc
k:p=
1.0
rad/
sec,α
=15
o[h
=7.
11m
,b=
1.90
m,R
=7.
35m
,r=
0.81
m],
subj
ecte
dto
Typ
e-B
puls
ew
ithT
p=2
sec.
..
.

5 Rocking Spectra
Parallel to the response spectra, one can generate rotation and angular velocity spectra (rocking
spectra) as a function of the “period” T=2π/p and different values of slenderness (damping),
)(tan 1 hb−=α . The minimum ground acceleration needed to initiate rocking can be computed
from static analysis, which yields that )tan(α≥gug&& . Table 5.1 offers the peak ground accelera-
tion (PGA) of the strong-motion records used in this study together with the values of tan(α) for
the range of slenderness that is of interest. For instance, the El Centro Array #5 record with
PGA/g=0.379 can barely induce uplift to a block with slenderness α=20ο (tan(α)=0.364); how-
ever, it will not be able to uplift a block with α=21ο since go /PGA379.0384.0)21tan( =>= .
Next to the peak ground accelerations, Table 5.1 offers the peak ground velocities of the ground
motions together with the duration of main pulses that can be identified within most of these
main near-source ground motions (Makris and Roussos 2000). These kinematic characteristics of
the ground are used later in this section where observations from response spectra and rocking
spectra are discussed.
The right side of Figures 5.1 to 5.7 plots rotation and angular velocity spectra next to the
displacement and velocity spectra presented earlier. As 2π/p increases, one moves to larger
blocks. Larger values of the slenderness α correspond to larger amount of energy lost during
impact. The most striking observation is that the displacements of oscillating structures, increase

18
as the natural period To=2π/ωο increases, reach a maximum, and subsequently converge to the
ground displacement; whereas the rotations of rocking structures decrease nearly monotonically
as their apparent “period” T=2π/p increases. This known behavior—that larger blocks (longer-
period structures) experience smaller rotations than smaller blocks (Housner 1963)—has not
been adopted by the profession to the extent that it deserves. For instance, in many occasions
there have been attempts to estimate the response of rocking structures by borrowing results from
the response of oscillating structures and their associated displacement response spectra that
amplify along certain period ranges with a pattern that is drastically different from the pattern
Table 5.1 Peak Ground Accelerations (PGA), Peak Ground Velocities (PGV) and ApproximateMain Pulse Periods of Selected Earthquake Motions Next to Values of Block-Slenderness of Interest.
Ground Motion PGA/gPGV
(m/sec)
ApproximateValue of Main
Pulse Period, Tp
(sec)
Slenderness (α) tan(α)
San Fernando, 1971Pacoima Dam 1.226 1.20 1.3 10ο=0.175rad 0.176
Imperial Valley, 1979El Centro #5 0.379 0.90 3.2 12ο=0.209rad 0.212
Loma Prieta, 1989Los Gatos
0.563 0.95 3.0 15ο=0.262rad 0.268
Northridge, 1994Rinaldi FN
0.838 1.75 1.0 17ο=0.175rad 0.306
Northridge, 1994Sylmar FN
0.732 1.20 2.3 20ο=0.349rad 0.364
Turkey, 1992Erzinkan 0.515 0.70 1.8 22ο=0.384rad 0.404
Kobe, 1995Takatori 0.611 1.25 - 25ο=0.436rad 0.466

19
that rotation spectra follow. In addition to the different trends observed in the spectra of the
SDOF oscillator and the rocking block, Table 5.2 summarizes selective characteristics and
parameters that emerge from the two systems of interest and identifies some of the fundamental
differences in their dynamical structure. In view of these inherent differences, any analogy
between the responses of the two systems tends to be superficial.
Table 5.2 Selective Characteristics and Parameters of the Two One-Degree-of-Freedom Systems of Interest.
PARAMETERS/ Damped Oscillator Rocking Rigid BlockCHARACTERISTICS m, c, k b, h, g
Restoring MechanismElasticity of the
structure Gravity
Restoring force/momentkuF =
(for linear springs) 22
)sin(
hbR
mgRM
+=
−= θα
Stiffness at stableequilibrium
Finite Infinite
Restoring force/momentat stable equilibrium
Zero Finite: )sin(αmgR
Stiffness awayfrom equilibrium
Positive Negative
Frequency parameter
Undamped naturalfrequency:
m
k
Too == πω 2
Frequency Parameter:
R
gp
4
3=
(for rectangular blocks)
Damping Parameter
Viscous dampingratio:
om
c
ωξ
2=
Slenderness:)/(tan 1 hb−=α

20
Response Spectra Rocking Spectra
0
0.2
0.4
0.6
0.8
1
0 1 2 3 4 5 6 7 8
To=2π/ωo (sec)
Dis
plac
emen
t(m
)
FEMA356ξ=5%
0.0
0.5
1.0
1.5
2.0
2.5
0 1 2 3 4 5 6 7 8
To=2π/ωo (sec)
Vel
ocity
(m/s
ec)
ξ=5%
ξ=15%
0
0.5
1
1.5
2
2.5
3
3.5
0 1 2 3 4 5 6 7 8
To=2π/ωo (sec)
Tot
alA
ccel
erat
ion
(g)
UBC97
FEMA356
ξ=5%ξ=10%ξ=15%
Time Histrory
-1.2
-1
-0.8
-0.6
-0.4
-0.2
0
0.2
0.4
0.6
0.8
1
1.2
1.4
0 5 10 15
Time (seconds)
Gro
und
Acc
eler
atio
n(g
)
0
0.1
0.2
0.3
0.4
0 1 2 3 4 5 6 7 8
2π/p (sec)
θ(r
ad)
α=10deg=0.175rad
α=15deg=0.262rad
α=20deg=0.349rad
α=10ο
0
0.1
0.2
0.3
0.4
0.5
0.6
0.7
0.8
0.9
1
0 1 2 3 4 5 6 7 8
2π/p (sec)
θ(r
ad/s
ec)
ξ=5%
ξ=15%
Figure 5.1 True response spectra of a linear viscously damped oscillator (left) and rocking spectra of arigid slender block (right) when subjected to the Pacoima Dam motion recorded during the 1971 SanFernando Earthquake.
.

21
Response Spectra Rocking Spectra
0
0.5
1
1.5
0 1 2 3 4 5 6 7 8To=2π/ωo (sec)
Dis
plac
emen
t(m
)
FEMA356ξ=5%
ξ=10%
0.0
0.5
1.0
1.5
2.0
2.5
0 1 2 3 4 5 6 7 8To=2π/ωo (sec)
Vel
ocity
(m/s
ec)
ξ=5%
ξ=15%
0
0.2
0.4
0.6
0.8
1
1.2
1.4
1.6
0 1 2 3 4 5 6 7 8
To=2π/ωo (sec)
Tot
alA
ccel
erat
ion
(g)
UBC97FEMA356
ξ=5%ξ=10%ξ=15%
Time Histrory
-0.5
-0.4
-0.3
-0.2
-0.1
0
0.1
0.2
0.3
0.4
0.5
0 5 10 15 20
Time (seconds)
Gro
und
Acc
eler
atio
n(g
)
0
0.1
0.2
0.3
0.4
0 1 2 3 4 5 6 7 82π/p (sec)
θ(r
ad)
α=10deg=0.175rad
α=15deg=0.262rad
α=20deg=0.349rad
0
0.1
0.2
0.3
0.4
0.5
0.6
0.7
0.8
0.9
1
0 1 2 3 4 5 6 7 82π/p (sec)
θ(r
ad/s
ec)
ξ=5%
ξ=15%
α=10ο
Figure 5.2 True response spectra of a linear viscously damped oscillator (left) and rocking spectra of arigid slender block (right) when subjected to the FN component of the Array #5 motion recorded duringthe 1979 Imperial Valley earthquake.
.

22
Response Spectra Rocking Spectra
0
0.5
1
1.5
0 1 2 3 4 5 6 7 8To=2π/ωo (sec)
Dis
plac
emen
t(m
)
ξ=10%
0.0
0.5
1.0
1.5
2.0
2.5
3.0
0 1 2 3 4 5 6 7 8
To=2π/ωo (sec)
Vel
ocity
(m/s
ec)
ξ=5%
ξ=15%
ξ=10%
0
0.5
1
1.5
2
2.5
0 1 2 3 4 5 6 7 8To=2π/ωo (sec)
Tot
alA
ccel
erat
ion
(g)
UBC97FEMA356
ξ=5%ξ=10%ξ=15%
Time Histrory
-0.8
-0.6
-0.4
-0.2
0
0.2
0.4
0.6
0.8
0 5 10 15 20
Time (seconds)
Gro
und
Acc
eler
atio
n(g
)
0
0.1
0.2
0.3
0.4
0 1 2 3 4 5 6 7 8
2π/p (sec)
θ(r
ad)
α=10deg=0.175rad
α=15deg=0.262rad
α=20deg=0.349rad
α=10ο
0
0.1
0.2
0.3
0.4
0.5
0.6
0.7
0.8
0.9
1
1.1
1.2
0 1 2 3 4 5 6 7 8
2π/p (sec)
θ(r
ad/s
ec)
ξ=5%
ξ=15%
Figure 5.3 True response spectra of a linear viscously damped oscillator (left) and rocking spectra of arigid slender block (right) when subjected to the Los Gatos motion recorded during the 1989 LomaPrieta earthquake.
FEMA356ξ=5%
.

23
Response Spectra Rocking Spectra
0
0.2
0.4
0.6
0.8
1
0 1 2 3 4 5 6 7 8
To=2π/ωo (sec)
Dis
plac
emen
t(m
)
FEMA356ξ=5%
0.0
0.5
1.0
1.5
2.0
2.5
3.0
3.5
0 1 2 3 4 5 6 7 8
To=2π/ωo (sec)
Vel
ocity
(m/s
ec) ξ=5%
ξ=15%
0
0.5
1
1.5
2
2.5
0 1 2 3 4 5 6 7 8
To=2π/ωo (sec)
Tot
alA
ccel
erat
ion
(g)
UBC97
FEMA356
ξ=5%ξ=10%ξ=15%
Time Histrory
-1
-0.8
-0.6
-0.4
-0.2
0
0.2
0.4
0.6
0.8
1
0 5 10 15
Time (seconds)
Gro
und
Acc
eler
atio
n(g
)
0
0.1
0.2
0.3
0.4
0 1 2 3 4 5 6 7 8
2π/p (sec)
θ(r
ad)
α=10deg=0.175rad
α=15deg=0.262rad
α=20deg=0.349rad
α=10ο
0
0.1
0.2
0.3
0.4
0.5
0.6
0.7
0.8
0.9
1
0 1 2 3 4 5 6 7 8
2π/p (sec)
θ(r
ad/s
ec)
ξ=5%
ξ=15%
Figure 5.4 True response spectra of a linear viscously damped oscillator (left) and rocking spectra of arigid slender block (right) when subjected to the Rinaldi motion recorded during the 1994 Northridgeearthquake.
.
24
Response Spectra Rocking Spectra
0
0.2
0.4
0.6
0.8
1
0 1 2 3 4 5 6 7 8
To=2π/ωo (sec)
Dis
plac
emen
t(m
) ξ=10%FEMA356ξ=5%
0.0
0.5
1.0
1.5
2.0
2.5
3.0
0 1 2 3 4 5 6 7 8
To=2π/ωo (sec)
Vel
ocity
(m/s
ec)
ξ=5%
ξ=15%
0
0.5
1
1.5
2
2.5
0 1 2 3 4 5 6 7 8
To=2π/ωo (sec)
Tot
alA
ccel
erat
ion
(g)
UBC97
FEMA356
ξ=5%ξ=10%ξ=15%
Time Histrory
-0.8
-0.6
-0.4
-0.2
0
0.2
0.4
0.6
0.8
0 5 10 15
Time (seconds)
Gro
und
Acc
eler
atio
n(g
)
0
0.1
0.2
0.3
0.4
0 1 2 3 4 5 6 7 8
2π/p (sec)
θ(r
ad)
α=10deg=0.175rad
α=15deg=0.262rad
α=20deg=0.349rad
α=10ο
0
0.1
0.2
0.3
0.4
0.5
0.6
0.7
0.8
0.9
1
0 1 2 3 4 5 6 7 82π/p (sec)
θ(r
ad/s
ec)
ξ=5%
ξ=15%
Figure 5.5 True response spectra of a linear viscously damped oscillator (left) and rocking spectra of arigid slender block (right) when subjected to the Sylmar motion recorded during the 1994 Northridgeearthquake.
.

25
Response Spectra Rocking Spectra
0
0.1
0.2
0.3
0.4
0.5
0.6
0.7
0.8
0 1 2 3 4 5 6 7 8
To=2π/ωo (sec)
Dis
plac
emen
t(m
) ξ=10%
0.0
0.5
1.0
1.5
2.0
2.5
0 1 2 3 4 5 6 7 8
To=2π/ωo (sec)
Vel
ocity
(m/s
ec)
ξ=5%
ξ=15%
ξ=10%
0
0.2
0.4
0.6
0.8
1
1.2
1.4
0 1 2 3 4 5 6 7 8
To=2π/ωo (sec)
Tot
alA
ccle
ratio
n(g
)
UBC97
ξ=5%ξ=10%ξ=15%
Time Histrory
-0.3
-0.2
-0.1
0
0.1
0.2
0.3
0.4
0.5
0.6
0 5 10 15
Time (sec)
Gro
und
Acc
eler
atio
n(g
)
0
0.1
0.2
0.3
0.4
0 1 2 3 4 5 6 7 8
2π/p (sec)
θ(r
ad)
α=10deg=0.175rad
α=15deg=0.262rad
α=20deg=0.349rad
α=10ο
0
0.1
0.2
0.3
0.4
0.5
0.6
0.7
0.8
0.9
1
0 1 2 3 4 5 6 7 8
2π/p (sec)
θ(r
ad/s
ec)
ξ=5%
ξ=15%
Figure 5.6 True response spectra of a linear viscously damped oscillator (left) and rocking spectra of arigid slender block (right) when subjected to 1992 Erzinkan, Turkey, earthquake.
.

26
Response Spectra Rocking Spectra
0
0.2
0.4
0.6
0.8
1
1.2
0 1 2 3 4 5 6 7 8
To=2π/ωo (sec)
Dis
plac
emen
t(m
)
ξ=10%
0.0
0.5
1.0
1.5
2.0
2.5
3.0
3.5
4.0
0 1 2 3 4 5 6 7 8
To=2π/ωo (sec)
Vel
ocity
(m/s
ec)
ξ=5%
ξ=15%
0
0.5
1
1.5
2
2.5
0 1 2 3 4 5 6 7 8
To=2π/ωo (sec)
Tot
alA
ccel
erat
ion
(g)
UBC97
ξ=5%ξ=10%ξ=15%
Time Histrory
-0.8
-0.6
-0.4
-0.2
0
0.2
0.4
0.6
0.8
0 5 10 15 20
Time (seconds)
Gro
und
Acc
eler
atio
n(g
)
0
0.1
0.2
0.3
0.4
0 1 2 3 4 5 6 7 8
2π/p (sec)
θ(r
ad)
α=10deg=0.175rad
α=15deg=0.262rad
α=20deg =0.349rad
α=10ο
0
0.1
0.2
0.3
0.4
0.5
0.6
0.7
0.8
0.9
1
0 1 2 3 4 5 6 7 8
2π/p (sec)
θ(r
ad/s
ec)
ξ=5%
ξ=15%
Figure 5.7 True response spectra of a linear viscously damped oscillator (left) and rocking spectra of arigid slender block (right) when subjected to the Takatori motion recorded during the 1995 Kobe,Japan, earthquake.
.

6 A New Measure of Earthquake Shaking
Before examining the shortcomings that result from the superficial analogy between the response
of a SDOF structure and a rocking block, this section elaborates on some interesting observations
which indicate that the rocking spectra can be used as a supplemental measure of earthquake
shaking which complements the valuable information that one draws from the response spectra.
Figure 5.1 (right) indicates that any block with slenderness α=10ο that is small enough so
that 2π/p<4 [R<2.98m (117.3”)] will overturn when subjected to the Pacoima Dam record. Less
slender blocks experience smaller rotations and are in principle more stable. For instance, a block
with slenderness α=20ο will survive the Pacoima Dam record even if it is as small as 2π/p=2
[R=0.74m (29.3”)]. Larger blocks, say 2π/p>6 [R>6.71m (264.0”)], will uplift, but the maxi-
mum rotation is only a fraction of their slenderness, α, even for the strong ground motions with
PGA/g more than four times the slenderness of a block with α=15ο (See Table 5.1). Figure 5.2
(right) shows rocking spectra from the fault-normal component of the Array #5 motion recorded
during the 1979 Imperial Valley earthquake that has a PGA/g 0.379, which is slightly larger than
the value of tan(20o)=0.364.
When comparing the response and rocking spectra shown in Figures 5.1 and 5.2, one can
make several interesting observations in conjunction with the kinematic characteristics of the
ground motions offered in Table 5.1. Indeed the rotations induced by the Array #5 record to
blocks with slenderness α=20ο are minimal (close to zero) whereas the rotations induced by the

28
Pacoima Dam record (more than three times larger PGA) to blocks with α=20ο are appreciable
(in particular for 2π/p < 6).
The rotations induced by the Array #5 record to blocks with slenderness α=15ο are
comparable to the rotations induced to the same blocks by the Pacoima Dam record; smaller
blocks ( 326.2 ≤≤ pπ ) survive the more “gentle” Array #5 record yet topple from the more
“violent” Pacoima Dam record. When observing the response of blocks with slenderness α=10ο,
the situation reverses. The Array #5 record topples every block with 2π/p < 6.5, while blocks
with α=10ο are much more stable when subjected to the Pacoima Dam record, as every block
with 2π/p > 4 survives the motion. The reason that the Array #5 record is more capable than the
Pacoima Dam record to overturn slender blocks is because it contains a 3.2-sec-long type-B
pulse. The significance of the duration of a long pulse in achieving overturning in association
with its acceleration intensity has been discussed in depth by Makris and Roussos (2000) and
Zhang and Makris (2001).
Recent studies on the shaking potential of near-source ground motions have proposed that
a better indicator of the destructiveness of an earthquake might be the peak ground velocity
(PGV) of the record. However, in this case, the peak ground velocity alone cannot elucidate the
problem, as the Pacoima Dam record results to a higher PGV than the Array #5 record. The
earthquake response of rigid blocks and its nonuniform character have been recently investigated
in depth by Makris and Roussos (2000), who showed that the response of different blocks is
more sensitive to the kinematic characteristics of distinct, yet different, pulses within the excita-
tion history. In particular, a dependable indicator of the overturning potential of a ground motion
is the “incremental ground velocity” (Bertero et al. 1978—that is the net increment of the ground

29
velocity along a monotonic segment of its time history) in association with the duration of the
local distinguishable pulse.
The response spectra of the Pacoima Dam record and the Array #5 record also exhibit
noticeable differences but of a different nature. For instance, up to sec7.1≈oT , the Pacoima
Dam record results to higher spectral displacements than the Array #5 record. However, at
To=4sec, the Array #5 record results to spectral displacements more than two times the spectral
displacements that result from the Pacoima Dam record. Nevertheless, this behavior is uniform
for all three values of damping, ξ=5%, 10%, and 15%, contrary to the case of rocking spectra for
which the behavior is nonuniform for different values of slenderness (damping).
Figure 5.3 (right) shows the rocking spectra for the Los Gatos motion, recorded during
the 1989 Loma Prieta earthquake. The interesting element of these spectra is that they show
isolated examples where (a) a small block can survive the motion that overturns a larger block
(see spectra for α=10ο) and (b) a more slender block can survive the motion that overturns a less
slender block (see where spectra for α=15ο and α=20ο cross).
Figures 5.4 and 5.5 reveal similar trends to those observed and discussed in Figures 5.1
and 5.2. For instance, the α=20ο rotation spectrum of the Rinaldi record (Figure 5.4) exceeds the
α=20ο rotation spectrum of the Sylmar record (Figure 5.5), whereas the α=10ο rotation spectrum
of the Rinaldi record yields smaller values and is more stable than the α=10ο rotation spectrum of
the Sylmar record.
Another interesting observation in the spectra of the Sylmar record is that while the
displacement spectra for different values of damping ratio show minor differences beyond To=4
sec, the rotation spectra show dramatic differences even for values of 2π/p=8 sec. This trend is
also observed with nearly identical pattern in Figure 5.6, which shows the response and rocking

30
spectra of the 1992 Erzinkan, Turkey, earthquake. In contrast, the rotation spectra of the Takatori
motion, 1995 Kobe, Japan (Figure 5.7), show relatively small differences beyond the value of
2π/p=5 sec. In conclusion, this section highlights the following two observations which uncover
major differences in the trends of the response and rocking spectra:
(a) When for a prescribed value of viscous damping, a response spectrum of a given
earthquake exceeds the response spectrum of another earthquake, the same will hap-
pen (with few local exceptions) for a different value of viscous damping. Contrarily,
when for a prescribed slenderness, the rocking spectrum of a given earthquake exceeds
the rocking spectrum of another earthquake, it is not guaranteed that the same will
happen for a slightly different value of the slenderness.
(b) There are period ranges where the values of the displacement spectra are nearly insen-
sitive to the value of viscous damping ratio ξ. However, the rotation (uplift) spectra
are very sensitive to the value of slenderness α throughout the 2π/p range.
The abovementioned differences have been the main motivation for proposing the use of
the rocking spectrum as a complementary tool to the response spectrum in order to quantify the
shaking potential of a ground motion.

7 Free Vibrations of Rocking Block
The rocking motion of a rigid block is an inherently nonlinear problem. Nonlinearities emerge
from several sources and become dominant when the rotation of the block, θ, approaches or
exceeds its slenderness α. For instance, Makris and Zhang (1999) and Zhang and Makris (2001)
have shown that the overturning of a rigid block is a multivalued problem since a rigid block can
survive a ground acceleration that exceeds the first ground acceleration which is capable of
overturning it. This multivalued and nonlinear response exists even for very slender blocks, and
the abovementioned references have shown that there is a frequency range where equations (4.1)
and (4.2) cannot be linearized even for small values of the slenderness α.
During a free-vibration regime that does not result in toppling (say with initial conditions
θο<α and 0=oθ& ), the situation is simpler than during a forced-vibration regime, and the equa-
tions of rocking motion can be linearized with confidence for slender blocks (about o20≤α )
The linearized pair of equations given by (7.1) and (7.2) can be easily integrated analytically,
0)()( 22 >−=− θαθθ ptpt&& (7.2)
0)()( 22 <=− θαθθ ptpt&&
0)cosh()sinh()( 21 <−+= θαθ ptAptAt
0)cosh()sinh()( 43 >++= θαθ ptAptAt (7.4)
(7.3)
(7.1)

32
where A1 to A4 are integration constants that are determined at the initiation of each segment of
the response (Makris and Roussos 2000). The solution given by Equations (7.3) and (7.4) reveals
that the free-vibration response of the rocking block is described by hyperbolic sines and cosines
and not by harmonic (trigonometric) functions. This fundamental difference has been the moti-
vation to avoid the term “oscillations” for the free-vibration response of a rocking block in this
report.
The free-vibration response of the rocking block at its linear limit was investigated by
Housner (1963), who was able to derive a relation between the maximum rotation after the nth
impact, θn, and the initial rotation, θo,
where r is the coefficient of restitution given by (4.8). Equation (7.5) that relates the rotation
after m=n/2 cycles to the initial rotation θo, induces the temptation to relate its result with the so-
called logarithmic decrement of the amplitude of the mth cycle of a SDOF damped oscillator
Equation (7.6) for lightly damped systems becomes
after approximating 21 ξ− with one.
Priestley et al. (1978) noticed this resemblance—while downplaying the fundamental dif-
ferences in the mathematical structure of the response of the two systems (see Table 5.2 and
Equations 7.3 and 7.4)—and proposed that since there is an apparent correspondence between
−−−−=2
1111αθ
αθ onn r
21
2ln
ξπξ
−=
m
u
u
m
o
=
m
o
u
u
mln
21π
ξ
(7.5)
(7.6)
(7.7)

33
the displacement, u, of a SDOF oscillator and the rotation, θ, of a rocking block, one can define
an equivalent viscous damping ratio for the rocking block
since in m cycles the block has experienced n=2m impacts (see free-vibration response in
Figures 4.1 and 4.2 that happens after the expiration of the Type-B pulse). Replacing (7.5) into
(7.8) gives
Figure 7.1 plots the relation between the equivalent viscous damping ratio, β, and the co-
efficient of restitution, r, as results from Equation (7.9) for values of initial rotation θο/α=0.1 to
0.7 and for four values of the number of impacts, n=2, 4, 6, and 8. As Priestley et al. (1978)
indicated, this relation is comparatively insensitive to the initial rotation, θο/α , and number of
impacts, n, and an average relation between β and r can be proposed that is independent of θο/α
and n. An empirical equation that approximates this relation is
and its performance is shown with a heavy line in each quarter of Figure 7.1. The results of
Equation (7.10) are very close to the graphical relation shown in Figure 3 of the Priestley et al.
(1978) paper which indicates that values of the equivalent viscous damping ratio, β,will vary
=
n
o
n θθ
πβ ln
1
−−−−
=2
1111
1ln
1
αθα
θπ
βon
o
rn
(7.8)
(7.9)
)ln(34.0 r−=β (7.10)

34
from this relationship by less than 10% for values of 16for0.5/o ≤≤ nαθ . While the Priestley et
al. (1978) reasoning and the results shown in Figure 7.1 appear reasonable to the nonspecialist
engineer, attention is redirected to Figure 4.1 that illustrates the divergent nature of the hyper-
bolic functions appearing in the free-vibration response of the rocking block. The left column of
Figure 4.1 plots the rocking response when the acceleration amplitude of the 2-sec-long cosine
pulse is 0.310g. Note that after the excitation pulse expires (t=2 sec), the block experiences a
negative rotation that reaches a maximum of θ/α=0.38 and subsequently the block vibrations
decay. A slightly stronger excitation, ap=0.315g induces a much more pronounced negative
rotation that reaches a maximum of θ/α=0.86. Therefore, a 1.6% change in the excitation ampli-
tude results in approximately 125% change in the response. A minor further increase in the input
results in overturning (catastrophe). In contrast to Figure 4.1, Figure 7.2 illustrates the robust
behavior that is expressed by trigonometric functions. The left column of Figure 7.2 plots the
oscillatory response of a SDOF oscillator with ωο=p=2 rad/sec and %2.7)ln(34.0 =−= rξ
(where r is the coefficient of restitution that corresponds to α=15ο) when subjected to a type-B
pulse with ap=0.310g. Figure 7.2 (center and right) shows that small amplifications of the input
have a marginal effect on the response. This comparison shows from a different point of view
that the concept of representing the rocking block as a single-degree-of-freedom oscillator with
constant damping and amplitude-dependent period is inherently flawed.

35
n=2
051015202530
0.5
0.6
0.7
0.8
0.9
1r
β(%)
θο/α
=0.1
FE
MA
356
β=
0.4(
1-r
1/2
)
n=4
051015202530
0.5
0.6
0.7
0.8
0.9
1r
β(%)
θο/α
=0.
7
θο/α
=0.
1
β=
-0.3
4ln
(r)
FE
MA
356
β=
0.4(
1-r
1/2
)
n=6
051015202530
0.5
0.6
0.7
0.8
0.9
1r
β(%)
θο/α
=0.7
θο/α
=0.1
β=
-0.3
4ln
(r)
FE
MA
356
β=
0.4(
1-r
1/2
)
n=8
051015202530
0.5
0.6
0.7
0.8
0.9
1r
β(%)
θο/α
=0.
7
θο/α
=0.1
β=
-0.3
4ln
(r)
FE
MA
356
β=
0.4(
1-r
1/2
)
θο/α
=0.
7
β=
-0.3
4ln
(r)
Fig
ure
7.1
Equ
ival
entv
isco
usda
mpi
ng,β
,of
aro
ckin
gbl
ock
asre
sults
from
(a)
the
Prie
stle
yet
al.(
1978
)an
alog
y(E
quat
ion
7.9)
,(li
ght
soli
dlin
es);
(b)
the
empi
rica
lEqu
atio
n(7
.10)
,(he
avy
solid
lines
);an
d(c
)th
eFE
MA
356
form
ula,
(das
hed
line
).

36
01
23
45
67
89
10−
0.50
0.5
Ground Acceleration (g)a p=
0.31
0g
01
23
45
67
89
10−
0.50
0.5
Ground Acceleration (g)
a p=0.
315g
01
23
45
67
89
10−
0.50
0.5
Ground Acceleration (g)
a p=0.
320g
01
23
45
67
89
10−
1
−0.
50
0.51
u (m)
01
23
45
67
89
10−
2
−1012
v (m/sec)
Tim
e (s
ec)
01
23
45
67
89
10−
1
−0.
50
0.51
u (m)
01
23
45
67
89
10−
2
−1012
v (m/sec)
Tim
e (s
ec)
01
23
45
67
89
10−
1
−0.
50
0.51
u (m)
01
23
45
67
89
10−
2
−1012
v (m/sec)
Tim
e (s
ec)
Fig
ure
7.2
Res
pons
eof
SDO
Fos
cilla
tor:ω
o=2.
0ra
d/se
c,%2.7
)81.0
ln(
34.0=
−=
ξ,s
ubje
cted
toT
ype-
Bpu
lse
with
Tp=
2se
c.

8 Estimation of Uplift Using theResponse Spectra
The availability of design response spectra in association with observations from strong earth-
quakes motivated Priestley et al. (1978) to propose a relatively simple procedure to estimate
structural displacements that originate from rocking (uplift). It includes the following steps:
(1) Establish that the ground acceleration is strong enough to induce rocking.
(2) Using Equation (7.5) or the graphs of Figure 7.1, estimate the equivalent viscous damp-
ing ratio, ξ=β, οf the rocking structure.
(3) Estimate an initial rotation θi and compute the amplitude-dependent period of the rocking
block from the formula derived by Housner (1963),
(4) From a displacement response spectrum (or even a displacement design spectrum) con-
structed for the value of the equivalent damping ratio estimated in step (2), read the
displacement, δi, of the equivalent SDOF oscillator with period T(θi).
(5) Compute the value of the new rotation,
−= −
αθθ
ii p
T1
1cosh
4)( 1 (8.1)
)cos(1 αδθ
Ri
i =+ (8.2)

38
(6) Compute the new local period T(θi+1) with Equation (8.1) and repeat steps (4) and (5) un-
til convergence results.
In this section, the abovementioned procedure is examined by comparing the converged
values of the rotations, θ, that result from the Priestley et al. (1978) design approach with the
exact rocking spectra presented in this report. We concentrate on blocks with slenderness α=10ο,
α=15ο and α=20ο. For these values, the equivalent viscous damping ratios according to Equation
(7.10) are β=ξ=3.15%, 7.20%, and 13.12%. Figures 8.1, 8.3, 8.4, 8.6, 8.8, 8.10, and 8.11 (left
columns), plot the response spectra of the seven earthquakes used in this study for the aforemen-
tioned values of viscous damping. The true displacement spectra shown in Figures 8.1, 8.3, 8.4,
8.6, 8.8, 8.10, and 8.11, are used to construct the uplift spectra for blocks with α=10ο, α=15ο, and
α=20ο, according to the Priestley et al. (1978) approximate method. These uplift spectra are
shown in the center column of the figures together with the exact rotation spectra. The third
column of Figures 8.1, 8.3, 8.4, 8.6, 8.8, 8.10, and 8.11, plots the values of the period T(θ) given
from Equation (8.1) when evaluated with the converged values of the rotations shown in the
center plots.
The center plot of Figure 8.1 indicates that for the Pacoima Dam record, the Priestley et
al. (1978) method is invariably overconservative, since (a) it predicts overturning of smaller
blocks that in reality survive the Pacoima Dam record and (b) it predicts substantially larger
rotations for larger blocks. As an example, a typical electrical transformer has a frequency
parameter p=2 rad/sec and a slenderness of α=20ο. According to the bottom-center plot, the
approximate method predicts a rotation of θ=0.25 rad whereas the exact solution gives θ=0.08
rad—that is less than three times smaller. As 2π/p increases, the predictions of the Priestley et al.
(1978) method become more dependable, in particular for slender blocks. Concentrating on the

39
top-right graph of Figure 8.1, the approximate method indicates that for 2π/p=6 sec and α=10ο,
the converged period of rocking is approximately T(θ)=5.7 sec, whereas for 2π/p=7 sec, the
converged period of rocking is T(θ)=6.6 sec. Figure 8.2 (left) plots the exact time histories of
blocks with size 2π/p=6 sec (middle left) and 2π/p=7 sec (bottom left) and slenderness α=10ο.
The rocking cycles have different durations, but the general trend is that larger blocks experience
smaller rotations with the corresponding cycles having smaller durations. For 2π/p=6 sec
(R=6.71 m), the maximum duration of one cycle is 5.25 sec, which is indeed close to the period
estimated by the approximate method (T(θ)=5.7 sec). For 2π/p=7 sec (R=9.12 m), the maximum
duration of one cycle is 3.61 sec; that is considerably smaller than the period estimated by the
approximate method (T(θ)=6.6 sec).
The Priestley et al. (1978) method is flawed because it attempts to compute rotations
))cos(()()( αδθ RTT o= by reading the )( oTδ values from the displacement spectrum that
shows a behavior totally different than that of the rotation spectrum. The fact that Equation (8.1)
converges at some value as )( oTδ gets updated has nothing to do with the actual duration of the
rocking cycles. For instance, for 2π/p=7 sec and α=20ο, the converged period shown in Figure
8.2 is approximately T(θ)=2.28 sec, whereas the maximum duration of one cycle from the exact
time history is 1.38 sec. According to the bottom-center plot, the approximate method predicts a
rotation of 0.05 rad, whereas the exact solution gives θ=0.015 rad.
Now, the reason that the approximate spectrum assumes decreasing values as 2π/p in-
creases is that a nearly constant spectral displacement (see values of spectral displacement in the
vicinity of To=3 sec) is divided by an increasing R (see Equation 8.2). This has nothing to do
with the mechanism of uplifting of a free-standing rigid block.

40
Figure 8.3 indicates that for the El Centro Array #5 record, the approximate method pre-
dicts with accuracy the rotations of large blocks with α=10ο, while it grossly overestimates the
rotations of blocks with α=15ο and α=20ο. A similar pattern is observed in Figure 8.4, which
compares the rotation spectra of the Los Gatos record. The time histories shown in Figure 8.5 in
association with the right column of Figure 8.4 offer additional evidence on the lack of correla-
tion between the converged period T(θ) and the actual duration of the rocking cycles.
Figure 8.6 shows that for the Rinaldi record, the approximate method of Priestley et al.
(1978) produces very good estimates of the rotations for all three values of α=10ο, 15ο, and 20ο.
This good agreement is partly due to the unique shaking strength and morphology of the Rinaldi
record. It exhibits a distinct one-second-long acceleration pulse with amplitude that reaches 0.9g.
Going back to Figure 5.4 (top right), one observes that the rotations of blocks with slenderness
α=10ο, 15ο, and 20ο, are crowded together in a pattern that is similar to the pattern followed by
the displacement response spectrum. Furthermore, because the main pulse that dominates the
response has a relative short duration (around 1 sec), the displacement response spectrum initi-
ates its descent relatively early so that the trend followed by the displacement spectra beyond
To=4 sec resembles the trend followed by the rocking spectrum beyond 2π/p=4 sec. It is because
of these unique yet accidental similarities between the response spectra and the rocking spectra
that the Priestley et al. (1978) method yields such remarkably good predictions of the block
rotations due to the Rinaldi motion. Figure 8.7 shows selective time histories of rocking blocks
and the durations of the main rocking cycles.
Figure 8.8 shows that for the Sylmar record, the approximate method is unconservative
for blocks with slenderness α=15ο and α=20ο. The right column of Figure 8.8 in association with
Figure 8.9 indicates that for α=10ο, the converged period of rocking is close to the actual dura-

41
tion of the main cycles of the rocking response. On the other hand, for α=15ο and α=20ο, the
converged periods of rocking are substantially larger than the actual durations of the main
rocking cycles. This observation confirms that the converged period computed from Equation
(8.1) has nothing to do with the actual durations of the rocking cycles due to earthquake shaking.
Figure 8.10 shows that for the 1992 Erzinkan, Turkey, earthquake, the predictions of the ap-
proximate method are poor, while Figure 8.11 shows that for the Takatori record (1995 Kobe,
Japan), the predictions of the approximate method are surprisingly good.

42
Res
pons
eSp
ectr
aU
plif
tSp
ectr
aC
onve
rged
Per
iod
0
0.2
0.4
0.6
0.81
1.2
01
23
45
67
8T
o=2π
/ωo
(sec
)
Displacement(m)
ξ=7.
20%
0.0
0.5
1.0
1.5
2.0
2.5
3.0
01
23
45
67
8
To=
2π/ω
o(s
ec)
Velocity(m/sec)
ξ=3.
15%
ξ=13
.12%
0
0.51
1.52
2.53
3.54
01
23
45
67
8T
o=2
π /ω
o(s
ec)
TotalAcceleration(g)
ξ=3.
15%
ξ=7.
20%
ξ=13
.12%
0
0.1
0.2
0.3
0.4
01
23
45
67
8
2π/p
(sec
)
θ(rad)
α=
10de
g=
0.17
5rad
α=
10de
g(P
rie
stle
yet
al.)
ξ=3.
15%
ξ=13
.12%
10ο
0
0.1
0.2
0.3
0.4
01
23
45
67
8
2π/p
(sec
)
θ(rad)α
=15
deg
=0.
262
rad
α=
15de
g(P
rie
stle
ye
tal
.)
0
0.1
0.2
0.3
0.4
01
23
45
67
82π
/p(s
ec)
θ(rad)
α=
20
deg
=0
.349
rad
α=
20
deg
(Pri
estle
ye
tal.)
20ο
15ο
0123456789
01
23
45
67
8
2π/p
(sec
)
T(sec)
α=1
0o
(Prie
stle
yet
al.)
012345678
01
23
45
67
8
2π/p
(sec
)
T(sec)
α=1
5o
(Prie
stle
yet
al.)
012345678
01
23
45
67
8
2π/p
(sec
)
T(sec)
α=
20o
(Prie
stle
yet
al.)
Fig
ure
8.1
Com
pari
son
ofex
acta
ndap
prox
imat
eup
lift
spec
tra
(cen
ter
colu
mn)
that
have
been
com
pute
dw
ith
the
Pri
estl
eyet
al.(
1978
)m
etho
dus
ing
the
true
disp
lace
men
tres
pons
esp
ectr
um(t
ople
ft).
The
conv
erge
dpe
riod
that
corr
espo
nds
toth
ees
tim
ated
upli
ftis
show
nin
the
righ
tco
lum
n.G
roun
dM
otio
n:P
acoi
ma
Dam
,197
1S
anF
erna
ndo.

43
05
1015
20
−1
−0.
50
0.51
Ground Acceleration (g)P
acoi
ma
Dam
, 197
1 S
an F
erna
ndo
05
1015
20−
1
−0.
50
0.51
θ/α
2π/p
=6,
α=
10o
02
46
810
−0.
50
0.5
θ/α
2π/p
=6,
α=
15o
02
46
8−
0.20
0.2
θ/α
2π/p
=6,
α=
20o
05
1015
20−
1
−0.
50
0.51
θ/α
2π/p
=7,
α=
10o
Tim
e (s
ec)
02
46
810
−0.
50
0.5
θ/α
2π/p
=7,
α=
15o
Tim
e (s
ec)
02
46
8−
0.20
0.2
θ/α
2π/p
=7,
α=
20o
Tim
e (s
ec)
02
46
810
−0.
50
0.5
θ/α
2π/p
=4,
α=
15o
02
46
8−
0.20
0.2
θ/α
2π/p
=4,
α=
20o
2.95
3.
81
5.25
4.
24
2.67
3.
00
3.61
2.
88
2.28
1.
38 1
.23
2.13
1.
77
2.11
1.
82
1.49
1.45
1.
02
1.39
0.
98
1.38
0.
97
Fig
ure
8.2
Sele
cted
time
hist
orie
san
ddu
ratio
nsof
rock
ing
cycl
esof
rigi
dbl
ocks
with
slen
dern
ess,α
=10ο
(lef
t),α
=15ο
(cen
ter)
,and
α=2
0ο(r
ight
)w
hen
subj
ecte
dto
the
Paco
ima
Dam
reco
rd.

44
Res
pons
eSp
ectr
aU
plif
tSp
ectr
aC
onve
rged
Per
iod
0
0.2
0.4
0.6
0.81
1.2
1.4
01
23
45
67
8
To=
2π/ω
o(s
ec)
Displacement(m)
ξ=7.
20%
0.0
0.5
1.0
1.5
2.0
2.5
01
23
45
67
8
To=2
π /ω
o(s
ec)
Velocity(m/sec)
ξ=3.
15%
ξ=13
.12%
0
0.2
0.4
0.6
0.81
1.2
1.4
1.6
01
23
45
67
8T
o=2
π /ω
o(s
ec)
TotalAcceleration(g)
0
0.1
0.2
0.3
0.4
01
23
45
67
8
2π/p
(sec
)
θ(rad)
α=
10de
g=
0.17
5rad
α=
10de
g(P
rie
stle
yet
al.)
ξ=3.
15%
ξ=13
.12%
10ο
Fig
ure
8.3
Com
pari
son
ofex
acta
ndap
prox
imat
eup
lift
spec
tra
(cen
ter
colu
mn)
that
have
been
com
pute
dw
ith
the
Pri
estl
eyet
al.(
1978
)m
etho
dus
ing
the
true
disp
lace
men
tres
pons
esp
ectr
um(t
ople
ft).
The
conv
erge
dpe
riod
that
corr
espo
nds
toth
ees
tim
ated
upli
ftis
show
nin
the
righ
tco
lum
n.G
roun
dM
otio
n:E
lCen
tro
Arr
ay#5
,197
9Im
peri
alV
alle
y.
0
0.1
0.2
0.3
0.4
01
23
45
67
8
2π/p
(sec
)
θ(rad)α
=1
5deg
=0
.26
2ra
d
α=
15d
eg(P
rie
stle
yet
al.)
0
0.1
0.2
0.3
0.4
01
23
45
67
82π
/p(s
ec)
θ(rad)
α=
20d
eg=
0.3
49r
ad
α=
20d
eg(P
rie
stle
yet
al.)
20ο
15ο
012345678
01
23
45
67
8
2π/p
(sec
)
T(sec)
α=1
0o
(Prie
stle
yet
al.)
012345678
01
23
45
67
82π
/p(s
ec)
T(sec)
α=1
5o
(Prie
stle
yet
al.)
0123456789
01
23
45
67
8
2π/p
(sec
)
T(sec)
α=2
0o
(Prie
stle
yet
al.)
ξ=3.
15%
ξ=7.
20%
ξ=13
.12%

45
Res
pons
eSp
ectr
aU
plif
tSp
ectr
aC
onve
rged
Per
iod
0
0.2
0.4
0.6
0.81
1.2
1.4
01
23
45
67
8T
o=2π
/ωo
(sec
)
Displacement(m)
ξ=7.
20%
0.0
0.5
1.0
1.5
2.0
2.5
3.0
3.5
4.0
01
23
45
67
8
To=
2π/ω
o(s
ec)
Velocity(m/sec)
ξ=3.
15%
ξ=13
.12%
0
0.51
1.52
2.53
3.5
01
23
45
67
8T
o=2
π /ω
o(s
ec)
TotalAcceleration(g)
ξ=
3.15
%ξ=
7.20
%ξ=
13.1
2%
0
0.1
0.2
0.3
0.4
01
23
45
67
82π
/p(s
ec)
θ(rad)
α=
10de
g=
0.17
5rad
α=
10de
g(P
rie
stle
yet
al.)
ξ=3.
15%
ξ=13
.12%
10ο
0
0.1
0.2
0.3
0.4
01
23
45
67
8
2π/p
(sec
)
θ(rad)α
=1
5deg
=0
.26
2ra
d
α=
15d
eg(P
rie
stle
yet
al.)
0
0.1
0.2
0.3
0.4
01
23
45
67
82π
/p(s
ec)
θ(rad)
α=2
0de
g=
0.3
49ra
d
α=2
0de
g(P
ries
tley
eta
l.)
20ο15ο
012345678910
01
23
45
67
8
2π/p
(sec
)
T(sec)
α=
10o
(Pri
estle
yet
al.)
012345678
01
23
45
67
82π
/p(s
ec)
T(sec)
α=
15o
(Prie
stle
yet
al.)
0123456789
01
23
45
67
82π
/p(s
ec)
T(sec)
α=
20o
(Pri
estle
ye
tal.)
Fig
ure
8.4
Com
pari
son
ofex
acta
ndap
prox
imat
eup
lift
spec
tra
(cen
ter
colu
mn)
that
have
been
com
pute
dw
ith
the
Pri
estl
eyet
al.(
1978
)m
etho
dus
ing
the
true
disp
lace
men
tres
pons
esp
ectr
um(t
ople
ft).
The
conv
erge
dpe
riod
that
corr
espo
nds
toth
ees
tim
ated
upli
ftis
show
nin
the
righ
tco
lum
n.G
roun
dM
otio
n:L
osG
atos
,198
9L
oma
Pri
eta.
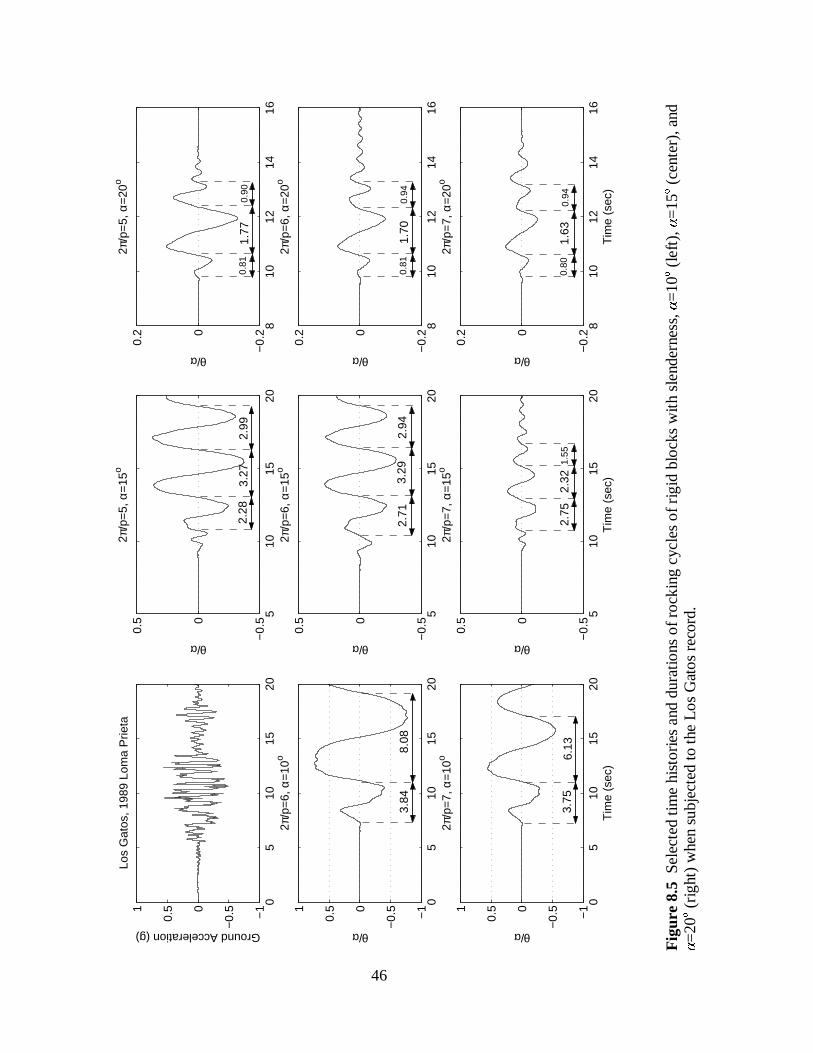
46
05
1015
20−
1
−0.
50
0.51
Ground Acceleration (g)Lo
s G
atos
, 198
9 Lo
ma
Prie
ta
510
1520
−0.
50
0.5
θ/α
2π/p
=5,
α=
15o
810
1214
16−
0.20
0.2
θ/α
2π/p
=5,
α=
20o
05
1015
20−
1
−0.
50
0.51
θ/α
2π/p
=6,
α=
10o
510
1520
−0.
50
0.5
θ/α
2π/p
=6,
α=
15o
810
1214
16−
0.20
0.2
θ/α
2π/p
=6,
α=
20o
05
1015
20−
1
−0.
50
0.51
θ/α
2π/p
=7,
α=
10o
Tim
e (s
ec)
510
1520
−0.
50
0.5
θ/α
2π/p
=7,
α=
15o
Tim
e (s
ec)
810
1214
16−
0.20
0.2
θ/α
2π/p
=7,
α=
20o
Tim
e (s
ec)
3.84
8.
08
3.75
6.
13
2.28
3.
27
2.99
2.71
3.
29
2.94
2.75
2.
32 1
.55
0.80
1.
63
0.94
0.81
1.
77
0.90
0.81
0.
94
1.70
Fig
ure
8.5
Sele
cted
time
hist
orie
san
ddu
ratio
nsof
rock
ing
cycl
esof
rigi
dbl
ocks
with
slen
dern
ess,α
=10ο
(lef
t),α
=15ο
(cen
ter)
,and
α=2
0ο(r
ight
)w
hen
subj
ecte
dto
the
Los
Gat
osre
cord
.

47
Res
pons
eSp
ectr
aU
plif
tSp
ectr
aC
onve
rged
Per
iod
0
0.1
0.2
0.3
0.4
0.5
0.6
0.7
0.8
01
23
45
67
8T
o=2
π /ω
o(s
ec)
Displacement(m) 0.0
0.5
1.0
1.5
2.0
2.5
3.0
3.5
01
23
45
67
8
To=
2π/ω
o(s
ec)
Velocity(m/sec)
ξ=3.
15%
ξ=13
.12%
0
0.51
1.52
2.5
01
23
45
67
8T
o=2π
/ωo
(sec
)
TotalAcceleration(g)
ξ=3.
15%
ξ=7.
20%
ξ=13
.12%
0
0.1
0.2
0.3
0.4
01
23
45
67
82π
/p(s
ec)
θ(rad)
α=
10de
g=
0.17
5rad
α=
10de
g(P
rie
stle
ye
tal.)
ξ=3.
15%
ξ=13
.12%
10ο
0
0.1
0.2
0.3
0.4
01
23
45
67
8
2π/p
(sec
)
θ(rad)α
=15
deg
=0.
262
rad
α=
15de
g(P
ries
tley
eta
l.)
0
0.1
0.2
0.3
0.4
01
23
45
67
82π
/p(s
ec)
θ(rad)
α=
20de
g=
0.34
9rad
α=
20de
g(P
rie
stle
ye
tal.)
20ο
15ο
012345678
01
23
45
67
82π
/p(s
ec)
T(sec)
α=
10o
(Prie
stle
yet
al.)
012345678
01
23
45
67
82π
/p(s
ec)
T(sec)
α=
15o
(Pri
estle
ye
tal.)
012345678
01
23
45
67
8
2π/p
(sec
)
T(sec)
α=
20o
(Prie
stle
yet
al.)
Fig
ure
8.6
Com
pari
son
ofex
acta
ndap
prox
imat
eup
lift
spec
tra
(cen
ter
colu
mn)
that
have
been
com
pute
dw
ith
the
Pri
estl
eyet
al.(
1978
)m
etho
dus
ing
the
true
disp
lace
men
tres
pons
esp
ectr
um(t
ople
ft).
The
conv
erge
dpe
riod
that
corr
espo
nds
toth
ees
tim
ated
upli
ftis
show
nin
the
righ
tco
lum
n.G
roun
dM
otio
n:R
inal
di,1
994
Nor
thri
dge.

48
02
46
810
1214
−1
−0.
50
0.51
Ground Acceleration (g)R
inal
di, 1
994
Nor
thrid
ge
24
68
10−
0.50
0.5
θ/α
2π/p
=6,
α=
15o
24
68
−0.
50
0.5
θ/α
2π/p
=6,
α=
20o
02
46
810
1214
−0.
50
0.5
θ/α
2π/p
=7,
α=
10o
24
68
10−
0.50
0.5
θ/α
2π/p
=7,
α=
15o
24
68
−0.
50
0.5
θ/α
2π/p
=7,
α=
20o
02
46
810
1214
−0.
50
0.5
θ/α
2π/p
=8,
α=
10o
Tim
e (s
ec)
24
68
10−
0.50
0.5
θ/α
2π/p
=8,
α=
15o
Tim
e (s
ec)
24
68
−0.
50
0.5
θ/α
2π/p
=8,
α=
20o
Tim
e (s
ec)
3.84
3.
84
2.62
3.69
3.
84
3.09
2.85
1.
81
1.49
2.73
1.
94
1.76
1.94
1.
11
1.08
1.90
1.
13
1.13
1.86
1.
14
1.15
2.
67
1.99
1.
86
Fig
ure
8.7
Sele
cted
time
hist
orie
san
ddu
ratio
nsof
rock
ing
cycl
esof
rigi
dbl
ocks
with
slen
dern
ess,α
=10ο
(lef
t),α
=15ο
(cen
ter)
,and
α=2
0ο(r
ight
)w
hen
subj
ecte
dto
the
Rin
aldi
reco
rd.
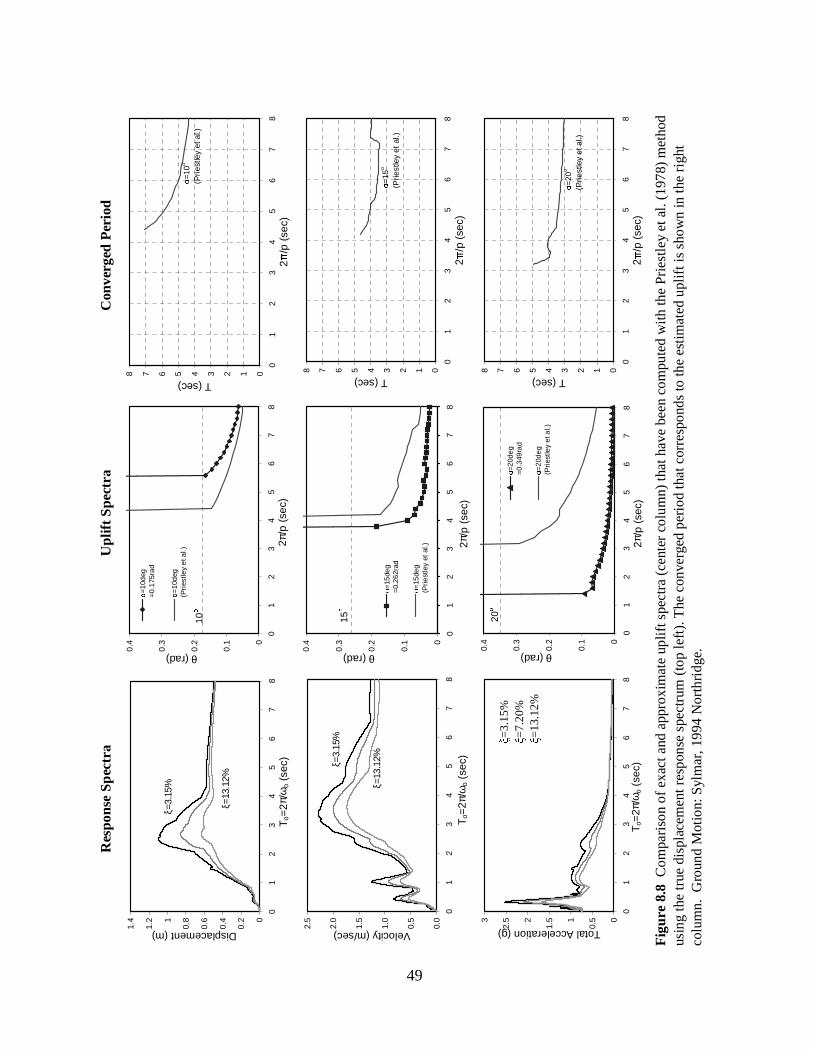
49
Res
pons
eSp
ectr
aU
plif
tS
pect
raC
onve
rged
Per
iod
0
0.2
0.4
0.6
0.81
1.2
1.4
01
23
45
67
8
To=
2π/ω
o(s
ec)
Displacement(m) 0.0
0.5
1.0
1.5
2.0
2.5
01
23
45
67
8
To=
2π/ω
o(s
ec)
Velocity(m/sec)
ξ=3.
15%
ξ=13
.12%
0
0.51
1.52
2.53
01
23
45
67
8T
o=2π
/ωo
(sec
)
TotalAcceleration(g)
ξ=3.
15%
ξ=7.
20%
ξ=13
.12%
0
0.1
0.2
0.3
0.4
01
23
45
67
82π
/p(s
ec)
θ(rad)
α=
10d
eg=
0.1
75ra
d
α=
10d
eg(P
ries
tley
eta
l.)
ξ=3.
15%
ξ=13
.12%
10ο
0
0.1
0.2
0.3
0.4
01
23
45
67
8
2π/p
(sec
)
θ(rad)α
=15
deg
=0.
26
2rad
α=
15de
g(P
rie
stle
yet
al.)
0
0.1
0.2
0.3
0.4
01
23
45
67
82π
/p(s
ec)
θ(rad)
α=
20d
eg
=0
.349
rad
α=
20d
eg
(Pri
estle
ye
tal.)
20ο
15ο
012345678
01
23
45
67
8
2π/p
(sec
)
T(sec)
α=1
0o
(Pri
estle
yet
al.)
012345678
01
23
45
67
8
2π/p
(sec
)
T(sec)
α=
15o
(Prie
stle
yet
al.)
012345678
01
23
45
67
8
2π/p
(sec
)
T(sec)
α=
20o
(Prie
stle
yet
al.)
Fig
ure
8.8
Com
pari
son
ofex
acta
ndap
prox
imat
eup
lifts
pect
ra(c
ente
rco
lum
n)th
atha
vebe
enco
mpu
ted
with
the
Prie
stle
yet
al.(
1978
)m
etho
dus
ing
the
true
disp
lace
men
tres
pons
esp
ectr
um(t
ople
ft).
The
conv
erge
dpe
riod
that
corr
espo
nds
toth
ees
timat
edup
lifti
ssh
own
inth
eri
ght
colu
mn.
Gro
und
Mot
ion:
Sylm
ar,1
994
Nor
thri
dge.

50
02
46
810
1214
−1
−0.
50
0.51
Ground Acceleration (g)S
ylm
ar, 1
994
Nor
thrid
ge
24
68
1012
14−
0.20
0.2
θ/α
2π/p
=5,
α=
15o
24
68
−0.
050
0.05
θ/α
2π/p
=5,
α=
20o
02
46
810
1214
−1
−0.
50
0.51
θ/α
2π/p
=6,
α=
10o
24
68
1012
14−
0.20
0.2
θ/α
2π/p
=6,
α=
15o
24
68
−0.
050
0.05
θ/α
2π/p
=6,
α=
20o
02
46
810
1214
−1
−0.
50
0.51
θ/α
2π/p
=7,
α=
10o
Tim
e (s
ec)
24
68
1012
14−
0.20
0.2
θ/α
2π/p
=7,
α=
15o
Tim
e (s
ec)
24
68
−0.
050
0.05
θ/α
2π/p
=7,
α=
20o
Tim
e (s
ec)
4.91
3.
41
4.49
4.
20
2.33
1.
31
2.20
1.
69
2.14
1.
80
0.88
0.
54
0.88
0.88
0.54
0.55
Fig
ure
8.9
Sele
cted
time
hist
orie
san
ddu
ratio
nsof
rock
ing
cycl
esof
rigi
dbl
ocks
with
slen
dern
ess,α
=10ο
(lef
t),α
=15ο
(cen
ter)
,and
α=2
0ο(r
ight
)w
hen
subj
ecte
dto
the
Syl
mar
reco
rd.

51
Res
pons
eSp
ectr
aU
plif
tSp
ectr
aC
onve
rged
Per
iod
0
0.1
0.2
0.3
0.4
0.5
0.6
0.7
0.8
0.91
01
23
45
67
8
To=2
π /ω
o(s
ec)
Displacement(m) 0.0
0.5
1.0
1.5
2.0
2.5
01
23
45
67
8
To=
2π/ω
o(s
ec)
Velocity(m/sec)
ξ=3.
15%
ξ=13
.12%
0
0.2
0.4
0.6
0.81
1.2
01
23
45
67
8T
o=
2π/ω
o(s
ec)
TotalAcceleration(g)
ξ=3.
15%
ξ=7.
20%
ξ=13
.12%
0
0.1
0.2
0.3
0.4
01
23
45
67
82π
/p(s
ec)
θ(rad)
α=
10de
g=
0.1
75r
ad
α=
10de
g(P
rie
stle
yet
al.)
ξ=3.
15%
ξ=13
.12%
10ο
0
0.1
0.2
0.3
0.4
01
23
45
67
8
2π/p
(sec
)
θ(rad)
α=
15
deg
=0
.262
rad
α=
15
deg
(Pri
estle
ye
tal.)
0
0.1
0.2
0.3
0.4
01
23
45
67
82π
/p(s
ec)
θ(rad)
α=
20
deg
=0
.349
rad
α=
20
deg
(Pri
estle
ye
tal
.)
20ο
15ο
012345678
01
23
45
67
8
2π/p
(sec
)
T(sec)
α=1
0o
(Prie
stle
yet
al.)
012345678
01
23
45
67
8
2π/p
(sec
)
T(sec)
α=
15o
(Prie
stle
yet
al.)
012345678
01
23
45
67
8
2π/p
(sec
)
T(sec)
α=
20o
(Prie
stle
yet
al.)
Fig
ure
8.10
Com
pari
son
ofex
acta
ndap
prox
imat
eup
lifts
pect
ra(c
ente
rco
lum
n)th
atha
vebe
enco
mpu
ted
with
the
Prie
stle
yet
al.(
1978
)m
etho
dus
ing
the
true
disp
lace
men
tres
pons
esp
ectr
um(t
ople
ft).
The
conv
erge
dpe
riod
that
corr
espo
nds
toth
ees
timat
edup
lifti
ssh
own
inth
eri
ght
colu
mn.
Gro
und
Mot
ion:
1992
Erz
inka
n,T
urke
y.

52
Res
pons
eSp
ectr
aU
plif
tSp
ectr
aC
onve
rged
Per
iod
0
0.2
0.4
0.6
0.81
1.2
1.4
01
23
45
67
8T
o=2π
/ωo
(sec
)
Displacement(m) 0.0
0.5
1.0
1.5
2.0
2.5
3.0
3.5
4.0
4.5
5.0
01
23
45
67
8
To=
2π/ω
o(s
ec)
Velocity(m/sec)
ξ=3.
15%
ξ=13
.12%
0
0.51
1.52
2.53
01
23
45
67
8T
o=2
π /ω
o(s
ec)
TotalAcceleration(g)
ξ=3.
15%
ξ=7.
20%
ξ=13
.12%
0
0.1
0.2
0.3
0.4
01
23
45
67
82π
/p(s
ec)
θ(rad)
α=
10d
eg=
0.1
75ra
d
α=
10d
eg(P
ries
tley
eta
l.)ξ=
3.15
%
ξ=13
.12%
10ο
0
0.1
0.2
0.3
0.4
01
23
45
67
8
2π/p
(sec
)
θ(rad)α
=1
5de
g=
0.2
62ra
d
α=
15d
eg
(Pri
estle
ye
tal.)
0
0.1
0.2
0.3
0.4
01
23
45
67
82π
/p(s
ec)
θ(rad)
α=
20de
g=
0.3
49ra
d
α=
20de
g(P
ries
tley
eta
l.)
20ο
15ο
024681012
01
23
45
67
8
2π/p
(sec
)
T(sec)
α=
10o
(Prie
stle
yet
al.)
012345678
01
23
45
67
82π
/p(s
ec)
T(sec)
α=1
5o
(Prie
stle
yet
al.)
012345678
01
23
45
67
82π
/p(s
ec)
T(sec)
α=
20o
(Prie
stle
yet
al.)
Fig
ure
8.11
Com
pari
son
ofex
acta
ndap
prox
imat
eup
lifts
pect
ra(c
ente
rco
lum
n)th
atha
vebe
enco
mpu
ted
with
the
Prie
stle
yet
al.(
1978
)m
etho
dus
ing
the
true
disp
lace
men
tres
pons
esp
ectr
um(t
ople
ft).
The
conv
erge
dpe
riod
that
corr
espo
nds
toth
ees
timat
edup
lifti
ssh
own
inth
eri
ght
colu
mn.
Gro
und
Mot
ion:
Tak
ator
i,19
95K
obe,
Japa
n.

9 The FEMA 356 Guidelines
Under the chapter “Foundation and Geologic Site Hazards,” the Federal Emergency Manage-
ment Agency (FEMA) 356 document Prestandard and Commentary for the Seismic
Rehabilitation of Buildings recommends as a possible procedure for estimating rotations of
rocking structures the approximate procedure examined in the previous section of this report.
The only difference in the FEMA recommendation is that instead of the exact displacement
spectra (as those used in Figures 8.1, 8.3, 8.4, 8.6, 8.8, 8.10, and 8.11), one should use the FEMA
design acceleration spectra (as those shown in the bottom left of Figures 5.1 to 5.7) modified for
the equivalent viscous damping of the rocking block in question
where r is the coefficient of restitution given by Equation (4.8). The spectral displacement values
needed to extract the rotations θi from Equation (8.2) are obtained from Equation (3.5). For the
FEMA-recommended empirical expression (9.1) that furnishes the design value of the equivalent
damping ratio, we do not have information on its origin. The resulting values of β from Equation
(9.1) are plotted in Figure 7.1 with a dashed line together with the values of β prescribed by
Equation (7.10). It is shown that the FEMA expression yields values of β which are about one-
half the values of β predicted by Equation (7.9).
( )r−= 14.0β (9.1)

54
Figures 9.1 and 9.2 compare the predictions of the FEMA recommendations with the ex-
act spectra. Note that for all five U.S. earthquake motions examined in this study, the FEMA
recommendation predicts overturning of all blocks with slenderness α=10ο and as large as
2π/p=8. For values of α=15ο and α=20ο, the FEMA procedure grossly overestimates rotations to
the extent that they are of no use. For the Los Gatos record (right column of Figure 9.1), the
FEMA guideline predicts overturning of all blocks as large as 2π/p=8 for α=10ο, α=15ο, and
α=20ο. Consequently, the concept of estimating rotations of rocking blocks by using response
spectra should be abandoned.
An attempt to estimate rotations of a rocking block by using response spectra of an oscil-
lating SDOF structure resembles an attempt to find a location in the City of London by using a
map of New York City. It might happen that a visitor in London is on a location that resembles
New York, and by following the wrong map to guide himself accidentally to the right place.
Most probably as his visit unfolds, he will be totally lost.

55
Pac
oim
aD
amE
lCen
tro
Arr
ay#5
Los
Gat
os
0
0.1
0.2
0.3
0.4
01
23
45
67
8
2π/p
(sec
)
θ(rad)α
=10
deg
=0.
175r
ad
α=
10de
g(F
EM
A3
56)
0
0.1
0.2
0.3
0.4
01
23
45
67
8
2π/p
(sec
)
θ(rad)
α=
10de
g=
0.17
5rad
α=
10de
g(F
EM
A3
56)
10ο
0
0.1
0.2
0.3
0.4
01
23
45
67
8
2π/p
(sec
)
θ(rad)
α=
10d
eg=
0.1
75
rad
α=
10
deg
(FE
MA
356)
10ο
0
0.1
0.2
0.3
0.4
01
23
45
67
8
2π/p
(sec
)
θ(rad)
α=
15d
eg=
0.2
62r
ad
α=
15d
eg(F
EM
A3
56)
15ο
0
0.1
0.2
0.3
0.4
01
23
45
67
8
2π/p
(sec
)
θ(rad)
α=
15d
eg=
0.2
62ra
d
α=
15d
eg(F
EM
A35
6)
15ο
0
0.1
0.2
0.3
0.4
01
23
45
67
8
2π/p
(sec
)
θ(rad)
α=
15de
g=
0.26
2rad
α=
15de
g(F
EM
A3
56)
15ο
0
0.1
0.2
0.3
0.4
01
23
45
67
8
2π/p
(sec
)
θ(rad)
α=
20de
g=
0.34
9rad
α=
20de
g(F
EM
A3
56)
20ο
0
0.1
0.2
0.3
0.4
01
23
45
67
8
2π/p
(sec
)
θ(rad)
α=
20d
eg=
0.3
49ra
d
α=
20d
eg(F
EM
A35
6)
20ο
0
0.1
0.2
0.3
0.4
01
23
45
67
8
2π/p
(sec
)
θ(rad)
α=
20d
eg=
0.3
49ra
d
α=
20d
eg(F
EM
A35
6)
20ο
10ο
Fig
ure
9.1
Com
pari
son
ofex
acta
ndde
sign
upli
ftsp
ectr
ath
atha
vebe
enco
mpu
ted
wit
hth
eP
ries
tley
etal
.(19
78)
met
hod
usin
gth
eF
EM
Ade
sign
disp
lace
men
tspe
ctra
.Whe
nth
eso
lid
line
isno
tsho
wn,
the
FEM
Apr
oced
ure
pred
icts
over
turn
ing
over
the
enti
re2 π
/pra
nge
show
n.

56
Rin
aldi
Sylm
ar
0
0.1
0.2
0.3
0.4
01
23
45
67
8
2π/p
(sec
)
θ(rad)
α=1
0deg
=0.1
75ra
d
α=1
0deg
(FE
MA
356)
0
0.1
0.2
0.3
0.4
01
23
45
67
8
2π/p
(sec
)
θ(rad)
α=1
0deg
=0.
175r
ad
α=1
0deg
(FE
MA
356)
10ο
0
0.1
0.2
0.3
0.4
01
23
45
67
8
2π/p
(sec
)
θ(rad)
α=
15de
g=0
.262
rad
α=
15de
g(F
EM
A35
6)
15ο
0
0.1
0.2
0.3
0.4
01
23
45
67
8
2π/p
(sec
)
θ(rad)
α=1
5deg
=0.2
62ra
d
α=1
5deg
(FE
MA
356)
15ο
0
0.1
0.2
0.3
0.4
01
23
45
67
8
2π/p
(sec
)
θ(rad)
α=
20de
g=0
.349
rad
α=
20de
g(F
EM
A35
6)
20ο
0
0.1
0.2
0.3
0.4
01
23
45
67
8
2π/p
(sec
)
θ(rad)
α=
20de
g=0
.349
rad
α=
20de
g(F
EM
A35
6)
20ο
10ο
Fig
ure
9.2
Com
pari
son
ofex
acta
ndde
sign
upli
ftsp
ectr
ath
atha
vebe
enco
mpu
ted
wit
hth
eP
ries
tley
etal
.(19
78)
met
hod
usin
gth
eFE
MA
desi
gndi
spla
cem
ents
pect
ra.W
hen
the
soli
dlin
eis
nots
how
n,th
eFE
MA
proc
edur
epr
edic
tsov
ertu
rnin
gov
erth
een
tire
2 π/p
rang
esh
own.

10 Conclusions
This report examines in depth the fundamental differences between the oscillatory response of a
single-degree-of-freedom (SDOF) oscillator (regular pendulum) and the rocking response of a
slender rigid block (inverted pendulum). Differences have been identified and discussed at
several levels, including the form of the governing equations and the structure of the responses of
the two systems.
Initially the report examines the underlying differences in the restoring mechanisms,
stiffness, and damping values of the SDOF oscillator and the rocking block. Subsequently, the
report proceeds by examining the differences appearing in the free- and forced-vibration re-
sponse of the two systems by emphasizing the nonlinear nature and sensitivity of the dynamic
response of the rocking block. It is concluded that the SDOF oscillator and the rocking block are
two fundamentally different dynamical systems, and the response of one should not be used to
draw conclusions on the response of the other. This conclusion motivated the proposal to use the
rocking spectra as an additional valuable measure of the intensity of ground shaking. Together
with the response spectra, the rocking spectra can provide a more lucid picture of the kinematic
characteristics of ground motions and their implications on the response of structures.
The report examines in depth the validity of a two-decade-old approximate design meth-
odology to estimate block rotations by performing iterations on the true or design displacement

58
response spectrum of oscillating structures. It is shown that the approximate method is funda-
mentally flawed and should be abandoned.
It is concluded that the exact rocking spectrum emerges as a distinct, valuable, and irre-
placeable analysis and design tool.

References
Bertero, V. V., S. A. Mahin, and R. A. Herrera. (1978). Aseismic Design Implications of Near-fault San Fernando Earthquake Records. Earthquake Engineering and Structural Dynamics. 6:3142.
Chopra, A. K. (2000). Dynamics of Structures: Theory and Applications to Earthquake Engi-neering. 2nd ed. Upper Saddle River, N.J.: Prentice Hall.
Clough, R., and Joseph Penzien (1993). Dynamics of Structures. 2nd ed. New York: McGraw-Hill.
FEMA 356. (2000).Prestandard and Commentary for the Seismic Rehabilitation of Buildings.Prepared by the American Society of Civil Engineers for the Federal Emergency ManagementAgency. FEMA.
Hogan, S. J. (1989). On the Dynamics of Rigid Block Motion under Harmonic Forcing. Proceed-ings of the Royal Society of London. Series A, 425, pp 44176.
Housner, G. W. (1963). The Behavior of Inverted Pendulum Structures During Earthquakes.Bulletin of the Seismological Society of America 53(2): 40417.
Makris, N., and Y. Roussos (2000). Rocking Response of Rigid Blocks under Near-SourceGround Motions. Géotechnique 50(3): 24362.
Makris, N., and J. Zhang. (1999). Response and Overturning of Anchored Equipment underSeismic Excitation. Report No. PEER-98/05. Berkeley, Calif.: Pacific Earthquake EngineeringResearch Center, University of California.
Milne, J. (1885). Seismic Experiments. Transactions of the Seismological Society of Japan 8: 1-82.
1997 Uniform Building Code. Vol. 2. Ch. 16. International Conference of Building Officials,(1997).

60
Priestley, M. J. N., R. J. Evison, and A. J. Carr. (1978). Seismic Response of Structures Free toRock on Their Foundations. Bulletin of the New Zealand National Society for EarthquakeEngineering. 11(3) 14150.
Shenton, H. W., III (1996). Criteria for Initiation of Slide, Rock, and Slide-Rock Rigid-BodyModes. Journal of Engineering Mechanics 122(7): 69093.ASCE,.
Yim, S. C. S.; A. K. Chopra and J. Penzien (1980). Rocking Response of Rigid Blocks to Earth-quakes. Earthquake Engineering and Structural Dynamics 8(6): 56587.
J. Zhang and Makris, N (2001). Rocking Response of Free-Standing Blocks Under CycloidalPulses. Journal of Engineering Mechanics 127(5)L 47383. ASCE.