Embed Size (px)
Citation preview

The Road to Becoming an Investment Professional
with B. Bobby Nouredini

My background…
CSUS graduate, May 2004, BS – Business Administration (Finance)Founder & Past President of the CSUS Investment SocietyAssociate Financial Analyst, Houlihan Valuation Partners, San Francisco, CAInvestment Banking/Private Equity Analyst, DCA Partners, Roseville, CAResearch Assistant, Palo Alto Investors, Palo Alto, CACFA Level III Candidate

The investment arena
On the Buy-Side:Hedge FundsMutual FundsPension FundsPrivate Equity/Venture CapitalSeparate Accounts Managers (not Financial Advisors)
On the Sell-Side:Investment Banks
Debt/Equity UnderwritingMergers & AcquisitionsInstitutional Sales/TradingEquity ResearchRetail/Private Client Wealth Management (buy-side activity)Principal Investment (buy-side activity)
Other firms that provide consulting, research, corp-orate valuations and other services
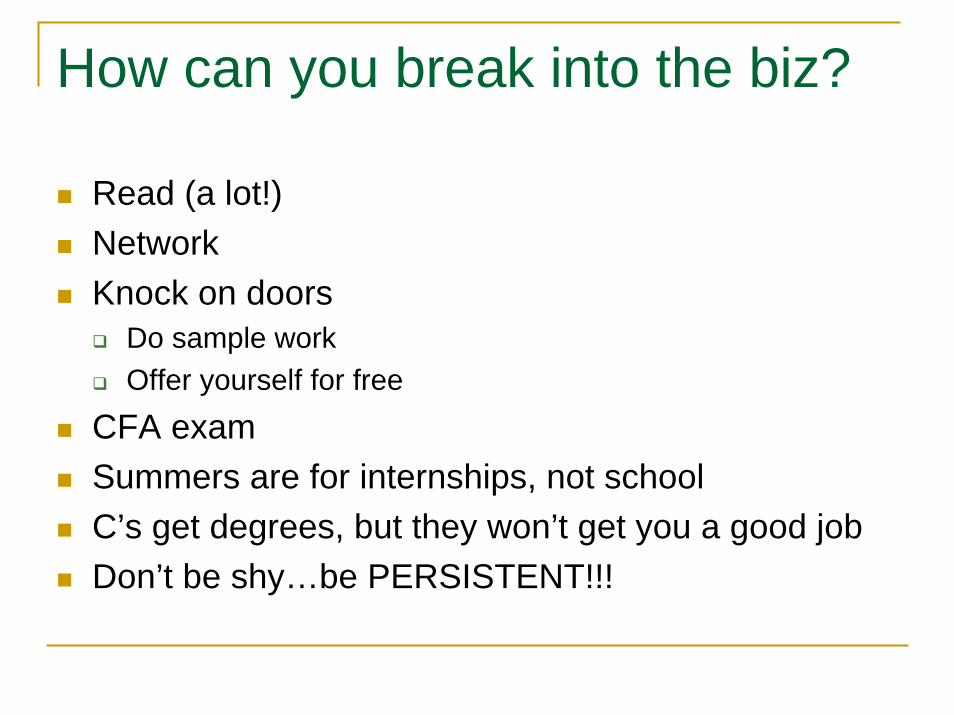
How can you break into the biz?
Read (a lot!)NetworkKnock on doors
Do sample workOffer yourself for free
CFA examSummers are for internships, not schoolC’s get degrees, but they won’t get you a good jobDon’t be shy…be PERSISTENT!!!

Opportunities in the Sac Metro
Akers CapitalAmerican River VenturesCalPERSCalSTRSCapital Valley VenturesCentral Valley FundCybus Capital AdvisorsCP SoftwareDavis Bioscience GroupDeCamilla CapitalDCA PartnersDFJ FrontierIntel CapitalHallador Venture Partners
JM Dutton & AssociatesLegacy Capital ManagementLP AdvisorsMoss AdamsOak Hill Capital Partners Pacific Coast Capital Partners* Preferred Capital Advisors*Sanli, Pastore & HillSCERSTechnology Funding PartnersTitus Equity PartnersVelocity Venture CapitalWells Fargo Private Client Services
*Real Estate Firms

Alternatives routes
Financial Analysis (in operations) – sales forecasting, capital budgeting, etc. Commercial Banking – providing debt and other financing solutions to middle market businessesIT/Engineering – Software development, product engineering, etc.

What not to do
Retail Financial Advisory (i.e. Merrill Lynch Financial Advisors) – looked down on by industry professionalsMortgage/Real Estate/Insurance SalesFund Accounting (i.e. Investors Bank & Trust)
If it’s easy to get, then it’s not worth having

Suggested readings…
Publications:Value LineBarron'sThe EconomistThe DealThe Wall Street Journal
Books:The Warren Buffet WayThe Warren Buffet PortfolioCommon Stocks and Uncommon ProfitsSecurity AnalysisThe Intelligent InvestorValue Investing (Whitman)

A Quick-and-Dirty understanding of Stocks and Valuation
with B. Bobby Nouredini

Where do stocks get their value?A stock is a small piece of a company.
Eg: Chipotle Mexican Grill Inc (CMG) has 32.8 million shares outstanding, meaning that each share represent a 1/32,800,000 equity share of the company. CMG trades at $123/share, theoretically you can purchase the company for $4.1 billion¹ ($123/share x 32.8mm shares out = $4.1bb market cap)Ignore price, it’s no indication of value. Eg: Crocs Inc (CROX) trades at $67/share and Nike Inc (NKE) trades at $63/share…which company is more expensive? NKE has a $31.6bb market cap, CROX only has a $5.4bb market cap.
A stock’s value is the value of the company divided by its shares outstanding. A company’s value based on it’s ability to generate cash flow (see next slide).
¹ Does not include a control premium that acquirers typically have to pay -- usually around 30%.² Even though NKE has a higher market cap it is more appropriately valued than CROX, which is likely overvalued with a $5.4bb market cap and a P/E ratio of 48x.

Using net income (EPS) as a proxy for cash flow –Nike Inc (NKE):
Value follows fundamentals

You, as an investor, don’t get to pocket EPS, but you do get to pocket dividends, which follow EPS – again NKE:
What good are EPS to me?
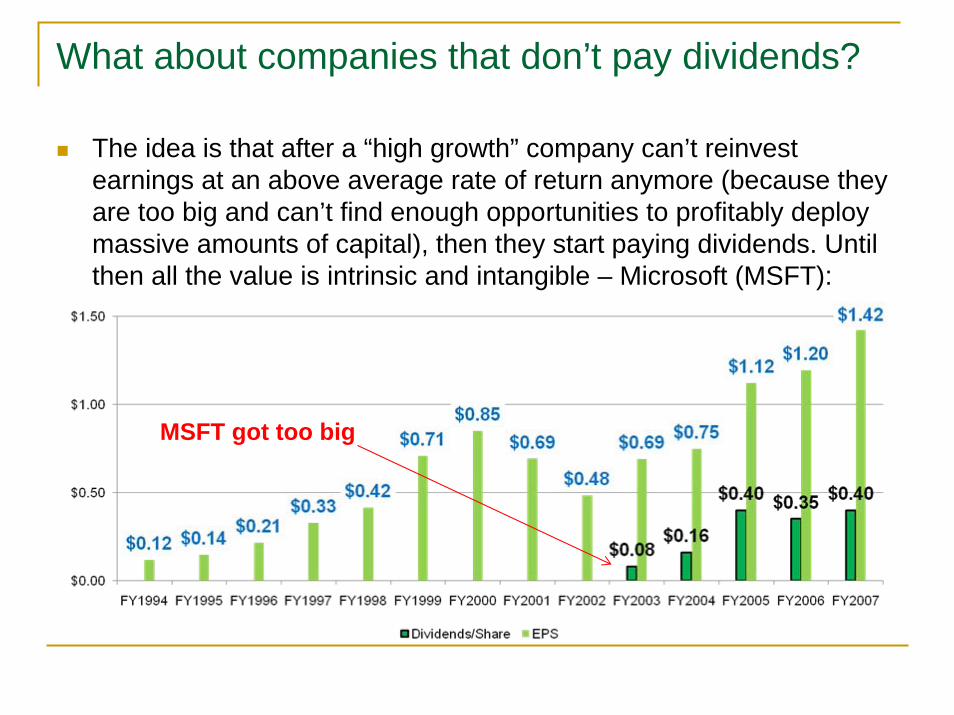
The idea is that after a “high growth” company can’t reinvest earnings at an above average rate of return anymore (because they are too big and can’t find enough opportunities to profitably deploy massive amounts of capital), then they start paying dividends. Until then all the value is intrinsic and intangible – Microsoft (MSFT):
What about companies that don’t pay dividends?
MSFT got too big

Common knowledge says that the cost of a company/stock is to be viewed in the traditional market cap/price-per-share framework. This is flawed in that it doesn’t consider the burden of debt or the benefit of cash.Consider: You pay $12 for a lemonade stand. What is your true economic cost if the lemonade stand comes with $5 in debt and $2 in cash on it’s books?
Answer: $12 equity cost+$5 debt cost- $2 cash benefit= $15 true economic cost
You only paid $12 in cash, but now you owe a third party $5. This is offset by the $2 that you can instantly extract from the business. The true economic cost is called Enterprise Value (EV).
An alternative “cost” framework

How do you calculate a EV for public companies?Equity cost is market cap = shares outstanding x price per share. Debt burden is the book value of debt, which is found on a company’s balance sheet. Cash benefit is the value of cash, cash equivalents and marketable securities held by the company, also found on the balance sheet.
Market Cap + Debt - Cash = EV
Calculating EV for public companies

Continuing with the Lemonade Stand example: If the Lemonade Stand had cash flow of $2 this year how can you put into perspective the value that you are getting for the cost (EV) of the business.
Answer: You can use trading multiples, ratios of a business’ cost to its underlying operating metrics, to get a quick sense of what you are getting for what you are paying for. The Lemonade Stand has an EV/Cash Flow multiple of 7.5x ($15 EV divided by $2 Cash Flow = 7.5x). If this ratio is higher than EV/Cash Flow multiples of similar refreshment stands, you might want to reconsider your purchase.Common trading multiples include: EV/RevenueEV/EBITEV/EBITDAEV/Free Cash FlowPrice/Earnings Price/Book Value
Trading multiples

Trading multiples can be used to create Relative Value (RV) models to identify companies that are potentially under- and overvalued relative to their peers. RV models are quick and somewhat crude methods of determining a company’s value and are incomplete because they never tell you what a company’s story and growth prospects are.There is NO substitute for fundamental research coupled with a thoughtful Discounted Cash Flow (DCF) model. The value given by a perfectly forecasted and complete DCF model (which is impossible to create in reality) gives you a company’s true economic value. Read about DCF models and ask your teachers about them.
Before we move on – DCF Analysis

Relative Value Analysis – BEER!
Company Name (exchange:ticker)Market
Cap TEVLTM
RevenueTEV/ LTM Total Rev
TEV/ LTM EBITDA
TEV/ LTM EBIT
P/ Dil EPS
Before Extra
P/ TangBV
InBev SA (ENXTBR:INB) 53,696 64,198 19,661 3.3x 10.0x 13.0x 23.5x NM
SABMiller plc (LSE:SAB) 46,798 54,151 14,862 3.6x 12.9x 16.4x 27.0x NM
Anheuser-Busch Companies Inc. (NYSE:BUD) 38,678 46,329 16,079 2.9x 10.6x 13.7x 19.7x 15.7x
Heineken NV (ENXTAM:HEIA) 31,270 34,968 17,278 2.0x 11.0x 16.3x 20.5x 8.4x
Grupo Modelo SA de CV (BMV:GMODELO C) 16,441 16,145 5,523 2.9x 9.3x 11.0x 19.6x 2.9x
Foster's Group Ltd. (ASX:FGL) 11,984 14,317 4,275 3.3x 12.2x 13.8x 17.6x 11.2x
Scottish & Newcastle plc (LSE:SCTN) 11,760 15,662 6,752 2.3x 13.0x 15.8x 19.4x 13.5x
Molson Coors Brewing Company (NYSE:TAP) 8,911 11,109 6,013 1.8x 10.1x 15.3x 20.1x NM
Tsingtao Brewery Co. Ltd. (SEHK:168) 4,621 4,426 1,697 2.6x 20.8x 30.8x 59.5x 6.8x
Boston Beer Co. Inc. (NYSE:SAM) 742 649 315 2.1x 15.7x 18.1x 35.9x 5.9x
Royal Grolsch N.V. (ENXTAM:GROL) 601 687 390 1.8x 8.6x 18.6x 22.2x 1.7x
Minimum 601 649 315 1.8x 8.6x 11.0x 17.6x 1.7xMedian 11,984 15,662 6,013 2.6x 11.0x 15.8x 20.5x 7.6xMean 20,500 23,876 8,441 2.6x 12.2x 16.6x 25.9x 8.3x
Maximum 53,696 64,198 19,661 3.6x 20.8x 30.8x 59.5x 15.7x

Relative Value Analysis – BEER! (continued)
Company Name (exchange:ticker)Market
Cap TEVLTM
RevenueTEV/ LTM Total Rev
TEV/ LTM EBITDA
TEV/ LTM EBIT
P/ Dil EPS
Before Extra
P/ TangBV
InBev SA (ENXTBR:INB) 53,696 64,198 19,661 3.3x 10.0x 13.0x 23.5x NM
SABMiller plc (LSE:SAB) 46,798 54,151 14,862 3.6x 12.9x 16.4x 27.0x NM
Anheuser-Busch Companies Inc. (NYSE:BUD) 38,678 46,329 16,079 2.9x 10.6x 13.7x 19.7x 15.7x
Heineken NV (ENXTAM:HEIA) 31,270 34,968 17,278 2.0x 11.0x 16.3x 20.5x 8.4x
Grupo Modelo SA de CV (BMV:GMODELO C) 16,441 16,145 5,523 2.9x 9.3x 11.0x 19.6x 2.9x
Foster's Group Ltd. (ASX:FGL) 11,984 14,317 4,275 3.3x 12.2x 13.8x 17.6x 11.2x
Scottish & Newcastle plc (LSE:SCTN) 11,760 15,662 6,752 2.3x 13.0x 15.8x 19.4x 13.5x
Molson Coors Brewing Company (NYSE:TAP) 8,911 11,109 6,013 1.8x 10.1x 15.3x 20.1x NM
Tsingtao Brewery Co. Ltd. (SEHK:168) 4,621 4,426 1,697 2.6x 20.8x 30.8x 59.5x 6.8x
Boston Beer Co. Inc. (NYSE:SAM) 742 649 315 2.1x 15.7x 18.1x 35.9x 5.9x
Royal Grolsch N.V. (ENXTAM:GROL) 601 687 390 1.8x 8.6x 18.6x 22.2x 1.7x
Minimum 601 649 315 1.8x 8.6x 11.0x 17.6x 1.7xMedian 11,984 15,662 6,013 2.6x 11.0x 15.8x 20.5x 7.6xMean 20,500 23,876 8,441 2.6x 12.2x 16.6x 25.9x 8.3x
Maximum 53,696 64,198 19,661 3.6x 20.8x 30.8x 59.5x 15.7x
If a beer company’s trading multiples stray too far from these trading multiples you should question its valuation

Relative Value Analysis – BEER! (continued)
Company Name (exchange:ticker)Market
Cap TEVLTM
RevenueTEV/ LTM Total Rev
TEV/ LTM EBITDA
TEV/ LTM EBIT
P/ Dil EPS
Before Extra
P/ TangBV
InBev SA (ENXTBR:INB) 53,696 64,198 19,661 3.3x 10.0x 13.0x 23.5x NM
SABMiller plc (LSE:SAB) 46,798 54,151 14,862 3.6x 12.9x 16.4x 27.0x NM
Anheuser-Busch Companies Inc. (NYSE:BUD) 38,678 46,329 16,079 2.9x 10.6x 13.7x 19.7x 15.7x
Heineken NV (ENXTAM:HEIA) 31,270 34,968 17,278 2.0x 11.0x 16.3x 20.5x 8.4x
Grupo Modelo SA de CV (BMV:GMODELO C) 16,441 16,145 5,523 2.9x 9.3x 11.0x 19.6x 2.9x
Foster's Group Ltd. (ASX:FGL) 11,984 14,317 4,275 3.3x 12.2x 13.8x 17.6x 11.2x
Scottish & Newcastle plc (LSE:SCTN) 11,760 15,662 6,752 2.3x 13.0x 15.8x 19.4x 13.5x
Molson Coors Brewing Company (NYSE:TAP) 8,911 11,109 6,013 1.8x 10.1x 15.3x 20.1x NM
Tsingtao Brewery Co. Ltd. (SEHK:168) 4,621 4,426 1,697 2.6x 20.8x 30.8x 59.5x 6.8x
Boston Beer Co. Inc. (NYSE:SAM) 742 649 315 2.1x 15.7x 18.1x 35.9x 5.9x
Royal Grolsch N.V. (ENXTAM:GROL) 601 687 390 1.8x 8.6x 18.6x 22.2x 1.7x
Minimum 601 649 315 1.8x 8.6x 11.0x 17.6x 1.7xMedian 11,984 15,662 6,013 2.6x 11.0x 15.8x 20.5x 7.6xMean 20,500 23,876 8,441 2.6x 12.2x 16.6x 25.9x 8.3x
Maximum 53,696 64,198 19,661 3.6x 20.8x 30.8x 59.5x 15.7x
Given the median trading multiples of publicly traded beer companies, who looks potentially undervalued?

Relative Value Analysis – BEER! (continued)
Company Name (exchange:ticker)Market
Cap TEVLTM
RevenueTEV/ LTM Total Rev
TEV/ LTM EBITDA
TEV/ LTM EBIT
P/ Dil EPS
Before Extra
P/ TangBV
InBev SA (ENXTBR:INB) 53,696 64,198 19,661 3.3x 10.0x 13.0x 23.5x NM
SABMiller plc (LSE:SAB) 46,798 54,151 14,862 3.6x 12.9x 16.4x 27.0x NM
Anheuser-Busch Companies Inc. (NYSE:BUD) 38,678 46,329 16,079 2.9x 10.6x 13.7x 19.7x 15.7x
Heineken NV (ENXTAM:HEIA) 31,270 34,968 17,278 2.0x 11.0x 16.3x 20.5x 8.4x
Grupo Modelo SA de CV (BMV:GMODELO C) 16,441 16,145 5,523 2.9x 9.3x 11.0x 19.6x 2.9x
Foster's Group Ltd. (ASX:FGL) 11,984 14,317 4,275 3.3x 12.2x 13.8x 17.6x 11.2x
Scottish & Newcastle plc (LSE:SCTN) 11,760 15,662 6,752 2.3x 13.0x 15.8x 19.4x 13.5x
Molson Coors Brewing Company (NYSE:TAP) 8,911 11,109 6,013 1.8x 10.1x 15.3x 20.1x NM
Tsingtao Brewery Co. Ltd. (SEHK:168) 4,621 4,426 1,697 2.6x 20.8x 30.8x 59.5x 6.8x
Boston Beer Co. Inc. (NYSE:SAM) 742 649 315 2.1x 15.7x 18.1x 35.9x 5.9x
Royal Grolsch N.V. (ENXTAM:GROL) 601 687 390 1.8x 8.6x 18.6x 22.2x 1.7x
Minimum 601 649 315 1.8x 8.6x 11.0x 17.6x 1.7xMedian 11,984 15,662 6,013 2.6x 11.0x 15.8x 20.5x 7.6xMean 20,500 23,876 8,441 2.6x 12.2x 16.6x 25.9x 8.3x
Maximum 53,696 64,198 19,661 3.6x 20.8x 30.8x 59.5x 15.7x
These two appear to be undervalued and warrant further evaluation of management team, competitive position & growth prospects
Why the high valuation here?
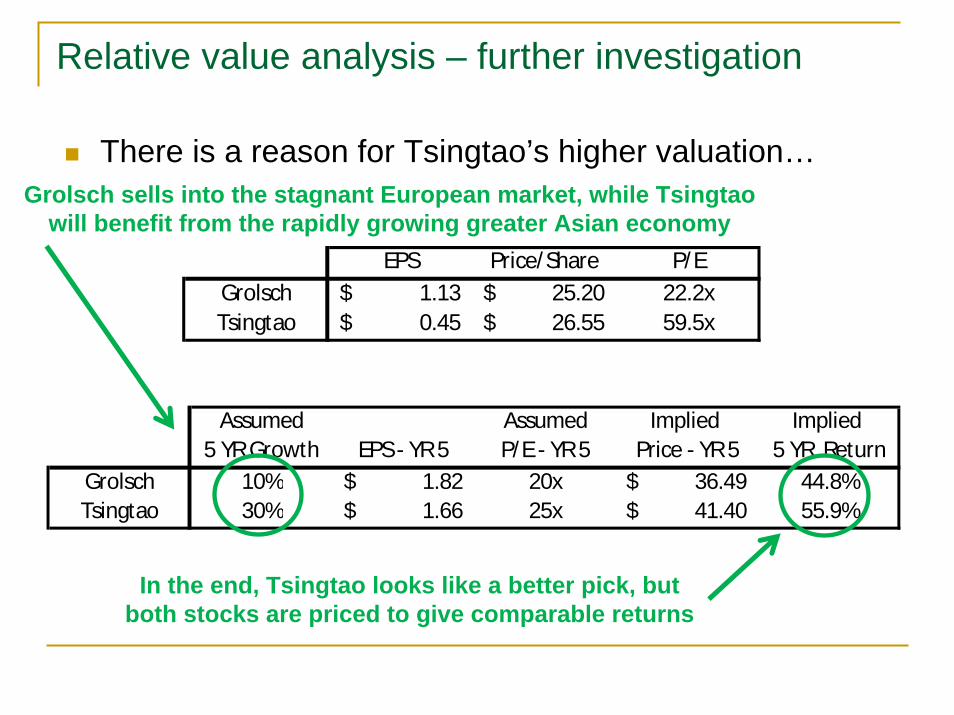
There is a reason for Tsingtao’s higher valuation…
Relative value analysis – further investigation
EPS Price/Share P/EGrolsch 1.13$ 25.20$ 22.2xTsingtao 0.45$ 26.55$ 59.5x
Assumed Assumed Implied Implied 5 YR Growth EPS - YR 5 P/E - YR 5 Price - YR 5 5 YR Return
Grolsch 10% 1.82$ 20x 36.49$ 44.8%Tsingtao 30% 1.66$ 25x 41.40$ 55.9%
Grolsch sells into the stagnant European market, while Tsingtao will benefit from the rapidly growing greater Asian economy
In the end, Tsingtao looks like a better pick, but both stocks are priced to give comparable returns

The lesson is that RV models can be a good start, but they are inherently flawed.
Always dig deeper!
Relative value analysis