Embed Size (px)
Citation preview

N E X T 1 0 1
The Road Ahead for Zero-Emission Vehicles in Cal i fornia: Market Trends & Pol icy Analysis
The Road Ahead for Zero-Emission Vehicles in CaliforniaMarket Trends & Policy Analysis
JANUARY 2018

N E X T 1 0 2
The Road Ahead for Zero-Emission Vehicles in Cal i fornia: Market Trends & Pol icy Analysis
NEXT 10 is an independent nonpartisan organization that educates, engages and empowers Californians to improve the state’s future.
Next 10 is focused on innovation and the intersection be-
tween the economy, the environment, and quality of life
issues for all Californians. We provide critical data to help
infrom the state’s effors to grow the economy and reduce
greenhouse gas emissions. Next 10 was founded in 2003
by businessman and philanthropist F. Noel Perry.
PRODUCED BY
Next 10
F. Noel Perry
Colleen Kredell
Marcia E. Perry
Stephanie Leonard
PREPARED BY
Beacon Economics
Adam Fowler
Hoyu Chong
Peter Breslin
DESIGN BY
José Fernandez
ONLINE AT
www.next10.org
A P R O J E C T O F

N E X T 1 0 3
The Road Ahead for Zero-Emission Vehicles in Cal i fornia: Market Trends & Pol icy Analysis
E X E C U T I V E S U M M A RY
In March of 2012, Gov. Jerry Brown set a goal of putting 1.5 million
zero-emission vehicles (ZEVs) on California’s roads by 2025. Today,
California is well on its way toward reaching that goal.
There have been bumps in the road, but
technology and market trends in Califor-
nia and around the world are accelerating
adoption of electric vehicles. And just as
cell phones upended the telecommunica-
tions industry, electric and autonomous
vehicle technologies, combined with new
business models, promise to transform the
transportation industry.
By October 2017, 337,483 ZEVs had been
sold in California, and market growth is ac-
celerating. ZEV sales increased 29.1 per-
cent in California between October 2016
and October 2017, with ZEVs reaching 4.5
percent market share compared to 3.6
percent market share in 2016.
For the most common type of ZEV — the
electric vehicle (EV) — the battery is the
most expensive component by far, and
battery costs are falling fast.1 From 2010 to
2016, battery costs fell from $1,000 to $209
per kilowatt-hour.2 This has allowed car
companies to offer greater driving range
and better performance at lower price
1 Zero-emission vehicles (ZEVs) are defined by The California ZEV Action Plan as including battery electric vehicles (BEVs), plug-in hybrid vehicles (PHEVs), and fuel cell electric vehicles (FCEVs). As the market share for FCEVs is minis-cule compared to the other types of ZEVs, this brief will focus on BEVs and PHEVs, simplified to electric vehicles (EVs).
2 Chediak, M. (2017). “The Latest Bull Case for Electric Cars: the Cheapest Batteries Ever.” Bloomberg New Energy Finance. December 5, 2017. Available at: https://www.bloomberg.com/technology
3 “Global Electric Passenger Car Sales Database, Forecast to 2025.” Frost & Sullivan. September 25, 2017. Available at: https://store.frost.com/global-electric-passenger-car-sales-database-forecast-to-2025.html#.WlZPJJH6mME.link
4 “Global Plug-In Vehicle Sales 2015.” EV Volumes: The Electric Vehicle World Sales Database. Available at: http://www.ev-volumes.com/news/global-plug-in-vehicle-sales/
5 “Dynamics in the Global Electric-Vehicle Market.” McKinsey & Company. July 2017. Available at: https://www.mckin-sey.com/industries/automotive-and-assembly/our-insights/dynamics-in-the-global-electric-vehicle-market
points, while expanding the number and
type of EV models they offer. Consumers
are responding positively, not just in Califor-
nia but also around the world. Last year, in
2017, global passenger electric vehicle sales
reached about 1 million,3 up from half a mil-
lion in 2015.4
As the world moves toward electrified trans-
portation, China has emerged as a market
leader. Chinese manufacturers produced
43 percent of EVs worldwide in 2016, while
the U.S. produced 17 percent.5 China is
leading on the policy front, as well, joining
India, France, the UK and the Netherlands
in announcing intentions to ban sales of
gasoline-powered cars.
As the rest of the world puts a priority on
ZEVs, the U.S. government appears to
be moving in the opposite direction, but
California remains committed to accelerat-
ing the transition to ZEVs. A bill before the
California legislature would ban sales of
non-ZEV cars by 2040, and Gov. Brown has
expressed interest in the idea of phasing out

N E X T 1 0 4
The Road Ahead for Zero-Emission Vehicles in Cal i fornia: Market Trends & Pol icy Analysis
vehicles powered by internal combustion engines (ICEVs). As the sixth-largest economy in the
world, California’s actions affect the global automobile market.
This report analyzes California’s ZEV market, including historic sales, costs, technology
trends, forecasts and challenges. It also reviews policies and implications that could affect
future market growth.
Summary of key findings
California’s leadership: California is a leader among U.S. states, but ZEV sales are on the
rise across the country.
• California 2017 ZEV sales increased 29.1% over 2016, while US 2017 ZEV sales grew by 28.8% over 2016.6
• ZEV market share in California was 4.5% in 2017, up from 3.6 % in 2016.7 This com-pares to 2017 ZEV market share of 1.1% in the U.S. and 1.8% in China.8
• When the state’s ZEV goal was enacted in 2012, California needed to average 35.5% annual growth in ZEV sales from 2013 to 2025 to meet its goal.9 But given the 29.1% increase in year-to-date 2017 sales, the annual growth rate required to meet the ZEV goal has decreased to 20% annually.
• Even if California’s sales growth were to slow by 5%, we project the state will easily meet its 1.5 million ZEV goal by 2025, if not before.10
Market Trends: Factors driving acceleration or deceleration of ZEV adoption include: price,
performance, choice, convenience, and public policy. Current trends suggest that cost,
range, selection and charging-time barriers to EV adoption are likely to continue to lessen,
while increased competition will continue to lower costs and improve technology. Figure 1
illustrates that as EV sales rates have continued to increase in the state, range has steadily
improved and battery cost has steeply declined, indicating a maturing market for EVs.
Total Cost of Ownership: While upfront costs for electric vehicles are higher than their
ICE equivalents, life cycle fuel and maintenance costs are decidedly lower. An analysis of
17 popular 2017 models found some ZEVs can be price competitive now, without govern-
ment incentives.
6 Advanced Technology Vehicle Sales Dashboard, Alliance of Automobile Manufacturers. Available at: https://autoalliance.org/energy-environment/advanced-technology-vehicle-sales-dashboard/
7 Bohlsen, M. (2017). “EV Company News for the Month of October 2017.” Seeking Alpha. November 1, 2017. Available at: https://seekingalpha.com/article/4118944-ev-company-news-month-october-2017
8 “Global EV Outlook 2017 – Two Million and Counting” (2017). Clean Energy Ministerial. International Energy Agency. Available at: https://www.iea.org/publications/freepublications/publication/GlobalEVOutlook2017.pdf
9 2013 ZEV Action Plan. Governor’s Interagency Working Group on Zero-Emission Vehicles. Available at: http://opr.ca.gov/docs/Governor’s_Office_ZEV_Action_Plan_(02-13).pdf
10 Assumes the state has until December 2025 to meet the goal instead of January 2025

N E X T 1 0 5
The Road Ahead for Zero-Emission Vehicles in Cal i fornia: Market Trends & Pol icy Analysis
BEV
& P
HEV
Sal
es in
Cal
iforn
iaBa
tter
y Ra
nge
(EPA
Rat
ed M
iles) Battery C
ost (USD
per KWh)
0
8,000
16,000
24,000
32,000
40,000
48,000
56,000
64,000
2017201620152014201320122011
Source: U.S. Department of Energy; U.S. Environmental Protection Agency; Bloomberg New Energy Finance; Alliance of Automobile ManufacturersNote: Range estimates are based on EPA ratings (not NEDC ratings)
0
20
40
60
80
100
120
140
160
0
100
200
300
400
500
600
700
800
UnitSales Range
Battery Range BEV sales (California) PHEV sales (California) Battery Cost
Pric
e pe
r Kilo
wat
t-ho
ur
$0
0
$100$200$300$400$500$600$700$800$900
$1,000
203020292028202720262025202420232022202120202019201820172016201520142013201220112010
Source: Bloomberg New Energy Finance; calculations by Beacon EconomicsNote: The quoted lithium-ion battery costs include cell plus pack prices
Actual Cost Forecasted Cost
Actual cost decline between 2010 and 2016: 19.5% per year
Projected cost decline between 2016 and 2025: 9.7% per year
Projected cost decline between 2025 and 2030: 7.7% per year
Figure 1: Lithium-Ion Battery Cost, Battery Range (BEV), and Sales in California (BEV)
Figure 2: Lithium-Ion Battery Cost
Price: The most expensive component
of a ZEV is the battery. From 2010-2016,
average battery cost per kilowatt-hour
has dropped 74% from over $1,000 to just
$273/Kwh (see Figure 2).11
11 Soulopoulos, N. (2017). “When Will Electric Vehicles be Cheaper than Conventional Vehicles?” Bloomberg New Energy Finance. April 12, 2017. Available at: https://data.bloomberglp.com/bnef/sites/14/2017/06/BNEF_2017_04_12_EV-Price-Parity-Report.pdf
12 Ibid.
Performance: For the last 25 years, battery
density has improved 5-7% annually, and
in recent years, battery range has been im-
proving considerably. In 2017, Tesla Model
S had the farthest EPA-rated range for an
all-electric vehicle, at 315 miles.12
N E X T 1 0 6
The Road Ahead for Zero-Emission Vehicles in Cal i fornia: Market Trends & Pol icy Analysis
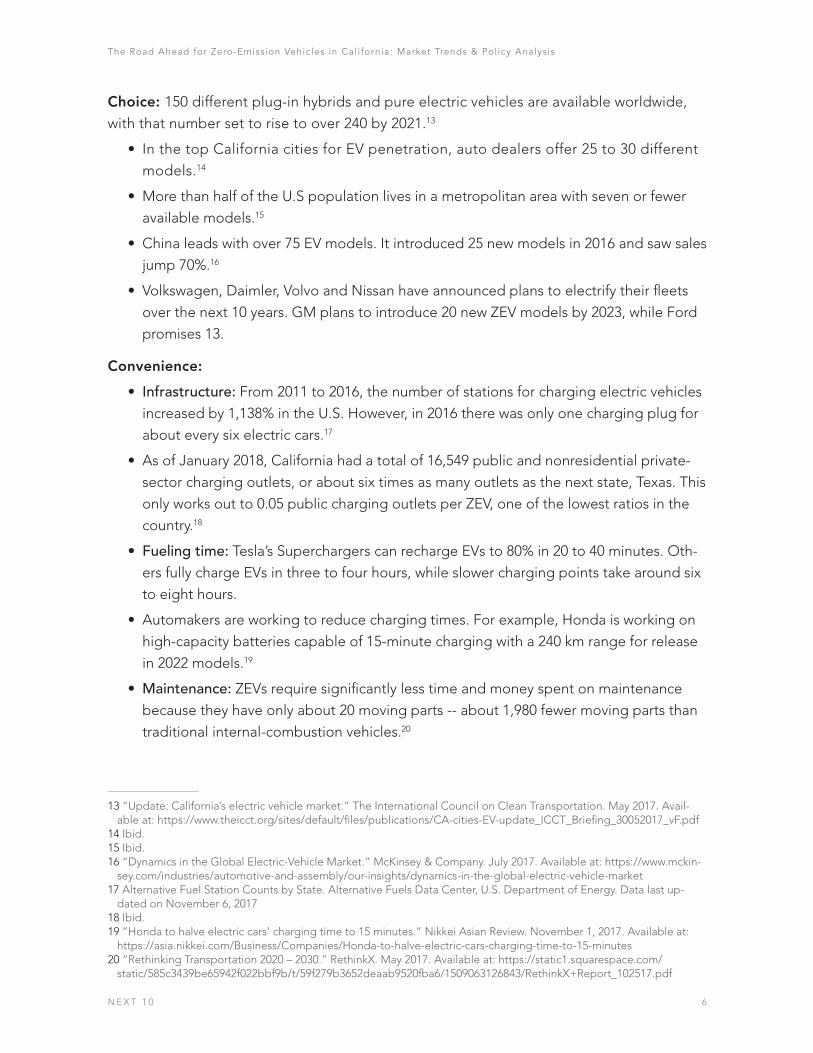
Choice: 150 different plug-in hybrids and pure electric vehicles are available worldwide,
with that number set to rise to over 240 by 2021.13
• In the top California cities for EV penetration, auto dealers offer 25 to 30 different
models.14
• More than half of the U.S population lives in a metropolitan area with seven or fewer
available models.15
• China leads with over 75 EV models. It introduced 25 new models in 2016 and saw sales
jump 70%.16
• Volkswagen, Daimler, Volvo and Nissan have announced plans to electrify their fleets
over the next 10 years. GM plans to introduce 20 new ZEV models by 2023, while Ford
promises 13.
Convenience:
• Infrastructure: From 2011 to 2016, the number of stations for charging electric vehicles
increased by 1,138% in the U.S. However, in 2016 there was only one charging plug for
about every six electric cars.17
• As of January 2018, California had a total of 16,549 public and nonresidential private-
sector charging outlets, or about six times as many outlets as the next state, Texas. This
only works out to 0.05 public charging outlets per ZEV, one of the lowest ratios in the
country.18
• Fueling time: Tesla’s Superchargers can recharge EVs to 80% in 20 to 40 minutes. Oth-
ers fully charge EVs in three to four hours, while slower charging points take around six
to eight hours.
• Automakers are working to reduce charging times. For example, Honda is working on
high-capacity batteries capable of 15-minute charging with a 240 km range for release
in 2022 models.19
• Maintenance: ZEVs require significantly less time and money spent on maintenance
because they have only about 20 moving parts -- about 1,980 fewer moving parts than
traditional internal-combustion vehicles.20
13 “Update: California’s electric vehicle market.” The International Council on Clean Transportation. May 2017. Avail-able at: https://www.theicct.org/sites/default/files/publications/CA-cities-EV-update_ICCT_Briefing_30052017_vF.pdf
14 Ibid.15 Ibid. 16 “Dynamics in the Global Electric-Vehicle Market.” McKinsey & Company. July 2017. Available at: https://www.mckin-
sey.com/industries/automotive-and-assembly/our-insights/dynamics-in-the-global-electric-vehicle-market17 Alternative Fuel Station Counts by State. Alternative Fuels Data Center, U.S. Department of Energy. Data last up-
dated on November 6, 201718 Ibid.19 “Honda to halve electric cars’ charging time to 15 minutes.” Nikkei Asian Review. November 1, 2017. Available at:
https://asia.nikkei.com/Business/Companies/Honda-to-halve-electric-cars-charging-time-to-15-minutes 20 “Rethinking Transportation 2020 – 2030.” RethinkX. May 2017. Available at: https://static1.squarespace.com/
static/585c3439be65942f022bbf9b/t/59f279b3652deaab9520fba6/1509063126843/RethinkX+Report_102517.pdf

N E X T 1 0 7
The Road Ahead for Zero-Emission Vehicles in Cal i fornia: Market Trends & Pol icy Analysis
Public Policy: International, national and state policy may play a role in California’s ZEV market.
• National governments including China, the UK, France, the Netherlands and India have
stated the intention to phase out the the internal combustion engine.
• CA and other leading states are moving to accelerate ZEV adoption. Eight states
including CA signed a memorandum of understanding (MoU) committed to bring 3.5
million ZEVs on the road by 2025.
∙ As of October 2017, California had fulfilled 22.5 % of the MoU goal, followed
by Oregon with 10%. California appears to be the only state on track to fulfill its
MoU goals.21
∙ In January 2018, Assembly Budget Committee Chairman Phil Ting introduced a
bill that would ban gas-powered cars by 2040.22
• There are a number of public policies and funding mechanisms within California to
promote the development of charging infrastructure, including settlement funds from
Volkswagen’s diesel emissions case.
• The growth of ZEVs represents a significant potential drain on motor vehicle fuel taxes,
which could drive a funding gap in state transportation revenue.
• Grid overload is another concern. The California Public Utilities Commission is study-
ing the effects this may have on the grid, while SoCal Edison and the Los Angeles Air
Force Base are conducting a pilot program that allows electric vehicles to act as battery
storage and send power back to the grid.23
21 Schulock, C. (2016). “Manufacturer Sales Under the Zero Emission Vehicle Regulation.” Natural Resources Defense Council. July 21, 2016. Available at: https://www.nrdc.org/sites/default/files/media-uploads/nrdc_commissioned_zev_report_july_2016_0.pdf
22 “Assemblymember Ting Introduces Clean Cars 2040.” January 3, 2018. Available at: https://a19.asmdc.org/press-releases/20180103-assemblymember-ting-introduces-clean-cars-2040
23 Zero Emission Vehicles, CPUC. http://www.cpuc.ca.gov/zev/#Vehicle

N E X T 1 0 8
The Road Ahead for Zero-Emission Vehicles in Cal i fornia: Market Trends & Pol icy Analysis
I N T R O D U C T I O N
Technology is disrupting the automobile industry at an unprece-
dented rate. Just as cell phones upended the phone industry and
solar technology is disrupting the utility business model, electric,
plug-in hybrid, and autonomous vehicle technology, combined
with new business models, promise to transform the automotive
industry. In fact, in many ways they already are.
2017 was a watershed year; as battery costs
fell, range continued to expand dramatical-
ly. From 2010 to 2016, battery costs fell from
$1,000 per kWh to $209 per KWh, according
to Bloomberg New Energy Finance.24 Auto
manufacturers around the world have ex-
panded their electric vehicle offerings and
are working to improve both performance
and cost. Just recently, Tesla announced
the planned launch of its Roadster, which
the manufacturer boasts will provide a 620
mile range. California has signaled interest
in banning the internal combustion engine.
Global passenger electric vehicle sales will
hit about 1 million in 2017,25 up from half a
million in 2015.26
The world is moving quickly to electrified
transportation, and China is leading the
way. Chinese manufacturers produced 43
percent of electric vehicles (EVs) worldwide
in 2016, while the U.S. produced only 17
24 Chediak, M. (2017). “The Latest Bull Case for Electric Cars: the Cheapest Batteries Ever.” Bloomberg New Energy Finance. December 5, 2017. Available at: https://www.bloomberg.com/technology
25 “Global Electric Passenger Car Sales Database, Forecast to 2025.” Frost & Sullivan. September 25, 2017. Available at: https://store.frost.com/global-electric-passenger-car-sales-database-forecast-to-2025.html#.WlZPJJH6mME.link
26 Ayre, James. “Global Electric Car Sales Surpasses Half A Million In 2015.” Clean Technica. March 8, 2016. Available at: https://cleantechnica.com/2016/03/08/global-electric-car-sales-surpasses-half-a-million-in-2015/
27 “Dynamics in the Global Electric-Vehicle Market.” McKinsey & Company. July 2017. Available at: https://www.mckin-sey.com/industries/automotive-and-assembly/our-insights/dynamics-in-the-global-electric-vehicle-market
28 “Update: California’s electric vehicle market.” The International Council on Clean Transportation. May 2017. Avail-able at: https://www.theicct.org/sites/default/files/publications/CA-cities-EV-update_ICCT_Briefing_30052017_vF.pdf
percent. While air quality challenges may
have driven the Chinese government to
push for EV growth and innovation, utilizing
subsidies to help encourage adoption, the
fact remains that the global auto market is
shifting increasingly toward the expansion
of electric vehicle offerings. Sales of EVs in
China increased 70 percent between 2015
and 2016 with cumulative EV sales reaching
650,000, overtaking the U.S. in cumulative
sales for the first time. Chinese sales are
spurred by a choice of approximately 75 EV
models, more than any other market, with
roughly 25 new EV models introduced in
2016 alone.27
By comparison, California has up to 30
models in largest metropolitan areas with
high EV penetration as of the end of 2016.28
China is targeting 35 million electric ve-
hicle sales by 2025 and wants what they call
“New Energy Vehicles” (NEVs) to make up
N E X T 1 0 9
The Road Ahead for Zero-Emission Vehicles in Cal i fornia: Market Trends & Pol icy Analysis
at least one-fifth of the total fleet by then. Bloomberg New Energy Finance projects 530
million electric vehicles, a third of the world fleet, will be on the road by 2040.
Despite the prioritization of “new energy vehicles” and zero-emission vehicles (ZEVs)29 globally, the current federal U.S. government has yet to see the potential for this rapidly growing market. Federal incentives for electric vehicles managed to avoid the recent tax cut–though their potential removal was contested–and vehicles emission standards agreed to by automakers, the federal government and California in 2012 are now being reevaluated – a move that could hinder ZEV innovation and sales.30
With a goal of putting 1.5 million ZEVs on the road by 2025, California leads the country in policy. As the sixth largest economy in the world, what the state does here has direct market impact. To better understand how California may be impacted by the evolving global ZEV industry, this report analyzes the state’s ZEV market, including historic sales, costs and tech-nology trends, forecasts and challenges, policies and implications for future market growth.
29 Zero-emission vehicles (ZEVs) are defined by The California ZEV Action Plan as including battery electric vehicles (BEVs), plug-in hybrid vehicles (PHEVs), and fuel cell electric vehicles (FCEVs). As the market share for FCEVs is minis-cule compared to the other types of ZEVs, this brief will focus on BEVs and PHEVs, simplified to electric vehicles (EVs).
30 Colias, Mike. “Tax Credit for Electric Vehicles Survives, in Win for Tesla and Other Auto Makers.” Wall Street Journal. December 15, 2017. Available at: https://www.wsj.com/livecoverage/tax-bill-2017/card/1513389842
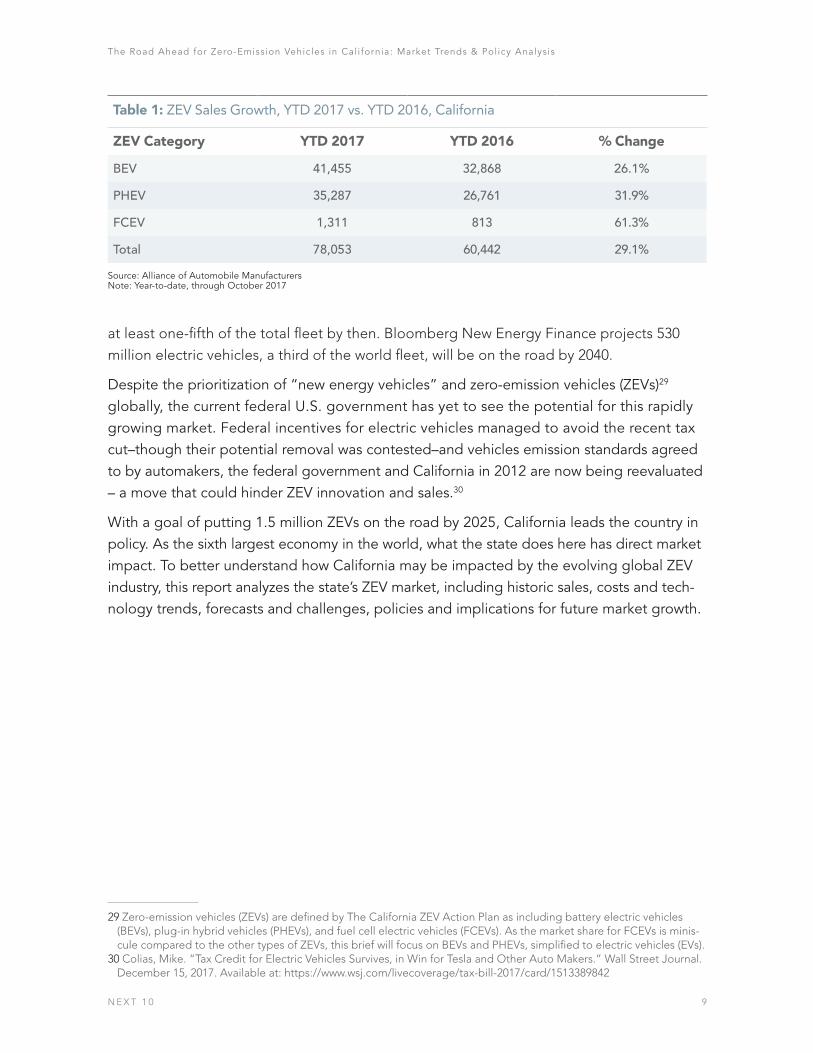
Table 1: ZEV Sales Growth, YTD 2017 vs. YTD 2016, California
ZEV Category YTD 2017 YTD 2016 % Change
BEV 41,455 32,868 26.1%
PHEV 35,287 26,761 31.9%
FCEV 1,311 813 61.3%
Total 78,053 60,442 29.1%
Source: Alliance of Automobile ManufacturersNote: Year-to-date, through October 2017

N E X T 1 0 10
The Road Ahead for Zero-Emission Vehicles in Cal i fornia: Market Trends & Pol icy Analysis
B Y T H E N U M B E R S : T R E N D S I N S A L E S , C O S T & T E C H N O L O G Y
Overall, electric vehicle average sales in California increased by 29 percent from year-to-date 2016 to year-to-date 2017. Table 1 indicates that as of October 2017, California sales of all types of ZEVs have been impressive. Battery electric vehicles (BEV) were the largest category with 41,455 sold from January to October 2017. Comparatively, 32,868 BEVs were sold during the same time period in 2016, a 26.1 percent increase. Growth in plug-in hybrid EV (PHEV) sales is also impressive, with a 31.9 percent increase over last year so far and 35,287 sold as of October 2017 year-to-date. Fuel cell electric vehicles (FCEV) had the largest marginal increase, raising sales by 61.3 percent from 813 to 1,311 sold.31
ZEVs are making up an increasing share of total automobile sales in California. Year-to-date ZEV sales in 2017 stands at 4.5
31 Advanced Technology Vehicle Sales Dashboard, Alliance of Automobile Manufacturers. Available at: https://autoal-liance.org/energy-environment/advanced-technology-vehicle-sales-dashboard/
32 Bohlsen, M. (2017). “EV Company News for the Month of October 2017.” Seeking Alpha. November 1, 2017. Avail-able at: https://seekingalpha.com/article/4118944-ev-company-news-month-october-2017
33 “Global EV Outlook 2017 – Two Million and Counting” (2017). Clean Energy Ministerial. International Energy Agency. Available at: https://www.iea.org/publications/freepublications/publication/GlobalEVOutlook2017.pdf
percent of the total market, a consider-ably leap from 2016’s 3.6 percent share.32 By comparison, the market share of ZEVs as percentage of total sales in the U.S. is 1.1 percent in year-to-date 2017, a slight increase over last year’s 0.9 percent market share. In China, the EV market makes up 1.8 percent of the total market, up from 1.4 percent in 2016.33
This kind of growth represents a trend with exponential implications. As of October 2017, sales growth in the U.S. without California more or less followed that of California. While national sales growth for PHEVs (+24.1%) trailed behind that of California (+31.9%), sales growth for BEVs (+33.9%) actually surpassed that of California (+26.1%) thus far. Overall, year-to-date ZEV sales in the U.S. grew by 28.8 percent, which is comparable to Califor-nia’s 29.1 percent.
Historic and Current ZEV Sales
California is the nation’s leader in ZEV sales, responsible for
49.3 percent of total U.S. sales. As of October 2017, a total of
337,483 ZEVs were sold in the state, compared to the national
total of 683,890.

N E X T 1 0 11
The Road Ahead for Zero-Emission Vehicles in Cal i fornia: Market Trends & Pol icy Analysis
Table 2: ZEV Sales Growth, YTD 2017 vs. YTD 2016, U.S. without California
ZEV Category YTD 2017 YTD 2016 % Change
BEV 36,992 27,634 33.9%
PHEV 37,241 30,003 24.1%
FCEV 2 3 -33.3%
Total 74,235 57,640 28.8%
Source: Alliance of Automobile ManufacturersNote: Year-to-date, through October 2017
ZEV
Mar
ket S
hare
(% o
f Tot
al S
ales
)
0
1%
2%
3%
4%
5%
2017 YTD201620152014
Source: : IHS MarkitNote: 2017 year-to-date to Q2-2017
BEV % PHEV %
Figure 3: ZEV Market Share, California, 2014 to YTD 2017
Of the total 152,288 ZEVs sold year-to-date 2017 in the US, 51.2 percent were sold in California, which is roughly about the same as the shares from 2013 to 2016, and a notable increase from 2012 and earlier, when ZEVs sales in California accounted for 44 percent or less of total sales.

N E X T 1 0 12
The Road Ahead for Zero-Emission Vehicles in Cal i fornia: Market Trends & Pol icy Analysis
G L O B A L C O M PA R I S O N S
On the global stage, California is more comparable to the leading
countries internationally – in terms of ZEV sales as percentage of
total sales - than it is to the U.S. itself. California’s overall ZEV sales
as share of total sales was about five percent in 2017 – behind
Norway’s 39 percent and comparable to China’s five percent.
What this Means for California
These trends bode well for California’s ZEV market and policy goals. When the state’s Action Plan of 1.5 million ZEVs on Califor-nia roadways was introduced, California needed an average of 35.5 percent annual growth from 2013 to 2025.34 But with the 29 percent increase in sales year-to-date,
34 2013 ZEV Action Plan. Governor’s Interagency Working Group on Zero-Emission Vehicles. Available at: http://opr.ca.gov/docs/Governor’s_Office_ZEV_Action_Plan_(02-13).pdf
35 Assumes the state has until December 2025 to meet the goal instead of January 2025
the annual growth rate required to meet the ZEV goal has decreased to 20 percent annually. Projecting forward this trend, California will handily meet the state’s 1.5 million ZEV goal by 2025.35 Even when testing with a conservative assumption of five percent diminishing growth rate, both assumptions would place the Golden State far above its self-imposed 2025 goal.
Figure 4: Global EV (BEV & PHEV) Market Share, 2014 to 2017*
ZEV
Sale
s as
Sha
re o
f Tot
al S
ales
Source: International Energy Agency, Clean Energy Ministerial; IHS/Markit; InsideEVs; EV Norway; The Advisory Council of Veitrafikken AS (OFV AS); BIL Sweden; The Society of Motor Manufacturers and Traders (SMMT); European Alternative Fuels Observatory; China Association of Automobile Manufacturers.*Note: China's 2017 market share is as of November 2017. California's 2017 market share is as of Q2-2017.
2014 2015 2016 2017
0
5%
10%
15%
20%
24%
30%
35%
40%
NorwayChinaCaliforniaSwedenThe UKThe NetherlandsFranceThe US
N E X T 1 0 13
The Road Ahead for Zero-Emission Vehicles in Cal i fornia: Market Trends & Pol icy Analysis
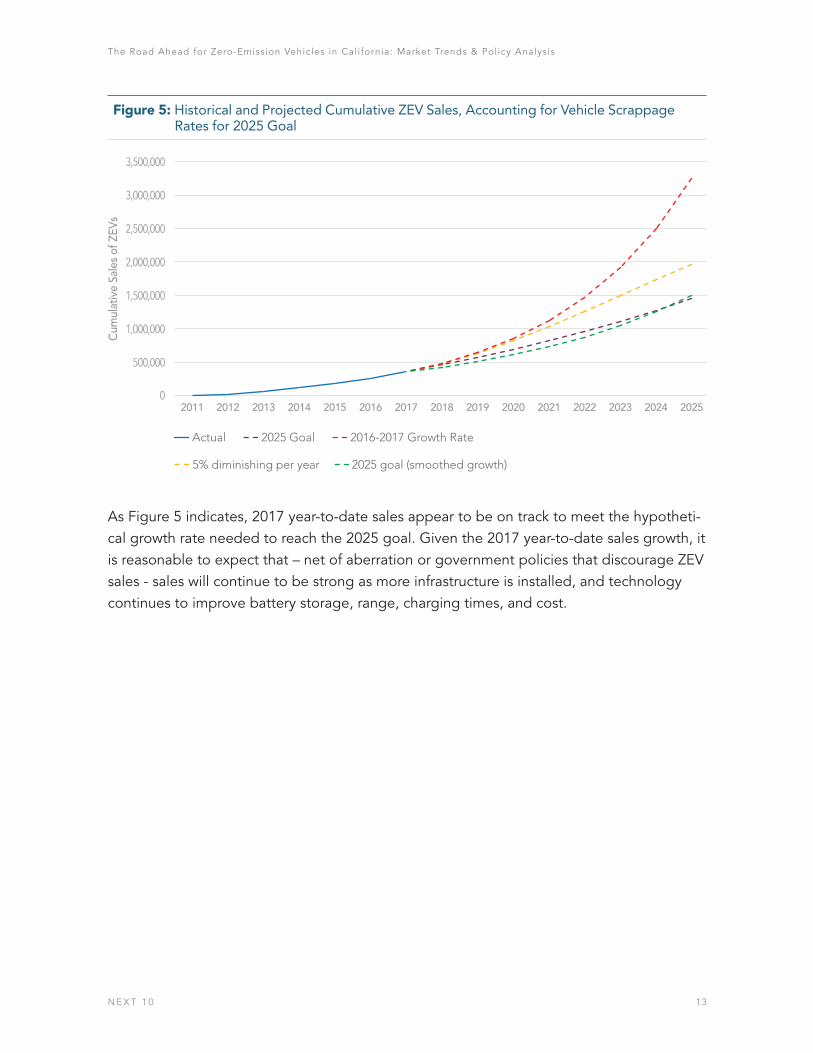
Figure 5: Historical and Projected Cumulative ZEV Sales, Accounting for Vehicle Scrappage Rates for 2025 Goal
Cum
ulat
ive
Sale
s of
ZEV
s
Actual 2025 Goal 2016-2017 Growth Rate
5% diminishing per year 2025 goal (smoothed growth)
0
500,000
1,000,000
1,500,000
2,000,000
2,500,000
3,000,000
3,500,000
202520242023202220212020201920182017201620152014201320122011
As Figure 5 indicates, 2017 year-to-date sales appear to be on track to meet the hypotheti-cal growth rate needed to reach the 2025 goal. Given the 2017 year-to-date sales growth, it is reasonable to expect that – net of aberration or government policies that discourage ZEV sales - sales will continue to be strong as more infrastructure is installed, and technology continues to improve battery storage, range, charging times, and cost.

N E X T 1 0 14
The Road Ahead for Zero-Emission Vehicles in Cal i fornia: Market Trends & Pol icy Analysis
D R I V I N G FA C T O R S
While the aforementioned projection scenarios indicate that
California is likely to reach 1.5 million ZEVs on the road by 2025 or
earlier, there are several factors that may drive future acceleration
or deceleration of adoption: Price, Performance, Choice,
Convenience, and Public Policy.
To understand market growth potential of
electric vehicles, it is helpful to understand
critical selling points and how they differ
between ZEVs (inclusive here of BEVs and
PHEVs) and internal combustion engine
(ICE) vehicles. This section analyzes trends
in price, including current ownership
costs, upfront costs, and trends in factors
that affect those costs, such as batteries,
R&D, materials and incentives. Technology
trends affecting performance, convenience
and consumer choice are also analyzed
here, including range, fueling, mainte-
nance, infrastructure and charging. Lastly,
this section examines public policies at the
national and subnational levels to evaluate
potential impact on market growth. This
analysis reveals both bridges and barri-
ers to adoption of ZEVs. In some cases,
trends suggest some of these barriers are
only temporary, while others require active
intervention to solve for the long-term.
36 Raustad, R. and P. Fairey (2014). “Electric Vehicle Life Cycle Costs Assessment.” Electric Vehicle Transportation Cen-ter, FSEC-CR-1984-14
37 ZEV Program Implementation Task Force (2014). “Multi-State ZEV Action Plan.” Page 9. Available at: http://www.nescaum.org/topics/zero-emission-vehicles/multi-state-zev-action-plan
PRICE
Current Cost of Ownership
At present, the MSRP of an electric vehicle
is still higher than its internal combustion
engine equivalent, largely due to the bat-
tery cost. But while upfront costs are higher,
life cycle fuel and maintenance costs are
decidedly lower.
Using a life cycle cost model, Raustad and
Fairey (2014) find that based on 12,330 miles
driven per year, the pure battery electric
Nissan Leaf has lower five-year and 10-year
life cycle costs than the internal combus-
tion Hyundai Elantra and the plug-in hybrid
Chevrolet Volt, even without the federal
government incentive.36 Similarly, the Multi-
State ZEV Action Plan study (2014) con-
cludes that the five-year cost of ownership
of a 2013 model year Nissan Leaf ($36,892)
is $8,057 lower than a general conventional
vehicle ($44,949) and $7,433 lower than a
generic hybrid vehicle ($44,325).37

N E X T 1 0 15
The Road Ahead for Zero-Emission Vehicles in Cal i fornia: Market Trends & Pol icy Analysis
Table 3: Total Cost of Ownership (TCO), 8,572 Annual Miles, Thousands of Dollars
With Incentives Without Incentives
Make
Type5 Year Cost
10 Year Cost
15 Year Cost
5 Year Cost
10 Year Cost
15 Year Cost
Nissan Leaf BEV $35.5 $45.2 $55.0 $45.5 $55.2 $65.0
smart fortwo ED BEV $29.5 $39.3 $49.1 $39.5 $49.3 $59.1
Tesla Model S (60 kw) BEV $76.6 $86.4 $96.1 $86.6 $96.4 $106.1
Chevrolet Bolt BEV $41.9 $51.5 $61.0 $51.9 $61.5 $71.0
BMW i3 BEV BEV $47.7 $58.9 $70.1 $57.7 $68.9 $80.1
Chevrolet Volt PHEV $40.0 $50.7 $61.4 $49.0 $59.7 $70.4
Toyota Prius Prime PHEV $38.1 $47.2 $56.3 $44.1 $53.2 $62.3
Ford Fusion Energi PHEV PHEV $43.5 $54.0 $64.6 $49.0 $59.5 $70.1
Chrysler Pacifica Hybrid PHEV $50.4 $61.7 $73.1 $59.4 $70.7 $82.1
Toyota Prius Hybrid HEV $40.0 $50.9 $61.8 $40.0 $50.9 $61.8
Honda Accord Hybrid HEV $45.8 $56.8 $67.9 $45.8 $56.8 $67.9
Toyota RAV4 Hybrid HEV $46.3 $59.1 $71.8 $46.3 $59.1 $71.8
Chevrolet Silverado 15 Hybrid
HEV $64.8 $77.9 $91.1 $64.8 $77.9 $91.1
Honda Civic 4Dr Gasoline ICEV $35.0 $46.9 $58.9 $35.0 $46.9 $58.9
Dodge Grand Caravan Gasoline
ICEV $42.4 $56.8 $71.2 $42.4 $56.8 $71.2
Lexus ES 350 Gasoline ICEV $57.7 $71.0 $84.3 $57.7 $71.0 $84.3
Mercedes-Benz E300 Gasoline
ICEV $72.6 $86.3 $100.0 $72.6 $86.3 $100.0
Source: Alternative Fuels Data Center, Department of Energy; Energy Information Administration; Calculations by Beacon Economics
Using the Alternative Fuels Data Center’s (AFDC) Vehicle Cost Calculator as the basis for
analysis, 17 popular vehicle models ranging from small sedans to pick-up trucks were select-
ed in order to calculate the total cost of ownership (TCO) in five-year, ten-year, and 15-year
terms, with and without government incentives. Assumptions used for the TCO calculations
can be found in Appendix A. For this simulation, two scenarios were modeled with different
annual miles driven: a more conservative estimate of 8,572 miles/year and a higher estimate
of 14,435 miles/year driven. All models selected are the 2017 model-year version, and the
results are presented in Tables 3 and 4.

N E X T 1 0 16
The Road Ahead for Zero-Emission Vehicles in Cal i fornia: Market Trends & Pol icy Analysis
With California and Federal incentives, the smart fortwo ED has the lowest total cost of
ownership regardless of the time horizon. The Honda Civic, one of the most economic
and popular models, has the second lowest cost of ownership on a five-year basis but falls
behind the Nissan Leaf due to the higher cost of fuel.38 Without government incentives, the
Honda Civic slightly edges out the smart fortwo ED and the Toyota Prius Prime.
It is important to note that the AFDC calculator very likely overstates the cost of ZEV own-
ership and even without government incentives, ZEVs can still be price competitive. First,
the AFDC calculator assumes the same maintenance expense regardless of fuel type,
despite the electric drivetrain having fewer moving parts (and thus lower maintenance
costs) than conventional gasoline engine.39 The calculator also does not take additional
state incentives such as utility-rate reductions into account. For example, Pacific Gas &
Electric customers with electric vehicles are eligible to receive $500 Clean Fuel Rebate for
using electricity as a clean transportation fuel.40 Also, San Diego Gas & Electric custom-
ers who own or lease a BEV or PHEV are eligible to receive credits worth $50 to $200 per
vehicle.41 Finally, Southern California Edison customers who own or lease a BEV or PHEV
are eligible for a $450 Clean Fuel Rebate.42
It should also be taken into account that many people drive more than 8,572 miles per year.
According to the U.S. Department of Transportation Federal Highway Administration, in
2015, vehicle miles per licensed driver in California was 14,435 miles per year.
At 14,435 miles driven per year and with incentives, the smart fortwo ED and the Nissan Leaf
have the lowest total cost of ownership regardless of the time horizon. While the Honda
Civic finishes third in the 5-year scenario, both the Toyota Prius Prime and the Ford Fusion
Energi PHEV surpass the Honda Civic to finish having the third and fourth lowest cost of
ownership after 15 years. Without government incentives, the Honda Civic is more expen-
sive to own than the smart ED and comparable to the Nissan Leaf and both versions of the
Toyota Prius after 15 years. Also, despite being almost 50 percent more expensive, the BMW
i3 has lower cost of ownership than the Toyota RAV4 Hybrid after 15 years.43 It is clear that
ZEVs can already be competitive at present even without government incentives.44
38 Data from the Department of Energy indicates that on November 11, 2017, regular gasoline costs $3.24 per gallon while electricity costs $1,73 per equivalent-gallon in California
39 A more detailed discussion of maintenance expenses between electric vehicles and conventional vehicles is included in Appendix B.
40 More information can be found at: https://www.pge.com/en_US/residential/solar-and-vehicles/options/clean-vehi-cles/electric/clean-fuel-rebate-for-electric-vehicles.page
41 More information can be found at: https://www.sdge.com/clean-energy/electric-vehicles/electric-vehicle-climate-credit
42 The program excludes electric bikes, electric motorcycles, electric scooters and neighborhood vehicles. More information can be found at: https://www.scecleanfuel.com/
43 The MSRP for the 2017 BMW i3 BEV is $42,400, which is 46 percent higher than 2017 Toyota RAV4 Hybrid’s MSRP of $29,030.44 This exercise does not consider battery replacement costs for two main reasons: 1. The life cycle of a battery pack
depends on several factors such as the chemical components, temperature, number of times the battery pack has been recharged and 2. The replacement costs vary widely depending on the make and model of a vehicle.

N E X T 1 0 17
The Road Ahead for Zero-Emission Vehicles in Cal i fornia: Market Trends & Pol icy Analysis
Table 4: Cost of Ownership, 14,435 Annual Miles, Thousands of Dollars
With Incentives Without Incentives
Make
Type5 Year Cost
10 Year Cost
15 Year Cost
5 Year Cost
10 Year Cost
15 Year Cost
Nissan Leaf BEV $38.3 $50.3 $62.2 $48.3 $60.3 $72.2
smart fortwo ED BEV $32.1 $44.4 $56.8 $42.1 $54.4 $66.8
Tesla Model S (60 kw) BEV $79.3 $91.8 $104.3 $89.3 $101.8 $114.3
Chevrolet Bolt BEV $48.2 $58.4 $68.6 $58.2 $68.4 $78.6
BMW i3 BEV BEV $50.7 $62.5 $74.3 $60.7 $72.5 $84.3
Chevrolet Volt PHEV $43.1 $56.7 $70.3 $52.1 $65.7 $79.3
Toyota Prius Prime PHEV $39.2 $52.2 $65.2 $45.2 $58.2 $71.2
Ford Fusion Energi PHEV PHEV $47.4 $61.6 $75.9 $52.9 $67.1 $81.4
Chrysler Pacifica Hybrid PHEV $54.6 $69.2 $83.9 $63.6 $78.2 $92.9
Toyota Prius Hybrid HEV $43.1 $57.1 $71.2 $43.1 $57.1 $71.2
Honda Accord Hybrid HEV $49.1 $63.4 $77.7 $49.1 $63.4 $77.7
Toyota RAV4 Hybrid HEV $51.0 $67.8 $84.5 $51.0 $67.8 $84.5
Chevrolet Silverado 15 Hybrid
HEV $67.8 $87.6 $107.5 $67.8 $87.6 $107.5
Honda Civic 4Dr Gasoline ICEV $39.0 $54.5 $70.1 $39.0 $54.5 $70.1
Dodge Grand Caravan Gasoline
ICEV $48.5 $68.1 $87.6 $48.5 $68.1 $87.6
Lexus ES 350 Gasoline ICEV $62.7 $80.6 $98.5 $62.7 $80.6 $98.5
Mercedes-Benz E300 Gasoline
ICEV $78.0 $96.1 $114.3 $78.0 $96.1 $114.3
Source: Alternative Fuels Data Center, Department of Energy; Energy Information Administration; Calculations by Beacon Economics
Battery replacement
When it comes to major vehicle maintenance costs, replacing an EV battery today is more
expensive than replacing an internal combustion engine. The industry does not measure
ZEV life cycles in terms of years but rather in terms of cycle charges. Note that for lithium-
ion (Li-ion) batteries, when a battery capacity is below certain percent, it is considered
dead. The cathode material and anode material may also affect the life cycle of a battery.
A test of five Li-ion batteries with different cathode and anode materials showed capacity

N E X T 1 0 18
The Road Ahead for Zero-Emission Vehicles in Cal i fornia: Market Trends & Pol icy Analysis
loss of up to 80 percent of the original capacity ranging from 240 charges to more than
1020 charges.45 Furthermore, Li-ion batteries start degrading as soon as manufactured,
even when they have never been used. High temperatures, overcharging or high voltage,
deep discharges or low voltage, and high discharges or charge current can shorten the life
of the battery. By controlling for these factors, the lifetime of the battery can be improved.
The Tesla Roadster, for example, achieves long battery life with lithium-cobalt batteries
that control for these factors.46
Upfront Price
While the upfront price tag of many ZEV vehicles is currently higher than equivalent ICEVs,
costs are coming down rapidly. Bloomberg Finance estimates that electric vehicles will be
cost-competitive with ICEV counterparts starting in 2025 onwards.47 Two of the biggest
factors driving price are research and development (R&D) and battery costs.
R&D
R&D for electric vehicles is much higher than for incremental improvements to ICE ve-
hicles. With traditional ICE vehicles, many engines are used for multiple generations of
vehicles across many models. Many automakers pay to be able to use engines from other
automakers to save on research and development costs. New versions of engines can also
use technology and data from the previous version to reduce costs. In other words, the
mature infrastructure for ICE vehicles means research and development costs expensed
on improving the internal combustion engine is very low compared to electric vehicles.
To develop electric vehicles, automakers are essentially starting from scratch, with R&D
investment requirements similar to those when the internal combustion engine was be-
ing developed. ZEV R&D is still an enormous line item for automakers, which means these
vehicles are both more expensive, and money losers for automakers. But as with any new
technology, the more that comes online, the less expensive the cost to produce.48
45 “A comparative study of commercial lithium ion battery cycle life in electric vehicle: Capacity loss estimation.” Journal of Power Sources. December 5, 2014. Available at: http://www.sciencedirect.com/science/article/pii/S0378775314009756
46 Arcus, Christopher. “Battery Lifetime: How Long Can Electric Vehicle Batteries Last?” May 31, 2016. Available at: https://cleantechnica.com/2016/05/31/battery-lifetime-long-can-electric-vehicle-batteries-last/
47 Shankleman, J. (2017). “Pretty Soon Electric Cars Will Cost Less Than Gasoline.” Bloomberg Technology. May 25, 2017. Available at: https://www.bloomberg.com/news/articles/2018-01-08/a-45-000-suv-shown-in-las-vegas-attests-to-china-s-car-ambition
48 In accounting, U.S. GAAP requires R&D costs to be expensed immediately as incurred whereas IFRS requires R&D costs to be capitalized first and then expensed as benefits are realized. This means if the cost of manufacturing ZEVs include the R&D costs (as is under IFRS), the cost of making ZEVs would be high if spread across few ZEVs. Source: http://www.kpmg-institutes.com/institutes/ifrs-institute/articles/2017/08/overview-of-r-d-under-ifrs.html

N E X T 1 0 19
The Road Ahead for Zero-Emission Vehicles in Cal i fornia: Market Trends & Pol icy Analysis
Batteries
The most expensive component of a ZEV is the battery, and battery costs are dropping
quickly and should reach a break-even point in the near future. Indeed, in the short span
of just six years, average battery cost per kilowatt-hour has dropped 74 percent from over
$1,000 to just $273/Kwh in 2016, and their energy density has improved 5 percent per year.
Bloomberg New Energy Finance estimates that battery cost will decline by almost 10 per-
cent until 2025, when ZEVs will reach price parity with ICE vehicles.49
Battery costs are projected to continue to decline rapidly, and technological advances could
accelerate that decline, but there are other factors to consider.
Materials
Supply constraints for critical materials like cobalt, lithium and graphite could slow the rap-
id decline in battery price. Olivetti et al. (2017) find that it is less likely to be due to short-
ages of the metals, and more likely that there could be short-term supply chain bottle-
necks of lithium and cobalt and that production cannot keep up with demand.50 Cobalt
and lithium are mined in the DR Congo (which faces uncertainty due to political instability)
and China (which has an ever-growing demand for ZEVs). As a result, lithium and cobalt
prices have more than doubled in the past year.51
49 Soulopoulos, N. (2017). “When Will Electric Vehicles be Cheaper than Conventional Vehicles?” Bloomberg New Energy Finance. April 12, 2017. Available at: https://data.bloomberglp.com/bnef/sites/14/2017/06/BNEF_2017_04_12_EV-Price-Parity-Report.pdf
50 Olivetti, E. A., G. Ceder, G. G. Gaustad, and X. Fu (2017). Lithium-Ion Battery Supply Chain Considerations: Analysis of Potential Bottlenecks in Critical Metals. Joule, 2017; 1 (2): 229 DOI: 10.1016/j.joule.2017.08.019. Available at: http://www.cell.com/joule/pdf/S2542-4351(17)30044-2.pdf
51 “How to Mine Cobalt Without Going to Congo.” November 30, 2017. Available at: https://www.bloomberg.com/news/articles/2017-12-01/the-cobalt-crunch-for-electric-cars-could-be-solved-in-suburbia
Pric
e pe
r Kilo
wat
t-ho
ur
$0
0
$100$200$300$400$500$600$700$800$900
$1,000
203020292028202720262025202420232022202120202019201820172016201520142013201220112010
Source: Bloomberg New Energy Finance; calculations by Beacon EconomicsNote: The quoted lithium-ion battery costs include cell plus pack prices
Actual Cost Forecasted Cost
Actual cost decline between 2010 and 2016: 19.5% per year
Projected cost decline between 2016 and 2025: 9.7% per year
Projected cost decline between 2025 and 2030: 7.7% per year
Figure 6: Lithium-Ion Battery Cost, 2010 to 2016, Projected 2030

N E X T 1 0 20
The Road Ahead for Zero-Emission Vehicles in Cal i fornia: Market Trends & Pol icy Analysis
But cobalt is not the only metal necessary for producing lithium-ion batteries – major battery
suppliers such as Samsung SDI and LG Chem have already begun development of alterna-
tive battery packs that use more nickel and less cobalt.52 And entrepreneurs are rushing to fill
the need, inventing cobalt-free alternatives.53 American Manganese Inc. recently announced
it has developed a way to produce enough cobalt to power all the electric cars on the road
today without drilling into the ground: by recycling faulty batteries. It’s one of many technol-
ogies in the works. American Manganese’s patent pending method draws out all of the met-
als in rechargeable batteries, which has 100 percent cobalt, as opposed to ore that contains
only two percent cobalt. Innovators have made so much progress that the companies like
Tesla Inc. and Toyota Motor Corp. could count on recycling for 10 percent of their battery
material needs through 2025 if companies roll out large schemes, according to Bloomberg
New Energy Finance.54
Incentives
As detailed in the policy discussion section, there are federal, state, and local incentives
for ZEV purchase.55 While analysis shows that there are cost competitive models available
now, incentives most certainly help drive sales by decreasing the cost.
52 West, K. (2017). “Carmakers’ electric dreams depend on suppliers of rare minerals.” The Guardian. Guardian News and Media Limited. July 29, 2017. Available at: https://www.theguardian.com/environment/2017/jul/29/electric-cars-battery-manufacturing-cobalt-mining
53 Lebedeva, N., F. Di Persio, and L. Boon-Brett (2016), Lithium ion battery value chain and related opportunities for Eu-rope, European Commission, Petten. The Joint Research Center of Europe predicts the introduction of other cobalt-free alternatives.
54 “How to Mine Cobalt Without Going to Congo.” November 30, 2017. Available at: https://www.bloomberg.com/news/articles/2017-12-01/the-cobalt-crunch-for-electric-cars-could-be-solved-in-suburbia
55 For an overview of ZEV incentives offered by participating MoU states, see Appendix C.

N E X T 1 0 21
The Road Ahead for Zero-Emission Vehicles in Cal i fornia: Market Trends & Pol icy Analysis
P E R F O R M A N C E
Range
While ICE vehicles can go hundreds of miles
on a tank of gas, there also is no concern
about running out except in the most re-
mote areas, as gasoline stations are ubiq-
uitous. As a result, a significant barrier to
consumer adoption is range anxiety. Even as
ZEVs with 80 mile ranges can accommodate
87 percent of current consumer daily trips,
prospective buyers worry over when and
where a car can be recharged.56
56 Needell, A., J. McNerney, M. Chang, and J. Trancik. (2015). “Potential for widespread electrification of personal vehicle travel in the United States.” Nature Energy. August 15, 2016. Available at: https://www.nature.com/articles/nenergy2016112
57 Zeyuan, C. et al. (2016). “An Ambient-air Stable Lithiated Anode for Rechargeable Li-ion Batteries with High Energy Density” Nano Letters, 2016, 16(11), pp. 7235 – 7240. DOI: 10.1021/acs.nanolett.6b03655
The energy-density, or capacity, of lithium-
ion batteries has been increasing five
to seven percent annually for the last 25
years.57 Figures 7 and 8 illustrate the battery
range of BEVs and PHEVs from recent years,
showing that both have improved consider-
ably. The top and bottom ticks of these fig-
ures represent the maximum and minimum
ranges, respectively. The upper, middle,
and lower bound of the boxes represent the
upper quartile (Q3), median (Q2), and lower
quartile (Q1), respectively.
Figure 7: Pure Battery Electric Vehicle Range Distribution
Batt
ery
Rang
e (M
iles)
Average (mean) Range
40
80
120
160
200
240
280
320
2011 2012 2013 2014 2015 2016 2017
Source: U.S. Department of Energy; U.S. Environmental Protection AgencyNote: Range estimates are based on EPA ratings (not NEDC ratings).

N E X T 1 0 22
The Road Ahead for Zero-Emission Vehicles in Cal i fornia: Market Trends & Pol icy Analysis
In 2017, Tesla Model S had the longest BEV range rated by the Environmental Protection
Agency (315 miles), which was 71 miles longer than Tesla Roadster, the longest range BEV
in 2011 with 244 miles. As for the rest of the BEVs, most models have a range of 80 to 100
miles. A number of BEVs within the 80- to 90-mile range were introduced in 2014, decreasing
the average range among all models from 104.1 miles in 2013 to 98.5 miles in 2014. There
has been considerable spike in the average range of the upper echelon of these vehicles in
2017 due to the existence of Chevrolet Bolt and the introduction of Tesla Model 3.
In 2017, for PHEVs, the Chevrolet Volt has an impressive 53 mile range rated by the Environ-
mental Protection Agency, which is 16 miles longer than Cadillac ELR, which has the second
longest range with 37 miles. As for the rest of the PHEVs, 2014 again saw a number of PHEVs
with low battery range, which decreased the median range among all models from 20 miles
in 2013 to 16 miles in 2014. Battery range for PHEVs continued to improve in 2017, after
the introduction of the second-generation Chevrolet Volt in 2016, and three new models –
Chrysler Pacifica Hybrid, Cadillac CT6, and Kia Optima, which boast a range of 33 miles, 31
miles, and 29 miles, respectively. This brings the number of PHEV models with at least 25
miles range from four models to seven models.
Traditional automotive companies such as Ford, Nissan, and Honda are introducing new,
longer-range ZEV options. In addition, more unconventional automakers have either en-
tered the market or are in stages of development – ranging from startups such as Faraday
Future and Lucid Motors to well established companies in other industries not related to
electric vehicles such as Dyson.58
58 Kahn, J. (2017). “Dyson to Spend £1 Billion Making ‘Radical’ Electric Car.” Bloomberg Technology. September 26, 2017. Available at: https://www.bloomberg.com/news/articles/2017-09-26/dyson-will-build-radically-different-electric-car-by-2020
Figure 8: Plug-in Hybrid Electric Vehicle Range DistributionBa
tter
y Ra
nge
(Mile
s)
Average (mean) Range
0
10
20
30
40
50
60
2011 2012 2013 2014 2015 2016 2017
Source: U.S. Department of Energy; U.S. Environmental Protection AgencyNote: Range estimates are based on EPA ratings (not NEDC ratings).

N E X T 1 0 23
The Road Ahead for Zero-Emission Vehicles in Cal i fornia: Market Trends & Pol icy Analysis
C H O I C E & C O N V E N I E N C E
Model Choices
Automakers around the world are ramp-
ing up their EV model offerings. Currently
there are 150 different plug-in hybrids and
pure electric vehicles available worldwide,
with more offered in some markets than
others. In the top California cities for EV
penetration, which account for 81 percent
of the state’s EV sales, auto dealers offer 25
to 30 different models. Mid-sized Califor-
nia markets had 13 to 21 models available.
Comparatively, more than half of the U.S
population lives in a metropolitan area with
seven or fewer available models.59
The overall number of global electric vehicles
models is set to rise to over 240 by 2021. Chi-
na is leading the way, with over 75 EV models,
introducing 25 in 2016 alone, and is spurring
urgency among other automakers.60 Volkswa-
gen, Daimler, Volvo and Nissan have made
aggressive plans to electrify their vehicle fleet
over the next 10 years. General Motors an-
nounced they plan to introduce 20 new ZEV
models by 2023, while Ford promises 13.
As the lead global EV adopter, China sales
jumped 70 percent with the introduction
of 25 new models in 2016. More choices
in California could help accelerate sales.
However, it is worth noting that China’s fa-
vorable subsidies help drive increased ve-
hicle choice. The government offers gener-
59 “Update: California’s electric vehicle market.” The International Council on Clean Transportation. May 2017. Avail-able at: https://www.theicct.org/sites/default/files/publications/CA-cities-EV-update_ICCT_Briefing_30052017_vF.pdf
60 Ibid.61 “Dynamics in the Global Electric-Vehicle Market.” McKinsey & Company. July 2017. Available at: https://www.mckin-
sey.com/industries/automotive-and-assembly/our-insights/dynamics-in-the-global-electric-vehicle-market62 For more information, please visit Santa Barbara County Air Pollution Control District’s website at: https://www.ourair.
org/ev-charging-program/63 Guinn, S. (2017). EVSE Rebates and Tax Credits, by State. Clipper Creek. October 10, 2017. Available at: https://www.
clippercreek.com/evse-rebates-and-tax-credits-by-state/
ous incentives but requires that qualifying
ZEVs are domestic, providing significant
demand for domestic ZEV production and
increased vehicle model choices.61
As illustrated in Figure 9, despite having a
similar number of models, sales vary between
California, Sweden, and the UK. However, the
population of Sweden is about one-fourth
that of California and the UK has roughly 25
million more people than California.
CONVENIENCE
Infrastructure
The electric charging infrastructure in the
United States has grown at a rapid pace. In
just five years, from 2011 to 2016, the num-
ber of plugs for charging electric vehicles
increased by 1,138 percent. This increase
comes despite the high cost of build-
ing charging stations. To offset the high
costs, many local governments are offering
rebates and loans specifically for charging
stations. For example, the largest rebate is
offered by the city of Santa Barbara, offer-
ing up to $20,000 for a DC fast charger to
public entities or nonprofits.62 There are 25
states that currently offer their own unique
rebate or loan programs to help incentivize
more chargers.63
Even with such rapid development of charg-

N E X T 1 0 24
The Road Ahead for Zero-Emission Vehicles in Cal i fornia: Market Trends & Pol icy Analysis
Figure 9: ZEV Models and Sales, United Kingdown, California & Sweden, 2011 to 2017*
Figure 10: Cumulative Battery Electric Vehicle Sales vs. Charging Plugs Deployment in the U.S.
Source: Vehicles Statistics, Department for Transport; European Alternative Fuels Observatory; the RAC Foundation; U.S. Department of Energy; U.S. Environmental Protection Agency; Alliance of Automobile Manufacturers; BIL Sweden; The Society of Motor Manufacturers and Traders (SMMT)Note: California figures for November and December 2017 are projected based on historical and current sales trends.
Tota
l ZEV
Ann
ual S
ales
Num
ber of ZEV Models A
vailable for Purchase
No. of ZEV Models (UK) No. of ZEV Models (California) No. of ZEV Models (Sweden)
Total EV Sales (UK) Total EV Sales (California) Total EV Sales (Sweden)
0
5
10
15
20
25
30
35
40
0
15,000
30,000
45,000
60,000
75,000
90,000
105,000
120,000
2017201620152014201320122011
Source: Alternative Fuel Data Center, Departtment of Energy; IHS/Markit; Alliance of Automobile Manufacturers
Cum
ulat
ive
BEV
Sale
sN
umber of C
harging Plugs (Outlets)
No. of ZEV Models (California)BEV Sales
0
50000
100000
150000
200000
250000
300000
0
7,500
15,000
22,500
30,000
37,500
45,000
201620152014201320122011

N E X T 1 0 25
The Road Ahead for Zero-Emission Vehicles in Cal i fornia: Market Trends & Pol icy Analysis
ing stations and plugs, the number of BEV vehicles on the road is increasing at an even faster
rate - a 3,765 percent increase in BEV sales during the same period. This is less of a concern for
PHEVs as they can also rely on gasoline in addition to electricity. In 2016, there was only one
charging plug for about every six pure electric cars (BEVs) in the United States. The disparity is
expected to increase as more mass produced electric cars enter the market. Additionally, the
lack of adequate charging options may depress sales.64
As of January 9, 2018, California had a total of 16,549 public and private (nonresidential but
privately owned)65 charging outlets, or about six times as many outlets as the next state, Texas,
with 2,727 charging outlets. While California has substantially more charging outlets than other
states, these only accounted for 31.6 percent of the U.S. total, while it has 50 percent of all ZEVS
on the road nationwide. As of January 2018, California only had 0.05 public charging outlets
per ZEV, one of the lowest ratios in the country (see Appendix D for maps of California charg-
ing stations).66 Studies have shown that California will need 125,000 to 220,000 charging ports
from private and public sources by 2020 in order to provide adequate infrastructure, not to
mention hundreds of thousands at multi-unit dwellings.67
The majority of ZEV owners charge at home, but for electric vehicles to become mainstream,
there have to be local options for those living in multi-family units, and urban areas with lim-
ited off-street parking. Renters – who make up almost half of California’s households (45.6%)
– have limited options to charge at home, especially in multi-unit dwellings.68 Furthermore,
metro areas with the highest ZEV adoption rates – namely Los Angeles, San Francisco, San
Jose, and San Diego metros – have higher shares of renter households (48.3% collectively)
compared to the state overall.69
The cost of a new public single port charging station varies. A level two charging station
can cost between $1,000 and $1,900 depending on permits and planning requirements. A
DC fast charging station can cost between $14,000 and $91,000.70 A level two charger takes
about four hours to fully charge an average electric car, while a DC fast charger can take
as little as 30 minutes.71 With the technology quickly improving, many cities are hesitant to
double down on current technology if prices are due to fall drastically in the near future or if
64 Alternative Fuel Station Counts by State. Alternative Fuels Data Center, U.S. Department of Energy. Data last up-dated on November 6, 2017
65 Public stations include such places as charging stations at train, park and Ride parking lots, University charging sta-tions, airport charging stations, etc. Private stations include charging stations at dealerships, business establishments (for employees only), apartment complexes (for residents only). It does not include residential private stations.
66 Alternative Fuel Station Counts by State. Alternative Fuels Data Center, U.S. Department of Energy. Data last up-dated on November 6, 2017
67 “Plugging Away: How to Boost Electric Vehicle Charging Infrastructure.” UC Berkeley Center for Law, Energy & the Environment. June 2017. https://www.law.berkeley.edu/wp-content/uploads/2017/06/Plugging-Away-June-2017.pdf
68 According to the 2016 American Community Survey 1-year estimates.69 Based on total CVRP rebates, which was discussed in the 2017 California Green Innovation Index, available at http://
next10.org/2017-gii70 Smith, M. and J. Castellano (2015). ”Costs Associated with Non-Residential Electric Vehicle Supply Equipment.” U.S.
Department of Energy Vehicle Technologies Office. November 2015. Available at: https://www.afdc.energy.gov/up-loads/publication/evse_cost_report_2015.pdf
71 More information can be viewed at ChargePoint at https://www.chargepoint.com/files/Quick_Guide_to_Fast_Charging.pdf

N E X T 1 0 26
The Road Ahead for Zero-Emission Vehicles in Cal i fornia: Market Trends & Pol icy Analysis
current charging tech become completely obsolete.
California has been leading the way with rebates to ensure infrastructure growth. In addition,
California’s settlement with Volkswagen over its diesel emissions scandal includes substantial
investment in charging infrastructure (more details in the Public Policy section).
Fueling time
While EV owners who charge at home have the luxury of time and convenience, reducing
charge time is important for consumer acceptance. Some, like Tesla’s network of Super-
chargers, can recharge EVs to 80 percent in 20 to 40 minutes. Meanwhile, others fully
charge EVs in three to four hours, while slower charging points take around six to eight
hours. Charging times that take more time than refueling petrol and diesel cars have been
seen as a roadblock to the mass adoption of ZEVs.
Vehicle makers are responding to the concern with innovations to reduce charge times.
For example, Honda recently announced that they are developing high-capacity batteries
capable of ultra-fast 15 minute charging with a 240 km range for release in 2022 models.72
This supercharging technology, coupled with Honda’s dynamic charging system, could have
significant implications for ZEV convenience.
Maintenance
Maintenance expenses were assessed in the cost of ownership analysis discussed earlier.
Here, maintenance is addressed from a convenience standpoint. ZEVs have about 1,980
fewer moving parts than ICE vehicles. With a total of about 20 moving parts per vehicle,
ZEVs have far fewer maintenance issues, visits and costs than ICE vehicles. This small
number of parts also makes EV assembly and part replacement relatively simple and inex-
pensive.73 UBS Group AG has found that the Chevy Bolt is almost maintenance-free since
fewer parts need to be replaced over the car’s life and it does not require a regular change
of fluids, like engine oil.74 The electric motor has just three moving parts compared with
133 in a four-cylinder internal combustion engine.75
72 “Honda to halve electric cars’ charging time to 15 minutes.” Nikkei Asian Review. November 1, 2017. Available at: https://asia.nikkei.com/Business/Companies/Honda-to-halve-electric-cars-charging-time-to-15-minutes
73 “Rethinking Transportation 2020 – 2030.” RethinkX. May 2017. Available at: https://static1.squarespace.com/static/585c3439be65942f022bbf9b/t/59f279b3652deaab9520fba6/1509063126843/RethinkX+Report_102517.pdf
74 Hummel, P., et. al. “UBS Evidence Lab Electric Car Teardown – Disruption Ahead?” May 18, 2017. http://www.advan-tagelithium.com/_resources/pdf/UBS-Article.pdf
75 “How Electric Cars Can Create the Biggest Disruption Since the iPhone.” Bloomberg Technology. September 22, 2017. Available at: https://www.bloomberg.com/news/articles/2017-09-21/how-electric-cars-can-create-the-biggest-disruption-since-iphone

N E X T 1 0 27
The Road Ahead for Zero-Emission Vehicles in Cal i fornia: Market Trends & Pol icy Analysis
P U B L I C P O L I C Y
Public policy can accelerate or erect barriers to electrification
of transportation. There are many moving policy parts - from
national to state, public utilities to municipal - that can help create
a virtuous or vicious cycle when it comes to ZEV adoption. While
California moves forward to clean up its fleets, national and
international policy plays a role in the state’s markets as well.
International
National governments around the world
including the UK, France, the Netherlands
and even India have officially stated
the intention to phase out the internal
combustion engine domestically, as shown
in Table 5. While their statements have
typically lacked specific measures, they are
indicative of the fast changing landscape.
China, which faces well-documented air
quality challenges, is likewise strongly
committed to deploying zero-emission
vehicles, or “new energy vehicles.” China
is expected to announce a ZEV credit
policy this year modeled after California’s
program resulting from collaborative
efforts led by the China-US ZEV Policy
Lab.76 A national “road map” for the
country’s auto market aims for ZEVs to
account for at least 20 percent of total
76 Clegern, Dave. “California and China team up to push for millions more zero-emission vehicles.” California Air Re-sources Board. June 7, 2017. Available at: https://www.arb.ca.gov/newsrel/newsrelease.php?id=934
77 Ibid.78 Mulholland, Rory. “Paris to ban all petrol cars from the city by 2030 in pollution crackdown.” October 12, 2017. Avail-
able at: http://www.telegraph.co.uk/news/2017/10/12/paris-ban-petrol-cars-city-2030-pollution-crackdown/79 Under the Clean Air Act (CAA), Section 209 provides California with the right to set its own vehicle emissions stan-
dards and Section 177 provides other states with the right to choose between California standards and the federal standards.
vehicle sales by 2025, or about 7 million
vehicles a year.77
Pollution and climate change are
the primary drivers of policy aimed
at accelerating the electrification of
transportation. As such, the world’s largest
cities choked by transportation emissions
may move faster than their national
counterparts. For example, Paris has
announced it will ban ICE vehicles by 2030,
ten years ahead of France.78
Emissions standards, both at home and
abroad, are incentivizing automakers to
expand EV options. In the U.S., the “clean
car states,” California and Section 177
states are moving ahead with policies to
accelerate the adoption of cleaner cars.79
Abroad, the EU’s emissions standards
impose heavy fines on automakers that do
not comply. In 2021, new targets for cars

N E X T 1 0 28
The Road Ahead for Zero-Emission Vehicles in Cal i fornia: Market Trends & Pol icy Analysis
sold in the EU come into force, and many
car makers are focused on increasing EV
options in order to be able to comply.80
Even as the United States has indicated
its intention to opt out of the Paris Accord
and weaken car emissions standards and
the ZEV mandate in Clean Car states,
automakers may feel pressure to clean up
their fleets to stay competitive.
Subnational
In 2013, eight states including California
signed a memorandum of understanding
(MoU) committed to bring 1.5 million ZEVs
on the roadways by 2025. Seven other
states have also committed to varying
goals that amount to over 3.4 million ZEVs
on the road by 2025.81
80 Wilmot, Steven. “Car Makers Count Costs of Global Warming Emissions Standards.” November 16, 2017. Available at: https://www.wsj.com/articles/car-makers-count-costs-of-global-warming-emissions-standards-1510844143
81 ZEV Program Implementation Task Force (2014). “Multi-State ZEV Action Plan.” Page 9. Available at: http://www.nescaum.org/topics/zero-emission-vehicles/multi-state-zev-action-plan
Table 5: Possible Actions Promised by Leading Countries
Country/State Action Earliest Date
California Will ban gas-powered cars 2030
Norway Will only sell electric and hybrid vehicles 2030
The Netherlands Will only sell electrified vehicles 2025
France Will ban the sale of gas and diesel cars 2040
United Kingdom Will ban the sale of gas and diesel cars 2025
China Will only sell electric and hybrid vehicles N/A
Source: Alliance of Automobile ManufacturersNote: Year-to-date, through October 2017
Table 6: ZEV Goal by States
State MoU Goal
California 1,500,000
New York 1,000,000
Oregon 140,000
Massachusetts 300,000
Maryland 280,000
Connecticut 150,000
Vermont 37,000
Rhode Island 44,000
Total 3,451,000
Source: ZEV Task Force (2014)
N E X T 1 0 29
The Road Ahead for Zero-Emission Vehicles in Cal i fornia: Market Trends & Pol icy Analysis
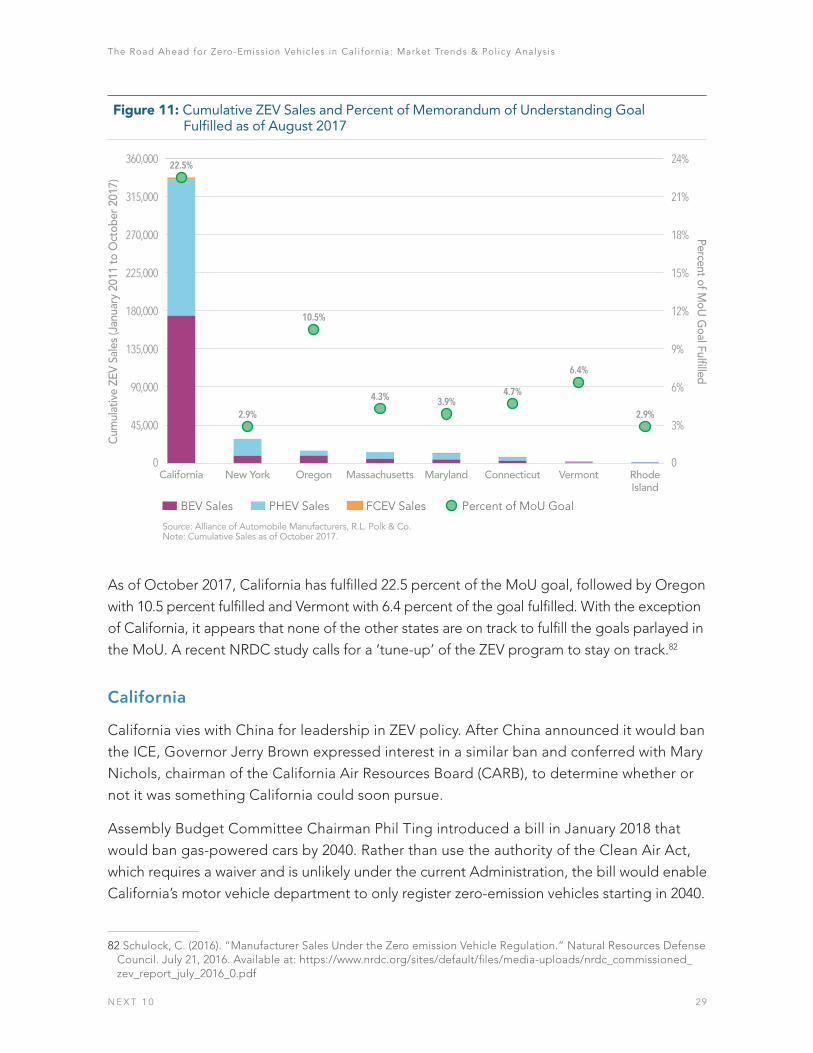
As of October 2017, California has fulfilled 22.5 percent of the MoU goal, followed by Oregon
with 10.5 percent fulfilled and Vermont with 6.4 percent of the goal fulfilled. With the exception
of California, it appears that none of the other states are on track to fulfill the goals parlayed in
the MoU. A recent NRDC study calls for a ‘tune-up’ of the ZEV program to stay on track.82
California
California vies with China for leadership in ZEV policy. After China announced it would ban
the ICE, Governor Jerry Brown expressed interest in a similar ban and conferred with Mary
Nichols, chairman of the California Air Resources Board (CARB), to determine whether or
not it was something California could soon pursue.
Assembly Budget Committee Chairman Phil Ting introduced a bill in January 2018 that
would ban gas-powered cars by 2040. Rather than use the authority of the Clean Air Act,
which requires a waiver and is unlikely under the current Administration, the bill would enable
California’s motor vehicle department to only register zero-emission vehicles starting in 2040.
82 Schulock, C. (2016). “Manufacturer Sales Under the Zero emission Vehicle Regulation.” Natural Resources Defense Council. July 21, 2016. Available at: https://www.nrdc.org/sites/default/files/media-uploads/nrdc_commissioned_zev_report_july_2016_0.pdf
Figure 11: Cumulative ZEV Sales and Percent of Memorandum of Understanding Goal Fulfilled as of August 2017
Cum
ulat
ive
ZEV
Sale
s (J
anua
ry 2
011
to O
ctob
er 2
017)
Percent of MoU
Goal Fulfilled
BEV Sales
0
3%
6%
9%
12%
15%
18%
21%
24%
0
45,000
90,000
135,000
180,000
225,000
270,000
315,000
360,000
RhodeIsland
VermontConnecticutMarylandMassachusettsOregonNew YorkCalifornia
PHEV Sales FCEV Sales Percent of MoU Goal
Source: Alliance of Automobile Manufacturers, R.L. Polk & Co.Note: Cumulative Sales as of October 2017.
22.5%
2.9%
10.5%
4.3% 3.9%4.7%
6.4%
2.9%

N E X T 1 0 30
The Road Ahead for Zero-Emission Vehicles in Cal i fornia: Market Trends & Pol icy Analysis
While California competes with China for leadership, it also collaborates with Beijing to
grow the market. In June 2017, Governor Edmund G. Brown and CARB Chair Mary Nichols
met with Chinese officials and automakers to forge greater cooperation and facilitate
developing new ZEV models for the US market. They announced a new working group
through the China-US ZEV Policy Lab at UC Davis to expand cooperation with Chinese
zero-emission vehicle and battery technology companies. Automakers included BYD,
Beijing Auto Group, Great Wall, Geely, Dongfeng Xiao Kang, Yangtze Motors and a half
dozen other vehicle and battery companies.
Chinese officials and automakers to forge greater cooperation and facilitate developing new
ZEV models for the US market. They announced a new working group through the China-US ZEV
Policy Lab at UC Davis to expand cooperation with Chinese zero-emission vehicle and battery
technology companies. Automakers included BYD, Beijing Auto Group, Great Wall, Geely,
Dongfeng Xiao Kang, Yangtze Motors and a half dozen other vehicle and battery companies.
Charging Infrastructure
Additionally, there are a number of public policies within California to promote the
development of charging infrastructure. ZEV electric infrastructure in California has grown
with substantial investments in the past several years, and accelerated investments are
expected as new infrastructure developments emerge. More than 10,000 Level 2 and 1,500
direct current fast charger (DCFC) connectors have been deployed across California.83
Volkswagen Settlement – California ZEV Investments: Appendix C of the consent
decree (the ZEV Investment Commitment) requires Volkswagen to invest $800 million
in ZEV projects in California over a 10-year period. Eligible projects include installing
ZEV fueling infrastructure (for both electric- and hydrogen-powered cars), funding
brand-neutral consumer awareness campaigns, and investing in projects such as car-
sharing programs that will increase access to ZEVs for all consumers in California,
including those in lower-income and disadvantaged communities. Volkswagen will
submit four ZEV investment plans, valued at up to $80.0 million per year, to the
CARB.84
Assembly Bill 118 created the Alternative and Renewable Fuel and Vehicle
Technology Program (ARFVTP). To date, ARFVTP funds have provided 38.8%
of statewide total public charging sites and 37.9 percent of charging outlets –
specifically, 1,418 publicly accessible sites (includes planned sites) with 4,635 public
charging outlets (includes planned outlets).85
83 Ibid.84 “Zero Emission Vehicles and Infrastructure.” California Energy Commission. July 5, 2017. Available at: http://www.
energy.ca.gov/renewables/tracking_progress/documents/electric_vehicle.pdf85 Ibid

N E X T 1 0 31
The Road Ahead for Zero-Emission Vehicles in Cal i fornia: Market Trends & Pol icy Analysis
EC Grants: In 2017, the Energy Commission awarded $2.1 million (total of $9.75 million
and 43 grants) for nine ZEV Regional Readiness Planning and Implementation grants.
These grants aim to streamline the permitting process for future ZEV infrastructure,
promote regional coordination through the establishment of ombudsman positions,
conduct siting analysis, establish best practices for “ZEV-ready” building and public
works guidelines, and provide public ZEV education and outreach.86
Utilities/SB 350: In 2014, the CPUC adopted Decision 14-12-079 in Rulemaking 13-
11-007, which allows for the consideration of utility ownership of EV charging stations
and infrastructure on a case-specific basis. Subsequently, in 2016 the CPUC approved
light-duty infrastructure pilot programs for Pacific Gas and Electric Company (PG&E),
San Diego Gas & Electric Company (SDG&E), and Southern California Edison (SCE)
to install charging stations.87
AQMD’s: The Bay Area Air Quality Management District’s “Charge!” program is
an incentive program that offers grant funding to help offset a portion of the cost
of purchasing, installing, and operating new publicly available charging stations at
workplaces, multiunit homes, and public locations. The goal of the Charge! Program
is to rapidly expand access to charging stations to achieve the region’s deployment
goal of 247,000 EVs by 2025. The program has $5 million available from the TCFA
Regional Fund.88
Implications for Infrastructure and the Grid
Even as California moves forward with powerful ZEV policies, policy makers are aware of
certain consequences of their success. Since BEVs and FCEV’s do not consume motor
vehicle fuel, they pay little to no motor vehicle fuel taxes. Mass adoption of these vehicles
represents a significant potential drain on state transportation revenue and will require
innovative policy solutions to make up the funding gap.89
Another potential impact of mass adoption of ZEVs is grid overload. Significant
research and innovative policy proposals point to a future electricity system, that, as
the Department of Energy describes, is seamless, cost-effective electricity system, from
generation to end-use, and capable of meeting all clean energy demands and capacity
requirements.90
86 Ibid.87 Ibid.88 Ibid.89 “Beyond the Gas Tax: Funding California Transportation in the 21st Century.” Next 10 and Beacon Economics April
2017. Available at: http://next10.org/transportation-funding90 “Vision of the Future Grid.” U.S. Department of Energy, Office of the Undersecretary for Science and Energy. Avail-
able at: https://energy.gov/under-secretary-science-and-energy/vision-future-grid

N E X T 1 0 32
The Road Ahead for Zero-Emission Vehicles in Cal i fornia: Market Trends & Pol icy Analysis
The CPUC is currently studying the effects this may have on the grid. SoCal Edison is
partnering with the Los Angeles Air Force Base to conduct a pilot program that allows its
electric vehicle fleet to act as battery storage and send power back to the grid. The fleet
of 34 electric and hybrid vehicles serve as a storage resource for the California grid. The
program went live in 2015 and ran through September 2017, though the results have not
yet been made public.91
Summary of Current Trends
As the section above details, current trends suggest that the cost, range, models and fueling
time barriers to EV adoption are likely to be reduced. Increased competition will continue
to lower costs and improve technology. Further, ZEV performance and maintenance are
superior to ICE vehicles and therefore are a bridge to adoption. Assuming current growth
rates, California is on track to meet its 1.5 million ZEV by 2025 goal.
This is not to suggest that the next three to five years are not critical. Automakers are
still losing money on these vehicles and dealers have less incentive to sell them as the
maintenance costs are lower. The relative absence of charging infrastructure has not
significantly dampened sales yet, as most ZEV owners charge overnight at home, but this
will likely be a challenge going forward. To achieve mass adoption, people of all income
levels and in different residence types must be able to easily and cost-effectively charge
their vehicles.
91 Zero Emission Vehicles, CPUC. http://www.cpuc.ca.gov/zev/#Vehicle

N E X T 1 0 33
The Road Ahead for Zero-Emission Vehicles in Cal i fornia: Market Trends & Pol icy Analysis
F U T U R E T R E N D S : H O W FA R , H O W FA S T ?
Advanced technology typically follows an s-curve rather than
incremental adoption, and it appears that ZEV technology is no
different. Figure 12 shows the adoption rates for smartphones from
2005 to 2015, as compared to the projected adoption rates of ZEVs
from 2015 to 2039. Both technologies follow the s-curve, and ZEVs
will likely be as ubiquitous in 2040 as smartphones are today.
Figure 12: U.S. Smartphone Adoption vs. Global ZEV Adoption (Forecasted to 2039)
20152014201320122011201020092008200720062005
Glo
bal Z
EV U
nit S
ales
(Mill
ions
, BN
EF 2
017
Fore
cast
) Smartphone D
ollar Sales in the U.S. (Billions of U
SD)
Global ZEV unit sales (Historic)Global ZEV unit sales (BNEF 2017 Forecast)
U.S. Smartphone Dollar Sales (billions of $)
0
10
20
30
40
50
60
70
80
0
15
30
45
60
2039203720352033203120292027202520232021201920172015
Source: International Energy Agency, OECD; Blooomberg New Energy Finance; and Statista.

N E X T 1 0 34
The Road Ahead for Zero-Emission Vehicles in Cal i fornia: Market Trends & Pol icy Analysis
Technological adoption also increases exponentially. As reported in the Harvard Business
Review, it took 30 years for electricity and 25 years for telephones to reach 10 percent
adoption but less than five years for tablet devices to achieve the ten percent rate. It took
an additional 39 years for telephones to reach 40 percent penetration and another 15 be-
fore they became ubiquitous. Smartphones, on the other hand, accomplished a 40 percent
penetration rate in just ten years.92
Historic innovations that have disrupted the economy are more systemic than incremental.
The iPhone did far more than change the way people made phone calls, it created
the App, which led to an entirely new economy for multibillion-dollar companies, and
completely disrupted the mobile phone and camera industries.93
Similarly, new mobility business models such as ride hailing or car sharing are building
momentum around the world and poised to dramatically disrupt the transportation
sector. With the advent of autonomous vehicles, set to debut in the 2020s, many experts
predict transportation will become a service, with consumers buying kilometers of
mobility from service providers instead of individual vehicles. At high utilization rates,
electric vehicles have much lower costs per kilometer. This trend would dramatically
accelerate the transportation transformation.94
Rethink X, a think tank that analyzes technology-driven disruption, predict the combination
of electric, autonomous and ride sharing/hailing will upend the car market and individual
car ownership quickly, due primarily to cost. Additionally, the cost of owning electric and
oil-fueled vehicles will reach parity for shared-mobility fleets by 2020 - five years earlier
than for individually-owned vehicles, according to Bloomberg New Energy Finance.95 Lyft,
Uber and other ride hail companies are driving down the prices of transport and driving
the internal combustion engine out of the market.
92 Beginning with the 2002 shipment of the first BlackBerry that could make phone calls and the first Palm-OS-powered Treo model.
93 “Rethinking Transportation 2020 – 2030.” RethinkX. May 2017. Available at: https://static1.squarespace.com/static/585c3439be65942f022bbf9b/t/59f279b3652deaab9520fba6/1509063126843/RethinkX+Report_102517.pdf
94 “How Electric Cars Can Create the Biggest Disruption Since the iPhone.” Bloomberg Technology. September 22, 2017. Available at: https://www.bloomberg.com/news/articles/2017-09-21/how-electric-cars-can-create-the-biggest-disruption-since-iphone
95 Ibid.

N E X T 1 0 35
The Road Ahead for Zero-Emission Vehicles in Cal i fornia: Market Trends & Pol icy Analysis
Conclusion
The transportation sector is the largest contributor of greenhouse gas emissions not
only in California, but throughout the United States and much of the globe. As the
state and world look to reduce greenhouse gas emissions, the rapid decarbonization of
transportation options has become a critical priority. California is among those taking a
lead by encouraging a transition toward ZEV adoption, though countries such as China
and Sweden outpace both U.S. and the Golden State’s ZEV market growth.
2017 marked a turning point for the zero-emission vehicle and, more specifically, battery
electric vehicle. Leading economies and global automobile manufacturers have drawn a
line in the sand to demonstrate that the future of the auto industry will be electric. As more
countries, states, cities, and manufacturers commit to prioritize EVs and phase out ICEVs,
California can play an important part in the continued growth of this accelerating market.
As one of the world’s largest economies, California is a major driver in the global ZEV
marketplace. The state’s car culture predisposes drivers to adopt better performing, cost
competitive cars. With a host of policies to encourage increased sales of high-performing ZEVs
as well as expanded infrastructure for charging, California has led the nation in establishing a
rapidly maturing ZEV market. Improvements in battery cost and vehicle performance, paired
with increased choice and expanded infrastructure will continue to bolster the market.
National ZEV sales are following the trends seen in California, with sales rates for the U.S.
now comparable to the Golden State’s. And California policy aims to push the industry
forward as it moves past critical thresholds to mass adoption, providing a model for other
governing bodies. This brief’s analysis indicates California will reach 1.5 million ZEVs on
the road by 2025, but it could be much faster. The transportation sector is quickly evolving,
with rideshare and transportation services playing a greater role. As companies like Lyft
and Uber transition to ZEVs and autonomous EVs, the adoption curve for electric vehicles
could shift more rapidly than has been estimated.
With such tremendous promise and growth in this industry, California stands to gain by
reducing its carbon emissions, and demonstrating its leadership in supporting the rapid
acceleration of the ZEV market.

N E X T 1 0 36
The Road Ahead for Zero-Emission Vehicles in Cal i fornia: Market Trends & Pol icy Analysis
A P P E N D I X A - C O S T O F O W N E R S H I P M O D E L I N G A S S U M P T I O N S
Vehicle Information
The vehicles chosen for analysis are conventional internal combustion engine (ICEV), hybrid
electric (HEV), plug-in hybrid electric (PHEV), and pure battery electric (BEV) available in
California. The model year is selected as 2017. High-end luxury and economy vehicles are
included for comparative purposes. At least one typical popular vehicle model is included
for each type of vehicle for comparative purposes as well. Table A.1 provides an overview of
the vehicles selected. Overall, seventeen vehicle models were selected.
Table A.1. Vehicle Information
Make Type 5 Year Cost MPGe/MPG
Nissan Leaf BEV $30,680 112/--
smart fortwo ED BEV $23,800 108/--
Tesla Model S (60 kw) BEV $68,000 104/--
Chevrolet Bolt BEV $36,620 119/--
BMW i3 BEV BEV $42,400 124/--
Chevrolet Volt PHEV $33,220 106/42
Toyota Prius Prime PHEV $27,100 133/54
Ford Fusion Energi PHEV PHEV $33,120 97/42
Chrysler Pacifica Hybrid PHEV $41,995 84/32
Toyota Prius Hybrid HEV $23,475 --/52
Honda Accord Hybrid HEV $29,605 --/48
Toyota RAV4 Hybrid HEV $29,030 --/32
Chevrolet Silverado 15 Hybrid HEV $35,790 --/20
Honda Civic 4Dr Gasoline ICEV $18,740 --/36
Dodge Grand Caravan Gasoline ICEV $25,995 --/20
Lexus ES 350 Gasoline ICEV $38,900 --/24
Mercedes-Benz E300 Gasoline ICEV $52,150 --/25
Source: Federal Highway Administration

N E X T 1 0 37
The Road Ahead for Zero-Emission Vehicles in Cal i fornia: Market Trends & Pol icy Analysis
Mileage Information
For this simulation, two cases were considered based on vehicle miles driven per capita
(8,572 miles/year) and vehicle miles traveled per licensed driver (14,435 miles/year). Further-
more, the mileage inputs are divided into city travel and highway travel. Since most of a typi-
cal commuter’s travel is driven on the highway, the model assumes 75 percent for highway
and 25 percent for city.
Table A.2. Driving Statistics
Make Low High
Daily Miles 20 40
Days per Week 5 5
Weeks per Year 50 50
Daily Miles Total 5,000 10,000
Other Trips 3,572 4,435
Annual Miles Driven 8,572 14,435
Percent Highway 75% 75%
Highway Distance 6,429 10,826
City Distance 2,143 3,609
Fuel Cost Assumption
For BEVs and PHEVs, the electricity component of the fuel cost is based on the average
electricity prices in California. For PHEVs, HEVs and ICEVs, the gasoline component of the
fuel cost is based on California average fuel cost for November 11, 2017 from the Energy
Information Administration. All models are assumed to run on unleaded regular except for
Mercedes-Benz E300, which requires unleaded premium fuel. Information on annual fuel
consumption and annual fuel cost are provided in Table A.3. below.
All ZEVs are assumed to be charged once daily. For PHEVs, during normal weekday driving,
battery electricity is used until the battery is depleted and then gasoline is used; for both
electricity and gasoline, the city-highway mileage split is assumed to be the same for the
miles on electricity and the miles on gasoline.
Source: Federal Highway Administration

N E X T 1 0 38
The Road Ahead for Zero-Emission Vehicles in Cal i fornia: Market Trends & Pol icy Analysis
Table A.3. Annual Fuel Consumption and Cost
Based on 8,572 miles/year Based on 14,435 miles/year
Make
Annual Fuel Use
Annual Elec Use
Annual Fuel/Elec
Cost
Annual Fuel Use
Annual Elec Use
Annual Fuel/Elec
Cost
Nissan Leaf 0 gal 2,725 kWh $474 0 gal 4,589 kWh $799
smart fortwo ED 0 gal 2,893 kWh $503 0 gal 4,872 kWh $848
Tesla Model S (60 kw) 0 gal 2,872 kWh $500 0 gal 4,266 kWh $742
Chevrolet Bolt 0 gal 2,533 kWh $441 0 gal 4,836 kWh $841
BMW i3 BEV 0 gal 2,464 kWh $429 0 gal 4,150 kWh $722
Chevrolet Volt 64 gal 1,896 kWh $537 79 gal 3,597 kWh $882
Toyota Prius Prime 51 gal 1,543 kWh $432 133 gal 1,927 kWh $766
Ford Fusion Energi PHEV 65 gal 2,095 kWh $576 190 gal 2,346 kWh $1,023
Chrysler Pacifica Hybrid 81 gal 2,427 kWh $685 154 gal 3,866 kWh $1,172
Toyota Prius Hybrid 168 gal 0 kWh $545 283 gal 0 kWh $918
Honda Accord Hybrid 181 gal 0 kWh $585 304 gal 0 kWh $985
Toyota RAV4 Hybrid 277 gal 0 kWh $899 467 gal 0 kWh $1,513
Chevrolet Silverado 15 Hybrid
387 gal 0 kWh $1,254 652 gal 0 kWh $2,111
Honda Civic 4Dr Gasoline 230 gal 0 kWh $745 387 gal 0 kWh $1,254
Dodge Grand Caravan Gasoline
383 gal 0 kWh $1,242 645 gal 0 kWh $2,091
Lexus ES 350 Gasoline 316 gal 0 kWh $1,025 533 gal 0 kWh $1,726
Mercedes-Benz E300 Gasoline
312 gal 0 kWh $1,091 525 gal 0 kWh $1,837
Source: Department of Energy

N E X T 1 0 39
The Road Ahead for Zero-Emission Vehicles in Cal i fornia: Market Trends & Pol icy Analysis
Other Assumptions
The model does not take resale value or depreciation expense into account. Previous
studies that include resale value or depreciation indicate that all else equal, BEVs and
PHEVs have lower resale value compared to HEVs and ICEVs. Indeed, the simulation
results show that the 5-year total ownership costs for ZEVs tend to be high compared to
HEVs and ICEVs. However, the reverse is true beyond five years due to the lower annual
fuel costs and other recurring expenses.
The acquisition cost of vehicle is based on the default assumptions on the Department
of Energy (DOE) calculator. No separate assumptions are made regarding purchase and
finance costs since every person’s financial situation is different. The DOE assumed the
buyer financed 90% of the vehicle price and took out a five-year loan at 6% interest.
Furthermore, because of uncertainties in expected life and future costs associated with
high-performance batteries, the cost to replace the battery pack has not been included in
the calculation.

N E X T 1 0 40
The Road Ahead for Zero-Emission Vehicles in Cal i fornia: Market Trends & Pol icy Analysis
A P P E N D I X B - M A I N T E N A N C E E X P E N S E S O F Z E R O - E M I S S I O N V E H I C L E S A N D I N T E R N A L C O M B U S T I O N E N G I N E V E H I C L E S
Most consumers see the upfront costs of ownership and assume ZEVs are more expensive
to own than ICEVs. This is not always the case, however, since ZEVs have significantly fewer
moving parts and thus require less maintenance. On average, ICE vehicles have 2,000 mov-
ing parts, many of which are found in the engine, transmission, and emissions systems. On
the other hand, ZEVs have about 20 moving parts altogether.
Fewer moving parts can ease consumer’s minds because it greatly reduces the chance for
anything to break during ownership. Apart from malfunctioning parts, scheduled preventa-
tive maintenance is also much lower on ZEVs. ICE vehicles require oil changes every three to
five thousand miles, costing $20-55 for regular oil and $45-70 for synthetic. In addition, brake
maintenance costs about $150 per axle every 50 thousand miles, depending on driving hab-
its. Lastly, many ICE vehicles require changing out the timing chain every 40,000 and 100,000
miles, costing on average several hundred dollars. ZEVs have none of these costs, except for
brakes. Furthermore, brakes endure less wear and tear due to the ZEVs regenerative braking
systems, leading to brake changes less frequently than ICEVs.

N E X T 1 0 41
The Road Ahead for Zero-Emission Vehicles in Cal i fornia: Market Trends & Pol icy Analysis
A P P E N D I X C - M O U S TAT E S Z E V I N C E N T I V E S
Table C.1. MOU States ZEV Incentives
State BEV PHEV FCEV Annual Fuel Use
California $2,500 $1,500 $5,000 Qualifying low-income households may receive an additional $2,000 for vehicles purchased or leased after November 1, 2016 or an addi-tional $1,500 for vehicles purchased or leased between March 29, 2016 and October 31, 2016.
Connecticut $500 (<100 miles)$2,000 (100 - 174 miles)$3,000 (175 miles+)
$500 (<40 miles) $2,000 (40 miles+)
$5,000 Tier incentive amounts for BEVs and PHEVs based on PEA rated electric range.
Maryland $100 times the kilowatt-hours of battery capacity of the vehicle up to $3,000
$100 times the kilowatt-hours of battery capacity of the vehicle up to $3,000
Excluding ZEVs in which purchase price exceeds $60,000, this would make the Toyota Prius PHEV (First Generation), which has a battery capacity of 4.4kWh, to not qualify for the excise tax credit.
Massachu-setts
$1,000 (Tesla Model S/X)$2,500 (all others)
$1,000 or $1,500 or $2,500
$2,500
New York $500 (>20 miles) or $1,100 (20 - 39 miles) or $1,700 (40 - 119 miles) or $2,000 (120 miles+)
Electric cars with MSRP greater than $60,000 are eligible for $500 regardless of EPA all-electric range
Oregon N/A N/A N/A Currently, Oregon does not offer any incentives. HB 2017, which established the rebates framework, became effective on October 6, 2017. However, the amount of funds collected will not be suffi-cient to start granting rebates until the summer of 2018.
Rhode Island $1,500 or $2,500 $1,500 or $2,500 N/A Program suspended on July 10, 2017 due to program funding un-availability.
Vermont N/A N/A N/A 190 gal

N E X T 1 0 42
The Road Ahead for Zero-Emission Vehicles in Cal i fornia: Market Trends & Pol icy Analysis
A P P E N D I X D - E L E C T R I C V E H I C L E C H A R G I N G I N F R A S T R U C T U R E M A P S
Map D.1 Available Public and Private Charging Stations in California, as of November 14, 2017

N E X T 1 0 43
The Road Ahead for Zero-Emission Vehicles in Cal i fornia: Market Trends & Pol icy Analysis
Map D.2 All Electric Vehicle Charging Stations in California, As of November 14, 2017
Map D.2 Number of Charging Outlets per Station in California, as of November 14, 2017