Embed Size (px)
Citation preview
The Surface Analysis Laboratory
The Rôle of the Adhesion Promoter in a
Model Water-Borne Primer
Siavash Adhami, Marie-Laure Abel, Chris Lowe, John F. Watts
The Surface Analysis Laboratory
Department of Mechanical Engineering Sciences
October 13 - 18, 2013
Cagliari, Sardinia (Italy)
The Surface Analysis Laboratory
Introduction
For many years industry has used chromate conversion coatings which
provided:
Outstanding corrosion protection
Improved paint adhesion
Nowadays the industry demands chrome-free processes which benefit from:
Cost effective
Environmentally compatible
large reductions in VOC emissions
Reduction in fire risk
Worker exposure to organic vapours
The performance of a chrome-free processed, organic coated panels,
applying a novel water-based primer system (containing an amine-based
adhesion promoter at two different concentrations), to alkali cleaned HDGS,
was investigated previously†.
‡ S. Adhami, M-L. Abel, C. Lowe, J. F. Watts, Surf. Interface Anal, 44, 1054, (2012)
The Surface Analysis Laboratory
Outline
The interfacial regions of a model multilayer coatings system on an alkali cleaned
zinc coated steel substrate has been investigated by time-of-flight secondary ion mass
spectrometry (ToF-SIMS).
Ultra-Low-Angle Microtomy (ULAM)† was employed to expose the interface
between the primer and the metal substrate at the depth of ≈ 25 µm.
The interfacial chemistry of the interface has been revealed by reconstruction of the
spectra from optimised regions of interests (ROIs) across the metal/primer and
primer/top coat interface to obtain the best spatial and chemical resolution.
The findings confirm that a fraction of the adhesion promoter in the formulation
segregate toward topcoat/primer interface where they enhance the adhesive
properties; such phenomenon are not observed in vicinity of metal/primer interface.
‡ S. J. Hinder, C. Lowe, J. T. Maxted, J. F. Watts, J Mater Sci, 40, 285, (2005)

The Surface Analysis Laboratory
Al2p 10.8%
C1s 25.5%
Zn2p 20.5% O1s 41.7%
Al2p 3.5%
C1s 10.2%
Zn2p 51.9%
O1s 34.4%
IPA Cleaned
HDGS
KOH Cleaned
HDGS
Coatings Formulation
XPS Spectra of HDGS
Polymeric Top Coat: Polyester-based, cross-linked with melamine + titanium
dioxide and phthalocyanine blue pigments. Applied at ca. 20µm thickness
Water-Based Primer: Novel system based on acrylic chemistry with “amine-based
adhesion promoter”. Applied to ca. 5µm thickness
Substrate: Alkali cleaned hot-dipped galvanised steel.
Al2p
Al2s
Zn3p Zn3s
Al2p
Al2s
Zn3p
Zn3s
Zn3s O2s
The Surface Analysis Laboratory
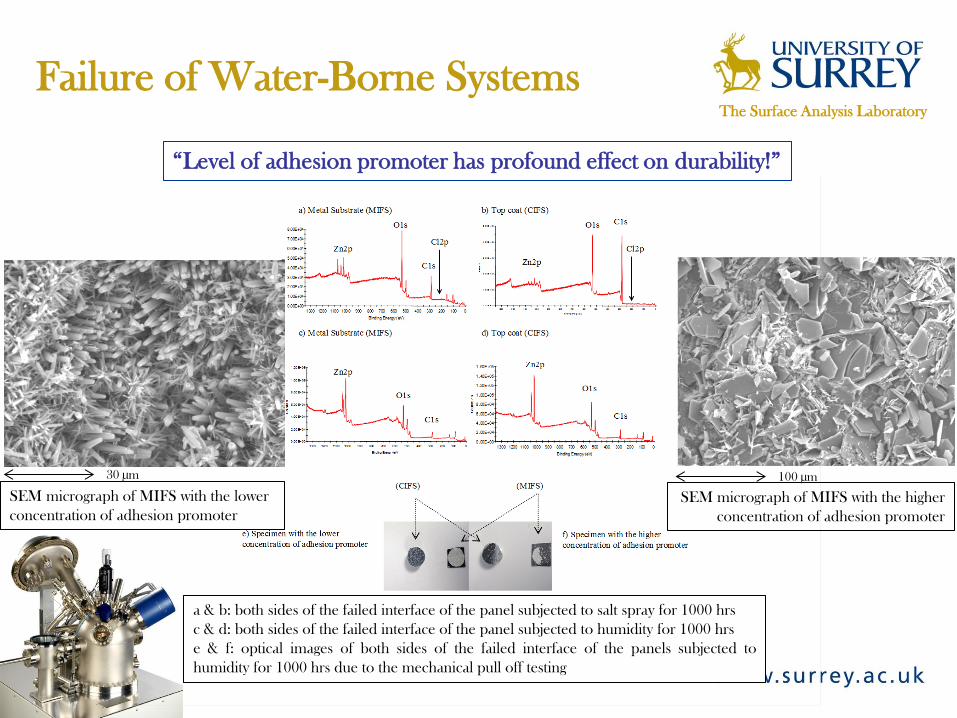
Failure of Water-Borne Systems
“Level of adhesion promoter has profound effect on durability!”
SEM micrograph of MIFS with the higher
concentration of adhesion promoter
SEM micrograph of MIFS with the lower
concentration of adhesion promoter
30 µm 100 µm
a & b: both sides of the failed interface of the panel subjected to salt spray for 1000 hrs
c & d: both sides of the failed interface of the panel subjected to humidity for 1000 hrs
e & f: optical images of both sides of the failed interface of the panels subjected to
humidity for 1000 hrs due to the mechanical pull off testing
The Surface Analysis Laboratory
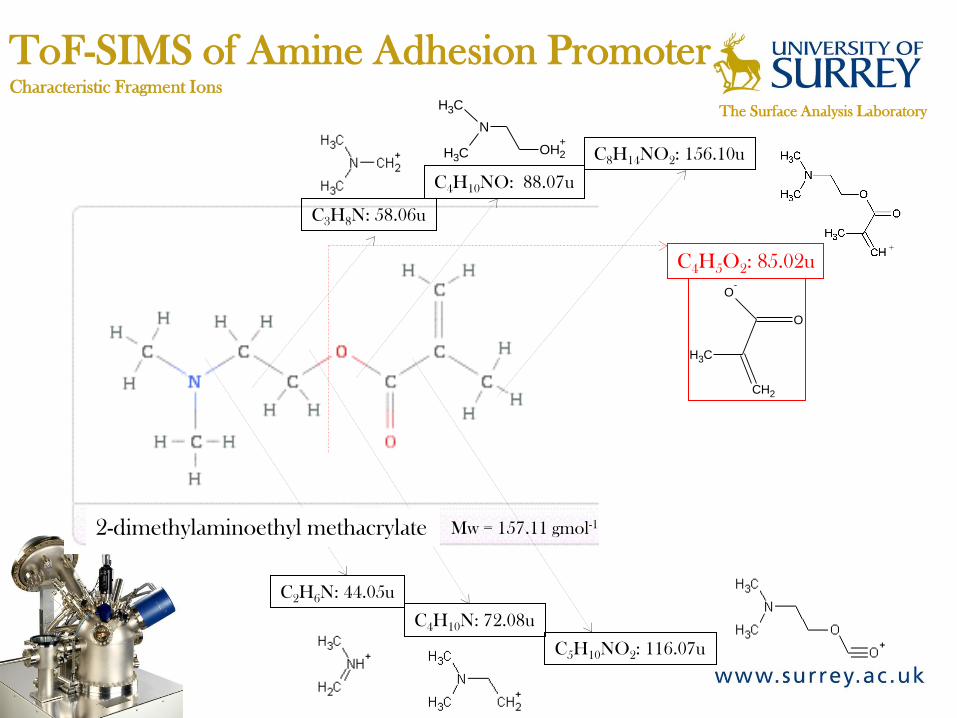
ToF-SIMS of Amine Adhesion Promoter Characteristic Fragment Ions
C2H6N: 44.05u
C4H10N: 72.08u
C4H10NO: 88.07u
C5H10NO2: 116.07u
C8H14NO2: 156.10u
C4H5O2: 85.02u
Mw = 157.11 gmol-1
C3H8N: 58.06u
+
O-
O
CH3
CH2
N
CH3
CH3OH2
+
2-dimethylaminoethyl methacrylate
The Surface Analysis Laboratory
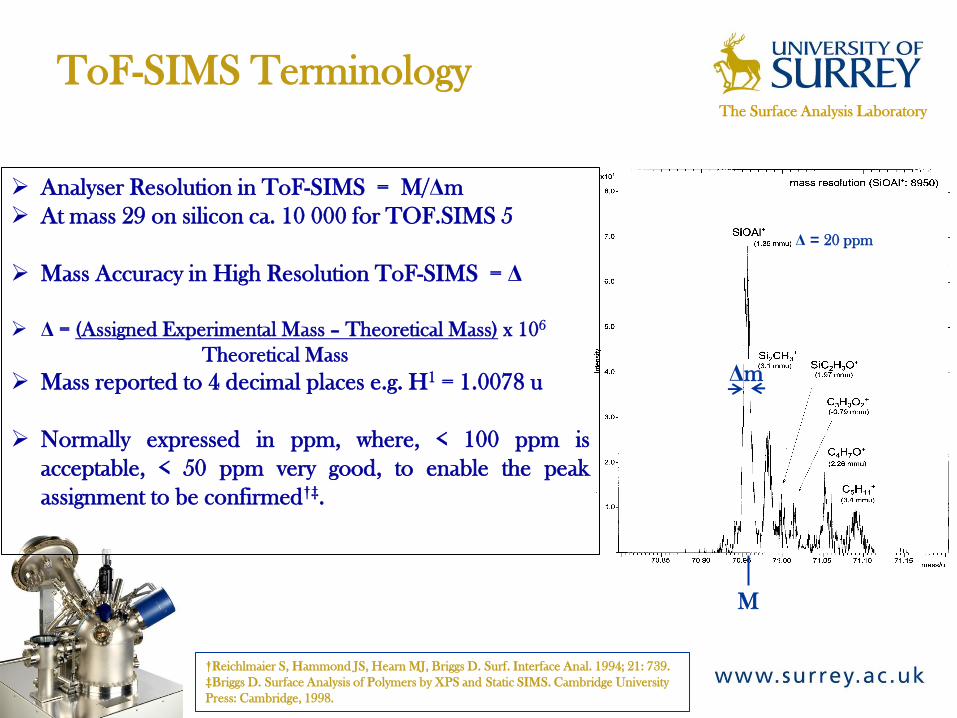
ToF-SIMS Terminology
Δ = 20 ppm
Δm
M
Analyser Resolution in ToF-SIMS = M/Δm
At mass 29 on silicon ca. 10 000 for TOF.SIMS 5
Mass Accuracy in High Resolution ToF-SIMS = Δ
Δ = (Assigned Experimental Mass – Theoretical Mass) x 106
Theoretical Mass
Mass reported to 4 decimal places e.g. H1 = 1.0078 u
Normally expressed in ppm, where, < 100 ppm is
acceptable, < 50 ppm very good, to enable the peak
assignment to be confirmed†‡.
†Reichlmaier S, Hammond JS, Hearn MJ, Briggs D. Surf. Interface Anal. 1994; 21: 739.
‡Briggs D. Surface Analysis of Polymers by XPS and Static SIMS. Cambridge University
Press: Cambridge, 1998.
The Surface Analysis Laboratory
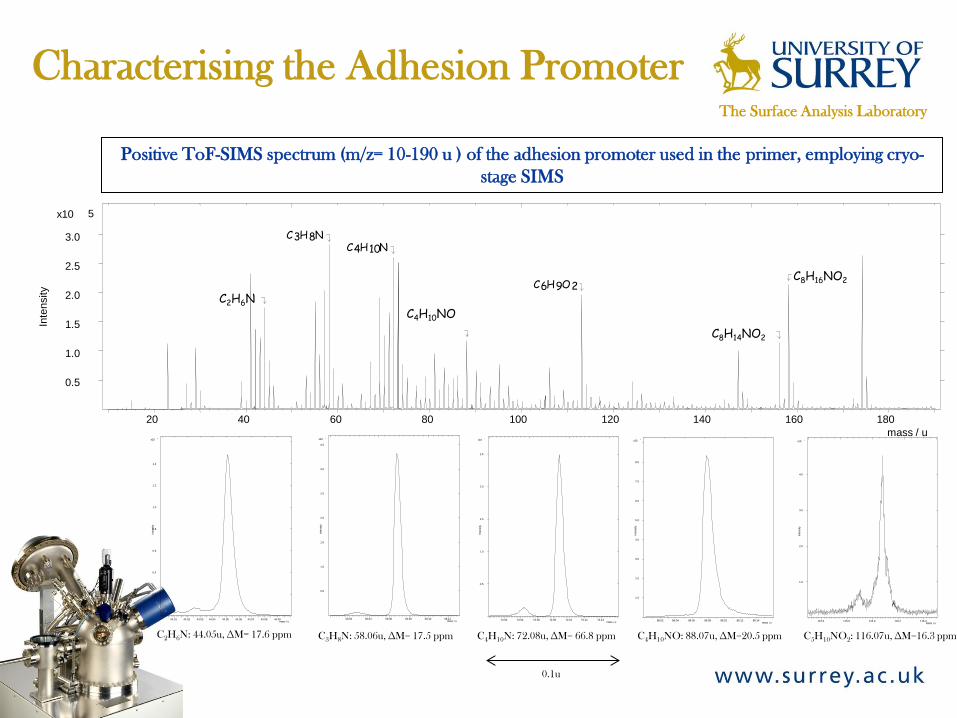
Positive ToF-SIMS spectrum (m/z= 10-190 u ) of the adhesion promoter used in the
primer; 1,2 dimethyl amino-ethyl methacrylate
Characterising the Adhesion Promoter
C2H6N
C 3 H 8 N
C 4 H 10 N
C4H10NO
C 6 H 9 O 2
C8H14NO2
C8H16NO2
mass / u
20 40 60 80 100 120 140 160 180
5 x10
0.5
1.0
1.5
2.0
2.5
3.0
Inte
nsity
Positive ToF-SIMS spectrum (m/z= 10-190 u ) of the adhesion promoter used in the primer, employing cryo-
stage SIMS
mass / u 44.01 44.02 44.03 44.04 44.05 44.06 44.07 44.08 44.09
4 x10
0.2
0.4
0.6
0.8
1.0
1.2
1.4
Inte
nsity
mass / u 58.02 58.04 58.06 58.08 58.10 58.12
4 x10
0.5
1.0
1.5
2.0
2.5
3.0
3.5
Inte
nsity
mass / u 72.02 72.04 72.06 72.08 72.10 72.12 72.14
4 x10
0.5
1.0
1.5
2.0
2.5
Inte
nsity
mass / u 88.02 88.04 88.06 88.08 88.10 88.12 88.14
3 x10
1.0
2.0
3.0
4.0
5.0
6.0
7.0
8.0
Inte
nsity
mass / u 115.6 115.8 116.0 116.2 116.4
2 x10
1.0
2.0
3.0
4.0
Inte
nsity
C2H6N: 44.05u, ∆M= 17.6 ppm C3H8N: 58.06u, ∆M= 17.5 ppm C4H10N: 72.08u, ∆M= 66.8 ppm C4H10NO: 88.07u, ∆M=20.5 ppm C5H10NO2: 116.07u, ∆M=16.3 ppm
0.1u
The Surface Analysis Laboratory
Adhesion Promoter Adsorption on
HDGS by XPS
0
10
20
30
40
50
60
0 0.3 0.6 0.9
C O N Zn Al
Concentration (Mole/Litre)
Su
rfac
e C
on
cen
trat
ion
(at
om
ic %
)
0
10
20
30
40
50
60
70
0 0.3 0.6 0.9
C O N Zn Al
Concentration (Mole/Litre)
Su
rfac
e C
on
cen
trat
ion
(at
om
ic %
)
0
1
2
0 0.005 0.01
0
1
2
0 0.005 0.01
IPA Cleaned HDGS KOH Cleaned HDGS
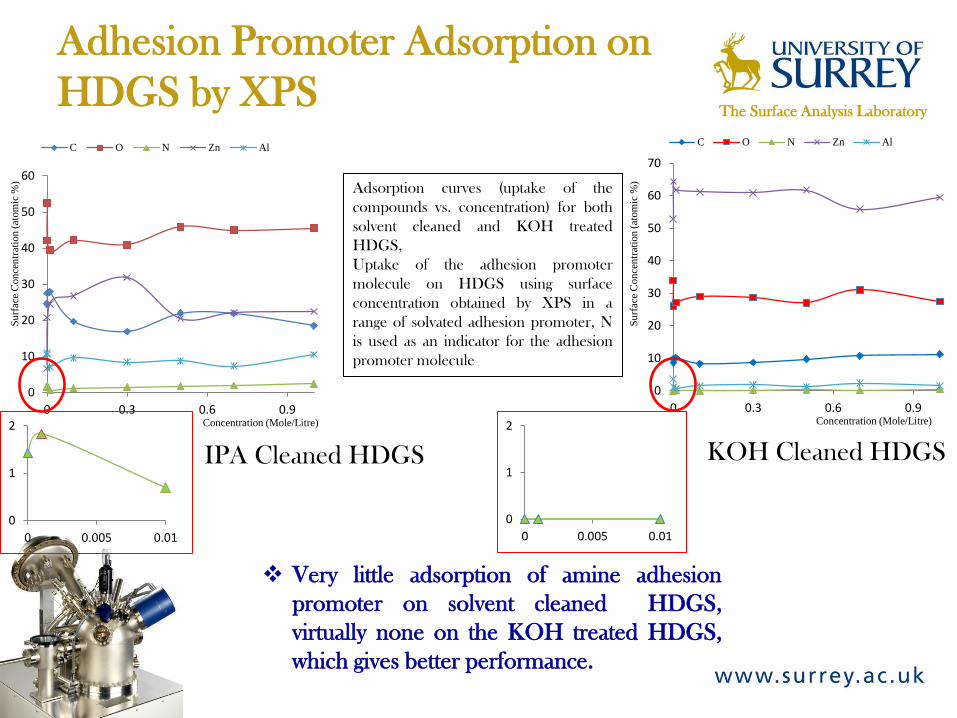
Very little adsorption of amine adhesion
promoter on solvent cleaned HDGS,
virtually none on the KOH treated HDGS,
which gives better performance.
Adsorption curves (uptake of the
compounds vs. concentration) for both
solvent cleaned and KOH treated
HDGS,
Uptake of the adhesion promoter
molecule on HDGS using surface
concentration obtained by XPS in a
range of solvated adhesion promoter, N
is used as an indicator for the adhesion
promoter molecule
The Surface Analysis Laboratory
Adhesion Promoter Adsorption on
HDGS by ToF-SIMS
0
1000
2000
3000
4000
5000
6000
7000
0 0.3 0.6 0.9
C2H6N+ C3H8N+ C4H10N+ C4H10NO+
C5H10NO2+ C8H14NO2+ C8H16NO2+ C9H18NO2+
Concntration (Mole/Litre)
RPI
0
500
1000
1500
2000
2500
3000
0 0.005 0.01
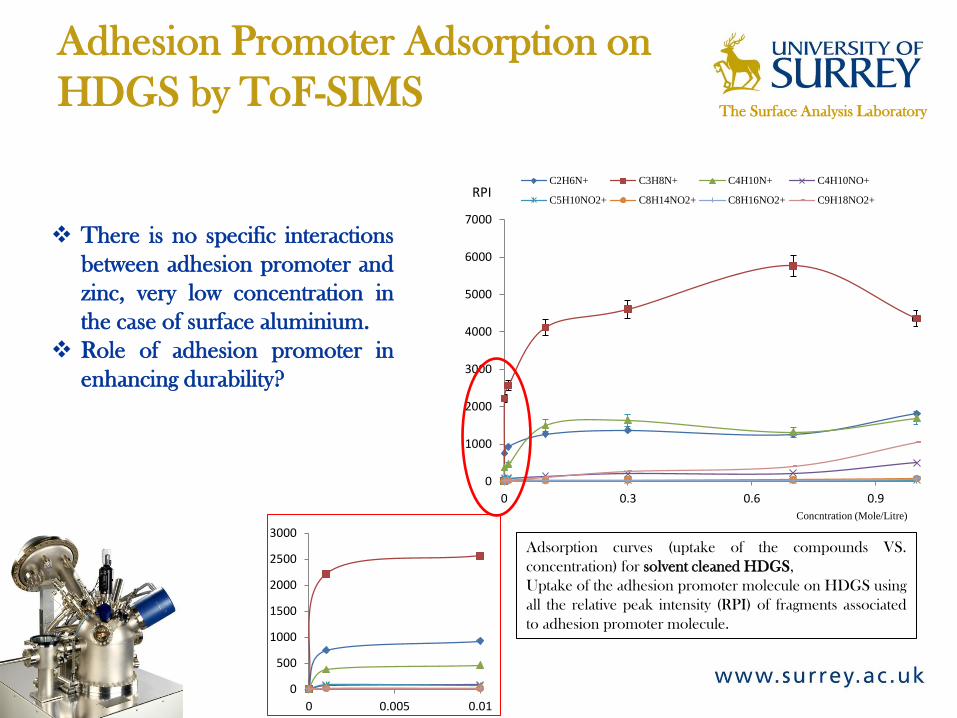
There is no specific interactions
between adhesion promoter and
zinc, very low concentration in
the case of surface aluminium.
Role of adhesion promoter in
enhancing durability?
Adsorption curves (uptake of the compounds VS.
concentration) for solvent cleaned HDGS,
Uptake of the adhesion promoter molecule on HDGS using
all the relative peak intensity (RPI) of fragments associated
to adhesion promoter molecule.
The Surface Analysis Laboratory
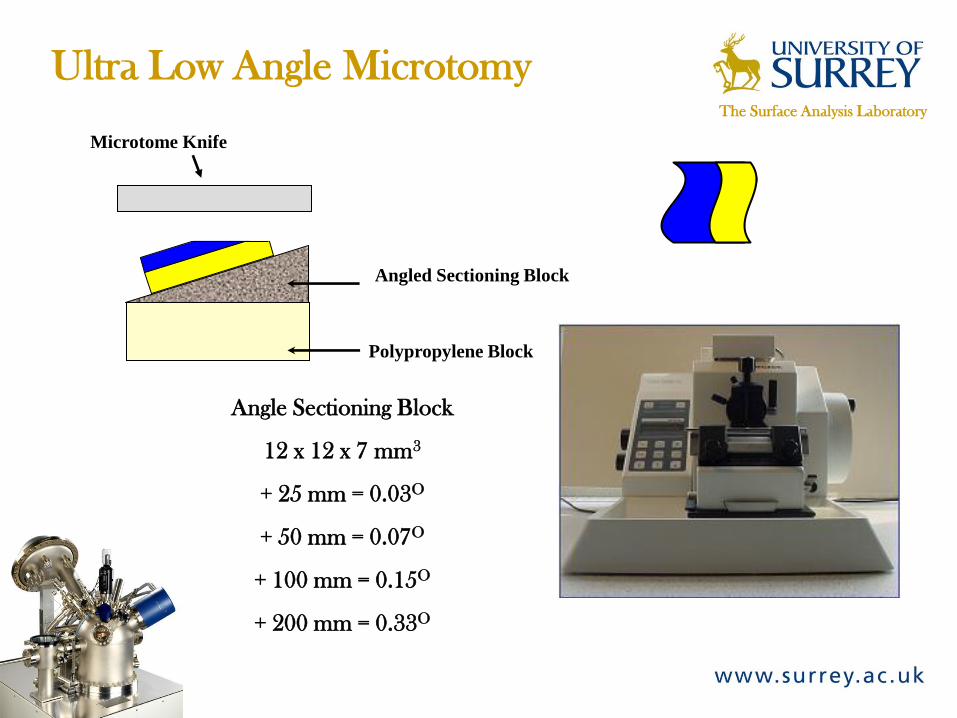
Ultra Low Angle Microtomy
Angle Sectioning Block
12 x 12 x 7 mm3
+ 25 mm = 0.03O
+ 50 mm = 0.07O
+ 100 mm = 0.15O
+ 200 mm = 0.33O
Microtome Knife
Angled Sectioning Block
Polypropylene Block

The Surface Analysis Laboratory
Experimental Sample preparation/ XPS & SIMS Line Scans
500 µm
128 pixels= 16 strips x 8 pixels
128 pixels
RoI: Region of Interest
∑8 x 128 of Recording Relative
Intensity (RI) for each
specific fragment
RI vs. RoI
Convert RoI to Depth
RI vs. Depth √ = 2°
8 pixels = 15.6 µm
1.08 µm
Red: Top coat
Green: Primer
Blue: HDGS
500 µm
25 µm
ULAM
Approximately same
area is used for XPS
line scan.
Depth profile of a various fragments
obtained by reconstruction of SIMS spectra
across the top coat/primer/metal area from
16 regions of interest.
The Surface Analysis Laboratory
XPS Line Scan
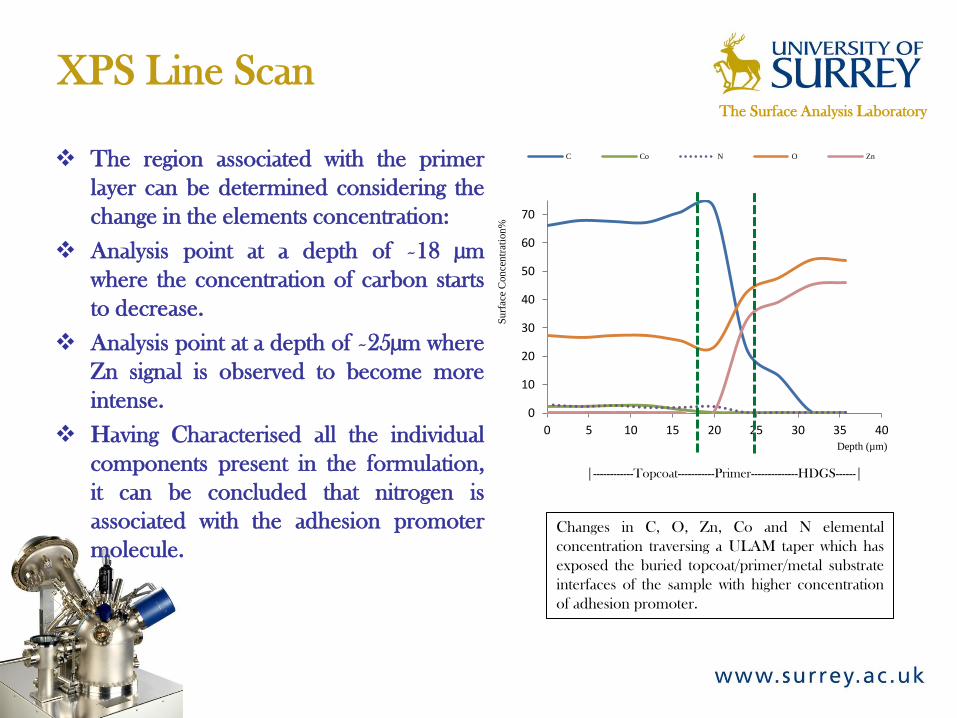
The region associated with the primer
layer can be determined considering the
change in the elements concentration:
Analysis point at a depth of ~18 µm
where the concentration of carbon starts
to decrease.
Analysis point at a depth of ~25µm where
Zn signal is observed to become more
intense.
Having Characterised all the individual
components present in the formulation,
it can be concluded that nitrogen is
associated with the adhesion promoter
molecule.
0
10
20
30
40
50
60
70
0 5 10 15 20 25 30 35 40
Su
rfac
e C
on
cen
trat
ion
%
Depth (µm)
C Co N O Zn
Changes in C, O, Zn, Co and N elemental
concentration traversing a ULAM taper which has
exposed the buried topcoat/primer/metal substrate
interfaces of the sample with higher concentration
of adhesion promoter.
|------------Topcoat-----------Primer--------------HDGS------|
The Surface Analysis Laboratory
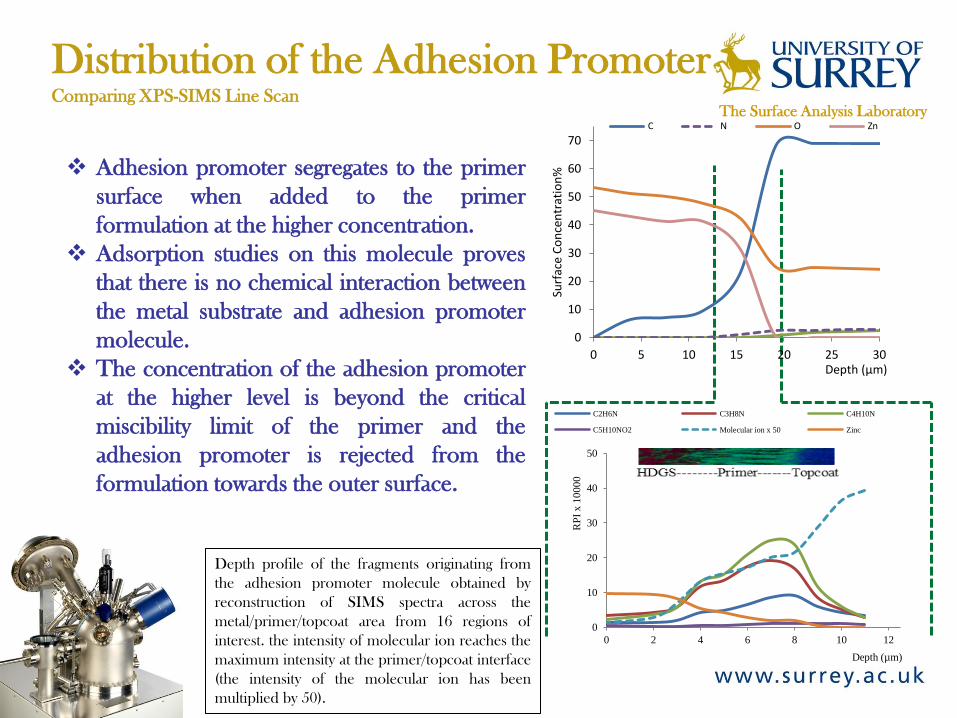
Distribution of the Adhesion Promoter Comparing XPS-SIMS Line Scan
0
10
20
30
40
50
0 2 4 6 8 10 12
RP
I x 1
00
00
C2H6N C3H8N C4H10N
C5H10NO2 Molecular ion x 50 Zinc
Depth (µm)
Depth profile of the fragments originating from
the adhesion promoter molecule obtained by
reconstruction of SIMS spectra across the
metal/primer/topcoat area from 16 regions of
interest. the intensity of molecular ion reaches the
maximum intensity at the primer/topcoat interface
(the intensity of the molecular ion has been
multiplied by 50).
Adhesion promoter segregates to the primer
surface when added to the primer
formulation at the higher concentration.
Adsorption studies on this molecule proves
that there is no chemical interaction between
the metal substrate and adhesion promoter
molecule.
The concentration of the adhesion promoter
at the higher level is beyond the critical
miscibility limit of the primer and the
adhesion promoter is rejected from the
formulation towards the outer surface.
0
10
20
30
40
50
60
70
0 5 10 15 20 25 30
Surf
ace
Co
nce
ntr
atio
n%
Depth (µm)
C N O Zn
The Surface Analysis Laboratory
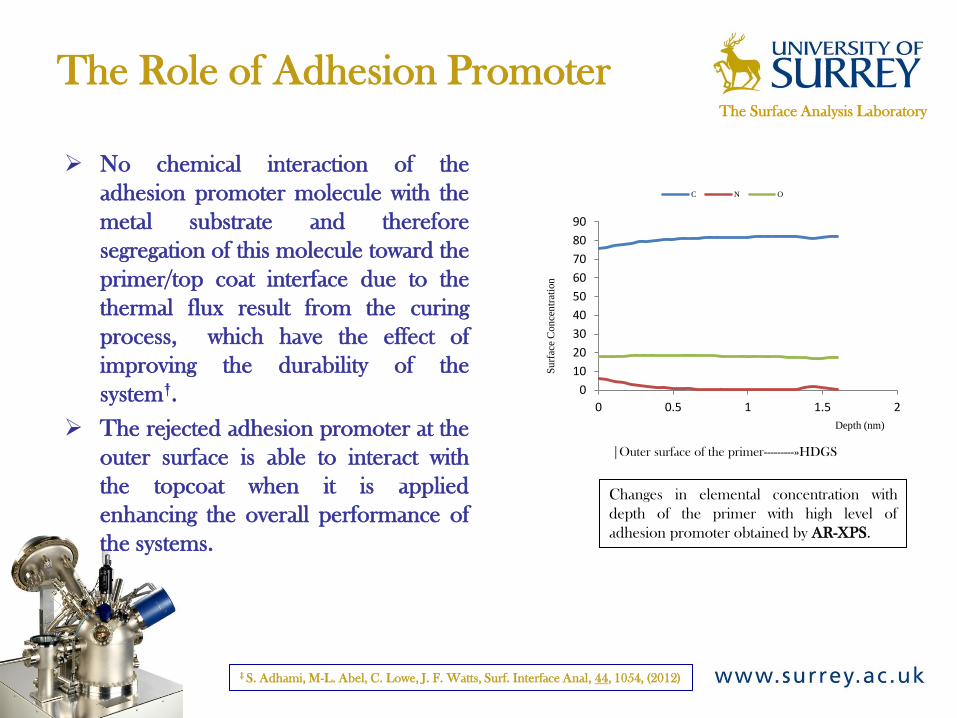
The Role of Adhesion Promoter
No chemical interaction of the
adhesion promoter molecule with the
metal substrate and therefore
segregation of this molecule toward the
primer/top coat interface due to the
thermal flux result from the curing
process, which have the effect of
improving the durability of the
system†.
The rejected adhesion promoter at the
outer surface is able to interact with
the topcoat when it is applied
enhancing the overall performance of
the systems.
0
10
20
30
40
50
60
70
80
90
0 0.5 1 1.5 2
C N O
Depth (nm)
Su
rfac
e C
on
cen
trat
ion
|Outer surface of the primer---------»HDGS
Changes in elemental concentration with
depth of the primer with high level of
adhesion promoter obtained by AR-XPS.
‡ S. Adhami, M-L. Abel, C. Lowe, J. F. Watts, Surf. Interface Anal, 44, 1054, (2012)
The Surface Analysis Laboratory
Conclusions
In these model systems, the adhesion promoter molecules tend to segregate toward
the primer surface instead of segregating to and improving the adhesive properties
of the primer/metal interface; which was unexpected!
The segregation of the adhesion promoter molecules toward the primer surface
improves the performance of the panels as on application of the topcoat, the
primer/topcoat interface becomes critical for durability.
The durability of the system improves as the concentration of the adhesion
promoter is increased.
This highlights the important role to be played by the primer/topcoat interface in a
multi-coat organic coatings system.
The Surface Analysis Laboratory
Thanks for Your Attention
Any Questions?