Embed Size (px)
Citation preview
Policy Research Working Paper 8068
The Rise of the Middle Class and Economic Growth in ASEAN
Markus BruecknerEra Dabla-NorrisMark Gradstein
Daniel Lederman
Latin America and the Caribbean RegionOffice of the Chief EconomistMay 2017
WPS8068P
ublic
Dis
clos
ure
Aut
horiz
edP
ublic
Dis
clos
ure
Aut
horiz
edP
ublic
Dis
clos
ure
Aut
horiz
edP
ublic
Dis
clos
ure
Aut
horiz
ed
Produced by the Research Support Team
Abstract
The Policy Research Working Paper Series disseminates the findings of work in progress to encourage the exchange of ideas about development issues. An objective of the series is to get the findings out quickly, even if the presentations are less than fully polished. The papers carry the names of the authors and should be cited accordingly. The findings, interpretations, and conclusions expressed in this paper are entirely those of the authors. They do not necessarily represent the views of the International Bank for Reconstruction and Development/World Bank and its affiliated organizations, or those of the Executive Directors of the World Bank or the governments they represent.
Policy Research Working Paper 8068
This paper is a product of the Office of the Chief Economist, Latin America and the Caribbean Region. It is part of a larger effort by the World Bank to provide open access to its research and make a contribution to development policy discussions around the world. Policy Research Working Papers are also posted on the Web at http://econ.worldbank.org. The authors may be contacted at [email protected] or [email protected].
This paper presents estimates of the relationship between the share of income accruing to the middle class and gross domes-tic product per capita of economies from the Association of Southeast Asian Nations. The increase in gross domestic product per capita that these economies experienced during 1970–2010 significantly contributed to a higher share of income accruing to the middle class. The impact of the rise of the middle class on economic growth depends on the countries’ initial level of gross domestic product per capita. In the majority of these countries, a rise of the middle
class that is unrelated to gross domestic product per capita growth would have had a significant negative effect on eco-nomic growth, based on the values of the countries’ gross domestic product per capita in 1970. In contrast, for recent values of gross domestic product per capita, a rise of the middle class would positively contribute to growth in gross domestic product per capita. The paper shows that human capital accumulation is an important channel through which a rise of the middle class affects economic growth.
The Rise of the Middle Class and Economic Growth in ASEAN
by
Markus Brueckner, Era Dabla-Norris, Mark Gradstein, and Daniel Lederman*
Key words: Income Inequality, Economic Growth, ASEAN
JEL codes: O1
* Australian National University (Brueckner); International Monetary Fund (Dabla-Norris); Ben Gurion University (Gradstein); and World Bank (Lederman). Corresponding author's email: [email protected]. We gratefully acknowledge comments received at the Trade, Industrialization and Structural Reforms in ASEAN conference that was held in Ho Chi Minh City in January 2017; particular thanks to our discussant Willem Thorbecke. Comments provided by Bruce Chapman, Tim Hatton, and Rod Tyers are also much appreciated.
2
1. Introduction This paper presents estimates of the relationship between the share of income held by the middle
class and economic growth of ASEAN economies. As such, the paper is part of a literature in
macroeconomics that examines the relationship between income inequality and aggregate output of
countries; see Galor (2011) for a review. At least since Kuznet (1955), it has been noted that the
relationship between income inequality and GDP per capita may be non-linear. Galor and Zeira
(1993) provide a model that generates such an inverted U-shaped relationship between income
inequality and GDP per capita. In their model, a bi-directional causality between income
distribution and GDP per capita emerges: (i) an increase in GDP per capita reduces income
inequality; (ii) the effect of an increase in income inequality on GDP per capita is positive for
relatively poor countries and negative for relatively rich countries. In the Galor and Zeira (1993)
model, the mechanism that generates the non-linear effect of income inequality on GDP per capita
is human capital accumulation: With credit market imperfections and fixed costs of human capital
accumulation, an increase in income inequality increases investment in human capital in relatively
poor countries; but the opposite is the case in relatively rich countries.
The first part of this paper presents effects that economic growth during 1970-2010 had on
changes of ASEAN countries' shares of income accruing to the third and fourth quintiles. Brueckner
et al. (2015) used international oil price shocks and trade-weighted world income of countries as
instruments to estimate the effect that exogenous variation in GDP per capita has on various
measures of countries' income inequality. Using these estimates and data on changes of ASEAN
countries' GDP per capita between 1970 and 2010, this paper computes predicted effects that GDP
per capita growth during 1970-2010 had on changes in the income share accruing to the middle
class of ASEAN countries. The main finding is that the middle class gained substantially from
economic growth over the past four decades: the share of income accruing to the 3rd (4th) quintile
increased for the average ASEAN country by around 6 (8) percentage points due to growth in
3
average incomes during that period.
In the second part of the paper, we present predictions of the effects that changes in income
inequality have on ASEAN countries' GDP per capita growth. These predicted effects are computed
by combining estimates of the non-linear effect that a change in income inequality has on GDP per
capita growth and data on ASEAN countries' initial GDP per capita. Brueckner and Lederman
(2015) provide instrumental variables estimates of the effect that an exogenous change in income
inequality has on GDP per capita growth. This paper draws on the estimates presented in that paper.
One of the main findings in this paper is that for the majority of ASEAN countries a rise of
the middle class would have had a negative effect on economic growth if it would have occurred at
an early stage of economic development, as measured by levels of GDP per capita in 1970. ASEAN
economies' average income was too low in 1970 for a rise of the middle class to have generated a
positive effect on economic growth. In contrast, for current values of average income a rise of the
middle class has a positive effect on economic growth in all the ASEAN countries.
Consistent with the Galor and Zeira (1993) model, the paper documents that human capital
accumulation is an important mechanism through which the rise of the middle class affects
economic growth in ASEAN. At the early stage of development, as measured by 1970 levels of
GDP per capita, an increase of the share of income held by the middle class would have had a
negative effect on the share of the population with secondary and tertiary education in ASEAN
countries. But for recent levels of ASEAN countries' GDP per capita the opposite is the case: An
increase in the share of income held by the middle class would increase the share of the population
with secondary and tertiary education. Borrowing constraints in investment in human capital1 may
explain the existence of this non-linear relationship between income inequality, economic growth,
and education; see the model of Galor and Zeira (1993).
1 For a discussion of borrowing constraints in investment in human capital, see Chapman (2006); or Asian
Development Bank (2011) for a discussion that has a specific focus on Asian countries.
4
2. Results
2.1 Effect of Economic Growth on the Rise of the Middle Class
Table 1 shows predictions of the country-specific effects that changes in the natural logarithm of
GDP per capita between 1970 and 2010 had on the income shares of the 3rd and 4th quintiles in
ASEAN countries. To generate these numbers, one first needs an estimate of the causal effect that
GDP per capita has on the income share of the 3rd and 4th quintiles. Brueckner et al. (2015) provide
such an estimate. For a panel of 104 countries spanning the period 1970-2010, they use oil price
shocks and trade-weighted world income as an instrument for GDP per capita. Their panel fixed
effects estimates show that exogenous increases in GDP per capita have a significant positive effect
on the income share of the 3rd and 4th quintiles.2 The relevant equation is:
(1) Inequalityct = ec + ft + αln(GDP p.c.)ct + εit
From the estimates provided in Brueckner et al. (2015), we can compute the effect that changes in
the natural logarithm of GDP per capita between 1970 and 2010 had on the income shares of the 3rd
and 4th quintiles of ASEAN countries. Specifically, this is done by multiplying the coefficients
reported in columns (4) and (5) of Table 1 in Brueckner et al. (2015) with the changes of ASEAN
countries' natural logarithms of GDP per capita between 1970 and 2010.3 Data on GDP per capita
are from the Penn World Table (Heston et al., 2012).
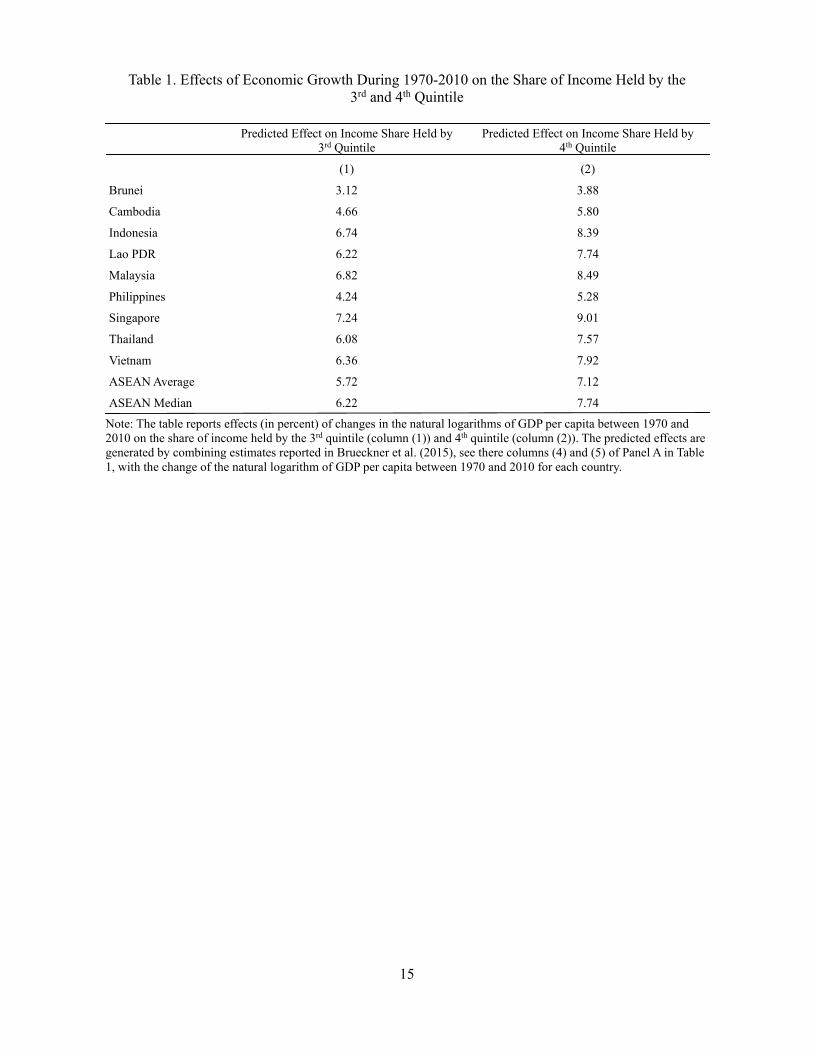
From Table 1, one can see that economic growth of ASEAN countries between 1970 and
2010 had a substantial impact on the share of income accruing to the middle class. In column (1) a
measure of the middle class is the income share of the 3rd quintile. In column (2) a measure of the
upper middle class is the income share of the 4th quintile. For the average (median) ASEAN
country, growth in GDP per capita between 1970 and 2010 increased the income share of the 3rd
quintile by around 5.7 (6.2) percentage points. The effect on the 4th quintile is slightly larger, around
7 percentage points.
2 Brueckner et al. (2015) do not find a significant non-linear effect of national income, i.e. [ln(GDP p.c.)]2, on the
income shares. 3 This follows from totally differentiating equation (1): Δinequalityct = αΔln(GDP p.c.)ct.
5
The ASEAN country with the highest GDP per capita growth rate during 1970-2010 was
Singapore. According to Table 1, the income share of the 3rd (4th) quintile was boosted in Singapore
due to rapid GDP per capita growth during that period by around 7 (9) percentage points. In
contrast, the ASEAN country with the lowest GDP per capita growth rate during 1970-2010 was
Brunei. Growth of Brunei's GDP per capita during 1970-2010 increased the income share of the 3rd
(4th) quintile by around 3 (4) percentage points.
2.2. Effect of the Rise of the Middle Class on Economic Growth
Brueckner and Lederman (2015) present instrumental variables estimates of the impact that various
measures of income inequality have on GDP per capita. The authors use the residual variation in
income inequality, ε, that is not due to GDP per capita as an instrument to estimate effects that
exogenous variation in income inequality have on GDP per capita.4 The relevant equation is:
(2) ln(GDP p.c.)ct = ac + bt + θ1Inequalityct + θ2Inequalityct*ln(initial GDP p.c.)c + uct
Brueckner and Lederman (2015) find that the effect of inequality on GDP per capita differs
depending on countries' initial level of GDP per capita. The estimates that these authors provide are
useful for computing effects that a rise of the middle class has on GDP per capita of ASEAN
economies at different stages of these countries' economic development.
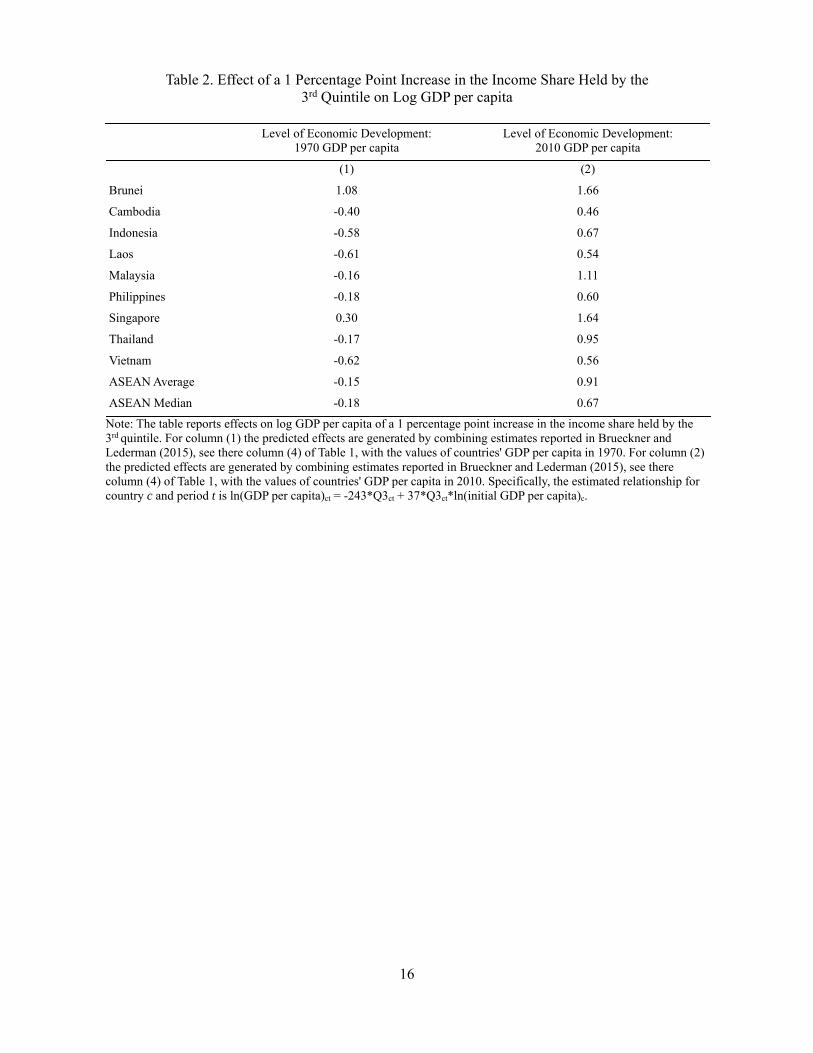
Table 2 reports predicted effects of a 1 percentage point increase in the income share of the
3rd quintile on GDP per capita of ASEAN countries. Column (1) reports predicted effects based on
ASEAN countries' initial economic development as measured by GDP per capita in 1970; column
(2) reports effects for recent levels of economic development as measured by GDP per capita in
2010. Specifically, for column (1) the predicted effects are generated by combining estimates
reported in Brueckner and Lederman (2015) (see their column (4) of Table 1), with the values of
countries' GDP per capita in 1970. For column (2) the predicted effects are generated by combining
4 To do this, one needs a consistent estimate of α in equation (1). This estimate is obtained from Brueckner et al.
(2015). For papers that have applied such an instrumental variables strategy in the context of foreign aid and fiscal policy, see, for example, Brueckner (2013) and Fatas and Mihov (2001).
6
estimates reported in Brueckner and Lederman (2015) (see their column (4) of Table 1), with the
values of countries' GDP per capita in 2010. Brueckner and Lederman's estimated relationship for
country c and period t is:
(3) ln(GDP per capita)ct = -243*Q3ct + 37*Q3ct*ln(initial GDP per capita)c
where Q3 is the income share of the 3rd quintile.
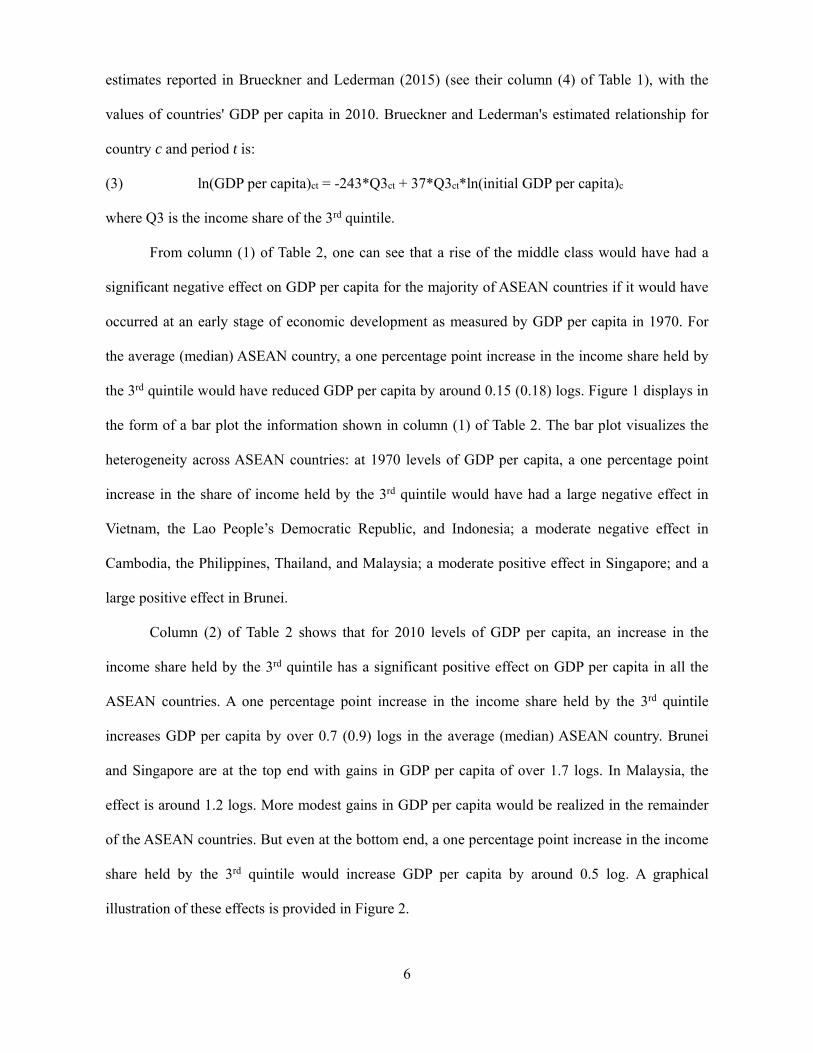
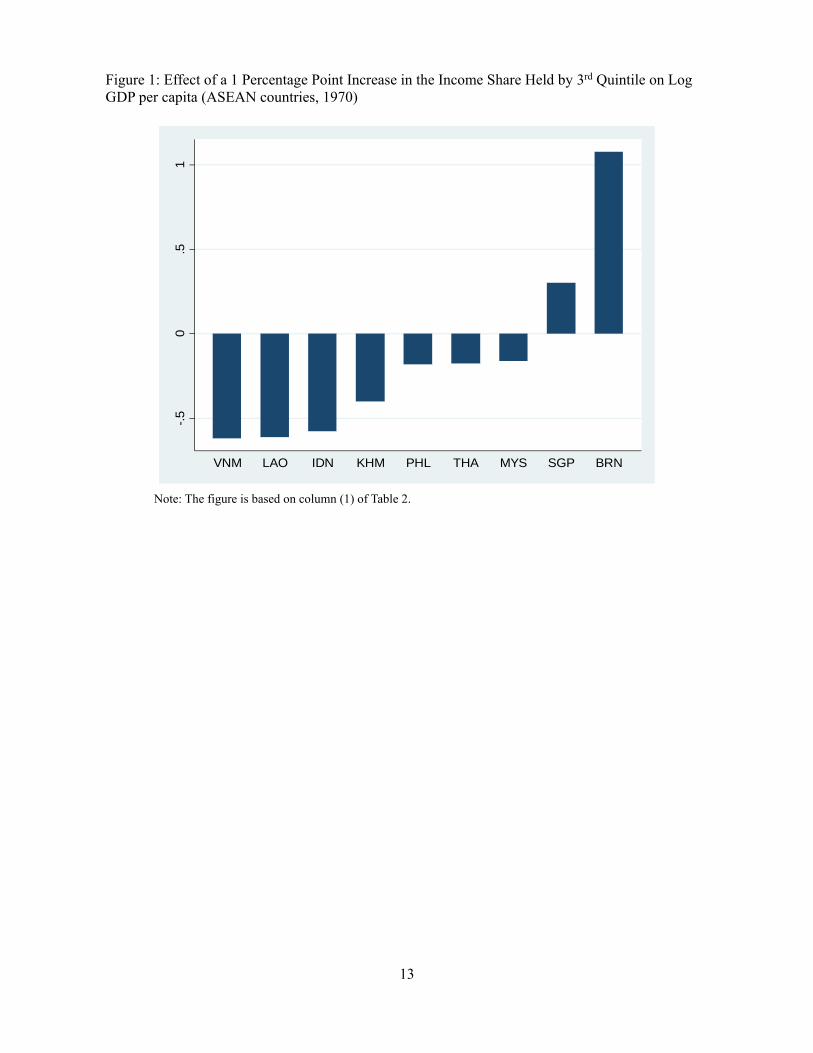
From column (1) of Table 2, one can see that a rise of the middle class would have had a
significant negative effect on GDP per capita for the majority of ASEAN countries if it would have
occurred at an early stage of economic development as measured by GDP per capita in 1970. For
the average (median) ASEAN country, a one percentage point increase in the income share held by
the 3rd quintile would have reduced GDP per capita by around 0.15 (0.18) logs. Figure 1 displays in
the form of a bar plot the information shown in column (1) of Table 2. The bar plot visualizes the
heterogeneity across ASEAN countries: at 1970 levels of GDP per capita, a one percentage point
increase in the share of income held by the 3rd quintile would have had a large negative effect in
Vietnam, the Lao People’s Democratic Republic, and Indonesia; a moderate negative effect in
Cambodia, the Philippines, Thailand, and Malaysia; a moderate positive effect in Singapore; and a
large positive effect in Brunei.
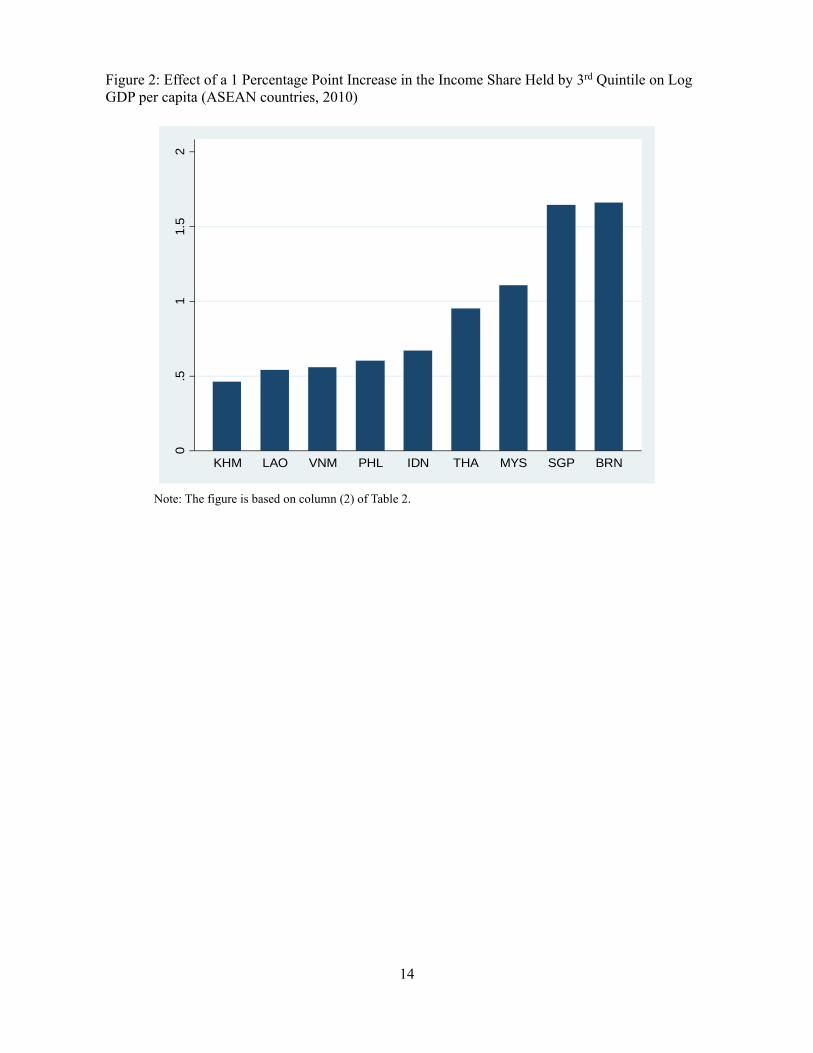
Column (2) of Table 2 shows that for 2010 levels of GDP per capita, an increase in the
income share held by the 3rd quintile has a significant positive effect on GDP per capita in all the
ASEAN countries. A one percentage point increase in the income share held by the 3rd quintile
increases GDP per capita by over 0.7 (0.9) logs in the average (median) ASEAN country. Brunei
and Singapore are at the top end with gains in GDP per capita of over 1.7 logs. In Malaysia, the
effect is around 1.2 logs. More modest gains in GDP per capita would be realized in the remainder
of the ASEAN countries. But even at the bottom end, a one percentage point increase in the income
share held by the 3rd quintile would increase GDP per capita by around 0.5 log. A graphical
illustration of these effects is provided in Figure 2.
7
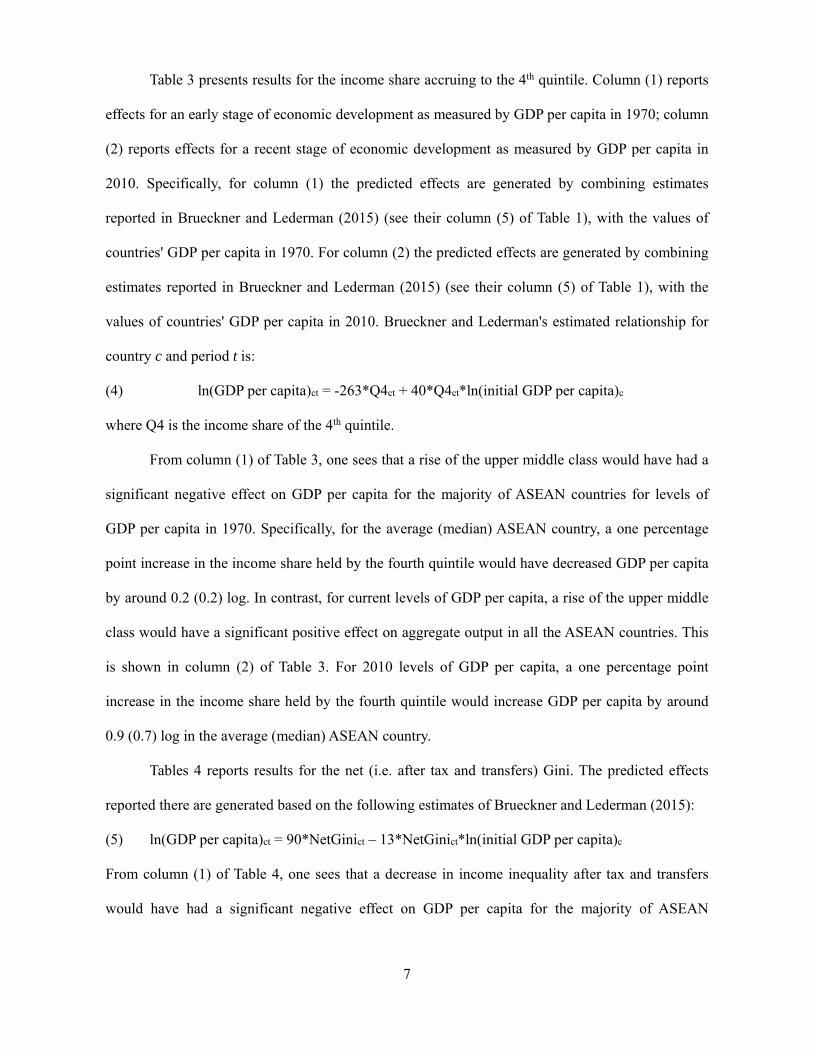
Table 3 presents results for the income share accruing to the 4th quintile. Column (1) reports
effects for an early stage of economic development as measured by GDP per capita in 1970; column
(2) reports effects for a recent stage of economic development as measured by GDP per capita in
2010. Specifically, for column (1) the predicted effects are generated by combining estimates
reported in Brueckner and Lederman (2015) (see their column (5) of Table 1), with the values of
countries' GDP per capita in 1970. For column (2) the predicted effects are generated by combining
estimates reported in Brueckner and Lederman (2015) (see their column (5) of Table 1), with the
values of countries' GDP per capita in 2010. Brueckner and Lederman's estimated relationship for
country c and period t is:
(4) ln(GDP per capita)ct = -263*Q4ct + 40*Q4ct*ln(initial GDP per capita)c
where Q4 is the income share of the 4th quintile.
From column (1) of Table 3, one sees that a rise of the upper middle class would have had a
significant negative effect on GDP per capita for the majority of ASEAN countries for levels of
GDP per capita in 1970. Specifically, for the average (median) ASEAN country, a one percentage
point increase in the income share held by the fourth quintile would have decreased GDP per capita
by around 0.2 (0.2) log. In contrast, for current levels of GDP per capita, a rise of the upper middle
class would have a significant positive effect on aggregate output in all the ASEAN countries. This
is shown in column (2) of Table 3. For 2010 levels of GDP per capita, a one percentage point
increase in the income share held by the fourth quintile would increase GDP per capita by around
0.9 (0.7) log in the average (median) ASEAN country.
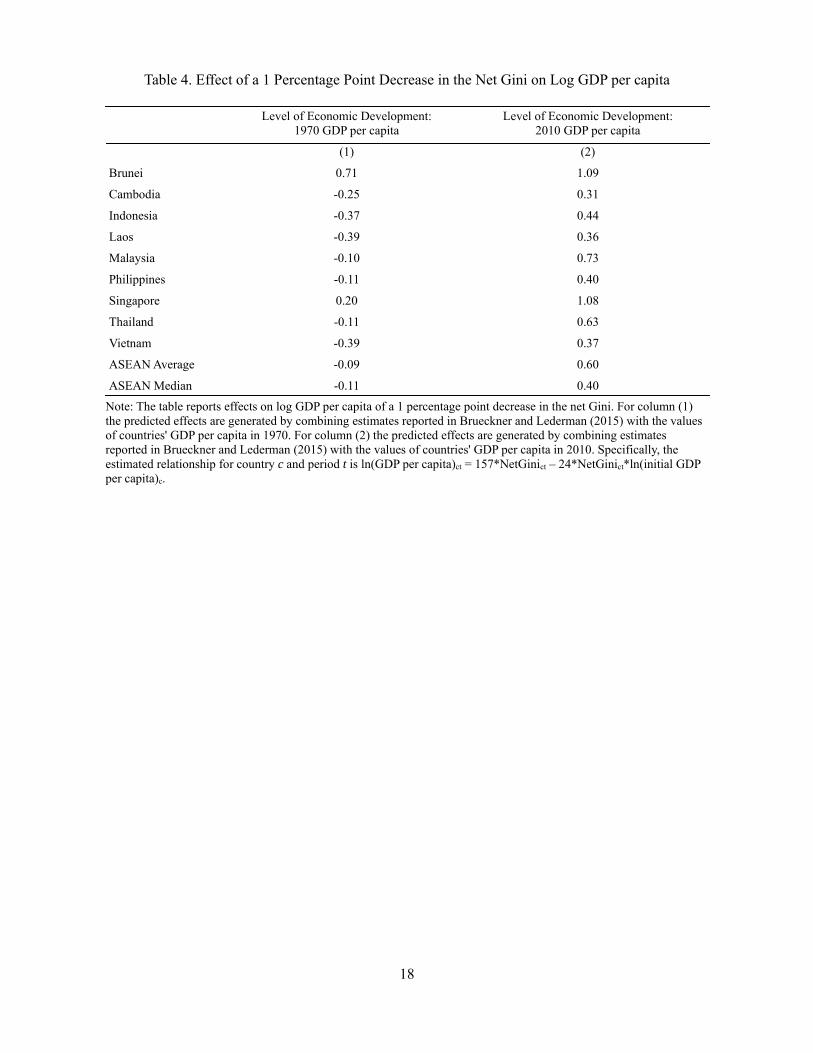
Tables 4 reports results for the net (i.e. after tax and transfers) Gini. The predicted effects
reported there are generated based on the following estimates of Brueckner and Lederman (2015):
(5) ln(GDP per capita)ct = 90*NetGinict – 13*NetGinict*ln(initial GDP per capita)c
From column (1) of Table 4, one sees that a decrease in income inequality after tax and transfers
would have had a significant negative effect on GDP per capita for the majority of ASEAN
8
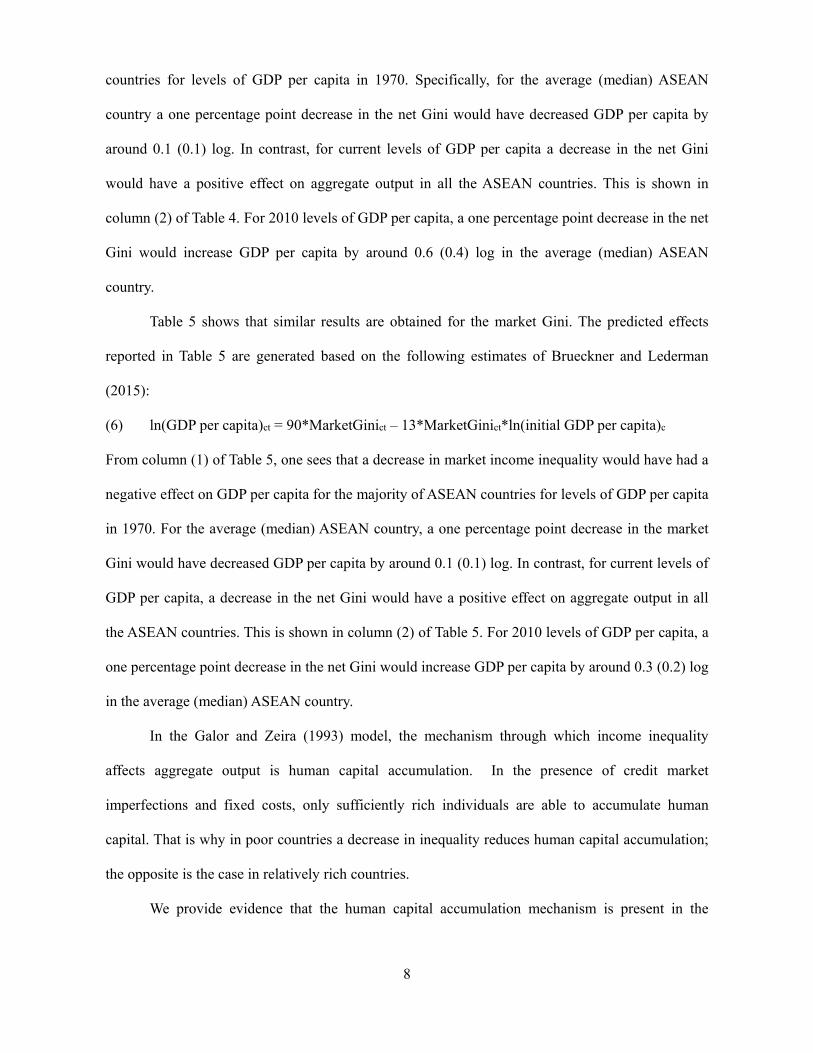
countries for levels of GDP per capita in 1970. Specifically, for the average (median) ASEAN
country a one percentage point decrease in the net Gini would have decreased GDP per capita by
around 0.1 (0.1) log. In contrast, for current levels of GDP per capita a decrease in the net Gini
would have a positive effect on aggregate output in all the ASEAN countries. This is shown in
column (2) of Table 4. For 2010 levels of GDP per capita, a one percentage point decrease in the net
Gini would increase GDP per capita by around 0.6 (0.4) log in the average (median) ASEAN
country.
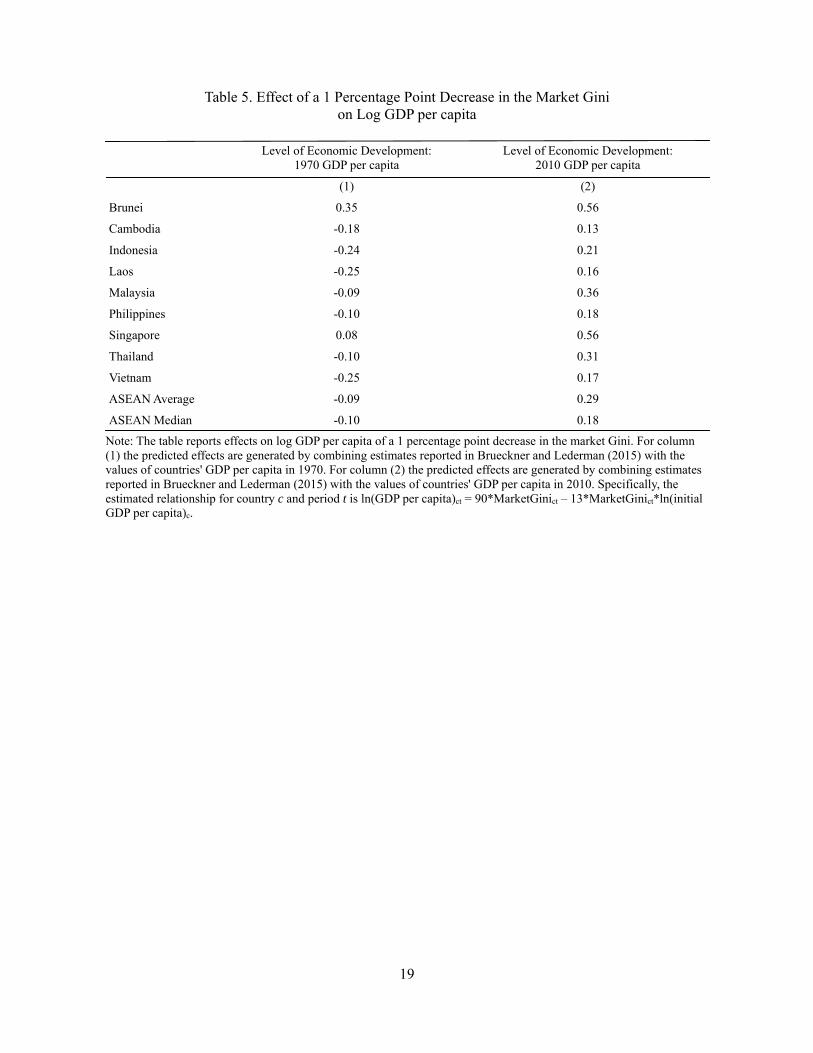
Table 5 shows that similar results are obtained for the market Gini. The predicted effects
reported in Table 5 are generated based on the following estimates of Brueckner and Lederman
(2015):
(6) ln(GDP per capita)ct = 90*MarketGinict – 13*MarketGinict*ln(initial GDP per capita)c
From column (1) of Table 5, one sees that a decrease in market income inequality would have had a
negative effect on GDP per capita for the majority of ASEAN countries for levels of GDP per capita
in 1970. For the average (median) ASEAN country, a one percentage point decrease in the market
Gini would have decreased GDP per capita by around 0.1 (0.1) log. In contrast, for current levels of
GDP per capita, a decrease in the net Gini would have a positive effect on aggregate output in all
the ASEAN countries. This is shown in column (2) of Table 5. For 2010 levels of GDP per capita, a
one percentage point decrease in the net Gini would increase GDP per capita by around 0.3 (0.2) log
in the average (median) ASEAN country.
In the Galor and Zeira (1993) model, the mechanism through which income inequality
affects aggregate output is human capital accumulation. In the presence of credit market
imperfections and fixed costs, only sufficiently rich individuals are able to accumulate human
capital. That is why in poor countries a decrease in inequality reduces human capital accumulation;
the opposite is the case in relatively rich countries.
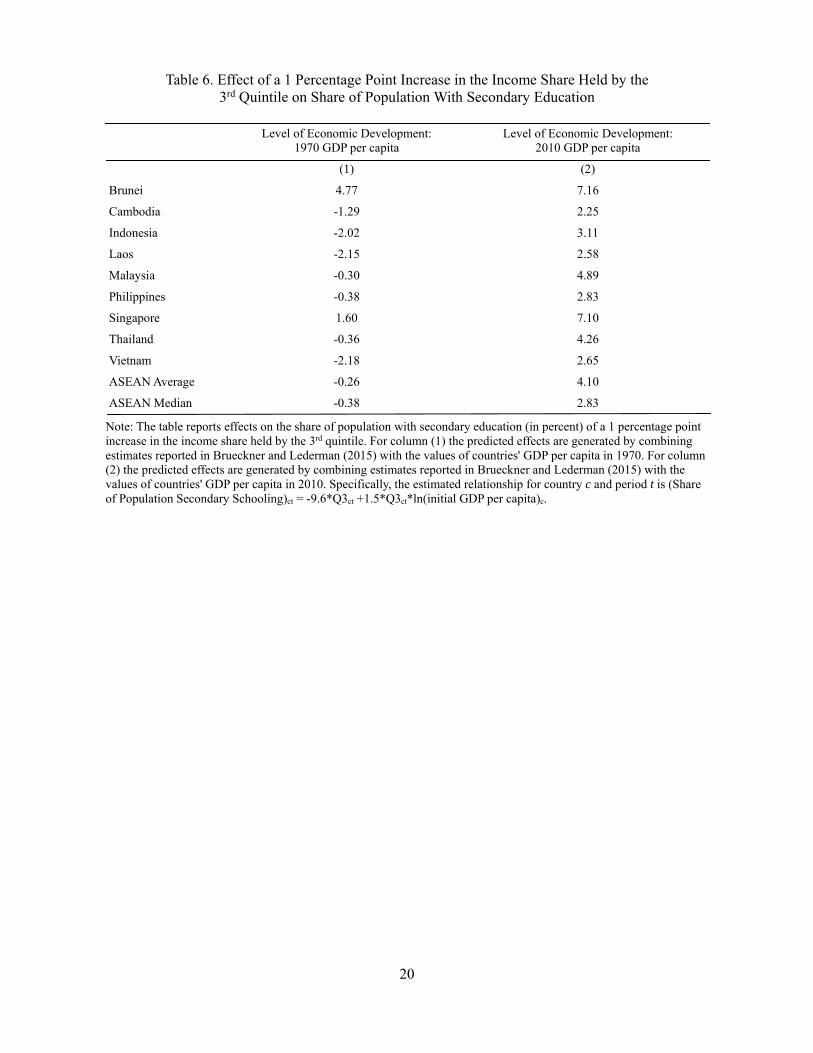
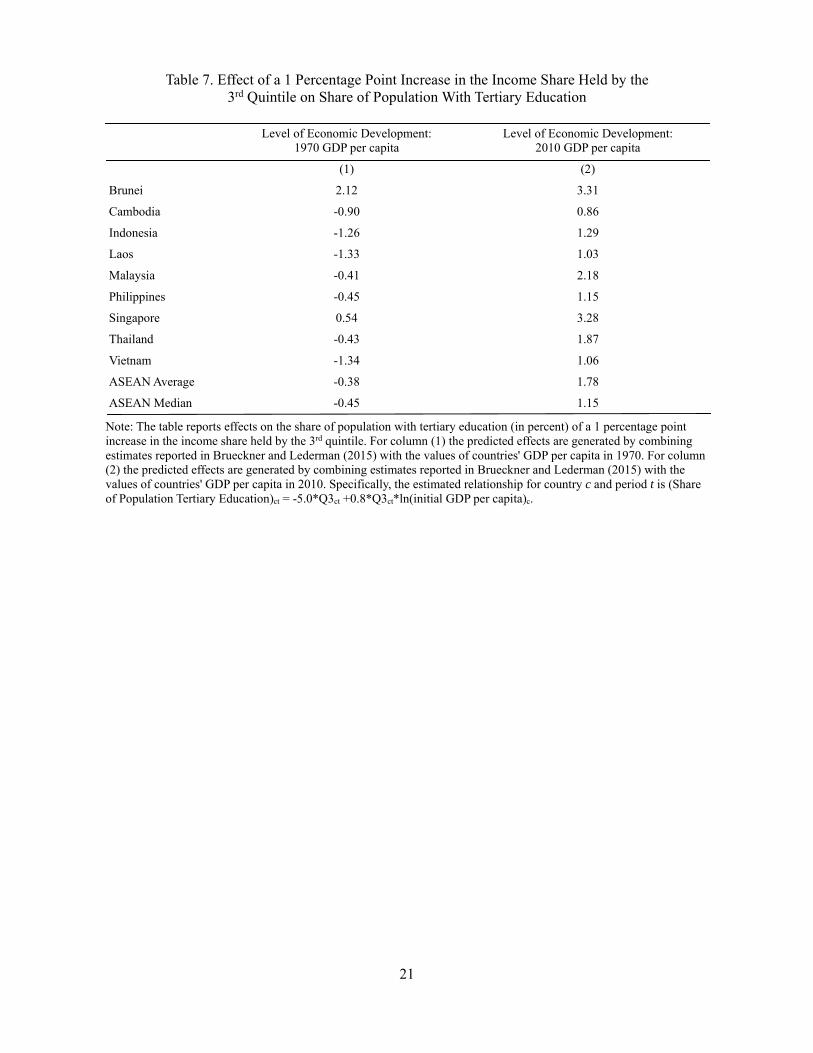
We provide evidence that the human capital accumulation mechanism is present in the
9
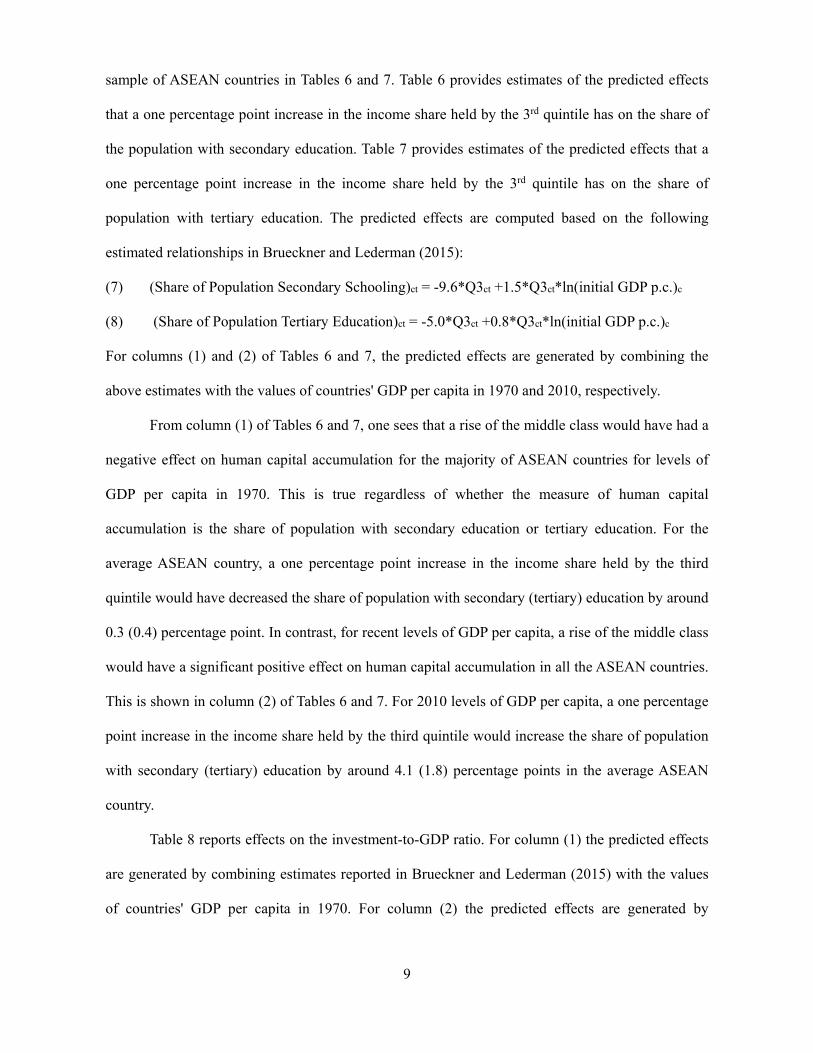
sample of ASEAN countries in Tables 6 and 7. Table 6 provides estimates of the predicted effects
that a one percentage point increase in the income share held by the 3rd quintile has on the share of
the population with secondary education. Table 7 provides estimates of the predicted effects that a
one percentage point increase in the income share held by the 3rd quintile has on the share of
population with tertiary education. The predicted effects are computed based on the following
estimated relationships in Brueckner and Lederman (2015):
(7) (Share of Population Secondary Schooling)ct = -9.6*Q3ct +1.5*Q3ct*ln(initial GDP p.c.)c
(8) (Share of Population Tertiary Education)ct = -5.0*Q3ct +0.8*Q3ct*ln(initial GDP p.c.)c
For columns (1) and (2) of Tables 6 and 7, the predicted effects are generated by combining the
above estimates with the values of countries' GDP per capita in 1970 and 2010, respectively.
From column (1) of Tables 6 and 7, one sees that a rise of the middle class would have had a
negative effect on human capital accumulation for the majority of ASEAN countries for levels of
GDP per capita in 1970. This is true regardless of whether the measure of human capital
accumulation is the share of population with secondary education or tertiary education. For the
average ASEAN country, a one percentage point increase in the income share held by the third
quintile would have decreased the share of population with secondary (tertiary) education by around
0.3 (0.4) percentage point. In contrast, for recent levels of GDP per capita, a rise of the middle class
would have a significant positive effect on human capital accumulation in all the ASEAN countries.
This is shown in column (2) of Tables 6 and 7. For 2010 levels of GDP per capita, a one percentage
point increase in the income share held by the third quintile would increase the share of population
with secondary (tertiary) education by around 4.1 (1.8) percentage points in the average ASEAN
country.
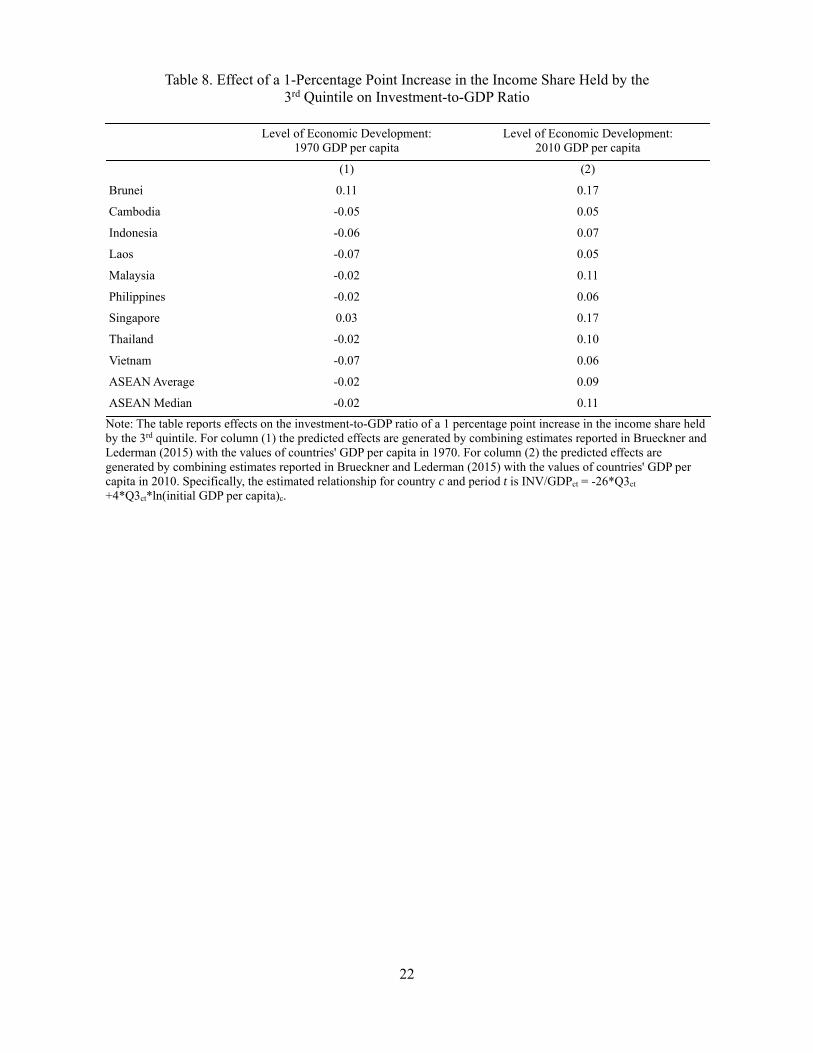
Table 8 reports effects on the investment-to-GDP ratio. For column (1) the predicted effects
are generated by combining estimates reported in Brueckner and Lederman (2015) with the values
of countries' GDP per capita in 1970. For column (2) the predicted effects are generated by
10
combining estimates reported in Brueckner and Lederman (2015) with the values of countries' GDP
per capita in 2010. Specifically, the estimated relationship for country c and period t is:
INV/GDPct = -26*Q3ct +4*Q3ct*ln(initial GDP per capita)c
Column (1) of Table 8 shows that an increase in the income share of the 3rd quintile has a negative
effect on the investment-to-GDP ratio for the majority of ASEAN countries for 1970 levels of GDP
per capita. From column (2) of Table 8, one sees that for 2010 levels of GDP per capita the effects
are positive for all ASEAN countries.
3. Summary This paper provided estimates of the relationship between the rise of the middle class and economic
growth in ASEAN countries. At early stages of economic development (as measured by GDP per
capita in 1970), a rise of the middle class would have decreased GDP per capita growth in ASEAN.
However, for current levels of GDP per capita, a rise of the middle class increases growth. The
paper documented that human capital accumulation, measured by the share of the population with
secondary and tertiary education, is an important mechanism through which changes in the income
share held by the middle class affect economic growth.
11
References Asian Development Bank (2011). “Higher Education in Asia: An Overview of Issues and
Strategies.” Available at https://www.adb.org/sites/default/files/publication/29407/higher-
education-across-asia.pdf
Barro, R. and J.W. Lee (2013). "A New Data Set of Educational Attainment in the World, 1950-
2010." Journal of Development Economics 104: 184-198.
Brueckner, M. (2013). “On the Simultaneity Problem in the Aid and Growth Debate”. Journal of
Applied Econometrics 28: 102-125.
Brueckner, M., E. Dabla Norris, M. Gradstein (2015). "National Income and Its Distribution."
Journal of Economic Growth 20: 149-175.
Brueckner, M. and D. Lederman (2015). "Effects of Income Inequality on Aggregate Output."
World Bank Policy Discussion Paper 7317.
Chapman, B. (2006). Government Managing Risk: Income contingent loans for social and
economic progress, Routledge, London.
Fatas, A. and I. Mihov (2003). "The Case for Restricting Fiscal Policy Discretion." Quarterly
Journal of Economics 118: 1419-1447.
Galor, O. (2011). “Inequality, Human Capital Formation, and the Process of Development.”
Handbook of the Economics of Education, North Holland.
Galor, O. and J. Zeira (1993). “Income Distribution and Macroeconomics.” Review of Economic
Studies 60: 35-52.
Kuznet, S. (1955). “Economic Growth and Income Inequality.” American Economic Review 45: 1-
28.
Heston, A., R. Summers and B. Aten (2012). "Penn World Table Version 7.1." Center for
International Comparisons of Production, Income and Prices at the University of
Pennsylvania.
12
Solt, F. (2009). "Standardizing the World Income Inequality Database." Social Science Quarterly
90: 231-242.
WDI (2014). World Development Indicators. Available for download at http://data.worldbank.org/
13
Figure 1: Effect of a 1 Percentage Point Increase in the Income Share Held by 3rd Quintile on Log GDP per capita (ASEAN countries, 1970)
Note: The figure is based on column (1) of Table 2.
-.5
0.5
1
VNM LAO IDN KHM PHL THA MYS SGP BRN
14
Figure 2: Effect of a 1 Percentage Point Increase in the Income Share Held by 3rd Quintile on Log GDP per capita (ASEAN countries, 2010)
Note: The figure is based on column (2) of Table 2.
0.5
11.
52
KHM LAO VNM PHL IDN THA MYS SGP BRN
15
Table 1. Effects of Economic Growth During 1970-2010 on the Share of Income Held by the 3rd and 4th Quintile
Predicted Effect on Income Share Held by
3rd Quintile Predicted Effect on Income Share Held by
4th Quintile
(1) (2)
Brunei 3.12 3.88
Cambodia 4.66 5.80
Indonesia 6.74 8.39
Lao PDR 6.22 7.74
Malaysia 6.82 8.49
Philippines 4.24 5.28
Singapore 7.24 9.01
Thailand 6.08 7.57
Vietnam 6.36 7.92
ASEAN Average 5.72 7.12
ASEAN Median 6.22 7.74
Note: The table reports effects (in percent) of changes in the natural logarithms of GDP per capita between 1970 and 2010 on the share of income held by the 3rd quintile (column (1)) and 4th quintile (column (2)). The predicted effects are generated by combining estimates reported in Brueckner et al. (2015), see there columns (4) and (5) of Panel A in Table 1, with the change of the natural logarithm of GDP per capita between 1970 and 2010 for each country.
16
Table 2. Effect of a 1 Percentage Point Increase in the Income Share Held by the 3rd Quintile on Log GDP per capita
Level of Economic Development:
1970 GDP per capita Level of Economic Development:
2010 GDP per capita
(1) (2)
Brunei 1.08 1.66
Cambodia -0.40 0.46
Indonesia -0.58 0.67
Laos -0.61 0.54
Malaysia -0.16 1.11
Philippines -0.18 0.60
Singapore 0.30 1.64
Thailand -0.17 0.95
Vietnam -0.62 0.56
ASEAN Average -0.15 0.91
ASEAN Median -0.18 0.67
Note: The table reports effects on log GDP per capita of a 1 percentage point increase in the income share held by the 3rd quintile. For column (1) the predicted effects are generated by combining estimates reported in Brueckner and Lederman (2015), see there column (4) of Table 1, with the values of countries' GDP per capita in 1970. For column (2) the predicted effects are generated by combining estimates reported in Brueckner and Lederman (2015), see there column (4) of Table 1, with the values of countries' GDP per capita in 2010. Specifically, the estimated relationship for country c and period t is ln(GDP per capita)ct = -243*Q3ct + 37*Q3ct*ln(initial GDP per capita)c.

17
Table 3. Effect of a 1 Percentage Point Increase in the Income Share Held by the 4th Quintile on Log GDP per capita
Level of Economic Development:
1970 GDP per capita Level of Economic Development:
2010 GDP per capita
(1) (2)
Brunei 1.12 1.75
Cambodia -0.46 0.46
Indonesia -0.65 0.69
Laos -0.68 0.55
Malaysia -0.20 1.16
Philippines -0.22 0.62
Singapore 0.30 1.73
Thailand -0.22 0.94
Vietnam -0.69 0.57
ASEAN Average -0.19 0.94
ASEAN Median -0.22 0.69
Note: The table reports effects on log GDP per capita of a 1 percentage point increase in the income share held by the 4th quintile. For column (1) the predicted effects are generated by combining estimates reported in Brueckner and Lederman (2015), see there column (5) of Table 1, with the values of countries' GDP per capita in 1970. For column (2) the predicted effects are generated by combining estimates reported in Brueckner and Lederman (2015), see there column (5) of Table 1, with the values of countries' GDP per capita in 2010. Specifically, the estimated relationship for country c and period t is ln(GDP per capita)ct = -263*Q4ct + 40*Q4ct*ln(initial GDP per capita)c.
18
Table 4. Effect of a 1 Percentage Point Decrease in the Net Gini on Log GDP per capita
Level of Economic Development: 1970 GDP per capita
Level of Economic Development: 2010 GDP per capita
(1) (2)
Brunei 0.71 1.09
Cambodia -0.25 0.31
Indonesia -0.37 0.44
Laos -0.39 0.36
Malaysia -0.10 0.73
Philippines -0.11 0.40
Singapore 0.20 1.08
Thailand -0.11 0.63
Vietnam -0.39 0.37
ASEAN Average -0.09 0.60
ASEAN Median -0.11 0.40
Note: The table reports effects on log GDP per capita of a 1 percentage point decrease in the net Gini. For column (1) the predicted effects are generated by combining estimates reported in Brueckner and Lederman (2015) with the values of countries' GDP per capita in 1970. For column (2) the predicted effects are generated by combining estimates reported in Brueckner and Lederman (2015) with the values of countries' GDP per capita in 2010. Specifically, the estimated relationship for country c and period t is ln(GDP per capita)ct = 157*NetGinict – 24*NetGinict*ln(initial GDP per capita)c.
19
Table 5. Effect of a 1 Percentage Point Decrease in the Market Gini
on Log GDP per capita
Level of Economic Development: 1970 GDP per capita
Level of Economic Development: 2010 GDP per capita
(1) (2)
Brunei 0.35 0.56
Cambodia -0.18 0.13
Indonesia -0.24 0.21
Laos -0.25 0.16
Malaysia -0.09 0.36
Philippines -0.10 0.18
Singapore 0.08 0.56
Thailand -0.10 0.31
Vietnam -0.25 0.17
ASEAN Average -0.09 0.29
ASEAN Median -0.10 0.18
Note: The table reports effects on log GDP per capita of a 1 percentage point decrease in the market Gini. For column (1) the predicted effects are generated by combining estimates reported in Brueckner and Lederman (2015) with the values of countries' GDP per capita in 1970. For column (2) the predicted effects are generated by combining estimates reported in Brueckner and Lederman (2015) with the values of countries' GDP per capita in 2010. Specifically, the estimated relationship for country c and period t is ln(GDP per capita)ct = 90*MarketGinict – 13*MarketGinict*ln(initial GDP per capita)c.
20
Table 6. Effect of a 1 Percentage Point Increase in the Income Share Held by the 3rd Quintile on Share of Population With Secondary Education
Level of Economic Development:
1970 GDP per capita Level of Economic Development:
2010 GDP per capita
(1) (2)
Brunei 4.77 7.16
Cambodia -1.29 2.25
Indonesia -2.02 3.11
Laos -2.15 2.58
Malaysia -0.30 4.89
Philippines -0.38 2.83
Singapore 1.60 7.10
Thailand -0.36 4.26
Vietnam -2.18 2.65
ASEAN Average -0.26 4.10
ASEAN Median -0.38 2.83
Note: The table reports effects on the share of population with secondary education (in percent) of a 1 percentage point increase in the income share held by the 3rd quintile. For column (1) the predicted effects are generated by combining estimates reported in Brueckner and Lederman (2015) with the values of countries' GDP per capita in 1970. For column (2) the predicted effects are generated by combining estimates reported in Brueckner and Lederman (2015) with the values of countries' GDP per capita in 2010. Specifically, the estimated relationship for country c and period t is (Share of Population Secondary Schooling)ct = -9.6*Q3ct +1.5*Q3ct*ln(initial GDP per capita)c.
21
Table 7. Effect of a 1 Percentage Point Increase in the Income Share Held by the 3rd Quintile on Share of Population With Tertiary Education
Level of Economic Development:
1970 GDP per capita Level of Economic Development:
2010 GDP per capita
(1) (2)
Brunei 2.12 3.31
Cambodia -0.90 0.86
Indonesia -1.26 1.29
Laos -1.33 1.03
Malaysia -0.41 2.18
Philippines -0.45 1.15
Singapore 0.54 3.28
Thailand -0.43 1.87
Vietnam -1.34 1.06
ASEAN Average -0.38 1.78
ASEAN Median -0.45 1.15
Note: The table reports effects on the share of population with tertiary education (in percent) of a 1 percentage point increase in the income share held by the 3rd quintile. For column (1) the predicted effects are generated by combining estimates reported in Brueckner and Lederman (2015) with the values of countries' GDP per capita in 1970. For column (2) the predicted effects are generated by combining estimates reported in Brueckner and Lederman (2015) with the values of countries' GDP per capita in 2010. Specifically, the estimated relationship for country c and period t is (Share of Population Tertiary Education)ct = -5.0*Q3ct +0.8*Q3ct*ln(initial GDP per capita)c.
22
Table 8. Effect of a 1-Percentage Point Increase in the Income Share Held by the 3rd Quintile on Investment-to-GDP Ratio
Level of Economic Development:
1970 GDP per capita Level of Economic Development:
2010 GDP per capita
(1) (2)
Brunei 0.11 0.17
Cambodia -0.05 0.05
Indonesia -0.06 0.07
Laos -0.07 0.05
Malaysia -0.02 0.11
Philippines -0.02 0.06
Singapore 0.03 0.17
Thailand -0.02 0.10
Vietnam -0.07 0.06
ASEAN Average -0.02 0.09
ASEAN Median -0.02 0.11
Note: The table reports effects on the investment-to-GDP ratio of a 1 percentage point increase in the income share held by the 3rd quintile. For column (1) the predicted effects are generated by combining estimates reported in Brueckner and Lederman (2015) with the values of countries' GDP per capita in 1970. For column (2) the predicted effects are generated by combining estimates reported in Brueckner and Lederman (2015) with the values of countries' GDP per capita in 2010. Specifically, the estimated relationship for country c and period t is INV/GDPct = -26*Q3ct +4*Q3ct*ln(initial GDP per capita)c.
23
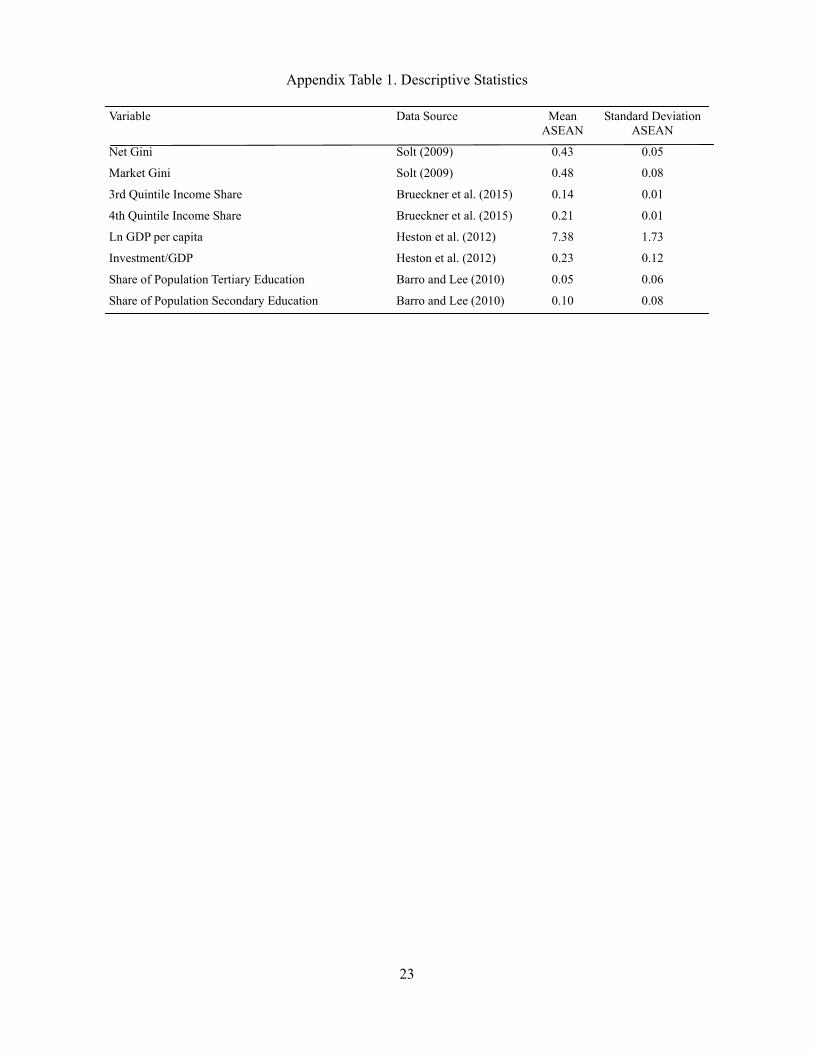
Appendix Table 1. Descriptive Statistics
Variable Data Source Mean ASEAN
Standard Deviation ASEAN
Net Gini Solt (2009) 0.43 0.05
Market Gini Solt (2009) 0.48 0.08
3rd Quintile Income Share Brueckner et al. (2015) 0.14 0.01
4th Quintile Income Share Brueckner et al. (2015) 0.21 0.01
Ln GDP per capita Heston et al. (2012) 7.38 1.73
Investment/GDP Heston et al. (2012) 0.23 0.12
Share of Population Tertiary Education Barro and Lee (2010) 0.05 0.06
Share of Population Secondary Education Barro and Lee (2010) 0.10 0.08
24
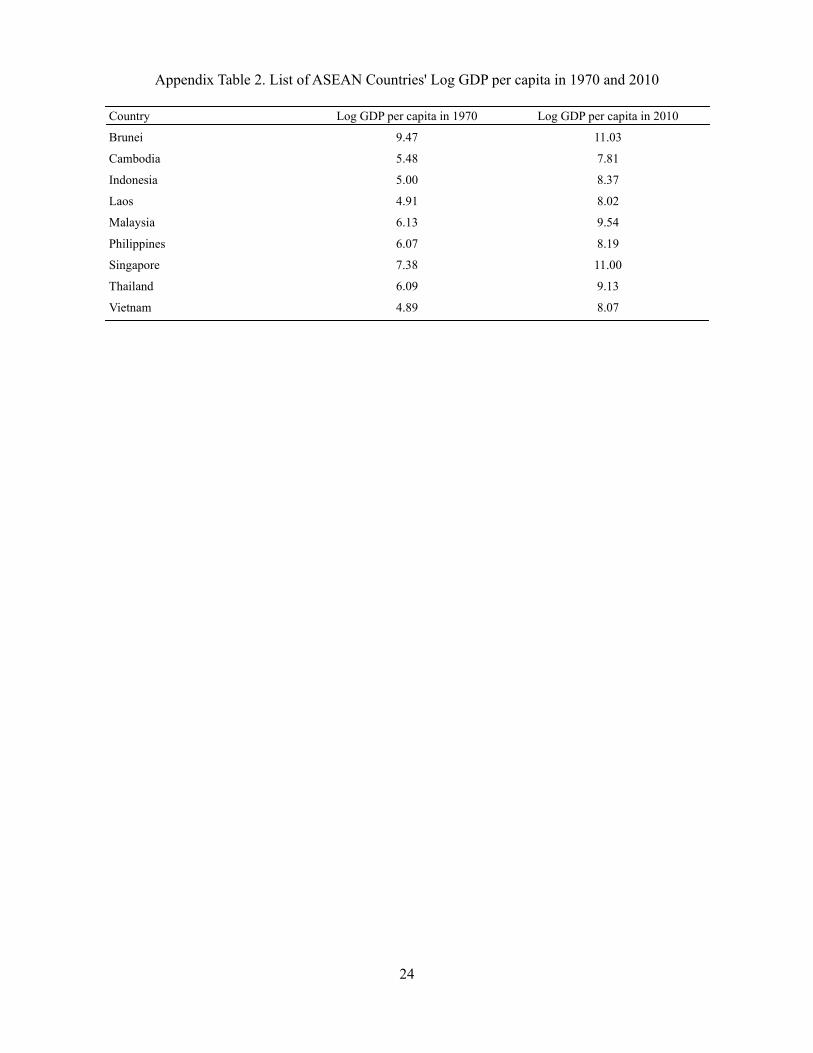
Appendix Table 2. List of ASEAN Countries' Log GDP per capita in 1970 and 2010
Country Log GDP per capita in 1970 Log GDP per capita in 2010
Brunei 9.47 11.03
Cambodia 5.48 7.81
Indonesia 5.00 8.37
Laos 4.91 8.02
Malaysia 6.13 9.54
Philippines 6.07 8.19
Singapore 7.38 11.00
Thailand 6.09 9.13
Vietnam 4.89 8.07