Embed Size (px)
DESCRIPTION
Regionalism has eclipsed the multilateral system as the 'fast track' for international economic restructuring. Within that framework, the Single European Market (SEM) and North American Free Trade Agreement (NAFTA) have emerged as the bi-polar core of the global economic system. Both agreements employ complex economic models as the basis for projected growth and increased competitive advantage and took a relatively simplistic view of 'the firm'.
Citation preview
The Rise of RegionalismRegionalism has eclipsed the multilateral system as the ‘fast track’for international economic restructuring. Within that framework,the Single European Market (SEM) and North American Free TradeAgreement (NAFTA) have emerged as the bi-polar core of the globaleconomic system. Both agreements were sold to the public onrelatively abstract terms, employing complex economic models as thebasis for projected growth and increased competitive advantage.National governments at the time tended to take a relativelysimplistic view of ‘the firm’ and ignore the strategic diversity amongeconomic actors. Partly as a result, ten years into the ‘Second Wave’of regionalism there are few uncontested conclusions as to itsoutcomes or significance.Regional integration in Europe and North America was largely facili-tated through the lobby activity of Western ‘core companies’: large,powerful firms that lead economic restructuring and operate withone foot in the political process. For Western core companies,regionalism has become the institutional framework of choice withinwhich the struggle for the preservation and consolidation of theircore positions is played out. Taking their spatial organization ofproduction in 1990 as a baseline, this study is the first to systema-tically unravel the traditional macro-aggregated understanding ofintegration outcomes. The evidence shows that, despite the persis-tence of ‘globalization’ ideology, regionalism has fueled a diversepattern of strategic migrations among core companies, particularlysince 1995. The outcome is one of growing polarization betweenNorth American and European core companies, and consequentlywithin an increasingly dyadic world economy.
ERIMThe Erasmus Research Institute of Management (ERIM) is the Research
School (Onderzoekschool) in the field of management of the Erasmus
University Rotterdam. The founding participants of ERIM are the
Rotterdam School of Management and the Rotterdam School of
Economics. ERIM was founded in 1999 and is officially accredited by
the Royal Netherlands Academy of Arts and Sciences (KNAW). The
research undertaken by ERIM is focussed on the management of the
firm in its environment, its intra- and inter-firm relations, and its
business processes in their interdependent connections. The objective
of ERIM is to carry out first rate research in management, and to
offer an advanced graduate program in Research in Management.
Within ERIM, over two hundred senior researchers and Ph.D. candi-
dates are active in the different research programs. From a variety of
academic backgrounds and expertises, the ERIM community is united
in striving for excellence and working at the forefront of creating
new business knowledge.
www.erim.eur.nl ISBN 90-5892-062-3
ALAN R. MULLER
AL
AN
R. M
UL
LE
R
Th
e R
ise o
f Rg
ion
alism
38
The Rise of RegionalismCore Company Strategies underthe Second Wave of Integration
Erim - 04 omslag Mullerxp5 01-04-2004 11:55 Pagina 1
THE RISE OF REGIONALISM:
CORE COMPANY STRATEGIES UNDER THE SECOND
WAVE OF INTEGRATION
De opkomst van regionalisering:
kernondernemingsstrategieën onder de tweede integratiegolf
Proefschrift
ter verkrijging van de graad van doctor aan de Erasmus Universiteit Rotterdam
op gezag van de Rector Magnificus
Prof.dr. S.W.J. Lambertsen volgens besluit van het College voor Promoties.
De openbare verdediging zal plaatsvinden op donderdag 3 juni 2004 om 13:30 uur
doorAlan René Muller
geboren te Niagara Falls, New York (USA)

Promotiecommissie
Promotor:Prof.dr. R.J.M. van Tulder
Overige leden: Prof.dr. S.J. Magala Prof.dr. P.M.H.H. Matthyssens Prof.dr. G.C.A. Junne
Erasmus Research Institute of Management (ERIM) Rotterdam School of Management / Rotterdam School of EconomicsErasmus University Rotterdam
Internet: http://www.erim.eur.nl
ERIM Electronic Series Portal: http://hdl.handle.net/1765/1
ERIM Ph.D. Series Research in Management 38
ISBN 90–5892–062–3
© 2004, Alan Muller
All rights reserved. No part of this publication may be reproduced or transmitted in anyform or by any means electronic or mechanical, including photocopying, recording, or byany information storage and retrieval system, without permission in writing from the author.

For Carter & Finn


ACKNOWLEDGEMENTS
The presumptuously thick book before you is the product of the long and winding roadknown as ‘the PhD’. Fortunately I have learned that, despite the tendency to panic onoccasion, if you stick to it and try to keep your wits about you, that road will lead to again and again to the same point of clarity while winding less and less each time around. In this book I have tried to stay true to my background in International Political Economy while bridging the gap to the field of Business and Strategy; in doing so I have had the advantageof moral, technical, practical and intellectual support from a large number of individuals,some of whom I, despite my best intentions, will undoubtedly fail to mention here. First of all, thanks to my current colleages at the department of Business SocietyManagement, who have contributed to giving me a laid-back work environment amidst thegrey-suit hustle and bustle of a Business School, and who appear to see my Americanbackground not so much as a flaw, but rather as an asset! I am particularly grateful to mypartners in crime Douglas van den Berghe and Arjen Mulder. Douglas ‘broke the ice’ for me my first two years in many ways, and provided a sounding board for ideas and insecurities while we shared a room and carpooled together. Arjen has been a source of inspiration and comic relief over the past few years and, thanks to the fact that our last names differ by only one letter and our rooms by only one number, we are fortunateenough to be regularly mistaken for one another. In this way we keep each other in check.Jeroen van Wijk deserves special mention for discretely and unassumingly offeringguidance and showing an unabated interest in my progress, my person and my future.Thanks also to the countless student assistants who throughout the years have made theSCOPE database possible, painstakingly entering data the old-fashioned way, putting upwith the agonizingly slow learning curve of their daily supervisors (myself among them)and never getting sufficient credit for work done. This applies particularly to David Frans,whose contribution to SCOPE cannot be expressed in hours or in currency. It also appliesto former student assistant and current Amsterdam PhD student in Fabienne Fortanier, who unwittingly and unintentionally continues to ‘raise the bar’ and force me to work and thinkharder.Both within the world of SCOPE and without, I owe a great debt of gratitude to my PhD adviser Rob van Tulder, for his seemingly limitless ability to inspire, to come up withclever solutions, to juggle too many balls, and to give me just enough room – but not toomuch – to do my own thing. Our collaboration over the past few years has been extremelyfluid, largely due to an unusual level of synergy and accord between our intellectual perspectives. My thanks also to my former thesis adviser at the University of Amsterdam,Gerd Junne, who in 1998 brought me into contact with his own erstwhile PhD student, justrecently endowed with a professorship in Rotterdam. Additional mention goes to other academics who have been supportive of my research, such as Danny van den Bulcke and Rob Grosse.A word of appreciation also goes to the ‘boys’ at Fource Consulting, who back in the daytried hard, but not too hard, to dissuade me from pursuing my dreams and introduced me tokey concepts such as ‘the mass marketing test tool’ and ‘the chasm’. The transition from‘the young and the eager’ at Fource to a decidedly different atmosphere at Erasmus was infinitely greater than I anticipated.
i

Last but not least, my thanks to my parents, my sister and my friends for supporting me,encouraging me and expecting nothing less than the best I have to give. That support has also carried over across the Atlantic: established friendships on the ‘American side’ withpeople like Jesse Kerns and Casey Nault, which I know will last a lifetime, have beencomplemented by true friends on this side of the pond like Diederik van Hese and my two‘paranymphs’, Mike van Akkooi and Moor de Leeuw.During my period as a PhD student, however, the focus has shifted somewhat to center onmy own little nuclear family through the birth of my two sons, Carter and Finn. They havemade the challenge of completing my dissertation ‘more or less on time’ all the greater butall the more worth it. Of course I would not even have made it to writing theseacknowledgements had it not been for Sofie, my rock in the stream, who had thewherewithal to egg me on, the love to believe in me and the patience to put up with myinsecurities. Without her I would be a much lesser man.
Alan Muller
Haarlem, March 2004
ii

TABLE OF CONTENTS
ACKNOWLEDGEMENTS ................................................................................................. i
ACRONYMS AND ABBREVIATIONS............................................................................ v
EXECUTIVE SUMMARY ............................................................................................... vii
1. INTRODUCTION.......................................................................................................... 1
1.1 SUMMARY OF THE PROBLEM...................................................................................... 11.2 RESEARCH QUESTIONS............................................................................................... 31.3 RELEVANCE OF THE RESEARCH.................................................................................. 51.4 STRUCTURE AND SCOPE OF THE STUDY...................................................................... 6
PART I: THEORETICAL BUILDING BLOCKS .......................................................... 7
2. INTEGRATION THEORY AND THE ‘NEW REGIONALISM’ ............................ 9
2.1 MAINSTREAM THEORIES OF REGIONAL INTEGRATION ............................................. 112.2 THE ORIGINS OF REGIONALISM ................................................................................ 172.3 MECHANISMS OF REGIONALISM .............................................................................. 252.4 THE OUTCOMES OF REGIONALISM ............................................................................ 302.5 MISSING LINKS ........................................................................................................ 40
3. UNDERSTANDING THE DYNAMICS OF REGIONALISM ............................... 45
3.1 TOWARDS AN INTEGRATIVE, MACRO-MICRO APPROACH.......................................... 453.2 THE MACRO/MICRO DYNAMICS OF REGIONALISM .................................................... 513.3 REGULATION AND ECONOMIC RESTRUCTURING....................................................... 583.4 THE CHOICE OF REGIONALISM STRATEGY ................................................................ 673.5 REGIONALISM AND THE SPATIAL ORGANIZATION OF ACTIVITY................................ 753.6 PRELIMINARY CONCLUSIONS ................................................................................... 82
4. CORE COMPANIES AND REGIONALISM STRATEGY .................................... 85
4.1 MAINSTREAM PERSPECTIVES ON INTERNATIONAL RESTRUCTURING ........................ 854.2 CORE COMPANIES AND BARGAINING RELATIONS ..................................................... 944.3 POSITIONING, ORGANIZATION AND BARGAINING RELATIONS................................. 1034.4 CORE COMPANY STRATEGIES AND REGIONALISM................................................... 1154.5 ANTICIPATING THE DYNAMICS OF REGIONALISM................................................... 123
PART II: EMPIRICAL EXPLORATIONS................................................................. 129
5. REGIONALISM’S ‘SECOND WAVE’ ................................................................... 131
5.1 THE SINGLE EUROPEAN MARKET (SEM) .............................................................. 1325.2 THE NORTH AMERICAN FREE TRADE AGREEMENT (NAFTA)............................... 1415.3 OTHER MANIFESTATIONS OF REGIONALISM ........................................................... 1505.4 UNDERSTANDING REGIONALISM IN A MULTILATERAL SYSTEM .............................. 1555.5 MACRO-LEVEL CONCLUSIONS................................................................................ 163
iii

6. INTERNATIONALIZATION AT ‘T-MINUS’: BASELINE 1990........................ 165
6.1 SAMPLE SELECTION ............................................................................................... 1656.2 DIMENSIONS FOR ANALYSIS................................................................................... 1746.3 QUANTIFYING INTERNATIONAL STRATEGIES.......................................................... 1796.4 NETWORK SPREAD AND ORGANIZATIONAL CHARACTERISTICS .............................. 1916.5 STRATEGIES IN THE EU AND NAFTA.................................................................... 1996.6 CONCLUSIONS........................................................................................................ 205
7. REALIZED REGIONALISM STRATEGIES OVER THE 1990s........................ 207
7.1 REFLECTIONS OF REGIONALISM AS A STRATEGIC ISSUE ......................................... 2077.2 RESTRUCTURING ACROSS THE SAMPLE AS A WHOLE .............................................. 2107.3 EUROPEAN CORE COMPANY STRATEGIES ............................................................... 2277.4 NORTH AMERICAN CORE COMPANY STRATEGIES................................................... 2417.5 CONTRASTING EUROPEAN AND NORTH AMERICAN PATTERNS .............................. 254
8. SYNTHESIS: OPENNESS AND THE MACRO-MICRO LINK.......................... 257
8.1 OPENNESS IN EUROPEAN COMPETITIVE SPACE....................................................... 2578.2 OPENNESS IN NORTH AMERICAN COMPETITIVE SPACE .......................................... 2648.3 CONCLUSIONS ON THE AGGREGATE ....................................................................... 270
9. CONCLUSIONS ........................................................................................................ 273
9.1 MACRO- AND MICRO- DIMENSIONS OF INTERNATIONAL RESTRUCTURING ............. 2739.2 A GLOBALIZING OR REGIONALIZING WORLD? ........................................................ 2779.3 THE POLITICAL ECONOMY OF REGIONALISM .......................................................... 2819.4 POLICY RECOMMENDATIONS ................................................................................. 2849.5 LIMITATIONS AND DIRECTIONS FOR FUTURE RESEARCH......................................... 286
APPENDICES.................................................................................................................. 289
APPENDIX I: THE SCOPE CORE200 ............................................................................ 289APPENDIX II: SALES, ASSET AND SUBSIDIARY REPORTING IN THE SCOPE DATABASE 291APPENDIX III: METHODS FOR MANIPULATING THE KEY VARIABLES ............................ 295
REFERENCES ................................................................................................................ 301
SAMENVATTING (IN DUTCH)................................................................................... 319
BIOGRAPHY................................................................................................................... 325
iv
ACRONYMS AND ABBREVIATIONS
AGE Applied General EquilibriumASEAN Association of Southeast Asian NationsCAP Common Agricultural PolicyCET Common External Tariff CGE Computable General EquilibriumCM Common MarketCU Customs UnionDSPs Dispute Settlement ProceduresDUPs Directly Unproductive Activities DVI Degree of Vertical IntegrationEC European CommissionEMU Economic and Monetary UnionEPU Economic and Political Union ERT European Round Table of IndustrialistsEU European UnionFDI Foreign Direct InvestmentFTA Free Trade Area FTAA Free Trade Area of the AmericasGATT General Agreement on Tariffs and Trade HST Hegemonic Stability TheoryIMF International Monetary Fund ISI Import Substitution Industrialization Mercosur Mercado Común del Sur MFN Most Favored NationNAFTA North American Free Trade AgreementNEG New Economic GeographyNTBs Non-Tariff BarriersOCA Optimal Currency Area PCU Partial Customs UnionPLC Product Life CyclePTA Preferential Trade AgreementRIA Regional Integration AgreementRTA Regional Trade AgreementSADC Southern African Development CommunitySEA Single European ActSEM Single European Market STT Strategic Trade Theory TCA Transaction Cost Analysis TNC Transnational CorporationTRIMs Trade-Related Investment MeasuresTRIPs Trade-Related Intellectual Property RightsVERs Voluntary Export RestrictionsWTO World Trade Organization
v

EXECUTIVE SUMMARY
Globalization, associated with economic liberalization and a commitment to free trade andinvestment, is one of the buzzwords of the 1990s. It is often associated with largemultinational enterprises, which are assumed to become increasingly ‘footloose’ in their‘global’ scope. This poses challenges for national policymakers, who have embarked on numerous large-scale supranational policy ventures in an attempt to channel the flow ofeconomic activity. One of the more prominent forms of supra-national policymaking has been the tendency towards regional integration.The resulting proliferation of regional integration agreements (RIAs) worldwide has drawn renewed attention to the phenomenon of regionalism as an object of research andtheoretical analysis. The current ‘second wave’ of regional integration differs from earlier,import-substitution based strategies in numerous ways, adding multiple layers ofcomplexity to the phenomenon. RIAs and their implications for welfare, economic activityand world trade are analyzed and interpreted in various ways, sometimes positive,sometimes negative, and sometimes as ‘old news’. Are RIAs sustainable, or do they onlylead to short term and unequally distributed gains? Are they a necessary step towardsglobalization, or an inevitable second-best option in a realist world? The confusion is notsurprising given the lack of a comprehensive understanding of the problem.Regional integration can be seen as a process of international restructuring, by which new institutions are built, driven and shaped by numerous stakeholders. Of these, firms andgovernments are arguably the most important. This observation, however, makes clear thatthe assessment of international restructuring processes like regional integration poses a level-of-analysis problem. National governments operate from a macro-level perspective,while firm strategy is formulated and executed largely from a micro-perspective (firm-specific stakeholders) and meso-perspective (competitors). As a result, strategic interestsdiffer between perspectives, and at the same time they criss-cross and overlap across geographic space. Ultimately, governments and firms do not share the same strategic intent, nor do they perceive the same strategic reality.As actors in a dynamic process, however, both firms and governments must have perceptions of each other’s intent and reality. This may lead to misconceptions of the drivers of the strategic behavior which occurs in response to the formation of new institutions. The assumptions of strategic behavior are key because they largely determinethe (expected) outcome of restructuring, particularly in terms of the spatial organization of economic activity and the rents which flow from this activity. Additionally, the dynamicand strategic aspects of international restructuring are related to the balance of poweramong the main actors. The role of ‘core companies’, a relatively select group of largefirms which occupy ‘core’ positions in the economy and more often than not operate withone foot in the political process, is crucial to the dynamic. International restructuring isultimately a small numbers game, with characteristics of oligopolistic competition at both the macro and the micro levels.Traditional approaches to regional integration demonstrate shortcomings from this point of view, in descriptive, prescriptive and predictive analysis. Firstly, integration is oftenviewed in an overly simplistic fashion. In many cases RIAs are even exogenous to theanalysis, or seen as a fully rational decision based solely on arguments of economicwelfare. Regional integration, however, can be seen in the context of the dynamic interplayand competition among regional blocs (or other concentrations of economic power) as a
vii
Executive Summary
desirable strategic outcome in its own right (‘regionalism’). Secondly, firms are rarely if atall considered explicitly in the analysis, neither as actors in the integration process itself,nor as individual players in a restructuring game with potentially ‘sub-optimal’ strategicinterests. A comprehensive framework of regional integration must emphasize the role ofboth firms and governments as strategic actors in international restructuring, offer insightinto the ‘strategic repertoires’ of both actors and analyze the outcomes of RIAs from this perspective.A number of pilot studies notwithstanding, empirical research and analysis relatingregional economic integration to internationalization strategies at the firm level has thus far been scarce. Theoretical work on multinational activity focuses almost exclusively onfirm-specific determinants, neglecting environmental (locational) issues. Empirical workon multinational activity tends to focus on macro-level proxies of MNE activity, primarilyfocused on foreign direct investment (FDI). Others concentrate on a particular aspect of internationalization, such as R&D, subsidiary ownership patterns, networks or on a geographic area. Studies which do claim to take a firm-level view often do not in factprogress past the level of FDI, which is only a proxy for firm activity but does not take thefirm as the unit of analysis. Such analysis does not, for instance, identify who is internationalizing, nor why they do so.Others emphasize the macro-micro link but do not analyze RIAs as such, making onlytheoretical predictions of FDI in relation to existing RIAs. These studies may evenemphasize the relevance of firm-level motivators (e.g. locational advantages and competitive position), but do not explore the possibilities of a broader framework with a set number of concrete variables, nor test their predictions empirically. At the singleregion, single-sector level, more in-depth work has been done on the automotive industryand Mercosur; on NAFTA), but this is rarely placed within a wider framework. The current study can be positioned in the context of a new research agenda which seeks to pay more attention to the spatial aspects of value-added activity within the context of companystrategies.The leading research question of the study focuses on Regional Integration as the outcomeof strategic behavior on the part of firms and governments. It addresses in particular theirmutual (mis)conceptions of the drivers and circumstances that shape each other’s behavior, and thus how the resulting realized outcomes can differ from intended outcomes:
To what extent do firms organize their economic activity spatially in response to regional
integration in ways that policymakers expect, and what does this say about the nature,
significance and viability of regional integration as a vehicle of international restructuring?
This question is addressed by analyzing the policy motives behind various RIAs, of whichthe Single European Market (SEM) and North American Free Trade Agreement (NAFTA) are the most prominent. These motives are broken down into their intended impact on theorganization of production, and to what extent the RIA is designed to be inwardly and outwardly ‘open’. Openness refers to the effect integration has on shifting production 1) within the region by ‘insider’ firms (inside-in); 2) to the region by ‘outsider’ firms(outside-in); 3) outside the region by insider firms (inside-out), and finally 4) productionshifts by outsider firms among third-party countries (outside-out).
viii
Executive Summary
The policy-designed ‘openness’ is first evaluated using trade and investment data to check whether the macro-level perceptions and expectations by national (and regional)policymakers played out in the regional economy. Trade data show that the SEM isrelatively inward in orientation, with member countries trading far more amongstthemselves than with the rest of the world. NAFTA countries, which have traditionally traded more with the rest of the world than with each other, are since 1997 also inward-oriented, trading more with each other. This stands in stark contrast with other regions such as the Mercado Común del Sur (Mercosur), Association of South East Asian Nations(ASEAN) and the Southern African Development Community (SADC), which are alloverwhelmingly outward-oriented, and in general increasingly so.Meanwhile, investment data reveal that European countries invest nearly as much in each other as they do in all other countries of the world combined. The countries of the NAFTA region, in contrast, are increasingly externally oriented as investors. The interpretation of increased inside-out openness must be made with caution, however, since the USdominates regional investment and Canada and Mexico remain very small investmenttargets compared to the rest of the (extra-regional) world. Additionally, in relation to theirrespective GDPs, inward investment stock from the US in Canada and Mexico has climbeddramatically over the second half of the 1990s. At the macro level of analysis, decomposing trends to the level of individual firms is oftenlargely hypothetical. This study has tried to fill this gap by analyzing the realizedinternationalization strategties and restructuring behavior of 122 of the world’s largestcompanies from Europe and North America. Taking their spatial organization ofproduction in 1990 as a baseline, the study analyzes ‘strategy migrations’ both pre- and post-1995 to understand the dynamics of the second wave of regionalism. These ‘core companies’ are in the best position to know what the stakes of integration are and theirinternationalization strategies have a flagship function towards other economic actors.Moreover, regional integration in Europe and North America was largely facilitatedthrough the lobby activity of many of these firms, both behind closed political doors as well as in the public media.The research shows that regionalism has eclipsed the multilateral system as the ‘fast track’for international economic restructuring. For Western core companies, regionalism has become the institutional framework of choice within which the struggle for preservation oftheir core positions is played out. This study differentiates between the different strategiesfirms can pursue within a range of ‘orientations’: domestic, regional (the home region), bi-regional (in practice the home region plus Europe for North American companies and vice-versa), and global (significant production in three or more regions). The data show that, incontrast to the ‘ideology’ of globalization, core company strategies and their strategic migrations over the 1990s have primarily taken place in the home region. Regionally oriented firms, for instance, which formed the largest orientational cluster in both regionsin 1990, remained the largest group in 2001. The wave of mergers and acquisitions(M&As) in the second half of the 1990s also involved in particular regional corecompanies, which were relatively speaking three times as likely to be acquired by othercore companies than firms with a different geographic orientation.There has been considerable migration between orientational clusters and the average degree of internationalization (overall as well as extra-regional) rose significantly over thedecade. Many of the firms which in 1990 were primarily domestic internationalized within their home region (although many US companies remained, or even became, domestic
ix
Executive Summary
over the decade), while regionally-oriented firms generally strengthened their regional positions. Other regional players, particularly in Europe, used integration at home to makethe jump to establishing extra-regional positions in an attempt to establish footholds in‘non-captive’ competitive spaces. The relatively small number of ‘global’ firms (only nine of the 122 core companies in the study) managed to maintain their global position but at the same time the group did not grow in size over the decade.The internationalization trend was also to some extent contradicted by a considerable degree of de-internationalization. North American companies which were in the bestposition to exploit the opportunities of integration, such as US carmakers, retreated to a limited extent to their home region after 1995. Moreover, many bi-regional firms (bothEuropean and North American) struggled with the simultaneous gravitational pull of integration in both regions and either reduced their exposure in the second region or divested activities outside the two regions in order to concentrate on the bi-regional core.In this way a ‘chasm’ has emerged between regionally- and globally-oriented strategies.But even global firms that remained ‘global’ experienced de-internationalizion over thedecade. Perhaps most crucially, the role of Europe in North American core companystrategies and North America in European core company strategies declined in most cases relatively and in some cases absolutely as growth was sought within the home region and /or outside the second region.The outcome is one of growing polarization between North American and European corecompanies, and consequently within an increasingly dyadic world economy. Regionalismseems thus to correspond better with the strategic intent of core companies than with thatof governments. The tendency towards further regional expansion and consolidation (new EU members in Central and Eastern Europe; piecemeal extension of the NAFTA to the rest of the Americas) has therefore received strong support from core companies eager to extend their production networks. The Europe-wide cap on labor migration from the new members, however, is also a strong indication that in the upcoming ‘Third Wave’ of integration, policy-level strategic intent and core company strategic intent may continue todiverge.
x
1. INTRODUCTION
The recent proliferation of regional integration initiatives worldwide has drawn renewedattention to the phenomenon of regionalism as an object of research and theoreticalanalysis. Nearly all of the WTO’s 144 members have concluded some form of RegionalIntegration Agreement (RIA) with other countries. In the period from 1948-1994, GATTcontracting parties notified 108 RIAs relating to trade in goods, of which 38 in the fiveyears ending in 1994. From the WTO’s creation in 1995 through 1999, 67 additional RIAs were notified. The current ‘second wave’ of regional integration (Dent, 1997; De Melo et
al., 1993; Bhagwati, 1993; Laird, 1997) differs from earlier, import-substitution based strategies in numerous ways, adding multiple layers of complexity to the phenomenon.RIAs and their implications for welfare, economic activity and world trade are analyzedand interpreted in various ways, sometimes positive, sometimes negative, and sometimes‘old news’. Are RIAs a viable form of restructuring, or do they only lead to short term and unequally distributed gains? Are they a necessary step towards globalization, or aninevitable second-best option in a realist world? The confusion is not surprising given thelack of a comprehensive understanding of the problem.
1.1 Summary of the problem
One of the most pressing problems in economics, business and politics is where economicactivity will locate in the future (Jovanovic, 2000). Globalization is one of the buzzwords of the 1990s, by which firms are assumed to become increasingly ‘footloose’ (Ohmae,1990). Facilitated by developments in ICT and other technologies, firms are capitalizing on these opportunities to become global companies. This poses challenges for policymakers,who have embarked on numerous large-scale supranational policy ventures in an attemptto channel the flow of economic activity. One of the more prominent policy ventures of this sort has been the tendency towards regional integration.Although science is largely preoccupied with the recent trend towards integration, it is byno means a new phenomenon. Integration goes in fact back to the time of the US colonies,(McGilvray, 1999), which were in effect sovereign policy spaces that chose to integrate their economic activity. In the 19th century numerous Bünde were formed among Germanstates in unions that preceded the German nation-state, such as the Zollverein, the North German Tax Union and the Bavaria-Württemberg Customs Union (Mattli, 1999b). The phenomenon of integration is currently more pervasive and far-reaching than preceding generations of integration. Currently almost every country in the world is a member of a larger economic agreement between a number of countries and the bulk of the world’seconomic activity falls under the scope of one RIA or another.Regional integration can be seen as a process of international restructuring, by which new institutions are built, driven and shaped by numerous stakeholders. Of these, firms andgovernments are the most important. This observation, however, makes clear thatinternational restructuring processes like regional integration form a level of analysisproblem. Governments operate from a macro-level perspective, while firm strategy isformulated and executed largely from a micro-perspective (firm-specific stakeholders) and meso-perspective (the competition). As a result, interests differ across levels of analysis,while at the same time these levels do not form a continuum in the real world. Rather, they
1
Chapter One
criss-cross and overlap, particularly across geographic space. Ultimately, government and firms do not share the same strategic intent, nor do they perceive the same strategic reality.As actors in a dynamic process, however, both firms and governments must have perceptions of the intent and reality of the other. This may lead to misconceptions of thedrivers of the strategic behavior which occurs in response to the formation of new institutions, and in turn lays the groundwork for new institutional development. The assumptions of strategic behavior are key because they largely determine the (expected) outcome of restructuring, particularly in terms of the spatial organization of economicactivity and the rents which flow from this activity. Additionally, the dynamic and strategicaspects of international restructuring are related to the balance of power among the mainactors. International restructuring is ultimately a small numbers game, with characteristicsof oligopolistic competition at both the macro and the micro levels.Traditional approaches to regional integration demonstrate shortcomings from this point of view, in descriptive, prescriptive and predictive analysis. Firstly, integration is oftenviewed in an overly simplistic fashion. In many cases RIAs are exogenous to the analysis,or seen as a fully rational decision based solely on arguments of economic welfare.Regional integration, however, can be seen in the context of competition among regionalblocs (or other concentrations of economic power) as a desirable strategic outcome in itsown right (‘regionalism’). Secondly, firms are rarely if at all considered explicitly in the analysis, neither as actors in the integration process itself, nor as individual players in arestructuring game with potentially ‘sub-optimal’ interests. A comprehensive frameworkof Regional integration must emphasize the role of firms and governments as strategicactors in international restructuring, offer insight into the ‘strategic repertoires’ of bothactors and analyze regionalism outcomes from this perspective.A number of pilot studies notwithstanding, empirical research and analysis relatingregional economic integration to internationalization strategies at the firm level has thus far been scarce.1 Theoretical work on multinational activity focuses almost exclusively onfirm-specific determinants, neglecting environmental (locational) issues (Dunning, 1998).Empirical work on multinational activity tends to focus on macro-level proxies of MNEactivity, primarily focused on FDI (Lipsey, 1999; Hagedoorn and Narula, 1996; Molle andMorsink, 1991). Others concentrate on a particular aspect of internationalization, such asR&D (Dunning and Narula, 1997); subsidiary ownership patterns (Ietto-Gillies, 1998), networks (Morsink, 1997) or on a geographic area (the Nordic school – Johansson andVahlne, 1977) Several studies (e.g. Buckley et al., 1999) claim a firm-level analysiswithout progressing beyond the level of FDI, which is only a proxy for firm activity butdoes not take the firm as the unit of analysis.2 Others, such as Ramstetter’s (1996) analysisof Japanese firms, do emphasize the macro-micro link but do not analyze RIAs as such. Blomström and Kokko (1997) and Gestrin and Rugman (1994) make theoreticalpredictions of FDI in relation to existing RIAs (CUSFTA, Mercosur and NAFTA), and even emphasize the relevance of firm-level motivators (e.g. locational advantages and competitive position), but do not explore the possibilities of a broader framework with a set number of concrete variables, nor test their predictions empirically. At the singleregion, single-sector level, more in-depth work has been done (e.g. Neto, 1998, on the
1 Some of the more notable exceptions are Robson 1993 at the theoretical level and Dunning 1997 at the empiricallevel.2 Such analysis does not, for instance, identify who is internationalizing, nor does it say anything about the specific motivation of the actor in question.
2
Introduction
automotive industry and Mercosur; on NAFTA), but this is rarely placed within a wider framework. The current study can be positioned in the context of a new research agenda which seeks to pay more attention to the spatial aspects of value-added activity within thecontext of company strategies.
1.2 Research questions
The leading research question of the study focuses on regional integration as the outcomeof strategic behavior on the part of firms and governments. It addresses in particular theirmutual (mis)conceptions of the drivers and circumstances that shape each other’s behavior, and thus how the resulting realized outcomes can differ from intended outcomes:
To what extent do firms organize their economic activity spatially in response to regionalintegration in ways that policymakers expect, and what does this say about the nature,
significance and viability of regional integration as a vehicle of international restructuring?
This question comprises a number of subquestions:
1. How is regional integration addressed in the traditional literature?
The first step is to study the dominant body of literature on regional integration for what it reveals about the current understanding of the problem. What inherent assumptions are made, what frameworks are used, and what empirical results have been generated thus far?How convincing are they? Based on the analysis a number of criticisms, shortcomings and missing links are identified.
2. What is the nature and the outcome of dynamic firm-government interaction inregional integration as a process of international restructuring?
Based on the results of question 1, a strategic actor-based approach to the problem isdeveloped. Assessing and understanding regional integration processes and outcomesinvolves a clear level-of-analysis problem. Regional integration is considered here as aprocess with an outcome determined by strategic behavior at both the macro and the microlevel. Firm and policymaker strategic behavior has characteristics of oligopolisticcompetition in which particularly a small number of ‘core’ companies and policymakingentities struggle for dominant positioning relative to their competitors and to each other. Additionally, that behavior, and inevitably its outcome, is characterized by the mutual(mis)conceptions that exist at each level and which may lead to unexpected outcomes.Since the macro- and micro-domains of strategic behavior are interwoven through time and geographic space, outcomes are best measured in terms of dynamic shifts in the spatial organization of economic activity.
3. How can regional integration in its various forms be seen as a ‘strategic repertoire’ of policy behavior of national governments, i.e. as a typology of geopolitical ambitions?
This question addresses the motivations and drivers behind regional integration from apolicy perspective (strategic intent) and the context in which regional integration is
3
Chapter One
adopted and implemented as a policy strategy (strategic reality). What factors and variablesare relevant in this strategy? And what assumptions are made at the policy level (asreflected in theoretical and practical macro-models) concerning firm strategic behaviorwith respect to the chosen form of regional integration? These factors will be integratedinto a ‘strategic repertoire’ of regional integration at the policy level.
4. What is the significance of regional integration for the spatial configuration andorganizational structures of core companies?
Regional integration is generally seen as an exogenous shock instead of an outcome of firm strategic behavior. Therefore to address the same policy-level issues raised in question3 at the micro level requires more in-depth analysis of relevant micro theories to distillcomponents of firm-level strategy (proactive and reactive) that relate to regional integration as an outcome of institutional restructuring. To what extent is regionalintegration a strategic variable in micro theories? What assumptions as to the nature offirm drivers and motivation (strategic intent) do these theories contain, and which are relevant for an actor-based view of firm strategic behavior under regional integration?What, if anything, is missing? These factors will be integrated into a ‘strategic repertoire’of regional integration at the firm level.
5. How can macro- and micro-strategic repertoires be compared and contrasted in a morecomprehensive framework?
This question implies a confrontation between the macro and micro perspectives, therebyexplicitly addressing the level of analysis problem. Which firm-strategic repertoire(s) is/arerelevant for which RIA strategies? Do they rest on similar assumptions and mutualperceptions of strategic behavior? Can a typology be developed of ‘macro/microregionalism strategies’, or are the differences in perception and expectation due to the levelof analysis gap so great that the two levels are incompatible?
6. What strategic motives, and inherent assumptions of firm behavior, are evidenced inpolicy documents of the Single European Market (SEM) and North American Free Trade Agreement (NAFTA) as two prime examples of RIAs?
This and the following questions are empirical in nature. Examining the strategic intent of policymakers with respect to regional integration involves the selection of one or moreRIAs for closer examination. Analyzing the world’s leading core companies in terms of their home country affiliation and the most important RIAs governing the bulk of their activity leads directly to the SEM and NAFTA as the two most important RIAs for corecompanies in general. The SEM and NAFTA will be examined from a policymakerperspective to identify their positioning in the policy-strategic repertoire developed above, as well as the implicit or explicit assumptions of firm strategic behavior which theyembody.
7. What realized restructuring behavior do core companies exhibit in their spatialconfiguration of activity and organizational structure under the SEM and NAFTA, respectively?
4
Introduction
Question 7 addresses the outcomes of RIA strategies from the firm perspective (micro-reality) to determine whether firm strategic behavior reflects the strategic intent at theoutset (as well as policymakers’ expectations), and what the ‘empirical results’ have been.
8. Conclusions
Do these realities, and the realized strategic behavior of governments and core companies,collide over time? What does this mean for the future prospects of regionalism as a form ofinternational restructuring? Can differences be traced to mutual misconceptions of macroand micro strategic intent? Or do firms, and/or policymakers, not do what they say? AreRIAs sustainable, or do they only lead to short term and unequally distributed gains? Arethey a necessary step towards globalization, or an inevitable second-best option in a realistworld?
1.3 Relevance of the research
In the wake of the ‘Battles’ of Seattle and Genoa, the stalemate in WTO-negotiations at Cancún and the tepid response of many Latin American countries to the Free Trade Area of the Americas (FTAA), international free trade agreements are increasingly a focus of social scrutiny. As the multilateral system grinds to a halt, the stakes of regionalism as analternate route for international restructuring are automatically raised. The deepening of integration in Europe, currently at the stage of monetary integration but with a commonEuropean constitution in the offing, creates additional pressure on members and non-members to toe the line of free trade. Britain’s decision to remain outside Europe’smonetary union, for instance, has made it subject to fierce lobby pressure from largecompanies such as Rover. As the debate on the costs and benefits (and winners and losers)of large-scale international restructuring heats up, scepticism is fueled by apparent doublestandards on the issue of free trade. In most cases this involves trade conflicts betweenmembers of the world’s two major RIAs, the European Single Market and North AmericanFree Trade Agreement. The case of US tariffs on steel and Europe’s refusals to allowimports of cheap Latin American bananas are two of the more notorious examples bywhich the reality of free trade does not live up to the rhetoric.
1.3.1 Scientific relevance
The literature on regional integration is rather unclear on the impact of firm strategies onregional integration and vice versa. Theoretical frameworks are largely missing, and empirical research has thus far been relatively fragmented. Furthermore, the literature oftenfocuses on one particular region, makes hardly any difference between the national originsof firms, and very often does not surpass the level of individual case or sector studies.There is a big gap between micro studies of firm strategies and macro studies of regionalintegration. Often macro studies are based on highly stylized (or even unrealistic) premisesof firm behavior (see the Cecchini Report on the impact of the SEM). Once we can establish the link between realized firm strategies and regional integration (both as anobjective of lobbying strategies, as well as a contingent factor of firm strategy), morerealistic policies can be designed and implemented in the area of regional integration. The assessment of the feasibility of various regional integration initiatives from the firm'sperspective should make it possible to come to better predictions on the next step after
5
Chapter One
regional integration: further globalization or a world economy of relatively detached and closed regional economies. The role of transnational corporations as ‘lynchpin’ betweenthese regions - supporting or frustrating the political aims - is of particular interest.
1.3.2 Managerial relevance
The research will improve the sophistication of International Management decision-making. It can be established for instance whether firms from different sectors have adifferent stake in regional integration, and what preexisting strategy means for post-integration strategies. Perspectives generated on the ‘durability’ of given strategies in aregional context will also provide substance for discussions on long-term strategy development.The assessment of the dynamism of regionalism should enable managers to better handlethe growing international institutional uncertainty that results from the different forms andtrajectories of regionalism. What should managers anticipate as an exogenous function and what can they influence either directly (lobbying) or indirectly (through the choice of a particular strategic repertoire)? In addition, as regional integration deals with a renewed arrangement regarding the tradeoff between public and private goods, managers should be supported in a more rational assessment of the most appropriate form of regionalintegration.
1.3.3 Societal relevance
The claim of welfare maximization through regional economic and political integration will be further analyzed by looking at the impact of regional integration on firm strategies and to what extent these strategies have a positive effect on welfare through the creation of more or less sustainable and viable regions. Governments will gain insight in theeffectiveness of their policy measures and the public will gain insight into the transparencyof policymaking and its relationship to the strategic reality of companies. Insight will begained on the relevance of home versus host firms in a regionalizing economy and theimpact of regionalization on the multilateral trade and investment regime will be assessed.
1.4 Structure and scope of the study
The chapters largely follow the questions as formulated in section 1.2. The overarchingstructure of the study is based on a split between the theoretical and empirical componentsof the research project. Part I explores the problem from the relevant theoretical perspectives and in Part II the analysis is taken to the empirical level.The study is explorative and descriptive in character. No model is developed, nohypotheses are tested, nor is a grand theory of regional integration formulated. Due to thenature of the problem as described in this introduction, a better understanding of the issuesat hand is required to create a foundation for more fundamental research in the future. Thecurrent approach serves this purpose well by providing building blocks at the conceptual aswell as methodological level, integrating various theoretical perspectives to create a betterunderstanding and introducing new quantitative data and measurement tools with which to analyze the phenomenon of regionalism.
6
PART I:
THEORETICAL BUILDING BLOCKS
Many authors heralded the 1990s as the era of ‘globalization’, pointing to the ever-increasing scale of international commerce, information and capital flows and thedecreasing significance of national borders in general (cf. Ohmae 1990, Porter 1990), embodied at the institutional level by the World Trade Organization’s (WTO) multilateraltrade regime. More recently, however, the globalization thesis has been countered by the paradigm of ‘regionalism’, according to which economic activity is conducted within economic blocs. From this perspective, macro-regions such as the EU or NAFTA are thedominant institutional framework within which economic and even political processes are structured and coordinated (Gilpin, 2001; Ethier, 1998; Dent, 1997; Bhagwati, 1993).A multitude of schools of thought touch on the problem of regionalism and contribute to our understanding in many ways. However, their explanations, descriptions and prescriptions can be extremely diverse and incompatible. Moreover, the implicit or explicittheoretical understanding of the role of firms in the process and outcomes tends to beoversimplified. From the firm side, theory deals exhaustively with the drivers of firmbehavior, ranging from cost issues to strategic, non-market factors yet has not given theregionalism phenomenon the attention it deserves. The first part of this study reviews theexisting theoretical approaches at the macro and the micro levels, and develops a framework of understanding around which the relevant theoretical building blocks can be organized.Chapter 2 has a dual function: 1) to review traditional theoretical approaches to regionalintegration and their empirical results in order to 2) identify the missing links of theanalyses. Chapter 3 begins by proposing elements for an alternative framework by whichto gain a more adequate understanding of the problem. The framework proposed introduces an actor-based approach to identify and integrate the motivations and strategicbehavior of the key actors in regional integration processes. On the basis of this frameworkthe real dynamism of integration can be explored and projections made for an assessmentof the outcomes of regional integration. Subsequently regionalism as a strategy at thepolicy level is explored, dissecting the drivers, interests and behavior of governments withregard to regional integration. Pertinent theories will also be examined to gain anunderstanding of implicit and explicit macro-level perspectives on firm behavior, or policymakers’ vision of micro-level strategic intent and strategic reality. Chapter 4 takes a firm-level perspective, addressing the relevance of regional integration for the strategicbehavior of individual firms. Implicit and explicit drivers and strategic behavior will bedistilled from various theories, and assumptions will be generated on the impact ofregional integration on these drivers and behavior. Part I ends by reviewing the research questions in light of the theoretical constructs developed.
7

2. INTEGRATION THEORY AND THE ‘NEW REGIONALISM’
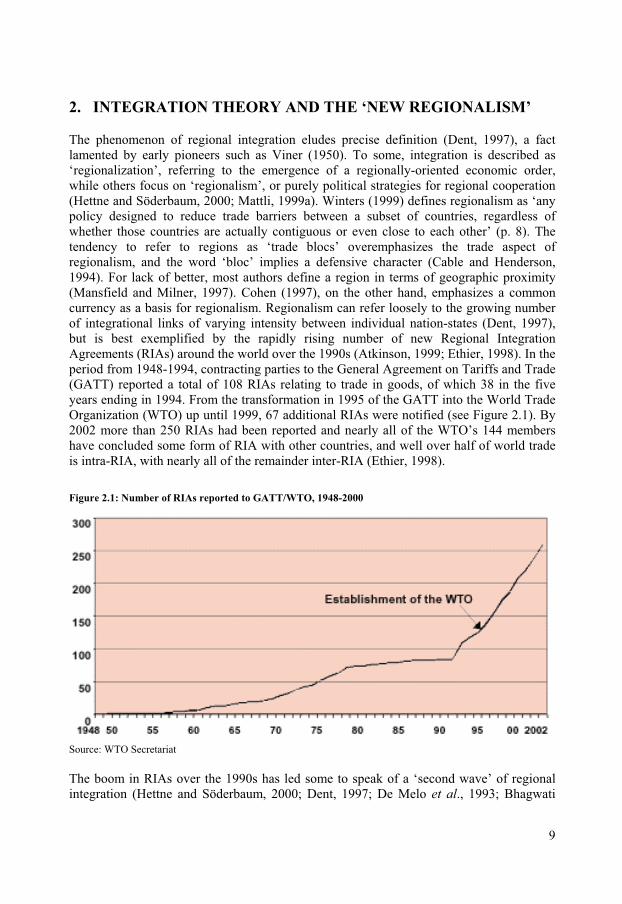
The phenomenon of regional integration eludes precise definition (Dent, 1997), a fact lamented by early pioneers such as Viner (1950). To some, integration is described as‘regionalization’, referring to the emergence of a regionally-oriented economic order, while others focus on ‘regionalism’, or purely political strategies for regional cooperation (Hettne and Söderbaum, 2000; Mattli, 1999a). Winters (1999) defines regionalism as ‘any policy designed to reduce trade barriers between a subset of countries, regardless of whether those countries are actually contiguous or even close to each other’ (p. 8). Thetendency to refer to regions as ‘trade blocs’ overemphasizes the trade aspect of regionalism, and the word ‘bloc’ implies a defensive character (Cable and Henderson, 1994). For lack of better, most authors define a region in terms of geographic proximity(Mansfield and Milner, 1997). Cohen (1997), on the other hand, emphasizes a commoncurrency as a basis for regionalism. Regionalism can refer loosely to the growing numberof integrational links of varying intensity between individual nation-states (Dent, 1997), but is best exemplified by the rapidly rising number of new Regional IntegrationAgreements (RIAs) around the world over the 1990s (Atkinson, 1999; Ethier, 1998). In theperiod from 1948-1994, contracting parties to the General Agreement on Tariffs and Trade (GATT) reported a total of 108 RIAs relating to trade in goods, of which 38 in the fiveyears ending in 1994. From the transformation in 1995 of the GATT into the World Trade Organization (WTO) up until 1999, 67 additional RIAs were notified (see Figure 2.1). By2002 more than 250 RIAs had been reported and nearly all of the WTO’s 144 membershave concluded some form of RIA with other countries, and well over half of world tradeis intra-RIA, with nearly all of the remainder inter-RIA (Ethier, 1998).
Figure 2.1: Number of RIAs reported to GATT/WTO, 1948-2000
Source: WTO Secretariat
The boom in RIAs over the 1990s has led some to speak of a ‘second wave’ of regionalintegration (Hettne and Söderbaum, 2000; Dent, 1997; De Melo et al., 1993; Bhagwati
9
Chapter Two
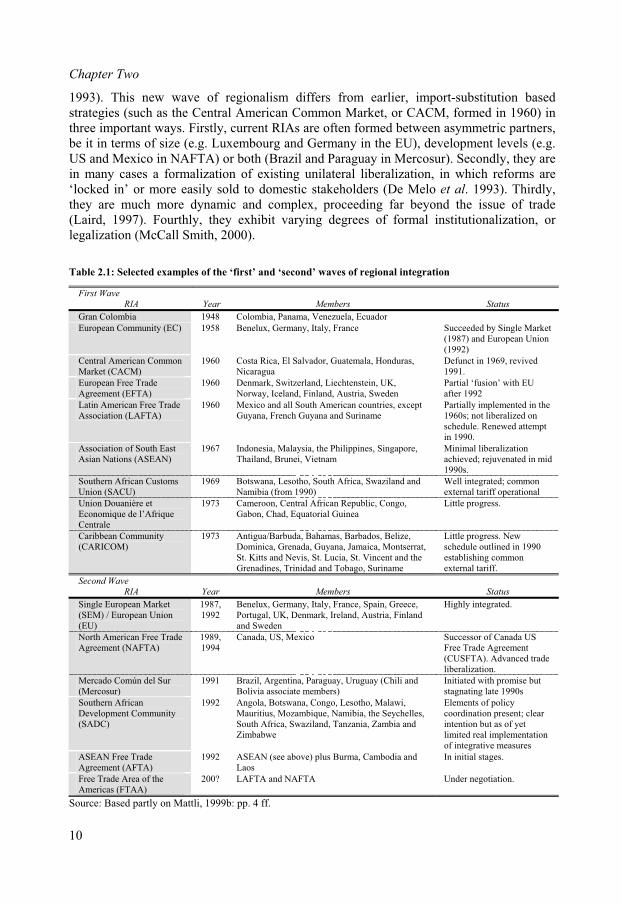
1993). This new wave of regionalism differs from earlier, import-substitution based strategies (such as the Central American Common Market, or CACM, formed in 1960) inthree important ways. Firstly, current RIAs are often formed between asymmetric partners,be it in terms of size (e.g. Luxembourg and Germany in the EU), development levels (e.g. US and Mexico in NAFTA) or both (Brazil and Paraguay in Mercosur). Secondly, they are in many cases a formalization of existing unilateral liberalization, in which reforms are‘locked in’ or more easily sold to domestic stakeholders (De Melo et al. 1993). Thirdly,they are much more dynamic and complex, proceeding far beyond the issue of trade(Laird, 1997). Fourthly, they exhibit varying degrees of formal institutionalization, or legalization (McCall Smith, 2000).
Table 2.1: Selected examples of the ‘first’ and ‘second’ waves of regional integration
First Wave
RIA Year Members Status
Gran Colombia 1948 Colombia, Panama, Venezuela, Ecuador
European Community (EC) 1958 Benelux, Germany, Italy, France Succeeded by Single Market (1987) and European Union(1992)
Central American CommonMarket (CACM)
1960 Costa Rica, El Salvador, Guatemala, Honduras,Nicaragua
Defunct in 1969, revived 1991.
European Free Trade Agreement (EFTA)
1960 Denmark, Switzerland, Liechtenstein, UK,Norway, Iceland, Finland, Austria, Sweden
Partial ‘fusion’ with EUafter 1992
Latin American Free Trade Association (LAFTA)
1960 Mexico and all South American countries, except Guyana, French Guyana and Suriname
Partially implemented in the 1960s; not liberalized on schedule. Renewed attemptin 1990.
Association of South EastAsian Nations (ASEAN)
1967 Indonesia, Malaysia, the Philippines, Singapore,Thailand, Brunei, Vietnam
Minimal liberalization achieved; rejuvenated in mid1990s.
Southern African CustomsUnion (SACU)
1969 Botswana, Lesotho, South Africa, Swaziland and Namibia (from 1990)
Well integrated; commonexternal tariff operational
Union Douanière et Economique de l’AfriqueCentrale
1973 Cameroon, Central African Republic, Congo,Gabon, Chad, Equatorial Guinea
Little progress.
Caribbean Community(CARICOM)
1973 Antigua/Barbuda, Bahamas, Barbados, Belize,Dominica, Grenada, Guyana, Jamaica, Montserrat,St. Kitts and Nevis, St. Lucia, St. Vincent and the Grenadines, Trinidad and Tobago, Suriname
Little progress. Newschedule outlined in 1990 establishing commonexternal tariff.
Second Wave
RIA Year Members Status
Single European Market (SEM) / European Union (EU)
1987,1992
Benelux, Germany, Italy, France, Spain, Greece, Portugal, UK, Denmark, Ireland, Austria, Finland and Sweden
Highly integrated.
North American Free Trade Agreement (NAFTA)
1989,1994
Canada, US, Mexico Successor of Canada USFree Trade Agreement(CUSFTA). Advanced trade liberalization.
Mercado Común del Sur (Mercosur)
1991 Brazil, Argentina, Paraguay, Uruguay (Chili and Bolivia associate members)
Initiated with promise but stagnating late 1990s
Southern AfricanDevelopment Community(SADC)
1992 Angola, Botswana, Congo, Lesotho, Malawi,Mauritius, Mozambique, Namibia, the Seychelles,South Africa, Swaziland, Tanzania, Zambia and Zimbabwe
Elements of policycoordination present; clear intention but as of yetlimited real implementationof integrative measures
ASEAN Free Trade Agreement (AFTA)
1992 ASEAN (see above) plus Burma, Cambodia and Laos
In initial stages.
Free Trade Area of the Americas (FTAA)
200? LAFTA and NAFTA Under negotiation.
Source: Based partly on Mattli, 1999b: pp. 4 ff.
10
Integration theory and the ‘new regionalism’
In the broad sense, governments have been cooperating in regional settings in the form of e.g. unions, leagues and commonwealths for hundreds of years, including e.g. the US colonies (McGilvray, 1999) and the German Zollverein (Customs Union) in 1816 (Mattli, 1999a). More recent efforts at regional integration dated from the 1960s, when manydeveloping nations tried to profit from comparative advantages and larger markets whileprotecting their markets from global trade via import-substitution industrialization (ISI). This semi-autarkic form of ‘free trade’ was based primarily on tariff reductions limited to a small number of products, high rates of protection against third countries, and offered little scope for efficiency gains through the exploitation of scale economies (Laird, 1997). Whereas ISI strategies can be seen in the context of Cold War polarity, notions of Third-World dependency and fear of nationalist sentiments, the second wave adds additionallayers of complexity to the phenomenon of regionalism.Consequently, this ‘New Regionalism’ (Mansfield and Milner, 2000) has received renewed attention from academic circles. Despite an overwhelming and diverse body of literature, the ‘hows and whys’ remain poorly understood (Hettne and Söderbaum, 2000). Debatescenter on welfare gains and the implications of regionalism (especially the consequences for multilateralism), under what conditions states engage in Regional Integration Agreements (RIAs), and why and when integration takes the form that it does. Yet clearanswers on the origins and implications of regional integration are lacking (Gilpin, 2001). Is regional integration nothing new and a non-issue? Does it lead to short-term or long-term gains, and for whom? Are RIAs simply accumulation regimes? Are regional blocs a step towards or away from ‘globalization’? Is there such a thing as an optimal region, or configuration of regions, or is autarky the true natural state? Are regions sustainable? Are they even desirable?Section 2.1 reviews the mainstream theories that deal with regional integration in generalterms. Subsequent sections explores the explanations and assessments offered by theory interms of the origins (section 2.2), shapes and forms of integration (section 2.3) and theconsequences of integration (section 2.4). The concluding section, 2.5, focuses on the‘missing links’ that need to be addressed systematically to provide a more sophisticatedand holistic treatment of regionalism.
2.1 Mainstream theories of Regional Integration
To try and understand the key issues of regionalism, in particular given its increasingcomplexity, and address the questions posed above, requires an inventory of themainstream theories that deal with the question of regional integration. Mainstreamapproaches to regional integration are traditionally categorized as based in economics or political science due to their distinctive respective assumptions and areas of focus. Theycan be classified as follows: 1) classical trade- and investment theories; 2) ‘new’ trade, political economy and economic geography theories; 3) functionalist ‘bottom-up’ political theories; and 4) statist ‘top-down’ political theories.
2.1.1 Classical trade- and investment theories
Traditional trade-oriented theories of regional integration draw largely on the seminalworks of Viner (1950), Meade (1953) and Balassa (1961) and emphasize the ‘static’effects of an RIA’s internal and external barriers to trade. Viner’s concepts of trade
11
Chapter Two
creation and trade diversion under a Customs Union (CU) are fundamental to the analysis(Viner 1950). Trade creation refers to the increased tendency towards specialization(based on comparative advantage) and the resulting trade between CU members, which enhances welfare and increases income to both parties. Freeing trade within a given regioncan create trade by reducing prices, which in turn stimulates demand. Trade diversiondescribes the economic loss incurred when a common external tariff forces members toimport a good from an RIA partner at higher cost than the good could be obtained on theworld market. A high external tariff- or non-tariff barrier to trade, for instance, can diverttrade to relatively higher-cost producers within the region and shut out the world low-costproducer behind the common tariff wall, creating a welfare loss to the region and to theworld as a whole. Hence the merits of a given RIA are measured in terms of its ability tocreate more trade than it diverts, depending on relative tariff levels and shifts in tradeflows.Optimal currency area (OCA) theory, pioneered by Mundell (1961), examines theconditions under which it is economically efficient to create a currency union (or to fixexchange rates, cf. Mattli 1999). Changes (or stabilization) of the exchange rate affects flows of capital, markets of goods and markets of production factors. Factor mobility and integration of factor markets are included, because mobile factors are a prerequisite for an OCA. The higher the intensity of trade, the higher the benefits of a common currency(Yetati and Sturzenegger, 1999). In its initial form, OCA theory was highly apolitical, focusing only on the optimal size of such a currency area (Cohen, 1997). Graduallyrecognition grew that the OCA is an issue of sovereign states, which weigh the costs andbenefits of surrendering their national currency autonomy. Krugman has emphasized thatOCAs are a matter of macro-micro tradeoffs, because the consequence of giving up macroeconomic sovereignty is the gain of microeconomic efficiency (cited in Cohen,1997).More recently OCA theory has been expanded to include game-theoretic concepts, paying particular attention to bargaining and cooperation issues that arise in strategic settings characterized by asymmetric information and unequal distribution of economic capabilities among possible members of the union (Mattli, 1999a). From a strategic perspective,currencies are seen as a vehicle of competition between states or, in the case of an OCA, between areas or ‘regions’ (Cohen, 1997). Additionally, the role of private actors in reallocation processes has been recognized, making OCAs an issue not only of ‘political space’, but ‘economic space’ as well. Although OCA theory has been revived in the face of monetary union in Europe, as an empirical phenomenon it has remained relatively scarce, suggesting that perhaps the tradeoffs in favor of relinquishing currency sovereignty are notas positive as theory might suggest. In general OCA theory tends to downplay the significance of currencies as an element of national power and, as a consequence, loses agreat deal of its theoretical value. Increased recognition for the cross-border (productive) activities of in particular AmericanMNEs (Hymer, 1976; Vernon, 1966) led subsequent studies of integration to focus on Foreign Direct Investment, or FDI. Approaches building on Kindleberger’s (1966) analysisof investment creation and investment diversion consider the ‘dynamic effects’ of an RIA(Clegg and Scott-Green, 1999; Belderbos, 1997; Gatz, 1997; Blomström and Kokko, 1997;Dunning, 1997; Gestrin and Rugman, 1994; Cantwell, 1993) which include greatercompetitive pressures (efficiency gains), technology transfer (directly and through spill-overs), access to superior management and production techniques, employment growth and
12
Integration theory and the ‘new regionalism’
access to new capital (Dent, 1997). Such gains are considered ‘dynamic’ because they generate new activity and innovation, which in turn attracts new FDI, generating a new round of gains in a ‘virtuous cycle of dynamic growth’ (Connolly and Gunther, 1999).The increased attention for dynamic effects and FDI has signaled implicit recognition for the role of companies in the process of effecting integration outcomes. According toRobson (1993), this recognition is also evidenced by the development of Industrial Organization frameworks (such as Dunning’s OLI paradigm) which depict the horizontalor vertical (cross-border) integration of a firm’s activities as an effort to internalizeotherwise inefficiently operating markets, e.g. in the face of trade barriers (Dunning, 1992;Buckley and Casson, 1976), or exploit company-internal advantages such as technologicalknow-how (Dunning 1997, Markusen 1995). In a similar vein, economic integrationbetween countries could be seen as an attempt to ‘internalize’ international markets as wellas the enhancement of region-internal competitive advantages. This suggests that motivesfor adopting the transnational mode of production also underlie the formation of regionalblocs (Robson, 1993).
2.1.2 ‘New’ trade theory, political economy and spatial economics
Strategic trade policy is a focus area of ‘new’ trade theory (Dixit and Grossman, 1986;Krugman, 1986; Helpman and Krugman, 1985; Krugman, 1990; Markusen, 1995;Baldwin, 1997). ‘New’ trade theory was developed in response to criticisms of classical trade theories’ inability to explain in particular intra-industry trade and trade between developed countries with similar factor endowments. These additions to trade theory consider issues like oligopolistic competition, factor mobility, scale economies and barriers to entry (Markusen, 1995; Helpman and Krugman, 1989). Given the imperfect nature ofmarkets, the assumption is that firms and governments, through strategic behavior, canimprove the country’s terms of trade through the use of ‘optimal tariffs’ (Gilpin, 2001). The optimal tariff argument is that a tariff improves a country’s terms of trade if thatcountry is large enough in world markets (exploitation of monopoly power), as well as through oligopolistic rents. The emphasis, however, on ‘two / three firm, two country’models (Bowen et al., 1998) means that models are oversimplified and particularlysensitive to variations in assumptions. Moreover, models differ on the assumption of eithera ‘horizontal’ view of the firm, in which firms produce roughly the same goods in differentcountries, or a ‘vertical’ view, in which different stages of production are located indifferent countries – with very different results (Markusen and Maskus, 2001). The recognition of potentially disparate gains from integration and the (theoretical)strategic use of integration for rent-seeking and the improvement of terms of trade has ledsome authors to model integration by endogenizing the political decision. Public choice theory models consider the choice between a Customs Union (CU) and a Free Trade Agreement (FTA) as a free rider problem in terms of lobbying (McLaren, 2000;Panagariya and Findlay, 1996). Then there is the Grossman-Helpman bidding equilibriumin which interest groups either donate to a politician’s campaign fund or help to pay off campaign debts after the politician leaves office, and then politicians bargain on the basisoff those payoffs. The diversity of interests in part determines which group (or thepolitician) gains the most. Approaches of this kind are innovative in that they incorporate domestic interests into international policy decisions, but rely heavily on classicaleconomic arguments like rationality and full information availability.
13
Chapter Two
The ‘New Economic Geography’ (NEG) pioneered by Helpman (1985) and Krugman(1990), and consolidated by Fujita et al. (1999), considers ‘regionalization’ outside of thepolicy sphere. NEG is not a theory of regional integration as such; rather, it implies thatintegration is a de facto endogenous outcome of the behavior of economic actors under specific market conditions. In doing so, NEG compensates for the shortcomings of traditional International Economics by addressing the question of why economic activitytakes place in a given location and why it spreads. In addition, it abandons the realm of constant returns to scale, identical tastes and technologies and perfect competition in order to generate agglomerating effects. In the Dixit-Stiglitz stylized model of monopolisticcompetition presented in Fujita et al. (1999), traditional ‘physics’ of location (income, the price index, wage and transport costs) are all interrelated. Together they generate a numberof handy agglomerating effects (love of variety, price index, and home market) and alsoleave room for the introduction of spreading effects (e.g. congestion). The inherentassumption of increasing returns means that market structure must be considered, as theformer implies imperfect markets. At the same time, causation is cumulative (optimallocation choice depends on what others do). This multiple-equilibria situation is characteristic of economies of scale; any resultant equilibrium will therefore depend on historical development.Though not a theory of regional integration, NEG can be seen as suggestive of economicbehavior when barriers to trade and investment fall, which arguably affects the perceived‘distance’, and thus transport costs, between trading partners (Davis and Weinstein, 1999).The responsiveness of firms to trade and investment barriers has implications forpolicymaking as a vehicle for inducing agglomeration. Still, the policy aspect of regionalizing forces are neglected, the model itself is highly stylized and implausible, andempirics are inconclusive as to when a region is stable, growing, or shrinking. In addition,firms do not exhibit economically sub-optimal strategic behavior.
2.1.3 Functionalist theories of integration
Political science offers two closely related ‘bottom-up’ approaches, functionalism andneofunctionalism. The functionalist approach to integration entails functional cooperationat social and economic levels and is in this sense apolitical (Mattli, 1999). According to David Mitrany, one of the school’s founding fathers, in a more ‘natural’ world order economic freedom would ensure that authority be linked to a specific activity, and not to ageographic area (Van der Pijl, 1992). Functionalism emphasizes security issues (a‘working peace’) in integration, and sees states and governments as obstacles to what would otherwise be a bottom-up process for solving coordination problems. The approachentails both political and economic arguments: it suggests that if politicians step aside,rational economic behavior by actors in transnational society will generate irreversible, gradual steps towards a global division of labor. The underlying assumption is that politics is by its very nature conflict oriented and that politics is not the way to solve such issues.Mitrany took a pragmatic, functional approach to integration (‘the logic of ramification’),whose objective was to circumvent the polarity between total national sovereignty on theone hand and federalist tendencies towards supranational power structures on the other(Van der Pijl, 1992). Functional integration was not limited to geographic proximity andhad no limits. Functionalism, while powerful in its concept of economic interdependencies,
14
Integration theory and the ‘new regionalism’
was more a normative cry for an alternative means of achieving lasting peace than a theoryof regional integration per se.Neofunctionalism adds a utilitarian dimension to functionalism by addressing thepracticalities of yielding sovereignty. Neofunctionalism embodies the notion that supranationality is the only method available to states to secure maximum welfare (Mattli, 1999). A first step needed to be taken, but then this would grow by itself into an integration process. Vehicles of integration are functional spillover, updating of commoninterests, and sub- and supranational group dynamics. Actors also have purpose (strategicintent) and function (unintentional outcomes that form a new strategic reality, allowing theactor to learn and adapt his purpose). So functionalist integration becomes a learningprocess (Van der Pijl, 1992). For Haas, the question was whether functionalist de factointegration would lead to the emergence of a new political community via ‘federalism instages’ (ibid.).A Functionalist approach would argue that such institutions emerge because there is a fundamental need for them (Braithwaite and Drahos, 2000), which rests in the reduction of policy complexity. One problem is that the consequence of creating the organization(reduction of complexity) in some sense becomes the explanation for its emergence. In any case it means governance change requires interventions at multiple levels (Cox, 1994).
2.1.4 Statist theories of integration
Intergovernmentalism, also called ‘neorealism’, assigns a central role to heads of states and their ‘realist’ motivations, emphasizing power-related variables. States interact in a decentralized, anarchic system, with bloc-formation between states as a solution to the security dilemma (Deutsch, in Gilpin, 2001). Central is the ‘celebrated bargain’, in whichlarge and powerful states strike a deal and small states are paid off with side payments. Big states are more powerful than small states, and thus ‘bargaining tends to converge towardsthe lowest common denominator of large state interests’ (Moravscik, 1991). The securitydilemma leads to bandwagon effects in which each region tries to increase its bargaining power relative to other regions (Gilpin, 2001). Cameron (1992) points out that neorealismcontests the irreversible and inevitable nature of integration. Here states remain the mostpowerful actors and behave rationally, and are motivated by their desire to maintain andenhance their power relative to that of other states. The power-based argument for integration can be seen in the context of Servan-Schreiber’s now-famous book ‘The American Challenge’, by which integration in Europe is seen as a defensive strategy of maintaining power relative to the US. More recently the security dilemma has yielded to a more general view of solving commonproblems, particularly on the market. A more market-oriented perspective is embodied inthe concept of an RIA as market-making between public ‘demand’ for integration and policymakers’ ‘supply’ of integration (Mattli, 1999b). ‘Regional institution-building maybe viewed as an attempt to internalize externalities that cross borders within a group ofcountries. Externalities affecting cross-border trade and investment arise from economicand political uncertainty as well as a wide range of financial risks that market actors facewhen dealing with foreign firms and governments’ (Mattli, 1999b: 3).The apparent ability of the international community to build supranational cooperation despite the decline of US hegemony in the 1980s generated criticism of intergovernmentalist theories. Robert Keohane (1984), the main proponent of
15

Chapter Two
neoinstitutionalism, saw international regimes as a way of dealing with collective actionproblems like market failures and transaction costs. Institutions can aid states in solvingthese problems together in the absence of a hegemon willing to incur a disproportionateshare of the cost.
2.1.5 Structuring the mainstream literature
The theories discussed above all make significant contributions to our understanding of Regionalism (see Table 2.2). Yet they deal with the topic from a wide range ofassumptions and points of departure. The level of analysis is overwhelmingly macro, theunderlying logic (implicit or explicit) is very different, and key ‘actors’ are conceptualizeddifferently, if at all. Drawing on this diversity to enhance our understanding of ‘the New Regionalism’ is a complex task.
Table 2.2: An overview of mainstream approaches to regional integration
Conceptualz-
zation of region
Focus of inte-
gration dynamic
Logic of
integration
Level of
analysis
Key ‘actors’ Conceptualization of
actors
Customs union theory
Customs Union(CU)
trade shifts trade creation, economic welfare
macro(supranational)
markets the invisible hand
OptimalCurrency Areas
Monetary Union/ fixed exchange rates
trade and factor shifts
macroeconomicand factor marketstability
macro(supranational)
markets the invisible hand
FDI and Integration
Free Trade Area, Customs Union,Common Market
cross-borderoperations of firms
efficiency effects and dynamicgrowth
macro(supranational)
firms;governments
profit maximizingMNEs; policyrealists
‘New’ Political Economy and Strategic Trade Theory
Free Trade Area, Customs Union
trade shifts improve terms of trade, serve protectionistinterests
macro(national)
policymakersand interest groups
rational, self-interested and welfare maximizing
New EconomicGeography
Agglomeration of economic activityin geographic space
agglomeratingversus spreading effects
costminimization;endogenous to firm behavior
regional firms rational production processes; ‘dots in space’
Functionalism Not applicable supranationalinstitutions;interdependenceof economicactors
peace through prosperity
macro(supranational)
economic actors interdependentproduction processes
Neo-functionalism
European Coal and Steel Community
utilitarianbehavior of actors
self-interest:welfaremaximization
macro(supranational)
political and economic actors
self-interestedutilitarian
Intergovern-mentalism
security bloc the ‘celebratedbargain’
increasednational and regional security
macro(national)
heads of state self-interested‘enlightened’ leaders in pursuit of power
Neo-institutionalism
supranationalinstitution
governments solving collectiveaction problem
macro(supranational)
states and supranationalgovernancebodies
organizations for problem-solving
Approaches can be structured in different ways; predominant is the classification alongeconomic and political lines but this is not very functional. Winters (1999) adopts a morecomplex (albeit weighted towards economics) taxonomy. In his account, approaches diverge in terms of objectives (welfare or other undefined ‘political’ considerations), interaction between countries (one-off or repeated), preferences and behavior (implicit or explicit), power dynamics (number of countries and number of trade blocs, and power
16
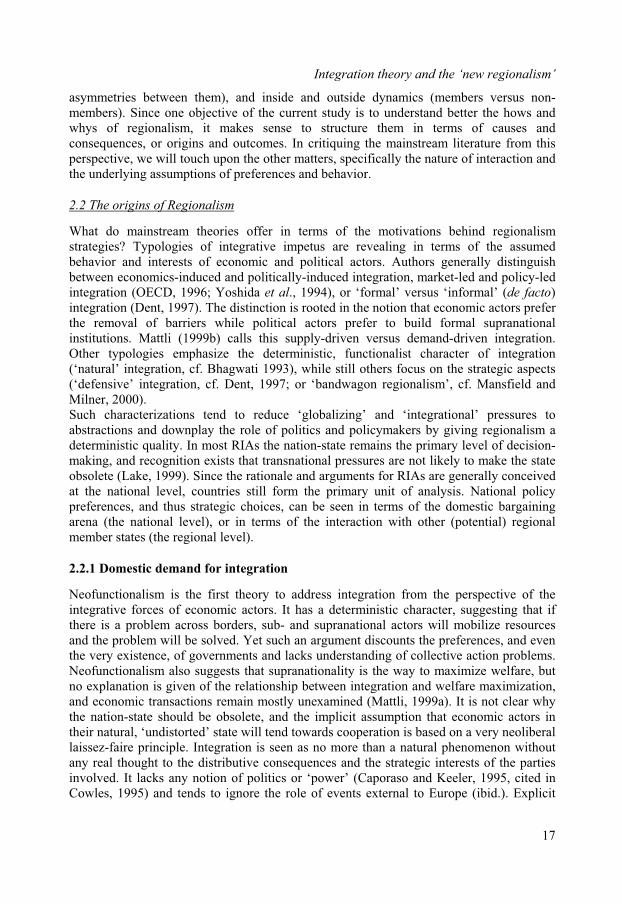
Integration theory and the ‘new regionalism’
asymmetries between them), and inside and outside dynamics (members versus non-members). Since one objective of the current study is to understand better the hows and whys of regionalism, it makes sense to structure them in terms of causes andconsequences, or origins and outcomes. In critiquing the mainstream literature from thisperspective, we will touch upon the other matters, specifically the nature of interaction and the underlying assumptions of preferences and behavior.
2.2 The origins of Regionalism
What do mainstream theories offer in terms of the motivations behind regionalismstrategies? Typologies of integrative impetus are revealing in terms of the assumedbehavior and interests of economic and political actors. Authors generally distinguish between economics-induced and politically-induced integration, market-led and policy-led integration (OECD, 1996; Yoshida et al., 1994), or ‘formal’ versus ‘informal’ (de facto)integration (Dent, 1997). The distinction is rooted in the notion that economic actors prefer the removal of barriers while political actors prefer to build formal supranationalinstitutions. Mattli (1999b) calls this supply-driven versus demand-driven integration. Other typologies emphasize the deterministic, functionalist character of integration(‘natural’ integration, cf. Bhagwati 1993), while still others focus on the strategic aspects (‘defensive’ integration, cf. Dent, 1997; or ‘bandwagon regionalism’, cf. Mansfield and Milner, 2000).Such characterizations tend to reduce ‘globalizing’ and ‘integrational’ pressures toabstractions and downplay the role of politics and policymakers by giving regionalism adeterministic quality. In most RIAs the nation-state remains the primary level of decision-making, and recognition exists that transnational pressures are not likely to make the stateobsolete (Lake, 1999). Since the rationale and arguments for RIAs are generally conceivedat the national level, countries still form the primary unit of analysis. National policy preferences, and thus strategic choices, can be seen in terms of the domestic bargainingarena (the national level), or in terms of the interaction with other (potential) regionalmember states (the regional level).
2.2.1 Domestic demand for integration
Neofunctionalism is the first theory to address integration from the perspective of theintegrative forces of economic actors. It has a deterministic character, suggesting that ifthere is a problem across borders, sub- and supranational actors will mobilize resourcesand the problem will be solved. Yet such an argument discounts the preferences, and eventhe very existence, of governments and lacks understanding of collective action problems.Neofunctionalism also suggests that supranationality is the way to maximize welfare, butno explanation is given of the relationship between integration and welfare maximization,and economic transactions remain mostly unexamined (Mattli, 1999a). It is not clear why the nation-state should be obsolete, and the implicit assumption that economic actors intheir natural, ‘undistorted’ state will tend towards cooperation is based on a very neoliberal laissez-faire principle. Integration is seen as no more than a natural phenomenon withoutany real thought to the distributive consequences and the strategic interests of the partiesinvolved. It lacks any notion of politics or ‘power’ (Caporaso and Keeler, 1995, cited in Cowles, 1995) and tends to ignore the role of events external to Europe (ibid.). Explicit
17
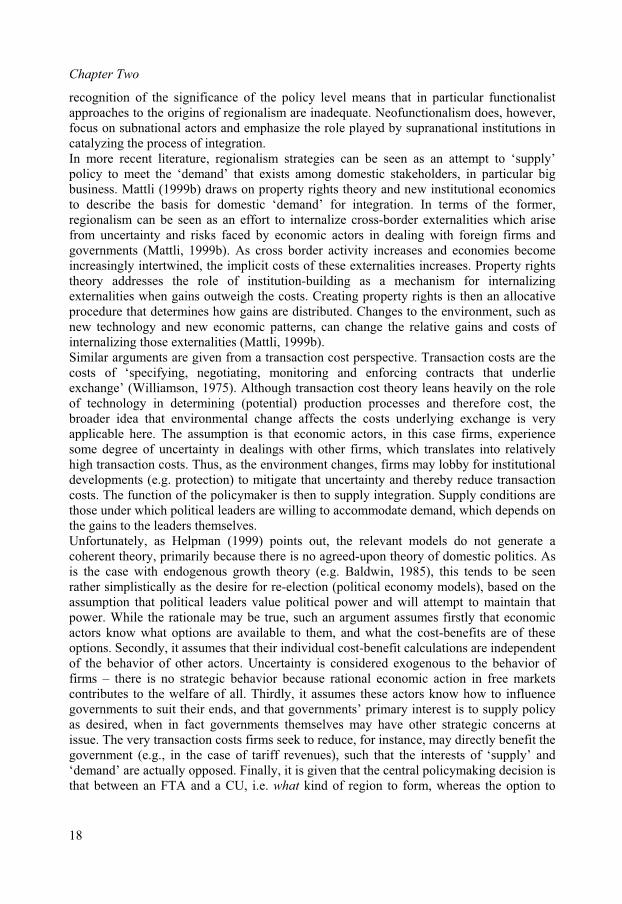
Chapter Two
recognition of the significance of the policy level means that in particular functionalistapproaches to the origins of regionalism are inadequate. Neofunctionalism does, however, focus on subnational actors and emphasize the role played by supranational institutions in catalyzing the process of integration.In more recent literature, regionalism strategies can be seen as an attempt to ‘supply’ policy to meet the ‘demand’ that exists among domestic stakeholders, in particular bigbusiness. Mattli (1999b) draws on property rights theory and new institutional economicsto describe the basis for domestic ‘demand’ for integration. In terms of the former,regionalism can be seen as an effort to internalize cross-border externalities which arisefrom uncertainty and risks faced by economic actors in dealing with foreign firms and governments (Mattli, 1999b). As cross border activity increases and economies becomeincreasingly intertwined, the implicit costs of these externalities increases. Property rightstheory addresses the role of institution-building as a mechanism for internalizingexternalities when gains outweigh the costs. Creating property rights is then an allocativeprocedure that determines how gains are distributed. Changes to the environment, such as new technology and new economic patterns, can change the relative gains and costs ofinternalizing those externalities (Mattli, 1999b).Similar arguments are given from a transaction cost perspective. Transaction costs are the costs of ‘specifying, negotiating, monitoring and enforcing contracts that underlieexchange’ (Williamson, 1975). Although transaction cost theory leans heavily on the role of technology in determining (potential) production processes and therefore cost, thebroader idea that environmental change affects the costs underlying exchange is veryapplicable here. The assumption is that economic actors, in this case firms, experiencesome degree of uncertainty in dealings with other firms, which translates into relativelyhigh transaction costs. Thus, as the environment changes, firms may lobby for institutional developments (e.g. protection) to mitigate that uncertainty and thereby reduce transactioncosts. The function of the policymaker is then to supply integration. Supply conditions arethose under which political leaders are willing to accommodate demand, which depends on the gains to the leaders themselves.Unfortunately, as Helpman (1999) points out, the relevant models do not generate a coherent theory, primarily because there is no agreed-upon theory of domestic politics. As is the case with endogenous growth theory (e.g. Baldwin, 1985), this tends to be seenrather simplistically as the desire for re-election (political economy models), based on the assumption that political leaders value political power and will attempt to maintain thatpower. While the rationale may be true, such an argument assumes firstly that economicactors know what options are available to them, and what the cost-benefits are of theseoptions. Secondly, it assumes that their individual cost-benefit calculations are independentof the behavior of other actors. Uncertainty is considered exogenous to the behavior of firms – there is no strategic behavior because rational economic action in free marketscontributes to the welfare of all. Thirdly, it assumes these actors know how to influencegovernments to suit their ends, and that governments’ primary interest is to supply policyas desired, when in fact governments themselves may have other strategic concerns atissue. The very transaction costs firms seek to reduce, for instance, may directly benefit thegovernment (e.g., in the case of tariff revenues), such that the interests of ‘supply’ and ‘demand’ are actually opposed. Finally, it is given that the central policymaking decision isthat between an FTA and a CU, i.e. what kind of region to form, whereas the option to
18
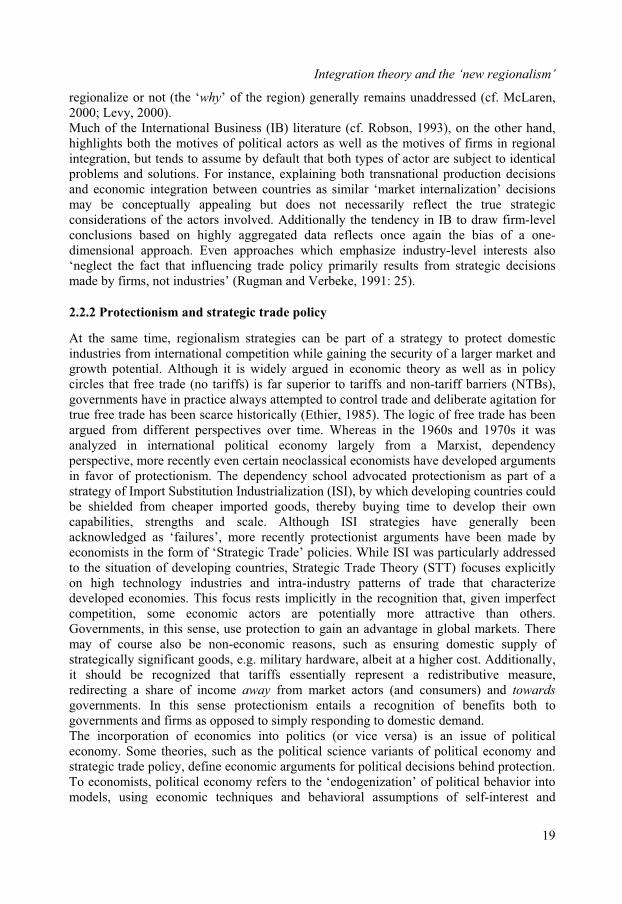
Integration theory and the ‘new regionalism’
regionalize or not (the ‘why’ of the region) generally remains unaddressed (cf. McLaren,2000; Levy, 2000). Much of the International Business (IB) literature (cf. Robson, 1993), on the other hand, highlights both the motives of political actors as well as the motives of firms in regionalintegration, but tends to assume by default that both types of actor are subject to identicalproblems and solutions. For instance, explaining both transnational production decisionsand economic integration between countries as similar ‘market internalization’ decisionsmay be conceptually appealing but does not necessarily reflect the true strategicconsiderations of the actors involved. Additionally the tendency in IB to draw firm-levelconclusions based on highly aggregated data reflects once again the bias of a one-dimensional approach. Even approaches which emphasize industry-level interests also‘neglect the fact that influencing trade policy primarily results from strategic decisionsmade by firms, not industries’ (Rugman and Verbeke, 1991: 25).
2.2.2 Protectionism and strategic trade policy
At the same time, regionalism strategies can be part of a strategy to protect domesticindustries from international competition while gaining the security of a larger market and growth potential. Although it is widely argued in economic theory as well as in policycircles that free trade (no tariffs) is far superior to tariffs and non-tariff barriers (NTBs),governments have in practice always attempted to control trade and deliberate agitation fortrue free trade has been scarce historically (Ethier, 1985). The logic of free trade has been argued from different perspectives over time. Whereas in the 1960s and 1970s it was analyzed in international political economy largely from a Marxist, dependencyperspective, more recently even certain neoclassical economists have developed argumentsin favor of protectionism. The dependency school advocated protectionism as part of a strategy of Import Substitution Industrialization (ISI), by which developing countries could be shielded from cheaper imported goods, thereby buying time to develop their own capabilities, strengths and scale. Although ISI strategies have generally been acknowledged as ‘failures’, more recently protectionist arguments have been made by economists in the form of ‘Strategic Trade’ policies. While ISI was particularly addressed to the situation of developing countries, Strategic Trade Theory (STT) focuses explicitly on high technology industries and intra-industry patterns of trade that characterizedeveloped economies. This focus rests implicitly in the recognition that, given imperfectcompetition, some economic actors are potentially more attractive than others. Governments, in this sense, use protection to gain an advantage in global markets. There may of course also be non-economic reasons, such as ensuring domestic supply of strategically significant goods, e.g. military hardware, albeit at a higher cost. Additionally, it should be recognized that tariffs essentially represent a redistributive measure,redirecting a share of income away from market actors (and consumers) and towards
governments. In this sense protectionism entails a recognition of benefits both togovernments and firms as opposed to simply responding to domestic demand.The incorporation of economics into politics (or vice versa) is an issue of political economy. Some theories, such as the political science variants of political economy and strategic trade policy, define economic arguments for political decisions behind protection. To economists, political economy refers to the ‘endogenization’ of political behavior into models, using economic techniques and behavioral assumptions of self-interest and
19
Chapter Two
individual welfare maximization. This assumes that economic institutions are created to serve market efficiency, however, and that everything can be explained endogenously; i.e.,as an attempt on the part of an actor to maximize his or her economic welfare (Gilpin,2001).Most of the possible explanations for the origins of regionalism come from politicalscience theories. In political science variants of political economy, however, the nature of economic activity remains an open question. Interests, power and strategic behavior are distinguished at different levels of analysis. Regional integration, for instance, can be a question of benefits to individual consumers, promoting specific welfare goals or of maximizing national power. Although the argument introduces strategic behavior on the part of both companies and governments, it has been criticized for lack of applicability to both real-world policy (Gilpin, 2001) and firm-strategy situations (Waverman, 1991). Criticizing protectionism as a policy strategy does not do away with the fact that pressure from domestic interestgroups may continue to exist, despite the supposedly self-evident flaws in protectionistlogic. The counter-arguments of free trade are often lost on those groups which stand tolose most by changing the status quo, and their political pressure can sometimes be irresistible. Trade creation, in the words of Albert Hirschman, can be a political liability.Gilpin (2001) argues that the relevance of the ‘new trade’ theory for trade policy has been exaggerated by those too willing to misuse economics for rent-seeking purposes, and as Samuelson once suggested, ‘one must be careful when businessmen parrot economictheory’ (Waverman, 1991: 60). ‘Misuse’, however, is subjective in the sense thatprotectionism represents real political and economic interests that can be powerful forces in shaping policy, regardless of the strengths and weaknesses of their arguments.
2.2.3 Pressuring domestic stakeholders
The assumption is often made that in international policymaking, governments only act inthe expressed interest of their constituents. Domestic pressure groups, meaning societal oreconomic stakeholders, are considered to have the implicit ability to unseat governmentsthrough their voting behavior. Many theories, therefore, fail to take into account the possibility that governments might enact policies contrary to those interests. In fact, government interests and thus policy preferences may be determined by factors other thandomestic pressure groups, and structural reforms may be a response to such externalpressures as powerful economic partners, regional hegemons or supranational institutions like the IMF. In such cases, regionalism strategies can be used to leverage governmentalpower against domestic interest groups in a more adversarial relationship. From aneoinstitutional perspective, economic interdependence ‘multiplies the opportunities for altering domestic coalitions (and thus policy outcomes) … in effect creating politicalentanglements across national boundaries (Putnam, 1993; cited in Cameron and Tomlin,2000: 22).Regionalism can be an attempt by government to shape comparative advantages andinfluence the capabilities of the national economy (Jovanovic, 2001). Regionalism can also serve to formalize, or ‘lock in’, liberal reforms (e.g., in the case of Mexico) by forming‘commitment institutions’ (Mattli, 1999b: 170) which are at least to some extent controlled by outside forces. Often this is looked at the international political level, particularly as a coordination dilemma. Yet the commitment to regionalism can also be a strategy for
20
Integration theory and the ‘new regionalism’
pressuring local stakeholders to adhere to policy by increasing the ‘weight’ of policy ingeneral, as a way of ‘tying the government’s own hands’. Some of the National BusinessSystems literature (see Whitley, 1999; Hollingsworth and Boyer, 1996; Lazonick and O’Sullivan, 1996; Whitley and Kristensen, 1996) tends to look at regional integration inthis way, considering policy as implemented from above and analyzing its impact in termsof the pressure it places on local stakeholders.Regionalism strategies can be part of an effort to shift power relations with domesticstakeholders, such as union leaders and big business. The government, for example, mayfeel that companies are not contributing successfully enough to national competitivenessand force them to restructure through exposure to additional competition. Tension mayexist between interests in policy space and competitive space, particularly if government is not solidly rooted in civil society. Additionally, democratic mechanisms may also not beeffective enough to ‘perfectly’ transmit domestic interests. This may particularly apply todeveloping countries in the context of ‘North-South’ integration, where the ideological gapbetween stakeholders is great. Political economy models (cf. Winters, 1999) argue that theeffectiveness of political pressure, and hence the incentive to undertake lobby activities, by predominantly nationally-organized interest groups declines under integration. Theresultant distribution of political decision-making power towards governments may in itself be a reason to engage in integration.Policy initiatives may be described as an attempt to mold competitive space in such a way that it is better compatible with policy spaces. A perspective based on policy initiatives as leading, however, does assume for its part some kind of information asymmetry, and thatstakeholders (or, most relevant for our analysis, core companies) might not fullyunderstand the stakes of the game, the range of options available to them, nor have a clearunderstanding of what the government’s interests are. The alarming diversity in ex antepredictions and ex post analysis of even the two most high-profile regions in the world, theEU and NAFTA, shows that the stakes in the real world are far from clearly defined.
2.2.4 Collective action problems
The newer institutionalist theories emphasize regionalism as an example of internationalcooperation in solving collective action problems (Gilpin, 2001), rooted at least to someextent in frustration with the apparent inability of multilateral process to solve suchproblems. Institutionalist theories generally seek collective action problems in the realm ofwelfare problems, such as the stability of the international monetary system (Mattli,1999b). Regionalism can be explained as a response to a number of problems particularlyin terms of transaction costs and diseconomies of scale at the multilateral level (Haggard, 1997). These are regional-level market failures that lead to an inability to couple regionalsupply and demand, with extra-regional supply and demand ‘leakage’ as a result. This lineof thinking emphasizes regionalism as a powerful tool to enhance competitiveness in each of the constituent nations as well as a way to promote interest and investment in the regionby the international community. By creating competitive advantage on a regional scale,countries could draw in additional sources of growth and free up intra-regional resources through scale economies. The injection of additional resources and competitive pressures would create innovative pressures that would ultimately allow the region to compete on the basis of superior technology. From a more realist perspective, explanations for regionalism
21

Chapter Two
are traditionally sought in the context of security as the fixed, unitary goal of states(Cohen, 1997).The central issue in collective action problems is the provision of public goods. The critically received Hegemonic Stability Theory (HST) argues that a stable international order can only be maintained in the presence of a hegemonic power willing to incur thecosts of providing certain ‘global’ public goods (Gilpin, 2001). Most recently, the United States is portrayed as having fulfilled this role, while Great Britain was the hegemonicpower in the 19th century. Whereas proponents of Hegemonic Stability Theory (HST) look to a strong, dominant state to provide such goods, the question remains as to who providesthe public goods in the absence of a hegemon. The cost-benefit analysis of providingpublic goods, and the risk of free-riders, can have the characteristics of a Prisoner’sDilemma (Mattli, 1999b) in which the gains from steps taken depend on the behavior of other actors. On the other hand, some argue that the power vacuum in the hegemon’sabsence signifies a removal of a key obstacle to enhanced economic cooperation. In thissense the origins of the second wave of regionalism can be seen in the shift to a multipolar,tripolar or even bipolar structure as a consequence of declining American hegemony(Hettne and Söderbaum, 2000). The absence of a hegemon thus necessitates collective action but at the same time impedes multilateralism. Multilateral failure (e.g. the OECD’s abandoned initiative for a Multilateral Agreement on Investment, the MAI, and the troubles surrounding the WTO) may also be symptomatic of the limits of real state policyin the face of UN weakness; regionalism, therefore, may be the most logical response.However, even though regionalism can be seen as the solution to a number of collectiveaction problems, it creates new ones of its own. An additional problem is that Prisoner’sDilemmas fail to consider the distributive element of trade bargaining, i.e. the distributionof power among players and the relative gains, losses and risks incurred by each. Haggard looks at integration not from the PD perspective, but more from the perspective of tradebargaining as a distributive game between small and large players. Haggard argues that,despite theoretical predictions suggesting greater potential gains from integration as thenumber of members increases, a larger number of members also increases the likelihood ofdivergent preferences and reduces the likelihood of striking a bargain (Haggard, 1997). Itis therefore theoretically possible that there is a critical mass to collective action problemssuch that governments do not expect more parties to be beneficial; in other words, theremay be an ‘optimal number’ of member states (Padoan, 1997). Preferences can become toodiverse, such that it becomes ineffective and the ability of individual governments to affect outcomes diminishes.Although neoinstitutional theory has been influential in our understanding of regional institutions, it has not generated a theory of economic and political integration (Gilpin, 2001). In addition, Sandholtz (1999) has criticized the neoinstitutionalist approach on the grounds that there is little evidence that such cooperative agreements actually reduce transaction costs, in part because such agreements are most likely to occur where transaction costs are already low, and notoriously difficult to measure. Additionally, theintergovernmentalist emphasis on this bargain in isolation ignores the context of integration (Mattli, 1999). There is too much emphasis on the enlightened leader, when the term of office is likely to expire far before the fruits of integration can be plucked. Inaddition, there is overreliance on the presumption that a large state (hegemon) will play akey role, incurring extra costs in guaranteeing stability. Lastly, regime theory suffers froma lack of true empirical research on the actual functioning of specific regimes, which
22
Integration theory and the ‘new regionalism’
makes it difficult to determine whether or not regimes actually make a difference in theconduct of international affairs (Gilpin, 2001).
2.2.5 ‘Defensible’ multilateralism
A variant to the argument of an optimal number of members is that of regionalism as an attempt to create ‘defensible’ multilateral institutions in which a higher degree of nationalsovereignty is retained. Economic linkages in general increase security (Ohmae, 1990), butthere still exists a trade-off between economic growth and autonomy. Regionalismstrategies may be undertaken simply as a way of maintaining some control over theorganization of economic activity in what Braithwaite and Drahos (2000) call ‘paradoxes of sovereignty’. If a supranational institution is too large, individual members run the riskof losing control over policy and may opt for a more ‘manageable’ degree of sovereigntycession. This rationale is particularly used in cases of developing or otherwiseeconomically weak or vulnerable countries fearful of multilateral liberalization and its consequences, or in the case of expansion of a pre-existing region (a kind of pathdependency) which Winters (1993) calls ‘managed liberalism’ (p. 212). The defensiblemultilateralism approach can also be a flanking strategy for countries when wider multilateralism stalls. The United States may provide the classic example of such anapproach, where bilateralism and regionalism are employed when multilateralism stalls, orwhen the multilateral path requires too great a concession of sovereignty, which is an issueof particular sensitivity for the US. As a conceptual argument ‘defensible multilateralism’is attractive but it does not show how to define the right size, or what the criteria are forsuch a collective action problem that the number of interested parties would have anoptimum. This depends on the perceived degree of common vision, or shared preferencesin a particular area of policymaking.One of the problems, however, with regionalism as a strategy to solve collective action problems is that it seems to rest on the assumption that the international economy issomething exogenous, while it is in fact a product of the behavior of strategic actors,including nation-states. Additionally, while the problem of collective action, public goods and free riding demonstrates the strategic game elements of international cooperation, a true theory of cooperation must also address the more fundamental question of policypreferences and the capabilities of the relevant actors. Key dimensions here are discrimination between insiders and outsiders (regionalism as the provision of ‘club’goods), and distributive issues between potential members.
2.2.6 Maximization of national power
Idealist perspectives of integration view the recently growing impetus to integrate as a strategic complement, meaning that the more countries that integrate, the greater the gainsare for all members (Krugman, 1991b). Such arguments, however, downplay thedistributive effects of trade policies by ignoring self-interest (Gilpin, 2001). Bhagwati and Baldwin were among the first to recognize that governments often fail to enact the policiesidentified in theory (Feenstra et al., 1996). Their political economy trade models madetrade policy endogenous, recognizing that governments are not benign welfare-maximizingentities but rather pursue other, potentially sub-optimal objectives (Panagariya andFindlay, 1996). However, the value of these trade models for policymaking has been
23
Chapter Two
overemphasized (Waverman, 1991), in part due to the lack of diversity in national interestsin which they incorporate (Gilpin, 2001).Nonetheless, governments are certainly very much motivated by national self-interest andcan use regional platforms to defend those interests. The ‘competition state’ (Cerny, 1999) continues to use its power to channel economic activity to suit its national interests,including receipt of a favorable share of the gains from international economic activities (Helmut Schmidt’s competition for the ‘world product’: Gilpin, 2001) and preservation ofnational autonomy. ‘One should see [regionalism] as an integral part of a nationalcompetitiveness strategy, one that complements domestic economic reforms designed to improve productivity and promote the ability of local industries to compete moreeffectively against foreign suppliers at home and in the world markets’ (Hufbauer andSchott, 1993: 116).This line of thinking presents the collective nature of regionalism as a vehicle for achieving nationally defined goals with a relative minimum of compromise (Gilpin, 2001) as opposed to the provision of supranational ‘public goods’. Regional integration is a wayto increase national wealth, and therefore power, in global terms (rent-seeking). Suchtheories emphasize the fact that RIAs embody conflicting interests, and that reality is a global arena of sometimes conflicting policy domains. The concept that regionalism isinherently discriminatory can, in this sense, refer to the distribution of gains fromintegration among members, not just relative to third parties or ‘outsiders’ (Haggard,1997). Prakash and Hart (1999) argue that regionalism, in addition to being an expression
of inter-state rivalry, may in fact even promote inter-state rivalry, largely through theenhancement of systemic power (cf. Strange, 1994).Rivalry between nations and supranational institution-building is not just a question of therisk of defection and the creation of commitment institutions to catalyze the process, inwhose absence RIAs could only be stable based on repeat-play, issue-linkage and reputation (Mattli, 1999b). Since some countries have more market power than others (Cameron and Tomlin, 2002), some will attempt to maximize their own interests or welfare, just as firms do under oligopoly and market power conditions. The assumptionthat there is little or no communal interest leads to an asymmetric game in whichequilibrium outcomes can be reached with one or more players unhappy, described by Lisa Martin as a ‘suasion’ game (cited in Haggard, 1997: 31). RIAs thus create a coordinationdilemma (Mattli, 1999b) where policy preferences are not predefined but depend on the behavior of others. Equilibria are self-enforcing, but hard to come by. In a model byGatsios and Karp (1995), on the other hand, ‘weaker’ states can actually profit by allowinga more ‘aggressive’ member state to lead negotiations. This quasi-hegemonic approach argues that a single powerful state, with the resources of an entire union at its disposal, can achieve more in international negotiations than individual states, or than regions withcollectively defined, pluralist preferences. The impetus to integrate may beget a kind of ‘bandwagon dynamism’ that Mattli (1999b) calls ‘the first integrative response’. This involves an effort by third-party countries to getinto an existing RIA (‘club’ membership) and therefore circumvent some of the initialcosts. This behavior is a form of me-too strategy, but as a ‘retaliatory response’ tominimize potential losses or being ‘locked out’ of the gains from integration (oligopolisticreaction) instead of as a ‘strategic complement’ (Head, 1998). The maximization ofnational power or self-interest is also reflected in the desire to engage in regionalismsimply because other nations do so. The region may welcome such efforts, since the
24
Integration theory and the ‘new regionalism’
attraction of new members (like Austria and Sweden in the case of the EU) will enhance its international bargaining power. Whether the aspiring candidate’s strategy is successfuldepends inter alia on the costs of membership, and what the potential candidate has tooffer. The price of joining a successful region, Mattli (1999b) argues, can be prohibitively high such that the ‘me-too’ strategy may require the initialization of a new region asopposed to accession to a preexisting one.
2.3 Mechanisms of Regionalism
What is the purpose of policymakers in shaping the institutions that govern economicbehavior, and what are the means, or ‘mechanisms’ (Braithwaite and Drahos 2000) bywhich they do so? Realist theories try to explain international behavior in terms of interestsand power alone but are insufficient because they ignore institutions (Keohane, 1984). Supranational institution-building rests on international cooperation, defined by Keohane (1984: p. 51) as the adjustment of actors’ behavior to suit the actual or anticipatedpreferences of others, through a process of policy coordination. The current ‘fad’ ofglobalization might suggest that international cooperation is a deterministic, naturalprocess, but in fact it is always contextual; history has always born witness to a ‘seesaw’ between nationalism and internationalism, both in terms of intellectual trends as well as real political ones (Wallerstein, 1974).What tools are available to policymakers in building supranational institutions, and howare they implemented? From a policy point of view, institutions are formal mattersconsolidated through policy intervention, particularly those affecting the (re)distribution of resources. A number of factors are important in developing institutions: the degree ofpluralism, type of public policy development process, definition of the public interest, and the influence of lobby techniques (Wartick and Wood, 1998). Braithwaite and Drahos (2000) emphasize a range of ‘push’ and ‘pull’ mechanisms such as military or economiccoercion, systems of reward, reciprocal adjustment and non-reciprocal coordination.Braithwaite and Drahos (2000) argue that coercion (‘the stick’) is more important thanreward (‘the carrot’). What are the restrictions, such as national stakeholder configurationsand multilateral legislation, to the use of such policies? The following subsections addressthe primary areas of policy mechanisms governments use to build the institutions which influence the organization of economic activity: trade and investment policy, competitionand industrial policy, monetary and fiscal policy, international agreements and treaties, and dispute settlement mechanisms. These policy tools are considered primarily from the pointof view of the (national) government as the predominant policymaking institution. What do these mechanisms suggest about the behavior of market actors?
2.3.1 Trade and investment policy
Barriers to trade and investment consist of mechanical barriers to the flow of goods andproduction factors into (and sometimes out) of a given policy space. While tariffs, or taxes,remain the most common barrier to the flow of goods, ‘non-tariff barriers’ (NTBs) such as voluntary export requirements (VERs), quotas, trade-related investment measures(TRIMs), trade-related aspects of intellectual property rights (TRIPs) are increasinglycommon. Tariffs and NTBs affect the price of goods to consumers either by raising the realcost price or by determining their relative scarcity. The flow of production factors, in
25
Chapter Two
particular capital, is regulated through TRIMs such as minority interest restrictions,national treatment of foreign investors, rules of origin (local content requirements), export-performance requirements, production mandates, mandatory technology transferrequirements and local-manufacturing requirements (Graham, 1997). Investment measuresessentially determine the ability of foreign investors to invest, or artificially alter therelative attractiveness of the target country.The logic of trade and investment policy is still predominantly shaped by neo-classicalapproaches to economics. National policy preferences, rooted in Ricardian comparativeand absolute advantage, are ultimately determined by relative production factor endowments. Countries with different factor endowments will produce most efficiently byproducing goods for export using factors in which the country has a relative advantage, and importing products from abroad that use factors compared to its trading partners. On thebasis of this theory, the production factor used relatively intensively in the production ofexport goods will gain under free trade, whereas production factors used intensively in import-competing production will gain most from protection. In terms of interests, these production factors were at first translated abstractly into ‘capitalists’ and ‘workers’, but arelooked at in an applied sense from a sectoral point of view. Gains and losses are primarilyinvestigated on the basis of one-off policy interventions (considering only the response of‘market’ actors and not taking possible policy retaliation into account).There do exist limitations to national policy sovereignty in such matters. Whereas tariffsand quotas are essentially measures enacted by the importing country, they can conflictwith international agreements. Voluntary export requirements (VERs), on the other hand, are concessions sometimes ceded by and sometimes forced upon the exporting country thatsneakily circumvent such agreements (Schwartz, 1994). This only works if the importingcountry is powerful enough to threaten sanctions. Although membership in the WTOimplies adherence to the principles of free trade, the reality is somewhat more flexible.Countries use trade and investment measures when they are beneficial, and decry anyattempt to limit free trade if such measures could be harmful. Given the predominance of free-market ideology, government intervention in trade and investment is consideredundesirable.Regional integration is generally seen in this way, depending on the degree to which theRIA creates or diverts trade and investment. Although regional integration is formallyfrowned upon in the WTO, provisions under the Enabling Clause and Article XXIV (andArticle XIX) of the GATT create ‘loopholes’ through which RIAs become practically viable.Article XXIV, which contains the main provisions concerning Territorial Application,Frontier Traffic, Customs Unions and Free Trade Areas, requires that a CU or FTA cover substantially all trade, and that for those items which are included, ‘duties and otherrestrictive regulations are [to be] eliminated’, i.e. that there is to be a 100 per cent reductionin tariffs and other barriers, a preferential rate other than zero is not contemplated. ArticleXXIV is ‘notoriously lax’ (Haggard, 1997: 29). The Enabling Clause, formally known as the Tokyo Round Decision on “Differential and More Favourable Treatment, Reciprocityand Fuller Participation of Developing Countries” (Laird, 1997), formally allows for thecreation of preferential trading arrangements between developing countries, as long as theydo not raise barriers or create ‘undue’ difficulties for third parties. One of the main criticismsof Article XXIV is that it does not subject RIAs to meaningful review even in respect to its own defined criteria since the outcome of the review process is controlled by the RIAmember states (Abbott, 1999).
26

Integration theory and the ‘new regionalism’
2.3.2 Monetary and fiscal policy
Monetary and fiscal policy are the primary elements of macroeconomic policy. Strictlyspeaking, monetary policy is the means by which the government controls the moneysupply and, as any other good under laws of supply and demand, thus determines itsrelative value. The money supply is controlled through interest rates, which affect theinvestment behavior and production decisions of firms. In the international context, therelative value of a currency determines the exchange rate. Exchange rate volatility affectscross-border capital flows as well as the value and flow of trade through inflation,devaluation, exchange rate pegs. Exchange rate fluctuations can lead to hysteresis, by which the circumstances around trade and investment decisions change over time and automatically alter the strategic relevance of the decision (Bowen et al., 1998).Fiscal policy affects e.g. government spending and interest payments on government debt,but its central mechanism is taxes. Taxes affect growth by stimulating labor supply,consumer spending and investment. Fiscal policy has an increasingly importantinternational dimension given the increase in cross-border capital flows. For certaincountries, fiscal policy can form the foundation of a competitive advantage through tax exemptions, rebates and generally low taxes, particularly on corporate activity (so-called‘tax havens’). It has been argued in the theory of optimal currency areas (OCA; see section 2.1.1) that supranational coordination of macroeconomic policies (primarily by means of a fixedexchange rate) can improve employment and price stability. Recent history has seen two major attempts to manage macroeconomic policies supranationally. The first, the goldstandard which existed prior to World War One, failed when the international distributionof gold stocks failed to reflect international flows of trade in goods (Schwartz, 1994). Thesecond, known as the Bretton Woods agreements, were essentially designed to reconcileaggregate demand and the balance of trade, while minimizing the risk of internationalpolicy conflict (Ethier, 1985). The adjustable peg system served to keep exchange rateswithin a manageable bandwidth. Only the European Union has seriously exploited thepossibility of monetary union (aside from numerous examples of ‘pegging’ and currencyunions in West Africa and the Caribbean) within the context of regional integration.There are certain limitations to the sovereignty of nations when it comes to policiesdesigned to alter capital flows. On the one hand, countries which are members of theInternational Monetary Fund are required to observe certain guidelines on e.g. inflation,debt ratios and central bank accountability, and on the other hand, capital can only be controlled through policy interventions up to a point. The choice of the Argentinegovernment, for instance, to maintain the peso’s peg to the dollar through 2001, despite itsglaring overvaluation, became ultimately an untenable strategy which was punished on international capital markets.
2.3.3 Industrial and competition policy
Industrial and competition policy are concerned less with the aggregate economy and morewith the behavior of individual consumers, firms and markets. As such its theoretical rootscan be found primarily in the field of microeconomics. Industrial policies are intended tomanage the decline of old industries and the rise of new ones, while competition policies are aimed at maintaining the intensity of competition (Johnson and Turner, 2000). By
27
Chapter Two
changing market structure, government can e.g. stimulate inter-firm rivalry (Dunning’sbusiness-analytic approach). Rivalry and competitiveness are the goals of competition andindustrial policies. Policies may be in the area of deregulation (to remove legalimpediments to competition), as well as a wide range of social, regional and R&Dprograms (to correct market failures; cf. McDonald and Potton, 1994). An example is therequirement of government approval of mergers and acquisitions (see Graham, 1997).McDonald and Potton (1994) distinguish three approaches to industrial and competitionpolicy, based on different rationales and assumptions of behavior: market-based policy,interventionalist policy and selective intervention. The first, also called negativeintervention, entails a minimalist approach to regulation, based on the assumption thatmarkets are best able to allocate resources. The second, also known as positive intervention, is based on the assumption that the government has a constructive role to playin the elimination of market failures. Selective intervention entails the strategic use ofpolicy to aid rising industries, based on the assumption that the competitive environment is imperfect. In that case limited government intervention can help firms gain a competitiveadvantage without permanently and extensively altering the market structure.The use of industrial and competition policy can differ widely across countries (and regions). Although there is an increasing tendency towards market-based policyorientation, intervention remains widespread as governments (despite the rhetoric of liberalization and deregulation) continue to protect or subsidize declining industries(McDonald and Potton, 1994). In the case of regional integration, national governmentsgenerally have to make concessions to partner countries in order to harmonize policies,which in turn alter the incentives and behavior of economic actors.Industrial and competition policies also encompass a host of policy terrains both positive(more government intervention) and negative (less government intervention). Governmentsmay agree to set up structural funds to aid in the development of weaker (micro)regionswithin member countries or agree on other subsidy structures (such as the CAP, or Common Agricultural Policy, in the European Union). Other structural marketinterventions can be found in the realm of e.g. labor market policies to help buffer therestructuring adjustment costs of integration as economic activity shifts.
2.3.4 International agreements and supranational policy
While governments largely have exclusive jurisdiction over policymaking in theaforementioned areas, such policies are sometimes insufficient for the achievement of certain goals. Additionally, they are indiscriminate to the extent that all economic actorsare exposed to the same regulations and operating environment. Yet some strategic goalsnecessitate international cooperation in the form of bilateral or multilateral agreements.Agreements can cover a wide range of mutually important issues, such as the use of eachother’s infrastructure, mail or telecommunications services, transport, and environmentaland social issues. Axelrod and Keohane identify reciprocity as one of the most important concepts indescribing the emergence of cooperation (Braithwaite and Drahos, 2000). Reciprocaladjustment, when actor interests drive them to an agreement on the same rule orconvergence of rules (Braithwaite and Drahos, 2000). ‘Non-reciprocal coordination iswhen actors back each others interests because they think they will get something out of it later, in different terms. Yet there is often a lack of differentiation between the interests
28
Integration theory and the ‘new regionalism’
and goals of different actors (Underhill, 1994). In neoclassical institutionalism, the origin and functioning of all types of institutions are explained as the result of the maximizingbehavior of rational individuals (Gilpin, 2001). Regime theory takes a more ‘idealist’approach to a non-hegemonial world, expecting convergence of expectations and behavior.Governments are not single-purpose unitary actors, often they are ambivalent and international agreements usually consist of a mixture of cooperative and conflictualbehavior (Underhill, 1994). Interests must not be over-generalized.Agreement does not, therefore, erase differences in interests among members. In fact itgenerally entails some kind of mutual concessions made by all parties, although some mayconcede more than others. In terms of specific issues, some members may share the majority view, or a common interest, while others are forced to yield. The ‘equilibrium’achieved on any given issue can change as new countries become party to an agreement, oras other circumstances change. This makes e.g. controlling membership expansion amechanism of regionalism strategies.
2.3.5 Dispute settlement procedures, sanctions and screens
Inherent to policy decisions, and the international agreements that substantiate thosedecisions, is the assumption that parties to such agreements will adhere to theirstipulations. This is, however, not always the case given that the agreement is not a directrepresentation of each member country’s individual interests. Supranational institution-building creates a compliance problem (Gilpin, 2001) generally addressed by disputesettlement procedures (DSPs). DSPs are central to the performance of internationalinstitutions (Mansfield and Milner, 1997). In regional integration terms, DSPs represent the degree of ‘legalization’ of a RIA (McCall Smith, 2000). This is a more explicitlypolitical dimension which implies that countries, in their international cooperation efforts, are primarily in pursuit of their own interests. Depending on the exigencies of the moment,it may or may not be in a given government’s interest to adhere to an agreement. Theorylooks at trade policy as a repeated game, where each country weighs the short term gain of deviating from its commitment against the longer-term loss implied by the futureimposition of punishing trigger strategies (i.e., adopted based on other actors’ past actions)by other countries (Ethier, 2001). Yet deviation has little value these days, where punishment can be immediate: in other words, the short term keeps getting shorter. Treaties can also be considered incomplete contracts (Ethier, 2001), which require thethreat of DSPs and sanctions to hold up. Dispute settlement procedures are in theory designed to limit unilateral action in breach of an agreement by means of the threat of sanctions. For international trade, for instance, theGATT/WTO provide the central provisions for disputes. Additionally, agreements or policies are often discriminate, and not aimed at all potential actors. In institutional theorythese are known as screens. Generally parties choose to negotiate rather than punish (ibid.).Ethier also argues that disputes are inherently bilateral and not multilateral. Underregionalism, however, the region itself can act, as in the case of the European Union. The European Commission is a party in 87 of the 244 disputes presented before the WTO from1995 through 2001. Disputes can be a political and an economic tool for achieving specific goals. Alongside motives of ‘leveling the playing field’ and ‘fighting unfair trade’ existmotives such as ‘retaliation’. Here is where reciprocity comes in (see above). Prusa andSkeath (2001) found in researching the motives behind the use of DSPs (in this case
29
Chapter Two
antidumping filings) considerable evidence of strategic motives for the use of antidumpingbeyond simple economic grievances.DSPs are not simply a matter of governments challenging other governments and theirpolicy actions. They are particularly aimed at the behavior of firms operating under thejurisdiction of, or legally seated in, a country party to the agreement. In the case of tradedisputes, governments are held accountable for the actions of the firm(s) accused ofbreaching the agreement. DSPs are thus a key example of how governments and businessactors interact in institutional development.
2.4 The outcomes of regionalism
Just as with typologies of regionalism origins, typologies of outcomes are quite revealing.Although the variety of outcome-related typologies is much greater than for origin-relatedtypologies, the distinction between economic and political outcomes remains the mostpervasive (see Table 2.3). Theories of economic outcomes are considerably more disputedand ideologically laden than theories of political outcomes, in part because economicoutcomes are more difficult to identify and isolate.
Table 2.3: Types of regionalism outcomes
Typology dimensions Primary operationalizations Examples
type of RIA # of policy areas (scope of cooperation) Hufbauer and Schott, 1994; Jovanovic, 1992; Balassa, 1961
positive vs. negative supranational institution-building vs. dismantlingof national barriers to trade
Mansfield and Milner, 1997
depth of integration degree to which policy sovereignty is ceded in a particular area of policymaking
Cable and Henderson, 1994
intensity of cooperation independent regional bodies, regional ministers cf. Ten Napel, 1998
openness openness to new membership, share of extra-regional trade in total trade
Bergsten, 1997; Bhagwati 1993
trade-creating vs. trade diverting
whether regional producers are lowest-costproducers in terms of world prices
Viner, 1950; see Winters, 1993 and 1999
investment-creating vs.investment-diverting
whether RIA distorts investment market through e.g. ‘tariff-jumping’ FDI
Kindleberger, 1966
economic asymmetry relative development levels McCall Smith, 2000; McGilvray, 2000
degree of legalization dispute settlement mechanisms Abbot, 1999; McCall Smith,2000
political asymmetry strength in international negotiations;
locus and number of ‘core’ countries and pluralist tendencies in decisionmaking
Cameron and Tomlin, 2002;
Van Tulder and Audet,forthcoming
2.4.1 Political outcomes of regionalism
Much of the literature addresses political and institutional outcomes, emphasizing variousdimensions which have thus far only rarely generated true taxonomies. Some authorsdistinguish between deep and shallow integration, referring to the extent of policycoordination, which is to some degree a question of subsidiarity (Cable and Henderson, 1994). Deep means that not only trade is liberalized formally, but also NTBs are addressed,like government procurement procedures, a clear surrender of sovereignty, liberalization
30
Integration theory and the ‘new regionalism’
beyond ‘request and offer’, and institutionalized DSPs. It should be noted that deep integration is not the same as harmonization. The harmonization of e.g. environmentalstandards in the case of NAFTA, for example, may be de facto a barrier to trade since they artificially eliminate cost disparities (ibid.). A similar axis is negative versus positiveintegration, which essentially distinguishes between the simple dismantling of barriers (supposedly in the interest of economic actors) and the actual building up of institutions (‘positive integration’) assumed to be primarily in the interest of political actors.The emphasis has been overwhelmingly on policy-level outcomes, described typically interms of the ‘scope’ of integration, or the number and type of policy areas subject to jointcoordination. This may involve i) barriers to trade and services; ii) restrictions oninvestment; iii) labor movement; iv) harmonization of monetary and fiscal policies; and v)the construction of supranational institutions (Hufbauer and Schott, 1994). Whereas theclassical distinction in RIAs has traditionally been between free trade areas (FTAs) and customs unions (CUs), the increasing complexity of regional integration can be demonstrated simply by reviewing successive attempts over the years to categorize RIAs. Balassa, in his classic work The Theory of Economic Integration (1961), was the first toexpand on a conceptual range of integration forms: the free trade area (FTA), the customsunion (CU), the common market (CM), the economic union (EU) and total economicintegration (EI). It is only recently that variations have been made to Balassa’s framework,primarily focused on the latter two forms (cf. McDonald and Dearden, 1994; Hoekman and Kostecki, 1995), largely a result of developments in the European Union. Dent (1997) redefined these as on the one hand economic and monetary union (EMU) and on the othereconomic and political union (EPU). Jovanovic (1992) introduced an additional two forms,the preferential trading agreement (PTA) and partial customs union (PCU), whichessentially are variations on the FTA and CU, respectively. A brief overview of the variousforms and their key characteristics follows in Table 2.4.Less ideologically colored typologies are e.g. those of a region’s ‘intensity’, referring tothe frequency of cooperation and the measures taken to ensure joint character, such as thenumber of ministers with a relevant portfolio and the frequency with which they meet.Similar categorizations can be made by size (number of members), level of economicdevelopment and terms of compliance, or durability. Compliance and durability are oftendescribed as the degree of legalization of a region (McCall Smith, 2000). Cameron and Tomlin (2002) take a more power-based perspective by addressing power asymmetries inregions, i.e. the extent to which a region’s members are more or less equal in terms ofbargaining power. Typologies deal primarily with institutional arrangements, while the real political significance of Regionalism remains largely speculative. On the one hand there is a debate on the nature of growth regimes; on the other hand on the hollowing out of thestate or even regulation in general, where unregulated gaps are left to the exploitation of market actors. Other debates center on the possibility of convergence between national institutional structures, and the impact of that convergence on national business systems or modes of accumulation (Whitley and Kristensen, 1996). Even political economy models(Winters, 1999 cites Levy, 1996 and Bhagwati and Panagariya, 1996) address the ability of a government to respond to e.g. exogenous shocks before and after integration. Ultimatelythis is simply a question of policy sovereignty. The more extensive the range of policycooperation and/or harmonization, the less liberty a given government has to dictate policyand the less ‘sovereign’ that government will be.
31

Chapter Two
Table 2.4: Main forms of regional integration and their characteristics
Form of RIA Main characteristics
PTAPreferential trade agreement
Mutual preferential treatment of signatories
Lower customs duties/tariffs than for non-signatories
PCUPartial customsunion
Application of a common external tariff (CET) against non-signatories
Intra-union customs duties/tariffs remain unchanged
FTAFree trade area
Removal of most customs duties/tariffs between signatories
Individual national tariff systems towards non-signatories remain in place
Local content measures (rules of origin) apply
CUCustoms union
Removal of most customs duties/tariffs between signatories
Application of a CET for non-signatories
CMCommon market
Removal of most customs duties/tariffs between signatories
Application of a CET against non-signatories
Free movement of factors of production (capital, goods, services and labor) between signatories
EMUEconomic and monetary union
Removal of most customs duties/tariffs between signatories
Application of a CET against non-signatories
Free movement of factors of production (capital, goods, services and labor) between signatories
Introduction of common currency
EPUEconomic and political union
Removal of most customs duties/tariffs between signatories
Application of a CET against non-signatories
Free movement of factors of production (capital, goods, services and labor)
Introduction of common currency
Common policies on broader issues, e.g. foreign policy and defense
Regionalism should not only be seen from the perspective of individual nation-states and cooperation/competition within a single region; the region itself can be seen as a collective actor on a global stage of national and supranational institutions. The example was alreadygiven of the European Commission (EC) as an actor in international trade disputes onbehalf of its member states. A proactive regional-level approach to trade disputes may infact be ‘protectionism with a polite face’, where companies employ the regional government to keep their competitors on the defensive instead of shielding themselvesbehind outright protectionist measures. Others worry that institutionalized regional-levelgovernments may create a ‘democratic deficit’. Hirst and Thompson (1999) argue, on theother hand, that regions can bolster democracy and that the EU will not become a ‘nation-state writ large’ (p. 231). But most argue in the context of the federal versus confederalstate: are policymakers democrats, or are they pragmatists trying to get the best deal?From a neoinstitutional perspective (Keohane, 1984), it could be argued that regionalism,as a surrogate for hegemony, facilitates the formation of even larger, supra-regionalregimes. Regional integration may lead to a ‘domino effect’ (Baldwin, 1993), or ‘bandwagon dynamism’ (Van Tulder and Audet, 2004). This is Mattli’s (1999b) ‘second integrative response’, namely that the fear of being locked out of integration gainsprecipitates me-too strategies in the form of competing regionalist initiatives. The ‘secondintegrative response, much like a realist interpretation of the ‘second wave’ of regionalism,assumes that bloc-formation would lead to parallel integration efforts (in essence a realist,intergovernmentalist approach). Winters (1999), however, suggests that an intergovernmental union would tend towards protectionism, because an intergovernmental
32
Integration theory and the ‘new regionalism’
construction is by its nature bureaucratic. In Winters’ argument, drawn on Messerlin(1983) and Scharpf (1988), incentives for bureaucrats tend towards protectionism and theinstitutional construction inherently draws influence away from voters and towards officialpreferences for administrative convenience.Realist, power-based analyses of regional integration reiterate the importance of historicaldevelopment: any given RIA cannot be studied in isolation, as it is a strategic response to a given global context. Sandholtz et al. (1992) take a similar geo-economic approach inwhich the strategic interrelationship between the Triad is emphasized, heralded by the endof the cold war and the decline of US hegemony. International competitiveness is thereforeseen as a security issue, with regionalism forming the basis for ‘peaceful’ economiccompetition instead of military competition. Cable and Henderson (1994), however, caution that tension between trade blocs may simply be the result of different standardsand rules, and not necessarily strategic competition. This word of caution only serves tounderscore the fact that the mainstream theories reviewed in Section 2.1 are largelyinadequate in their understanding of the political significance of regionalism, for they fail to explain the wide range of forms and outcomes of integration (Mattli, 1999b).
2.4.2 Economic outcomes of regionalism
The significance and meaning of economic outcomes, or the impact of RIAs on economicactivity, also remain shrouded in relative mystery. In traditional economics and International Business approaches, the focus is on the trade- and investment-creating anddiverting characteristics of an RIA. The rationale is rooted in the concept of the largermarket, which can reduce the market power of individual firms and has in turn a positiveeffect on competition and innovation, reducing prices and generating welfare benefits toconsumers. These are growth regimes based on productivity growth, achieved througheither a division of labor, technology, comparative advantage and specialization. Yetclassical economics approaches in particular introduce a simplistic understanding of economic activity as basic production processes without a geographic component.Economic activity is defined by assumptions of ‘markets’ and the ‘invisible hand’. Location of production is static, a matter only of factor endowments, with additional markets serviced by exports.Returning to the list of types of RIA, the economic impact anticipated per type (Table 2.5)can be examined. The ‘shallowest’ form of integration, the preferential trade agreement(PTA), is expected to lead to increased trade between partners. Tariff barrier reductiontranslates directly into lower costs for consumers, as the costs of transporting goods across borders falls. As demand increases in response to lower cost, production increases. Areallocation of resources follows along lines of comparative advantage, and increasedspecialization through the potential for scale economies, which allows costs to fall again (a virtuous cycle of growth). Assumes elastic demand, markets clear, uniform tastes, smallnumber of products etc. In addition, goods can be purchased from a larger number of sources as suppliers in other countries become attractive through the reduction of cross-border transport costs. This reduces the monopoly power of a country’s firms in thatcountry’s markets (McDonald, 1994).
33
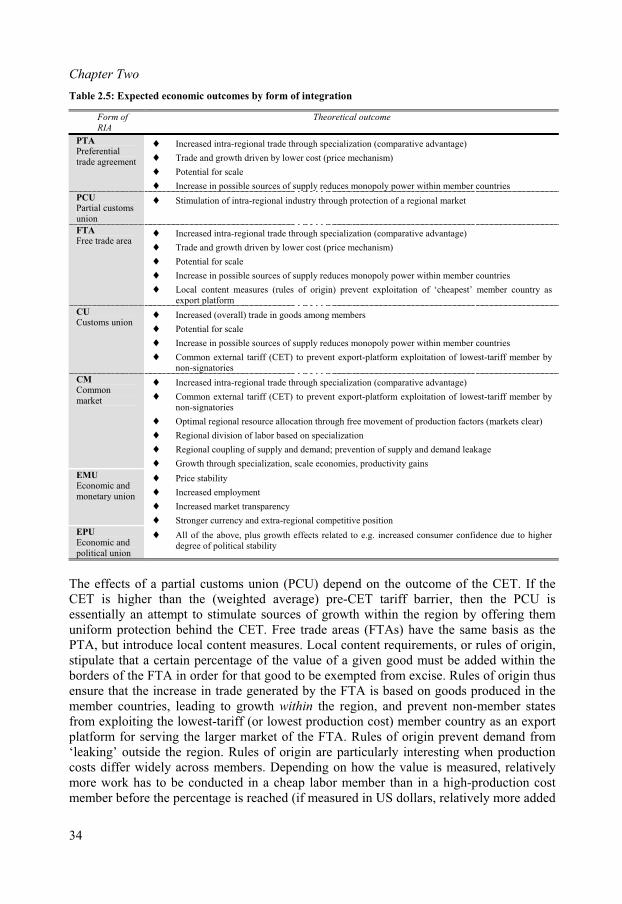
Chapter Two
Table 2.5: Expected economic outcomes by form of integration
Form of
RIA
Theoretical outcome
PTAPreferentialtrade agreement
Increased intra-regional trade through specialization (comparative advantage)
Trade and growth driven by lower cost (price mechanism)
Potential for scale
Increase in possible sources of supply reduces monopoly power within member countries
PCUPartial customsunion
Stimulation of intra-regional industry through protection of a regional market
FTAFree trade area
Increased intra-regional trade through specialization (comparative advantage)
Trade and growth driven by lower cost (price mechanism)
Potential for scale
Increase in possible sources of supply reduces monopoly power within member countries
Local content measures (rules of origin) prevent exploitation of ‘cheapest’ member country as export platform
CUCustoms union
Increased (overall) trade in goods among members
Potential for scale
Increase in possible sources of supply reduces monopoly power within member countries
Common external tariff (CET) to prevent export-platform exploitation of lowest-tariff member bynon-signatories
CMCommonmarket
Increased intra-regional trade through specialization (comparative advantage)
Common external tariff (CET) to prevent export-platform exploitation of lowest-tariff member bynon-signatories
Optimal regional resource allocation through free movement of production factors (markets clear)
Regional division of labor based on specialization
Regional coupling of supply and demand; prevention of supply and demand leakage
Growth through specialization, scale economies, productivity gains
EMUEconomic and monetary union
Price stability
Increased employment
Increased market transparency
Stronger currency and extra-regional competitive position
EPUEconomic and political union
All of the above, plus growth effects related to e.g. increased consumer confidence due to higherdegree of political stability
The effects of a partial customs union (PCU) depend on the outcome of the CET. If theCET is higher than the (weighted average) pre-CET tariff barrier, then the PCU is essentially an attempt to stimulate sources of growth within the region by offering themuniform protection behind the CET. Free trade areas (FTAs) have the same basis as thePTA, but introduce local content measures. Local content requirements, or rules of origin,stipulate that a certain percentage of the value of a given good must be added within theborders of the FTA in order for that good to be exempted from excise. Rules of origin thusensure that the increase in trade generated by the FTA is based on goods produced in themember countries, leading to growth within the region, and prevent non-member statesfrom exploiting the lowest-tariff (or lowest production cost) member country as an exportplatform for serving the larger market of the FTA. Rules of origin prevent demand from‘leaking’ outside the region. Rules of origin are particularly interesting when productioncosts differ widely across members. Depending on how the value is measured, relativelymore work has to be conducted in a cheap labor member than in a high-production costmember before the percentage is reached (if measured in US dollars, relatively more added
34
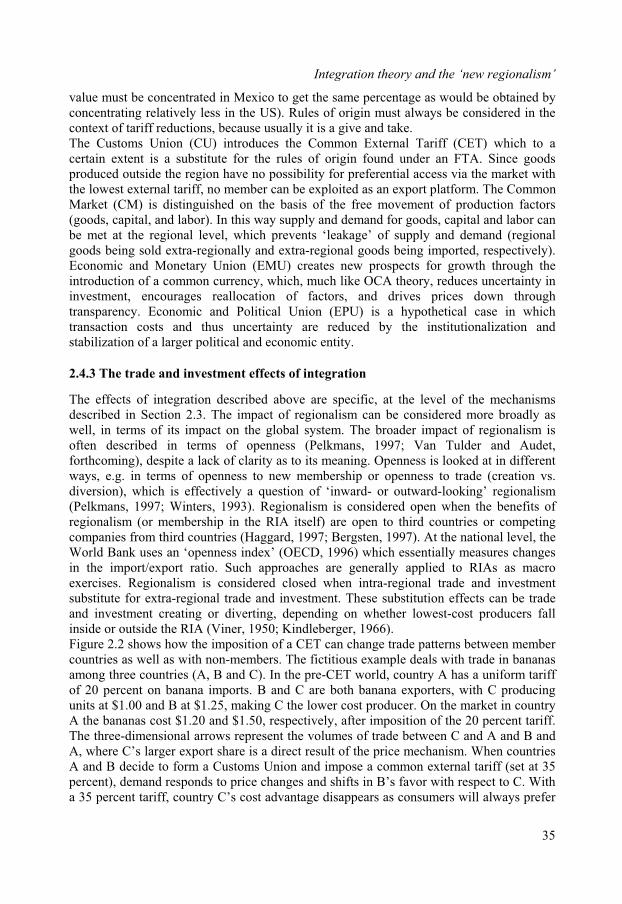
Integration theory and the ‘new regionalism’
value must be concentrated in Mexico to get the same percentage as would be obtained byconcentrating relatively less in the US). Rules of origin must always be considered in thecontext of tariff reductions, because usually it is a give and take.The Customs Union (CU) introduces the Common External Tariff (CET) which to a certain extent is a substitute for the rules of origin found under an FTA. Since goods produced outside the region have no possibility for preferential access via the market with the lowest external tariff, no member can be exploited as an export platform. The CommonMarket (CM) is distinguished on the basis of the free movement of production factors(goods, capital, and labor). In this way supply and demand for goods, capital and labor can be met at the regional level, which prevents ‘leakage’ of supply and demand (regionalgoods being sold extra-regionally and extra-regional goods being imported, respectively).Economic and Monetary Union (EMU) creates new prospects for growth through theintroduction of a common currency, which, much like OCA theory, reduces uncertainty ininvestment, encourages reallocation of factors, and drives prices down throughtransparency. Economic and Political Union (EPU) is a hypothetical case in whichtransaction costs and thus uncertainty are reduced by the institutionalization andstabilization of a larger political and economic entity.
2.4.3 The trade and investment effects of integration
The effects of integration described above are specific, at the level of the mechanismsdescribed in Section 2.3. The impact of regionalism can be considered more broadly as well, in terms of its impact on the global system. The broader impact of regionalism isoften described in terms of openness (Pelkmans, 1997; Van Tulder and Audet,forthcoming), despite a lack of clarity as to its meaning. Openness is looked at in differentways, e.g. in terms of openness to new membership or openness to trade (creation vs. diversion), which is effectively a question of ‘inward- or outward-looking’ regionalism(Pelkmans, 1997; Winters, 1993). Regionalism is considered open when the benefits ofregionalism (or membership in the RIA itself) are open to third countries or competingcompanies from third countries (Haggard, 1997; Bergsten, 1997). At the national level, theWorld Bank uses an ‘openness index’ (OECD, 1996) which essentially measures changes in the import/export ratio. Such approaches are generally applied to RIAs as macroexercises. Regionalism is considered closed when intra-regional trade and investmentsubstitute for extra-regional trade and investment. These substitution effects can be tradeand investment creating or diverting, depending on whether lowest-cost producers fallinside or outside the RIA (Viner, 1950; Kindleberger, 1966).Figure 2.2 shows how the imposition of a CET can change trade patterns between membercountries as well as with non-members. The fictitious example deals with trade in bananas among three countries (A, B and C). In the pre-CET world, country A has a uniform tariffof 20 percent on banana imports. B and C are both banana exporters, with C producingunits at $1.00 and B at $1.25, making C the lower cost producer. On the market in countryA the bananas cost $1.20 and $1.50, respectively, after imposition of the 20 percent tariff.The three-dimensional arrows represent the volumes of trade between C and A and B andA, where C’s larger export share is a direct result of the price mechanism. When countriesA and B decide to form a Customs Union and impose a common external tariff (set at 35percent), demand responds to price changes and shifts in B’s favor with respect to C. Witha 35 percent tariff, country C’s cost advantage disappears as consumers will always prefer
35
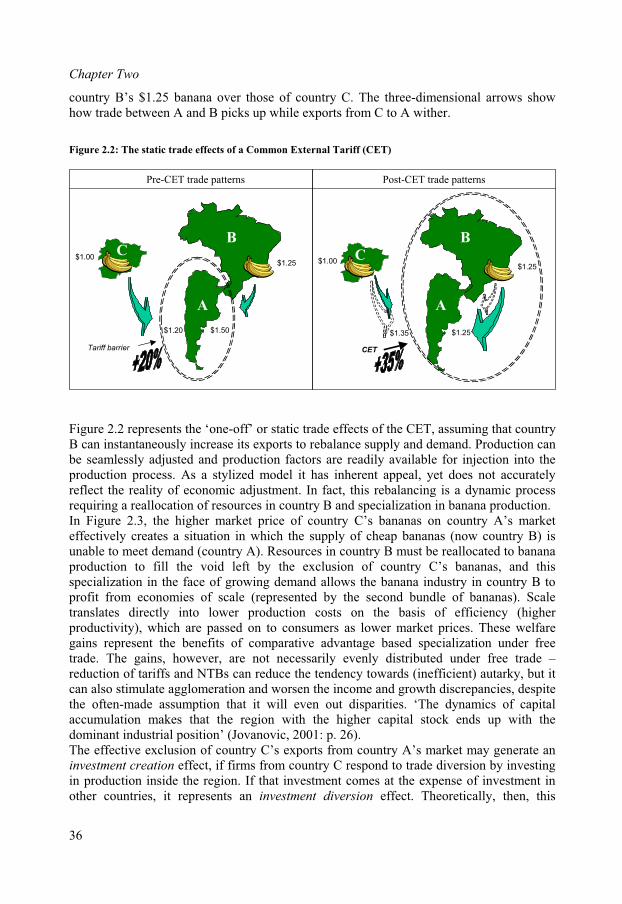
Chapter Two
country B’s $1.25 banana over those of country C. The three-dimensional arrows show how trade between A and B picks up while exports from C to A wither.
Figure 2.2: The static trade effects of a Common External Tariff (CET)
$1.25
$1.25
CET
$1.00
$1.35
$1.25
$1.50
Tariff barrier
$1.00
$1.20
Pre-CET trade patterns Post-CET trade patterns
B
A
C CB
A
Figure 2.2 represents the ‘one-off’ or static trade effects of the CET, assuming that countryB can instantaneously increase its exports to rebalance supply and demand. Production can be seamlessly adjusted and production factors are readily available for injection into theproduction process. As a stylized model it has inherent appeal, yet does not accuratelyreflect the reality of economic adjustment. In fact, this rebalancing is a dynamic processrequiring a reallocation of resources in country B and specialization in banana production.In Figure 2.3, the higher market price of country C’s bananas on country A’s marketeffectively creates a situation in which the supply of cheap bananas (now country B) isunable to meet demand (country A). Resources in country B must be reallocated to bananaproduction to fill the void left by the exclusion of country C’s bananas, and this specialization in the face of growing demand allows the banana industry in country B toprofit from economies of scale (represented by the second bundle of bananas). Scaletranslates directly into lower production costs on the basis of efficiency (higherproductivity), which are passed on to consumers as lower market prices. These welfaregains represent the benefits of comparative advantage based specialization under free trade. The gains, however, are not necessarily evenly distributed under free trade –reduction of tariffs and NTBs can reduce the tendency towards (inefficient) autarky, but itcan also stimulate agglomeration and worsen the income and growth discrepancies, despitethe often-made assumption that it will even out disparities. ‘The dynamics of capitalaccumulation makes that the region with the higher capital stock ends up with the dominant industrial position’ (Jovanovic, 2001: p. 26). The effective exclusion of country C’s exports from country A’s market may generate aninvestment creation effect, if firms from country C respond to trade diversion by investingin production inside the region. If that investment comes at the expense of investment inother countries, it represents an investment diversion effect. Theoretically, then, this
36
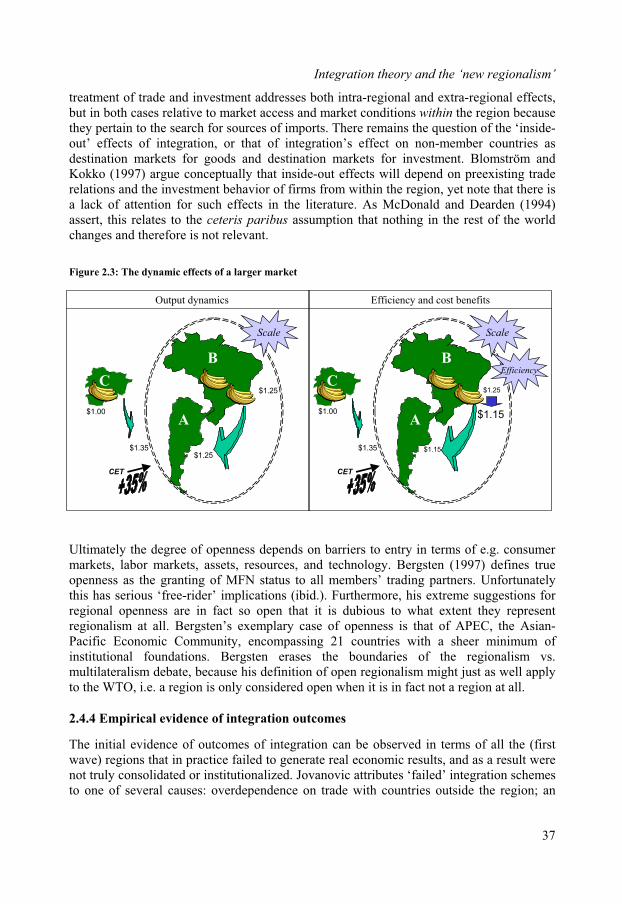
Integration theory and the ‘new regionalism’
treatment of trade and investment addresses both intra-regional and extra-regional effects,but in both cases relative to market access and market conditions within the region because they pertain to the search for sources of imports. There remains the question of the ‘inside-out’ effects of integration, or that of integration’s effect on non-member countries as destination markets for goods and destination markets for investment. Blomström andKokko (1997) argue conceptually that inside-out effects will depend on preexisting traderelations and the investment behavior of firms from within the region, yet note that there isa lack of attention for such effects in the literature. As McDonald and Dearden (1994)assert, this relates to the ceteris paribus assumption that nothing in the rest of the worldchanges and therefore is not relevant.
Figure 2.3: The dynamic effects of a larger market
$1.25
$1.25
CET
$1.00
$1.35
Scale
Output dynamics Efficiency and cost benefits
$1.25
$1.15
$1.15
CET
$1.00
$1.35
Scale
EfficiencyB
A
C C
B
A
Ultimately the degree of openness depends on barriers to entry in terms of e.g. consumermarkets, labor markets, assets, resources, and technology. Bergsten (1997) defines trueopenness as the granting of MFN status to all members’ trading partners. Unfortunatelythis has serious ‘free-rider’ implications (ibid.). Furthermore, his extreme suggestions for regional openness are in fact so open that it is dubious to what extent they representregionalism at all. Bergsten’s exemplary case of openness is that of APEC, the Asian-Pacific Economic Community, encompassing 21 countries with a sheer minimum ofinstitutional foundations. Bergsten erases the boundaries of the regionalism vs.multilateralism debate, because his definition of open regionalism might just as well apply to the WTO, i.e. a region is only considered open when it is in fact not a region at all.
2.4.4 Empirical evidence of integration outcomes
The initial evidence of outcomes of integration can be observed in terms of all the (firstwave) regions that in practice failed to generate real economic results, and as a result were not truly consolidated or institutionalized. Jovanovic attributes ‘failed’ integration schemesto one of several causes: overdependence on trade with countries outside the region; an
37
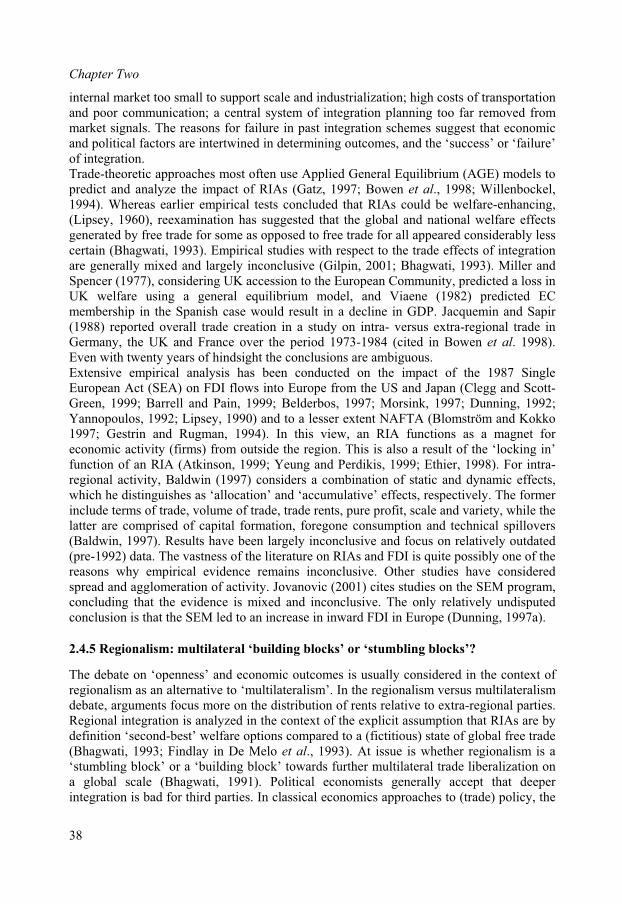
Chapter Two
internal market too small to support scale and industrialization; high costs of transportationand poor communication; a central system of integration planning too far removed frommarket signals. The reasons for failure in past integration schemes suggest that economicand political factors are intertwined in determining outcomes, and the ‘success’ or ‘failure’ of integration.Trade-theoretic approaches most often use Applied General Equilibrium (AGE) models topredict and analyze the impact of RIAs (Gatz, 1997; Bowen et al., 1998; Willenbockel,1994). Whereas earlier empirical tests concluded that RIAs could be welfare-enhancing,(Lipsey, 1960), reexamination has suggested that the global and national welfare effectsgenerated by free trade for some as opposed to free trade for all appeared considerably lesscertain (Bhagwati, 1993). Empirical studies with respect to the trade effects of integrationare generally mixed and largely inconclusive (Gilpin, 2001; Bhagwati, 1993). Miller andSpencer (1977), considering UK accession to the European Community, predicted a loss in UK welfare using a general equilibrium model, and Viaene (1982) predicted EC membership in the Spanish case would result in a decline in GDP. Jacquemin and Sapir(1988) reported overall trade creation in a study on intra- versus extra-regional trade inGermany, the UK and France over the period 1973-1984 (cited in Bowen et al. 1998). Even with twenty years of hindsight the conclusions are ambiguous.Extensive empirical analysis has been conducted on the impact of the 1987 SingleEuropean Act (SEA) on FDI flows into Europe from the US and Japan (Clegg and Scott-Green, 1999; Barrell and Pain, 1999; Belderbos, 1997; Morsink, 1997; Dunning, 1992;Yannopoulos, 1992; Lipsey, 1990) and to a lesser extent NAFTA (Blomström and Kokko1997; Gestrin and Rugman, 1994). In this view, an RIA functions as a magnet for economic activity (firms) from outside the region. This is also a result of the ‘locking in’function of an RIA (Atkinson, 1999; Yeung and Perdikis, 1999; Ethier, 1998). For intra-regional activity, Baldwin (1997) considers a combination of static and dynamic effects,which he distinguishes as ‘allocation’ and ‘accumulative’ effects, respectively. The formerinclude terms of trade, volume of trade, trade rents, pure profit, scale and variety, while thelatter are comprised of capital formation, foregone consumption and technical spillovers (Baldwin, 1997). Results have been largely inconclusive and focus on relatively outdated(pre-1992) data. The vastness of the literature on RIAs and FDI is quite possibly one of the reasons why empirical evidence remains inconclusive. Other studies have consideredspread and agglomeration of activity. Jovanovic (2001) cites studies on the SEM program,concluding that the evidence is mixed and inconclusive. The only relatively undisputedconclusion is that the SEM led to an increase in inward FDI in Europe (Dunning, 1997a).
2.4.5 Regionalism: multilateral ‘building blocks’ or ‘stumbling blocks’?
The debate on ‘openness’ and economic outcomes is usually considered in the context of regionalism as an alternative to ‘multilateralism’. In the regionalism versus multilateralismdebate, arguments focus more on the distribution of rents relative to extra-regional parties.Regional integration is analyzed in the context of the explicit assumption that RIAs are bydefinition ‘second-best’ welfare options compared to a (fictitious) state of global free trade(Bhagwati, 1993; Findlay in De Melo et al., 1993). At issue is whether regionalism is a‘stumbling block’ or a ‘building block’ towards further multilateral trade liberalization ona global scale (Bhagwati, 1991). Political economists generally accept that deeper integration is bad for third parties. In classical economics approaches to (trade) policy, the
38

Integration theory and the ‘new regionalism’
more and the freer the trade, the better. The welfare effects of free trade are good for everyone; ‘the rising tide of free trade lifts all boats’ (Leamer, 1995). In the neoliberalview, liberalization of world trade and investment is about benefits, not costs, yet critics emphasize the costs of globalization, such as growing income inequality both among andwithin nations, unemployment, environmental degradation and the negative impacts ofunregulated financial flows on (particularly less developed) national economies (Gilpin,2001). Similar arguments were made in the early functionalist approaches, which saw nolimit to integrative tendencies, particularly the less governments intervened (cf. Mitrany,1975).More cautious approaches have demonstrated that limitations to multilateral free trade (i.e., trade blocs) can theoretically be constructed such that they are not harmful to non-members. Kemp and Wan (1976) broke new ground in this regard as the first generallyaccepted argumentation that RIAs were not necessarily inherently discriminatory to third parties. Some authors see macro-regionalism as ‘one facet’ of globalization, in whichregionalism is a form of multilateralism, and not necessarily contradictory (Cox, 1994).The same issues play out in the debate on ‘Triadization’, i.e. whether trade and investmentis increasingly centered on the world’s dominant three trade ‘blocs’, the EU, NAFTA and Japan/ASEAN (Rugman, 2000) or spreading to other regions as well (Proff, 2002).Regionalism and multilateralism, however, can be mutually reinforcing but stillcontradictory. The WTO (1995) admits that the perceived threat of regionalism played a key role in bringing the Uruguay Round of negotiations to a successful conclusion. Haggard adds that it is theoretically possible that regional arrangements ‘are beingnegotiated by governments which already pursue relatively free trade policies on a multilateral basis, and in which free trade interests are strong. In such a setting, thedynamic with outsiders changes significantly. The source of discrimination is not so muchthe wedge between internal free trade and tariffs toward third parties, but the advantagesthat accrue to the community from other forms of policy coordination’ (Haggard, 1997: 30).However, Haggard (1997) also points out two reasons why the Kemp and Wan argumentsmay be flawed. First, because countries may be tempted to exploit the market power that is created by such a region, and second, as a consequence of the political bargains required to reach the regional agreement in the first place. In terms of the latter case, trade creation is apolitical liability, whereas trade diversion services producer groups within the region. Theory aside, regionalism in a historical perspective has almost always meant a loss of market access for external partners (Mattli, 1999b). Regionalism in the 1930s, for instance, is commonly associated with protection and conflict. Bergsten (1997) points out theexamples of the British Commonwealth System of Preferences as well as the closedeconomic zone created in central Europe by Nazi Germany. It is not clear from hisarguments, however, whether closed regionalism in this sense is considered a stabilizingfactor (e.g. the British Commonwealth) or destabilizing factor (e.g. Nazi Germany).Bergsten also emphasizes the fact that in recent regionalist experiments, trade creation has generally exceeded trade diversion. Furthermore, RIAs can be a low threshold stepping stone for (especially developing) countries that wish to liberalize, and RIAs create an incentive for other countries to follow suit and ‘ratchet up’ the global process (Bergsten,1997: 3). Expectations of what other actors will do are crucial. This depends on whether they are already members of a regional agreement. According to Winters (1999), countries have
39
Chapter Two
three possible responses to the regionalism of others: either to join an existing group, tocreate a new group, or to pursue multilateral liberalization (cf. also the precedingdiscussion on the ‘ideal number of members’ and ‘bad regionalism’). The observation thatintegration has generally arisen from a backdrop of economic hardship and difficulties (Mattli, 1999a) reinforces the argument that self-interested behavior underlies theformation, and therefore the logic, of regionalism. As the international economy hasbecome more closely integrated, regional groupings of states have increased theircooperation in order to strengthen their autonomy, improve their bargaining positions, and promote other political and economic objectives (Gilpin 2001, Balassa 1961). In this way regionalism can be seen as a form of global oligopolistic competition (market power), in which regions, at least partly, can be seen as a strategic response to regional steps by otherblocs (Prakash and Hart, 1999).Winters’ (1999) response to the ‘regionalism vs. multilateralism’ question is simply ‘we don’t know yet’ (p. 7). He bases his argument on three observations: 1) that models go both ways and are too abstract to be considered realistic; 2) we are faced with a shortage ofreal-life examples; and 3) no-one seems able to offer a functional definition ofmultilateralism. Bergsten emphasizes the fact that ultimately governments themselves,given the constraints of domestic and international interests, and the expected behavior of economic actors and other governments, have the ability to determine whether regionalismwill result in greater multilateral liberalization or not: ‘the inherent dynamics of the processseem to be sufficiently balanced that the policy decisions of the participants themselves are determinative’ (Bergsten, 1997: 3).
2.5 Missing links
Mainstream approaches, besides being rooted in different fields of social science,demonstrate a wide range of theoretical assumptions and points of departure. Sometheories focus on the causes of regional integration, and others on its effects. Yet none hasgenerated conclusive evidence, and none has led to a convincing general theory of thephenomenon. This is even more glaring in light of the questions in regionalism today. Whyand how do developing and developed countries integrate? Why is there such a wide rangeof institutional outcomes? Why is there a wider range of policy issues beyond those of trade? Why are extra-regional issues still ignored, though they seem more important than ever? Why are the strategic aspects of regionalism still ‘masked’ behind classical economic arguments? The inability to answer questions such as these has to do with threeinterrelated key ‘missing links’ in the literature: first, a lack of attention for firm-levelstrategies with respect to regionalism; second, an overemphasis on ‘intrinsic’ argumentsfor integration and a tendency to downplay ‘extrinsic’ motivations; and thirdly, a generalfailure to compare and contrast the rationale of government policymakers (intentions) withthe actual restructuring behavior of firms.
2.5.1 Firm-level strategies with respect to regionalism
Traditional approaches to regional integration based on Viner (1950), Meade (1956) andBalassa (1961) overemphasize macro-level trade-theoretical elements (Dunning, 1997;Markusen, 1995; Findlay, 1993), while the true micro issues (i.e., the significance ofregional integration for individual companies), even in ex post analyses, remain
40
Integration theory and the ‘new regionalism’
understudied (Davies et al., 1999; Phelps, 1997; Pani , 1991). These largely economics-oriented approaches introduce a simplistic understanding of economic activity without a geographic component, in which company behavior is derived from assumptions of ‘markets’ and the ‘invisible hand’. Although more recent theories such as Strategic Trade Theory (Krugman, 1986) and economic variants of political economy (Panagariya and Findlay, 1996; Levy, 2000) make more effort to explicate both firm and governmentbehavior, they remain highly stylized. Foreign Direct Investment (FDI)-centric ‘dynamic’approaches (e.g. Blomström and Kokko, 1997; Cantwell, 1993; Yannopoulos, 1992) thatbuild on Kindleberger (1966) highlight both macro and micro motives in regionalintegration, but assume by default that macro and micro actors are subject to identicalproblems and solutions.In reality, the assumption that micro behavior is simply a disaggregate of macro trends (orthe converse) reflects once again the bias of a one-dimensional approach. Vital issues of e.g. strategy and underlying market structure in traditional trade and FDI approaches remain a macro-level exercise based on abstract models far removed from the reality ofindividual companies (see Bowen et al., 1998; Willenbockel, 1994). This is at least tosome degree related to the debate on the substitutability between trade and investment,which in classical economic approaches and many policy models are still often assumed tobe perfect substitutes. Some authors, on the other hand, suggest that trade and investmentmay be complementary instead of substitutable (Molle and Morsink, 1991; Blomström and Kokko, 1997) or in fact both (Blomström et al., 1998). As a result theory and empiricalevidence about the net effects of RIAs on investment lead to no unambiguous conclusions.The lack of conviction is related to the lack of concreteness in establishing the relationshipbetween trade and investment, which itself is a consequence of the abstract nature ofworking with such highly aggregated concepts to make firm-level inferences. Ultimatelythe relationship between trade and investment depends on the motives of both, which arebest analyzed at the firm level (Goedegebuure and Van Tulder, forthcoming).The persistent theoretical and empirical ambiguity can be seen as evidence that macroquestions do not necessarily lead to micro answers. In the words of Braithwaite and Drahos (2000, p. 21), ‘macro-macro theory tends to use abstract categories of explanation whichappear to be more universal and seemingly allow theories to sweep across a larger range of phenomena’. The macro-level focus in mainstream theories of regional integration issymptomatic of the lack of explicit attention for both economic and political actors in the process and outcomes of integration. Regional integration is rarely placed in any kind of context and the ‘hows and whys’ are not addressed (Hettne and Söderbaum, 2000). Someapproaches, like the New Economic Geography (NEG), emphasize firm-level responses to‘regionalizing’ forces, but as in more traditional trade and FDI literature, companies are highly stylized, seen as rational, economic and without body. Moreover, it fails to address systematically the role of companies in the shaping of policy outcomes, i.e. the interactionbetween macro and micro actors in regionalizing processes. An understanding ofregionalism requires the recognition of firms and governments as strategic actors inregionalism processes, with desired and expected outcomes, and explicit incorporation intoframeworks and models.
41
Chapter Two
2.5.2 Intrinsic and extrinsic motives for regionalism strategies
Given that governments and firms are strategic actors in processes of internationalrestructuring, their interests and behavior are best considered from a strategic point of view. Political economy, strategic trade policy and public choice theories contribute muchto our understanding of strategic interests, but tend to overemphasize trade, and sacrificeplausibility and real-world applicability for rigor. In most economics approaches, strategic considerations such as market power are often left out (Sachwald, 1993), in addition toeconomically ‘sub-optimal’ behavior like dumping and preemption (Gilpin, 2001), and location remains a neglected factor (Dunning, 1998). Thus the literature tends to overemphasize the ‘bright side’ of firm behavior (Eden and Lenway, 2001).Political science approaches more specifically address actors and the context of actorbehavior. Classic state-centric perspectives on regional integration likeintergovernmentalism (Moravcsik, 1998) see states as actors and allow for the notion ofsuboptimal outcomes, yet oversimplify the role and interests of economic actors (the‘demand’ for integration as opposed to the ‘supply’ of integration on the policy side; cf.Mattli, 1999b) and do not explore them empirically. Neoinstitutionalism (Keohane, 1984) views the origin and functioning of all types of institutions as the result of the welfare-maximizing behavior of rational individuals attempting to solve collective action problems,but despite its behavioral insights has not yet led to a specific theory of regional integration(Gilpin, 2001). (Neo)functionalism (Mitrany, 1975; Haas, 1958), on the other hand, sees states and governments as obstacles to what would otherwise be a bottom-up process for solving coordination problems, but emphasize transnational society as the major drivingforce behind integration while underplaying the significance, and potentially suboptimalbehavior, of companies as actors.Therefore, the logic of integration as explained by the mainstream theories reveals anoveremphasis on ‘intrinsic’ drivers of firm and government behavior and neglects‘extrinsic’ motivations. Intrinsic drivers refer to efficiency-oriented, rational, economicconsiderations determined by relating the state of affairs internal to the actor (e.g.production processes) to some often idealized ‘Pareto optimum’. Extrinsic motivations, onthe other hand, relate actor-internal issues to the environment or the behavior of otheractors. The search for extrinsic motivations of internationalization is part of anInternational Political Economy tradition. Firm strategic elements involve e.g. the possibility of lobbying not only for a decrease in intra-regional barriers, but also for anincrease in extra-regional barriers. Bargaining models of various types (Kobrin, 1984;Encarnation and Wells, 1986; Doz, 1986; Stopford and Strange, 1991) have addressedpower-based motives for interaction, particularly between MNEs and developing countrygovernments, but not yet in the context of regional integration. Extrinsic motives forcompany and policy strategy have been relatively ignored since the 1960s and 70s, whenHymer (1976) and others addressed the collusive, anti-competitive behavior of US multinationals. The International Business literature has focused largely on intrinsicmotivations since the 1980s, emphasizing internalization of markets, economies of scaleand scope, transaction costs and other internal coordination problems. In the same period,macro-economic and political science theories revealed a comparable logic, focusing onwelfare gains from reduced trade barriers, efficiency effects and increased intra-regional competition.
42
Integration theory and the ‘new regionalism’
Table 2.6, drawing on the origins of Regionalism as reviewed in Section 2.2, categorizesthe motivations of governments for integration as intrinsic or extrinsic. Integration, forinstance, can be motivated by the desire to link supply and demand at the regional level,lowering costs and freeing up resources for new growth and enhanced welfare. At the sametime, integration may be motivated by a desire to enhance bargaining power in interactionswith other states or regions. Additionally, Table 2.6 suggests that companies may favor regional integration on the grounds of intrinsic and extrinsic motivations as well, buildingon the ‘missing link’ identified above in section 2.5.1. Intrinsically, companies may seeadvantages in terms of reduced uncertainty and lower transaction costs. Extrinsically,regional integration can de facto raise barriers to entry for competitors from outside theregion, or even enhance a firm’s competitive position relative to others within the region.Ultimately, intrinsic goals do not themselves exist in a vacuum; rather, they are oftenpursued to serve extrinsically-driven ambitions. Similarly, extrinsically-oriented strategiesmay be pursued to avoid pursuing intrinsic strategies such as rationalization or downsizing.
Table 2.6: Examples of extrinsic and intrinsic motives behind regional integration
Governments Companies
Intrinsic intent
efficiencyoriented
neo-liberal policy orientation
reduce barriers to regional trade
increase intra-regional competition
couple supply and demand at regional level to create virtuous growth regimes
more efficient resource allocation through regional division of labor and larger ‘homemarket’
economies of scale and scope
mkt internalization; lower transaction costs
technical spill-overs
more resources available for innovation
Extrinsic intent
bargaining-power oriented
improve bilateral bargaining position vis à vis other regions or hegemonic powers
improve bargaining position in multilateral forums
recapture lost ground of national autonomy
create institutional counterweight to cross-border activity of companies
raise barriers to entry
create ‘defensible’ institutions and / or governance regimes
enhance competitive position (withoutdownsizing)
springboard for extra-regional expansion to pressure stakeholders
regional ‘location tournaments’ to pressure stakeholders
2.5.3 The relationship between policy intent and realized company strategies
By and large, the literature either focuses on the origins of regional integration andneglects its effects, or expounds (largely theoretically) on the impact of integration whileignoring the origins. It is increasingly acknowledged that explanations provided by thedominant politically-oriented schools of thought, neofunctionalism and intergovernmentalism, are in themselves insufficient (Mattli, 1999; Cowles, 1995) and have generated only unconvincing attempts at synthesis (Branch and Øhrgaard, 1999; see e.g. Cameron, 1992 and Moravcsik, 1993). Political approaches, in their enthusiasm to understand the process of regionalism, are often ‘far too vague on the question of whatpurpose a process serves if it is not to generate outcomes’ (Winters, 1999: 9).In most economics approaches, RIAs are treated as exogenous, or simply a result of anatural, deterministic tendency towards integration based on rational economic behavior.Regional integration is rarely placed in any kind of context and the ‘hows and whys’ arenot addressed (Hettne and Söderbaum, 2000), specifically in terms of government roles
43
Chapter Two
(Dunning, 1997b). Where regional integration is treated as a strategic issue, the motivesand dynamics of its genesis are simplistic, and the role of economic actors is underdefined.In other cases it is generally associated with a positivist strategy motivated either by thedesire to increase national and regional power, or to overcome market imperfections andenhance welfare in general. Explanations which emphasize domestic interests trying toshift rents in their own favor do not take into account costly exercises like the EU (Gilpin,2001).Finally, attempts at integrating insights from political science approaches with insightsfrom economics approaches are few and far between (see e.g. Baldwin, 1996). The debateon policy-induced integration versus integration stemming from economic forces(Mansfield and Milner, 1999) may also be of limited use in understanding the impact of true integration, because true integration implies policy cooperation as well as economicrestructuring. An understanding of the phenomenon requires an appreciation for theintentions of the policymakers as well as the realized changes in the organization of economic activity by firms. This requires some perspectives on the way policy is intendedto impact firms, what the assumptions exist among governments regarding the drivers of firm behavior and responses to policy stimuli, as well as attention for the nature ofgovernment – firm interaction. International restructuring, however, is not limited only tothose issues that governments consider to be on the agenda for discussion with thegovernments of other states (Strange, 1997a). Firms have strategic considerations of theirown that governments may or may not take into account. As a result, political and economic actors can have different, and sometimes conflicting, strategic motivations.Hence governments, in their attempt to manage economic behavior through the building of institutions, risk anticipating different strategic behavior than in reality takes place, suchthat realized restructuring outcomes may differ from those expected by policymakers.
44
3. UNDERSTANDING THE DYNAMICS OF REGIONALISM
This chapter redresses the missing links in understanding the particular dynamics of regionalism identified in Chapter 2. The first two sections propose ingredients for a moreholistic approach to the phenomenon of regionalism, resting on the tension that existsbetween the strategies of governments and ‘core companies’, the key economic actorsinvolved in international restructuring. Section 3.3 explores the logic of governmentregulation in the spatial organization of economic activity, and section 3.4 discusses someof the issues that determine government policy preferences with regard to internationalinstitution-building in general and regionalism in particular. Section 3.5 explores differentlevels of policy interests and develops a new typology of RIA policy strategies thatgoverns both intentions and realized outcomes. The chapter concludes in 3.6 by paving theway for integrating the policy-level typology with one at the core company level (Chapter4).
3.1 Towards an integrative, macro-micro approach
Understanding the origins and impact of regional integration is quite complex. Regionalintegration is both a matter of policy shifts and changing patterns of economic activity, and must be analyzed as such. Carr (1951) observed that ‘the science of economicspresupposes a given political order, and cannot be profitably studied in isolation frompolitics’ (quoted in Gilpin 1975: 37). Waltz (1979) argues that economic theories tell us something about politics and political theories tell us something about economics. The study of economic and political forces interacting to shape the economic and political orderrequires the application of institutional perspectives. ‘An analysis of regional integrationthat neglects to incorporate institutional elements risks being empty. [One] must considerthe reciprocal relationship between economic and politico-institutional factors’ (Mattli, 1999: 7). If regional integration is seen as an institution-building exercise with both a process and outcome side, a framework needs to be developed that addresses the actorsinvolved in the process, their strategic interests, the nature of their interaction, and allowsfor evaluation of the outcomes.
3.1.1 Actors and strategy in supranational institution-building
An institution is ‘an ongoing organized human activity that has some fundamental societal purpose’ (Wartick and Wood, 1998: 22) and provides incentive structures that determinesocial, political and economic behavior (Gilpin, 2001; North, 1991). Many mainstreamapproaches to regional integration assume that the market is the primary force organizingeconomic behavior (Gilpin, 2001), and assume away the relevance of institutional and political forces. Those which do consider institutions assume they are primarily createdeither to support the market by increasing its efficiency, or for maximizing the welfare ofindividual actors (CPB, 1997; North, 1991). Others see institutions as a coordination issuein the absence of a power center (e.g., a hegemonic state), or a ‘regulatory regime’ forsolving collective action problems (cf. Keohane, 1984). Yet it is possible that institutions are formed for rational, irrational or even capricious motives, or as an unforeseeable outcome of historical accident and path dependency (Arthur, 1989). Hence institutions may
45
Chapter Three
not be a direct representation of the interests of the actors that created them (Gilpin, 2001;Schotter, 1981).Institutions may be spontaneous (international common law), but they are most often the result of (intentional or unintentional) interaction between a range of actors. Often game-theoretic approaches are used to describe the emergence of institutions (Schotter, 1981). Institutions can thus also be seen as a means of organizing relationships between actors(Cox, 1989). This organizing quality can be found in the understanding that institutions are ‘sets of implicit or explicit principles, norms, rules and decision-making proceduresaround which actors’ expectations converge in a given area of international relations’(Krasner, 1982 cited in Gilpin, 2001: 83; emphasis added). The term ‘actor’ in this study isused in the sociological sense to describe a group of individuals sharing the same interest(Cyert and March, 1963). Regional integration, as a process of international restructuring,is a matter of actor interaction in (re)defining ‘the rules of the game’.If an actor is considered ‘a group of individuals with the same interests’, strategy can beseen as a ‘deliberate act of a collection of people joined together to pursue some mission incommon’ (Mintzberg and Waters, 1998). Therefore, strategy can equated with action. If institution-building is about actors defining the rules of the (common) game, it can be said that actors join together to pursue a ‘mission in common’, i.e., the establishment of a newinstitutional framework, and through their actions consolidate that framework. Organizing actor relationships in such a way that expectations should converge suggests that norms,values and behavior should converge as well, otherwise expectations would increasinglydiverge from reality. Following this line of thinking, institutions are about actors doing thesame things according to the same rules. In this sense institution-building is intended to reduce uncertainty.
3.1.2 A holistic perspective on strategy
The Strategic Management literature describes processes of ‘strategy formation’ as identifying a strategic problem, forming a diagnosis, conceiving a solution (‘strategyformulation’) and realizing that strategy (De Wit and Meyer, 1998). However, manyapproaches consider strategy as a linear process (Mintzberg and Waters, 1985). Linearapproaches to strategy tend to overlook the fact that ‘realized strategy’ forms the basis for the next step. This is only the ‘planned’ part of strategy, which does not yet consider‘organic’ (emergent) strategy. The degree to which strategy is seen as planned versus organic is based on assumptions of cognition, rational thought and bounded rationality, which is an issue of logic versus creativity, and of how ‘controllable’ the environment is.De Bono (1970) calls this vertical versus lateral thinking, or thinking ‘inside or outside thebox’. In game theory, strategy is a decisional rule that determines the decisions and actionsan actor will take.The strategy formation process described in the literature generally fails to consider thecontextual aspects that determine how a problem is identified as such. ‘Conceiving’ is a step where strategic options are defined, which is not only based on a perception of anactor’s strategic position, it must also involve assumptions of the behavior of other actors.Under institutionalist assumptions, the tendency exists to expect archetypal behavior on thepart of actors. For instance, economic actors under a Customs Union, as an example of an institutional framework, may be expected to trade more with partners in fellow CU member states. Viewing institution-building as strategic convergence, however, may have
46
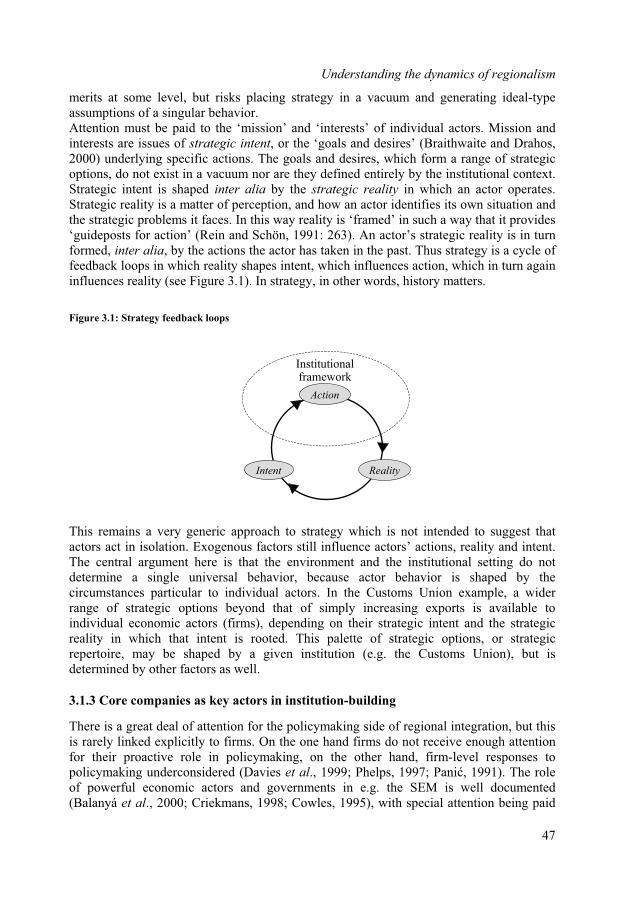
Understanding the dynamics of regionalism
merits at some level, but risks placing strategy in a vacuum and generating ideal-typeassumptions of a singular behavior.Attention must be paid to the ‘mission’ and ‘interests’ of individual actors. Mission and interests are issues of strategic intent, or the ‘goals and desires’ (Braithwaite and Drahos,2000) underlying specific actions. The goals and desires, which form a range of strategicoptions, do not exist in a vacuum nor are they defined entirely by the institutional context.Strategic intent is shaped inter alia by the strategic reality in which an actor operates.Strategic reality is a matter of perception, and how an actor identifies its own situation andthe strategic problems it faces. In this way reality is ‘framed’ in such a way that it provides ‘guideposts for action’ (Rein and Schön, 1991: 263). An actor’s strategic reality is in turn formed, inter alia, by the actions the actor has taken in the past. Thus strategy is a cycle offeedback loops in which reality shapes intent, which influences action, which in turn again influences reality (see Figure 3.1). In strategy, in other words, history matters.
Figure 3.1: Strategy feedback loops
Intent
Action
Reality
Institutionalframework
This remains a very generic approach to strategy which is not intended to suggest thatactors act in isolation. Exogenous factors still influence actors’ actions, reality and intent. The central argument here is that the environment and the institutional setting do notdetermine a single universal behavior, because actor behavior is shaped by the circumstances particular to individual actors. In the Customs Union example, a widerrange of strategic options beyond that of simply increasing exports is available toindividual economic actors (firms), depending on their strategic intent and the strategicreality in which that intent is rooted. This palette of strategic options, or strategicrepertoire, may be shaped by a given institution (e.g. the Customs Union), but is determined by other factors as well.
3.1.3 Core companies as key actors in institution-building
There is a great deal of attention for the policymaking side of regional integration, but thisis rarely linked explicitly to firms. On the one hand firms do not receive enough attention for their proactive role in policymaking, on the other hand, firm-level responses topolicymaking underconsidered (Davies et al., 1999; Phelps, 1997; Pani , 1991). The roleof powerful economic actors and governments in e.g. the SEM is well documented(Balanyá et al., 2000; Criekmans, 1998; Cowles, 1995), with special attention being paid
47
Chapter Three
to the role of organized forms of political activity such as the European Round Table ofIndustrialists (ERT) in the integration process. Several other business organizations exist inwhich core companies figure prominently, such as Transatlantic connection, the Group of Thirty, the World Economic Forum, the Business Roundtable. Overemphasis on such organizations as actors in their own right, however, has led to a tendency to focus on theumbrella institution instead of the individual members.It is conceptually stronger in this sense to think of key economic actors as ‘core companies’ (Van Tulder et al., 2001), of which organizations like the ERT are merely thebest-organized vocalization. Many macro-economic developments, for instance, are in factthe expression of the strategic behavior of a limited number of core companies. For instance the case of world FDI stocks, where 50 firms account for more than 60 percent of total US outward FDI stock; the case of trade, where between 30-60 percent is thought tobe company internal trade and thus open to transfer pricing; and in Research and Development and patenting strategies, where more than 50 percent of R&D expendituresin many nations are accounted for by only 5 companies. In many respects internationalrestructuring processes are a ‘small numbers’ game (ibid:xx).Thinking of large and multinational firms in terms of core companies is becomingincreasingly popular in the International Business literature. John Dunning, for example, in his seminal overview work on Multinational Enterprises and the Global Economy,confirms the importance of linkages and spill-over effects and multinationals considered intheir network configuration (Dunning, 1993: 445ff). Other definitions of ‘leading firms’ in combination with network configurations exist such as ‘leader firms’ (Porter, 1998) or‘flagship firms’ (Rugman and D’Cruz, 2000) in which multinational firms are characterized by global competitiveness and international benchmarks. A comparablediscussion is triggered by the introduction of the idea of meta-national companies. Corecompanies are large firms that operate as spiders in webs of value chains and innovation,lead processes of internationalization and which – partly due to their core position – alsohave explicit political vision and direct access to political decisionmakers (Cowles, 1995). ‘Core companies’ are operationalized in greater detail in Box 1 below.It generally acknowledged that in particular large firms are powerful actors in political and economic processes and outcomes (Hancher and Moran, 1989). Core companies are keyactors in regional integration, both in terms of the processes that underlie integrationorigins as well as the restructuring that signals the outcome of integration. This means corecompany strategies have economic and political, or market and non-market, dimensions(Baron, 2000). Core companies can employ proactive, reactive and interactive response choices to changing business-government relations (James Post [1976] cited in Wartickand Wood, 1998). Such choices can involve e.g. front-loading incentives for governmentsor threatening sanctions such as withdrawal (see also Doz, 1986). A proactive approach, for instance, increases the likelihood of influencing outcomes, but being reactive minimizes costs incurred from incorrectly anticipating change. It is also possible to have insome cases even inactive strategies, particularly if the core company’s systemic power issignificant enough. This means the firm’s influence is so great that it need not take anyaction, or even threaten to do so, for the simple possibility that it can take such action issufficient to sway governments and determine policy outcomes. On the other hand, corecompanies can use their leverage to play governments against each other (Doz, 1986). Additionally, there are push and pull elements to core company strategies: Molle andMorsink (1991) refer in this respect to strategies of stimulus and resistance to signal
48
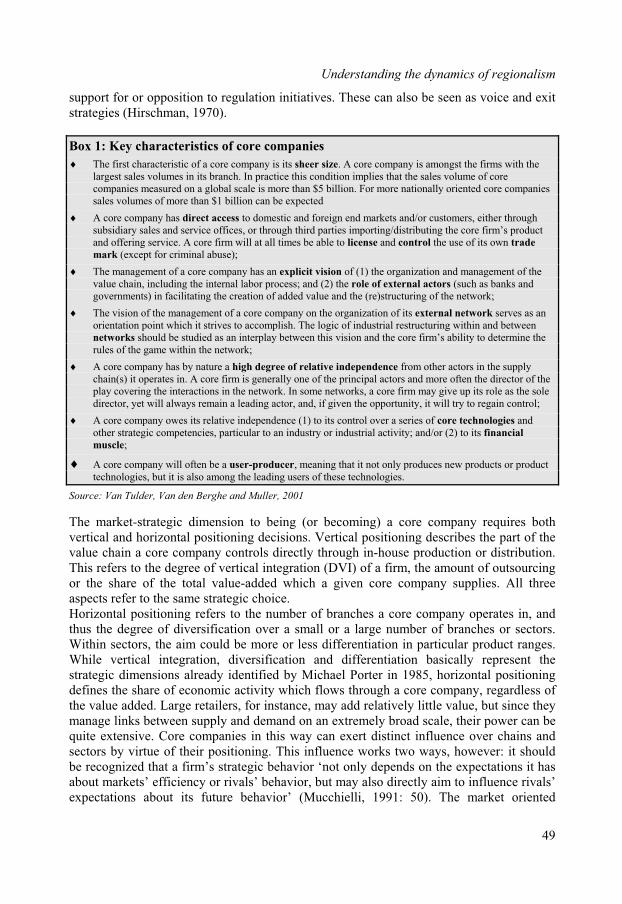
Understanding the dynamics of regionalism
support for or opposition to regulation initiatives. These can also be seen as voice and exit strategies (Hirschman, 1970).
Box 1: Key characteristics of core companies
The first characteristic of a core company is its sheer size. A core company is amongst the firms with the largest sales volumes in its branch. In practice this condition implies that the sales volume of core companies measured on a global scale is more than $5 billion. For more nationally oriented core companiessales volumes of more than $1 billion can be expected
A core company has direct access to domestic and foreign end markets and/or customers, either through subsidiary sales and service offices, or through third parties importing/distributing the core firm’s product and offering service. A core firm will at all times be able to license and control the use of its own trade
mark (except for criminal abuse);
The management of a core company has an explicit vision of (1) the organization and management of the value chain, including the internal labor process; and (2) the role of external actors (such as banks and governments) in facilitating the creation of added value and the (re)structuring of the network;
The vision of the management of a core company on the organization of its external network serves as an orientation point which it strives to accomplish. The logic of industrial restructuring within and between networks should be studied as an interplay between this vision and the core firm’s ability to determine the rules of the game within the network;
A core company has by nature a high degree of relative independence from other actors in the supplychain(s) it operates in. A core firm is generally one of the principal actors and more often the director of the play covering the interactions in the network. In some networks, a core firm may give up its role as the sole director, yet will always remain a leading actor, and, if given the opportunity, it will try to regain control;
A core company owes its relative independence (1) to its control over a series of core technologies and other strategic competencies, particular to an industry or industrial activity; and/or (2) to its financial
muscle;
A core company will often be a user-producer, meaning that it not only produces new products or product technologies, but it is also among the leading users of these technologies.
Source: Van Tulder, Van den Berghe and Muller, 2001
The market-strategic dimension to being (or becoming) a core company requires bothvertical and horizontal positioning decisions. Vertical positioning describes the part of thevalue chain a core company controls directly through in-house production or distribution.This refers to the degree of vertical integration (DVI) of a firm, the amount of outsourcingor the share of the total value-added which a given core company supplies. All threeaspects refer to the same strategic choice.Horizontal positioning refers to the number of branches a core company operates in, and thus the degree of diversification over a small or a large number of branches or sectors.Within sectors, the aim could be more or less differentiation in particular product ranges. While vertical integration, diversification and differentiation basically represent thestrategic dimensions already identified by Michael Porter in 1985, horizontal positioningdefines the share of economic activity which flows through a core company, regardless ofthe value added. Large retailers, for instance, may add relatively little value, but since theymanage links between supply and demand on an extremely broad scale, their power can be quite extensive. Core companies in this way can exert distinct influence over chains and sectors by virtue of their positioning. This influence works two ways, however: it shouldbe recognized that a firm’s strategic behavior ‘not only depends on the expectations it hasabout markets’ efficiency or rivals’ behavior, but may also directly aim to influence rivals’expectations about its future behavior’ (Mucchielli, 1991: 50). The market oriented
49

Chapter Three
‘strategic realities’ created through their behavior allow firms to influence the strategic realities of policymakers, thereby influencing the direction of institutional development.Non-market techniques like lobbying lead to lower transaction costs (psychic distance, costof information) but also offers those firms with an active lobby a competitive advantage in creating a policy environment best suited to their needs. Lobby activity takes place throughtrade associations, head of industry organizations, peak associations or professional lobbyagencies. In the US, for example, the right to lobby is part of the 1st Amendment, and interest groups spent nearly $700 million in 1999 lobbying Washington alone. The very act of lobbying may influence strategy as well, as it has been proven that having a local officehelps when trying to lobby a government (Baron, 2000). Other factors that improve thechances of impacting decisions are e.g. through direct access to parliamentarians or members of Congress, or, indirectly, through reputation, credibility, and market power.Non-market techniques tend to involve lower costs than market techniques because of the degree of uncertainty and risk-mitigation involved. Lobbying essentially reduces uncertainty against a fixed cost, while market techniques create a built-in risk and mayresult in less than optimal production strategies. Thus market strategies influence outcomesand non-market strategies influence policy itself: these are in fact ‘push’ and ‘pull’elements of strategy.
3.1.4 Strategy in policy space versus competitive space
The traditional literature on regional integration shows how levels of actors can beconfused, because it demonstrates how theory infers micro-level behavior from macro-level strategies. At the macro-level, the strategic intent behind a Customs Union (CU) maybe to increase trade with CU partners, given e.g. a strategic reality of declining terms oftrade. Despite the assumption referred to above that ‘actors’ expectations converge’ undera given institutional setting, it is simplistic to assume that actors share motives for theformation of any given institutional framework, or that they will complement each other’s strategies for capitalizing on that framework. As Streeck and Schmitter (1996) demonstrated in the case of the SEM, although European business and government elites joined forces, each did so for different reasons. Central to institution-building is the tensionbetween strategies of the key actors involved.The tension between actors involved in restructuring stems largely from the difference in‘spaces’ within which actors operate. Space is used here in the more abstract sense ofPerroux’s (1950) ‘field of forces’, or Cohen’s ‘authoritative domains’ (Cohen, 1997) thanpurely in the physical sense. Governments, for instance, are primarily concerned with governance structures within a geographically defined policy space (similar to ‘regulatory domains’ of Braithwaite and Drahos, 2000; and the ‘political space’ of Dunning, 1997).Core companies, on the other hand, are concerned with the activities which take place within their competitive space, in particular that segment of their competitive space which they attempt to control (Ruigrok and Van Tulder, 1995). Competitive space is best understood as the arena in which firms compete (similar to the ‘contestable market’(Baumol, 1982)), with specific rules of engagement that reflect the characteristics ofcompetition between firms. Competitive space can exist at the industry level or e.g. amonga relatively small oligopoly within an industry, depending on the make-up of the industryand how (market) power is concentrated. Policy space can be characterized as a ‘macro’space due to its national orientation and corresponding high levels of aggregation in
50

Understanding the dynamics of regionalism
analysis, while competitive space is best seen at the firm- (or industry) level and can be qualified as a ‘micro’ space (cf. Figure 3.2). Policy space and competitive space mayoverlap and interweave through geographic space but are not necessarily spatially organized in complementary ways (cf. Dunning, 1997). Given the differences in theirmacro and micro operational spaces, companies and governments do not face the samestrategic realities, nor do they have the same strategic intent (Eden, 1993; Rugman and Verbeke, 1991). Realities are not always self-evident; they are to some extent theorized. Additionally, they are constituted by knowledge structures that give identity to institutions and forces (Gill, 1994 in Underhill, 1994).
Figure 3.2: Strategy in policy space versus competitive space
Intent
Action
Reality
Institutionalframework
Action
Intent Reality
Competitive space
Policy space
Figure 3.2 shows that macro reality and intent exist in a different sphere than that of microactors, though they both act within a shared institutional setting. In addition, the figure suggests that the strategies of economic and political actors are intertwined in the formation and consolidation of new institutions, reflecting the notion that geographic andcompetitive space interweave and overlap. Governments shape economic behavior, not only through policy, but also through strategic geo-political maneuvers (Van der Pijl, 1992). At the same time, free market systems mean that firms take decisions beyond therealm of government control (Criekmans, 1998). Additionally, companies themselvesaffect the development of the very institutions which govern their activities (Zylberstaijn and Jank, 1998) through both market and non-market strategies (Baron, 2000). Phelps(1997) refers to the influence of companies, and particularly MNEs, on regulatoryinstitutions as ‘institutional or regulatory capture’. Building international institutions like
and competitive space. Regional integration is a matter of the internationalization strategies of governments and core companies.
3.2 The macro/micro dynamics of Regionalism
A change in institutional setting not only alters the way in which activity (in particulareconomic and political) is organized, but also the way in which actors interact in pursuingtheir interests. In the formation of new institutions, the confrontation between stakeholderinterests is played out in bargaining environments (Ruigrok and Van Tulder, 1995),
51
RIAs involve the push and pull forces of macro and micro actors through geographic space s
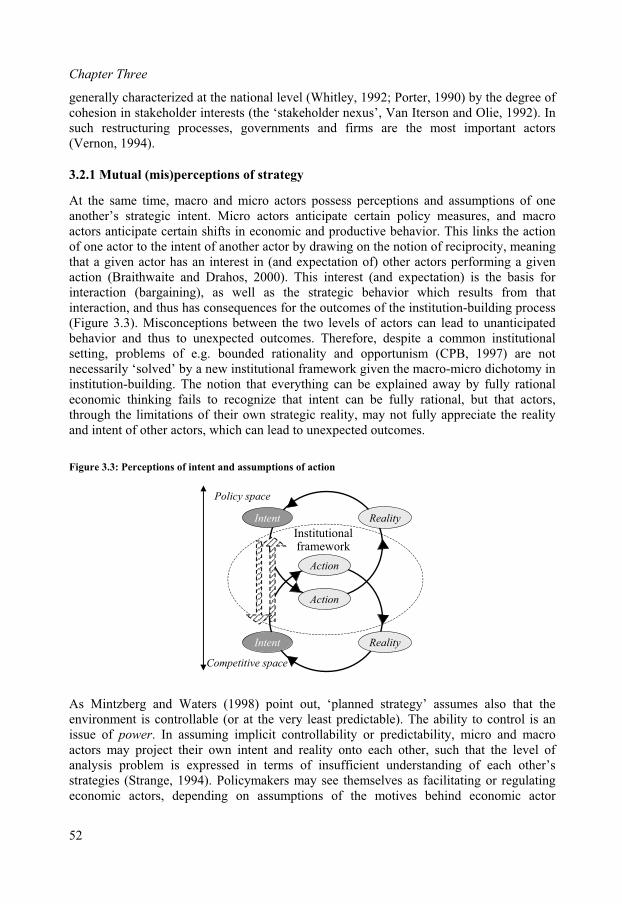
Chapter Three
generally characterized at the national level (Whitley, 1992; Porter, 1990) by the degree of cohesion in stakeholder interests (the ‘stakeholder nexus’, Van Iterson and Olie, 1992). In such restructuring processes, governments and firms are the most important actors(Vernon, 1994).
3.2.1 Mutual (mis)perceptions of strategy
At the same time, macro and micro actors possess perceptions and assumptions of oneanother’s strategic intent. Micro actors anticipate certain policy measures, and macroactors anticipate certain shifts in economic and productive behavior. This links the actionof one actor to the intent of another actor by drawing on the notion of reciprocity, meaningthat a given actor has an interest in (and expectation of) other actors performing a givenaction (Braithwaite and Drahos, 2000). This interest (and expectation) is the basis for interaction (bargaining), as well as the strategic behavior which results from thatinteraction, and thus has consequences for the outcomes of the institution-building process(Figure 3.3). Misconceptions between the two levels of actors can lead to unanticipatedbehavior and thus to unexpected outcomes. Therefore, despite a common institutionalsetting, problems of e.g. bounded rationality and opportunism (CPB, 1997) are notnecessarily ‘solved’ by a new institutional framework given the macro-micro dichotomy ininstitution-building. The notion that everything can be explained away by fully rationaleconomic thinking fails to recognize that intent can be fully rational, but that actors,through the limitations of their own strategic reality, may not fully appreciate the reality and intent of other actors, which can lead to unexpected outcomes.
Figure 3.3: Perceptions of intent and assumptions of action
Action
Reality
Institutionalframework
Action
Reality
Intent
Intent
Competitive space
Policy space
As Mintzberg and Waters (1998) point out, ‘planned strategy’ assumes also that theenvironment is controllable (or at the very least predictable). The ability to control is anissue of power. In assuming implicit controllability or predictability, micro and macroactors may project their own intent and reality onto each other, such that the level of analysis problem is expressed in terms of insufficient understanding of each other’s strategies (Strange, 1994). Policymakers may see themselves as facilitating or regulatingeconomic actors, depending on assumptions of the motives behind economic actor
52
Understanding the dynamics of regionalism
behavior. They may see companies as e.g. extensions of policy, or ‘politics by othermeans’ (Vernon, 1971); on the other hand they may see them as threats to state power (Eden, 1993). Policymaking bodies will likely have an implicit view of companies, forinstance as producers converting inputs to outputs to satisfy society’s material needs and wants within a context created by government activities (i.e., policymaking). This impliesthat policymakers have a vision of firm-level reality and intent, and of their own role inmanaging that reality and intent.Companies, on the other hand, may see their purpose in e.g. ‘identifying and exploiting theresources and capabilities of the firm in the marketplace for the purpose of gaining competitive advantage and superior financial performance’ (Tallman and Yip, 2001: 1),and perceive policymakers as managers of macroeconomic stability, inputs and infrastructure efficiency, the rules of the game and the negative consequences of monopolypower (Porter, 1998). Yet such assumptions place behavior in a contextual vacuum andignore any intrinsic interests policymakers themselves have. Ultimately these perceptions underlie the strategic behavior of actors at both levels, as well as the way in which theyinteract with each other, and will be determinant for the outcomes of a given RIA regime.The strategic mismatch present in this analysis of institutions draws conceptually on game-theoretic approaches to (explicitly determined) institutions. In this sense a game is a set ofrules for a particular situation which delimits the actions available to the players. Eachplayer has a set of actions he can choose from (the strategic repertoire). Payoff isdetermined not only by own action but also by the action of other actors. Schotter (1981)describes four kinds of problems that can lead to the emergence of social institutions:problems of coordination, prisoner’s dilemma, problems of inequality preservation andproblems of the cooperative-game type. This adds a new dimension to game theoreticapproaches like the prisoner’s dilemma, where uncertainty can lead to less than optimalbehavior.
3.2.2 Underlying assumptions of behavior
Ultimately, strategy must be understood in the context of assumed motivations behind human activity, both at the macro and the micro level. ‘Historical experience indicates that the purpose of economic activities is ultimately determined not only by markets and the prescriptions of technical economics, but also (either explicitly or implicitly) by the norms,values and interests of the social and political systems in which economic activities are embedded’ (Gilpin 2001: 12). It is therefore essential to explicate the behavioralassumptions underlying actor strategies in order to place that behavior in the proper context.Interests and behavior of the one can be related to the interests and behavior of the other ase.g. harmonious, adversarial, altruistic, self-interested or ‘enlightened’ self-interested(Baldwin, 1985). They can also be seen at varying levels, such as societal, economic andpolitical. A useful framework for structuring interests, and institutions for that matter,involves positioning of societal values along the individualist–collectivist axis, economicvalues along the free-market–utopian axis and political values along the anarchist–totalitarian axis (Figure 3.4). In fact all three are dimensions of the idealism–realism axisin the sense of the classic Lockean-Hobbesian polarity (Van der Pijl, 1992). Classifyingassumptions of behavior is not only a question of theoretical perspective; it also hasimplications for how macro- and micro-actors perceive each other and their respective
53
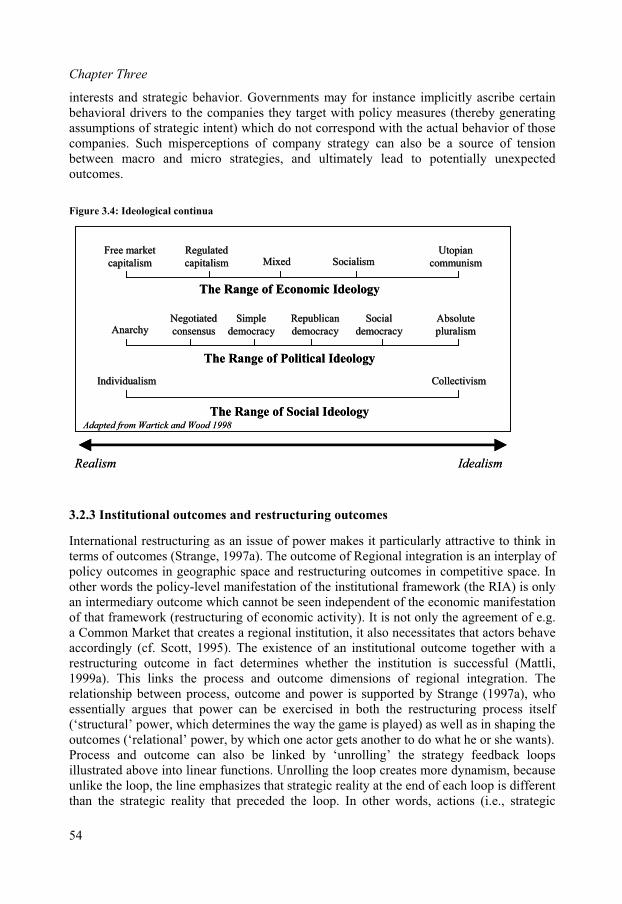
Chapter Three
interests and strategic behavior. Governments may for instance implicitly ascribe certainbehavioral drivers to the companies they target with policy measures (thereby generatingassumptions of strategic intent) which do not correspond with the actual behavior of thosecompanies. Such misperceptions of company strategy can also be a source of tensionbetween macro and micro strategies, and ultimately lead to potentially unexpectedoutcomes.
Figure 3.4: Ideological continua
The Range of Economic Ideology
The Range of Political Ideology
The Range of Social Ideology
Free marketFree market
capitalismcapitalismRegulatedRegulated
capitalismcapitalism MixedMixed SocialismSocialismUtopianUtopian
communismcommunism
AnarchyAnarchyNegotiatedNegotiated
consensusconsensusRepublicanRepublican
democracydemocracySocialSocial
democracydemocracyAbsoluteAbsolute
pluralismpluralismSimpleSimple
democracydemocracy
IndividualismIndividualism CollectivismCollectivism
Realism Idealism
Adapted from Wartick and Wood 1998
3.2.3 Institutional outcomes and restructuring outcomes
International restructuring as an issue of power makes it particularly attractive to think interms of outcomes (Strange, 1997a). The outcome of Regional integration is an interplay ofpolicy outcomes in geographic space and restructuring outcomes in competitive space. In other words the policy-level manifestation of the institutional framework (the RIA) is onlyan intermediary outcome which cannot be seen independent of the economic manifestationof that framework (restructuring of economic activity). It is not only the agreement of e.g. a Common Market that creates a regional institution, it also necessitates that actors behaveaccordingly (cf. Scott, 1995). The existence of an institutional outcome together with arestructuring outcome in fact determines whether the institution is successful (Mattli, 1999a). This links the process and outcome dimensions of regional integration. The relationship between process, outcome and power is supported by Strange (1997a), whoessentially argues that power can be exercised in both the restructuring process itself(‘structural’ power, which determines the way the game is played) as well as in shaping theoutcomes (‘relational’ power, by which one actor gets another to do what he or she wants). Process and outcome can also be linked by ‘unrolling’ the strategy feedback loopsillustrated above into linear functions. Unrolling the loop creates more dynamism, becauseunlike the loop, the line emphasizes that strategic reality at the end of each loop is different than the strategic reality that preceded the loop. In other words, actions (i.e., strategic
54
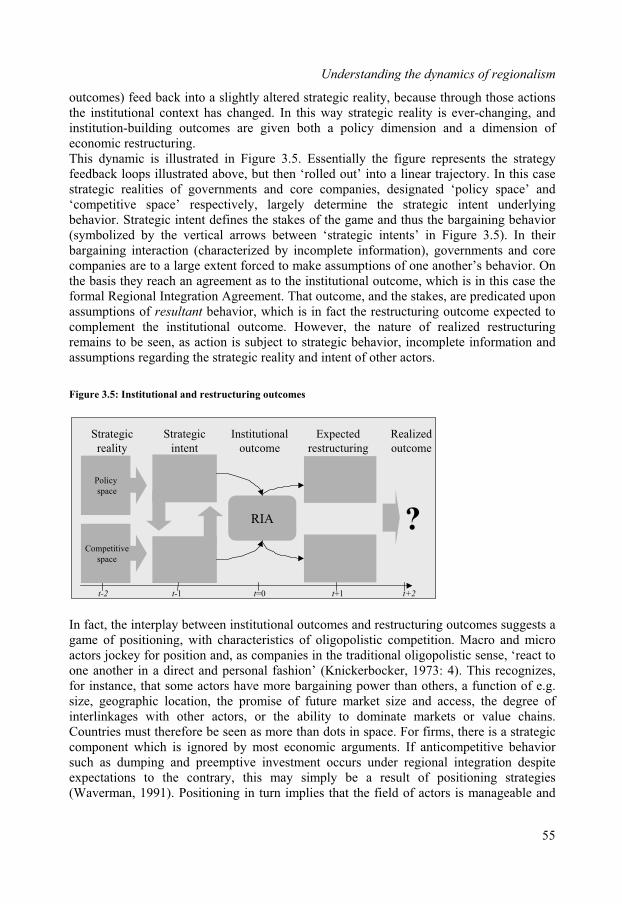
Understanding the dynamics of regionalism
outcomes) feed back into a slightly altered strategic reality, because through those actions the institutional context has changed. In this way strategic reality is ever-changing, andinstitution-building outcomes are given both a policy dimension and a dimension ofeconomic restructuring.This dynamic is illustrated in Figure 3.5. Essentially the figure represents the strategyfeedback loops illustrated above, but then ‘rolled out’ into a linear trajectory. In this case strategic realities of governments and core companies, designated ‘policy space’ and‘competitive space’ respectively, largely determine the strategic intent underlying behavior. Strategic intent defines the stakes of the game and thus the bargaining behavior(symbolized by the vertical arrows between ‘strategic intents’ in Figure 3.5). In theirbargaining interaction (characterized by incomplete information), governments and corecompanies are to a large extent forced to make assumptions of one another’s behavior. Onthe basis they reach an agreement as to the institutional outcome, which is in this case the formal Regional Integration Agreement. That outcome, and the stakes, are predicated upon assumptions of resultant behavior, which is in fact the restructuring outcome expected tocomplement the institutional outcome. However, the nature of realized restructuringremains to be seen, as action is subject to strategic behavior, incomplete information and assumptions regarding the strategic reality and intent of other actors.
Figure 3.5: Institutional and restructuring outcomes
Strategic
reality
Strategic
intent
Institutional
outcome
RIA
Expected
restructuring
Realized
outcome
?
t=0 t+1 t+2t-1t-2
Policy
space
Competitive
space
In fact, the interplay between institutional outcomes and restructuring outcomes suggests a game of positioning, with characteristics of oligopolistic competition. Macro and microactors jockey for position and, as companies in the traditional oligopolistic sense, ‘react to one another in a direct and personal fashion’ (Knickerbocker, 1973: 4). This recognizes,for instance, that some actors have more bargaining power than others, a function of e.g.size, geographic location, the promise of future market size and access, the degree of interlinkages with other actors, or the ability to dominate markets or value chains.Countries must therefore be seen as more than dots in space. For firms, there is a strategic component which is ignored by most economic arguments. If anticompetitive behavior such as dumping and preemptive investment occurs under regional integration despiteexpectations to the contrary, this may simply be a result of positioning strategies(Waverman, 1991). Positioning in turn implies that the field of actors is manageable and
55
Chapter Three
not infinitely large; ultimately institution-building is a small-numbers game. The small-numbers game means there is more opportunity for direct bargaining interaction betweenactors. This can lead to more symbiosis at both macro and micro levels, but not necessarilyacross levels.Strategic positioning in turn implies that outcomes can be sub-optimal in the classicaleconomic sense. Conversely, it can be argued that an economically ‘optimal’ welfareconstruct is not necessarily optimal in the interest of individual actors. It can easily beassumed that in certain situations, certain macro and micro actors might see the classical‘second-best’ strategy (RIAs) as leading to the most desirable outcome in terms of theirown strategic interests. The theoretical welfare gains to the world of global free trade overRIAs may be largely established, but in practice the distribution of those welfare gainsremains an issue (Gilpin, 2001). Moreover, regional outcomes may be subject to‘bandwagon effects’ (Van Tulder, 2001) or ‘path dependency’ (Arthur, 1989) that may bythemselves lead to suboptimal regions, or configurations of regions.
3.2.4 Regionalism as a policy-led, two-level game
In regional integration, key actors determine their behavior largely in response to and inanticipation of other actors’ behavior. This is reminiscent of iterative mixed-motive games(‘manipulative’ bargaining games, as opposed to non-cooperative games, cf. Gawande and Hansen, 1999) that emphasize the ‘presence of both strategic interaction and imperfectinformation’ (Young, 1975; cited in Keohane, 1984). In such games strategic choices are not made in isolation but emerge based on expectations of other actors. Neorealism(Krasner, 1982) and neoinstitutionalism (Keohane, 1984) deal with these strategic choicesin international relations. However, the neorealist emphasis on conflict and anarchy ininternational relations makes cooperation seem unlikely and does not explain the recent resurgence of Regionalism. Neoinstitutionalism is more optimistic in that institutions canbecome ‘intervening variables’ that create incentives for cooperation between states, butboth theories tend to ignore the significance of the domestic arena in shaping internationalpreferences.Putnam’s theory of two-level games form an attempt to link the domestic and internationalissues (Putnam, 1988; Cowles, 1995; Putnam, 1993) and has recently been used to analyze the dynamics of regional integration (Cameron and Tomlin, 2000). The two-level approach focuses on legislators and ratification procedures in international negotiations (Meunier,2000). This is a weakly developed part of two-level game theory (Cameron and Tomlin,2000). It also only deals with domestic politics, whereas we are dealing with the articulation of economic interests by core companies. The approach introduced here, therefore, introduces a different level than the level Putnam and successors are referring to.The game becomes a two-tier game similar to the two-level games of Putnam, but distinctin the sense that the focus in this case is between political and economic actors as opposed to Putnam’s state-centric balancing act between international and domestic interests innegotiating supranational institution-building. Additionally, the current study does notattempt a formalized modeling of the bargaining dynamic. Two-level games, whichCameron and Tomlin (2000) describe as ‘more metaphor than theory’ (p. 25) and many ofthose who build on Putnam tend to oversimplify, are better suited to a conceptualapproach.
56
Understanding the dynamics of regionalism
Taking such an approach requires attention for theories of international relations as well astheories of economic governance and regulation. The focus here is primarily on thestrategies and interests of political actors and economic actors (vertical) and less on intergovernmental interaction (horizontal), because although the latter is clearly relevant,‘cross-national information asymmetries [in negotiating supranational institutions] are less prevalent than … mis-estimations within domestic polities’ (Evans, 1993; cited inCameron and Tomlin, 2000: 22). Furthermore, the world of core companies must beexplored to understand their strategic concerns as well as the means through which theycan affect international outcomes (institution-building). Core companies can exercise real and powerful influence on government policy preferences, not only through political contributions and lobbying, but also through market mechanisms and (re)locationstrategies.Addressing regional integration using a two-level game-theoretic perspective makes itmore relevant to look at strategies in terms of extrinsic strategic intent than solely in termsof more traditional, purely economics-driven concepts. Ultimately, intrinsic goals do not themselves exist in a vacuum; rather, they are often pursued to serve extrinsically-drivenambitions. Similarly, extrinsically-oriented strategies may be pursued to avoid pursuingintrinsic strategies such as rationalization or downsizing. Extrinsic strategies can becollectively explored as ‘bargaining power’, defined in general terms as the ability of anegotiating actor to obtain the most from a partner while conceding the least, ceteris
paribus (Meunier, 2000). For governments this implies the ability to dictate terms in other policy spaces and for core companies the ability to dictate competitive space, or the termsof competition (‘rules of the game’). Bargaining power is a useful perspective because 1) itfollows logically from the strategic interaction, power and game theory precepts already introduced; 2) it has a spatial component in that size, reach and locational presence are important factors, which can easily be related to the restructuring aspects of integration;and 3) bargaining power, having also been used extensively for state actors, is one of thedefining characteristics of core companies. Bargaining power at the macro level is not newin relation to regional integration (cf. Balassa, 1961) but it has not yet been explored as a macro-micro issue.
3.2.5 Implications of the approach
Approaching regional integration as a level of analysis problem of strategic actors has limitations, and consequences. First of all, many of the concepts described in this chapterare ambiguous and difficult to operationalize. But given the tendency in economic modelsto assume ‘ideal-type’ behavior and uniform interests as well as assumptions of convergentpatterns of behavior under institutionalization, there is a need for an approach that considers a wider range of strategic options, developing ‘strategic repertoires’ of regionalism. Further theoretical explorations at both the macro- and micro-levels will helpto identify dimensions along which e.g. strategic intent and reality can be structured, and what the basis might be for the macro and micro strategic repertoires, respectively.Secondly, such an analysis requires a particular definition of regional integration. It requires a definition of regional integration that encompasses both political and economicelements, excluding e.g. purely military pacts like the NATO, constructionist approachesof e.g. perceived cultural convergence (Mansfield and Milner, 1997), as well as economicgeography approaches and their emphasis on agglomeration effects, which may help to
57
Chapter Three
explain different locations, ‘but not different nations’ (Dunning 1998, cited in Pitelis and Sugden, 2000). Thirdly, the treatment of both macro- and micro-level actors as unified may be contestedon the grounds that companies and governments are themselves much more than a cohesive group of individuals, and arguably the stage of interaction between multiple‘actors’. ‘Reaction functions’, by which observable outcomes are used to generateinferences about policymakers’ intentions, offer little in analyzing policy (cf. Alt and Woolley, 1982). ‘Finding a systematic means of relating intentions to outcomes is aserious problem of political analysis … We cannot just compare outcomes – this teaches us little if we do not take into account the intentions and the actions of the policymakers (ibid:711). This means we have to distinguish between policy spaces where authorities have discretion versus those in which they are constrained. Although we run the risk of falling prey to the simplistic ‘rational actor’ approach of the optimization model, which portrayspolicy as being made by a unified authority with clearly defined preferences, it is,however, possible to typify the interests of a given firm or policymaking body such thateach can be defined as a single actor relative to other actors. Any given firm (and similarly, an individual policymaking body) is characterized at some level by commonoverarching strategic interests that bind the ‘group of individuals’ in a way that sets theirstrategy apart from that of other actors (i.e., other companies). Otherwise the group woulddissolve on the basis of its inability to define and pursue a shared direction.Fourthly, defining and limiting the sample of actors is required to characterize the truenature of the ‘small numbers game’. Conceptually it suggests on the one hand political actors whose behavior has economic consequences within the RIA context (e.g. theEuropean Commission and the US Trade Representative), and on the other economicactors whose behavior has political consequences. Government actors and core companieswill need to be more precisely defined. Finally, grouping actors at a given level entails the risk of oversimplifying their strategic realities, intents and behavior. Each level comprisesdifferent actors with different interests, and the categorization macro/micro is very broad. Still, the attempt is not to identify all the differences, but to identify the commonalities at each level and to show how, in a very broad sense, the levels can be so divergent that they cloud our understanding of the phenomenon. Creating a strategic repertoire concise enough to be manageable yet broad enough to capture a wider spectrum of possibilities will be a distinct challenge.
3.3 Regulation and economic restructuring
Since we assume that policy’s greater institution-building and –enforcing capabilities giveit a leading position in the macro/micro dynamic, it makes sense to look at the logic of regulation and assumptions of economic restructuring initially from a policy perspective. Doing so requires an assessment of the role of government in regulating political and economic behavior. Historically, there has always been a fit between the organization of economic activity (the regime of accumulation) and political institutions, behavior and belief systems (the mode of regulation) (Brodie, 1997). Numerous bodies of literaturetouch on these issues from a wide range of perspectives, including political scienceapproaches like neo-Gramscianism and the ‘Regulation school’ as well as public choiceand theories of the economics of regulation. This section begins by addressing recentdevelopments in thinking on government policymaking (3.3.1), before examining views of
58

Understanding the dynamics of regionalism
the government as one of a broader scala of stakeholders (3.3.2). This is followed by an historical overview of perspectives on the role of government in organizing economicactivity (3.3.3). and an exposition of the spatial dimension of economic activity and its significance for policymaking (3.3.4). The section concludes by emphasizing thesignificance of the behavioral assumptions which underlie theories of governmentregulation (3.3.5).
3.3.1 The ‘rethinking’ of government policy
Mainstream theories of regional integration say little about why there is a second wave, andwhy this wave is occurring now. Generally, regionalism can be seen in the context of a broader ‘rethinking of government policy’ (Lipsey, 1997: 82) which emerged after 1975,when a new period of rapid structural change began. The main issues of structural change,both political and economic, are embodied in several key phenomena: the emergence of free-market thinking as the predominant economic ideology (with political consequences, the corresponding increase in interdependency, the increasing complexity of policymakingin the face of a larger playing field (horizontally) and multiple levels of governance (vertically), and the post Cold-War crisis of hegemony. These phenomena change the costsand benefits of given organizational patterns of structuring activity, and hence the costsand benefits of a given institutional context.The past twenty years have been characterized by a ‘doctrinal battle’ (Lipsey, 1997), ending in the triumph of free market thinking and the pressures of liberalization,deregulation and privatization (Prakash and Hart, 1999). This ideology of the ‘competitionstate’ (Gill, 1994: 80) stands in stark contrast to the preceding protectionist period. The neoliberal ideology of free markets, as embodied by the Bretton Woods institutions (WorldBank and IMF) and ideas propagated by supranational organizations like the OECD and the G-8, is rooted in a specific political philosophy (Scott, 1997). These institutions shape the discourse within which policies are defined (Cox, 1994) and are in fact ideologicalunderpinnings, or even embodiments, of the dominant ‘policy frame’. It should be notedthat the free market does not mean an absence of government activity because even free market systems need rules and enforcement, but it does entail a reappraisal of thegovernment’s role as overseer of economic activity (Dunning, 1997b). As free-market ideology predominates, economies become increasingly intertwined.Dunning (1997b) distinguishes in this regard between the extent of interdependency(effective boundaries of nation-states) and form of interdependence (degree and characterof boundaries’ porosity). This is also facilitated by technological developments that reduce the costs of communication, production and transportation (Lipsey, 1997; Strange, 1994). As transportation costs decrease, more and more goods are becoming ‘tradables’ (Gilpin,2001). Increased transparency (Braithwaite and Drahos, 2000) also signals an increasingrecognition of structural market failures. Disparities in economic growth or prosperity come more to the fore as economies are less and less isolated from one another. As economies become increasingly intertwined, national sovereignty may be challenged byincreased exposure to destabilizing factors like capital flows and interpenetration of markets by foreign firms (Gill, 1994). Dunning (1997b) calls this the increasing ease withwhich competitiveness-enhancing assets can move across national borders. Given thatthese assets are often the property of an ever-diversifying body of companies fromdifferent national backgrounds, governments are faced with an increasingly complex range
59
Chapter Three
of interests. The spatial boundaries of nation states and the significance of location-specificadvantages of countries need to be reconfigured as government policies are increasinglyaffected by the policies of others (Dunning, 1997). Increased transparency and the compression of time and space amounts in a sense to a crowding of more and more jurisdictions, or governance structures (Prakash and Hart,1999). Growing interconnectedness means that actors are increasingly exposed to a widerrange of potentially fundamentally different governance structures (horizontally). As problems become ‘bigger’, states are forced to delegate authority (vertically) tosupranational entities (Lake, 1999). Braithwaite and Drahos (2000) refer to this as the ‘globalization of rules’. Regulatory power is being situated in new locations (e.g. Brussels,GATT) that overlap, supersede and sometimes contradict preexisting (national) domains ingeographic space. The implications can be far reaching; Strange (1995) claims the state is ‘hollowing out’; governments are the victims of a shift in the state market balance of power. Lake (1999) adds that there are large, unclaimed political spaces in the international arena amidst the ‘mishmash of rules’ (Graham, 1997: 500), which at least to some extenthave been filled by large corporations (Prakash and Hart, 1999). Ohmae (1990) and others even go so far as to suggest that additional layers of policy complexity and governance structures signal the end of the Westphalian nation-state.In the bipolar world that preceded the fall of the Iron Curtain in 1989, there was a higher degree of certainty with respect to political allegiances and spheres of influence. Largely as a response, the geopolitical positioning of numerous nation states has shifted and changed (e.g. the former Warsaw Pact countries), and in some cases countries have disintegratedcompletely (e.g. Yugoslavia). A much wider range of countries has experienced rapideconomic and/or political transition in the same period. Fragmentation of the Cold-Warinstitutional constellation has ushered in added uncertainty for policymaking in theinternational arena and contributed to a slowdown of the multilateral process. Thatuncertainty can be linked to a diffusion and decentralization of institutional power back to the national and regional level (bloc-formation) while the market continues its climb to anincreasingly global level, signaled by a shift in the international agenda towards economicissues (Leaver, 1994). This fragmentation, however, has played a large role in thedifficulties surrounding the development of a broader multilateral system, with the rise in regionalism as an inevitable result (Baldwin, 1993). Bhagwati (1993) refers to thisphenomenon as a shift from rule-based international relations back to power-based international relations. The tension between these tendencies creates an additional level ofcomplexity for policymakers.
3.3.2 Configurations of institution-building
The changes taking place in the technological, economic and geopolitical spectrum have an impact on the configurations of social actors within which new institutions are formed.These ‘configurations of institution-building’ encompass the bargaining environment, anddescribe the interplay between the key actors which shape regulation, also known as the‘nexus of stakeholders’ (Van Itersen and Olie, 1998). Whereas older schools of thoughtemphasized the homogeneity in social organization (‘pluralist industrialism’), ‘newinstitutional’ theories emphasize the diversity in institutional structures between societies(Crouch and Streeck, 1997) and the differences in interaction between societal, economicand political actors. The analysis of recent upheaval in forms of the organization of
60
Understanding the dynamics of regionalism
production has been seen in the context of the crisis of post-Fordism (Boyer, 1997; Bakkerand Miller, 1996; Ruigrok and Van Tulder, 1995; Piore and Sabel, 1984; Aglietti, 1979).Configurations of institution-building are used in this sense to follow up on the Fordistdebate to describe the processual link between government regulation and the activities of economic actors. These configurations are defined by the number and relative influence ofstakeholders organizing production, such as business interests, labor (trade unions) and other societal actors, and particularly the role of the state (Martin, 1994). The role and influence of stakeholders is in turn a question of the ‘social embeddedness’ of economicinstitutions (Jessop, 1999). Such configurations can also be viewed as ‘concepts of control’(Ruigrok and Van Tulder, 1995). Concepts of control refer to long-term strategies forsolving five key control dilemmas: the labor process, the supply of components and raw materials, distribution and consumption, core production technologies, and finance.Although firms and banks are proactive in this process, there is also “the role to be playedby the state, including a definition of the ‘national’ or ‘common’ interest” (Ruigrok and Van Tulder 1995: 38; italics added for emphasis).Such configurations are generally analyzed at the national level (Crouch and Streeck,1997) because ‘policy space’ at this level is generally supremely sovereign. The national foundations of the spatial organization of economic activity is the subject of a large bodyof literature on ‘national systems of political economy’ (Gilpin, 2001),‘national systems ofinnovation’ (Lundvall, 1992; Nelson, 1993; Porter, 1990), ‘production regimes’(Wilkinson, 1983; Rubery, 1994) and on ‘national business systems’ (Whitley, 1992). The literature on endogenous trade theory also focuses on the motivations of policymakers and domestic interest groups in the shaping of trade policy (Baldwin, 1985, Caves, 1976). Thismeans that configurations of institution-building center on domestic actors and theirpressure activities. In other words, the establishment of concepts of control, or modes ofregulation, is a product of the domestic bargaining environment.The post-Fordist model emerged out of the work of French regulationists, most notablyAglietta (1979) and Lipietz (1987). They argue that the crises of the 1970s and 1980s signified a breakdown of the prevailing Fordist political economy, which wascharacterized by mass production technologies, a mass consumption culture, andKeynesian welfare policies. Regulationists view Fordism in a wider perspective ofcapitalist development as a sequence of internationally different historical formations thatevolve through crises and conflict. In situations of crisis, social actors are forced toabandon established norms of behavior and to develop new strategies to deal with thecrisis. Their strategies reflect different interests, different visions of the roots of the crisis,and thus different options on how to deal with the crisis; hence, strategies may be conflicting. Economic institutions are formed through the compromises made between these divergent interests and as such differ from the classical market-effectivenessapproach.Macroeconomically, there may be a new articulation of modes of production, called a regime of accumulation (Boyer and Durand, 1997). According to regulationists, each stageof capitalist development consists of a particular regime of accumulation and mode of regulation. The post-Fordist regime of accumulation is driven by new informationtechnologies and organizational networks. The regime of accumulation requires a set of fitting explicit and implicit rules and norms for its stabilization, called the mode ofregulation. This involves state, money, wage relations and modes of competition. Aglietta differentiates between two types of regime: Keynesianism and productivity coalitions,
61
Chapter Three
linking wage increases to labor productivity; and Monetarism, or supply-side economics,in which variable capital (wage goods) are rendered more cheaply. Either type will eventually reach its limits in the domestic market and require an ‘extraversion’ of accumulation strategies. This is nothing less than the internationalization of a mode of regulation under the auspices of the government; in other words, the internationalizationstrategy of the state.Fordism can be subdivided into micro-Fordism or macro-Fordism (Ruigrok and Van Tulder, 1995). ‘Macro-Fordism’ entails the simultaneous growth of production and consumption generated not only at the firm level, but also at the societal level, ‘involvingactors such as governments and national trade union federations’ (ibid, p. 12). In otherwords, macro-Fordism, also called tripartitism, (neo)corporatism and statism (Schmitter,1974; Cox, 1989) entails a centralized bargaining environment operating at all levels. In a micro-Fordist system (see also Strange’s ‘crony capitalism’), the state is highly centralizedbut non-interventionist, resulting in low levels of cohesion with business (Lane, 1992). The emphasis in economic organization is therefore at the firm level. Different post-Fordistorders have been suggested in the literature, predominant among them Toyotism,Uddevalism and flexible specialization (Boyer and Durand, 1997; Piore and Sabel, 1984).The Toyotist concept of control refers to centralized indirect or informal control over external supplier markets, shorter production runs, domestic innovation, indigenoustechnological know-how and autonomous industrialization (Van de Gevel, 1997).Toyotism is characterized by close cooperation with government as opposed toconfrontation (Ogata, 1999). Japan, with its ‘weak state’ (Ruigrok and Van Tulder, 1995)and history of close business government relations (Van de Gevel, 1997) is the primeexample of a Toyotist environment. Flexible specialization is a vision of small, flexibleand highly networked firms operating on the cutting edge through ‘a strategy of permanentinnovation: accommodation to ceaseless change, rather than an effort to control it’ (Piore and Sabel, 1984: 17). Uddevalism (derived from the name of a Volvo factory in Sweden) isactually only a theoretical basis for a production model in which the division of labor isradically reorganized through elimination of the assembly line, such that workers have much more power over machines and production, combined with a national-level capital-labor compromise (Boyer and Durand, 1993). The variation among these regimes suggeststhat there is not necessarily a universal strategy for addressing post-Fordism.Whatever its form, core companies, particularly those with cross-border activities, are anintegral part of the emergent post-Fordist order. They are the answer to the problem of microeconomic regulation. Core companies rely upon factories located around the world toproduce parts that are later assembled in one locale. They increasingly rely uponsubcontractors, part time labor, just-in-time inventory systems, and other informationtechnologies to minimize costs (Dicken, 1992). Cost minimization, however, often leads tocost externalization, as workers and ecosystems are exploited to bolster profits (Foster,1994). Brecher and Costello (1994) and others argue that post-Fordism has initiated a “race to the bottom”. Free-market ideology embodies a new growth regime, or mode of regulation, based on cost minimization, price mechanisms, intellectual property rights,open economies and productivity growth in which core companies play a key role. Othersupranational arrangements such as RIAs as well as the World Trade Organization (WTO)are suggestive of a new global mode of regulation designed to facilitate the post-Fordist regime of accumulation.
62
Understanding the dynamics of regionalism
Configurations of institution-building mean that political actors are not free to do as theyplease. Rather, much like the strategy feedback loop described in section 3.1, they arelimited by ‘a historically specific field of constraints imposed by, among other things,international power structures and the force of previous decisions’ (Brodie, 1996: 383). Inthe changing context of international policy strategies, regionalism may be part of theemergent post-Keynesian and post-Fordist order, first and foremost because concepts of control, but also competitive space, are determined less and less in domestic bargainingenvironments and policy spaces, and more so in an internationalized operating environment.
3.3.3 The role of government in organizing economic activity
Although Dunning (1997c) describes governments as simply one mode of organizingactivity (beside markets, hierarchies, intrafirm alliances), Chang and Rowthorn (1995)argue that state involvement is in any case required for the establishment of a newcoordination structure. The state is the only entity able to legalize and give backing to thenew relations of power which provide an institutional reality to the new structure. The state is also the only actor which can more or less represent the broad spectrum of interestsin the society as a whole. Chang (1994) describes the role of government as 1) creator andsustainer of institutional, legal and commercial infrastructure, 2) fashioner of valuesystems and ideologies, 3) provider of focal point around which allocative decisions can be coordinated, and 4) as the provider of a vision of the future. These are the ‘economic-productive’ activities of political governance; the realms of coercive-protective and social-communal governance (McGinnis, 1999) are not addressed here. State entrepreneurship does not stop at the provision of a vision of the future. If this visionis to be implemented, the state has to provide an institutional reality to it. This meanslooking at the state in the role of institution builder (Chang and Rowthorn, 1995: 37;original italics). It is the government’s responsibility to establish consensus, in the sense of convergent expectations among actors, and not necessarily in the sense of a harmoniousprocess (Chang and Rowthorn, 1995). States have to enlist non-state actors (often withdifferent preferences and endowments) in institutional design and implementation in a process of ‘rearticulation’ (Prakash and Hart, 1999: 15). In building institutions for the organization of economic activity, the government is also a process manager, facilitatingthe interaction of other stakeholders. Similarly, government can be seen as a market maker,linking ‘supply’ and ‘demand’ for policy interventions (Mattli, 1999a). Visions of the government’s role in organizing economic activity differ depending on theoverall view of how the economy functions. In free-market ideology, states provide publicgoods of law and order, sound money, regulation of markets, and protection from invasion,acting as it were as a benevolent nightwatchman (Gill, 1994). This entails an emphasis on market failure, and a tendency to think that less intervention is better than more (Dunning,1997c). The degree to which intervention is acceptable depends on the issue being addressed, e.g. whether the focus is unemployment reduction, social reform, nationalcompetitiveness or environmental concerns. Additionally, organizational strategies dependon the kind of market that exists, often related to sectors – in the case of agriculture, forinstance, intervention is much more widely accepted than in manufacturing.An explicit philosophical view on the state’s role in organizing economic activity startedwith Mercantilism, which argued that the political needs of the state should be served, not
63
Chapter Three
the needs of economics. Similarly ‘less enlightened’ motives for intervention can be e.g.paternalism and self-interested redistributive behavior (Lipsey, 1997) or the desire tomaintain political power (i.e., re-election) identified by public-choice theories (Grossmanand Helpman, 1994). The French Physiocrats responded with ‘laissez faire’ as the ‘natural’order of things (Dunning, 1997c: 38), which was in turn countered by welfare economics,pioneered by Arthur Pigou, largely as a reaction to the social issues that were raised by the Industrial Revolution (Chang and Rowthorn, 1995a). Welfare economists argued that free markets may not achieve a socially optimal resource allocation and that governmentmanipulation of price mechanisms could therefore be justified. This line of thought led totheories of state-led development policies developed by Raul Prébisch and NicholasKaldor.More recently, classical economic thought has generated the cost-benefit view, emphasizing rational behavior, perfect markets and Pareto optima. Government exists tocounter five major market imperfections (cf. Dunning, 1997c): structural distortions thatinhibit competition; endemic market failures due to intrinsic market impurities, likeexternalities which cause divergence between private and social welfare; the issue ofstructural unemployment; and lastly the transaction and coordination costs of economicorganization (as opposed to the production and transformation costs), meaning in essence the furnishing public goods. North and others argue that transaction costs are increasingand that in this sense the role of government may need to increase. Additionally, there are processes of technological and organizational change identified by Schumpeter (along withKondratieff), who argued that innovation was the main driver of economic change. Hebelieved that technological progress would lead to ‘instabilities in production and exchange, demand new organizational structures, and encourage more influentialgovernments’ (Dunning, 1997c: 51). In other words, even in a free-market system, the roleof government (not its absence) is crucial, and assumptions of perfect competition, price signals and optimum resource allocation say nothing about an economy in which change isendogenous and path-dependent (Lipsey, 1997). Fundamental to all the aforementionedperspectives, however, is a recognition of the costs of government intervention.
3.3.4 The macro-reality of location
Economic change is endogenous because political actors’ decisions have economic impact.In other words, issues of economic organization are where policy space and competitivespace overlap. Why is the location of economic activity relevant from a macro point ofview? Because the locus of (value-adding) activity determines policy-relevant indicators like terms of trade, growth levels, and the rents which accrue (e.g. in the form of taxes ongoods, wages and profits, which in turn has an impact on sovereignty, policy jurisdictionand ultimately the legitimacy of the state. Traditionally the best way to achieve this hasbeen to produce goods from the home country (or the relevant policymaker domain), and export to external policy domains. This generates improvements in terms of trade and thebalance of payments, tax revenues and has a positive effect on jobs and production(Vernon, 1993). Jovanovic (2001), on the other hand, argues that the logic of trade (based on Ricardo), is a matter of exporting as a means to finance imports, not as a means in itself. But this is only a perspective of consumer welfare. The issue is more than just trade, and also more than the range of selection the consumer has when shopping; put simply, themacro-reality of economic activity concerns the rents generated by location of value-added
64
Understanding the dynamics of regionalism
activities. Additionally, inward and outward investment affects factor endowments and factor demand, which has an impact on government competitiveness and ‘systemic’ power. From a policy perspective, governments want to ‘host’ economic activity, and hence themacro-reality of location is a question of attractiveness to economic actors. This applies in particular to core companies, given their ‘flagship’ function among competitors, suppliersand customers as well as their intangible assets (tacit knowledge, production techniques,core technologies). In the past this competition for foreign investment was viewed with considerable scepticism, since foreign capital was often perceived as a threat to localindustry as well as to the bargaining power of the host government (Lipsey, 1997; see alsoGuisinger, 1985). The macro-reality of economics centers on spatial inequality (Schwartz, 1994). Spatial inequality is ‘explained’ by numerous theories based on diverse assumptions, including neoclassical economics, Von Thünen rings, world-systems theoryand dependency theory. Neoclassical economics essentially argues that spatial inequality isa result of varying supply and demand curves for production factors, while Von Thünen’sargument links the relative price of goods and production factors with the distance tomarket (Jovanovic, 2001; Schwartz, 1994). Dependency centers on ‘core’ economic areasand the forced dependency of peripheral regions (i.e., the underdeveloped world) on theeconomic demands of the core, while world-systems theory argues that underdevelopmentis not solely a by-product of capitalist exploitation.Distinctly political matters of government like security and order are, especially since theIndustrial Revolution, increasingly dependent on development levels and economic growth(Pani , 1995). Mokyr (1990) distinguishes three sources of growth: ‘Solovian’ (capitalaccumulation), ‘Smithian’ (expansion of markets) and ‘Schumpeterian’ (technological change). Schwartz (1994) adds an international dimension to growth strategies bydistinguishing between Ricardian (trade-based) and Kaldorian (investment-based) growthstrategies, with the emphasis in recent times on the latter, particularly in developed economies. Although governments are seen as actively vying for foreign investment toserve their development objectives, investment is primarily directed at highly developedeconomies (Encarnation and Wells, 1986), which suggests that the stimuli for investmentin developed countries are already present, possibly in the form of the capacity for innovation (Lipsey, 1997).A key concern for governments is the possibility that core companies might relocate, particularly in response to the policy inducements of other governments (‘locationtournaments’). Governments have a dual nature: on the one hand promoting, on the otherhand protecting against global competition (Porter, 1986). Governments are interested in protecting infant industries (Doz, 1986) and also enjoy the revenues generated by importtariffs. To show that competition in policy space differs from competition in competitivespace is the fact that the major competitors of US firms are other US firms (Gilpin, 2001). Policy-induced market distortions, like restrictions on either products or on factors ofproduction are government creations intended to somehow protect domestic input or outputmarkets (Wartick and Wood, 1998). States have incentives to promote firms closelyassociated with their territorial jurisdictions (policy space), a phenomenon known as ‘commercial diplomacy’ (Prakash and Hart, 1999). In competing for locationalattractiveness, governments can play off firms against one another, but firms can do thesame; at the same time, firms try to front-load incentives, while governments try to stretchthem out (Doz, 1986). Location, therefore, has implications for the balance of powerbetween states and markets, and configurations of institution-building. Location influences
65
Chapter Three
the emergent configuration, and the configuration influences location, forming yet anotherstrategic feedback loop.
3.3.5 Assumptions of political behavior
Policy preferences are rooted in perceptions of political behavior, or, to paraphraseStephen Gill (1994), ‘theory is always for someone and for some purpose’. The mostimportant distinction in political theory is between realism and idealism (see Gilpin, 2001). Realism is very much associated with the state-centrist view of the likes of Machiavelli,Morgenthau and Bismarck. Neorealism (Waltz, 1979) takes a more holistic view in whichthe distribution of power among states is key instead of the state’s interest in itself. Theunderlying assumption is that the world system is anarchic, not in the Hobbesian sense butsuch that no higher authority than the state exists to arbitrate in international affairs.Idealism is based on John Locke and reflected in e.g. Woodrow Wilson’s League ofNations, which had as a premise that nations could work together to solve collectiveproblems in the interest of all. In the Lockean state of nature there are no institutions, onlyagents, preferences and technology to convert inputs to outputs (Schotter, 1981).Institutional development is a ‘social contract’; institutions evolve through human action but not necessarily through human design. Idealism has been less favored than realismsince the Second World War (Keohane, 1984).More recently idealist thought has been superseded by ‘liberal’ views of politics, which take a more economic perspective of politics and are concerned with the freedom and welfare of individuals. Although liberalism can be seen as a variant of realism ifindividuals are assumed to be self-interested, liberalism is actually idealist in the sense thatit assumes human beings can develop harmonized interests through rational behavior.From a practical point of view, altruism may exist simply because individuals’ respectiveinterests are mutually dependent, but Phelps (1975) argues that we should also consider thepossibility of acts of altruism based on a generalized regard for human rights, social codes,business ethics and so on (cited in Baldwin, 1985). Unlike realism, then, liberalperspectives treat economics as an area of concern in its own right instead of relegatingeconomics to a matter of politics (security). Economics is then very much a vehicle for increased cooperation between states, and free markets yield the greatest good to all.Ideas about behavior are also rooted in the era in which they are propagated. Realism haslost some if its allure because of the increasingly multilateral character of some aspects ofthe international order, such as the UN and the myriad of international conventionsgoverning international politics and economics. Idealism is more associated with in particular economics-oriented approaches that attribute benevolent characteristics to theinternational economic order. In idealist approaches, political behavior is rational orconsequence-driven, meaning individuals assess the costs and benefits prior to action(McGinnis, 1999). The state recedes to the background and has only a facilitative role inensuring the optimal functioning of the market to the end of welfare optimization. To a certain extent the idealist/realist dichotomy is one of prescription versus description,normative versus positive, or ‘soll versus ist’.Yet to assume away the strategic behavior of governments is naive and unrealistic. Realistscriticize such assumptions, arguing that behavior is more complex and much more than anaction based on a cost-benefit analysis. In fact Krasner (1978) recognized that a delimitedset of policy preferences emerges over time, which is in fact recognition that past strategic
66
Understanding the dynamics of regionalism
behavior conditions the range of strategic options in the present (history matters, andbehavior is to some extent path dependent). Sandholtz (1999) asserts that actors haveinterests or goals only in the context of social relations that produce shared meanings andvalues (Prakash and Hart, 1999). Thus, institutions are more than bargaining forums where utility maximizing states with autonomous preferences construct arrangements for minimizing transaction costs. Actors make decisions by analogy and not by cost-benefitcalculations. Decisions depend crucially on beliefs and values and how issues are framed(Prakash and Hart, 1999; Dudley and Richardson, 1997).
3.4 The choice of regionalism strategy
The perception of strategic intent, given its emphasis on the expected behavior of otheractors, can be related to realist or idealist assumptions of behavior, in particularly notionsof communal interest versus self-interest. It can be acknowledged that regionalism by itsvery nature has more of a realist approach because it assumes strategic behavior as a meansto gain something, without the assumption, implicit or explicit, that those gains will accrue to all (not even all regional parties). The very notion of strategic behavior indicates on itsface a realist-type approach, but still recognizing the need to take economics into account as more than just an issue of security. The assumption that state interaction in theinternational system is by its nature anarchic is acceptable, but the neoinstitutionalistassumption must be recognized that supranational institutions have a role in defining the strategic options (as ‘intervening variables’) available to governments (Cameron andTomlin, 2000). Finally, the concept of multi-level games is revisited to emphasize the role of international and domestic interests in shaping international policy preferences at thegovernment level.
3.4.1 Three ‘isms’ and internationalization strategies of the state
Regionalism strategies cannot be considered in isolation or as exogenous shocks; rather,they are best seen in the context of the wider debate of alternate ‘modes of regulation’ inthe global economy. These modes of regulation consist of more than just multilateralism,which could be presented as the mode of regulation of ‘globalization’ in the context of thedebate in 2.5.3. If regionalism is characterized as a mode of regulation in the context of state internationalization strategies, it must be recognized that there are other strategicoptions. Since national governments remain the most ubiquitous sovereign policymakingbodies, unilateralism must be taken into consideration as well. In theory, governments alsohave the option to ‘go it alone’ (Lung and Van Tulder, 2004), pursuing neither regional nor multilateral strategies. Unilateralism means that states retain the right, and sovereignty, topursue their own interests, regardless of the interests of other states. Regionalism isinternationalization of the state within a ‘club’ framework, and multilateralism is fullcommitment to the neo-liberal ideology of market liberalization. In this sense regionalismis more than a description of policy choices; rather, it is an ideology as well. The three mayseem mutually exclusive as ideologies, but as internationalization strategies of the state, they can be complementary.Figure 3.6 demonstrates how unilateralism, regionalism and multilateralism can be relatedconceptually. In the ‘regionalism vs. globalism’ debate the dichotomy is between thepursuit of state internationalization strategies primarily through multilateralism (‘strong’
67
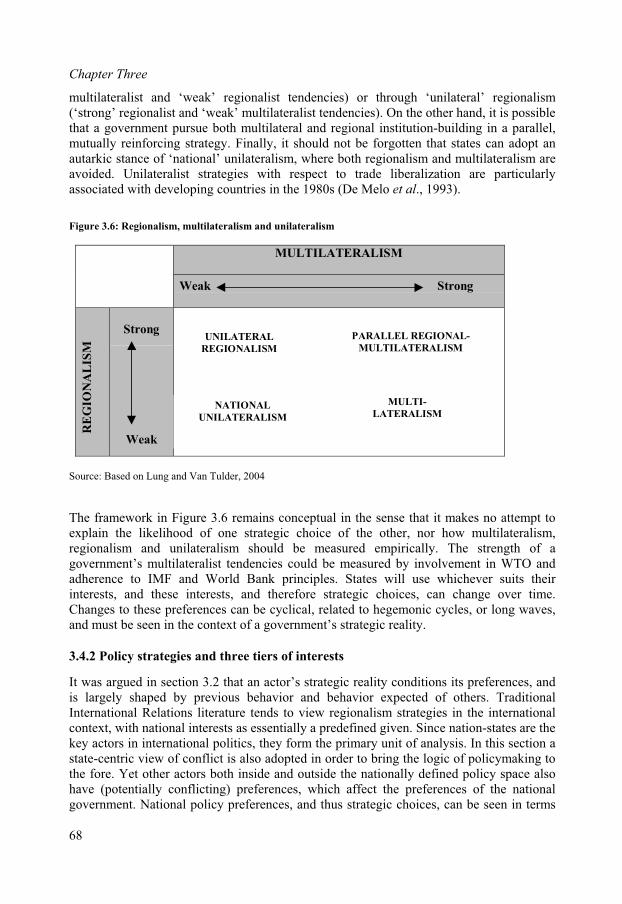
Chapter Three
multilateralist and ‘weak’ regionalist tendencies) or through ‘unilateral’ regionalism(‘strong’ regionalist and ‘weak’ multilateralist tendencies). On the other hand, it is possible that a government pursue both multilateral and regional institution-building in a parallel,mutually reinforcing strategy. Finally, it should not be forgotten that states can adopt an autarkic stance of ‘national’ unilateralism, where both regionalism and multilateralism areavoided. Unilateralist strategies with respect to trade liberalization are particularlyassociated with developing countries in the 1980s (De Melo et al., 1993).
Figure 3.6: Regionalism, multilateralism and unilateralism
MULTILATERALISM
Weak Strong
Strong
Weak
UNILATERAL
REGIONALISM
PARALLEL REGIONAL-
MULTILATERALISM
NATIONAL
UNILATERALISM
MULTI-
LATERALISM
RE
GIO
NA
LIS
M
Source: Based on Lung and Van Tulder, 2004
The framework in Figure 3.6 remains conceptual in the sense that it makes no attempt toexplain the likelihood of one strategic choice of the other, nor how multilateralism,regionalism and unilateralism should be measured empirically. The strength of a government’s multilateralist tendencies could be measured by involvement in WTO and adherence to IMF and World Bank principles. States will use whichever suits theirinterests, and these interests, and therefore strategic choices, can change over time.Changes to these preferences can be cyclical, related to hegemonic cycles, or long waves, and must be seen in the context of a government’s strategic reality.
3.4.2 Policy strategies and three tiers of interests
It was argued in section 3.2 that an actor’s strategic reality conditions its preferences, and is largely shaped by previous behavior and behavior expected of others. TraditionalInternational Relations literature tends to view regionalism strategies in the internationalcontext, with national interests as essentially a predefined given. Since nation-states are the key actors in international politics, they form the primary unit of analysis. In this section astate-centric view of conflict is also adopted in order to bring the logic of policymaking tothe fore. Yet other actors both inside and outside the nationally defined policy space also have (potentially conflicting) preferences, which affect the preferences of the national government. National policy preferences, and thus strategic choices, can be seen in terms
68
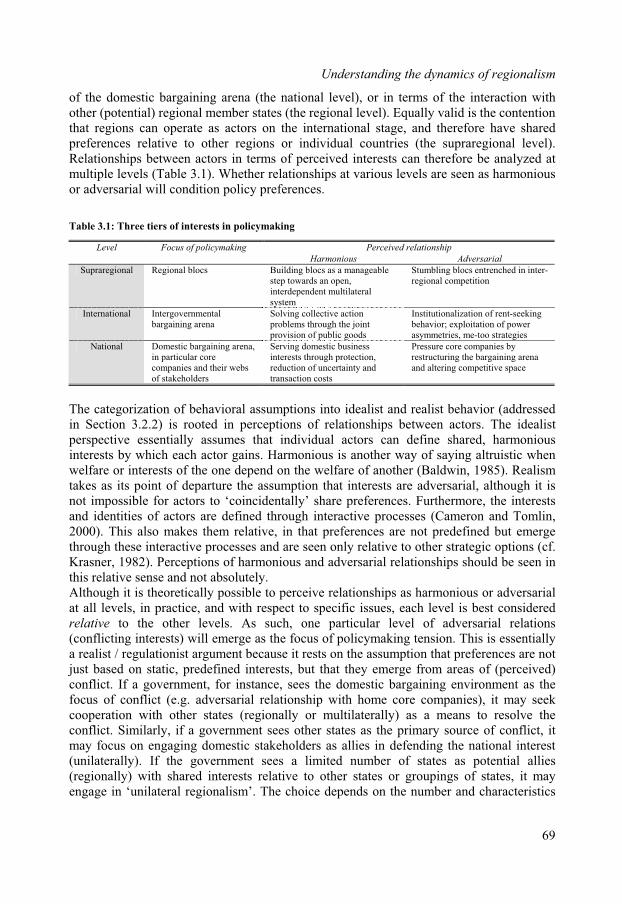
Understanding the dynamics of regionalism
of the domestic bargaining arena (the national level), or in terms of the interaction withother (potential) regional member states (the regional level). Equally valid is the contentionthat regions can operate as actors on the international stage, and therefore have shared preferences relative to other regions or individual countries (the supraregional level).Relationships between actors in terms of perceived interests can therefore be analyzed at multiple levels (Table 3.1). Whether relationships at various levels are seen as harmoniousor adversarial will condition policy preferences.
Table 3.1: Three tiers of interests in policymaking
Perceived relationshipLevel Focus of policymaking
Harmonious Adversarial
Supraregional Regional blocs Building b glocs as a mana eable Stumblingstep towards an open,interdependent multilateralsystem
blocs entrenched in inter-regional competition
International Intergovernmental Institutionalization of rent-seeking bargaining arena
Solving collective action problems through the jointprovision of public goods
behavior; exploitation of powerasymmetries, me-too strategies
National Domestic bargaining arena, in particular core companies and their webs of stakeholders
Serving domestic business interests through protection,reduction of uncertainty and transaction costs
naPressure core companies by
rerestructuring the bargaining aand altering competitive space
The categorization of behavioral assumptions into idealist and realist behavior (addressed
perceive relationships as harmonious or adversarial
in Section 3.2.2) is rooted in perceptions of relationships between actors. The idealistperspective essentially assumes that individual actors can define shared, harmoniousinterests by which each actor gains. Harmonious is another way of saying altruistic when welfare or interests of the one depend on the welfare of another (Baldwin, 1985). Realismtakes as its point of departure the assumption that interests are adversarial, although it isnot impossible for actors to ‘coincidentally’ share preferences. Furthermore, the interests and identities of actors are defined through interactive processes (Cameron and Tomlin,2000). This also makes them relative, in that preferences are not predefined but emergethrough these interactive processes and are seen only relative to other strategic options (cf. Krasner, 1982). Perceptions of harmonious and adversarial relationships should be seen inthis relative sense and not absolutely.Although it is theoretically possible toat all levels, in practice, and with respect to specific issues, each level is best considered relative to the other levels. As such, one particular level of adversarial relations(conflicting interests) will emerge as the focus of policymaking tension. This is essentiallya realist / regulationist argument because it rests on the assumption that preferences are not just based on static, predefined interests, but that they emerge from areas of (perceived) conflict. If a government, for instance, sees the domestic bargaining environment as thefocus of conflict (e.g. adversarial relationship with home core companies), it may seekcooperation with other states (regionally or multilaterally) as a means to resolve theconflict. Similarly, if a government sees other states as the primary source of conflict, itmay focus on engaging domestic stakeholders as allies in defending the national interest(unilaterally). If the government sees a limited number of states as potential allies (regionally) with shared interests relative to other states or groupings of states, it mayengage in ‘unilateral regionalism’. The choice depends on the number and characteristics
69
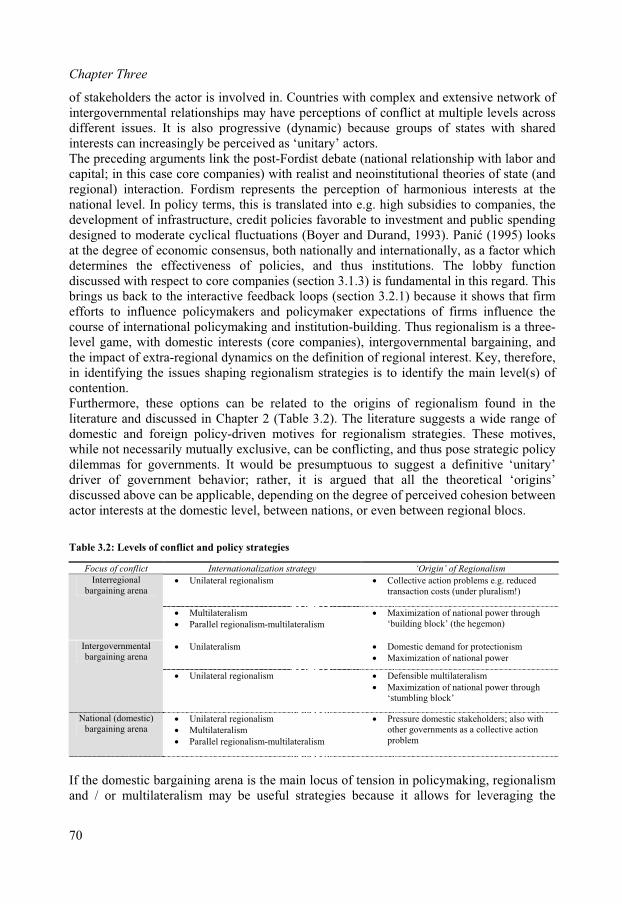
Chapter Three
of stakeholders the actor is involved in. Countries with complex and extensive network of intergovernmental relationships may have perceptions of conflict at multiple levels across different issues. It is also progressive (dynamic) because groups of states with sharedinterests can increasingly be perceived as ‘unitary’ actors.The preceding arguments link the post-Fordist debate (national relationship with labor and
these options can be related to the origins of regionalism found in the
Table 3.2: evels of conflict and policy strategies
ategy ‘Origin’ of Regionalism
capital; in this case core companies) with realist and neoinstitutional theories of state (andregional) interaction. Fordism represents the perception of harmonious interests at thenational level. In policy terms, this is translated into e.g. high subsidies to companies, thedevelopment of infrastructure, credit policies favorable to investment and public spendingdesigned to moderate cyclical fluctuations (Boyer and Durand, 1993). Pani (1995) looksat the degree of economic consensus, both nationally and internationally, as a factor whichdetermines the effectiveness of policies, and thus institutions. The lobby functiondiscussed with respect to core companies (section 3.1.3) is fundamental in this regard. Thisbrings us back to the interactive feedback loops (section 3.2.1) because it shows that firmefforts to influence policymakers and policymaker expectations of firms influence the course of international policymaking and institution-building. Thus regionalism is a three-level game, with domestic interests (core companies), intergovernmental bargaining, andthe impact of extra-regional dynamics on the definition of regional interest. Key, therefore,in identifying the issues shaping regionalism strategies is to identify the main level(s) ofcontention.Furthermore,literature and discussed in Chapter 2 (Table 3.2). The literature suggests a wide range of domestic and foreign policy-driven motives for regionalism strategies. These motives,while not necessarily mutually exclusive, can be conflicting, and thus pose strategic policydilemmas for governments. It would be presumptuous to suggest a definitive ‘unitary’driver of government behavior; rather, it is argued that all the theoretical ‘origins’discussed above can be applicable, depending on the degree of perceived cohesion betweenactor interests at the domestic level, between nations, or even between regional blocs.
L
Focus of conflict Internationalization str
Unil Collect educedateral regionalism ive action problems e.g. rtransaction costs (under pluralism!)
Interregionalbargaining arena
Multilateralism
sm-multilateralism
ugh
Parallel regionali
Maximization of national power thro‘building block’ (the hegemon)
Unilateralism Domestic demand for protectionism
Maximization of national power
Intergovernmentalbargaining arena
Unilateral regionalism
wer through
Defensible multilateralism
Maximization of national po‘stumbling block’
National (domestic)bargaining arena
Unilateral regionalism
ltilateralism
takeholders; also with
Multilateralism
sm-muParallel regionali
Pressure domestic sother governments as a collective action problem
the domestic bargaining arena is the main locus of tension in policymaking, regionalismand / or multilateralism may be useful strategies because it allows for leveraging the If
70
Understanding the dynamics of regionalism
weight of a larger political entity (e.g. regional members, the WTO) in forcing through reforms (the ‘lock-in’ option). If governments see relative cohesion at the national level,but perceive themselves to be predominantly engaged in competition with other states, theymay adopt a unilateralist position, either in response to domestic demand (often for protectionism) or as a strategy of national power maximization (through minimalsovereignty concessions). On the other hand, even under conditions of perceived conflict, a government may choose to opt into an RIA as a form of defensible multilateralism as a ‘least risk’ strategy, or as a strategy to enhance national power by limiting the progress of multilateralism (facilitating the ‘stumbling block’). The third possibility involves shared interests with a select number of other governments, and perceived conflict with otherstates or clusters of states (e.g., regions). In this case strategies can be inward or outward inorientation. The former essentially encompasses collective action problems, such as the reduction of intra-regional transaction costs and coupling supply and demand at theregional level. The latter involves the use of regionalism as a stepping stone towardsmultilateralism, which allows the government (through the weight of the regional grouping) to have extra influence in determining the future shape of multilateralism.Additionally multilateralism can be employed selectively as a flanking strategy toundermine the strength of other regional groupings.
3.4.3 Positioning in choosing a regionalism strategy
to specific strategic issues facing
that governments
00) argue that the
How perceptions of conflict at various levels are relatedgovernments, and how these can lead to the initiation of RIAs is beyond the scope of this study. However, it can be argued that perceptions of conflict are related to issues of power and strategic positioning which do have a direct bearing on the decision to regionalize, and the decision as to what form of RIA to undertake (e.g., a PTA or a CM), and how therelevant policy mechanisms (see section 2.4) can best be implemented. Since strategicbehavior with respect to regionalism is based on an actor’s strategic reality (positioning) aswell as expectations of other actors (other governments as well as core companies),perceptions of conflict are relevant. Perceived levels of conflict are related to relativedevelopment levels, market power and hegemony, and pre-existing economic and political relations (i.e., the outcomes of previous strategic positioning behavior).First of all, it can be argued that the level of perceived conflict is fundamental in limitingthe extent of policy cooperation, or the depth of integration. This meansinvolved in an adversarial relationship with the interests of big business will have moredifficulty engaging in extensive policy cooperation with others, even though they may see it as in their interest to do so (pressuring domestic stakeholders through ‘lock-in’ strategiesetc.). In other words, invasive and costly exercises of ‘deep’ integration, like a commonmarket or a monetary union, are only feasible if there is enough of a shared vision betweengovernment and core companies at the national level as well as sufficient ‘critical mass’among a number of like-minded governments at the ‘regional’ level.There is considerable disagreement on the relationship between internal cohesion / conflictand international bargaining strategies. Cameron and Tomlin (20perceived level of harmony between domestic interests and government (internal cohesion)is in fact a by-product of a country’s relative international bargaining power. Theirargument is that powerful states have more room to listen to their domestic constituentsthan weaker states, which are forced more to cater to outside influences than press their
71

Chapter Three
own domestically-driven agenda. This is dubious, because their underlying assumption is that the government prefers not to engage in supranational cooperation for fear of havingsome ‘weakness’ exploited, whereas in this particular case it is argued that the governmentwants to employ a regionalism strategy precisely for the purpose of undermining theposition of (adversarial) domestic stakeholders. Harmonious interests at the national levelhave in this sense bearing on the strength and the character of regionalist tendencies.Others argue that internal divisions may be an asset because negotiators can stall and smokescreen on the international bargain, and then argue they ‘couldn’t get more’concessions from their constituents (the ‘Schelling conjecture’; Meunier, 2000). Milner and Rosendorff (1997) argue otherwise, claiming that internal divisions among domesticstakeholders make ratification less likely, tilt the outcome towards protectionism andweaken the country’s negotiating power relative to other countries.The political theories reviewed here use the two levels of Putnam to make their case, i.e. the executive (the international negotiator) and legislators (responsible for ratification). Yet
ates, and
p in a preexisting region. His argument is based on the prospect
the overemphasis on politics in these studies makes them weak for our purposes. It can beargued that adversarial relations between government and domestic interest groups, inparticular core companies, will weaken that country’s bargaining power because, unlike in the case of legislators (the domestic level in Putnam), core companies have more power in shaping the restructuring outcome after the implementation of the institutional outcome(the international ‘bargain’, in this case an RIA). For bargaining partners (othergovernments), power of this nature has a different significance, because core companieshave direct disposition over the allocation of economic resources, much more thanlegislators do. Additionally, the consequences of core company allocative power are farther reaching, because the life-span of the average core company (see Van Tulder et al.,2001) is considerably longer than the term in office of the average Congressman.International restructuring processes (and therefore regionalism strategies) are games ofstrategic positioning between governments and domestic stakeholders, between steven between regions. In international negotiations, ‘market power remains the basicprerequisite to gaining concessions’ (Canadian NAFTA negotiator Michael Hart, quoted inCameron and Tomlin, 2000: 15). Strategic positioning is a question of power, but power does not stem solely from harmonious relations with domestic interests. Market powerconcerns positioning relative to other countries, which is for instance also related todevelopment levels. One of the ‘new’ aspects of the recent wave of Regionalism is that it is not specifically a developing country phenomenon. The emergence of RIAs betweencountries of disparate development levels must to some extent be a factor in the increasingcomplexity of policy strategies. The degree to which a policymaker disposes over resources will affect the strategic intent, and thereby determine the outcome, of aregionalism strategy.Mattli (1999b), for instance, suggests that lower growth levels will stimulate any given country to seek membershiof free-riding, but it is also valid in that economically weaker countries will have moredifficulty initiating a new RIA because they lack the political weight to pull it off. There is also a more economic rationale drawn from his ‘supply and demand’ argument: the morewell-off a nation is, the lower the relative gains that can reasonably be expected fromintegration. On the other hand, there may exist a minimum level of prosperity required for integration, since countries without much to trade or without developed markets will standlittle to gain from integration in economic terms. Winters (1999) claims that disparities in
72

Understanding the dynamics of regionalism
development levels are crucial to the choice of regionalism strategy. He argues that incases of North-South integration (i.e., NAFTA), the central issue pertains more toattracting investment to the developing partner than trade, and that investment in the Southis a stabilizing factor from which the North also benefits. Development issues, such as Ethier’s (2001) terms of trade sensitivity, have to do with how sensitive or vulnerable a country is to the actions of others.The arguments above suggest that a country’s power, be it market power, military power or systemic power, should be seen relative to the countries with which it interacts; in other
ive potential market gains from integration, and that an ‘absence of
stemic
words, a country’s position in a larger constellation of economic activity will largely determine its bargaining power. That constellation is finite and unique to each country, asopposed to the notion that each country is positioned relative to some static median or the‘rest of the world’ as a whole. Not all countries ‘do business’ with all other countries.Bargaining becomes a question of relative political asymmetries (Cameron and Tomlin,2000) within a country’s specific geopolitical network. This returns to the question of hegemony versus political pluralism (cf. Wartick and Wood, 1998). Mattli (1999b) and Van Tulder and Audet (2004) look at this as an outcome (see section 2.4.1), when in fact itis equally relevant, if not more so, to consider power asymmetries (and related informationasymmetries) as a factor in determining both the institutional and the restructuringoutcome. Whether regional integration can only occur in the absence of a ‘global’hegemon or not is immaterial; the fact is that regions themselves may be dominated by aregional hegemon.Mattli (1999b) argues that uncontested regional leadership increases the chance of success, combined with relatleadership’ can cripple a region. His argument suggests that a ‘hub and spoke’constellation in a region will be the most successful. Dent (1997) in essence supports this view, stating that an RIA will be more successful if one of the members is already a majortrading power, and that the international bargaining power of the region will profit fromsuch membership. In addition, it will attract new members (like Austria and Sweden in thecase of the EU). Yet Haggard (1997) talks of political and economic heterogeneity as being a barrier to integration. If a region is dominated by one or more power, the contents of theagreement may be more a reflection of their interests than of the other members. The me-too strategies of countries feeling left out, or as a strategic complement, are examples of strategies determined largely by the policy preferences of others. Regionalism under ahegemonial banner may then be unsustainable in the long run since not all parties areequally convinced of its benefits. This logic suggests that regionalism can only be used as a strategy to maximize national power by states which are already relatively strong.Further, as was demonstrated in the discussion on trade policy in 2.4.3, size matters (theoptimal tariff argument). Hegemony is not just about market power; it includes sypower as well. In the event of a large hegemonic power, protection can seem moreadvantageous because the overall larger market and pool of resources will appear‘sufficient’ for the growth ambitions of all members, rooted in the logic of ‘importprotection in order to export’ (Gilpin 2001: 124). We have seen in our exposition of protection that development levels matter; yet it is too simple to say that the one always means the other. For instance, if a region is composed of developing economies dominatedby an external hegemon, the region is less likely to be protectionist because the hegemonwill almost certainly agitate for some kind of preference (for which, it should berecognized, the hegemon incurs few costs in the form of public goods provision). Member
73

Chapter Three
countries may attempt to counter such external pressure by opting for shallow, relativelypoorly institutionalized integration, which lends itself less easily to exploitation by outside powers (as Haggard [1997] argues in the case of ASEAN and the US and Japan). Panic(1995) supports the relationship between depth of integration and political independence, claiming that policies cannot be effective if decisions are imposed from outside. This is notnecessarily the case, however: policies can be extremely effective but may not serve the interests of the government in question.The last factor which will influence the shape and character of regionalism strategies theeconomic relations which existed prior to the RIA’s inception (i.e., on the basis of
less demand (in Asia, for example) for policy coordination because of
el
arguing that previous policy decisions and
‘harmonious relations’ among countries). Most likely the region will be formed with partners with high degree of preexisting economic relations although, as we have seen inthe case of the external hegemon, it is possible that the region be formed among nationswhose strongest partners are outside the region. The more intertwined economies are, themore difficult it becomes to pursue national interests. However, interests can be definedmore communally by virtue of that interdependence (Pani , 1995), such that internationalrelationships are seen less and less as the main focus of tension. This may be the case, for instance, when economic relations are based on complementarity (Dent, 1997; Cable and Henderson, 1994).Haggard (1997) suggests that interdependency may act as a substitute for integration,saying there may bethe extensive interdependency in terms of trade and investment. On the other hand, itseems more likely that the less similarity, the narrower the scope of policy areas forcooperation will be, and the shallower (less extensive) cooperation in those areas can beanticipated and the less intensity the RIA will have. Individual actors which are strong but internally divided will be weak. This goes for regions as well. If the member states do notshare the same vision and the region becomes a vehicle for political infighting and intra-regional maneuvering, the region will not amount to much. Then there are likely to be other motives driving the integration push, such as ‘window dressing’, an even greaterexternal threat, or bandwagon effects. At the same time, it is conceivable that a countrydecides to ‘opt out’ of regional integration altogether and adopt a ‘go-it-alone’ strategy.Regionalism outcomes can be operationalized according to the relative strength and bargaining power of their members, as Van Tulder and Audet (2004) and Ten Nap(1998) have shown (Table 3.3). The typology ranges from egalitarian arrangements, where economic contributions are balanced and where political decisionmaking occurs at the regional level through pluralist voting, to outside-dominated RIAs, where trade andinvestment are primarily extra-regional and regional institutions are weak or under extensive influence from a non-member state.The considerations addressed above fit into the logic of strategic feedback loops (section3.1 and 3.2) because this is nothing else thanpositioning behavior, and the behavior of others, conditions the strategic reality in thepresent. The strategic element of regional integration implicitly introduces the factor of time: policy-makers and firm strategists have to deal with a timeline when planning policyand strategy with respect to regional integration. It is important to recognize that thisfeedback loop runs right through all three levels discussed above. The extent to which thedifferent levels are perceived as harmonious or adversarial determines the relativeimportance of those levels, and thus the related points in the feedback loop. Regionalism isan attempt to change the power positioning game.
74
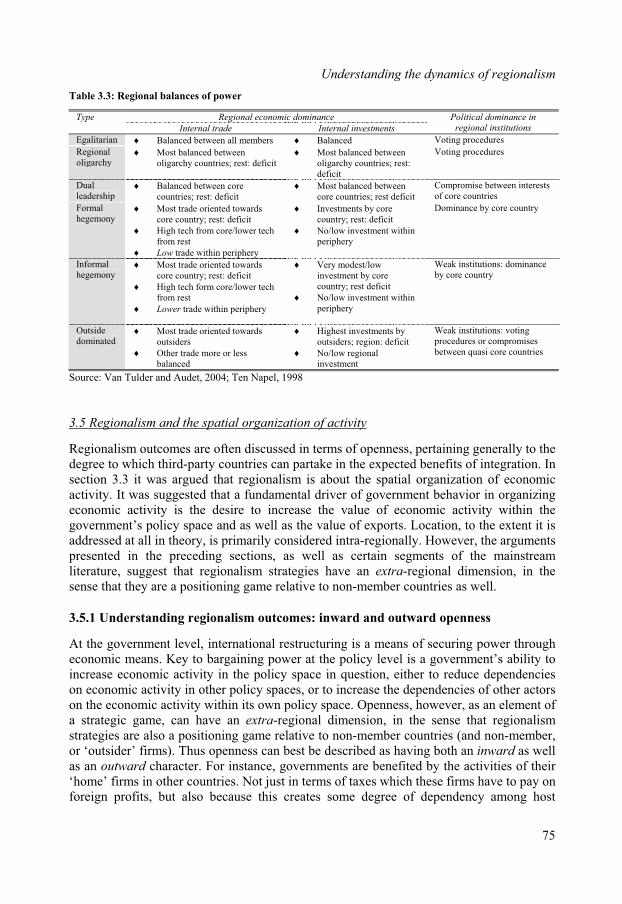
Understanding the dynamics of regionalism
Table 3.3: Regional balances of power
Regional economic dominanceType
Internal trade Internal investments
Political dominance in
regional institutions
Egalitarian Balanced between all members Balanced Voting procedures
Regionaloligarchy
Most balanced boliga
balanced betweenst:
Votetweenest: deficit
Mostrchy countries; r oligarchy countries; re
deficit
ing procedures
Dualleadership
Balanced between core countries; rest: deficit
Most balanced between core countries; rest deficit
Compromise betweeof core countries
n interests
Formalhegemony
er tech
Dominance by core countryMost trade oriented towards core country; rest: deficit
High tech from core/lowfrom rest
Low trade within periphery
Investments by core country; rest: deficit
No/low investment withinperiphery
Informal Most trade oriented towards core country; rest: deficit
High tech form core/lower tech st deficit
within
Weak institutions: dominanceby core country
from rest
Lower trade within periphery
Very modest/lowinvestment by core country; re
No/low investmentperiphery
hegemony
Outsidedominated
Most trade oriented towards outsiders
Other trade more or less balanced
Highest investments byoutsiders; region: deficit
No/low regional
Weak institutions: voting procedures or compromisesbetween quasi core countries
investment
S T
of activity
ource: Van ulder and Audet, 2004; Ten Napel, 1998
3.5 Regionalism and the spatial organization
pertaining generally to thexpected benefits of integration. In
At the government level, international restructuring is a means of securing power throughs ability to
Regionalism outcomes are often discussed in terms of openness,degree to which third-party countries can partake in the esection 3.3 it was argued that regionalism is about the spatial organization of economicactivity. It was suggested that a fundamental driver of government behavior in organizingeconomic activity is the desire to increase the value of economic activity within thegovernment’s policy space and as well as the value of exports. Location, to the extent it is addressed at all in theory, is primarily considered intra-regionally. However, the argumentspresented in the preceding sections, as well as certain segments of the mainstreamliterature, suggest that regionalism strategies have an extra-regional dimension, in thesense that they are a positioning game relative to non-member countries as well.
3.5.1 Understanding regionalism outcomes: inward and outward openness
economic means. Key to bargaining power at the policy level is a government’increase economic activity in the policy space in question, either to reduce dependencies on economic activity in other policy spaces, or to increase the dependencies of other actors on the economic activity within its own policy space. Openness, however, as an element ofa strategic game, can have an extra-regional dimension, in the sense that regionalismstrategies are also a positioning game relative to non-member countries (and non-member,or ‘outsider’ firms). Thus openness can best be described as having both an inward as well as an outward character. For instance, governments are benefited by the activities of their ‘home’ firms in other countries. Not just in terms of taxes which these firms have to pay on foreign profits, but also because this creates some degree of dependency among host
75
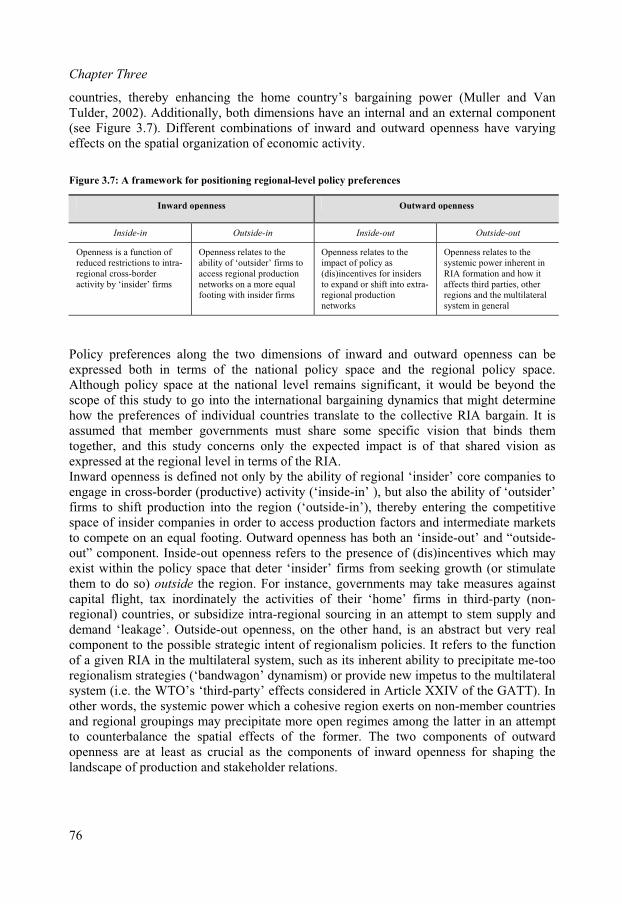
Chapter Three
countries, thereby enhancing the home country’s bargaining power (Muller and Van Tulder, 2002). Additionally, both dimensions have an internal and an external component(see Figure 3.7). Different combinations of inward and outward openness have varyingeffects on the spatial organization of economic activity.
Figure 3.7: A framework for positioning regional-level policy preferences
Inward openness Outward openness
Inside-in Outside-in Inside-out utside-outO
Openness is a function of reduced restrictions to intra-
Openness relates to the ability o rms to
l
Openness relates to the impact o
tra-
Openness relates to the systemi nt in
it r
regional cross-border activity by ‘insider’ firms
f ‘outsider’ fiaccess regional production networks on a more equafooting with insider firms
f policy as (dis)incentives for insiders to expand or shift into exregional production networks
c power inhereRIA formation and howaffects third parties, otheregions and the multilateralsystem in general
Policy preferences along the two dimensions of inward and outward openness can be expressed both in terms of the national policy space and the regional policy space.
in’ ), but also the ability of ‘outsider’
Although policy space at the national level remains significant, it would be beyond the scope of this study to go into the international bargaining dynamics that might determinehow the preferences of individual countries translate to the collective RIA bargain. It isassumed that member governments must share some specific vision that binds themtogether, and this study concerns only the expected impact is of that shared vision asexpressed at the regional level in terms of the RIA.Inward openness is defined not only by the ability of regional ‘insider’ core companies toengage in cross-border (productive) activity (‘inside-firms to shift production into the region (‘outside-in’), thereby entering the competitivespace of insider companies in order to access production factors and intermediate marketsto compete on an equal footing. Outward openness has both an ‘inside-out’ and “outside-out” component. Inside-out openness refers to the presence of (dis)incentives which mayexist within the policy space that deter ‘insider’ firms from seeking growth (or stimulatethem to do so) outside the region. For instance, governments may take measures againstcapital flight, tax inordinately the activities of their ‘home’ firms in third-party (non-regional) countries, or subsidize intra-regional sourcing in an attempt to stem supply anddemand ‘leakage’. Outside-out openness, on the other hand, is an abstract but very realcomponent to the possible strategic intent of regionalism policies. It refers to the functionof a given RIA in the multilateral system, such as its inherent ability to precipitate me-tooregionalism strategies (‘bandwagon’ dynamism) or provide new impetus to the multilateralsystem (i.e. the WTO’s ‘third-party’ effects considered in Article XXIV of the GATT). Inother words, the systemic power which a cohesive region exerts on non-member countriesand regional groupings may precipitate more open regimes among the latter in an attemptto counterbalance the spatial effects of the former. The two components of outwardopenness are at least as crucial as the components of inward openness for shaping thelandscape of production and stakeholder relations.
76
Understanding the dynamics of regionalism
3.5.2 The effects of regionalism policies on openness
As yet these dimensions remain abstract. However, the mechanisms of regionalismexplained in Chapter 2 can be used to operationalize the dimensions of inward and outwardopenness. Since each form of RIA has its own logic and its own combination of policymechanisms, the mechanisms regulating openness will differ. We therefore return to themechanisms through which regionalism strategies are pursued (section 2.4) and theinstitutional outcomes they generate (RIAs) to identify the main strategic componentbehind each type of RIA. In other words, how do governments intend these policymechanisms to explicitly shape the spatial organization of economic activity? Thisquestion can be addressed by discussing effects of regionalism policies on the locationaladvantages of the region.The discussion of economic outcomes of regionalism in the literature (section 2.4.2) dealsindirectly with mechanisms of inward openness, but the assumed consequences forlocation were not yet made explicit. Some measures do not have an explicit locationalassumption, however, and many are only relevant in relation to policy measures enacted bynon-members and cannot be given a clear value. Here is where the ceteris paribusassumption is crucial: if tariffs and investment conditions in the rest of the world remainconstant, an increase in the locational attractiveness of a given region should lead toshifting economic activity towards that region. The mechanisms governing inwardopenness by form of RIA are discussed below (Table 3.4). For the PTA, openness is governed by the relative reduction in intra-regional tariff barriersand how attractive this makes it to operate within that regional market. This can be amatter of market size, or a regional division of labor. Similar arguments apply to the PCU,except that changes in openness depend on the increase in the CET relative to the pre-RIAsituation instead of relative intra-regional tariff reductions. If the CET represents a tariff-barrier increase, it may stimulate extra-regional firms to ‘jump’ the tariff wall by investingwithin the region. If the CET represents a reduction, it may signal a reduced incentive toproduce within the region. The FTA introduces locational effects of a more serious order inthe form of the rules of origin. By requiring goods sold on the regional market to be produced, up to a point, using regional production factors (or risk subjection to tariffs), theFTA is by its nature designed to be inwardly open. Ultimately, ceteris paribus, the FTA is designed to attract economic activity through rules-of-origin requirements (a form of rentseeking; Haggard, 1997). The CU is in essence a combination of the PTA and the PCU,with both a relative reduction in intra-regional tariffs and a CET, which allows inside firmsto profit from the larger market and lower transaction costs while drawing in outside firmsto circumvent the CET. Under the CM, the free movement of factors together withcompetition policy regulates not only the intra-regional cross-border flows of activity, butthe outside-in activity as well. In the EMU, a common monetary policy reduces intra-regional transaction costs, risk and uncertainty. The EPU adds to this a more abstract overall risk reduction, but posits in addition the risk of dealing with a larger government(bargaining partner) when it comes to lobbying.How these mechanisms regulate outward openness and effect outward dynamics, however, remains underemphasized. Outward openness is difficult to address as it concerns relative(dis)incentives to remain regional or to seek markets, knowledge or assets elsewhere, as well as the responses of other political and economic actors to the RIA. The policy focus is overwhelmingly on inward dynamics, i.e. the changes to the characteristics of the
77
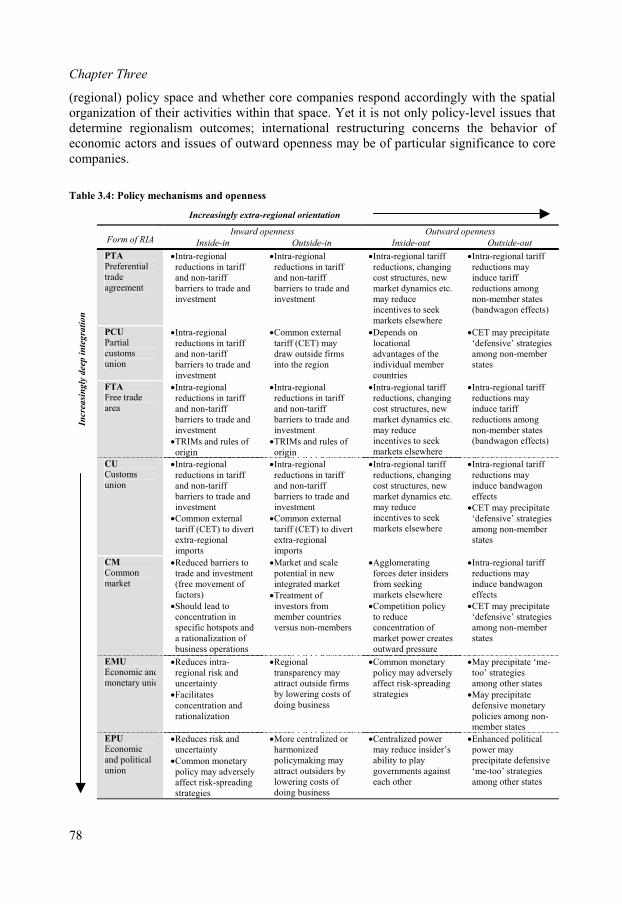
Chapter Three
(regional) policy space and whether core companies respond accordingly with the spatial organization of their activities within that space. Yet it is not only policy-level issues that determine regionalism outcomes; international restructuring concerns the behavior ofeconomic actors and issues of outward openness may be of particular significance to corecompanies.
Table 3.4: Policy mechanisms and openness
Increasingly extra-regional orientation
Inward openness Outward openness Form of RIA Inside-in Outside-in Inside-out Outside-out
PTAPreferentialtradeagreement
Intra-regionalreductions in tariff and non-tariff barriers to trade and investment
Intra-regionalreductions in tariff and non-tariff barriers to trade and investment
Intra-regional tariff reductions, changing cost structures, new market dynamics etc. may reduce incentives to seek markets elsewhere
Intra-regional tariff reductions mayinduce tariff reductions amongnon-member states (bandwagon effects)
PCUPartialcustomsunion
Intra-regionalreductions in tariff and non-tariff barriers to trade and investment
Common external tariff (CET) maydraw outside firmsinto the region
Depends on locationaladvantages of the individual membercountries
CET may precipitate ‘defensive’ strategies among non-memberstates
FTAFree trade area
Intra-regionalreductions in tariff and non-tariff barriers to trade and investment
TRIMs and rules of origin
Intra-regionalreductions in tariff and non-tariff barriers to trade and investment
TRIMs and rules of origin
Intra-regional tariff reductions, changing cost structures, new market dynamics etc. may reduce incentives to seek markets elsewhere
Intra-regional tariff reductions mayinduce tariff reductions amongnon-member states (bandwagon effects)
CUCustomsunion
Intra-regionalreductions in tariff and non-tariff barriers to trade and investment
Common external tariff (CET) to divert extra-regionalimports
Intra-regionalreductions in tariff and non-tariff barriers to trade and investment
Common external tariff (CET) to divert extra-regionalimports
Intra-regional tariff reductions, changing cost structures, new market dynamics etc. may reduce incentives to seek markets elsewhere
Intra-regional tariff reductions mayinduce bandwagoneffects
CET may precipitate ‘defensive’ strategies among non-memberstates
CMCommonmarket
Reduced barriers to trade and investment(free movement of factors)
Should lead to concentration in specific hotspots and a rationalization of business operations
Market and scale potential in newintegrated market
Treatment of investors frommember countries versus non-members
Agglomeratingforces deter insiders from seeking markets elsewhere
Competition policyto reduce concentration of market power creates outward pressure
Intra-regional tariff reductions mayinduce bandwagoneffects
CET may precipitate ‘defensive’ strategies among non-memberstates
EMUEconomic and monetary union
Reduces intra-regional risk and uncertainty
Facilitatesconcentration and rationalization
Regionaltransparency mayattract outside firmsby lowering costs of doing business
Common monetarypolicy may adverselyaffect risk-spreading strategies
May precipitate ‘me-too’ strategies among other states
May precipitate defensive monetarypolicies among non-member states
I
ncr
easi
ng
ly d
eep
in
teg
rati
on
EPUEconomicand political union
Reduces risk and uncertainty
Common monetarypolicy may adverselyaffect risk-spreading strategies
More centralized or harmonizedpolicymaking mayattract outsiders bylowering costs of doing business
Centralized powermay reduce insider’sability to playgovernments against each other
Enhanced political power mayprecipitate defensive ‘me-too’ strategies among other states
78
Understanding the dynamics of regionalism
In addition to the ceteris paribus assumptions with respect to the rest of the world, thelogic of international trade and investment policy mechanisms rests largely on assumptionsof the relationship between trade and investment. Whether they are substitutes from aneconomic point of view is a matter of academic debate and the behavior of firms. It should be recognized, however, that they are not substitutes to governments, in that the gains, costs and relevant policy issues differ.Note also that the vertical and horizontal axes indicate an increasingly extra-regional orientation as integration deepens. Whereas a PTA, for example, primarily addresses issuesof intra-regional openness, the EPU carries with it significantly greater political ‘weight’and bargaining power. The relationship between depth and outside openness can also be linked to the notion of relative realms of conflict, in that deeper integration signals a higherperception of intra-regional harmony, which by default increases the perception of potentially adversarial extra-regional relationships. Hence sources of conflict are likely tobe perceived as increasingly external to the regional members themselves as integrationdeepens.In practical terms, changing openness is not only a question of policy-level issues thatdetermine policy-level regionalism strategies. International restructuring is an issue of therestructuring behavior of economic actors, and as argued previously, policy is largely madedependent on assumptions of that behavior, in particular of core companies. To understandthe intentions behind regionalism as well as make assumptions of its outcome, we have toreturn to our partner in international restructuring, the core company. What are thedifferent ways in which governments can perceive firms, and how do governments appear to understand firm behavior based on the assumptions implicit in the policy mechanismsdescribed above?
3.5.3 Assumptions of firm locational behavior
Government perceptions of economic actors’ strategic behavior determine the predicationsupon which economic restructuring processes are founded. Analysis of the relevantliterature (Chapter 2), however, reveals that the firm is poorly incorporated into the mosttheories given their macro-level orientation. Conceptualizations of the firm, as a multifaceted mechanism for the coordination of (international) economic activity, remainhighly underdeveloped (Markusen, 2000), and particularly in the case of regionalintegration (Davies et al., 1999; Pani , 1991).Classical trade theory characterizes national production strategies for a given good as (relatively) intensive in a given production factor. The expected behavior of actual firmscan only be derived on the basis of cost drivers (a function of price, efficiency, and demand) which are determined by factor endowments given the universal availability of(exogenous) technology. Yet firms are not explicated; there is in fact no explanation as tothe existence of firms at all (as opposed to markets). Cantwell (2000) refers to firms as ‘thevisible hand’ in contrast to ‘the invisible hand’ of the market, but in effect the ‘invisiblehand’ represents the ‘black box’ of the firm (Sachwald, 1993), which traditional trade theory does not open. Many of the theoretical assumptions made in academic literature concerning responses to regional integration, the substitutability of trade and investment,and so forth are reflected in the models developed and applied by policy-makers to predictresponse to policy. Such models are generally macroeconomic and make implicitassumptions about firm behavior and motivations behind strategic decision-making. These
79
Chapter Three
assumptions are often taken as a given, when in fact there is little unanimity as to whetherthese assumptions accurately reflect behavior, especially at the firm level.New trade theories and political economy models employ elements like Bhagwati’s ‘DUPs’ (directly unproductive profit-seeking activities) to refer to lobbying and other activities that use real resources to capture economic rents (Feenstra et al., 1996). Although they take an economic view of firms as strategic stakeholders which act andreact to their competitors and the environment, and even consider the regionalization of economic activity as an endogenous result of firm behavior, they still have no depth; firmsare atomistic. As in international trade theory, these dimensions remain issues of marketstructure which determine economic behavior, and the firm, if discussed at all, remains an abstraction. Despite the increased recognition of triggers of firm behavior, the firm as such is not conceptualized, and is certainly not seen as an actor. At most the firm is considered as an implicit production process, but there remains no place for strategy (Cantwell, 2000) or the firm as an organizational structure (Sachwald, 1993).Whereas international trade theory considers the international economy as the object ofstudy, with national economies as pieces of the puzzle, other approaches consider thenation-state and the national economy itself as the puzzle and only secondarily addressinteraction between nations. These approaches (Porter, 1990) reflect an attempt to break open the black box of the national economy beyond factor endowments to identify modesof production and economic stakeholders. Firms are from this perspective carriers of national competitiveness. The ‘national business systems’ approach (Whitley, 1992) is another variant of this perspective. Yet despite having laid bare the configurations of stakeholders in national business environments and established the key role of firms andpolicymakers in patterns of economic activity, these theories fail to deal adequately withthe issue of regional integration as an outcome of these stakeholder configurations.Where they fall short is in their relatively static approach to the economic order and thebalance between stakeholders in the national economy (cf. Graham, 1997; Hirst andThompson, 1999). On the one hand, firms are generally typified as e.g. a ‘family business’or ‘industrial group’, and there are no real ideal-types, only organizational outcomes(Sorge in Whitley and Kristensen, 1997). The firm is implicit; a by-product of social actors in their struggle for resources and autonomy (cultural conventions, state structures,financial system; cf. Whitley, 1997). What is in fact considered are differences in thebalance between stakeholders in different economic environments. On the other hand, it isstriking that RIAs are considered exogenous to national business systems, and in manyways antagonistic to the coherence and continued existence of national systems, when itseems more likely that RIAs are endogenous to the dynamic interaction of nationalsystems. In the taxonomies of Strategic Management (e.g. Porter, 1985; Prahalad andHamel, 1990), firm strategic repertoires essentially represent little more than a continuumof degrees of internationalization. Although Porter-style approaches have been criticizedfor lack of rigor (consisting of ‘frameworks’ and not models; cf. Buckley and Casson,1998) they do, however, introduce the vital distinction between home and host firms.IPE, on the other hand, considers regional integration as a dynamic restructuring process inwhich stakeholders bargain for their respective interests. The assumption that homecountry matters allows for neomercantilist views of the firm as politics by other means(Moran, 1985) or firms as arenas of politics (cf. the ‘new diplomacy’ of Stopford andStrange, 1991). Firms and governments use their positions to further each other’s interests, whether they are shared or not (Vernon, 1971). This line of thinking cumulates with firms
80
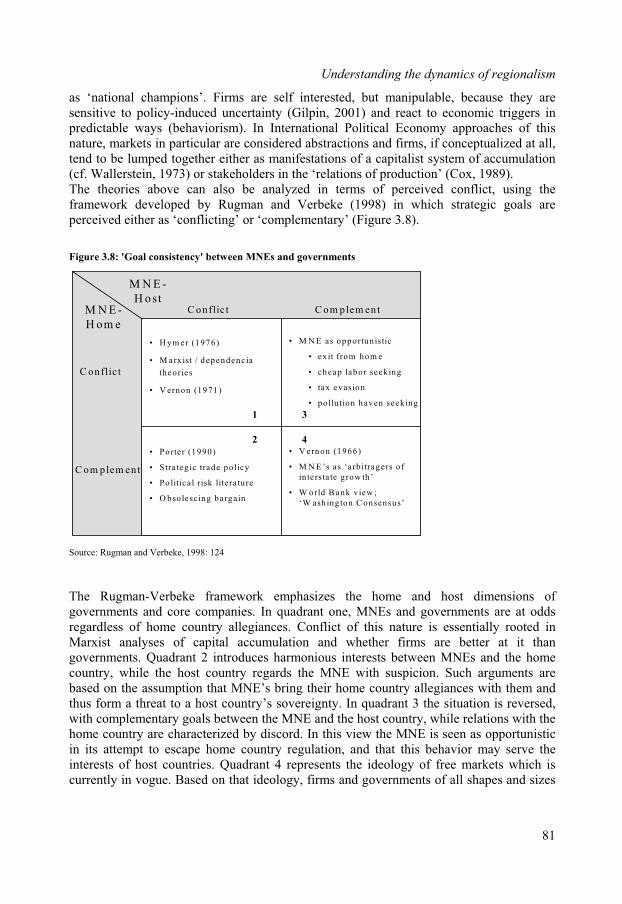
Understanding the dynamics of regionalism
as ‘national champions’. Firms are self interested, but manipulable, because they are sensitive to policy-induced uncertainty (Gilpin, 2001) and react to economic triggers in predictable ways (behaviorism). In International Political Economy approaches of thisnature, markets in particular are considered abstractions and firms, if conceptualized at all, tend to be lumped together either as manifestations of a capitalist system of accumulation(cf. Wallerstein, 1973) or stakeholders in the ‘relations of production’ (Cox, 1989).The theories above can also be analyzed in terms of perceived conflict, using theframework developed by Rugman and Verbeke (1998) in which strategic goals are perceived either as ‘conflicting’ or ‘complementary’ (Figure 3.8).
Figure 3.8: 'Goal consistency' between MNEs and governments
he Rugman-Verbeke framework emphasizes the home and host dimensions of overnments and core companies. In quadrant one, MNEs and governments are at odds
• H ym er (1976)
• M arx ist / dependenc ia
theories
• V ernon (1971)
• Porter (1990)
• Stra teg ic trade po licy
• Po litica l risk litera ture
• O bsolescing bargain
• V ernon (1966)
• M N E ’s as ‘a rb itragers o f
in te rsta te g row th’
• W orld B ank v iew ;
‘W ash ington C onsensus’
• M N E as opportun istic
• ex it from hom e
• cheap labor seek ing
• tax evasion
• pollu tion haven seek ing
M N E -
H om e
M N E -
H ostC onflic t C om plem ent
C om plem ent
C onflic t
1
2
3
4
Source: Rugman and Verbeke, 1998: 124
Tgregardless of home country allegiances. Conflict of this nature is essentially rooted inMarxist analyses of capital accumulation and whether firms are better at it thangovernments. Quadrant 2 introduces harmonious interests between MNEs and the homecountry, while the host country regards the MNE with suspicion. Such arguments are based on the assumption that MNE’s bring their home country allegiances with them andthus form a threat to a host country’s sovereignty. In quadrant 3 the situation is reversed,with complementary goals between the MNE and the host country, while relations with thehome country are characterized by discord. In this view the MNE is seen as opportunisticin its attempt to escape home country regulation, and that this behavior may serve theinterests of host countries. Quadrant 4 represents the ideology of free markets which iscurrently in vogue. Based on that ideology, firms and governments of all shapes and sizes
81
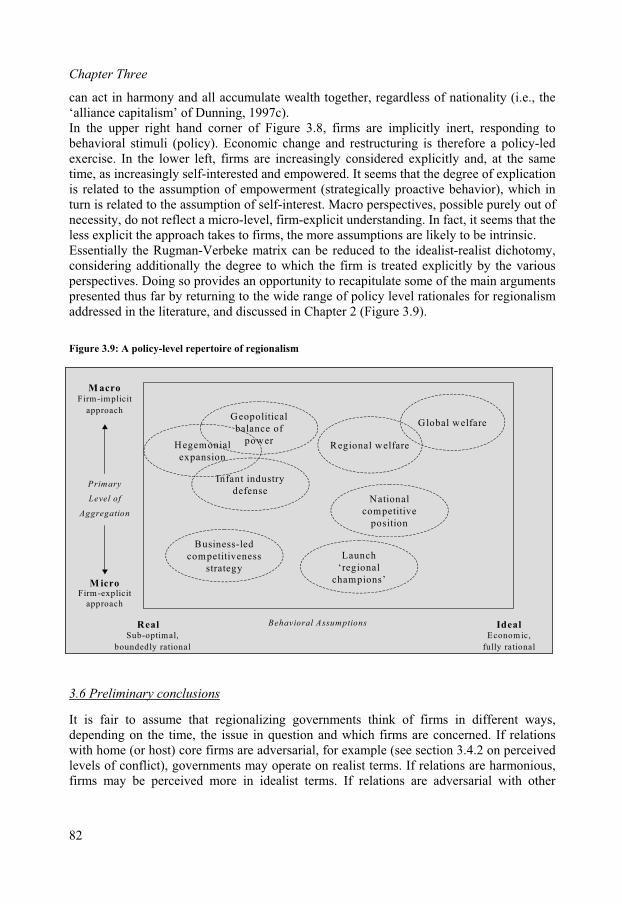
Chapter Three
can act in harmony and all accumulate wealth together, regardless of nationality (i.e., the ‘alliance capitalism’ of Dunning, 1997c). In the upper right hand corner of Figure 3.8, firms are implicitly inert, responding to
y,
igure 3.9: A policy-level repertoire of regionalism
3.6 Preliminary conclusions
behavioral stimuli (policy). Economic change and restructuring is therefore a policy-ledexercise. In the lower left, firms are increasingly considered explicitly and, at the sametime, as increasingly self-interested and empowered. It seems that the degree of explication is related to the assumption of empowerment (strategically proactive behavior), which inturn is related to the assumption of self-interest. Macro perspectives, possible purely out of necessity, do not reflect a micro-level, firm-explicit understanding. In fact, it seems that theless explicit the approach takes to firms, the more assumptions are likely to be intrinsic.Essentially the Rugman-Verbeke matrix can be reduced to the idealist-realist dichotomconsidering additionally the degree to which the firm is treated explicitly by the variousperspectives. Doing so provides an opportunity to recapitulate some of the main argumentspresented thus far by returning to the wide range of policy level rationales for regionalismaddressed in the literature, and discussed in Chapter 2 (Figure 3.9).
F
Real Ideal
M icroFirm-explicit
approach
M acroFirm-implicit
approach
Economic,
fully rational
Sub-optimal,
boundedly rational
Behavioral Assumptions
Global welfare
National
competitive
position
Geopolitical
balance of
power
Launch
‘regional
champions’
Infant industry
defense
Hegemonial
expansion
Business-led
competitiveness
strategy
Regional welfare
Primary
Level of
Aggregation
ionalizing governments think of firms in different ways,It is fair to assume that regdepending on the time, the issue in question and which firms are concerned. If relationswith home (or host) core firms are adversarial, for example (see section 3.4.2 on perceivedlevels of conflict), governments may operate on realist terms. If relations are harmonious,firms may be perceived more in idealist terms. If relations are adversarial with other
82
Understanding the dynamics of regionalism
countries, home firms may be seen in idealist terms at home, but as a realist vehicle forpolitics by other means in the international arena.How is firm behavior presented in RIAs, and more importantly, how are argumentspresented when policymakers attempt to legitimize an RIA to their citizens, ‘outsider’firms and the rest of the world? Given the recent tendency to view the world through a neoliberal lens, RIAs are most likely to be ‘sold’ to the world primarily in ideal terms. Thisis not to say that governments do not see firms from a realist point of view, or that theymay even enact policies on that basis. As Winters (1999) argues, the rhetoric required toachieve a political outcome does not necessarily reflect the true causes of the endeavor.Building on the argument of relative perceptions of conflict, expectations and assumptionsof firm behavior depend on the relative power of the country in question and whetherrelations with home firms are seen as harmonious. The more market power the countryenjoys, the more likely the government is to assume ‘idealized’ behavior on the part of home core companies. The more harmonious relations with home core companies, themore the government is likely to see relations with host companies as ‘adversarial’ andthus attribute ‘realist’ characteristics to their behavior. But, most importantly, they will still enact policies, legitimate their arguments, and make predictions about the response of firms based on assumptions of intrinsic, economic, rational, fully informed behavior. In order to determine whether such predictions are justified, and whether there is tensionbetween the expected behavior of core companies and their real behavior, it is firstnecessary to explore core companies more closely.
83

4. CORE COMPANIES AND REGIONALISM STRATEGY
If firms are understood to be key actors in regional integration processes, firm-leveltheoretical approaches must be investigated to determine what they reveal about firmstrategic behavior, the spatial organization of firm activity, and to what extent they dealwith the issue of regional integration. The arguments made in Chapter 3 maintain thatregionalism-based policy levers are primarily concerned with intra-regional effects, and then largely from an intrinsic perspective.The current chapter begins by analyzing mainstream theoretical perspectives on the spatialorganization of economic activity at the firm level. RIAs concern not onlyinternationalization of policy spaces, but must also be addressed in terms of the internationalization of competitive space, and then with particular attention to the nature of that competitive space. Relevant arguments will be selected based on their ‘fit’ with the strategic actor approach explored in Chapter 3. Comparing these theoretical foundationswith the observations made in Chapter 3 should help shed light on the question of theextent to which policymakers are disposed to ‘misperceptions’ and failed anticipation ofthe spatial behavior of core companies, and the consequences this has for welfare,competition and ultimately the welfare and growth goals of the regional policy space.
4.1 Mainstream perspectives on international restructuring
Numerous theories exist which address the firm, firm behavior, and the spatialorganization of firm activities, particularly across borders. These theories differ in theirassumptions and their level of analysis. As a consequence they can be ordered according tothe way in which they conceptualize the firm as a strategic actor, which behavioralassumptions they attribute to actors, and the role of context (strategic reality). Clusteringtheories according to these criteria generates 5 categories. Firstly, those theories rooted ineconomic thinking, where the firm is not explicated and the context is generic (classicaleconomics and Transaction Cost Analysis). Secondly, theories which take a more firm-specific view but are acontextual (the Product Life Cycle approach and the ‘stages’ theoryof internationalization). Thirdly, theories that take a view of firms in the explicit context oftheir environment (Market Power theory, the obsolescing bargain and dependencies).Fourthly, hybrid approaches in which the firm and the context are considered and a widerange of behavioral assumptions apply (management / strategy approaches). Lastly, theOLI paradigm, as an effort to integrate those perspectives, is considered. This will generatea strategic fit with the framework concepts illustrated in sections 3.1 and 3.2.
4.1.1 Market drivers: economics perspectives
The earliest ventures into the significance of location originated with Weber’s locationtheory (1909), based on axioms of classical trade theory and comparative advantage (Dent,1997). In classical trade theory, production factors are location-specific (such as transport-and labor costs) only later did theory expand to accommodate the externalities flowing from e.g. concentration of industry that allowed for external scale economies. Weber’slogic is closely related to the Hecksher-Ohlin factor endowment model, according to which relative factor endowments determine trade. It follows (according to HO) that FDI flows should be greatest between countries with the least similarity in factor endowments.
85
Chapter Four
In classical trade theory, the location of production is essentially a function of factorendowments and all institutional elements are absent. Location is only relevant in imperfect markets (Jovanovic, 2001) because in ideal markets, without transportation costs or cost disadvantages to spreading production, location does not matter. As often as not,firms are a black box and not an organizational structure for production. Classicaleconomic views of economic activity and markets are unsatisfactory from an actor-basedperspective, given the proliferation of companies as coordinating mechanisms within themarket. Hence the question arose as to why firms exist at all, and whether they are in themselves a market distortion. Coase (1937) addressed the matter by stating that marketsand firms were not mutually exclusive because some markets are simply internal to the firm. It follows that firms can internalize markets, and will do so if that is more cost-effective. This allowed for the possibility of firms and (more) perfect markets to co-existbecause a market would only be internalized if it was less distorted than an external market. Internalization theory looks at the costs of doing business, not just at the cost ofinputs (Caves, 1996). Theorizing cross-border internalization at the firm level introduces the possibility offoreign direct investment (FDI) and intra-firm trade (Bowen et al., 1998). Once therationale for firms over markets has been established one can consider how firmsinternalize markets abroad, or why they invest abroad for the purpose of controlling of assets. The answer is largely sought in terms of transaction costs. Transaction cost analysis(TCA) assumes that ‘the primary motivation for TNC integration is the belief that a unifiedcontrol of productive activities in different countries yields benefits to their owner, over and above those that would arise if they were separately owned’ (Robson, 1993: 2). Although there are costs inherent to internalization itself, the assumption is that given theinability of markets to allocate resources effectively, the costs of internalization are lowerthan the transaction costs of using markets to organize activities.Whereas the major motive for cross-border market internalization in conventional theoryhas been the reduction of transaction costs associated with tariffs (‘tariff-jumping’), morerecent work focuses on the exploitation of tangible assets (although former still does apply). This means technology, marketing expertise etc. can best be exploited internallydue to their high transaction costs of other modes of doing business (not only licensing, butalso trade) (Blomström and Kokko, 1997). Know-how, therefore, appears to be a critical issue in internationalization (Hennart, 2000; Dunning, 1998; Bowen et al., 1998; Caves,1996). Instead of knowledge being omnipresent and equally accessible to all actors, it becomes an independent variable of its own. On a theoretical basis, therefore, one wouldexpect to see more externalities, spill-over and agglomeration than in the past becauseknow-how has become much more important. This would predict the rise of regionaleconomies (agglomeration) from an economic theory standpoint, as a counter-balance tothe politically driven rise of RIAs. These externalities become the ‘locational’ assets instead of traditional locational assets (production factors) which are inherent to the nationor other form of geographic location.Buckley and Casson (1976), Williamson (1975) and Caves (1982) further explored the theory of internalization in the international context as a matter of complete contract andincomplete contract theories (Tirole, 1988). Although opinions diverge as to the degree of asset specificity involved in market failure, the shared conclusion is that where cross-border contracts fail, MNEs will arise. Not all contracts can be completely enforceable, however; trust, therefore, plays an important role. The primary difference between Buckley
86
Core companies and regionalism strategies
and Casson (1976) and Williamson (1975) is the issue of asset specificity. The former rely more on the public good nature of intermediate products, such as technology, know-howand more generally knowledge-related ‘intangible assets’. In TCA, asset-specificity based approaches still dominate and TNC-related internalization insights are ignored. In the latter, TNCs internalize markets which fail because of intangible assets that exhibit public goods characteristics. As Kay (1991) observed, these need not be specific assets, as TCAwould have us believe. IO theory, despite acknowledgement of asset specificity and incomplete contract based perspectives, has still not been open enough to non-specificasset theories. Kogut and Zander (1993), on the other hand, argue that since much of knowledge is tacit,and therefore difficult and expensive to transfer, it cannot be seen as a public good. Hencetheir conclusion is that TNCs exist because they are better in transferring tacit knowledge (across borders) than are either markets or other firms. Teece (1977, quoted in Bowen etal., 1998) concluded that technology transfers to joint venture partners were on average 5.1percent more costly than transfers to wholly-owned subsidiaries, while transfers toindependent licensees were about 8.7 percent more costly. As Caves (1996) explains, costsare associated with negotiating the terms in advance and haggling afterwards, plusmanaging the information flow so that the need for the license is maintained over timeinstead of letting the cat out of the bag. Licensing also entails the risk of brand damage ifthe licensee does not live up to the standards of the licensing firm.Logically, larger markets are required to compensate for higher transport costs (Bowen et
al., 1998). These authors, as do many in mainstream economic research, address the issueof export vs. servicing local markets through investment abroad. Firms’ strategic repertoireis restricted to licensing, local production or exports, depending on the exigencies of thebusiness environment. Such studies still assume trade and FDI are substitutes, whereasalternative schools of thought are on the rise that suggest the two are complements.Knowledge as an intra- or inter-firm transferable good or service increases the risk for policy makers of transfer pricing, since it is often difficult to determine arm’s length valuesfor knowledge-based, firm-specific assets (Bowen et al., 1998).
4.1.2 Responding to environmental change: incremental perspectives
Other theories look at internationalization in stages, i.e. as an incremental process. Keyamong these are the Product Life Cycle (PLC) theory of Vernon (1966), theinternationalization process model of Johanson and Vahlne (1977), internationalization as innovation (Bilkey and Tesar, 1977) and network theory (Johanson & Mattsson, 1988). They conceptualize the firm better, and consider the role of the environment. Markets are no longer implicitly perfect and hence location matters.Vernon’s PLC theory was an attempt to link international trade theory to a firm-levelperspective of international investment theory (Melin, 1992) in order to shed light on thesequential development of international production, including the spatial, geographicalelement. The PLC theory places less emphasis on comparative cost and more on the timingof innovation, scale economies and the roles of ignorance and uncertainty in influencingtrade patterns (Vernon, 1966). The focus is a source country of technological development(in his case the US), where the firm bases its initial operations. In the first stage, theseproducts are manufactured locally and exported. In phase two, production commencesabroad (Europe) and the US exports to the least developed countries (LDCs). In phase 3
87
Chapter Four
Europe exports to LDCs, displacing US exports. In phase 4 the US has to import fromEurope. In phase 5, the LDCs export to USA and Europe. This has a lot of similarity to theworld systems theory in political science.The PLC approach was in fact an effort to integrate the ‘neotechnology’ approach withHymer’s ownership advantages (see below) (Yamin, 1991). The neotechnology approachemphasized ‘not on the specific resource endowment of countries but on the exclusivepossession of certain assets by enterprises’ (Dunning, 1981: 23). This logic is similar to theinternalization theory in that it looks at the role of knowledge in modes and motives of internationalization. As such PLC theory combines an improved conceptualization of thefirm with market exigencies to explain cross-border activity. The competition element ofthe PLC is in its use of technological advantage for a head-start and exploiting those first-mover advantages in international markets.The stages theory, or Uppsala model, is more of a firm-centric view of internationalizationin that the drivers are internal to the firm. Firms internationalize in order to maintain ormaximize their long-term profit under changing conditions of the firm in its environment.Inevitably, the only way to do so at a certain point is through cross-border activity. Firm-level internationalization is a step by step process, starting with export and then moving tolocal production through FDI. Knowledge also plays a prominent role in that export andultimately the location of production are made based on knowledge of foreign markets.Lack of knowledge is described as ‘psychic distance’ (Johanson and Vahlne, 1977: 24). Internationalization occurs initially towards countries which are ‘psychically less distant’, such as immediate neighbors or countries with a shared cultural heritage.Both approaches assume incomplete knowledge and therefore bear no expectation of fullyrational behavior. International activity is implicitly an uncertain and risky endeavor. Yet these inherent knowledge-based disadvantages may not apply to firms with richexperiential knowledge to draw upon. At the same time, incremental models’ deterministiccharacter leaves little room for strategizing, with behavior built primarily on costs andeconomic considerations.
4.1.3 Shaping the environment: power perspectives
Stephen Hymer’s (1976) Market Power theory originated in criticism of Hecksher-Olin, due to empirical evidence in the post-war period that showed FDI flows occurred mainlybetween developed countries with similar endowments. Hymer claimed that a MNE’sinternationalization strategy had to be viewed within the larger context of its globalstrategy to increase its market power. According to Hymer, this process ‘is rooted in theoligopolistic market conditions within which most MNEs operate’. By exploiting their ownunique ‘ownership-specific’ advantages together with the ‘location-specific’ advantages of the host economy, MNEs could enhance their competitive position. Kindleberger (1969) adapted Hymer’s theory to the monopolistic competition model where production differentiation holds more relevance than oligopolistic interdependence. Caves (1971) alsoexplored this issue and related it to the role of an MNE’s ownership advantages. Cowlingand Sugden (1987) pursued similar veins of research by analyzing the capacity of multinational market power to generate higher labor surplus induced profit levels. Marketpower theorists in general emphasize different aspects of structural market failureassociated with monopolistic and oligopolistic competition and share some similaritieswith the NIDL theorists (Yamin, 1991).
88
Core companies and regionalism strategies
Hymer dealt with two separate theories. The most referred to is the firm advantage theory,according to which firms controlled operations in foreign countries because they had an advantage that made it profitable to do so (‘firm-specific’ advantages (FSAs) or ‘ownership advantages’). Differences in location can also be attributed to ‘home market’advantages (Hymer, 1976; Knickerbocker, 1973). But the role of the home market is notalways black and white, since foreignness can be both an advantage and a disadvantage,depending inter alia on home government actions. International production takes theadvantage question beyond the industry level, because it concerns advantages in aparticular country (Hymer, 1976). His lesser-studied theory is the ‘removal of conflict’ theory. According to this theory, themore interdependence (horizontal or vertical) exists between oligopolists, the higher thetendency towards collusion, such as market-sharing, price agreements or cartels. If, on theother hand, there are many independent firms and entry barriers are low, there will be less incentive for collusion. It is possible as well that collusion fails and that competitionensues as a result. The more competitive angle was introduced by Knickerbocker (1973) through the concept of oligopolistic reaction, which described the essentially defensivenature of certain internationalization processes.Ruigrok and van Tulder (1995) draw on similar assumptions of dependencies and a firm’sdesire to control, but emphasize relations with stakeholders inside and outside an individual firm’s value chain as opposed to the relationship between firms. They describethe ‘concepts of control’ which large, powerful companies exploit to manage thedependent relationships with their stakeholders. The ‘obsolescing bargain’ (Vernon, 1971) and similar theories (Kobrin, 1987; Encarnation and Wells, 1986), are also concerned withthe power-seeking motivations for firm behavior, only in this case with respect to hostgovernments. These studies are important for their exposition of potentially sub-optimalbehavior and the chess-like character in their move-countermove aspect (Strange, 1991), as well as the notion that location is relevant beyond simple factor endowments.
4.1.4 Firm-environment interplay: strategic management approaches
Strategy, according to the strategic management (SM) literature, is about the exploitation of competitive advantages. SM is distinct from Industrial Organization approaches in thatit tends to be truly micro in orientation instead of meso (Morrison, 1990: 3). According toMorrison (1990), strategy is an issue of matching organizational competencies and abilitieswith the organization’s external context, or ‘identifying and exploiting the resources and capabilities of the firm in the marketplace for the purpose of gaining competitiveadvantage and superior financial performance’ (Tallman and Yip, 2001) based on theexploitation of competitive advantage (Porter, 1986; Kogut; 1985). The firm is not considered in isolation, however; elements of strategy include not only setting goals and objectives, but also analyzing industry and competition as well as resources andcapabilities. The interplay between firm-internal drivers and external drivers (usually onlyindustry-specific) is summed up in Zou and Cavusgil (1996).Strategy is also a matter of allocating these resources and capabilities across businessactivities and geographic space (Hamel and Prahalad, 1998). A key question concerns, therefore, when a location is strategic: as a large source of revenues or profits; as the homemarket of global customers; as the home market of global competitors, significant marketof global competitors; or a major source of industry innovation (Yip, 1992). Therefore in
89
Chapter Four
Strategic Management, competition is primarily about beating out competitors in as manymarkets as possible. Different patterns of competition are ‘strategic intents’ that in globalindustries ‘lead to very distinct approaches to competition and the use of competitiveadvantages, even if the strategic infrastructures appear not to be markedly dissimilar’(Prahalad and Doz, 1987).Strategy perspectives have inside-out and outside-in variants, which define the drivers of strategic behavior as in or outside the firm, respectively (De Wit and Meyer, 1998),whereby the emphasis is traditionally on the external dimension (Bartlett and Ghoshal,1989; Porter, 1979). The interplay between both is central to the Strategy literature, for instance in the comparison of comparative advantage (the environment, i.e. location) and competitive advantage (firm-specific, i.e. ownership). The interaction is seen in the waylocation affects competitive advantage through its influence on productivity and productivity growth (Porter, 1998a). Internal and external pressures force managers to strike a balance between the economicimperative (internationalization is a response to competitive pressures) which calls for rationalized global operations and the political imperative (the adjustments made necessary by host government demands) which calls for increased local responsiveness (Melin,1992). As such the issue is not so much why to internationalize (this is a given), but ratherhow to coordinate the MNE once this has taken place. It leads back to the strategy-structure issue of Chandler (1962). Chandler also took a strategic incremental approach ofstages, as did Stopford and Wells (1972).Yip (1995) identifies four categories of drivers of international activity: the market (Levitt, 1983), cost (Porter, 1986), government policy, (Doz, 1986), or competitive drivers such as cross-country subsidization (Hamel and Prahalad, 1985). All internationalization drivers instrategy are considered relevant in the sense that they have bearing on the firm’s ultimatedriver, the pursuit of larger markets (Tallman and Yip, forthcoming). The firm’s ability tointernationalize stems from its competitive advantage, which ‘drives both financialperformance and the ability to internationalize’ (ibid.). Financial performance underlies everything, and relies on growth, market share and profit maximization. To Porter, thestrategy of the firm is to strengthen its global position, which it can do by ‘transferringstrategic assets between different markets which permit it to exploit economies of scale,scope, learning and real options; by the differentiation of products to adapt to nationalareas and to exploit up-stream competitive advantages and by the flexibility and bargainingstrength that a multi-national network provides in managing stakeholders in diverseenvironments’ (Kogut, 1984). In the strategy literature there is no archetypal global strategy, but numerous ways ofcompeting globally. Hence a set ‘strategic repertoire’ can be interpreted in different ways,depending on the competitive position of the player in question. Strategy approaches are therefore critical of classical full rationality approaches, on the grounds that strategic problems are difficult to define and do not always have a fixed set of solutions (Rittel,1972; Mason and Mitroff, 1981; cf. also Caves, 1982). There are not necessarily ultimatelyoptimal positions; rather, each strategic choice and outcome involves trade-offs (Porter 1998b). The strategy literature shares certain perspectives with Hymerian analysis of global competition as a strategic ‘game’ (cf. the core competencies of Prahalad and Hamel,1990; Porter’s search for strategic differences [1998a] or Porter’s ‘diamond’ as the field of positioning [1980]).
90
Core companies and regionalism strategies
Although much of the strategy literature steers away from economics-style assumptions offull rationality, many of its other assumptions have in fact precipitated many of the recentdevelopments in economic theory, such as scale economies, profit maximization, cost andrisk minimization, uncertainty avoidance, the role of competition, the location andexploitation of created assets, and the role of country openness in competition levels. Indicators of this nature are also common in both the theoretical literature and consultingpractice on country risk and location advising. The concept of profit maximization or costminimization, however, does not preclude expensive or ‘uneconomical’ behavior due tothe longer-run perspective in strategy literature. Strategies of preemption, where firms get into markets early even at a cost penalty to corner the market, or dumping as a means todrive weaker competitors out of the market (Doz, 1986) may be an example of a sub-optimal strategy from the perspective of economic ‘one-off’ models, but in the long termcan be rewarding.The resulting spatial organization of firm activities, described by Porter (1986) as its ‘configuration’, is usually characterized on the one axis by its global scope (the global /local) and on the other by the level of diversification of the firm. Complementary is thefirm’s mode of control or coordination, e.g. the multinational, international, global and,finally, ‘transnational’ organization models of Bartlett and Ghoshal (1989). Firms can see national markets as ‘strategic’, ‘tactical’ or ‘opportunistic’ (Doz, 1986), but ultimatelytarget markets are selected on a cost basis, or on demand (potential revenue) basis.Jovanovic (2001), however, admits that in practice the issue is more complex. Strategiclocation decisions, for instance, may be influenced by the location decisions of othercompeting or supplying firms, earlier sunk costs in other locations, the availability ofinvestment funds or demographic effects on factor inputs such as retirement patterns or ‘brain drain’. The aim may be low total cost, but locations with low wages often lack e.g.infrastructure, suppliers and mechanisms of maintenance. The effects of low costs are easy to measure up front, but productivity costs remain hidden or unanticipated (Porter, 1998a).Ultimately locational choices should weigh overall productivity potential, not just input costs or taxes.The strategy literature has been criticized largely due to the wealth of variables, strategies,factors it supplies. Its breadth is in many ways seen as its weakness, generating‘frameworks’ instead of theory (Casson). In fact its practical orientation leads to a higher emphasis on managerial relevance than on theoretical elegance (Melin, 1992). The 2x2 frameworks for which it is famous have served strategic management well, but they are ‘far from ideal’ (Morrison, 1990: 142). Furthermore, the concept of internationalizationlacks refinement in that it tends to throw all non-domestic solutions onto one big pile. Asproblems with dichotomizing international competition are mounting, the global-local continuum is no longer adequate. Bartlett and Ghoshal admit their transnational strategymodel is a hypothetical solution that ‘does not correspond to any one company’ (Morrison,1990: 143).
4.1.5 The OLI paradigm
While Hymer and Vernon launched FDI as a field of study in its own right and introducedthe concepts of ownership advantages and location advantages to the literature, Dunning (1977) combined the two with the internalization perspective (TCA) in his ‘eclectic’ OLI paradigm as an all-encompassing ‘framework’ for FDI (Cantwell, 2000). In the words of
91
Chapter Four
Dunning, ‘the theory of foreign-owned production stands at the crossroads between a macroeconomic theory of trade and a microeconomic theory of the firm’ (Dunning, 1998:19). OLI was in fact aimed primarily at making internalization theory more dynamic(Melin, 1992) by endogenizing some of the ‘environmental’ issues that firm theoriesneglect.Ownership (i.e., firm-specific) advantages form the basis for the firm-level strategic repertoire and can be seen simply as unit-cost reducing relative to competitors (Dunning), or as a means to suppress competition by raising barriers to entry (Hymer), or as a weaponwhich sustains competition between rivals (see 4.3). Internationalization depends on acombination of location and governance decisions (Dunning, 1977; Dunning, 1981). Of thethree types of advantage, the least attention has been paid in the International Businessliterature to location. Dunning (1998) emphasizes the renewed attention for the spatialaspects of investment and production instead of the emphasis on firm-specificdeterminants, returning to the questions set by new research agendas which seek to pay more attention to the spatial aspects of value-added activity.OLI, just as internalization theory, is primarily rooted in economics, with transaction costsand factor costs as main explanatory variables and assumes rational decision-making infirms undertaking FDI (Melin, 1992). OLI does not have a fixed view of competition nor a theory of the firm, and its structure-conduct-performance approach is too static (Cantwell,2000). OLI is not a theory of the firm, but one of firms and / or countries (Dunning, 2000).By linking so heavily to internalization theory, it overemphasizes the national dimension.The focus remains on ‘the advantages that one firm has over another that allows it tocompete in that other firm’s home country’ (cf. Dunning, 2000), where ‘home country’ isbetter replaced by the term ‘competitive space’. International dimension of firm behavior, firm strategy with respect to spatial organization of activity, but regional integration is either ignored or seen as an extension of existing theory (change to locational advantages,possible harmonization of ownership advantages etc.). Efficiency, from the firm strategypoint of view, is not always optimal (Cantwell, 2000).
4.1.6 Evaluating theory from a strategic actor perspective
In TCA the question is an economic calculation of markets versus hierarchies. Strategicmanagement literature focuses on firm strategic reality in terms of cost minimization andprofit maximization, growth, and risk mitigation, often at the industry level. Strategy is often left out of International Business literature, which considers markets and industries,as well as the organization and structuring of the MNE itself (Tallman and Yip,forthcoming), and as such tends to overemphasize the ‘sunny side’ of firm behavior (Eden and Lenway, 2001). As Table 4.1 illustrates, there is a focus on intrinsic considerations in much of the theory. Only Hymer’s Market Power hypothesis hinges on intrinsic and extrinsic considerations. The contrast between intrinsic and extrinsic considerations is reflected in the debate between ‘structural’ and ‘transactional’ market imperfections.Hymer has been widely criticized for focusing on ‘structural’ imperfections instead of‘transactional’ ones (Dunning and Rugman, 1985) although Hymer did, in fact, address‘internalization’ in his thesis (Hymer, 1976: 48).
92
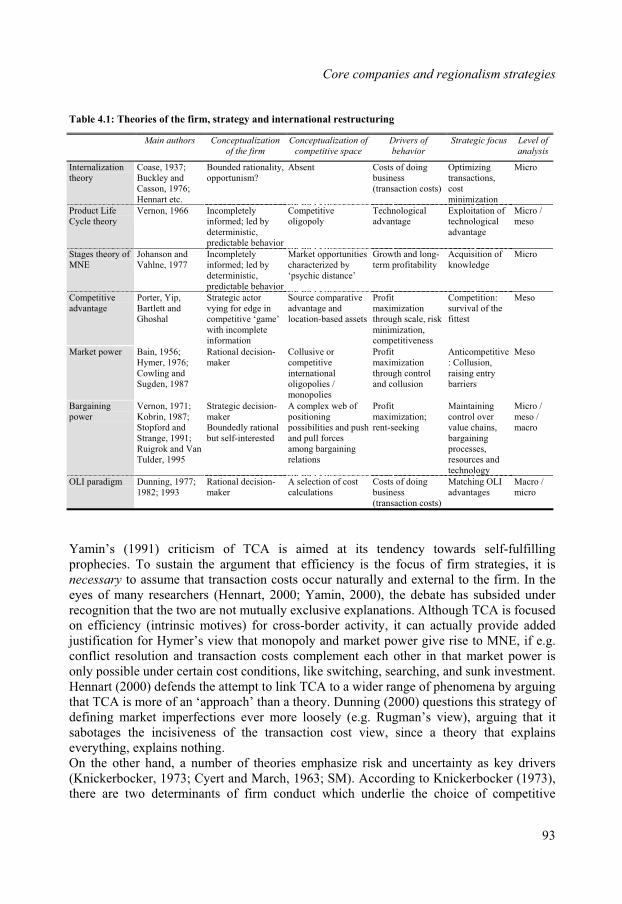
Core companies and regionalism strategies
Table 4.1: Theories of the firm, strategy and international restructuring
Main authors Conceptualization
of the firm
Conceptualization of
competitive space
Drivers of
behavior
Strategic focus Level of
analysis
Internalizationtheory
Coase, 1937; Buckley and Casson, 1976; Hennart etc.
Bounded rationality,opportunism?
Absent Costs of doing business(transaction costs)
Optimizingtransactions,costminimization
Micro
Product LifeCycle theory
Vernon, 1966 Incompletelyinformed; led bydeterministic,predictable behavior
Competitiveoligopoly
Technologicaladvantage
Exploitation of technologicaladvantage
Micro / meso
Stages theory of MNE
Johanson and Vahlne, 1977
Incompletelyinformed; led bydeterministic,predictable behavior
Market opportunities characterized by‘psychic distance’
Growth and long-term profitability
Acquisition of knowledge
Micro
Competitiveadvantage
Porter, Yip, Bartlett and Ghoshal
Strategic actor vying for edge in competitive ‘game’with incompleteinformation
Source comparativeadvantage and location-based assets
Profitmaximizationthrough scale, risk minimization,competitiveness
Competition:survival of the fittest
Meso
Market power Bain, 1956; Hymer, 1976; Cowling and Sugden, 1987
Rational decision-maker
Collusive or competitiveinternationaloligopolies / monopolies
Profitmaximizationthrough control and collusion
Anticompetitive: Collusion,raising entrybarriers
Meso
Bargainingpower
Vernon, 1971; Kobrin, 1987; Stopford and Strange, 1991; Ruigrok and VanTulder, 1995
Strategic decision-makerBoundedly rational but self-interested
A complex web of positioningpossibilities and pushand pull forces among bargaining relations
Profitmaximization;rent-seeking
Maintainingcontrol over value chains, bargainingprocesses,resources and technology
Micro / meso /macro
OLI paradigm Dunning, 1977; 1982; 1993
Rational decision-maker
A selection of cost calculations
Costs of doing business(transaction costs)
Matching OLIadvantages
Macro / micro
Yamin’s (1991) criticism of TCA is aimed at its tendency towards self-fulfilling prophecies. To sustain the argument that efficiency is the focus of firm strategies, it isnecessary to assume that transaction costs occur naturally and external to the firm. In theeyes of many researchers (Hennart, 2000; Yamin, 2000), the debate has subsided under recognition that the two are not mutually exclusive explanations. Although TCA is focusedon efficiency (intrinsic motives) for cross-border activity, it can actually provide added justification for Hymer’s view that monopoly and market power give rise to MNE, if e.g. conflict resolution and transaction costs complement each other in that market power is only possible under certain cost conditions, like switching, searching, and sunk investment.Hennart (2000) defends the attempt to link TCA to a wider range of phenomena by arguingthat TCA is more of an ‘approach’ than a theory. Dunning (2000) questions this strategy ofdefining market imperfections ever more loosely (e.g. Rugman’s view), arguing that itsabotages the incisiveness of the transaction cost view, since a theory that explains everything, explains nothing.On the other hand, a number of theories emphasize risk and uncertainty as key drivers(Knickerbocker, 1973; Cyert and March, 1963; SM). According to Knickerbocker (1973),there are two determinants of firm conduct which underlie the choice of competitive
93
Chapter Four
strategy: uncertainty avoidance and risk minimization (the two are not necessarilyidentical). Risk is often thought of in political terms, but risk can also be reduced within the value chain, through e.g. downsizing, outsourcing, the exploitation of corecompetencies, or the development of flexible networks (e.g. Rugman, D’Cruz, Verbeke). Spreading production across geographic space can also be seen as a risk-mitigating or riskspreading strategy (Rugman, 1976). Hence, for Yip (2001) the choice is not ‘whyinternationalize’, but rather ‘why not’?The second dimension of critique relates to the attention given to competition and competitive positioning. Competition has been seen as largely static and as resting on costminimization in relatively closed economies (Porter, 1998a). Initially the basis was comparative advantage, more recently economies of scale. According to Porter, competition must be seen as dynamic, as the search for strategic differences. The role oflocation in the search for strategic differences has been misleading because thinking on location in recent decades has taken a relatively simple view of how companies compete(Porter, 1998a). Location affects competitive advantage through its influence on productivity and productivity growth.In other analyses, competition is absent altogether, such as TCA and the incrementalapproaches. The need to incorporate oligopolistic interaction issues has been recognized(Cantwell, 2000). Buckley (1990) and Buckley and Casson (1998a) have bothacknowledged the need to incorporate advantage and oligopolistic interaction-based issuesin their analyses, although in their understanding cooperation is no more than an issue ofefficiency (Yamin, 1991). TCA is therefore more an analysis of the firm than of firms(Cantwell, 2000) and its understanding of the MNE is static (Melin, 1992). A theory offirm behavior, however, depends not only on what kind of firm is being considered, butalso what kind of structural or institutional environment the firm operates in: ‘the key tounderstanding fruitfully the characteristics of a firm’s activities is to conceptualize its environment’ (Sugden, 1991: 171). Additionally, the argument that TNC has emerged to minimize transaction costs does not on its face prove it is efficient (Cowling and Sugden, 1987: 10). Hymer made similar observations, in that his focus was on profit maximization,but that he astutely observed that an advantage (FSA) may make control desirable for otherreasons than direct or short-term profit.The final point of critique concerns the nature of core company relationships with otherstrategic actors, such as governments, suppliers, customers, trade unions. Much of theliterature ignores these relationships, and the bargaining literature is almost exclusively aimed at interaction with governments alone. Hymer himself considered only power relationships with respect to other companies. Although Porter’s diamond addresses competition, value chain partners and governments, it unfortunately provides only a static analysis and confuses ‘factors’ with ‘actors’ (Ruigrok and Van Tulder, 1995).Understanding the strategic behavior of core companies requires a vision of relationshipswith actors of multiple types.
4.2 Core companies and bargaining relations
The theories above contribute much to our understanding, but they hinge on a wide range of divergent assumptions and emphasize different aspects of behavior. They exhibitshortcomings for the purposes of this study on the basis of several key ingredients of strategic actor approach applied here. Firstly, on the basis of their behavioral assumptions
94
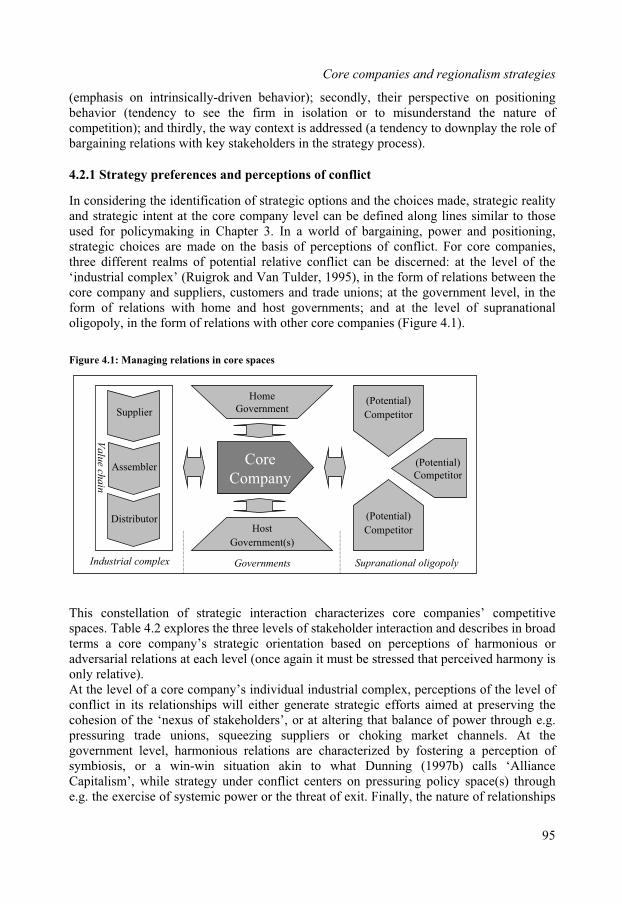
Core companies and regionalism strategies
(emphasis on intrinsically-driven behavior); secondly, their perspective on positioning behavior (tendency to see the firm in isolation or to misunderstand the nature of competition); and thirdly, the way context is addressed (a tendency to downplay the role ofbargaining relations with key stakeholders in the strategy process).
4.2.1 Strategy preferences and perceptions of conflict
In considering the identification of strategic options and the choices made, strategic reality and strategic intent at the core company level can be defined along lines similar to thoseused for policymaking in Chapter 3. In a world of bargaining, power and positioning,strategic choices are made on the basis of perceptions of conflict. For core companies,three different realms of potential relative conflict can be discerned: at the level of the‘industrial complex’ (Ruigrok and Van Tulder, 1995), in the form of relations between thecore company and suppliers, customers and trade unions; at the government level, in theform of relations with home and host governments; and at the level of supranationaloligopoly, in the form of relations with other core companies (Figure 4.1).
Figure 4.1: Managing relations in core spaces
Core
Company(Potential)
Competitor
Home
Government
Host
Government(s)
(Potential)
Competitor
(Potential)
CompetitorV
alu
e chain
Governments Supranational oligopolyIndustrial complex
Supplier
Assembler
Distributor
This constellation of strategic interaction characterizes core companies’ competitivespaces. Table 4.2 explores the three levels of stakeholder interaction and describes in broad terms a core company’s strategic orientation based on perceptions of harmonious oradversarial relations at each level (once again it must be stressed that perceived harmony is only relative).At the level of a core company’s individual industrial complex, perceptions of the level of conflict in its relationships will either generate strategic efforts aimed at preserving thecohesion of the ‘nexus of stakeholders’, or at altering that balance of power through e.g.pressuring trade unions, squeezing suppliers or choking market channels. At the government level, harmonious relations are characterized by fostering a perception of symbiosis, or a win-win situation akin to what Dunning (1997b) calls ‘AllianceCapitalism’, while strategy under conflict centers on pressuring policy space(s) through e.g. the exercise of systemic power or the threat of exit. Finally, the nature of relationships
95

Chapter Four
with other core companies, characterized here as a supranational oligopoly, can lead eitherto competition (in the Porterian sense) or collusion (in the Hymerian sense). Thesupranational oligopolistic character of relations between core companies will be discussedin more detail below.
Table 4.2: Realms of perceived conflict in competitive space
Level Focus of strategy Perceived relationship
Harmonious Adversarial
Supranationaloligopolies
Other core companies in supranational competitivespaces beyond the scope of policy space
Collusive behavior, e.g. price agreements, cartel formation,non-penetration of other core company complexes
Competitive behavior, e.g.dumping, preemptive investment,raising entry barriers through value chain capture
Governments Governments, both home and host.
Symbiotic win-win situation; shared strategic reality in policyand competitive space
Eliciting incentives through lobbybehavior, threat of exit, systemicpower etc. with minimalconcessions
Industrialcomplex
Stakeholders within the industrial complex, in particular value chain partners (suppliers and customers) and trade unions
Preservation of stakeholder consensus
Pressuring trade unions,suppliers, and customers, chokingmarket channels through broad horiz. positioning etc.
Core companies, by their very nature, are predisposed to anti-competitive behavior as partof their effort to reduce conflict. In their drive to preserve their positions at the core of theirrespective complexes, core companies are very extrinsically oriented. These extrinsic strategies relate in particular to three categories of bargaining partner: governments, (valuechain) partners within the core complex, and other core companies. Firms adapt their positioning, act to preserve core status and try to shape their competitive and institutionalenvironment.Core companies want to preserve their core positions in the long term. Strategy preferences (choices from a strategic repertoire) are focused on perceived areas of conflict, and geared towards removal of that conflict (Hymer’s reduction of conflict thesis; see also Porter andFuller [1986] on the importance of ‘conflict resolution’). Conflict removal with respect toother core companies comes down to the question of collusion versus competition. Corecompanies only view other core companies as competitors to a limited degree. Hymer’s(1976) conflict-reduction thesis, however, was aimed only at oligopolistic behavior ofeconomic actors, whereas the context of the strategic actor approach begs for analysis ofconflict with other types of actors.The reduction of conflict extends beyond relationships between core companies.Bargaining is an issue of rent sharing, and strategies for rent-sharing depend on positioningrelative not only to other core companies, but also to governments and to otherstakeholders. Conflict removal with respect to governments and value chain partners has todo with bargaining power and managing dependencies. Since bargaining power is relatedto dependency (Ruigrok and Van Tulder, 1995; Kobrin, 1987), a strategy built around power and influence must consider the degree to which the actor is dependent on thechoices and actions of other actors, and vice versa. These ideas are counter to strategic management theories which blend intrinsic and extrinsic motivations, also because positioning is less about developing distinctive competencies than about developing distinctive, independent industrial complexes.
96
Core companies and regionalism strategies
Transaction cost analysis is also inadequate due to its overwhelmingly intrinsic orientationand lack of contextual perspective. Strategies are not solely driven by exogenous economictriggers because core companies have enough power to influence market conditions (distorting the market instead of responding to the market), particularly when it comes totheir own competitive spaces. Core companies generate (‘structural’) market distortions through their market and non-market strategies; they are not an economic answer to(‘natural’) market distortions.Firms can apply both non-market and market strategies in positioning, bargaining and managing dependencies. Non-market techniques generally refer to lobby activity, whereas market techniques imply marketing, production and organization behavior. Marketstrategies imply the introduction of market distortions of different kinds (the perfectmarket does not exist and never has), both intrinsically and extrinsically motivated. Theymay consist of the generic strategies of Porter (cost leadership, cost focus, differentiationand focused differentiation); market seeking, asset seeking, or sourcing strategies, but alsoentail the use of economic muscle to sway policy outcomes, such as transfer pricing or thethreat of relocation. Often the two techniques are used in combination (e.g., the threat ofrelocation is the leverage behind the lobby). The emphasis in the literature is on market-oriented strategy because competitive space is assumed to be more important than policy space for firm strategies. Both market and non-market strategies can be what Bhagwati calls ‘directly unproductive’ activities (DUPs), where the emphasis is on shaping the environment to one’s bargaining advantage instead of production pur sang.In keeping to the framework devised in Chapter 3, the strategic behavior exhibited withrespect to conflict reduction and the management of dependencies can be analyzed inspatial terms. Strategic responses, spatially, involve influencing bargaining and competitive relationships through location decisions and the organization of activities.Jovanovic’s (2001) assumption is that firms want to maximize profit and minimizeoperating costs and any ‘penalty’ associated with different locations. That penalty,however, is generally quite limited for core companies, as they generally have sufficientmarket power to distort the market in other ways which ‘compensate’ for that penalty. Thisreiterates the assumption that core companies, as strategic actors, are not restrained by‘exogenous’ circumstances beyond their control. Furthermore, understanding strategy as an issue of power relations among individual actors has a realist bent. As soon as actors aredefined, their interests become more and more realist and less idealist, since idealism is associated with abstractions. Once an actor has a face and a name, it becomes self-interested.
4.2.2 Core companies and oligopolistic competition
There are a few reasons to justify the emphasis on core companies in regionalism.Jovanovic (2001) argues that, generally, most restructuring will take place over a longer period, in large part because information takes time to get around and companies do notalways know what is ‘expected’ of them. Core companies, however, are not subject toinformation asymmetries of this nature because they are part of the preceding political process and therefore able to respond immediately, or even proactively. Furthermore, theylead the restructuring process, particularly in its international dimension: according to UNCTAD (1998), fifty US firms account for 60% of the entire US outward FDI stock.
97
Chapter Four
It is useful to see the micro-reality of location, particularly in the cross-border context, as related to the nature of market structures and competition (i.e.; polypolistic, monopolistic,oligopolistic). Most Industrial Organization (IO) perspectives consider the decision toundertake cross-border productive activity as a logical outcome of an oligopolisticenvironment (Knickerbocker, 1973). As a consequence, oligopoly is a key ingredientwhich in effect makes Industrial Organization approaches meso more than micro. From an ‘internalization’ perspective, the firm is not really competing, only selecting fromenvironmentally conditioned options and as such a passive reactor to environmentalchange (moreover, internalization is an issue of intermediate markets, not productmarkets). Oligopolistic competition implies multiple producers for a given market, which in economic terms remains (artificially) defined by product categories (in reality the linebetween ‘products categories’ and thus ‘industries’ is quite arbitrary).Oligopoly means the field of players is manageable and limited. Therefore positioning strategies are not only necessary but also feasible. In a game of positioning, an actor has arange of options (‘strategic repertoire’) to choose from, not all of which are equally viablefor every firm (cf. Caves, 1996). Oligopolistic firms can and do choose a course of actionthat anticipates the behavior of their competitors, a dynamic which economists are unable to model reliably (Gilpin, 2001). Thus the strategic behavior which emerges fromoligopolistic structures means that actions are determined by drivers other than staticcircumstantial factors.Core companies’ overriding strategic operative, the preservation of their core position, can be expressed in terms of market power (cf. Robson, 1993). Lall (1976) defines marketpower as ‘the ability of particular firms, acting singly or in collusion, to dominate theirrespective markets (and so earn higher profits), to be more secure, or even to be lessefficient than in a situation with more effective competition…the concept may, of course,be applied to buyers (monopsonists) as well as sellers’ (quoted in Cantwell, 2000: 14). Market power implies being a price maker instead of a price taker. Encarnation and Wells1986: ‘competition among governments in the market for foreign investment is analogous to competition among producers for market share.’ Core companies are themselves an agglomeration of power in a field of limited power (oligopoly). This can also relate topolicy space, and therefore also to RIAs. Ultimately, the oligopolistic nature of firm interaction poses two overarching strategicoptions: rivalry or collusion (similar to competition and collaboration in the ‘embeddedfirm’ perspective; De Wit and Meyer, 1998). Hymer and Rowthorn (1970) were the first totruly consider oligopoly in the international context. In Hymer’s Market Power theory,firms collude in anti-competitive behavior to prevent new entrants. Oligopoly already suggests that optimal positioning in the economic sense may not be necessary and opens the possibility for sub-optimal behavior. This is simply because a firm’s rent-generating capacity may not be seriously threatened by its competitors (Doz, 1986). Moreover, this absence of threat may be an implicit or explicit ‘gentleman’s agreement’ by which corecompanies choose not to threaten each other’s rent-generating capacity (what Scherer [1980] calls ‘exercising mutual restraint’).If there were real competition among core companies, there would be a price war with negative consequences for all. Avoiding such situations therefore becomes the ‘firstconcern of corporate policy’ (Baran and Sweezy, 1966: p. 57). Thus collusion derives in part from recognition of the retaliatory power of rivals (Cowling and Sugden, 1987: 17).Price wars are particularly damaging for (innovative) products at the front end of the
98

Core companies and regionalism strategies
product life cycle, from which core companies gain the bulk of their advantages. Corecompanies owe much of their core position to their control over and exploitation of core technologies (Van Tulder and Junne, 1989). Positioning based on innovation secures alonger term core position. The temporal aspect is vital as ‘being a key player is not a state, but a process’ (Jovanovic, 2001: 32). Hymer also emphasizes the long term (‘the largefirms of the world are all competing for these various sources of future growth…’) butsecuring a stable core environment leads in his view to competition in ‘an oligopolistic rather than in a cutthroat way’ (Hymer, 1979: 82). These large internationally activeoligopolists ‘recognize their mutual interdependence and strive to share in the pie withoutdestroying it. As they do so they come to be less and less dependent on their homecountry’s economy for their profits and more and more dependent on the world economy.Conflicts between firms on the basis of nationality are thereby transformed intointernational oligopolistic market sharing and collusion’ (Hymer, 1979: 82).In fact, it can be argued that core companies are actually quasi monopolists. They try tokeep differentiating themselves from others, repositioning to maintain their own identity.Consequently, identifying competitive spaces is difficult; markets can be thought of in product categories (SIC codes etc.) but core companies cannot. Although their positions change, their existence is much more stable: they generally do not wipe each other of the competitive map. Competition works best when firms think they are working towards a monopoly position (at best) and an oligopoly (at worst) (Jovanovic, 2001). If core companies know that oligopoly is the setting, why should they bother to compete fully? In other words, core companies collude because they wish to avoid the perfect competitionwhich would otherwise erode their profits (Cowling and Sugden, 1987).Core company spatial organization strategies and corresponding locational decisions mustbe seen in the context of a core company’s positioning between collusion and competition(Cowling and Sugden, 1987) and their ‘signaling’ strategies with respect to one another(cf. Slager, 2004). According to Yamin (1991), lack of integration in world economy was generally seen as the basis of costs and disadvantages of foreign operations. As the worldeconomy integrates, monopolistic advantages may no longer be necessary to offset costs. Barriers to internalization would fall, but this would lead to even greater cutthroatcompetition, which core companies want to avoid. Plus the costs of internationalization forcompanies which are already international are considerably less than the costs of initialinternationalization, which TCA and Hymer were both considering. In fact, as firmsbecome increasingly international and exposed to more bargaining partners, the handlingof conflict becomes of greater importance. Internationalization and geographic spreadfunction as a risk mitigation strategy, whereby the risk is of losing one’s core position, andconflict resolution is the means to make the spread strategy feasible. For core companies,transactional uncertainties are considerably less significant than the conflict uncertainties.
4.2.3 Core company interaction with governments
Hymer (1976) and Vernon (1971) were among the first to direct attention towards firms aseconomic actors with political impact. Core company strategy in institution-building comprises techniques of influencing the regulatory environment. Generally the regulatoryregime is seen by business actors as a ‘thicket of rules’ (Braithwaite and Drahos, 2000:18). As such governments have often been seen as an obstacle to international strategies,although some now see them as a source of opportunity (Gilpin, 2001; Krugman, 1991;
99
Chapter Four
Porter, 1986). To many, the function of government as far as firms are concerned does notextend beyond the provision of economic and technical uncertainty, interest rates and fiscalconditions (Doz, 1986). From a firm point of view, policymakers are here to guaranteemacroeconomic stability, efficiency of inputs and infrastructure, and to establish the rules of the game (Porter, clusters 1998). Milton Friedman (1962) notes four functions that government performs for business: to serve as a rule maker and rule enforcer; to provide a common monetary authority; to control the negative consequences of monopoly power;and to take care of those who cannot legitimately participate in the system (for example‘madmen’ and children) (cited in Wartick and Wood, 1998: 43). Dunning, on the otherhand, sees only two legitimate interventions for governments: protection of infant industry, and countering anti-competitive behavior (Dunning, 1997b). Assumptions of the role of government are a part of core company strategic reality. The relevance of policy, however, has been understated in much of the literature. Doz (1986)argues that an analysis of government policies should be an integral part of strategymaking. ‘A middle level analysis is required to understand these policies and try toanticipate them. Merely studying their explicit manifestations – codes, laws, regulationsand the like – would ignore the opportunity to anticipate and even influence them bystudying their dynamics and understanding the concerns, motives and logic of governmentintervention’ (Doz, 1986: 258). Yet the assumptions of government behavior illustrated above are highly idealistic, dramatically understating the possibility of strategic behavior on the part of governments. It is possible that firms are more likely to have a realist view of policymakers than the other way around. The strategic use of public policy has been dealtwith extensively in the literature; firms establishing a presence in Europe pre-1992, forexample, were able to influence policy outcomes to suit their interests (Wartick and Wood,1998). Rugman and Verbeke (1994) also convincingly argue that firms pursue ‘shelter’strategies aimed at imposing artificial costs on rivals without positively affecting own core competencies. This implies the pursuit of extrinsic strategies (lobbying for protection) toavoid the necessity of intrinsic strategies (increased competitiveness) as strategic behavioron the part of firms (see also section 2.5). Rugman and Verbeke’s arguments also implythat firms don’t always share their strategic reality with governments when trying to realize shelters through political activity, since the use of protectionism (strategic trade policy) isusually legitimized by allegations of potential for superior profits or technology spillover,which are often untrue.Incidentally, this also suggests that non-market strategies have spatial dimensions, since afirm’s lobbying impact is greater if the firm is actually present as an economic actor withinthe institutional sphere it tries to shape (Baron, 2000). Similarly, ‘market players who stand to gain the most from integration will be the most active in lobbying for it’ (Mattli, 1999a: 3). Firms can influence policy as well simply through new ways of doing business,such as just-in-time production (JIT) which change de facto the business environment.Generally this in turn forces a policy response (actor interaction). Massive capital flight,for instance, can lead to a new institutional setting for capital controls. Another example is a shift towards increased vertical integration across geographic space and the resulting global division of labor. This is in itself a new way of doing business which can promptpolicy interventions that formalize (institutionalize) the new rules of the game.Studies by Lipson (1985), Bennet and Sharpe (1985), Evans (1979) and Moran (1974) suggest that the attractiveness of an investment site often depends on the relativebargaining power of the investing firm and the host country state and / or the degree of
100
Core companies and regionalism strategies
political risk associated with the host country (see also Moran, 1985). According to Gatz (1997), multinational enterprises see instability as the principal deterrent to investing and operating abroad. Despite its insights, the political risk literature assumes the decision tointernationalize has already been taken (or is inevitable); the question remains what
motivates the original decision, not what the go/no-go criteria are.The relationship between policy strategy and core company spatial organization strategiesrelate to bargaining power. Certain strands of International Organization have fused withelements of political economy to take firm-government interaction better into account while attempting to carry the discussion farther than ‘firms as profit maximizers andgovernments as policy realists’ (Vernon, 1994). Graham (2000) introduces game theoreticperspectives to firm behavior in order to develop inter-firm rivalry better, while Muller and Van Tulder (2002) explore the strategic intent of policymaking in relation to firms andtheir internationalization strategies. Dunning (1986) lists six dimensions of activity byinternationally operating firms with potentially negative consequences (supply and / or demand leakage) for a country’s growth regime: the transfer of resources, the control of resources, sourcing strategies, domestic competition effects, the distribution of value-added, and the impact on the international allocation of resources. Geographic spread can enhance bargaining power, but concentration can as well, if only relative to differentpartners.In much of the literature, the emphasis for both firms and governments is placed on competitiveness. Unfortunately discussions of competitiveness can in themselves become a level of analysis problem because it is not always clear what competitive means. On the one hand there is macro-competitiveness, emphasizing e.g. the balance of trade and pricedevelopments (cf. Sachwald, 1993); on the other hand meso-competitiveness, where market variables such as factor and demand conditions are key (cf. Porter); andadditionally micro-competitiveness, which emphasizes the ability of individual firms to besuccessful in their respective markets. Some analyses have reversed the question, sayingthat firm level competitiveness is a function of national competitiveness (like Whitleyetc.), but this overemphasizes the role of the home diamond in firm strategy. Corecompanies are precisely core companies because they are largely the cause of the diamondand not simply shaped by it, and core company strategies are defined at the level of thefirm, not sector (Rugman and Verbeke,1991).Maintaining core position is key in general and regional integration is part and parcel of a strategy in this regard. One element of strategy in maintaining core position relative togovernments is that of geographic spread. Spreading is a risk reduction strategy (Rugman,1976) by which firms can counterbalance new pressures from governments (Phelps, 1997;Muller and Van Tulder, 2002). Moreover, core companies are generally able (financially,in particular) to manage the risks inherent in spread, which tend to be lower than the risk of‘policy capture’.
4.2.4 Core companies and bargaining within the industrial complex
Core company international strategies also have to do with perceptions of conflict amongstakeholders within core industrial complexes, particularly within the value chain.Relations at this level hinge largely on the dependencies and interdependencies of variousactors. In this way their bargaining power is defined. Strategies to this end relate to the
101
Chapter Four
management of the various dependencies within a core company’s industrial complex (for a more detailed exposition see Ruigrok and Van Tulder, 1995). Relationships can vary from complete independence to one of total dependence, where thevalue chain partner has no influence on core strategy and production decisions. The ‘concept of control’ of the core company varies accordingly from one of cooperation / competition to one of structural control, respectively. Different degrees of dependency aresuited to different types of network configurations. Whereas independent partners willengage the core company in an egalitarian network, a relationship of complete dependencewill translate into structural control. This scale of dependencies in fact parallels the debateon post-Fordism (see section 3.3) as the egalitarian network represents the flexiblespecialization paradigm of Piore and Sabel (1984), formal control networks represent theFordist production paradigm, and structural, informal control describes the Toyotistrelationship between core company and value chain partners.In their global positioning strategies, core companies look increasingly for long-termplanning relationships with members of the industrial complex. Whereas in the past corecompanies had multiple-sourcing agreements which served to play suppliers against one another, the trend is currently towards single-sourcing agreements, whereby relationshipsare more exclusive (Ruigrok and Van Tulder, 1995). This reduced interpenetration of corecomplexes is a parallel to the collusive core company gentleman’s agreement.One of the means through which core companies can attempt to gain competitiveadvantage is by squeezing value chain partners. Both collusion and competition, however, can have detrimental effects for core company network partners. Collusion may be detrimental because it makes it difficult, if not impossible, for partners to play core companies off against each other, and competition may be detrimental because the higherbargaining power of core companies in general means that the costs of competition are more likely to be borne by other members of the industrial complex.Peoples and Sugden (2000) also explore collusion between firms, but then in terms ofsetting wages. Here internationalization becomes a means to sabotage labor’s ability toorganize on a company-wide basis (Cowling and Sugden, 1987). The collusive, intra-regional gentleman’s agreement hinges on the assumption that inputs, be they labor,intermediate goods or raw materials, are finite and to a certain extent location-bound.Collusion is unnecessary if there are infinite resources, but in the real world collusion takesplace with respect to inputs to avoid ‘race to the bottom’ strategies based on competitivecost alone. Peoples and Sugden (2000) describe this as the ‘divide and rule’ tactics of MNEs with respect to labor.Under increased potential for conflict, internationalization strategies may alleviatetensions. Companies have been shown to withdraw from their home countries to exertpressure on other domestic stakeholders, be they governments or value chain partners(Vernon, 1998; Ruigrok and Van Tulder, 1995). Thus by dispersing activities (increasedcross-border production), as opposed to consolidation of production in a single countrywithin the region, core companies can enhance their bargaining power relative to regionalvalue chain partners (an ownership-type advantage derived from multinationality; cf. Dunning, 1997c). Spreading can therefore also be a strategy to pressure value chainpartners (Ruigrok and Van Tulder, 1995). Dispersion allows core companies to avoid‘capture’ by other stakeholders. Geographic spread, in other words, can in itself be a strategic asset for core companies.
102
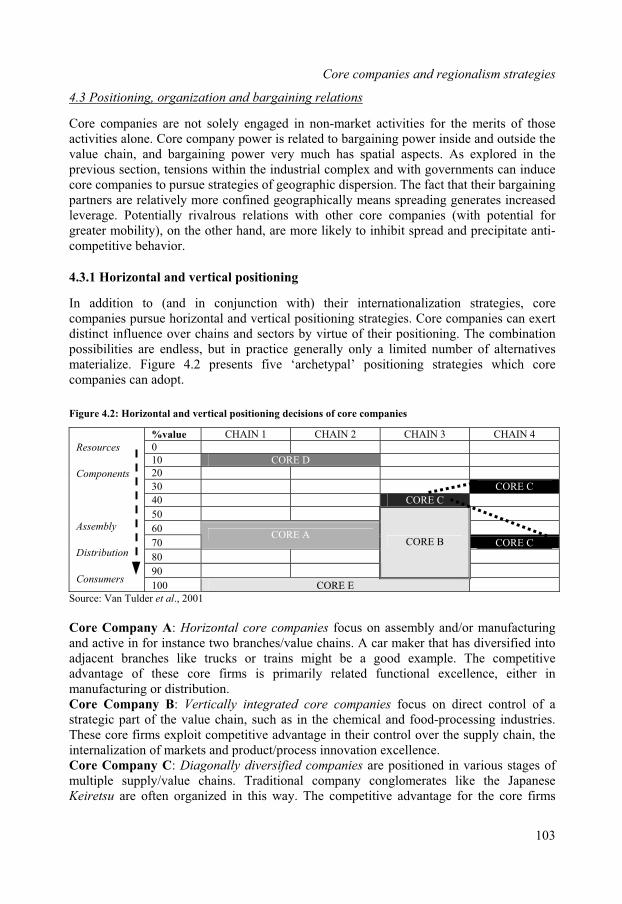
Core companies and regionalism strategies
4.3 Positioning, organization and bargaining relations
Core companies are not solely engaged in non-market activities for the merits of those activities alone. Core company power is related to bargaining power inside and outside thevalue chain, and bargaining power very much has spatial aspects. As explored in theprevious section, tensions within the industrial complex and with governments can inducecore companies to pursue strategies of geographic dispersion. The fact that their bargainingpartners are relatively more confined geographically means spreading generates increased leverage. Potentially rivalrous relations with other core companies (with potential forgreater mobility), on the other hand, are more likely to inhibit spread and precipitate anti-competitive behavior.
4.3.1 Horizontal and vertical positioning
In addition to (and in conjunction with) their internationalization strategies, corecompanies pursue horizontal and vertical positioning strategies. Core companies can exertdistinct influence over chains and sectors by virtue of their positioning. The combinationpossibilities are endless, but in practice generally only a limited number of alternativesmaterialize. Figure 4.2 presents five ‘archetypal’ positioning strategies which core companies can adopt.
Figure 4.2: Horizontal and vertical positioning decisions of core companies
%value CHAIN 1 CHAIN 2 CHAIN 3 CHAIN 4
0
10 CORE D
20 CORE A
30 CORE C
40 CORE C
50
60
70CORE A
CORE C
80
90 CORE D
CORE B
Resources
Components
Assembly
Distribution
Consumers100 CORE E
Source: Van Tulder et al., 2001
Core Company A: Horizontal core companies focus on assembly and/or manufacturingand active in for instance two branches/value chains. A car maker that has diversified intoadjacent branches like trucks or trains might be a good example. The competitiveadvantage of these core firms is primarily related functional excellence, either inmanufacturing or distribution.Core Company B: Vertically integrated core companies focus on direct control of a strategic part of the value chain, such as in the chemical and food-processing industries.These core firms exploit competitive advantage in their control over the supply chain, the internalization of markets and product/process innovation excellence.Core Company C: Diagonally diversified companies are positioned in various stages of multiple supply/value chains. Traditional company conglomerates like the Japanese Keiretsu are often organized in this way. The competitive advantage for the core firms
103
Chapter Four
arises from the coordination of various activities that might also relate to different product cycles.Core Company D: Horizontal resource-based core companies are situated at the beginning of the value chain. Positioning in multiple value chains is probably required toattain core status, since the risk of substitution effects for firms operating in only one valuechain is high. This risk can be mitigated if the resource is strategic and the marketoligopolistic, as is the case in e.g. the diamond and gold industry, and in some specialtyseeds. The competitive advantage for the core firm comes from the monopoly on a particular strategic input.Core Company E: Horizontal retailers are positioned at the very end of the supply chain.Although sometimes considered a relatively weak position in the past, a number of changes in market structure and competition behavior have reinforced this as a corestrategy. The increasing concentration of a small number of companies in this part of thechain, increased horizontal diversification and the change from a sellers’ market to a buyers’ market due to more assertive consumers have allowed in particular wholesaletraders and retailers to reinforce their position. They derive their competitive advantagefrom their ownership of shops with extensive market reach or as a trading house (such as traditional Japanese sogo shoshas) which handle all the exports of a whole cluster ofcompanies.
The more a company moves upstream the value chain, the more its position as a core company can be jeopardized. Other guarantees are required in that case. Either a dominantposition in the provision of strategic components or very strong brand value can reinforcethe position of the supplier. Intel microprocessors is a textbook case. It not only developskey components, but has also succeeded in convincing consumers (based on a huge advertisement budget) to search for the “Intel Inside” logo. This strategy has changed Intelfrom a dependent component supplier (of IBM) into a leading core company in theInformation Technology business. Computer manufacturers have to a certain degree lostsome of their core company status, with the vertically integrated IBM as a prime example.Positioning strategies also have spatial implications in that the various stages of productiveactivity and added value, as well as final markets, are not one-dimensional. The ideal-type positioning strategies explored above can in theory be pursued in a single national policyspace, or across any number of borders. Moreover, the type of positioning has clear ramifications for a company’s bargaining environment since different horizontal andvertical positioning denote different configurations of stakeholders. Key bargainingrelations for a company of type ‘B’ may be with a small number of distributors, while type‘E’ will likely interact primarily with a wide range of suppliers. Thus positioning strategy involves bargaining relations.
4.3.2 Core companies and the spatial organization of production
The spatial organization of a core company’s activities refers to way in which theproduction process is organized. Production organization is often associated with Fordistautomated assembly, where workers were specialized in a particular stage of the production process instead of each individual good being produced from start to finish by the same worker(s). The crisis of post-Fordism (see Chapter 3) refers thus to the uncertainty in new strategies for organizing production that emerged in the 1980s, just
104
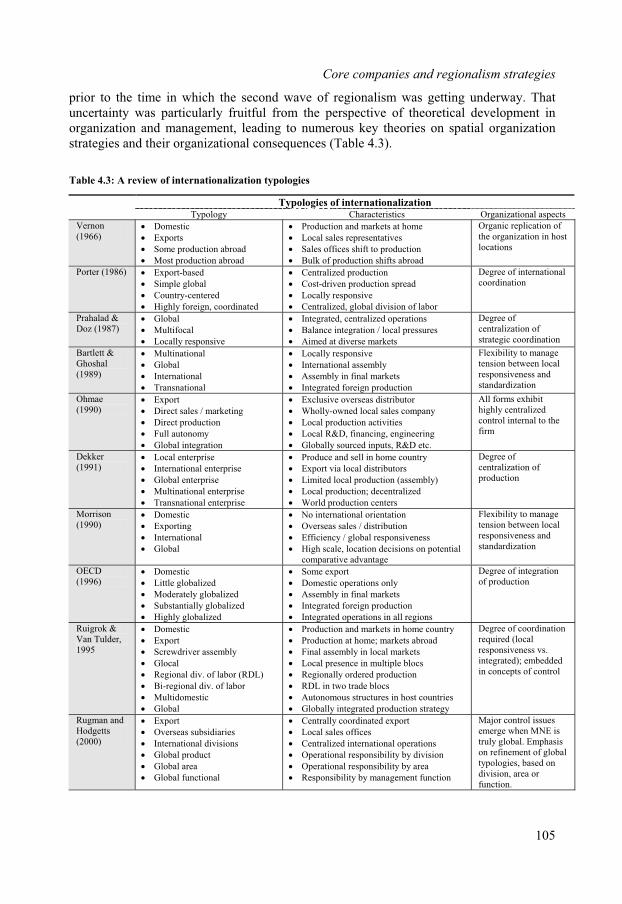
Core companies and regionalism strategies
prior to the time in which the second wave of regionalism was getting underway. That uncertainty was particularly fruitful from the perspective of theoretical development inorganization and management, leading to numerous key theories on spatial organizationstrategies and their organizational consequences (Table 4.3).
Table 4.3: A review of internationalization typologies
Typologies of internationalizationTypology Characteristics Organizational aspects
Vernon(1966)
Domestic
Exports
Some production abroad
Most production abroad
Production and markets at home
Local sales representatives
Sales offices shift to production
Bulk of production shifts abroad
Organic replication of the organization in host locations
Porter (1986) Export-based
Simple global
Country-centered
Highly foreign, coordinated
Centralized production
Cost-driven production spread
Locally responsive
Centralized, global division of labor
Degree of international coordination
Prahalad & Doz (1987)
Global
Multifocal
Locally responsive
Integrated, centralized operations
Balance integration / local pressures
Aimed at diverse markets
Degree of centralization of strategic coordination
Bartlett & Ghoshal(1989)
Multinational
Global
International
Transnational
Locally responsive
International assembly
Assembly in final markets
Integrated foreign production
Flexibility to managetension between local responsiveness and standardization
Ohmae(1990)
Export
Direct sales / marketing
Direct production
Full autonomy
Global integration
Exclusive overseas distributor
Wholly-owned local sales company
Local production activities
Local R&D, financing, engineering
Globally sourced inputs, R&D etc.
All forms exhibit highly centralized control internal to the firm
Dekker(1991)
Local enterprise
International enterprise
Global enterprise
Multinational enterprise
Transnational enterprise
Produce and sell in home country
Export via local distributors
Limited local production (assembly)
Local production; decentralized
World production centers
Degree of centralization of production
Morrison(1990)
Domestic
Exporting
International
Global
No international orientation
Overseas sales / distribution
Efficiency / global responsiveness
High scale, location decisions on potential comparative advantage
Flexibility to managetension between local responsiveness and standardization
OECD(1996)
Domestic
Little globalized
Moderately globalized
Substantially globalized
Highly globalized
Some export
Domestic operations only
Assembly in final markets
Integrated foreign production
Integrated operations in all regions
Degree of integration of production
Ruigrok & Van Tulder,1995
Domestic
Export
Screwdriver assembly
Glocal
Regional div. of labor (RDL)
Bi-regional div. of labor
Multidomestic
Global
Production and markets in home country
Production at home; markets abroad
Final assembly in local markets
Local presence in multiple blocs
Regionally ordered production
RDL in two trade blocs
Autonomous structures in host countries
Globally integrated production strategy
Degree of coordination required (local responsiveness vs.integrated); embeddedin concepts of control
Rugman and Hodgetts(2000)
Export
Overseas subsidiaries
International divisions
Global product
Global area
Global functional
Centrally coordinated export
Local sales offices
Centralized international operations
Operational responsibility by division
Operational responsibility by area
Responsibility by management function
Major control issues emerge when MNE is truly global. Emphasison refinement of global typologies, based on division, area or function.
105
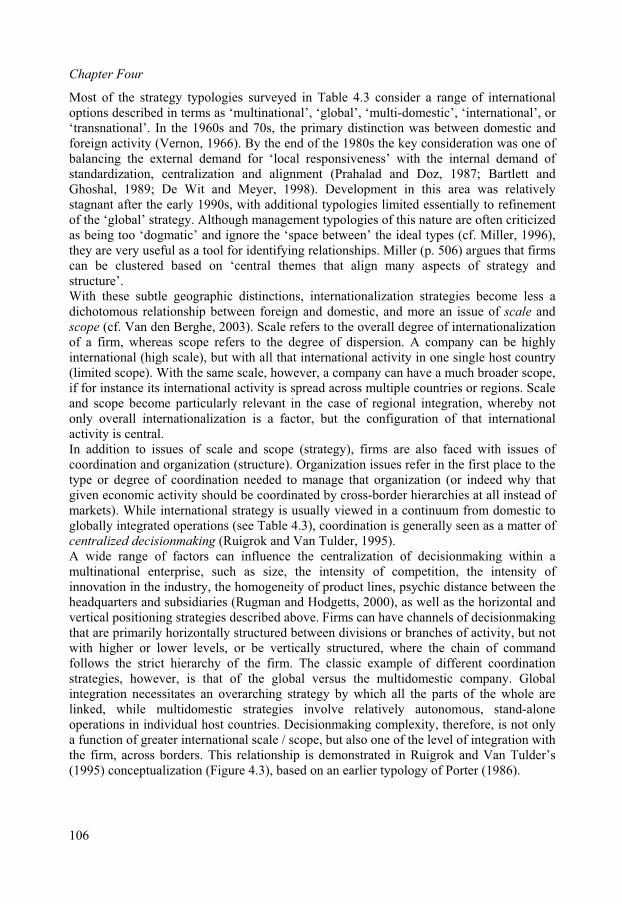
Chapter Four
Most of the strategy typologies surveyed in Table 4.3 consider a range of internationaloptions described in terms as ‘multinational’, ‘global’, ‘multi-domestic’, ‘international’, or‘transnational’. In the 1960s and 70s, the primary distinction was between domestic and foreign activity (Vernon, 1966). By the end of the 1980s the key consideration was one of balancing the external demand for ‘local responsiveness’ with the internal demand of standardization, centralization and alignment (Prahalad and Doz, 1987; Bartlett andGhoshal, 1989; De Wit and Meyer, 1998). Development in this area was relativelystagnant after the early 1990s, with additional typologies limited essentially to refinementof the ‘global’ strategy. Although management typologies of this nature are often criticized as being too ‘dogmatic’ and ignore the ‘space between’ the ideal types (cf. Miller, 1996),they are very useful as a tool for identifying relationships. Miller (p. 506) argues that firmscan be clustered based on ‘central themes that align many aspects of strategy and structure’.With these subtle geographic distinctions, internationalization strategies become less a dichotomous relationship between foreign and domestic, and more an issue of scale and scope (cf. Van den Berghe, 2003). Scale refers to the overall degree of internationalizationof a firm, whereas scope refers to the degree of dispersion. A company can be highlyinternational (high scale), but with all that international activity in one single host country(limited scope). With the same scale, however, a company can have a much broader scope, if for instance its international activity is spread across multiple countries or regions. Scale and scope become particularly relevant in the case of regional integration, whereby notonly overall internationalization is a factor, but the configuration of that internationalactivity is central.In addition to issues of scale and scope (strategy), firms are also faced with issues ofcoordination and organization (structure). Organization issues refer in the first place to the type or degree of coordination needed to manage that organization (or indeed why thatgiven economic activity should be coordinated by cross-border hierarchies at all instead of markets). While international strategy is usually viewed in a continuum from domestic toglobally integrated operations (see Table 4.3), coordination is generally seen as a matter of centralized decisionmaking (Ruigrok and Van Tulder, 1995).A wide range of factors can influence the centralization of decisionmaking within amultinational enterprise, such as size, the intensity of competition, the intensity ofinnovation in the industry, the homogeneity of product lines, psychic distance between theheadquarters and subsidiaries (Rugman and Hodgetts, 2000), as well as the horizontal and vertical positioning strategies described above. Firms can have channels of decisionmakingthat are primarily horizontally structured between divisions or branches of activity, but notwith higher or lower levels, or be vertically structured, where the chain of commandfollows the strict hierarchy of the firm. The classic example of different coordinationstrategies, however, is that of the global versus the multidomestic company. Globalintegration necessitates an overarching strategy by which all the parts of the whole are linked, while multidomestic strategies involve relatively autonomous, stand-aloneoperations in individual host countries. Decisionmaking complexity, therefore, is not onlya function of greater international scale / scope, but also one of the level of integration withthe firm, across borders. This relationship is demonstrated in Ruigrok and Van Tulder’s(1995) conceptualization (Figure 4.3), based on an earlier typology of Porter (1986).
106
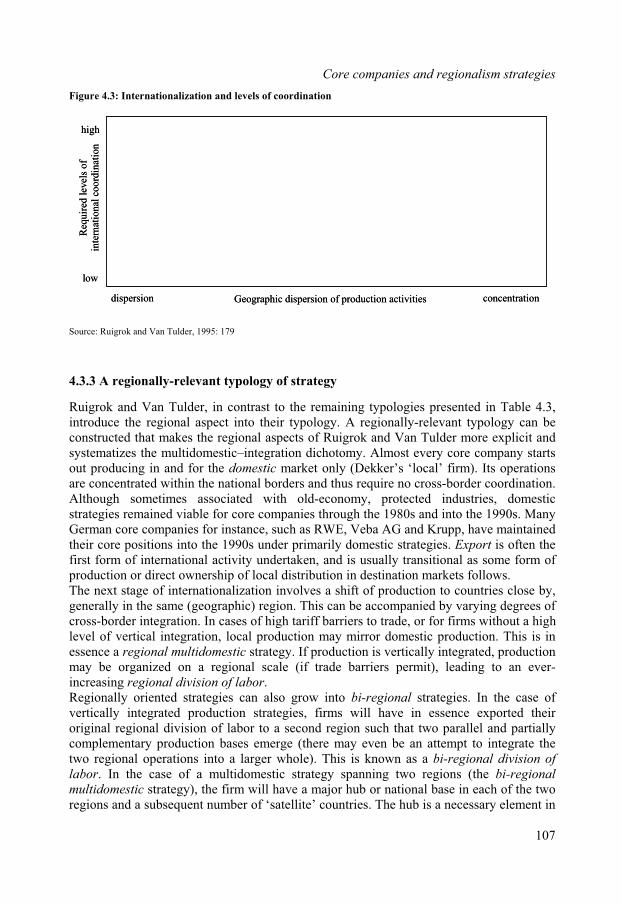
Core companies and regionalism strategies
Figure 4.3: Internationalization and levels of coordination
Req
uir
ed l
evel
so
fin
tern
atio
nal
coo
rdin
atio
n
low
high
Geographic dispersion of production activitiesdispersion concentration
Req
uir
ed l
evel
so
fin
tern
atio
nal
coo
rdin
atio
n
low
high
Geographic dispersion of production activitiesdispersion concentration
Source: Ruigrok and Van Tulder, 1995: 179
4.3.3 A regionally-relevant typology of strategy
Ruigrok and Van Tulder, in contrast to the remaining typologies presented in Table 4.3, introduce the regional aspect into their typology. A regionally-relevant typology can be constructed that makes the regional aspects of Ruigrok and Van Tulder more explicit and systematizes the multidomestic–integration dichotomy. Almost every core company starts out producing in and for the domestic market only (Dekker’s ‘local’ firm). Its operations are concentrated within the national borders and thus require no cross-border coordination.Although sometimes associated with old-economy, protected industries, domesticstrategies remained viable for core companies through the 1980s and into the 1990s. ManyGerman core companies for instance, such as RWE, Veba AG and Krupp, have maintainedtheir core positions into the 1990s under primarily domestic strategies. Export is often thefirst form of international activity undertaken, and is usually transitional as some form of production or direct ownership of local distribution in destination markets follows.The next stage of internationalization involves a shift of production to countries close by,generally in the same (geographic) region. This can be accompanied by varying degrees of cross-border integration. In cases of high tariff barriers to trade, or for firms without a highlevel of vertical integration, local production may mirror domestic production. This is inessence a regional multidomestic strategy. If production is vertically integrated, productionmay be organized on a regional scale (if trade barriers permit), leading to an ever-increasing regional division of labor.Regionally oriented strategies can also grow into bi-regional strategies. In the case of vertically integrated production strategies, firms will have in essence exported their original regional division of labor to a second region such that two parallel and partiallycomplementary production bases emerge (there may even be an attempt to integrate thetwo regional operations into a larger whole). This is known as a bi-regional division of
labor. In the case of a multidomestic strategy spanning two regions (the bi-regionalmultidomestic strategy), the firm will have a major hub or national base in each of the two regions and a subsequent number of ‘satellite’ countries. The hub is a necessary element in
107

Chapter Four
acquiring sufficient critical mass in the host region in which to replicate the multidomesticorganization; small piecemeal strategies in a fragmented second region will lack the necessary momentum. In the home region this will be the home country and in the second region most likely the largest market.Firms whose production strategies encompass more than two regions can be described as
able 4.4: Core company strategies
globally integrated companies. Levitt (1983) is most generally associated with the push for globally integrated strategies, which became a hype that led to the debate on footloose firms and the apparent obsolescence of the nation-state (Ohmae, 1990). At the same timethe tension between global reach and local needs created a counterweight to global integration (Douglas and Wind, 1987), reflected in global multidomestic strategies (‘multinational’, Bartlett and Ghoshal, 1989; Dekker, 1991; ‘full autonomy’, Ohmae,1990). Global multidomestic strategies are characterized by a high geographic dispersion of activity, but respective national divisions are considerably more autonomous. Unileveris a classic example, with its decentralized structure and locally-sensitive brandingstrategies and product lines. The global multidomestic strategy is similar to the export strategy in that it may also be the first form of internationalization undertaken by a company. The regionally-relevant typology is summarized in Table 4.4.
T
Domestic (DOM) Production nearly all in home country
Nearly all sales in home country
Exporter (EXP) Production nearly all in home country
edSales considerably more internationaliz
Regional division of labor (RDL)
Production primarily intra-regional
Firm exhibits cross-border integration
Regional multi-domestic (RMDM)
Production primarily intra-regional
Little to no cross-border integration
Bi-regional divisionof labor (BiRDL)
Production is highly internationalized in home region
e regionProduction moderately internationalized outside the hom
Extra-regional production primarily centered in a single second region
Firm exhibits cross-border integration
Bi-regionalmultidomestic(BiRMDM)
Production is highly internationalized in home region
e regionProduction moderately internationalized outside the hom
Extra-regional production primarily centered in a single second region
Little to no cross-border integration
Global (GLOB) Production exhibits high geographic dispersion:
rest of worldPresence in second region as well as third region /
Firm exhibits cross-border integration
Globalmultidomestic(GLMDM)
Production exhibits high geographic dispersion:
rest of worldPresence in second region as well as third region /
Little to no cross-border integration
ll the strategies described above reflect in large part efforts to deal with institutionalized Aobstacles to cross-border economic activity (e.g. tariffs, non-tariff barriers, voluntaryexport requirements) from an insider perspective. The typology omits strategies identifiedin other studies (‘glocal’, ‘screwdriver assembly’) which are typically associated with the Japanese approach to internationalization (Ruigrok and Van Tulder, 1995; Ohmae, 1990).Japan has expressly avoided regionalism as a strategy and hence Japanese companies will
108
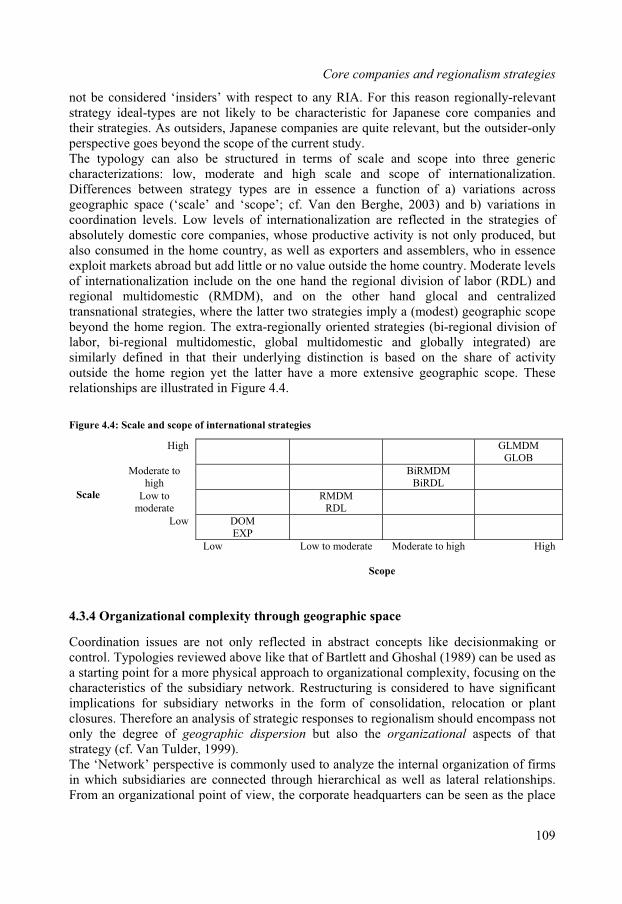
Core companies and regionalism strategies
not be considered ‘insiders’ with respect to any RIA. For this reason regionally-relevantstrategy ideal-types are not likely to be characteristic for Japanese core companies and their strategies. As outsiders, Japanese companies are quite relevant, but the outsider-onlyperspective goes beyond the scope of the current study.The typology can also be structured in terms of scale and scope into three generic
igure 4.4: Scale and scope of international strategies
GLMDM
characterizations: low, moderate and high scale and scope of internationalization.Differences between strategy types are in essence a function of a) variations across geographic space (‘scale’ and ‘scope’; cf. Van den Berghe, 2003) and b) variations in coordination levels. Low levels of internationalization are reflected in the strategies ofabsolutely domestic core companies, whose productive activity is not only produced, butalso consumed in the home country, as well as exporters and assemblers, who in essence exploit markets abroad but add little or no value outside the home country. Moderate levels of internationalization include on the one hand the regional division of labor (RDL) and regional multidomestic (RMDM), and on the other hand glocal and centralizedtransnational strategies, where the latter two strategies imply a (modest) geographic scopebeyond the home region. The extra-regionally oriented strategies (bi-regional division of labor, bi-regional multidomestic, global multidomestic and globally integrated) aresimilarly defined in that their underlying distinction is based on the share of activityoutside the home region yet the latter have a more extensive geographic scope. Theserelationships are illustrated in Figure 4.4.
F
HighGLOB
Moderate to BiRMDMhigh BiRDL
Low tomoderate
RM MDRDL
Scale
w DOMLoEXP
Low Low to moderate Moderate to high High
4.3.4 Organizational complexity through geographic space
decisionmaking or
monly used to analyze the internal organization of firms
Scope
Coordination issues are not only reflected in abstract concepts like control. Typologies reviewed above like that of Bartlett and Ghoshal (1989) can be used as a starting point for a more physical approach to organizational complexity, focusing on thecharacteristics of the subsidiary network. Restructuring is considered to have significantimplications for subsidiary networks in the form of consolidation, relocation or plantclosures. Therefore an analysis of strategic responses to regionalism should encompass notonly the degree of geographic dispersion but also the organizational aspects of that strategy (cf. Van Tulder, 1999).The ‘Network’ perspective is comin which subsidiaries are connected through hierarchical as well as lateral relationships.From an organizational point of view, the corporate headquarters can be seen as the place
109
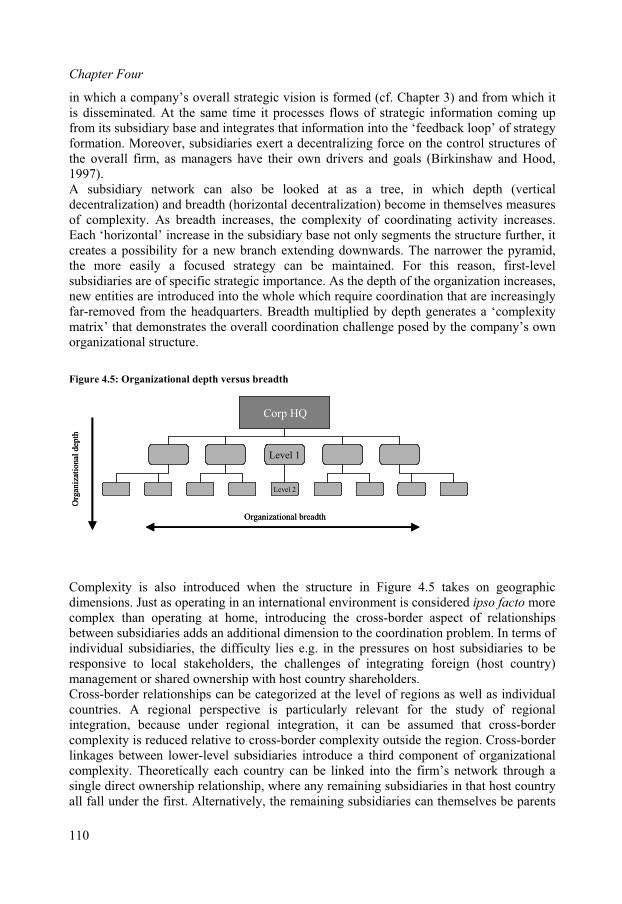
Chapter Four
in which a company’s overall strategic vision is formed (cf. Chapter 3) and from which itis disseminated. At the same time it processes flows of strategic information coming upfrom its subsidiary base and integrates that information into the ‘feedback loop’ of strategyformation. Moreover, subsidiaries exert a decentralizing force on the control structures ofthe overall firm, as managers have their own drivers and goals (Birkinshaw and Hood, 1997).A subsidiary network can also be looked at as a tree, in which depth (vertical
igure 4.5: Organizational depth versus breadth
omplexity is also introduced when the structure in Figure 4.5 takes on geographic
s as well as individual
decentralization) and breadth (horizontal decentralization) become in themselves measuresof complexity. As breadth increases, the complexity of coordinating activity increases.Each ‘horizontal’ increase in the subsidiary base not only segments the structure further, itcreates a possibility for a new branch extending downwards. The narrower the pyramid,the more easily a focused strategy can be maintained. For this reason, first-levelsubsidiaries are of specific strategic importance. As the depth of the organization increases,new entities are introduced into the whole which require coordination that are increasingly far-removed from the headquarters. Breadth multiplied by depth generates a ‘complexitymatrix’ that demonstrates the overall coordination challenge posed by the company’s own organizational structure.
F
Level 1
Level 2
Corp HQ
Org
aniz
atio
nal
dep
th
Organizational breadth
Level 1
Level 2
Corp HQ
Org
aniz
atio
nal
dep
th
Organizational breadth
Cdimensions. Just as operating in an international environment is considered ipso facto morecomplex than operating at home, introducing the cross-border aspect of relationshipsbetween subsidiaries adds an additional dimension to the coordination problem. In terms of individual subsidiaries, the difficulty lies e.g. in the pressures on host subsidiaries to be responsive to local stakeholders, the challenges of integrating foreign (host country)management or shared ownership with host country shareholders.Cross-border relationships can be categorized at the level of regioncountries. A regional perspective is particularly relevant for the study of regionalintegration, because under regional integration, it can be assumed that cross-border complexity is reduced relative to cross-border complexity outside the region. Cross-borderlinkages between lower-level subsidiaries introduce a third component of organizationalcomplexity. Theoretically each country can be linked into the firm’s network through a single direct ownership relationship, where any remaining subsidiaries in that host countryall fall under the first. Alternatively, the remaining subsidiaries can themselves be parents
110
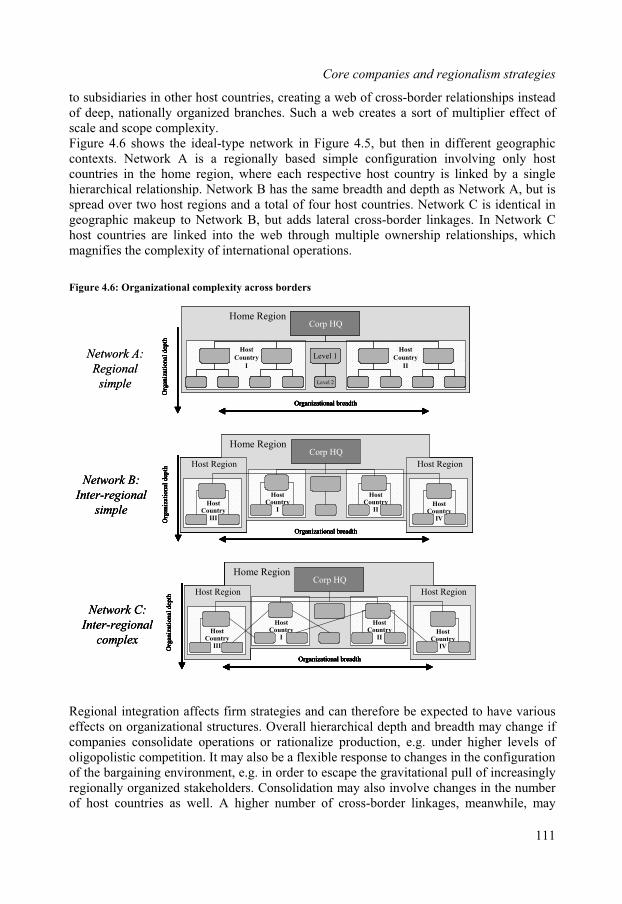
Core companies and regionalism strategies
to subsidiaries in other host countries, creating a web of cross-border relationships insteadof deep, nationally organized branches. Such a web creates a sort of multiplier effect ofscale and scope complexity.Figure 4.6 shows the ideal-type network in Figure 4.5, but then in different geographic
igure 4.6: Organizational complexity across borders
egional integration affects firm strategies and can therefore be expected to have various
contexts. Network A is a regionally based simple configuration involving only hostcountries in the home region, where each respective host country is linked by a single hierarchical relationship. Network B has the same breadth and depth as Network A, but isspread over two host regions and a total of four host countries. Network C is identical ingeographic makeup to Network B, but adds lateral cross-border linkages. In Network Chost countries are linked into the web through multiple ownership relationships, which magnifies the complexity of international operations.
F
Host
Country
I
Host
Country
II
Level 1
Level 2
Corp HQ
Org
aniz
atio
nal
dep
th
Organizational breadth
Home Region
Host
Country
I
Host
Country
II
Level 1
Level 2
Corp HQ
Org
aniz
atio
nal
dep
th
Organizational breadth
Level 1
Level 2
Corp HQ
Org
aniz
atio
nal
dep
th
Organizational breadth
Home Region
Network A:
Regional
simple
Home Region
HostCountry
IHost
CountryIII
Host Region
HostCountry
IIHost
CountryIV
Host Region
Corp HQ
Org
aniz
atio
nal
dep
th
Organizational breadth
Home Region
HostCountry
IHost
CountryIII
Host Region
HostCountry
IIHost
CountryIV
Host Region
Corp HQ
Org
aniz
atio
nal
dep
th
Organizational breadth
Network B:
Inter-regional
simple
Home Region
HostCountry
IHost
CountryIII
Host Region
HostCountry
IIHost
CountryIV
Host Region
Corp HQ
Org
aniz
atio
nal
dep
th
Organizational breadth
Home Region
HostCountry
IHost
CountryIII
Host Region
HostCountry
IIHost
CountryIV
Host Region
Corp HQ
Org
aniz
atio
nal
dep
th
Organizational breadth
Network C:
Inter-regional
complex
Host
Country
I
Host
Country
II
Level 1
Level 2
Corp HQ
Org
aniz
atio
nal
dep
th
Organizational breadth
Home Region
Host
Country
I
Host
Country
II
Level 1
Level 2
Corp HQ
Org
aniz
atio
nal
dep
th
Organizational breadth
Level 1
Level 2
Corp HQ
Org
aniz
atio
nal
dep
th
Organizational breadth
Home Region
Network A:
Regional
simple
Home Region
HostCountry
IHost
CountryIII
Host Region
HostCountry
IIHost
CountryIV
Host Region
Corp HQ
Org
aniz
atio
nal
dep
th
Organizational breadth
Home Region
HostCountry
IHost
CountryIII
Host Region
HostCountry
IIHost
CountryIV
Host Region
Corp HQ
Org
aniz
atio
nal
dep
th
Organizational breadth
Network B:
Inter-regional
simple
Home Region
HostCountry
IHost
CountryIII
Host Region
HostCountry
IIHost
CountryIV
Host Region
Corp HQ
Org
aniz
atio
nal
dep
th
Organizational breadth
Home Region
HostCountry
IHost
CountryIII
Host Region
HostCountry
IIHost
CountryIV
Host Region
Corp HQ
Org
aniz
atio
nal
dep
th
Organizational breadth
Network C:
Inter-regional
complex
Home Region
HostCountry
IHost
CountryIII
Host Region
HostCountry
IIHost
CountryIV
Host Region
Corp HQ
Org
aniz
atio
nal
dep
th
Organizational breadth
Home Region
HostCountry
IHost
CountryIII
Host Region
HostCountry
IIHost
CountryIV
Host Region
Corp HQ
Org
aniz
atio
nal
dep
th
Organizational breadth
Network C:
Inter-regional
complex
Reffects on organizational structures. Overall hierarchical depth and breadth may change ifcompanies consolidate operations or rationalize production, e.g. under higher levels of oligopolistic competition. It may also be a flexible response to changes in the configuration of the bargaining environment, e.g. in order to escape the gravitational pull of increasinglyregionally organized stakeholders. Consolidation may also involve changes in the numberof host countries as well. A higher number of cross-border linkages, meanwhile, may
111
Chapter Four
reflect increased cross-border integration of production, but it could also lead to moreextensive control strategies by embedding a firm’s subsidiaries in a more rigid (and lesstransparent) hierarchy.
4.3.5 Internationalization and bargaining power
a response to market and demand
ents and their relations
latively weak
in the geopolitical balance of power are
Although production strategies of course are in partconditions, spatial organization also plays a key role in managing conflict and bargainingrelations (the external equivalent of ‘managing interdependencies’, Prahalad and Doz, 1987). Ultimately a core company’s spatial organization is geared towards preserving itscore position through a combination of market and non-market strategies. The division of labor is far more than an issue of labor relations. The way in which a company coordinatesits activities (the concept of control, see 4.1.3) involves bargaining relations outside the value chain (in particular with respect to governments) as well as positioning strategiesrelative to other companies (in particular core companies). Thus ‘division of labor’ refersto strategies to manage relations at all three levels identified in section 4.2: government,core industrial complex and supranational oligopolies.The spatial organization of activity has consequences for governmnot only with core companies, but other interest groups as well (see Chapter 3) as governments attempt to exert push-pull forces on firms in the interest of breaking down monopolistic structures, securing job growth or investment growth. A government maytherefore have a very different idea of a firm’s optimal spatial organization andcoordination than the firm itself does (cf. Prahalad and Doz, 1987). Locational decisions atthe core company level are also clearly an issue in relations with value chain stakeholders, be they suppliers, customers or labor unions (e.g. the ‘divide and rule’ tactics discussed insection 4.2.5). A company’s spatial organization is, however, also of strategic significancein its relations with other core companies. Supranational (core) oligopolies, and the degree to which inter-firm relations are characterized by collusion or competition, are a majorfactor in the way core companies choose to allocate production (Table 4.5).Table 4.5 shows which at which levels bargaining partners are considered reand which relatively strong with respect to the core company itself. Where actors are seen as relatively strong are areas of potential conflict and thus levels at which special attentionis paid to managing relations. Since the spatial strategies outlined above reflect competitivespaces of varying geographic scope, the other strategic actors in those spaces becomeincreasingly ‘diffuse’ the greater the international scope of bargaining relations. A company pursuing a multi-domestic strategy, for instance, has to deal with governments in multiple countries while a purely domestic strategy is based on interaction with only the home government. The international character of such competitive spaces has both advantages and disadvantages which are ‘balanced out’ by the different characteristics of the respective strategies for spatial organization.Increased economic interdependence and changesrelated to changes in the configuration of stakeholders and their relative bargaining power. The bargaining relations embodied by the various concepts of control can be analyzed onthe basis of the relative strength of the actors in a given competitive space. Relative strength is also a matter of relative threat, and can thusly be related to perceptions of conflict as discussed in section 4.2.2.
112
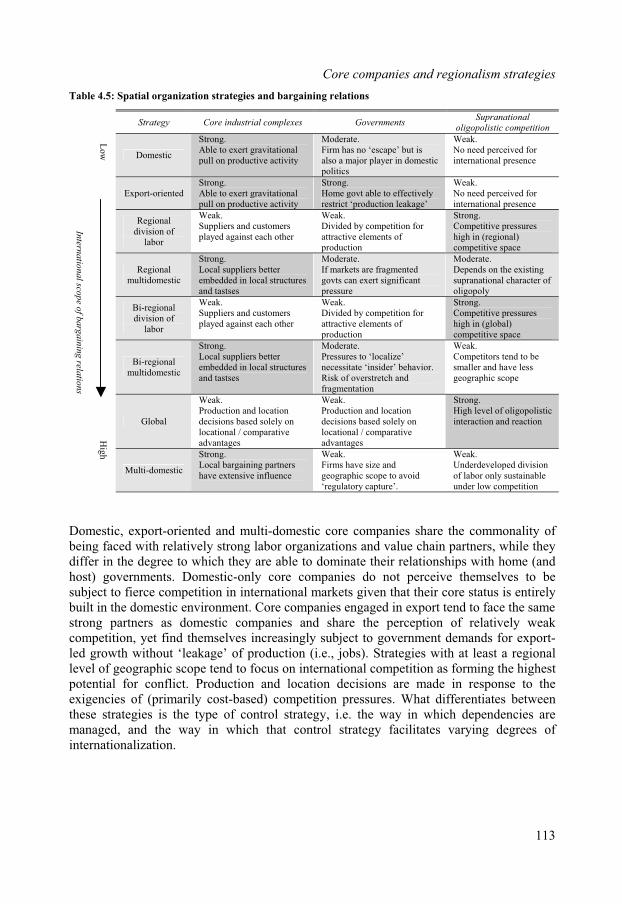
Core companies and regionalism strategies
Table 4.5: Spatial organization strategies and bargaining relations
rnmentsSupranational
oligopolistic competitionStrategy Core industrial complexes Gove
Domestic
Strong.Able to exert gravitational pull on productive activity
Moderate.Firm ha iss no ‘escape’ butalso a major player in domesticpolitics
Weak.No need perceived for
onal presenceinternati
Export-orientedStrong.Able to exert gravitational pull on productive activity
Strong.Home govt able to effectivelyrestrict ‘production leakage’
Weak.No need perceived for
onal presenceinternati
Regionaldivision of
labor
Weak.Suppliers and customersplayed against each other e elements of
Weak.Divided by competition for attractivproduction
Strong.Competitive pressures high in (regional)competitive space
Regionalmultidomestic
Intern
atio
na
lsco
pe
of
ba
rga
inin
grela
tion
s
Lo
wH
igh
Strong.Local suppliers better embedded in local structuresand tastses
Moderate.If markets are fragmentedgovts can exert significantpressure
Moderate.Depends on the existingsupranational character ofoligopoly
Bi-regionaldivision of
labor
Weak.Suppliers and customers
gainst each othery competition for
e elements of played a
Weak.Divided battractivproduction
Strong.Competitive pressureshigh in (global)competitive space
Bi-regionalmultidomestic
Strong.Local suppliers better embedded in local structuresand tastses
Moderate.Pressures to ‘localize’necessitate ‘insider’ behavior.Risk of overstretch andfragmentation
Weak.Competitors tend to be
and have lesssmallergeographic scope
Global
Weak.Production and location decisions based solely on d solely on locational / comparativeadvantages
Weak.Production and location
s basedecisionlocational / comparativeadvantages
Strong.High level of oligopolistic interaction and reaction
Multi-domestic
Strong.Local bargaining partnershave extensive influence
Weak.Firms have s
hicize and
scope to avoid
Weak.Underdeveloped division
only sustainable geograp‘regulatory capture’.
of laborunder low competition
omestic, export-oriented and multi-domestic core companies share the commonality of Dbeing faced with relatively strong labor organizations and value chain partners, while they differ in the degree to which they are able to dominate their relationships with home (andhost) governments. Domestic-only core companies do not perceive themselves to besubject to fierce competition in international markets given that their core status is entirelybuilt in the domestic environment. Core companies engaged in export tend to face the samestrong partners as domestic companies and share the perception of relatively weakcompetition, yet find themselves increasingly subject to government demands for export-led growth without ‘leakage’ of production (i.e., jobs). Strategies with at least a regionallevel of geographic scope tend to focus on international competition as forming the highestpotential for conflict. Production and location decisions are made in response to theexigencies of (primarily cost-based) competition pressures. What differentiates betweenthese strategies is the type of control strategy, i.e. the way in which dependencies aremanaged, and the way in which that control strategy facilitates varying degrees ofinternationalization.
113
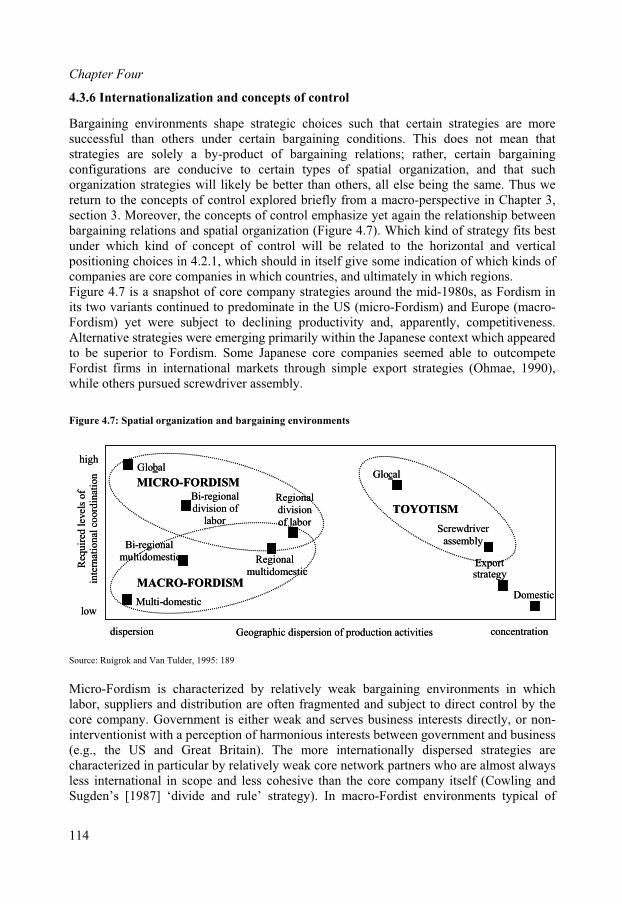
Chapter Four
4.3.6 Internationalization and concepts of control
Bargaining environments shape strategic choices such that certain strategies are moresuccessful than others under certain bargaining conditions. This does not mean that strategies are solely a by-product of bargaining relations; rather, certain bargainingconfigurations are conducive to certain types of spatial organization, and that such organization strategies will likely be better than others, all else being the same. Thus we return to the concepts of control explored briefly from a macro-perspective in Chapter 3,section 3. Moreover, the concepts of control emphasize yet again the relationship betweenbargaining relations and spatial organization (Figure 4.7). Which kind of strategy fits bestunder which kind of concept of control will be related to the horizontal and vertical positioning choices in 4.2.1, which should in itself give some indication of which kinds ofcompanies are core companies in which countries, and ultimately in which regions. Figure 4.7 is a snapshot of core company strategies around the mid-1980s, as Fordism inits two variants continued to predominate in the US (micro-Fordism) and Europe (macro-Fordism) yet were subject to declining productivity and, apparently, competitiveness.Alternative strategies were emerging primarily within the Japanese context which appearedto be superior to Fordism. Some Japanese core companies seemed able to outcompeteFordist firms in international markets through simple export strategies (Ohmae, 1990), while others pursued screwdriver assembly.
Figure 4.7: Spatial organization and bargaining environments
by relatively weak bargaining environments in whichbor, suppliers and distribution are often fragmented and subject to direct control by the
Source: Ruigrok and Van Tulder, 1995: 189
Micro-Fordism is characterizedlacore company. Government is either weak and serves business interests directly, or non-interventionist with a perception of harmonious interests between government and business(e.g., the US and Great Britain). The more internationally dispersed strategies arecharacterized in particular by relatively weak core network partners who are almost always less international in scope and less cohesive than the core company itself (Cowling andSugden’s [1987] ‘divide and rule’ strategy). In macro-Fordist environments typical of
Req
uir
ed l
evel
sof
inte
rnat
ion
al c
oord
inat
ion
low
high
Geographic dispersion of production activitiesdispersion concentration
Multi-domestic
Exportstrategy
Domestic
Global
Regionaldivisionof labor
Bi-regionaldivision of
labor
Regionalmultidomestic
Bi-regionalmultidomestic
Screwdriverassembly
Glocal
MACRO-FORDISM
MICRO-FORDISM
TOYOTISM
114
Core companies and regionalism strategies
Continental European countries, governments and members of the core complex arerelatively strong and exert considerable gravitational pull on the activities of their core companies. As a result, core companies in macro-Fordist environments tend to exhibitrelatively lower degree of internationalization than firms in micro-Fordist environments.To the extent that they are internationally active, their operations tend to be less centralizedin response to the pressures of local (host) bargaining partners. The structural control ofsuppliers and distribution typically associated with Toyotism is a key feature of Japanese core companies limits the possibilities for extensive internationalization, as structuralcontrol is difficult to ‘export’ to new markets characterized by different pre-existingbargaining environments.Thus do the typologies reviewed in Table 4.3 clearly betray their ‘national’ origins.Ohmae’s typology reflects the high level of structural control associated with Toyotism at
company strategies and regionalism
all stages of international activity. Porter (1986), Prahalad and Doz (1987), Bartlett and Ghoshal (1989) and Morrison (1990) show bias towards the micro-Fordist strategies of US multinationals. Morrison’s typology, for instance, reflects not only the highly centralizedcoordination of US companies, but also their attempt to ‘export’ their production processes in classic micro-Fordist fashion. Perspectives on decisionmaking support these views,albeit from a different angle (Rugman and Hodgetts, 2000). The way in whichdecisionmaking is centralized is connected to the spatial organization of the firm’sactivities. Continental European firms, for instance, tend to be fairly decentralized in their decisionmaking, which facilitates the multi-domestic strategy associated with macro-Fordism. On the other hand, the combination of centralized and decentralized mechanismstypical of Japanese firms fits well with the Toyotist precepts of indirect or structuralcontrol.
4.4 Core
ole of European and US core companies in ing regionalism strategies) is an attempt to
It is an extension of this logic to argue that the rpropagating regional institutions (and developfind solutions for the crisis of post-Fordism. This section explores possible dynamics incompetitive space in response to regional integration in order to highlight how they can differ from the dynamics intended or anticipated by governments. In competitive space, spatial organization is a function both of competitors’ relative positions and of bargainingrelations both inside and outside the value chain. The locational aspects of regionalismstrategies are crucial, because e.g. bargaining leverage in competitive space will be higher with a physical presence in a competitor’s market (and access to the competitor’s homeinstitutions) than through arm’s length trade relationships. Strategies are therefore not necessarily economically driven because core companies have enough power to influencemarket conditions, distorting the market themselves as opposed to purely responding to it,certainly when it comes to their own competitive spaces. By extention an RIA gives corecompanies a larger market to distort; outside of that space, they may be forced more into competition-based positioning strategies. Developments of this nature may signal a newtype of semi-collusive behavior within regions that induces insiders to respect each other’s core positions. Core companies, given the strength of their position at home and withintheir region, may be less likely to see regionalism as an opportunity to expand into the restof the region as they are to see it in terms of the opportunities it affords for extra-regional
115
Chapter Four
(outward) expansion. Such expansion may be also encouraged if the intra-regional growthdynamic by itself is not sufficient to sustain an insider’s core position.
4.4.1 Hypothesized firm-level responses in the literature
re in different ways. From an
on the spatial distribution of economic activity
capabilities into account, Rugman (1994) employs a 2x2 matrix to
s in contrast to the generalizations of
Integration can be interpreted on the basis of the literatuinternalization perspective, it may be seen as a mechanism that lowers transaction costs and the necessity to internalize. In terms of internalization theory, Regional integration isbest seen as a variable that influences the market-versus-hierarchy cost equation and thusthe strategic option to license, export or produce locally. As barriers to cross-border activity (transaction costs) fall, companies will either consolidate production in one country and export (final products) or develop a regional division of labor in the case of a vertically integrated company. In addition, firms could develop inter-firm specialization such that each firm produces narrower ranges of goods (Jovanovic, 2001) and trade morewith each other (such specialization has collusive qualities in that it signals an inter-firmdivision of labor instead of competition in similar product markets). Yet, Jovanovic (ibid.) admits, many firms, including car companies, have not capitalized on the potential for concentration of production. Simply put, companies have additional concerns that extend beyond the ‘optima’ of technology and production curves. Internalization rationale ishighly intrinsic and, although clearly relevant, ignores extrinsic considerations of bargaining and strategic positioning.‘Integration has three basic effectsdepending on the functional intra-industry production links, the mobility of factors of production and public policy: an industry may either spread or agglomerate, or the regionaleconomic structure may stagnate and polarize in such a way that advanced regions develophigh value-added activities and experience low unemployment, while backward regions are left with low value-added economic activities and high unemployment’ (Jovanovic, 2001: 3). The choice of RIA strategy, however, is not universal. As Caves (1982) argued, there isno Pareto optimal strategy since options are not always equally attractive or profitable todifferent firms. Plus, decisions are made at the firm level, not the industry level (Rugmanand Verbeke, 1991) and it is not realistic to assume that firms within an industry will react the same way (intrinsic); there are the extrinsic issues of other stakeholders andcompetitive position.To take firm-specificanalyze the interaction between changes to the policy environment (country-specificadvantages) and firm capabilities (firm-specific advantages). Often integration isconsidered as a risk-reducing phenomenon with (re)location effects on production(Vernon, 1994; Eaton et al., 1994). Vernon (1994), considering NAFTA, contrasts short-and long-term effects of integration on corporate restructuring. In the short term, therewould be a reshuffling between the three countries as smaller production plants in Canadaand Mexico are closed and production relocated to the US to exploit scale. In the longterm, however, investment would shift once again to Canada and Mexico as scaleopportunities are exhausted and congestion occurs.Others have generated more subtle, varied hypothesethe authors above. Yannopoulos (1990) predicted four basic restructuring responses: 1)defensive import-substituting investment, as extra-regional firms attempt to circumventregional protectionist tendencies and switch from an export-strategy to local product to
116
Core companies and regionalism strategies
serve the regional market; 2) reorganization investment, whereby firms reorganizeproduction in accordance with regional members’ comparative advantages; 3) rationalization investment, where firms respond to scale potential; and 4) offensive import-substituting investment, whereby firms try to capitalize on the growth-enhancing andmarket-augmenting effects of integration. Buckley et al. (2000) categorizes Yannopoulos’soriginal responses in terms of ‘insider’ and ‘outsider’ effects. In contrast, other authorsassume (in the case of Europe) that outsiders had a better competitive position to start withand therefore ‘will be able to appropriate a larger part of the gains assumed to flow from asingle market because of their greater initial competitiveness and the fact that it may beeasier for them to reorganize’ (Young et al. 1991: 20).Such analyses hinge largely on internationalization in the purest sense of domestic versus
in comparative
ty (ex-post) studies of the way firms deal with the issue of regional integration
foreign activity. Foreignness is a matter of political and economic uncertainty and financial risk; regional integration reduces ‘foreignness’ and thus uncertainty and risk. Yet mostcore companies have been integrating production internationally a lot longer than RIAshave been in effect (Robson, 1993). Additionally, the firm-level focus in theorydevelopment is overwhelmingly investigated empirically with aggregated data. As Buckleyet al. (2000) point out, ‘no disaggregated longitudinal studies have examined the effect of the removal of trade barriers on changes in MNEs’ production location decisions’ (p. 7).Feinberg and Keane (2001) are a notable exception, using a firm-level dataset to analyzeproduction location decisions of Canadian firms in response to NAFTA. In the strategy literature, regional integration is viewed as a changeadvantage and competitive advantage, in part through raising entry barriers. RIAs are generally associated with the implementation of ‘regional’ strategies, defined by Morrisonand Roth as ‘the cross-subsidization of market-share battles in pursuit of regionalproduction, branding and distribution advantages. A transnational corporation with a regional strategy locates strategic decision-making within the region; market share battlesare designed, waged and monitored within the region, and company operations are geared to regional scale requirements’ (1992, p. 45). Conn and Yip (1997) found that the use ofregional strategies was associated with poorer performance, while global strategies were associated with better performance. Schlie and Yip (2000) found in a study of the car industry that global strategy should come first, only possibly complemented by a regionalstrategy as a second step. In other words, regionalization is not a stepping stone towardsglobalization. This supports earlier research by the Conference Board which revealed thatregionalizing pressures were forcing some companies to ‘shift up’ to regional strategy, and others to ‘shift down’ to regional strategy because ‘global businesses [were] toocumbersome or insensitive to specific market needs’ (cited in Morrison, 1990: 145). Although the strategy literature is very much focused on intra-regional reorganization, it does show that regionalism strategies can be much broader than the adoption of a regional
strategy.Third-paremphasize dynamic effects such as economies of scale and product specialization (SingleMarket Review, 1997; Davies et al., 1999; Blank and Haar, 1998). In the SMR study,firms were hesitant to define the SEM as a strategically important issue. Correlations at thenational level were higher than for sectors across nations. It is quite likely that many of thefirms surveyed did not know with any great certainty what the significance of the SEMwould be and may have simply reflected the viewpoints of the ‘national’ debates. TheBlank and Haar study (1998), based on an in-depth survey among North American MNEs
117

Chapter Four
to assess the impact of NAFTA on corporate strategy, found that the North Americanregional market had become a centerpoint of many firms’ strategic outlooks long beforeNAFTA was ratified. The study, although revealing of firms’ strategic perceptions andintents, lacked any substantive empirical analysis of real production decisions and as such may be biased towards the ‘PR’ interests of the companies interviewed.Davies et al. (1999) addressed the issue of competitive pressures and the SEM, assuming
4.4.2 Openness from a core company perspective
tional environment affect bargaining
able 4.6: Regional openness from a core company perspective
that market integration would lead to lower prices, leaving low-cost producers over whowould typically increase their scale to exploit scale economies. The survey revealed a definite tendency towards restructuring due to the SEM, namely in a return to corebusiness in response to higher competitive pressures. The study also found that multinationality and diversification are neither substitute nor complementary strategies;i.e., they are both pervasive features of EU manufacturing activity, but a direct correlationis not evident. Ex-post studies of this type are based on the underlying assumption thatfirms are fully informed and respond predictably to market levers. A core companyapproach is necessary as the very exhaustiveness of e.g. the SMR sample may have led todiffuse responses from firms which either had little stake in an integrated European marketor lacked the political vision to know what that stake should be.
Under regional integration, the changes to the institurelations with core company complexes, governments, and power struggles within corecompany oligopolies in different ways. Drawing on Chapter 3, it can be argued thatinstutitional changes under regionalism can be captured in various dimensions of openness (Table 4.6). The clash between ‘integrative’ forces on the one hand and those ofinternational diversity can be seen as push-pull dynamics surrounding openness acrosspolicy spaces. In fact, regionalism as a political phenomenon can be seen in the context of this ‘ideological’ debate as an institutional framework within which to address the crisis ofpost-Fordism.
T
Inward openness Outward openness
Inside-in Outside-in Inside-out Outside-out
Relations insider Positioning behavior relative Extra-regional positioning, Indirectf third-
with othercore companies, regional governments, regional suppliers
to outsider firms, be theycore companies, suppliers or customers. Includes non-market strategies.
relations with extra-regionalgovts and (potential) core industrial complex partners
effects oncompetitive space oparty core companies and their complexes (‘global’competition’)
able 4.6 describes the nature of inward and outward openness from a core companyTperspective. The inside-in dimension relates to the positioning strategies of core companieswith other core companies inside the region, and the bargaining relations with otherstakeholders. Outside-in openness (seen from the perspective of an insider core company)relates essentially exclusively to positioning behavior relative to outsider economic actors,be they core companies, suppliers or customers. Outside-in openness regarding political
118

Core companies and regionalism strategies
actors refers to the ability of extra-regional governments to influence intra-regional competitive spaces directly. Although such behavior is possible, it usually follows political channels; therefore core companies will likely manage outside-in openness with respect tooutsider governments via lobbying. In terms of outward openness, the inside-outdimension is defined by the positioning strategies of core companies outside the region(both market and non-market). Outside-out openness refers to the (indirect) effects of theregional space on the competitive spaces of outsider core companies and their corecomplexes. This is, in effect, the impact of core companies’ regionalism strategies on‘global competition’ and the multilateral system.The relative importance of different dimensions depends on international exposure of the
4.4.3 Openness and shifting perceptions of conflict
c scope (Porter, 1986).
tner
ng becomes even more important with respect to extra-regional
core company in question. The typology has an explicit ‘insider’ dimension in that thestrategies are considered from within the RIA. The same table, however, could beduplicated to describe the strategies of ‘outsiders’ (e.g. the response commonly associatedwith Japanese firms anxious to avoid the prospects of a post-1992 ‘Fortress Europe’. However, as was suggested under 4.3.4, certain spatial configurations are more associatedwith certain concepts of control than others, and therefore a given RIA may not be ‘home’to the whole range of core company ideal-types. Additionally, it has been suggested thatthe ‘global’ and ‘glocal’ strategies are more ideology than reality and thus only a veryselect group of firms may be placed under these categories. Which strategies predominatein which given geographic areas, and how these strategies change under regionalintegration, will be explored at the level of individual regions, and in so doing the typologyper region will be more focused. Additionally, changing openness regimes can be expectedto affect different strategies in different ways.
International strategy at the micro level is a matter of geographiResponses to RIAs involve shifting resources to gain positioning in response to, and in an attempt to shape, policy decisions and the (re)allocation of rents as a result. Realizedrestructuring behavior characterizes the outcomes of regional integration trajectories.Spatial restructuring with respect to any given policy space, or any value chain parinvolves location decisions. Core companies like to maintain a geographic spread ofactivity beyond that expected by efficiency arguments because this allows them to maintain their bargaining position the best. This tendency gains a regional dimensionthrough regionalism pressures, which create and reinforce an ‘us versus them’ mentality.Just as governments perceive conflict at various levels in a relative sense, regionalismshifts perceptions of conflict from the intra-regional level to the inter-regional level. As a result (depending on the degree to which their competitive spaces supersede policy spaces geographically), core companies may be more concerned with extra-regional strategicconsiderations.Hence positionicompetitors. As policy space changes, the incentives for companies to locate production within their home country and within their region change. As countries integrate, the sizeand shape of (potential) competitive space changes, transcending national and evenregional boundaries, making issues of outward openness particularly relevant at the firmlevel. In fact, there is evidence that regionalism creates or reinforces an ‘us versus them’mentality among insider firms relative to outsiders. In the North American steel industry,
119
Chapter Four
for example, trade disputes initiated by NAFTA steel producers are increasingly aimed at non-NAFTA producers, with disputes between regional competitors dropping to virtually nil in 1998-99 (Bagsarian, 1999). Of all the 242 WTO disputes in the 1995-2002 period,only nine covered disputes between members of the same RIA. Two applied to NAFTA, inwhich Canada and Mexico used WTO dispute settlement procedures in 2001 to challengeunilateral positions taken by the United States. Such a move says something about thenature of NAFTA as an institution; consider, again in the case of the steel industry, the US’s unilateral 30 percent import duty on foreign steel announced in the spring of 2002.In the EU, on the other hand, no member country has filed a WTO complaint against
nfiguration of
ganized division of labor may be more
regional conflict.
another EU member state, which illustrates the advanced nature of EU integration. The ‘usversus them’ mentality is also given form by the relatively higher threshold under an RIAfor outsiders to file complaints. For example, only 13 of the 242 cases mentioned above addressed individual EU countries. Similarly, the European Commission has always actedas plaintiff on behalf of all member countries. ‘Us vs. them’ is the most logical formula ofmanaging conflict in the context of regionalism and signals in fact a shift towards moreextrinsically-driven strategic behavior. Moreover, the us vs. them dichotomy is also a result of institutional changes, as insider firms e.g. have better access to regional capital (national treatment provisions etc.). This makes it a self-reinforcing system.The example of trade disputes demonstrates that regionalism alters the cobargaining relations within a core company’s industrial complex. These bargainingrelations are subject to the dynamics of openness in its various dimensions. Different typesof openness are more relevant for a given strategy type than others. A domestic firm, for instance, will be primarily affected by inward openness given that its competitive space is limited to its home country. Inside-in openness, or the removal of restrictions to cross-border activity within the region, will likely raise competitive pressures from otherregional core companies, as well as potential tensions with home and other regionalgovernments as the opening up of the domestic competitive space threatens the firm’s core position. Similar arguments apply if the region is opened up to outsiders, in which case thedomestic core company may agitate for special protective measures or resist intrusion bylobbying for dumping charges against the home governments of new extra-regionalentrants. If the RIA is designed to ‘disentrench’ regional core companies by creating incentives to expand extra-regionally, it may weaken the home position of regionalcompetitors as they relocate activities abroad thereby opening up the regional playing fieldfor the domestic core company. Whether the RIA is able to effect some degree of outside-out openness (i.e., openness between extra-regional third parties), on the other hand, willnot likely have immediate significant impact.Core companies employing a regionally-orconcerned about outside-in openness and the risk of outsiders penetrating their productionnetworks, capturing their suppliers and / or distribution, since an RDL is most effective ifthe region affords some kind of protection. At the same time, the increased policyharmonization between regional governments and transparency at the policy level will reduce the firm’s ability to play regional governments against each other. Some of these risks can be offset by cost reductions afforded by accompanying inside-in openness, but this in turn poses new challenges in the form of less fragmented, regionally-organizedsuppliers. The ultimate effect may be considerable pressure to relocate extra-regionally.The deeper the integration, the higher the stakes are, and the greater the sense of inter-
120

Core companies and regionalism strategies
Bi-regional firms are faced with an exponential increase in strategic complexity if theregions in which their activities are centered both engage in regional integration. A bi-
atory internationalization trajectories
rate inside the typology grid (Prahaladpull dimensions in the sense that
core companies. Positioning depends on the
regional organization runs the risk of being ‘torn apart’ by the gravitational pull in each respective region and may, particularly in the case of vertically integrated firms (with a bi-regional division of labor), be unable to sustain a cohesive overall strategy. Globallyoriented firms, on the other hand, are more likely to have sufficient geographic scope thatvery few bargaining partners are in a position to exert much pressure, particularly if (as is the case for multidomestic firms) competition often takes place in national markets where competitors are often a fraction of the size of the globally-oriented multidomestic corecompany.
4.4.4 Migr
As the ‘rules of the game’ change, strategies can migand Doz, 1987: 30). Strategies are subject to push and RIAs may ‘push’ the behavior of economic actors within the policy space, as well as act as incentives that ‘pull’ economic actors in other policy spaces. Strategy migrations can be seen as responses to shifts in the nature of a core company’s competitive space. Such shifts are characterized by changes in bargaining relations with governments and otherstakeholders as well as the degree of exposure to competitive pressures from other corecompanies. The changed nature of bargaining relations necessitates adaptations to thespatial organization of activity (internationalization) and the coordination applied to thatorganization. Strategic responses to the new bargaining environment are aimed at reducingthe potential for conflict at some or all levels. The security of a core company’s core position hinges on its ability to manage these (potentially adversarial) relationships in sucha way that its core status is not jeopardized. The inside-in dynamics under regionalism refer in part to competitive and collusivepositioning relative to other regional insiderdegree of openness and where insider core companies perceive competitive pressures to beintra-regional or extra-regional. If competition is perceived to be intra-regional,internationalization strategies will be part of an effort to deal with that potentialcompetition, as well as changes in the bargaining relations with home governments or partners in the industrial complex. If competition is perceived to be extra-regional, theremay be more of a tendency towards collusive behavior within the region rooted in the ‘usversus them’ mentality which regionalism fosters. Such collusive behavior can lead to aregional ‘gentleman’s agreement’ among core companies. ‘The gentleman’s agreement’refers to the reluctance of core companies to compete directly with one another in ‘a cutthroat way’ (Hymer, 1979), and thus to abstain from strategies that form a direct assaulton the core networks of other core companies within their home region. This means for instance a lack of initiatives to capture another core company’s supply chains, distribution channels, or labor pools. This tacit agreement is rooted in the desire to avoid competitionon two fronts; effective global competition strategy would be severely compromised if a core company not only had to compete better against outsiders, but against insiders as well.A more intrinsically driven core company, subject to relatively little conflict with itsstakeholders, may develop regional production centers in numerous countries to replace cross-border production chains, consolidating and concentrating individual productsegments scattered about the region. Jovanovic (2001), for instance, argues that
121
Chapter Four
horizontally integrated companies specialize production by plant instead of producing allgoods in all countries, while vertically integrated companies specialize componentproduction by plant. Such strategies (which Jovanovic attributes to ‘increasedcompetition’) allow core companies to bundle their strength without sacrificing their geographic spread. This suggests a migration from a multi-domestic strategy to essentially a regional division of labor.Yet outside-in openness may alter the logic of a regional division of labor because new competitors change the relative costs and benefits of comparative-advantage based
anti-
in product and factor
t that restructuring is limited to matters of coordination. This can
production strategies. The entry behavior of outsiders changes the supply and demandcharacteristics of the local factors upon which advantage is based. Outside-in openness will have the most impact on regionally-oriented core companies (domestics, exporters and RDLs). Although core companies will actively pursue non-market strategies gearedtowards reducing the possibilities for outsiders to capitalize on intra-regional opportunities,their abilities to minimize outsider penetration directly are limited. If governments enhance import protection for a relatively larger market via integration, this makes the region moreattractive for external investors. Through capturing suppliers and distribution channels, as well as labor supplies, core companies can create entry barriers by ‘locking up’ markets.Additionally, inside-in openness can inherently create entry barriers for outsiders aimed atnationally organized markets because it removes barriers to cross-border activity, forcing entrants de facto to compete on a much larger scale instead of pursuing a piecemealstrategy of entering individual national or sub-regional markets one at a time. Meanwhile,insider firms may be able to expand the geographic scope of their industrial complexes aspolicy harmonization allows for expansion of the core company’s concept of control.Inside-out openness may in itself be a side-effect of inside openness or a matter of activepolicy stimulation. If the intra-regional competitive space is characterized bycompetitive behavior and thus precludes aggressive expansion within the home region,extra-regional activity is likely to form the spearhead of growth. Regionalization at thetheoretical level would mean a harmonization at certain levels of the bargainingenvironment, meaning transposition of a core company’s control strategy would be betterenabled (cf. Ruigrok and Van Tulder, 1995). In other words, expansion is facilitated by regionalism. Extra-regional expansion may in turn be facilitated by outside-out effects ofan RIA. Outside-out openness may lead e.g. regional exporters to relocate some of theirproduction outside the region in an attempt to profit from the larger market afforded by the‘me-too’ regionalism strategies of its destination market countries.Companies with extensive geographic dispersion may be forced to agglomerate as value chain partners organize regionally, outsiders raise competitionmarkets, or the bargaining power of governments rises as policy is harmonized. Globallyintegrated firms are more concerned about reduced openness since they are already able toproduce effectively across borders and across blocs. Reductions to outside-in openness andoutside-out openness may necessitate a retreat to regional divisions of labor, or even glocalstrategies. Hence regional openness in different dimensions can precipitate spreading or agglomeration depending on the competitive and bargaining pressures that emerge fromaltered policy spaces.Changes to a core company’s competitive space may also lead to little or no spatial reconfiguring at all, buamount to new administrative organization, such as the establishment of a regionalheadquarters or new chains of command. More dramatic alterations can be found in e.g. a
122
Core companies and regionalism strategies
strategic decision to merge, or even be acquired. Merging or being taken over can be‘positive’ internationalization strategies in that they form the best option for survival at worst and preservation of core position at best. In other words, a merged or acquiredcompany is not always a ‘victim’. Moreover, the opportunities for scale and immediatereduced transaction costs create the possibility for gains by core companies without themactually having to restructure at all. This is particularly derived from a core company’sability to pass the restructuring costs on to other value chain partners. After all, a corecompany’s ability to dictate the terms in competitive space will to a considerable extent determine the degree to which it has to amend its intrinsic strategies in order to competebetter.Certain aspects of strategic behavior as explored here may run counter to the strategicintent of policymakers and their expectations. If RIAs generally lead to de-regionalization
ism
of home core companies and increased regional presence by outsider core companies, with their own concepts of control, allegiances and strategic considerations, the changedcomposition of regional competitive spaces will leave an indelible mark on bargaining in the regional policy space. As a result the engines of growth (and government conceptions of the ‘growth regime’) inside the region change in composition, building increasingly on the economic behavior and strategies of firms whose allegiances arguably lie outside theregion. This has consequences for accountability, bargaining relations in the region and ultimately the legitimacy of the RIA.
4.5 Anticipating the dynamics of Regional
nvolves the push and pull of micro and is thus a matter of shifting economic
ion’, nor do the core company considerations translate into generic
It has been established that regional integration imacro actors through geographic space, and resources. The literature suggests that governments, based on their interests and strategic reality, think more in terms of the domestic and intra-regional outcomes (organization ofactivity), while core companies think of regional and extra-regional spread of activities. Sogovernments talk of home and host, whereby the emphasis is on regional versus extra-regional host firms, and theory (to some extent) but core companies specifically thinkabout regional versus extra-regional firms, not so much in terms of home and host but interms of global positioning. The regional aspect is significant because it allows them to enhance market power through e.g. reallocation but also bargaining power through their(collective) government. A cohesive regional government, or at least a regionally shared point of view is more successful in representing and defending insider interests withrespect to outsiders than are fragmented national governments (consider the role of the ECin WTO disputes).The strategic issues embodied in the different levels of perceived tension do not translateto some generic ‘regstrategies. Chapter 2 emphasized the need to understand realized outcomes in the contextof the intended outcomes. Since regionalism strategies are not a uniform concept at eitherlevel, a typology of regionalism strategies (a ‘strategic repertoire of regionalism’) is required. Typologies say something about assumptions of behavior as well as criteria foranalysis; in this case strategic intent and realized outcomes reflect issues of power, strategic positioning, anticipated behavior and the spatial organization of economicactivity. The core company strategy ideal-types reflect different, distinct combinations oftensions at various levels.
123
Chapter Four
Just as regional integration can be seen in strategic terms as an internationalization strategyemployed by states to pace the internationalization of production (Dent, 1997; Ruigrok and
ientation
type of opennessward openness,
can also be seen from an ‘inside-out’
Van Tulder, 1995), it can also be argued that core companies pursue cooperative /collusive strategies just like governments do in their policy-level regionalism strategies(cooperation with some countries, increased competition with others), creating a clear macro-micro parallel. On the balance, the ultimate outcome of regionalism strategies maybe decreased competition at the regional level, meaning a rent shift towards firms andaway from national governments. Furthermore, the outward expansion facilitated byintegration spreads firm risk (minimizing effect) and rents while policymakers are bankingon enhanced bargaining power with respect to companies as a result of increased competition and limiting firms’ rent-seeking behavior. Regionalism, therefore, seemsaimed at creating room for global competition defined in Porterian terms, but may in factrun in conjunction with regional collusion in Hymerian terms. Predictions of this naturerun counter to the logic of market mechanisms in classical regional integration theory and cannot be explained away by an ‘invisible globalizing hand’.
4.5.1 The level of analysis problem: two tiers of strategic or
The analysis of policy-relevant literature in Chapter 3 suggested that theexplicitly addressed by regionalism policies is overwhelmingly inward. Outon the other hand, is considerably less explicit. Mainstream views of openness look at theextent to which the gains from regionalism can be shared by nonmembers, but do notconsider the spatial aspect of those gains. Location is underemphasized because of thefocus on trade and the nagging tendency to consider trade and investment (perfect)substitutes. Given the geographically intransigent nature of policy spaces, policies and their effectiveness are measured based on their ability to increase economic activity in the policy space in question. Increasing economic activity can serve either to reduce dependencies on economic activity in other policy spaces (e.g. reduce reliance on imports),or to increase the dependencies of other actors on the economic activity within its own policy space (e.g. increase third parties’ dependence on local exports). In either case the increased activity generates improvements in terms of trade and the balance of payments,boosts tax revenues and has a positive effect on jobs and production (Vernon, 1993), which in turn have an impact on sovereignty, policy jurisdiction and ultimately the legitimacy ofthe state. This consolidation of state power through economic means translates intobargaining power leverage relative to other states.Openness can be seen from an ‘outside-in’ (inward) perspective, pertaining to market- and investment access from outside the region, but it(outward) perspective, which reflects whether a region is primarily designed to increaseinterdependence with extra-regional partners or intra-regional partners. For corecompanies, inward oriented solutions to problems they perceive as outward oriented maybe of little value. The assumption that inside-in openness creates a level playing field ineach individual member country for firms from all other members suggests that locational concerns are irrelevant. For core companies, location is not only relevant because of cost,price and the availability of factors; the presence of other core companies and the cohesionof their industrial complexes makes a difference. A possible logical outcome of the ‘usversus them’ mentality is a form of collusive behavior that keeps insiders from penetratingthe value chains of other insider core companies and induces them to expand their
124
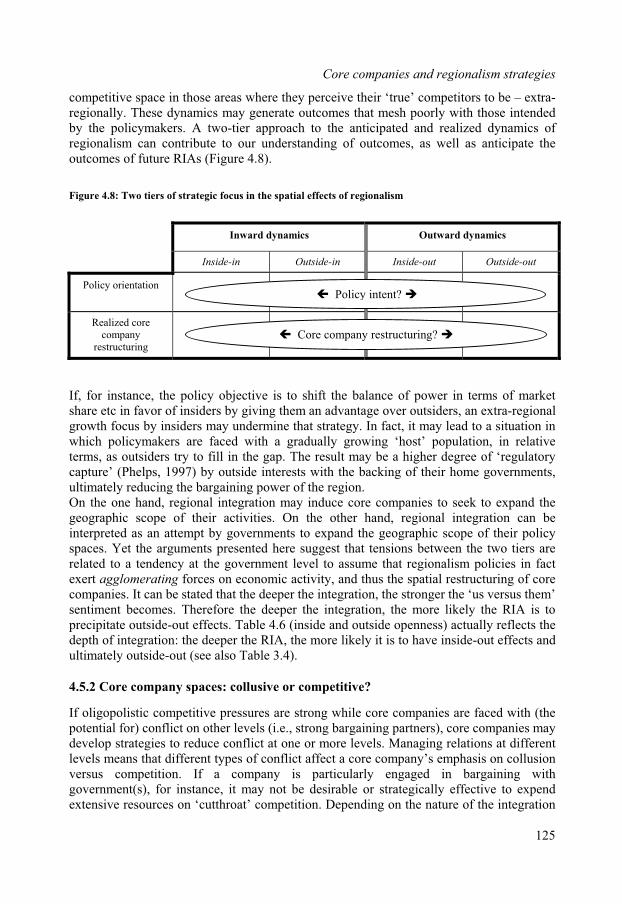
Core companies and regionalism strategies
competitive space in those areas where they perceive their ‘true’ competitors to be – extra-regionally. These dynamics may generate outcomes that mesh poorly with those intendedby the policymakers. A two-tier approach to the anticipated and realized dynamics ofregionalism can contribute to our understanding of outcomes, as well as anticipate theoutcomes of future RIAs (Figure 4.8).
Figure 4.8: Two tiers of strategic focus in the spatial effects of regionalism
Outward dynamicsInward dynamics
Inside ide-in Insid e-out-in Outs e-out Outsid
Policy orientation
Realized core company
restructuring
f, for instance, the policy objective is to shift the balance of power in terms of marketshare etc n favor of insiders by giving them an advantage over outsiders, an extra-regional
nd, regional integration can be
mpetitive?
re companies are faced with (the ng partners), core companies may
Policy intent?
Core company restructuring?
Ii
growth focus by insiders may undermine that strategy. In fact, it may lead to a situation inwhich policymakers are faced with a gradually growing ‘host’ population, in relative terms, as outsiders try to fill in the gap. The result may be a higher degree of ‘regulatorycapture’ (Phelps, 1997) by outside interests with the backing of their home governments,ultimately reducing the bargaining power of the region.On the one hand, regional integration may induce core companies to seek to expand thegeographic scope of their activities. On the other hainterpreted as an attempt by governments to expand the geographic scope of their policyspaces. Yet the arguments presented here suggest that tensions between the two tiers are related to a tendency at the government level to assume that regionalism policies in factexert agglomerating forces on economic activity, and thus the spatial restructuring of core companies. It can be stated that the deeper the integration, the stronger the ‘us versus them’sentiment becomes. Therefore the deeper the integration, the more likely the RIA is toprecipitate outside-out effects. Table 4.6 (inside and outside openness) actually reflects thedepth of integration: the deeper the RIA, the more likely it is to have inside-out effects andultimately outside-out (see also Table 3.4).
4.5.2 Core company spaces: collusive or co
If oligopolistic competitive pressures are strong while copotential for) conflict on other levels (i.e., strong bargainidevelop strategies to reduce conflict at one or more levels. Managing relations at differentlevels means that different types of conflict affect a core company’s emphasis on collusion versus competition. If a company is particularly engaged in bargaining withgovernment(s), for instance, it may not be desirable or strategically effective to expendextensive resources on ‘cutthroat’ competition. Depending on the nature of the integration
125
Chapter Four
(depth, perception of adversarial relations at the international level – see Chapter 3), it ispossible that core companies will in their strategic focus seek primarily to minimizeconflict with other core companies. Such behavior can be expressed in explicitly collusivebehavior such as market-sharing, price-rigging or cartel formation, but may also simply befound in a lack of interpenetration in consumer-, intermediate-, or labor-markets (the‘gentleman’s agreement’) in cases where such interpenetration would seem economicallyprudent or likely on the basis of e.g. cost calculations and scale potential.In internationalization processes, core companies are not only competing for destinationmarkets, but for resources and productive assets. As such members of a core company
oted in
llusive in one location
implications for the governments and regions
network, particularly suppliers but also e.g. potential employees, become the potential‘stakes’ of competitive behavior. Since these assets are to some extent location-bound, internationalization trajectories and division of labor strategies are related to competitionbetween core companies both directly as well as via the dependencies of their bargainingpartners. As national economies become increasingly intertwined, it becomes a realstrategic issue for core companies how the increased ‘exposure’ and threat of potentialconflict can be managed. In such a case the result may be anti-competitive (collusive)behavior within the home region, possibly combined with an increased sense ofcompetition outside the home region, which brings core companies to shift the focus oftheir growth and investment strategies outside the region. In other words, if core companies distort markets, an RIA may simply give them a larger space in which to do so;outside of that space, they may be forced into competition in the traditional sense. Wisse Dekker, at the time the CEO of Philips Electronics, argued in 1989 that the ‘SEM is necessary to achieve scale and lower unit costs required for global strategy’ (quMorrison, 1990: 144). But scale and reduced unit costs can also be obtained throughreduced competition in factor markets (monopsonies) between core companies if suppliers are more dependent on their customers than vice versa. A ‘gentleman’s agreement’ can allow core companies to squeeze their suppliers much better because it minimizessuppliers’ ability to play core companies against each other. Squeeze can take the form of ‘lock in’, whereby suppliers are integrated into production such that switching costs areprohibitively high, or by playing suppliers against each other. Lock in is a monopsonistrelationship within which the core company can drive down prices, while playing suppliersagainst each other exposes them to potentially costly uncertainty. It is thus worth considering the extent to which core companies are by their naturecompetition-enhancing or anti-competitive (whereby firms can be coand competitive in another). What is the role of regionalism? For core companiesregionalism is a way to shift conflict and manage bargaining relations more effectively in amore open playing field as precipitated by increasing economic interdependence. The ‘usversus them’ hypothesis of regionalism (or ‘insider / outsider’) suggests regionalism couldgenerate increasingly collusive spaces, which would have clear implications for welfare and the distribution of ‘rents’ in economic activity.
4.5.3 Regionalism and international relations
Regionalism is part of a country’s overall positioning strategy and has distribution of rents across space; i.e., the relationships between are at issue. Its outcomes form the basis for measuring the impact and effectiveness of that strategy. Do governments base their expectations on misguided notions of firm behavior?
126

Core companies and regionalism strategies
Regionalism as a policy strategy hinges on heightened growth within the regional policyspace. The idea has been that international specialization based on comparative advantage would lead to trade in complementary goods. It is generally assumed that these gains will accrue primarily to insider firms. It is also assumed (or at least, the RIA is legitimatedbased on the assumption) that trade creation exceeds trade diversion and that investmentcreation exceeds investment diversion. Nowadays, trade is based on other things, since most goods are available in multiple locations; indeed, many firms produce multiplevariations on the same good within single locations. Moreover, investment does not signifyincreased competition. Both trade and investment can remain intra-firm. It is thereforepossible that regionalism leads to an increasing compatibility between policy space and competitive space, except that the latter may be more appropriately designated as ‘collusive’ spaces.If so, this has serious ramifications at multiple levels. This has impact on understanding ofcore company behavior, it says something about the viability of government regionalism
rial complexes in a given region. Internationalization
ight be at stake in e.g. a battle between China and Japan over the shape and
tion of these issues, recapitulation of the er of this study is in order. In cases of
strategies. What would that mean for the sustainability and viability for the multilateralsystem as a whole? If policymakers misinterpret the designs of their core companies, how viable are their growth regimes? If core companies are the linking pins between regions (of various depth/width), do they create pressures towards isomorphism and homogenization,or towards institutional diversity?The viability of regionalism in the multilateral system may depend on the bargainingrelations within the myriad industaffects these bargaining relations just as policy changes do. As the policy environmentchanges, the potential gains and viability of existing internationalization strategies areaffected. There might even be a relationship between the depth of integration possible and the pre-existing degree of internationalization of the region’s core companies. Alternately,from a core company perspective (including lobbying), regionalism may be an attractivealternative to multilateralism because it limits the number of bargaining partners. Regionalintegration in terms of ‘locking in’ is relevant from this perspective as well: this is muchmore of a risk-mitigating factor than, say, business incentives (cf. UNCTAD, 1998). Thisfrees up ‘directly unproductive’ (DUP) resources for targeting governments outside theregion.How might the answers to these questions affect future government positioning strategies?What mhegemony of ASEAN? What are the risks for the US of pursuing ‘unilateral regionalism’in the American continents through the Free Trade Area of the Americas (FTAA), andwhat role might Brazil and the Mercosur play? Is there a future for regionalism in Africa, and what might be the restructuring impact of true political union in Europe?
4.5.4 The leading research questions revisited
Before proceeding to a more empirical investigaempirical questions posed in the introductory chaptthe ‘second wave’ of regionalism, what were the professed outcomes expected by thepolicymakers? What theoretical arguments and empirical evidence are considered injustifying and substantiating those expectations? What types of strategies do the regionalcore companies concerned employ? What evidence can be found of core companies’envisioned strategies under regional integration? What kinds of realized restructuring, or
127

Chapter Four
‘strategy migration’, can be seen? What implicit conclusions can be drawn as to changingbargaining relations in the RIAs under analysis? Do core companies appear to exhibitcompetitive or collusive behavior? What can we say about the perceptions of behavior between policymakers and core companies? What can be said about the viability of regionalism as an element in international positioning strategies?
128
PART II:
EMPIRICAL EXPLORATIONS
Just because companies and policymakers share a perception of the stakes does not meanthey share the stakes. The micro and macro perceptions of reality relate to the scope ofactivities within the micro and macro domains. Policy domains are an institutionalframework concerned primarily with geographic space within national borders or under supranational institutions (governance structures) within which they attempt to exert influence, or bargaining power. Firms, on the other hand, attempt to exert influence across the entirety of the geographic space in which they operate and compete, which is only determined to a limited extent by policymakers’ governance structures. Thus micro andmacro domains overlap like patchwork through geographic space, and the location of economic activity becomes a control issue at both levels. Part II of the study is aimed at thesearch for answers to these issues, and the nature of the approach necessitates keeping theissues within their wider context. Given their complexity, however it would be far beyondthe scope of a single study to study them in all their aspects. Areas of focus must be identified in the framework as well as in the dynamics of spatial restructuring.The focus is on developments after the RIA. Strategic intent is primarily considered inpolicy space as a way to create expectations of restructuring which can then be related torealized restructuring ex post. The strategic intent of core companies will be dealt withsummarily. Instead of developing a ‘theory of core company strategy under regionalism’,the aim is to expose the diversity in strategic migrations, on the assumption that theirstrategic behavior flows only in part from the intrinsic motives assumed by policymakers.A key assumption is that the strategic behavior of core companies is largely shaped by the extrinsic aspects of maintaining core position in and of itself. In so doing, the analysis will broadly show how the arguments made in Chapter 4 apply. Additionally, the study does not explore the complexities of interaction between core companies and governmentsleading up to the institutional outcome.Focus must also be found in terms of the spatial dynamics under study. The opennessframework consists of four distinct dimensions for exploration: inside-in, outside-in,inside-out, and outside-out (Figure IIa). For understanding the significance of regionalism,all four dimensions are relevant. Given the firm-level emphasis in this study, however, andthe thesis of intra-regional collusion versus competition, the inside-in dimension deservesthe most attention. Additionally, the ‘us versus them’ hypothesis draws attention to theinside-out dimension. To compare possible intra-regional collusion with extra-regionalcompetition, however, necessitates some degree of comparison with the outside-in dimension. For the purposes of this study and the hypotheses laid out in the previouschapter, outside-out is the least important dimension and will thus receive the least
129

attention empirically. Focus in the spatial dynamics is represented by the darkened blocksin Figure IIa.
Figure IIa: Areas of focus in the dynamics of integration
Inward dynamics Outward dynamics
Inside-in Outside-in Inside-out Outside-out
Policy expectations
Realized core company
restructuring
Chapter 5 returns to the macro-level to analyze the origins and drivers behind a selectsample of five of the key RIAs to have emerged or been institutionalized during the secondwave of regionalism in the 1990s. The two most prominent RIAs, the Single European Market (SEM) and the North American Free Trade Agreement (NAFTA), receive the bulk of the attention, not only because of their high-profile character but because of their‘flagship’ function and significance for regionalism in the rest of the world. The other threeRIAs, the Mercado Común del Sur (Mercosur), the Association of South-East AsianNations (ASEAN) and the Southern African Development Community (SADC) arerelevant more because of their geographic significance, encompassing large swaths of the world’s remaining continents and their vast populations, and thus vicariously because of the potential effects they harbor. In addition they exhibit markedly different characteristics than the SEM and the NAFTA, and therefore create a ‘foil’ against which to juxtapose the latter two regions. At the same time they all look to the NAFTA and SEM as role modelsto some degree or another and will model their own integration paths based on theobserved experiences of the two leading regions. The chapter ends by linking the originsand apparent macro outcomes of these RIAs to the globalization debate addressed inChapter 2.In Chapter 6 an overview is given of the world’s largest core companies and their spatialorganization strategies in the year 1990 in order to provide a context from which to analyzecore company restructuring in the decade that followed. The relevant indicators of internationalization and organizational structure are developed and dimensions of restructuring are operationalized. This static view gives way in Chapter 7 to a thoroughempirical investigation of core company restructuring. Chapter 8 considers core companyinternationalization on the aggregate, and Chapter 9 concludes by linking the apparentmicro trends with the goals of regionalism in the 1990s, generating conclusions as to thenature and dynamism of regionalism, its place in the global order, on the relationship between government and firm strategic intent and strategic realities, and on the nature of internationalization patterns and ‘globalization’ at the firm level.
130
5. REGIONALISM’S ‘SECOND WAVE’
Different regions show different motivations with respect to integration and outcomes.This has much to do with the factors shaping the strategic reality of governments, such as development levels, market power, preexisting relations and perceptions of tension withdomestic interests and other countries. Similarly, different RIAs may not be predicated on identical views of firms and expectations of their strategic responses. What strategicmotives, and inherent assumptions of firm behavior, are evidenced in policy documents of RIAs?As shown in Chapter 2 (Figure 2.1), the number of RIAs in existence is considerable. For the purpose of empirical exploration the current study focuses primarily on the SingleEuropean Market (SEM) and the North American Free Trade Agreement (NAFTA). Although other RIAs were in effect in both Europe and North America during the periodunder study, the SEM and the NAFTA are clearly politically, economically and demographically the most important RIAs in the world. The Canadian-US Free TradeAgreement (CUSFTA), for instance, implemented in 1991, laid the groundwork for theNAFTA and was essentially ‘absorbed’ by the NAFTA in 1994. In Europe, the European Free Trade Association (EFTA) lost much of its significance when Austria, Sweden andFinland joined the European Union in 1995, following in the footsteps of Denmark and theUK. The European Monetary Union (EMU) was only implemented in 1999, and at presentits restructuring impact is likely to be limited; it therefore falls outside the scope of thepresent study.The SEM and the NAFTA are the most well-established and embedded RIAs in the world,and conclusions drawn on the basis of their experience may have bearing on thedevelopment of other RIAs. Since they are accordingly also extensively studied phenomena, they may be subject to objections on those grounds. However, they have as yet not been studied in the terms relevant for the current research. The significance of NAFTA is highly disputed seven years after its implementation, and the SEM, despite a wealth of research, shows conflicting outcomes due in large part to the criticisms identifiedin Chapter 2. Moreover, neither RIA has been studied explicitly from a core companyperspective. Those studies which have focused on the role of large firms in the politicalprocesses surrounding regionalism trends in both regions have tended not to examine theex post restructuring beyond superficial macroeconomic analysis. These two RIAs,therefore, make excellent case studies for a study of regionalism and core companies,precisely because they have been so exhaustively analyzed without generating clearanswers.It is therefore not the task of the present study to repeat previous studies, but rather toreexamine and reposition the evidence on the basis of the framework laid out in Chapter 3.In doing so a context is created for realized firm strategies in the form of the policy-levelstrategic intent behind the RIAs, their expectations of firm restructuring and underlyingassumptions of firm behavior. First, the SEM is addressed in section 5.1, followed by theNAFTA in section 5.2. After providing a brief overview of the contents of each RIA, each section deals with the RIA’s origins in the context of the member governments’ policypreferences as conditioned by their perceptions of conflict at different levels. These policypreferences are then translated into their consequences for openness. Subsequently theleading policy models used to predict the RIA’s outcomes and legitimate the agreementwill be analyzed in terms of their assumed and expected behavior on the part of economic
131
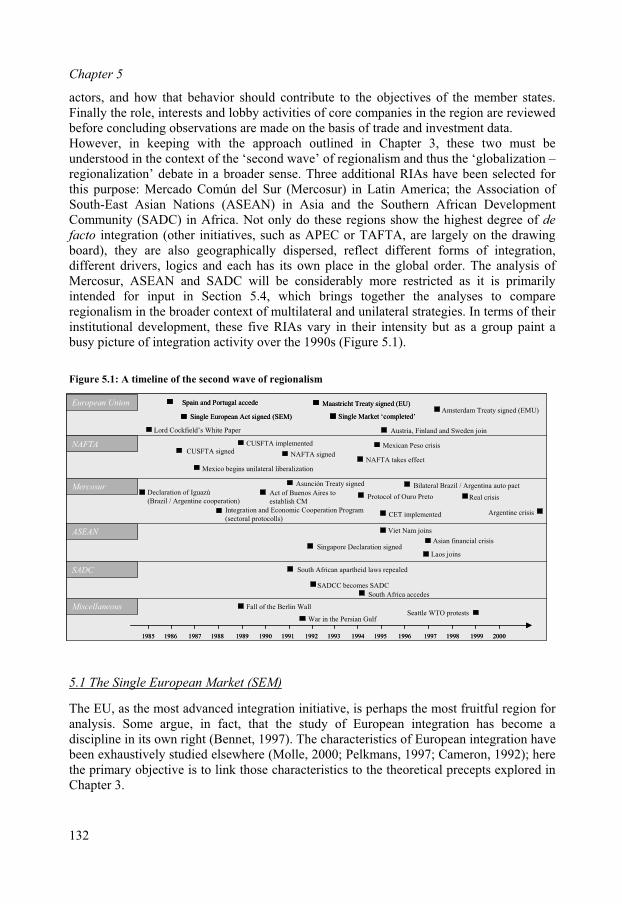
Chapter 5
actors, and how that behavior should contribute to the objectives of the member states.Finally the role, interests and lobby activities of core companies in the region are reviewed before concluding observations are made on the basis of trade and investment data.However, in keeping with the approach outlined in Chapter 3, these two must beunderstood in the context of the ‘second wave’ of regionalism and thus the ‘globalization –regionalization’ debate in a broader sense. Three additional RIAs have been selected forthis purpose: Mercado Común del Sur (Mercosur) in Latin America; the Association of South-East Asian Nations (ASEAN) in Asia and the Southern African DevelopmentCommunity (SADC) in Africa. Not only do these regions show the highest degree of de
facto integration (other initiatives, such as APEC or TAFTA, are largely on the drawingboard), they are also geographically dispersed, reflect different forms of integration,different drivers, logics and each has its own place in the global order. The analysis of Mercosur, ASEAN and SADC will be considerably more restricted as it is primarilyintended for input in Section 5.4, which brings together the analyses to compareregionalism in the broader context of multilateral and unilateral strategies. In terms of theirinstitutional development, these five RIAs vary in their intensity but as a group paint a busy picture of integration activity over the 1990s (Figure 5.1).
Figure 5.1: A timeline of the second wave of regionalism
.1 The Single European Market (SEM)5
NAFTA signed
1985 1986 1999 20001997 19981994 19951992 1993 19961989 19901987 1988 1991
European Union
NAFTA
Mercosur
ASEAN
Lord Cockfield’s White Paper
Amsterdam Treaty signed (EMU)
CUSFTA signed
Single European Act signed (SEM)
Maastricht Treaty signed (EU)
Single Market ‘completed’
Austria, Finland and Sweden join
Mexican Peso crisis
Mexico begins unilateral liberalization
NAFTA takes effect
CUSFTA implemented
Protocol of Ouro Preto
Asunción Treaty signed
CET implemented
Bilateral Brazil / Argentina auto pact
Singapore Declaration signedAsian financial crisis
SADC
Spain and Portugal accede
Real crisis
Argentine crisis
South Africa accedes
South African apartheid laws repealed
SADCC becomes SADC
Viet Nam joins
Laos joins
Declaration of Iguazú
(Brazil / Argentine cooperation)
Integration and Economic Cooperation Program
(sectoral protocolls)
Act of Buenos Aires to
establish CM
Fall of the Berlin Wall
War in the Persian GulfSeattle WTO protests
Miscellaneous
NAFTA signed
1985 1986 1999 20001997 19981994 19951992 1993 19961989 19901987 1988 19911985 1986 1999 20001997 19981994 19951992 1993 19961989 19901987 1988 1991
European Union
NAFTA
Mercosur
ASEAN
Lord Cockfield’s White Paper
Amsterdam Treaty signed (EMU)
CUSFTA signed
Single European Act signed (SEM)Single European Act signed (SEM)
Maastricht Treaty signed (EU)Maastricht Treaty signed (EU)
Single Market ‘completed’Single Market ‘completed’
Austria, Finland and Sweden join
Mexican Peso crisis
Mexico begins unilateral liberalization
NAFTA takes effect
CUSFTA implemented
Protocol of Ouro Preto
Asunción Treaty signed
CET implemented
Bilateral Brazil / Argentina auto pact
Singapore Declaration signedAsian financial crisis
SADC
Spain and Portugal accedeSpain and Portugal accede
Real crisis
Argentine crisis
South Africa accedes
South African apartheid laws repealed
SADCC becomes SADC
Viet Nam joins
Laos joins
Declaration of Iguazú
(Brazil / Argentine cooperation)
Integration and Economic Cooperation Program
(sectoral protocolls)
Act of Buenos Aires to
establish CM
Fall of the Berlin Wall
War in the Persian GulfSeattle WTO protests
Miscellaneous
n initiative, is perhaps the most fruitful region foranalysis. Some argue, in fact, that the study of European integration has become a The EU, as the most advanced integratio
discipline in its own right (Bennet, 1997). The characteristics of European integration havebeen exhaustively studied elsewhere (Molle, 2000; Pelkmans, 1997; Cameron, 1992); herethe primary objective is to link those characteristics to the theoretical precepts explored in Chapter 3.
132
Regionalism’s ‘second wave’
The Single European Act (SEA), approved in 1986 and to be completed by January 1993, was in fact little more than the final stage of implementation of the Treaty of Rome from
has been criticized by others as undemocratic, bureaucratic, and
in Europe are intergovernmentalist ornd the two (Moravcsik,
erms of business environment, size, GDP and demographics. Several countries
influences than mostcontinental countries (Casson and McCann, 1999), hence its concept of control is less
1957. Although tariff barriers to trade had been eliminated within the European EconomicCommunity (EEC) as it was then called as of 1968, non-tariff barriers continued to exist inthe form of different technical standards, procurement policies and the relative immobilityof labor (Bennet, 1997). The central element of the SEA was Article 13, which called for ‘an area without internal frontiers in which the free movement of goods, persons, servicesand capital is ensured in accordance with the provisions of this Treaty [of Rome]’(McDonald and Dearden, 1994: 17). To this end hundreds of measures were taken by theindividual member states and common commercial, industrial and social policies havebeen developed and implemented. The SEM continues to be the centerpiece of European integration, which has since been expanded to formally include more political andeconomic union.Although hailed by most as a vital step towards growth and progress in Europe, theEuropean Unionexclusive. It is important to note that the liberalization of trade and investment withinEurope by no means implies that the same benefits have been extended to the rest of theworld. Hotbeds of contention continue to exist such as the highly subsidized nature of European agriculture under the Common Agricultural Policy (CAP) and the preferentialtreatment of former colonies in the African, Caribbean and Pacific (ACP) regions.
5.1.1 Policy preferences and realms of conflict
The predominant explanations for integrationfunctionalist in nature, while some more recent theories try to ble1993; Stone Sweet and Sandholtz, 1997). Functionalist explanations, in which integrationis a natural response to increased interdependency, hark back to the post-war period, when faith in technocracy’s ability to supersede ‘old’ national interests was high. Theintergovernmentalist approach emphasizes more the purpose of rational heads of state inmaking an arrangement to deal with collective action problems that ultimately center onsecurity issues. Moravcsik’s liberal intergovernmentalism (1993), on the other hand, whichattempts to move beyond the limitations of the intergovernmentalist – functionalist debate,has been highly criticized as being too broad and, by trying to capture everything, in factsaying nothing. As such the phenomenon of European integration remains elusive and enigmatic.The member states, despite their common ‘European’ character, exhibit considerablediversity in tare considered to be the ‘core’ of Europe: the Benelux, France, Germany, Italy and the UK. European decision-making process has been characterized as ‘transnational pluralist’, a major departure from some existing national corporatist models (Criekmans, 1998;Schmitter, 1991). That transnational pluralism was and is still focused on the preferences of the core countries as opposed to those of the smaller, economically weaker (and new)members such as Portugal, Greece and Ireland (at the time the EU, or EEC, had only 12 members). Hence the EU can be qualified as a regional hegemony.National differences continue to play an important role, even among the core countries.The UK has traditionally been more open to non-European
133
Chapter 5
“European” than that of the French and that of Germany, whose firms are alsoproportionately less active outside their home region (Davies et al., 1999). In a historicalperspective, this relates directly to the post-hegemonic tendency to adopt a stance of open international commerce (Ruigrok and Van Tulder, 1995). UK government might bemotivated by a desire for greater global dispersion of UK firm activity. France, on the other hand, might be motivated more by domestic factors like efficiency and growth athome.Despite diffuse interests on a wide range of issues and potentially incongruous businesssystems (Whitley, 1998), which some consider a significant barrier to true integration(Ruigrok and Van Tulder, 1995), Young (1991) notes that the tendency to compromise for
ng (2001) and others tend to
ill, 1992) perceived as sources of weakness compared to firms from
change rates. Thus in the policy-
echanism to reduce the likelihood that Europe would ever again be ravaged by war. The very nature of a ‘club’ agreement creates a perception of inward orientation to the exclusion of others. The SEM’s inside-in
the sake of unity is particularly strong with respect to foreign economic policy. Although itis plausible to assume that the conditions and the stakes may have differed acrosscountries, the SEM was clearly based on a shared vision. That vision was rooted in aperception of a collective action problem in which countries aspired to collectivelyenhance the competitiveness of their markets and their firms.This proposes in essence an inward-looking solution to Europe’s problems (Devinney and Hightower, 1991). What was strong enough to precipitate cooperation even when stakeswere so diverse and preference congruence was so low? Youfocus on the momentum of EU institutions that led to unforeseen cooperation, and the risksof not cooperating, as well as the fact that membership itself alters preferences. These areall inward-looking explanations; there was, however, a more pressing issue: tensions of anextra-regional nature.The shared vision behind the SEM is best understood in light of ‘Eurosclerosis’, lowproductivity, technological backwardness and a country-centered orientation (Phelps,1997; Young and Hamother countries, in particular the US and Japan. The assumption was that integration wouldultimately lead to more (and cheaper) exports in third markets (CEC, 1988; emphasisadded). This was in turn based on an assumption that more competitive European firmswould raise entry barriers and make it inherently more difficult for non-European firms tocompete in the European marketplace (Bhagwati, 1993). In the words of EC CommissionerDe Clerq, ‘we are not building a single market in order to turn it over to hungry foreigners’(Winters, 1993: 207). Thus the policy preferences were conditioned by perceptions of conflict at the international level, in particular waning European bargaining power relativeto the US and Japan (Devinney and Hightower, 1991). Creating dependence on European exports in third markets generates bargaining leveragefor EU governments and at the same time allows them to profit from internal growth interms favorable for e.g. balance of payments and exstrategic vision, the assumption of intra-regional growth (fueled by rationalization,consolidation and export growth from home markets) engenders rents and terms of tradebenefits to EU governments from which they derive bargaining power relative to non-regional countries perceived as competitors.
5.1.2 Openness and the geopolitical positioning of the SEM
Integration in Europe was originally a political m
134

Regionalism’s ‘second wave’
openness, embodied in the free movement of goods, labor and services under Article 13,looked like a source of wealth creation to outsiders wanting to get in. The perception of a‘Fortress Europe’ was rooted in the function of a Common External Tariff (CET) on theregional borders of the Common Market. As Winters (1992) explains, outside-in openness is governed by three types of trade barrier issues: 1) whether they are revenue raising(through tariff rents); 2) whether they operate on prices or costs (tariffs) or on quantities (import restrictions); 3) whether they are equal to intra and extra trade. Additionally, thereis the issue of competitiveness improvement, aimed specifically at EU firms. Yet whetherthey will be trade diverting or trade creating is unclear, as is how they relate to the tradebarrier issues. It must also be observed that the implementation of the directives aimed at opening up Europe’s internal market was not completed by 1993, nor is it fully complete in 2003. On those grounds one can conclude that the EU is not open, simply by virtue of the fact thatthe greatest exceptions to ‘free market’ are in sectors in which EU core companies are perceived to be weaker internationally (e.g. autos, telecoms and semiconductors). Realopenness would suggest a division of labor beyond the purely regional, yet there is noteven a truly Europe-wide division of labor for those sectors.Hufbauer (1992) concludes that the US will be a minor gainer from 1992 from the extra growth in EU GDP, which would create additional draw for US exports. Some assumedthe a priori more efficient outsider firms operating in the EU would be in a better positionto capitalize on the opportunities afforded by the SEM (Hood and Young, 1991) and that activities within Europe were more important than exports to Europe. Hufbauer (1990) predicted that EU competition policy would be favorable to newcomers. In fact, US lobby organizations such as the Business Roundtable were enthusiastic about the opportunities. At the same time, it can be discouraging because the EC will question the activities of outsider firms in Europe. The effects on Europe’s trade relations with the developingworld, in particular the ACP countries, were also inconclusive. Davenport and Page (1991) predicted diversion of manufactured exports from developing countries, while a Matthewsand McAleese study (1990) predicted trade growth. Despite the natural emphasis on outside-in openness, however, Molle (1990) suggests that full (outside-in) openness maynot be the best option given that competition is (was) distorted in many markets and thuswelfare maximization may be better served by a specific good and factor approach. Remember that the EU dynamic is not isolated ; there are other things happening too, likethe Uruguay Round. EU is not an official actor within WTO, but it acts like one. EC has been an active user of voluntary export restrictions (VERs) against Japan, NIEs, other lessdeveloped countries and Eastern Europe. At times, the EC has even argued for legalizationof discrimination embodied by VERs but forbidden by GATT. Also, when the US threatened sanctions against the EU in the face of the Iberian enlargement, the British and German governments’ responses were clearly calculated on the value of joint bargainingstrength (Young, 1991). Young also notes that in certain cases, the interdependence of EU governments can increase a member state’s interdependence with the rest of the world.Hufbauer (1990) adds that the EU will not automatically extend reciprocity to third countries unless required to do so.
135

Chapter 5
5.1.3 Policy models and expectations of firm restructuring
The Cecchini report, regarded by many as the ‘official EC view’ of the integration process, irect cost savings due toncreased volumes and more
icroeconomic models building on Dixit and Norman’s ‘net welfare gain’
ring,
ugh increased competition may offset the benefits of the larger
summarizes the expectations of integration as follows: delimination of (non) tariff barriers; cost savings derived from iefficient location of production (scale and learning economies, and better exploitation of comparative advantage; tightening of competitive pressures, leading to reduced prices andincreased efficiency as more firms from different member states compete directly in the bigger market place; and increased competitive pressures leading to speedier innovation.These motivations are supported by others (Oman, 1993; Padoa-Schioppa, 1987). In thewords of the Commission itself, ‘in the present condition of the European economy thesegmentation and weak competitiveness of many markets mean that there is large potentialfor the rationalization of production and distribution structures leading to improvements inproductivity, and reductions in many costs and prices’ (CEC, 1988, p. 21). Ultimatelythese improvements would lead to enhanced growth and ‘millions of new jobs’ (Baldwin,1989: 249). Policy studies typically employ gravity models and general equilibrium (GE) models toanalyze the possible outcomes of the common market in Europe. CEC 1988 emphasizesthe use of m(1980). Models are built on variations across three variables: market structure (ability of firms to enter and exit markets); product ranges (fixed or determined endogenously); andcompetitive behavior (Cournot or Bertrand) (see CEC, 1988). Yet Winters (1992) cautionsthat the CEC was a hastily thrown-together study performed by many different economistswith different backgrounds and theoretical baggage. The micro-studies at its heart form thebasis for partial equilibrium analysis, which in turn forms the basis for the GE models.Baldwin (1989) points out that this is risky business because the assumptions mademultiply through the models and can skew the results in ways unanticipated ex ante.The CEC studies reported divergent perceptions as to the largest barriers to growth inEurope. An EC expert commission expected technical barriers to be the biggest obstacle tocross-border activity, particularly in electrical engineering, mechanical engineepharmaceuticals, food and tobacco, precision and medical equipment, and after that metal,cars and office machines. The CEC’s business survey showed slightly different results,namely that cars and other transport related machinery were most hampered by technical barriers. These perceptions are predicated on the expectation that larger market size will allow for economies of scale and that ultimately the scale gains will generate technological innovation. The CEC conducted industry case studies on a number of sectors to analyzethese assumptions: foodstuffs, pharma, autos, textiles and clothing, building materials and telecom equip. These industries show the most diversity across a number of variables, such as barriers to internal trade, transport costs, economies of scale, technology, homogeneityof tastes, link between internal market policy and external policy, and the significance of government procurement.The micro models lead to a number of common conclusions. Firstly, there should be greater price competition in European markets. Baldwin (1989), however, warned that reduced profit margins thromarket (at least for firms, but not for society as a whole). Another overwhelming outcomewas the expectation that firms would engage in more cross-border collaboration. In mass-
136
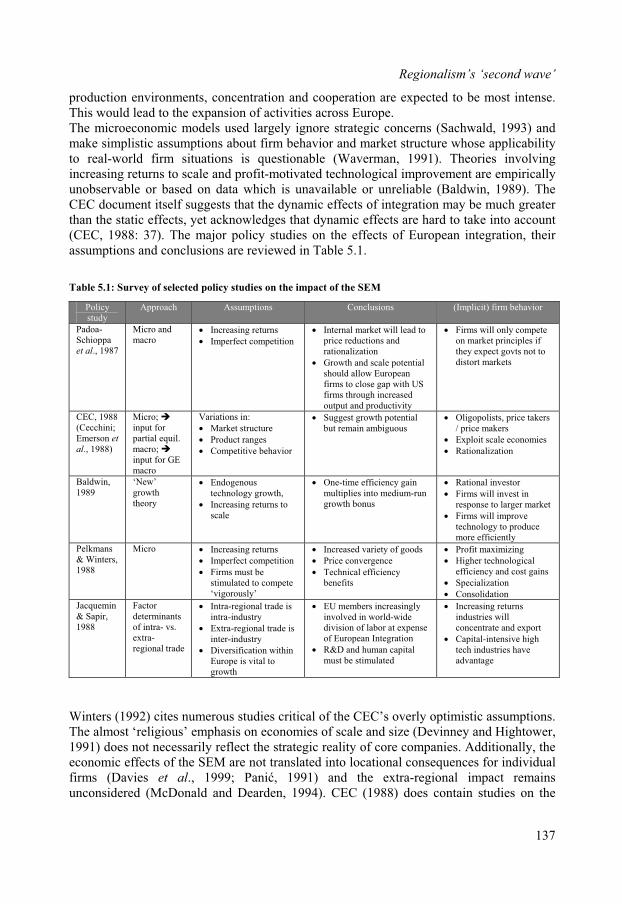
Regionalism’s ‘second wave’
production environments, concentration and cooperation are expected to be most intense.This would lead to the expansion of activities across Europe.The microeconomic models used largely ignore strategic concerns (Sachwald, 1993) andmake simplistic assumptions about firm behavior and market structure whose applicabilityto real-world firm situations is questionable (Waverman, 1991). Theories involvingincreasing returns to scale and profit-motivated technological improvement are empiricallyunobservable or based on data which is unavailable or unreliable (Baldwin, 1989). The CEC document itself suggests that the dynamic effects of integration may be much greaterthan the static effects, yet acknowledges that dynamic effects are hard to take into account(CEC, 1988: 37). The major policy studies on the effects of European integration, theirassumptions and conclusions are reviewed in Table 5.1.
able 5.1: Survey of selected policy studies on the impact of the SEMT
Policystudy
Approach Assumptions Conclusions (Implicit) firm behavior
Padoa-S
7
Micro and m
Increasing returns
Im tion
Internal mprice reductions and
np with US
chioppaal., 198et
acro perfect competi
arket will lead to
rationalization
Growth and scale potential should allow Europeafirms to close gafirms through increased output and productivity
Firms will only competeon market principles if they expect govts not to distort markets
CEC, 1988 (Cecchini;
Micro;input for
Variations in:
Market structure
vior
Oligopolists, price takers / price makers
Emerson et
al., 1988) partial equil.macro;input for GEmacro
Product ranges
Competitive beha
Suggest growth potential but remain ambiguous
Exploit scale economies
Rationalization
Baldwin,1989 technology growth,
One-time efficiency gain multiplies into medium-rungrowth bonus
Firms will invest in arket
‘New’growththeory
Endogenous
Increasing returns to scale
Rational investor
response to larger m
Firms will improvetechnology to producemore efficiently
Pelkmans& Winters,
Micro ing returns
Imperfect competition
Increased variety of goods
Price convergence gains1988
Increas
Firms must be stimulated to compete‘vigorously’
Technical efficiencybenefits
Profit maximizing
Higher technological efficiency and cost
Specialization
Consolidation
Jacquemin& Sapir,
Factordeterminants
glyn world-wide
division of labor at expense export
gh
1988 of intra- vs.extra-regional trade
Intra-regional trade isintra-industry
Extra-regional trade isinter-industry
Diversification withinEurope is vital to growth
EU members increasininvolved i
of European Integration
R&D and human capital must be stimulated
industries willIncreasing returns
concentrate and
Capital-intensive hitech industries haveadvantage
Winters (1992) cites numerous studies critical of the CEC’s overly optimistic assumptions.The alm ‘religious’ emphasis on economies of scale and size (Devinney and Hightower,ost1991) does not necessarily reflect the strategic reality of core companies. Additionally, the economic effects of the SEM are not translated into locational consequences for individualfirms (Davies et al., 1999; Pani , 1991) and the extra-regional impact remainsunconsidered (McDonald and Dearden, 1994). CEC (1988) does contain studies on the
137
Chapter 5
perception of business regarding the costs of non-Europe, but these in no way figure intothe final quantification upon which the SEM was ‘sold’ to the public.Numerous models are also developed by national central banks to study and predict theimpact of integration on national economies. The bulk of these models are macroeconomic
total sales and on real GDP; from
esses surveyed also expected exports to other EU countries to
nies
et program, the role of business, toent. Many authors claim
in nature and often based on Keynesian assumptions. In the EUROMON model of thecentral bank of the Netherlands, for example, prices and wages are sluggish, output andemployment are demand-determined, prices are simply factor costs plus a mark-up, andwages reflect the bargaining environment (DNB, 1997). Firms’ investment behavior isassumed to be a function of macro variables like income, long-term interest, short terminterest, change in sales levels, corporate lending rate, cash flow, the GDP deflator, capitalutilization, government indebtedness, the liberalization of capital markets and – moregenerally, the increased internationalization of financial transactions. Exchange rates arealso considered crucial: appreciation of the dollar, for instance, leads to higher primaryincome receipts on dollar investments. Net trade increases as competitive position improves, which is the primary motor for higher GDP.Such models draw on various theories such as the ‘accelerator model’, in which investmentdepends in the short run on acceleration of growth incash-flow and pecking-order theories, in which real profit income also affects investment,and of course neoclassical theory, which predicts decisions based on a comparison of marginal costs and returns that are thus influenced by the interest rate and rate of capacityutilization. To illustrate how sensitive such models can be, the central bank in theNetherlands estimates that a one-percentage point higher rate of capacity utilization ispredicted to generate a rise of investment of 0.5 percent in the UK and 2.5 percent in theNetherlands (DNB, 1997).The firm-level behavior modeled is intrinsic, i.e. rationalization in response to increasedcompetitive pressures. Businincrease more than home sales and sales to other countries, but even here the expectationswere not that high. A study by the Single Market Review (SMR, 1997) showed that firmsEurope-wide were fairly uncertain of the significance of the single market in terms of theopportunities and threats it posed, even ex post. This raises the question as to the motivesbehind the SEM: does the RIA target firms in general, or specific types of firms, i.e. core companies? The ambiguity of business survey results suggest that the vision of a commonmarket that EU governments shared with the business elite may have been targeted morenarrowly at that elite than is generally assumed.
5.1.4 The motivations of European core compa
In the bulk of the literature on the European single markthe extent explicated at all, is subordinated to the role of governmthat integration in Europe was purely the result of intergovernmental bargaining (Cowlescites Moravcsik, 1991 and Cameron, 1992), but such explanations are unable to account for the convergence in policy preferences in Europe at the time. Other authors defineinterests in Europe along business and government lines (Criekmans, 1998). Streeck and Schmitter (1991), for instance, explain that although European business and governmentelites joined forces in the 1992 project, each did so for their own reasons. European business pursued both market and non-market strategies in defending their interests.
138

Regionalism’s ‘second wave’
Non-market strategies in essence refer to lobbying. The major lobbyists in the European Union are businesses, which have proven highly effective. Businesses can lobby throughvarious channels, be they members of parliament (MEPs), trade associations, civilservants, professional lobbyists and even the European Commission itself. The European Round Table of Industrialists (ERT), a group of ca. 40 leading industrialists (originally 17 at its inception in 1983), is considered to have a fundamental role in this process. ‘Theagenda for the Single Market program was largely set by the ERT Through theirarticulation of the need for European industrial growth and the creation of European-scaleprojects, ERT members made it clear in direct meetings with government leaders why a unified market was vital’ (Criekmans, 1998: 18). This had to do with subsidization of weakindustries, restrictive employment practices. By creating more flexibility in theirrestructuring activities, firms could create economies of scale and (re)create the needed jobs to fuel growth (Cowles, 1995). Scale economies were needed to ‘resist pressure fromnon-European competitors’. Furthermore, ‘the European market must serve as a unified‘home’ base necessary to allow European firms to develop as powerful competitors inworld markets’ (1983 ERT report cited in Cowles, 1995: 507) The underlying assumption on the part of core companies – despite much of the rhetoric –was still that the European market would be relatively protected. In the words of Fiat CEO
d’ Europe would allow
an trade and investment
ess followed policy intent – albeit at a policy measures surrounding
Agnelli, ‘the Single Market must first offer an advantage to European companies. This is a message we must insist on without hesitation’ (cited in Bhagwati, 1993: 39). European core companies fully expected political leaders to heed such messages (Greenwood, 1997). The ERT made clear threats to European Commission members that a failure to reach agreement on further integration in Europe would be a clear signal to European industrythat growth opportunities were to be sought elsewhere (Cowles, 1995). In other words,ERT members threatened to withdraw from the European arena.Given the shared perception of poor competitiveness in Europe, a relatively closed region served both business and government power interests. A ‘closeEuropean core-companies to maintain their position in Europe while generating extra-regional activity. In their two-level game, industry expected European policymakers tomake the first move, reserving the right to respond accordingly with growth andinvestment strategies in their own interests (cf. Cowles, 1995). From a policy perspective,the SEM was an inward-looking solution to Europe’s waning power. Core companies are also presented as having an inward orientation towards the SEM (Criekmans 1998,Greenwood 1997), with extra-regional growth opportunities in the form of increasedexport competitiveness.
5.1.5 Trends in Europe
In Europe, policy outcomes in the 1990s more or lsomewhat slower pace than hoped for. It can be argued that 1992 were enacted with the purpose of achieving the objectives as discussed above, or atthe very least that core companies acted on the expectation that this would be the case.Winters (1999): evidence on trade and NTBs in Europe continue to defy simpleconclusions. According to Blomström et al. (1998), there is no consensus as to the reasons for increased US investment in Europe in the first phase of integration. Dunning (1997a)argues that market size, agglomeration economies etc. were equally as important, if notmore so. Most macroempirical analyses, however, are limited to earlier stages of
139
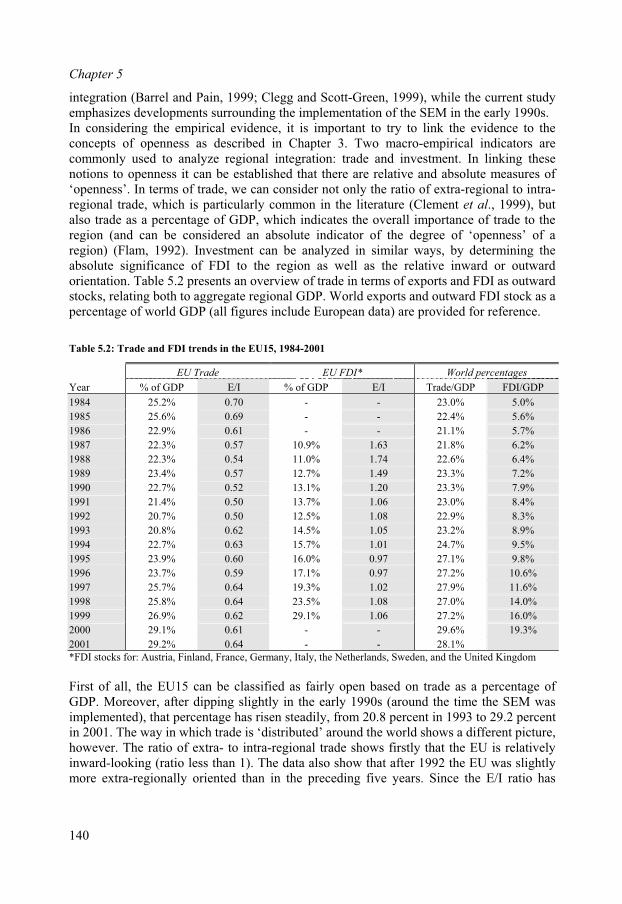
Chapter 5
integration (Barrel and Pain, 1999; Clegg and Scott-Green, 1999), while the current studyemphasizes developments surrounding the implementation of the SEM in the early 1990s. In considering the empirical evidence, it is important to try to link the evidence to theconcepts of openness as described in Chapter 3. Two macro-empirical indicators are
FDI* World percentages
commonly used to analyze regional integration: trade and investment. In linking thesenotions to openness it can be established that there are relative and absolute measures of‘openness’. In terms of trade, we can consider not only the ratio of extra-regional to intra-regional trade, which is particularly common in the literature (Clement et al., 1999), butalso trade as a percentage of GDP, which indicates the overall importance of trade to theregion (and can be considered an absolute indicator of the degree of ‘openness’ of aregion) (Flam, 1992). Investment can be analyzed in similar ways, by determining theabsolute significance of FDI to the region as well as the relative inward or outwardorientation. Table 5.2 presents an overview of trade in terms of exports and FDI as outwardstocks, relating both to aggregate regional GDP. World exports and outward FDI stock as a percentage of world GDP (all figures include European data) are provided for reference.
able 5.2: Trade and FDI trends in the EU15, 1984-2001T
EU Trade EU
Year % of GDP E/I % of GDP E/I Trade/GDP FDI/GDP
1984 25.2% 0.70 - - 23.0% 5.0%
1985 25.6% 0.69 - - 22.4% 5.6%
1986 22.9% 0.61 - - 21.1% 5.7%
1987 22.3% 0.57 10.9% 1.63 21.8% 6.2%
1988 22.3% 0.54 11.0% 1.74 22.6% 6.4%
1989 23.4% 0.57 12.7% 1.49 23.3% 7.2%
1990 22.7% 0.52 13.1% 1.20 23.3% 7.9%
1991 21.4% 0.50 13.7% 1.06 23.0% 8.4%
1992 20.7% 0.50 12.5% 1.08 22.9% 8.3%
1993 20.8% 0.62 14.5% 1.05 23.2% 8.9%
1994 22.7% 0.63 15.7% 1.01 24.7% 9.5%
1995 23.9% 0.60 16.0% 0.97 27.1% 9.8%
1996 23.7% 0.59 17.1% 0.97 27.2% 10.6%
1997 25.7% 0.64 19.3% 1.02 27.9% 11.6%
1998 25.8% 0.64 23.5% 1.08 27.0% 14.0%
1999 26.9% 0.62 29.1% 1.06 27.2% 16.0%
2000 29.1% 0.61 - - 29.6% 19.3%
2001 29.2% 0.64 - - 28.1%
*FDI stocks for: A inland, Fr many, It , the Netherlands, Sweden, a nited Ki
ofDP. Moreover, after dipping slightly in the early 1990s (around the time the SEM was
ustria, F ance, Ger aly nd the U ngdom
First of all, the EU15 can be classified as fairly open based on trade as a percentageGimplemented), that percentage has risen steadily, from 20.8 percent in 1993 to 29.2 percentin 2001. The way in which trade is ‘distributed’ around the world shows a different picture,however. The ratio of extra- to intra-regional trade shows firstly that the EU is relativelyinward-looking (ratio less than 1). The data also show that after 1992 the EU was slightlymore extra-regionally oriented than in the preceding five years. Since the E/I ratio has
140
Regionalism’s ‘second wave’
stabilized at around 0.6 : 1, it can still be concluded on the whole the EU remains relatively inward-oriented.This suggests further that the EU was limited in its outside-in openness, because their
r the entire period, it can
d FDI percentages, the trade
5.2 The North American Free Trade Agreement (NAFTA)
import values essentially correspond to their export values (i.e., current accounts are moreor less balanced). In other words, if the average European country exported largely to otherEuropean countries, the average European country also imported largely from otherEuropean countries to the exclusion of extra-regional countries.Despite a lack of reliable FDI data for some EU members oveclearly be seen that outward FDI stock grew considerably in relation to GDP, to a value in1999 nearly three times that in 1987. Although recent growth is somewhat of an anomalydue to the merger and acquisition (M&A) boom at the end of the 1990s, the preceding years also show steady growth in investment activity. Again, however, that investment isincreasingly oriented towards EU member states, although extra-regional FDI stockscontinue on the whole to exceed intra-regional FDI stocks.If the European data are compared to the world trade anfigures exhibit similar values and similar trends. Thus measured in absolute terms, theworld as a whole has become more open to trade just as Europe has. In terms of investmentbehavior, however, the EU is clearly a world leader, with a propensity to invest more than150 percent higher than the world average.
ber 17, 1992
5.2.1 Policy preferences and realms of conflict
The North American Free Trade Agreement (NAFTA) was signed on Decemby US President Bush Sr., Mexican President Salinas and Canadian Prime Minister Mulroney, to take effect January 1, 1994. The agreement provides for most tariffs betweenthe three countries to be phased out over a 5-15 year period. The scope of NAFTA islimited to trade barriers, and the intensity of integration is low given the absence of acentral coordinating body. External trade relations (with third-party countries) remainmatters of national policy. Fundamental to NAFTA are the rules of origin (local contentrequirements) that require considerable shares of the value in final products to have beenadded in one of the three member countries in order to be eligible for tariff-exempt status.NAFTA is an extension of the Canada-US Free Trade Agreement (CUSFTA),implemented on January 1, 1989. CUSFTA was based on the phased bilateral eliminationof tariffs, although its practical significance remains debated. Numerous sectors wereexcepted, especially in services, such as telecommunications. Additionally, US-Canadiantrade was already highly liberalized. The legal scope for bilateral investment, however,was improved in part by the inclusion of a relatively robust dispute settlement procedure (DSP), which arguably reduced the likelihood of either government acting disfavorablytowards investors from the other country. NAFTA contains several chapters that reflectseparate arrangements between the US and Mexico and Canada and Mexico (USITC,1993).
NAFTA is unique because it is the first case of ‘North-South’ integration between developed economies and a developing one (Blomström et al., 1998). In the past, the ideaof reciprocity in trade relations with a superpower was considered by developing countries
141
Chapter 5
to be disastrous (Orme, 1996). But even Canada’s status as a developed economy does notput it on an equal footing with the US, which both economically and politically dominatesthe NAFTA. With the NAFTA effectively creating a $6.2 billion market, Mexico’s share islittle more than the ‘point two’, with a GDP roughly equal to that of Ohio (Orme, 1996). In the 23 percent of Mexican GDP in manufacturing, American firms are dominant.According to Pasquero (2000), US interests are much more complex than the improvementof ‘national competitiveness’ (Hufbauer and Schott, 1993). US president Ronald Reagan was the godfather of NAFTA, and when first discussed it was looked at not just an issue of international free trade, but as a solution to a wide range of problems, such as immigration(Orme, 1996, paraphrasing Martin Anderson, Reagan’s first domestic policy adviser in1979). As a foreign policy, Pasquero (2000) argues that american strategy was fourfold: toreinforce its hegemonic position; to promote its own brand of free-market ideology; toadvance democracy through trade and to secure access to world markets. Others, however,argue that the NAFTA is nothing more than a formalization and institutionalization of pre-existing dynamics (cf. Blank and Haar, 1998).The NAFTA for Mexico was part of a broader effort of openness towards foreigninvestment, dubbed ‘Salinistroika’ (Cameron and Tomlin, 2000). Additionally, the NAFTA ‘locks in’ Mexico’s liberalization program and legitimizes Mexican politics(Bosworth et al., 1992). Since national economic interests are paramount in foreign policy,the NAFTA may increase perceptions of harmony between domestic and governmentinterests, enhancing the government’s legitimacy (Orme, 1996). In part this effort wasrooted in Mexico’s debt crisis, but also an attempt to force competitiveness upon Mexican conglomerates. Additionally, the NAFTA was seen as a way to protect Mexico against what it views as a highly capricious US trade policy. Mexico’s transformation from debtorto creditor made it easier, and a tactically sounder move, to try and talk to Washington asan equal. What Mexico hoped the NAFTA would create abroad was an image of ‘newinvestment opportunities in Mexico and a chance to improve the overall climate of conducting business…not only by lifting restrictions but also by extending variousguarantees, for example on the availability for foreign exchange, expropriation and disputesettlement.’ (Bosworth et al., 1992). As far as Mexican business is concerned, most of thedominant interests are state-controlled. Furthermore, Mexico has never shied away fromheavily protecting sectors it sees as strategic and this did not change under the NAFTA. It is generally agreed that the NAFTA is about the US and Mexico, and that its impact forCanada is minimal (Orme, 1996; Globerman, 1994). Canada was forced to adopt a veryreactive position in the integration process. ‘For Canada, the negotiations are basicallyabout how to include Mexico in the North American economy, not an opportunity to re-open the FTA or deal with the unfinished American agenda. Canada’s basic position isdefensive – to protect the [CUS]FTA’ (Cameron et al., 1992). The legal scope for bilateralinvestment, however, was improved in part by the inclusion of a relatively robust disputesettlement procedure (DSP), which arguably reduced the likelihood of either governmentacting disfavorably towards investors from the other country. For Canada, therefore, theNAFTA was more of a defensive measure out of fear of US trade actions. In fact, someargue that the DSPs were Canada’s only real gain (Haggard, 1997). Whereas the ambitionwas originally to diversify trade relations, Canada’s strategy ultimately necessitated afocus on the market that mattered most in the face of the US’s aggressive unilateralism(Cameron and Tomlin, 2000; USITC, 1993). Canadian business was positive because they saw an FTA as a chance to move away from US production-satellite status. Canadian
142
Regionalism’s ‘second wave’
industry desperately wanted to develop beyond the ‘truncated firm’, referring to facilities producing goods (largely for US companies) without the key functions of a ‘normal’ firm,such as marketing and development.Perceptions of potential conflict are related to the existing balance of power. As argued in
gy to enhance national
5.2.2 Openness and the geopolitical positioning of NAFTA
icit that an FTA is in and of
tive advantage, the NAFTA introduces
Chapter 3, weaker countries (those with less market power) are more likely to perceiveconflict with other (individual) countries, while stronger states are more likely to perceiveconflict with supranational blocs of countries. NAFTA was not, for example, a bitter partisan issue in Mexico; most of the opposition came from north of the border. For thesmaller two countries, NAFTA was a way to rein in the ability of the US to do as it pleased with respect to trade policy, as both are highly dependent on the US market. AdditionallyNAFTA was a means to manage their dependence on US host companies which they hadfostered ten years earlier. In the US, the NAFTA debate was fought in business councilsand editorial boards; the American people were largely ignored.Supporters argue that NAFTA was part of a broader strate(particularly US) competitiveness by helping local industries compete more effectivelyagainst foreign companies at home and secure growth through privileged export access to key intra-regional destination markets (USTR, 2000; Hufbauer and Schott, 1993). The UShas not, however, adopted regionalism exclusively. The basic strategy is to press on withmultilateralism, while using bilateralism and regionalism where multilateralism fell short,such as the case of intellectual property or services (Haggard, 1997). US felt bilateralnegotiations did not interfere with multilateral efforts and would moreover allow the US toexploit its market power to achieve results which would be impossible in multilateralnegotiations (Cameron and Tomlin, 2000). Pasquero (2000) points out that between 1993 and 1997 alone, the US signed 245 new trade agreements with its various partners aroundthe world. This diverse palette of strategies and interests means that the NAFTA had anidentity crisis from its inception: was it a foreign policy initiative, a domestic jobsprogram, a pre-emptive strike in coming global trade wars, or an attempt to halt Mexicanimmigration (Orme, 1996)?
In discussing the NAFTA’s openness, it should be made explitself a fairly shallow form of integration which in part reflects the somewhat divergentinterests of the parties involved, but also is better suited to in particular the US strategy ofparallel regionalism-multilateralism. Even as an FTA, it is so full of protectionistexemptions and long phase-outs that it ‘should be underscored that the NAFTA does notcall for free trade’ (Globerman, 1994: 23). Weintraub (1992), however, argues that theNAFTA is ‘fraught’ with GATT provisions and therefore inclined towards a more open regime. Yet Winters (1999) cites evidence that while Canada lowered tariffs on 1500 tariffitems following NAFTA implementation, Mexico raised tariffs on 500 items, signaling aless that total commitment to inside-in openness.In addition to location effects rooted in comparaeffects of a more serious order in the form of the rules of origin. By requiring goods soldon the regional market to be produced, up to a point, using regional production factors (orrisk subjection to tariffs), the FTA is by its nature designed to attract economic activitythrough local content requirements (a form of rent seeking), which were instituted to prevent third countries from using the NAFTA member with the lowest external tariffs as a
143
Chapter 5
portal to access the entire NAFTA market. In fact, NAFTA’s local content rules for textiles (‘yarn forward’) and autos are stricter than they were under the CUSFTA and the NAFTAhas elaborate antidumping procedures (Orme, 1996). The three most important changes toinvestment regulations include expansion to include minority shareholders, the applicationof most favored nation (MFN) treatment to investments and investors, and new rules andprocedures for dealing with disputes in the form of binding international arbitration(Rugman and Gestrin, 1994). Open investment regulations were not imposed uponnumerous industries like Mexican oil, telecommunications and the fishing industry (Orme,1996).From this perspective, the NAFTA may be – despite the rhetoric – more of a defensive
tes the assertion that the NAFTA centered
capturing foreign capital, as stated earlier, was not
5.2.3 Policy models and expectations of firm restructuring
inate. The NAFTA, as
response to the Single Market in Europe (cf. Mansfield and Milner, 2000; Abbot, 1999) bywhich the US seeks to secure its hemispherical hegemony while Canada and Mexico try tominimize the negative effects this can have. Mexico’s new investment law was as muchaimed at outside countries as at NAFTA countries (Orme, 1996). Outside-in, therefore,NAFTA was designed to be relatively closed, despite the US government’s prevailinglyneo-liberal attitude. This is seen by some as a defensive, strategic attempt on the part of theUS, in the face of its declining global hegemony, to consolidate regionally and reinvigorate its hegemonial position (Ruigrok and Van Tulder, 1995). Particularly the rules of origincomponent suggests that NAFTA was designed to be inwardly relatively closed byensuring that the benefits of tariff reductions will accrue primarily to producers andproduction in North America (USITC, 1993).Like Pasquero (2000), Orme (1996) also dispuon US competitiveness, claiming that its impact in that sense is ‘marginal’. It can be saidthat an overarching goal of any North American trade agreement was to precipitateoutward-out openness, as demonstrated by several of the alternatives proposed to theNAFTA. Some tended to favor Strategic Trade Policy (STP) over free trade, while otherslobbied for managed trade in favor of tactical protectionism to force open foreign markets.James Baker saw integration as a ‘hard-nosed Yankee-trader realism’ by which nationsreluctant to open their market would be excluded from multilateral progress and at thesame time domestic protectionist interests would come under pressure (Baker, 1988 citedin Cameron and Tomlin, 2000). Mexico’s broader strategy fornecessarily oriented towards the North American market. Mexico has made clear its intention to extend its free trade and liberalization program in the direction of otherregions, particularly Europe. In fact, Cameron and Tomlin (2000) suggest that MexicanPresident Gortari’s decision to pursue NAFTA in earnest was only made once European leaders made clear they did not see Mexico’s unilateral liberalization program as sufficientto attract European investment. Also, Mexico is the only country in the world besidesIsrael to have signed free-trade agreements with both the US and the EU (Economist, Oct.28, 2000).
Since the NAFTA is US-led, American arguments and logic predoman example of north-south integration, hinges heavily on the assumed complementarity of production factors. That complementarity is captured in Hecksher-Ohlin style theory, bywhich countries will specialize in industries intensive in the factors which are relatively
144
Regionalism’s ‘second wave’
abundant in that country. The general consensus of the major policy studies was alsoconsistent with Hecksher-Ohlin, generating major gains for Mexico and mild gains for the US and Canada. Globerman (1994) recounts the expectations of the NAFTA asreallocation of resources consistent with patterns of comparative advantage; intensifiedcompetition from imports leading to rationalization; DSPs to filter out frivolous attempts at protectionist sanctions; and increased investment by host firms. Moreover, its impact was expected to be ‘instantaneous’ (Orme, 1996). Canada’s expectations of free trade with the US were based on a lack of ‘major evidence
ented to the US
academic reports were confusing and
do not predict how labor force or capital stock will change
that any company, whether favorable or unfavorably disposed, would close up shop in one country or the other on the basis of a Free Trade agreement. That is not to say that it wouldnot happen, but when private companies have been asked by government officials whatthey would do, the first thought has been rationalization. That would lead one to believethat if a Free Trade agreement were reached, there would not be any massive closings of plants, but plant functions might be considerably altered as companies seek to make use oftheir new found flexibility’ (Nef, 1985, quoted by Blank and Haar, 1998). Most quantitative studies, particularly the well-known policy studies presInternational Trade Commission (USITC, 1993) focus almost exclusively on trade effectsof liberalized US-Mexican trade. The bulk of the evidence was generated throughcomputable general equilibrium models (CGE) at the macro or meso levels (see Table 5.3).Partial equilibrium models were employed at the sector level where US and Mexicanproducts are imperfect substitutes (meaning consumers distinguish between domestic andforeign goods) and firms are considered to respond fully to price changes and cost-demandstructures. Often aggregate supplies of labor and capital are set exogenously and can flowfreely between sectors, respond perfectly to wage differentials, and are always fullyemployed. Model outcomes depend heavily on estimates of market behavior parameterssuch as substitution, demand and supply elasticities.As a result, when it comes down to the specifics, thecontradictory (Orme, 1996; Bosworth et al., 1992). The USITC admits that applicability of CGE models is ‘limited’ due to the relative simplicity of the theoretical constructs inrelation to the detail of the NAFTA provisions (USITC, 1993: 1-5). In Weintraub’s (1992)analysis, most of the benefits reported by the policy models are directly linked to dubiousassumptions and the gains are often small enough to be swamped by the ‘noise’ in themodel. Most of the models were constructed prior to the actual details of the agreementand employ divergent assumptions as to e.g. returns to scale, substitutability of foreign fordomestic goods and demand elasticities. Rules of origin were omitted from most studies given the difficulty of quantifying these effects in mathematical models. Additionally,many models do not incorporate dynamic effects of increased competition andmanifestations of free trade (Globerman, 1994). Therefore, to the extent that CGE modelsare able to capture the reality of integration effects, they may have operated on the wrongassumptions (see Table 5.3). Moreover, static CGE modelsin response to policy, they are therefore unable to predict changes in investment behaviorin North America (Gatz, 1997). Faux and Rothstein (1991) argue that the increase inmarket size (for US firms, by ‘adding’ Mexico to the market) would be so slight that scalegains would be minimal. Furthermore, the most dramatic effects of the NAFTA generatedthrough dynamic CGE models ‘are those that result from increases in foreign investment inMexico. Yet, in all these models, even in the dynamic ones, this process is modeled as
145
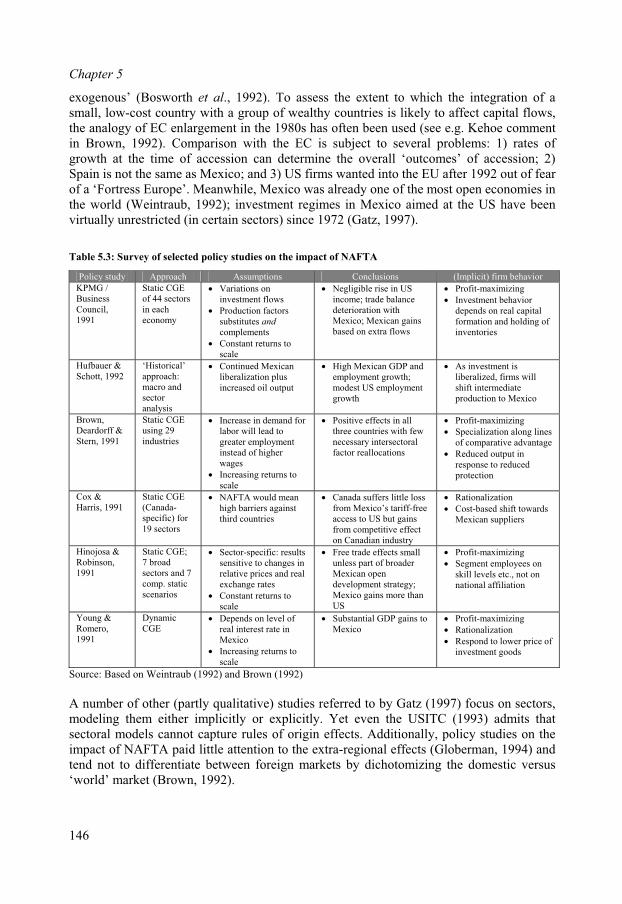
Chapter 5
exogenous’ (Bosworth et al., 1992). To assess the extent to which the integration of asmall, low-cost country with a group of wealthy countries is likely to affect capital flows,the analogy of EC enlargement in the 1980s has often been used (see e.g. Kehoe commentin Brown, 1992). Comparison with the EC is subject to several problems: 1) rates of growth at the time of accession can determine the overall ‘outcomes’ of accession; 2) Spain is not the same as Mexico; and 3) US firms wanted into the EU after 1992 out of fearof a ‘Fortress Europe’. Meanwhile, Mexico was already one of the most open economies inthe world (Weintraub, 1992); investment regimes in Mexico aimed at the US have been virtually unrestricted (in certain sectors) since 1972 (Gatz, 1997).
Table 5.3: Survey of selected policy studies on the impact of NAFTA
Policy study Approach Assumptions Conclusions (Implicit) firm behavior
KPMG /BusinessCouncil,1991
S Va
s to
Negligible rise in US
lf
tatic CGEsof 44 sector
in each economy
riations on sinvestment flow
Production factorssubstitutes and
complements
Constant returnscale
income; trade balance deterioration withMexico; Mexican gainsbased on extra flows
Profit-maximizing
rInvestment behaviodepends on real capitaformation and holding oinventories
Hufbauer & ‘Historical’ High Mexican GDP and As investment is willSchott, 1992 approach:
macro and sectoranalysis
Continued Mexicanliberalization plus increased oil output
employment growth;modest US employmentgrowth
liberalized, firmsshift intermediateproduction to Mexico
Brown,f &
E Increase in demand for
to
w linesDeardorfStern, 1991
Static CGusing 29 industries
labor will lead to greater employmentinstead of higher wages
Increasing returnsscale
Positive effects in all three countries with fenecessary intersectoral factor reallocations
Profit-maximizing
Specialization alongof comparative advantage
Reduced output in response to reducedprotection
Cox & Static CGE Canada suffers little loss ion
owardsHarris, 1991 (Canada-specific) for 19 sectors
NAFTA would meanhigh barriers against third countries
from Mexico’s tariff-free access to US but gains from competitive effect on Canadian industry
Rationalizat
Cost-based shift tMexican suppliers
Hinojosa & ; Sector-specific: results Profit-maximizing
onRobinson,1991
Static CGE7 broad
nd 7sectors acomp. static scenarios
sensitive to changes in relative prices and real exchange rates
Constant returns to scale
Free trade effects smallunless part of broader Mexican open development strategy;Mexico gains more thanUS
Segment employeesskill levels etc., not on national affiliation
Young & Profit-maximizingRomero,1991
DynamicCGE
Depends on level ofreal interest rate in Mexico
Increasing returns toscale
Substantial GDP gains to Mexico Rationalization
r price of Respond to loweinvestment goods
Source: Based on Weintraub (19
number of other (partly qualitative) studies referred to by Gatz (1997) focus on sectors,
92) and Brown (1992)
Amodeling them either implicitly or explicitly. Yet even the USITC (1993) admits that sectoral models cannot capture rules of origin effects. Additionally, policy studies on the impact of NAFTA paid little attention to the extra-regional effects (Globerman, 1994) and tend not to differentiate between foreign markets by dichotomizing the domestic versus ‘world’ market (Brown, 1992).
146
Regionalism’s ‘second wave’
Ultimately there was considerably more agreement on the broad expectation that theNAFTA would lead to economic growth. In most cases, the argument was not opposed onits economic merits but on the basis of projected losses to certain sectors or socioeconomicgroups. Most were willing to accept that in terms of welfare (at least at the regional level),NAFTA would lead to gains. But the distribution of those gains, the ability of labormarkets to respond, and what those gains meant for the restructuring of North Americanenterprise, were highly disputed. Faux and Rothstein (1991), for instance, argued that at a point when US industry is at a crossroads between a high-skills, high-wage path (innovative, high-quality goods saleable at margins high enough to support US living standards) and a low-wage, low-skills path (cutting labor costs), the FTA embodies a choice for the latter. Orme, meanwhile, argues that the NAFTA calls for ‘replacing low-wage sunset industries with high-wage sunrise industries.’ (Orme, 1996: 3).
5.2.4 The motivations of North American core companies
Given the micro-Fordist environment of US firms, the NAFTA is very much a firm-ledintegration agreement. Many US companies have propagated the view that NorthAmerican integration was a reality way before the NAFTA that according to one executive ‘it almost makes the agreement secondary’ (Blank and Haar, 1998). It is therefore notsurprising that the managers surveyed for the Blank and Haar study (1998) identifiedNAFTA with the emergence of a continental economy rather than more narrowly with thelegal accord itself.One of the important aspects of NAFTA is that core companies, whose behavior is at theroot of the policy debate and whose role in the agreement itself is undeniable, are essentially only located in the US. Canadian opponents were concerned that NAFTA would lead to US firms repatriating capital to the US, consolidating their operations andreducing investment and employment in Canada. Mexican opponents were concerned about the ability of Mexican companies to compete? The saga of Mexican steel producers and the barriers set up by the US in the early 80s taught Mexican planners that leadingindustries must always be ready to shift markets quickly, and that these shifts are onlyfeasible within NAFTA. Firms expected that continent-wide integration would give themmuch more flexibility to shift production within corporate networks (Blank and Haar, 1998).To one observer, the NAFTA is ‘clearly a political agreement that helps institutionalize therent-seeking behavior of US core companies by positioning [political] matters such as unlawful dismissal, the right to strike and emissions standards as fundamental trade issues’(Globerman, 1994: 23). In an environment characterized by power asymmetries betweenfirms and governments (Rugman and D’Cruz, 1994) the interests of particularly the USautomotive industry came to the fore (Hufbauer and Schott, 1993). The Big Three USautomakers (Ford, GM and Chrysler) exploited power asymmetries to the detriment of theforeign competition, effectively kicking Japanese auto manufacturer Honda (with its large North American presence) out of the North American Auto Manufacturers’ Association on the basis of its divergent NAFTA standpoint (Hufbauer and Schott, 1993). The antagonistic relationship between core companies and governments makes the ‘shared vision’ among North American core companies in the case of the NAFTA different fromthat of European core companies in the EU. Whereas EU companies were more vocal about the use of protectionist (non-tariff) barriers to safeguard their own positions, US
147

Chapter 5
companies in particular were adamant about limiting the use of such potentially powerfulweapons by Canada and Mexico. The Chapter 11 provisions, for instance, which allowregional firms to lodge complaints against governments perceived as being discriminatory,was a vital ingredient North American core companies agitated for. Recent critical reports (cf. IISD-WWF, 2001) suggest that these provisions may be used as a weapon toundermine legitimate regulation – particularly environmental and natural resourcemanagement measures. As of March 2001, 10 out of a total of 17 NAFTA Chapter 11cases have been brought against such measures.Corporate proponents expected NAFTA to be a win-win situation. Rapidly expandingmarkets in Mexico and rising levels of demand for a wide range of products were expectedto lead to a substantial increase in production in Mexico and ultimately Mexican export growth (Blank and Haar, 1998). At the same time it was predicted that increasingconsumption and rising purchasing power in Mexico would ensure that production and employment in the US and Canada would not suffer. In some cases this would concernMexico’s potential as a destination market (Orme, 1996), and others were more interestedin exporting (back) to the US. ‘We clearly want to export more to the US, particularlyhigher-end production, since certain product lines are still cheaper to import from Asiathan to manufacture here or import from the US’ (Garen Chu for Singer Mexicana,interviewed in Blank and Haar 1998).US core companies were quick to propagate the win-win angle. One loose-knitorganization, ‘USA-NAFTA’, was formed by the CEOs of 35 of America’s largestcorporations (including e.g. Kodak, Xerox, GM, GE and AT&T) to actively lobby bothpoliticians and the public (through the media) to drum up support for the agreement(Public Citizen). US companies saw in the NAFTA a ‘blueprint for the more efficient reordering of industrial production on a continental scale’ (Orme, 1996: 4). IBM began consolidation and reorganization involving centralization of business units in 1990, bywhich Canada, the US and Mexico would fall under IBM North America. ‘As a response to the increasing number of customers that have been demanding cross-border devices,IBM will become as seamless as possible across North America…If your customers areorganized on a North American basis, we have to organize on a North American basis too’(John Akers, former CEO IBM (Blank and Haar, 1998). According to Pablo Rosales, theGeneral Director of Honeywell, Mexico, ‘reevaluation of the Mexican market caused a 180-degree turn in the firm’s thinking. ‘Global thinking’ is the centerpiece of our new, corporate culture, and Mexico’s potential is tremendous’ (Blank and Haar, 1998). US business lobby organizations by and large adhered to the mainstream economic logic.The KPMG Peat Marwick study referred to in Table 5.3, for instance, was commissionedby the pro-NAFTA Business Council. The rationale behind integrating operations was toincrease profitability, increase market share, and reduce overhead. The most importantfactors in determining strategy were: globalization, international competition, growthpotential, product development / change, and changes in competitive advantage. Whenasked which areas of operations had been subjected to significant change in response toNAFTA, 44 percent of respondents said scale of production, 35 percent mentioned newproduction opportunities, 29 percent said marketing, and 27 percent indicated the degree of product specialization / sophistication. ‘Location’ was mentioned as an area of significantchange by only 21 percent.Yet in several companies, such as Kodak, the Mexican subsidiary continued to report tothe firm’s Latin American division. Strong personal feelings as well as organizational
148
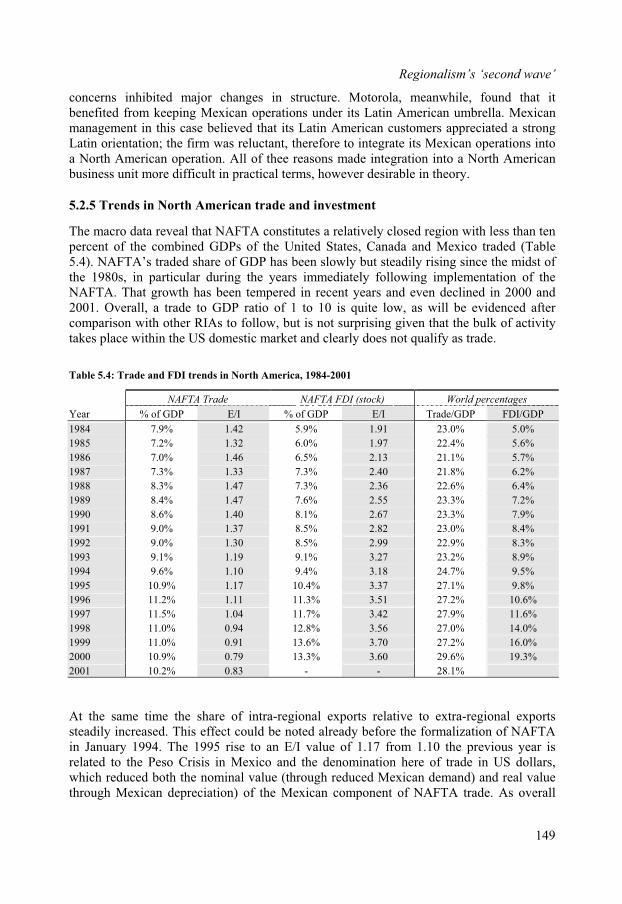
Regionalism’s ‘second wave’
concerns inhibited major changes in structure. Motorola, meanwhile, found that itbenefited from keeping Mexican operations under its Latin American umbrella. Mexicanmanagement in this case believed that its Latin American customers appreciated a strongLatin orientation; the firm was reluctant, therefore to integrate its Mexican operations intoa North American operation. All of thee reasons made integration into a North Americanbusiness unit more difficult in practical terms, however desirable in theory.
5.2.5 Trends in North American trade and investment
The macro data reveal that NAFTA constitutes a relatively closed region with less than tenpercent of the combined GDPs of the United States, Canada and Mexico traded (Table5.4). NAFTA’s traded share of GDP has been slowly but steadily rising since the midst of the 1980s, in particular during the years immediately following implementation of theNAFTA. That growth has been tempered in recent years and even declined in 2000 and 2001. Overall, a trade to GDP ratio of 1 to 10 is quite low, as will be evidenced after comparison with other RIAs to follow, but is not surprising given that the bulk of activitytakes place within the US domestic market and clearly does not qualify as trade.
Table 5.4: Trade and FDI trends in North America, 1984-2001
NAFTA Trade NAFTA FDI (stock) World percentages
Year % of GDP E/I % of GDP E/I Trade/GDP FDI/GDP
1984 7.9% 1.42 5.9% 1.91 23.0% 5.0%
1985 7.2% 1.32 6.0% 1.97 22.4% 5.6%
1986 7.0% 1.46 6.5% 2.13 21.1% 5.7%
1987 7.3% 1.33 7.3% 2.40 21.8% 6.2%
1988 8.3% 1.47 7.3% 2.36 22.6% 6.4%
1989 8.4% 1.47 7.6% 2.55 23.3% 7.2%
1990 8.6% 1.40 8.1% 2.67 23.3% 7.9%
1991 9.0% 1.37 8.5% 2.82 23.0% 8.4%
1992 9.0% 1.30 8.5% 2.99 22.9% 8.3%
1993 9.1% 1.19 9.1% 3.27 23.2% 8.9%
1994 9.6% 1.10 9.4% 3.18 24.7% 9.5%
1995 10.9% 1.17 10.4% 3.37 27.1% 9.8%
1996 11.2% 1.11 11.3% 3.51 27.2% 10.6%
1997 11.5% 1.04 11.7% 3.42 27.9% 11.6%
1998 11.0% 0.94 12.8% 3.56 27.0% 14.0%
1999 11.0% 0.91 13.6% 3.70 27.2% 16.0%
2000 10.9% 0.79 13.3% 3.60 29.6% 19.3%
2001 10.2% 0.83 - - 28.1%
At the same time the share of intra-regional exports relative to extra-regional exportssteadily increased. This effect could be noted already before the formalization of NAFTA in January 1994. The 1995 rise to an E/I value of 1.17 from 1.10 the previous year isrelated to the Peso Crisis in Mexico and the denomination here of trade in US dollars,which reduced both the nominal value (through reduced Mexican demand) and real valuethrough Mexican depreciation) of the Mexican component of NAFTA trade. As overall
149
Chapter 5
trade volumes stalled in the late 1990s, the E/I ratio plummeted to below the balance line,indicating that a decrease in extra-regional trade was primarily responsible for thestagnation. Thus the macro (trade) dynamics of regional integration after NAFTA havebeen towards increased closedness.Furthermore, the country-level data underlying Table 5.4 show that all of Canada’s exportgrowth after 1995 is due to increased exports to the US. There is also a NAFTA tradedeficit; i.e., more trade flowing into the US than from US to Canada and Mexico. Thisaggregate trade deficit reflects the US running current account deficit, which is largely financed by attracting inward investment.As indicated in preceding sections, policy studies on the impact of the NAFTA have centered on foreign investment effects, particularly inflows to Mexico. The trade picture isparalleled by the absolute investment position (as a percent of GDP) of the region, beingrelatively closed and in comparison to for instance the European Union). The outward FDI position of NAFTA countries, however, is considerably more extra-regionally orientedthan its trade activity, while extra-regional and intra-regional FDI positions are relativelybalanced. For every dollar of intra-regional outward FDI stocks in 1984 there were almosttwo dollars positioned extra-regionally, and that disparity has nearly doubled since. The value of extra-regional outward FDI stock is now more than 3.5 times that of regionaloutward FDI stocks.As Blomström et al. (1998) suggest, the increased investment in Canada which paralleledthe increase in trade from Canada appears to support contentions that much of US-Canadatrade is intra-firm. The Canadian government, using US Bureau of Economic Analysis(BEA) data, concluded that 40 percent of all Canada-US trade in 1998 was intra-firm(Industry Canada, 2001). That intra-firm trade is primarily a result of US firms investing inCanada and then exporting those (intermediate) products back to the US, or the export of intermediate goods to Canada for further processing and reimport into the US. One must exercise caution in interpreting such data, because they clearly reflect other influences than simply the implementation of free trade policies. Still, Blomström et al.(1998) and others characterize the trade and FDI trends as weaker than expected, whichwould appear at odds with the rhetoric of regionalism captured in the interviews of Blankand Haar (1998).
5.3 Other manifestations of regionalism
In this section the analysis will be considerably more superficial as it is intended to providematerial for comparison for the two main regions under study. It draws largely on TenNapel, 1998.
5.3.1 Mercado Común del Sur (Mercosur)
Under the Treaty of Asunción, signed on March 26, 1991 by the Presidents of Argentina,Brazil, Paraguay and Uruguay, the Mercado Común del Sur (Mercosur) was established.Mercosur stems from the earlier Integration, Co-operation and Development Treaty of August 1989 between Argentina and Brazil, which in turn was based on the Iguazú Declaration of November 1985. The treaty was subsequently ratified by all members andentered into force on November 29, 1991. The Treaty of Asunción has been formallyamended once, in the Additional Protocol of the Treaty of Asunción, known as the ‘Protocol
150
Regionalism’s ‘second wave’
of Ouro Preto’, signed on December 17, 1994. This protocol, which concerns mainlyinstitutional issues as well as dispute settlement, is also considered to confer on Mercosur adistinct international legal personality.As the name shows, Mercosur is designed to be a common market. The Treaty of Asunciónforeshadowed the establishment of a common market among the four countries with freecirculation of goods, services, capital and workers from January 1 1995 (but not all of thisambitious program was achieved). The treaty has 25 Articles in six main chapters coveringthe purposes, principles and instruments of Mercosur, the organizational structure, the periodof application, accession, denunciation (withdrawal) and general provisions. In addition, there are annexes covering the trade liberalization program, rules of origin, disputesettlement, safeguards (including against other members of Mercosur), and the establishmentof technical and policy working groups. Safeguards follow the guidelines of Article XIX of the GATT, but these have not been allowed on intra-regional trade since the beginning of1995. The broad principles for dispute settlement were set out in the Treaty of Asunción. Various stages and procedures were elaborated in the Brasilia Protocol for the Settlement ofDisputes, signed on 17 December 1991, and this is maintained in accordance with Article 43 of the Protocol of Ouro Preto.Brazil is the economic powerhouse, accounting for 75 percent of Mercosur’s GDP and 80 percent of its industrial manufacturers (Mattli, 1999b). Until 2001, Argentina was the morestable of the two economies, with a currency peg to the dollar ensuring a stablemacroeconomic environment. Yet Brazil has failed to assume its leadership role, opting for short-term national interests over regional ones. In the early 1990s Mercosur would havelikely been characterized as a dual hegemony under Brazilian and Argentine leadership, but squabbles between the two and the economic crises that gripped the region from thelate 1990s on have made any kind of policy coordination next to impossible and considerably reduced any real likelihood of further strengthening of integration.Mercosur’s integration process has also stalled in part due to the prospect of a pan-American FTA (the Free Trade Area of the Americas, or FTAA). In particular Brazil seems to expect the FTAA to bolster its regional hegemony and thus appears to haveadopted a wait-and-see attitude.As is generally the case in developing countries, regional economies are corporatist-statistwith deeply entrenched monopolistic and/or oligopolistic market structures. Liberalizationprocesses already underway prior to Mercosur were designed as an outward-orientedgrowth strategy, in contrast to Import-Substitution Industrialization (ISI). There isconsiderable merger & acquisition (M&A) activity; home core companies are under constant threat: if they do not do well, they fail, and if they do too well, they are simplybought up. Therefore many home core companies are either being transformed or facedwith glossy new competition, and there is a risk of concentration of power in the hands ofhost firms. In this light competition policy is particularly important, particularly where it might seem that host firms are better able to capitalize on the opportunities provided byintegration.In Mercosur the idea was for Argentina to raise tariffs on imported capital goods to meetBrazilian levels, which suggests some level of ‘closedness’. In the case of integrationdepth, however, Mercosur integration has been subordinate to the relations that each country maintains with its main trade partners. With the exception of special cases likeBolivia, Paraguay, Uruguay and Argentina, the main trade partners have not been, or are not, countries in the region. In some circumstances the integration process has served as a
151
Chapter 5
support instrument to achieve national objectives which were shared by two or morecountries. This has been the case of Mercosur to date. The President of Uruguay expressedthis in a conference given at SELA in March 1997: ‘What was attempted with Mercosurwere basically three objectives: the first was democratic consolidation which was thepriority at that moment. You realize that priorities change with time: in 1985, the priority was political, then it became economic and today we feel it is social.’ Although Latin America is most often clustered under the American ‘sphere of influence’,Mercosur was modeled more along European lines. According to Luis Rubio, President ofthe Center of Research for Development (CIDAC) in Mexico, ‘while Mexico, CentralAmerica and the Caribbean look to the US and NAFTA as a trade model, South Americancountries are closer to Europe culturally and have established Mercosur along EU lines to acertain extent.’ Mattli (1999b) describes Mercosur as a response to the end of the ColdWar and changes in Europe that led more towards an inward orientation, coupled withMexican president Salinas’s intention to seek a free trade pact with the US. Mattlidescribes Mercosur in this context as an example of reactive integration, in whichcountries enhance their cooperation due to perceptions of external change (largely inresponse to other RIAs). Latin American countries on the whole were seriously afraid of being less of a priority in Europe’s eyes. On the one hand was the fear of investment and aid diversion to Eastern Europe, on the other the exclusion of Latin American trade. In particular the role of Germany as the lynchpin in EU–Latin American relations was a causefor concern in the wake of German reunification.
5.3.2 Association of South-East Asian Nations (ASEAN-FTA)
The Association of South-East Asian Nations dates from 1967 and was primarilypolitically motivated, as a counterweight to the instability in Indochina at the time.ASEAN was very much an anti-communist initiative taken at a time when the US andGreat Britain began to signal a retreat from Southeast Asia. The focus of its foundingmembers (Malaysia, the Philippines, Thailand, Indonesia and Singapore) was to maintainpeace and stability in the region by providing a forum for the discussion, maintaining open channels for dialogue and resolution of potentially destabilizing issues (Boudhan, 1997).The FTA was a longer-term goal; not until 1993 was there a Common EffectivePreferential Tariff (CEPT). First steps were taken in 1976 at the First Summit meeting,where aims of enhancing economic growth and social development were expressed, although security issues remained prominent. The Concord signed at the First Summitidentified four major areas of cooperation: cooperation in basic commodities, particularly food and energy; industrial cooperation; cooperation in trade and joint approach tointernational commodity problems.With the accession of Brunei in 1984, Vietnam in 1995 and Laos and Myanmar in 1997, the group’s diversity in terms of openness, growth and development levels increasedgreatly. Singapore, Malaysia and Brunei, for instance, are open, outward-oriented marketeconomies, Indonesia is highly protected and three of the members (Laos, Vietnam andMyanmar) are totalitarian or planned economies. As a result, integration has been relatively shallow and selective. Its economic basis is threefold: selective tradeliberalization, industrial complementary agreements, and allocation of major industrialprojects. There is no centralized decision-making and policy formulation is left to each
152
Regionalism’s ‘second wave’
individual country. It is important to realize that ASEAN is not based on a treaty like otherregions are; bargaining in ASEAN is therefore informal.Currently only a preferential trade area (PTA), it was decided at the Fourth Summit inSingapore in January 1992, to establish an ASEAN FTA within 15 years. The Singaporesummit emphasized a commitment to open regionalism. This is logical in the context ofthe East Asian Miracle transpiring at the time, in the form of exorbitant growth rates andbooming exports. The rationale for industrial cooperation was based on the expectations of a larger combined market and economies of scale. Specialization in niches of specificvalue chains and enhancement of investment climate. Underlying premise: export-ledgrowth.Economic growth in the region was not initially linked to liberalization. Industrialization began under protectionist ISI strategies and, although views have become more liberal over the 1990s, most ASEAN countries have a penchant for regulating trade and investment.Nonetheless, in particular the core ASEAN countries in principle welcome foreigninvestors and have developed several incentive packages to attract more FDI. These incentives include provisions for foreign ownership, for export-oriented FDI, permissionfor export-oriented firms to distribute domestically, and allowing joint ventures toparticipate in government exports. At the same time, the CEPT scheme calls for foreigncompanies to meet a 40 percent local content requirement in order to trade their products inASEAN (UNCTAD, 1996: 106-109). Yoshida et al. (1994) describe ASEAN as a typical case of market-led integration,associated with ‘positive’ integration. The US has long promoted increased openness in Asia, but although ASEAN to some extent reflects the policy interests of the US, one mustrecognize that the US has to contend particularly with Japanese influence in the region,whose policy agenda does not overlap with the US (Haggard, 1997). The struggle fordominance in the region is related to the absence of a clear leader within ASEAN. As aresult ASEAN is generally qualified as being externally dominated, with Japan as theprimary external hegemon. One of the reasons Asia is not further integrated underJapanese tutelage is because of the US’s economic and military power counterbalancing that of Japan (Orme, 1996). Hence the extent of centralized policy coordination within theregion is low, and ASEAN has developed a very open institutional character.
5.3.3 Southern African Development Community (SADC)
The Southern African Development Community (SADC) establishes trade relations amongtwelve nations in Sub-Saharan Africa: Angola, Botswana, the Democratic Republic ofCongo, Lesotho, Malawi, Mauritius, Mozambique, Namibia, the Seychelles, South Africa, Swaziland, Tanzania, Zambia and Zimbabwe. SADC was formed in 1992 on thefoundations laid by the Southern African Development Coordination Conference(SADCC) in 1980. Whereas the SADCC had no legal identity, SADC is institutionalized by treaty, although the treaty calls for a rather limited scope for cooperation.The region is dominated by South Africa, whose GDP at the time of the RIA’s formationwas 75 percent of the regional total. As a consequence, South Africa has a tendency not toconsult other member countries on trade arrangements with far-reaching consequences, such as commitments to WTO requirements, unilateral trade liberalizations and subsequentindirect market penetration by foreign firms, and negotiations with the EU on bi-regionalfree trade (Ten Napel, 1998). The latter, for instance, would threaten the privileged access
153
Chapter 5
to the European market which many other SADC members enjoy under the LoméConvention (preferential access for former colonies). SADC was never intended as an ISI or autarkic growth program, but rather a form of ‘defensible multilateralism’. Trade relations are unbalanced, with South Africa beingrelatively unilateral in its aggressive penetration of other African markets (Ten Napel,1998). As a development paradigm this could be designated a ‘flying geese’ scenario(Boudhan, 1997) or from a trickle-down perspective as a potential regional growth hub. Interms of bargaining power and dependency, the trade imbalance is better described as a core-periphery relationship that solidifies the hegemonic position of South Africa.To the extent that the SADC has generated increased economic activity, the role of SouthAfrica and improved trade relations after the end of Apartheid regime were instrumental.Hard to say if all trade activity prior to 1991 was accurately reported. clear that the SADC is largely externally oriented in its trade relations, much as other developing countryinitiatives (see Mercosur and ASEAN above). This is in part a reflection of the membercountries’ colonial past. In addition the trends reflect the general liberalization undertaken under IMF auspices among many African countries around 1990.
5.3.4 Trends in trade activity and openness: Mercosur, ASEAN and SADC
In ASEAN, the trend towards increased decentralization of Japanese control may explain the shift in activity (i.e., formal ‘ownership’ of sales and assets implies direct control) fromJapan to Asia between 1993 and 1997. Networks of indirect, structural control over largeparts of the Asia region could complement the networks of indirect, structural control inJapan. In particular ASEAN became strongly influenced by Japan, thus creating a semi-periphery in a comparable manner as Central Europe for the European Union. However, with one big difference: Central Europe became part of the production network of the European Union as an extension of the macro-Fordist concept of control, which containssubstantial formal integration. ASEAN became part of the Toyotist production networks, which implies preferably informal (and thus shallower) integration, but highly outward inorientation. Mercosur revolves largely around the cautious distrust between its two largestmembers, Argentina and Brazil, and can be seen as an attempt to lock their respective economies together in such a way that trade economics are less easily used as a weapon inthat distrust. SADC centers on the position of South Africa as hegemon, which is to leadthe drive for trade growth and development from the inside out.Analysis of their relative openness is limited here to trade data due to the limitedavailability and unreliability of FDI data at the country-to-country level for these countries. The trade data show mixed base values that reflect the divergent strategic realities anddivergent migrations (Table 5.5). Mercosur countries, which began with a relatively lowlevel of trade, were actually trading more before the introduction of the RIA, with the tradeto GDP ratio dropping from 12 percent in 1984 to seven percent in 1991. Although thistrade level remained essentially unchanged over the subsequent decade, trade becameconsiderably more inward-oriented, with the ratio of extra- to intra-regional exportsdropping from around 12:1 in the period 1984-1991 to around 4:1 in 1991-2001.ASEAN and SADC had similar trade-to-GDP ratios in the 1980s that paralleled that of world trade (ca. 24 percent), but while that ratio declined for SADC as a whole over the1990s, for ASEAN it exploded to as high as 75 percent in 2000. At the same time ASEAN was able to maintain a general outward orientation, dropping only slightly from over 4:1 to
154
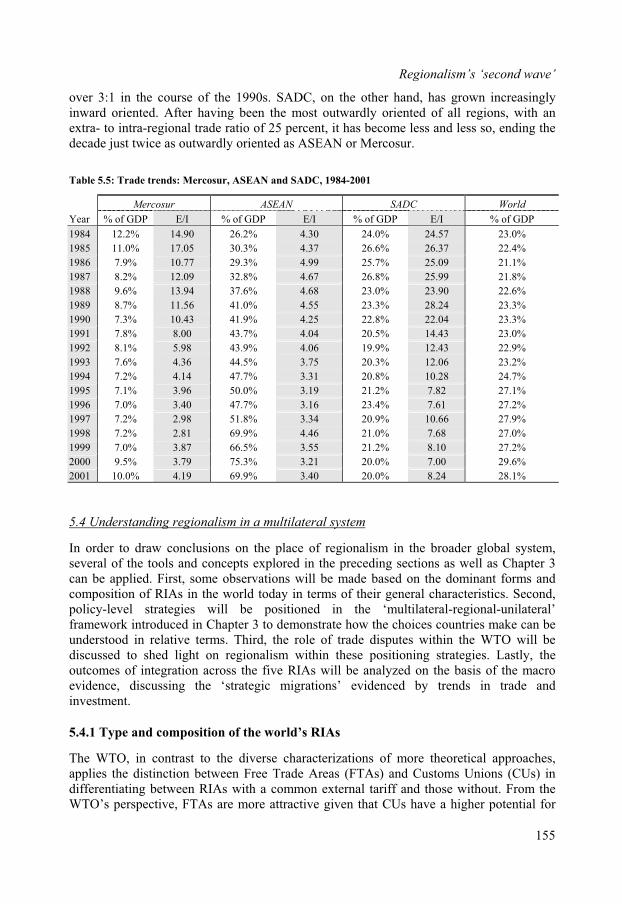
Regionalism’s ‘second wave’
over 3:1 in the course of the 1990s. SADC, on the other hand, has grown increasinglyinward oriented. After having been the most outwardly oriented of all regions, with anextra- to intra-regional trade ratio of 25 percent, it has become less and less so, ending thedecade just twice as outwardly oriented as ASEAN or Mercosur.
Table 5.5: Trade trends: Mercosur, ASEAN and SADC, 1984-2001
Mercosur ASEAN SADC World
Year % of GDP E/I % of GDP E/I % of GDP E/I % of GDP
1984 12.2% 14.90 26.2% 4.30 24.0% 24.57 23.0%
1985 11.0% 17.05 30.3% 4.37 26.6% 26.37 22.4%
1986 7.9% 10.77 29.3% 4.99 25.7% 25.09 21.1%
1987 8.2% 12.09 32.8% 4.67 26.8% 25.99 21.8%
1988 9.6% 13.94 37.6% 4.68 23.0% 23.90 22.6%
1989 8.7% 11.56 41.0% 4.55 23.3% 28.24 23.3%
1990 7.3% 10.43 41.9% 4.25 22.8% 22.04 23.3%
1991 7.8% 8.00 43.7% 4.04 20.5% 14.43 23.0%
1992 8.1% 5.98 43.9% 4.06 19.9% 12.43 22.9%
1993 7.6% 4.36 44.5% 3.75 20.3% 12.06 23.2%
1994 7.2% 4.14 47.7% 3.31 20.8% 10.28 24.7%
1995 7.1% 3.96 50.0% 3.19 21.2% 7.82 27.1%
1996 7.0% 3.40 47.7% 3.16 23.4% 7.61 27.2%
1997 7.2% 2.98 51.8% 3.34 20.9% 10.66 27.9%
1998 7.2% 2.81 69.9% 4.46 21.0% 7.68 27.0%
1999 7.0% 3.87 66.5% 3.55 21.2% 8.10 27.2%
2000 9.5% 3.79 75.3% 3.21 20.0% 7.00 29.6%
2001 10.0% 4.19 69.9% 3.40 20.0% 8.24 28.1%
5.4 Understanding regionalism in a multilateral system
In order to draw conclusions on the place of regionalism in the broader global system,several of the tools and concepts explored in the preceding sections as well as Chapter 3 can be applied. First, some observations will be made based on the dominant forms andcomposition of RIAs in the world today in terms of their general characteristics. Second,policy-level strategies will be positioned in the ‘multilateral-regional-unilateral’framework introduced in Chapter 3 to demonstrate how the choices countries make can be understood in relative terms. Third, the role of trade disputes within the WTO will be discussed to shed light on regionalism within these positioning strategies. Lastly, theoutcomes of integration across the five RIAs will be analyzed on the basis of the macroevidence, discussing the ‘strategic migrations’ evidenced by trends in trade andinvestment.
5.4.1 Type and composition of the world’s RIAs
The WTO, in contrast to the diverse characterizations of more theoretical approaches,applies the distinction between Free Trade Areas (FTAs) and Customs Unions (CUs) indifferentiating between RIAs with a common external tariff and those without. From theWTO’s perspective, FTAs are more attractive given that CUs have a higher potential for
155
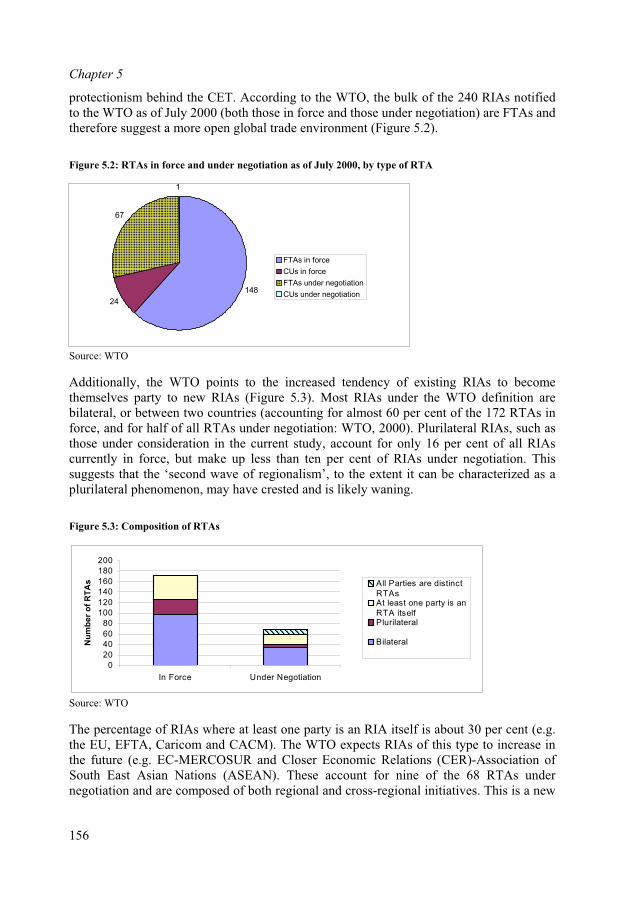
Chapter 5
protectionism behind the CET. According to the WTO, the bulk of the 240 RIAs notifiedto the WTO as of July 2000 (both those in force and those under negotiation) are FTAs andtherefore suggest a more open global trade environment (Figure 5.2).
Figure 5.2: RTAs in force and under negotiation as of July 2000, by type of RTA
Source: WTO
Additionally, the WTO points to the increased tendency of existing RIAs to becomethemselves party to new RIAs (Figure 5.3). Most RIAs under the WTO definition arebilateral, or between two countries (accounting for almost 60 per cent of the 172 RTAs inforce, and for half of all RTAs under negotiation: WTO, 2000). Plurilateral RIAs, such as those under consideration in the current study, account for only 16 per cent of all RIAs currently in force, but make up less than ten per cent of RIAs under negotiation. Thissuggests that the ‘second wave of regionalism’, to the extent it can be characterized as aplurilateral phenomenon, may have crested and is likely waning.
Figure 5.3: Composition of RTAs
Source: WTO
The percentage of RIAs where at least one party is an RIA itself is about 30 per cent (e.g. the EU, EFTA, Caricom and CACM). The WTO expects RIAs of this type to increase inthe future (e.g. EC-MERCOSUR and Closer Economic Relations (CER)-Association ofSouth East Asian Nations (ASEAN). These account for nine of the 68 RTAs under negotiation and are composed of both regional and cross-regional initiatives. This is a new
148
24
67
1
FTAs in force
CUs in force
FTAs under negotiation
CUs under negotiation
0
20
40
60
80
100
120
140
160
180
200
In Force Under Negotiation
Nu
mb
er
of
RT
As All Parties are distinct
RTAsAt least one party is anRTA itselfPlurilateral
Bilateral
156

Regionalism’s ‘second wave’
trend which reflects the growing consolidation of established regional tradingarrangements (WTO, 2000).
5.4.2 The WTO as a forum for multilateralism and regionalism
The primarily economics-centric debate on globalization and regionalization has a political counterpart in the debate between multilateralism and regionalism. As argued in Chapter 3 (section 3.4), countries have various options for positioning in the global order, assumingat the two extremes either a multilateralist stance or a unilateralist stance, or moremoderate strategies of unilateral regionalism or parallel regionalism-multilateralism. Ananalysis of WTO trade dispute activity can provide insight into the relative importancecountries attach to the multilateral system. As of December 5, 2002, a total of 273 consultations had been requested via the WTO since January 1, 1995. A number of thoseconsultations were initiated by multiple parties, raising the number of complainants beforethe WTO to 303. Ten parties account for more than three-quarters of all the complaintsraised before the WTO (Table 5.6). The US alone accounts for one quarter. The EC of course represents 15 countries, but has a fairly harmonious and unified trade policy inwhich the European Commission speaks on its members’ behalf.
Table 5.6: Origins of trade disputes before WTO, 1995-2002
complainant 1995 1996 1997 1998 1999 2000 2001 2002 Totals % of total
US 6 17 17 10 10 8 1 3 72 23.8%
EC 2 7 15 16 7 7 2 3 59 19.5%
Canada 5 3 1 4 2 1 3 3 22 7.3%
Brazil 1 0 3 2 0 3 7 5 21 6.9%
India 1 4 0 3 1 1 3 2 15 5.0%
Japan 1 3 1 1 2 0 1 2 11 3.6%
Mexico 1 4 0 0 3 1 1 0 10 3.3%
Chile 1 0 1 0 0 0 4 2 8 2.6%
Thailand 1 3 0 0 1 1 2 0 8 2.6%
Argentina 0 1 0 1 0 1 1 3 7 2.3%
Other 6 12 8 7 9 7 11 9 70 22.8%
Totals 25 54 46 44 35 30 36 33 303
Note: Total number of complainants (303) is greater than the total number of disputes (273) due to a small number of cases in which multiple parties are complainant
Four major RIAs are represented in the ‘Trade Dispute Top 10’: the NAFTA, EU,Mercosur and ASEAN. In the case of NAFTA, all three member countries are in the list.The EU is represented by the EC, and Mercosur’s two main countries (Brazil and Argentina) as well. Thailand tops the list representing ASEAN. Additionally, two go-it-aloners (Japan and India). In addition to the Top Ten, 26 additional parties have pursued dispute settlement one or more times before the WTO. African countries are absent in the entire list. In order to relate regionalism to multilateralism, however, WTO DSP activitymust be considered in relation to the RIA to which parties are members. Some RIAsprovide for dispute settlement procedures (DSPs) at the regional level, others do not.NAFTA, for instance, has DSPs that allow for deferral to the WTO, and in that sense it is not surprising that NAFTA countries, with the US at the fore, are the primary complainantsat the WTO, accounting for over one-third of the total (Table 5.7).
157

Chapter 5
Table 5.7: Intra- vs. extra-regional trade disputes before WTO, 1995-2002
NAFTA EU Mercosur ASEAN SADC Other Total Intra/extra
NAFTA 19 37 10 4 0 34 104 18.3%
EU 29 0 12 1 0 17 59 0.0%
Mercosur 14 8 2 0 0 6 30 6.7%
ASEAN 5 2 2 1 0 6 16 12.5%
SADC 0 0 0 0 0 0 0 n.a.
Other 37 18 9 4 1 25 94
Total 104 65 35 10 1 88 303
Hence, nearly 20 percent of total NAFTA are consultations requested from other NAFTA countries (intra-regional disputes). Even though WTO activity by NAFTA countries is inthe procedural sense not surprising, it remains remarkable that regional members wouldhave so many disputes with other regional members at all. This activity has wanedconsiderably since 1999 however. Still, it suggests that either the NAFTA does not address all the issues of major concern to its members, or that NAFTA members did not haveenough of a common vision or motive in entering into the agreement.Members of the EU, on the other hand, have never lodged a complaint against fellow EU member countries. Mercosur is home to the third-largest group of complainants,accounting for 12.5 percent of the cases presented. Of the cases raised, just over 15 percentwere directed at fellow Mercosur countries. A unique case is the CEFTA; although only 7members were involved in consultation requests during the period, most (5) were directedat other CEFTA members.Interestingly, in most cases complaints between regions or regional members are more or less in balance. While NAFTA countries have lodged complaints 104 times, they have alsohad 104 complaints lodged against them. The EC has requested consultations 59 times,either on its own or on behalf of a member state, and has been subject to a consultationrequest 65 times. Mercosur countries have complained 38 times, and been targeted 37times. Even more striking is that inter-regional disputes also tend to be balanced. A noticeable exception is the EU and NAFTA. The EC has requested consultations 29 timeswith NAFTA member countries, while NAFTA members have lodged complaints 37 timesagainst the EC or one of its members. Only 94 of the 303 complainants (30 percent) werenot members of any of the five RIAs in question. Of these, three countries (Japan, Indiaand South Korea) accounted for nearly a third.
5.4.3 Opting out and ‘going it alone’
Some larger countries have chosen to stay out of the second wave of regionalism. The most noticeable cases are Japan and South Korea, India, China and Russia (or the Russian Federation). Applying the same technique of analysis to these five countries, the followingobservations on their openness and/or closedness in trade and investment can be construed.On the whole the 1990s showed an increased openness towards trade, which could implythat the growth of real world trade has been primarily linked to the countries that did notengage in RIAs. The picture for the five countries is mixed, however (Table 5.8).
158
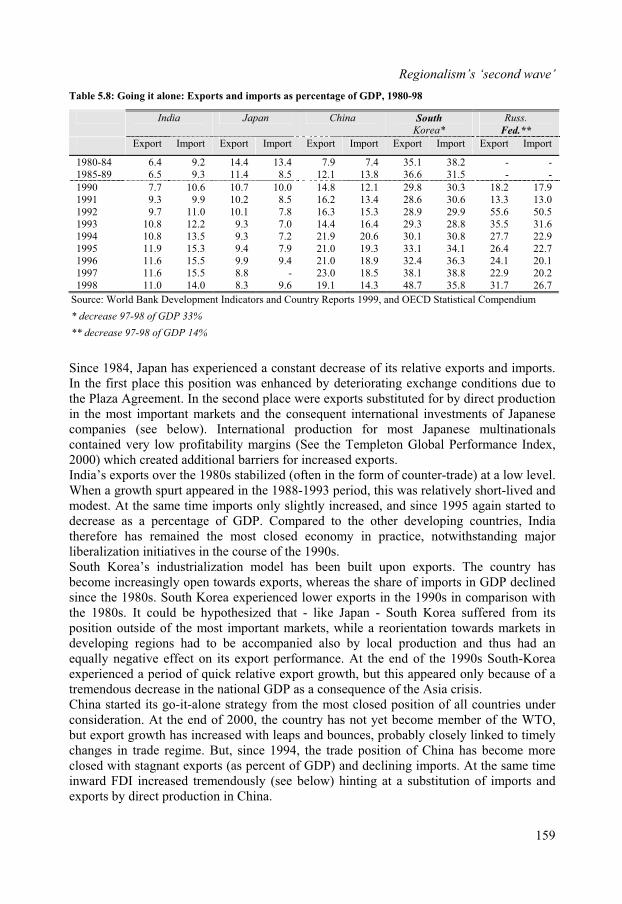
Regionalism’s ‘second wave’
Table 5.8: Going it alone: Exports and imports as percentage of GDP, 1980-98
India Japan China SouthKorea*
Russ.
Fed.**
Export Import Export Import Export Import Export Import Export Import
1980-84 6.4 9.2 14.4 13.4 7.9 7.4 35.1 38.2 - -1985-89 6.5 9.3 11.4 8.5 12.1 13.8 36.6 31.5 - -
1990 7.7 10.6 10.7 10.0 14.8 12.1 29.8 30.3 18.2 17.91991 9.3 9.9 10.2 8.5 16.2 13.4 28.6 30.6 13.3 13.01992 9.7 11.0 10.1 7.8 16.3 15.3 28.9 29.9 55.6 50.51993 10.8 12.2 9.3 7.0 14.4 16.4 29.3 28.8 35.5 31.61994 10.8 13.5 9.3 7.2 21.9 20.6 30.1 30.8 27.7 22.91995 11.9 15.3 9.4 7.9 21.0 19.3 33.1 34.1 26.4 22.71996 11.6 15.5 9.9 9.4 21.0 18.9 32.4 36.3 24.1 20.11997 11.6 15.5 8.8 - 23.0 18.5 38.1 38.8 22.9 20.21998 11.0 14.0 8.3 9.6 19.1 14.3 48.7 35.8 31.7 26.7
Source: World Bank Development Indicators and Country Reports 1999, and OECD Statistical Compendium
* decrease 97-98 of GDP 33%
** decrease 97-98 of GDP 14%
Since 1984, Japan has experienced a constant decrease of its relative exports and imports.In the first place this position was enhanced by deteriorating exchange conditions due to the Plaza Agreement. In the second place were exports substituted for by direct production in the most important markets and the consequent international investments of Japanesecompanies (see below). International production for most Japanese multinationalscontained very low profitability margins (See the Templeton Global Performance Index,2000) which created additional barriers for increased exports. India’s exports over the 1980s stabilized (often in the form of counter-trade) at a low level. When a growth spurt appeared in the 1988-1993 period, this was relatively short-lived and modest. At the same time imports only slightly increased, and since 1995 again started todecrease as a percentage of GDP. Compared to the other developing countries, Indiatherefore has remained the most closed economy in practice, notwithstanding majorliberalization initiatives in the course of the 1990s. South Korea’s industrialization model has been built upon exports. The country has become increasingly open towards exports, whereas the share of imports in GDP declinedsince the 1980s. South Korea experienced lower exports in the 1990s in comparison withthe 1980s. It could be hypothesized that - like Japan - South Korea suffered from itsposition outside of the most important markets, while a reorientation towards markets indeveloping regions had to be accompanied also by local production and thus had an equally negative effect on its export performance. At the end of the 1990s South-Koreaexperienced a period of quick relative export growth, but this appeared only because of a tremendous decrease in the national GDP as a consequence of the Asia crisis.China started its go-it-alone strategy from the most closed position of all countries under consideration. At the end of 2000, the country has not yet become member of the WTO,but export growth has increased with leaps and bounces, probably closely linked to timelychanges in trade regime. But, since 1994, the trade position of China has become moreclosed with stagnant exports (as percent of GDP) and declining imports. At the same timeinward FDI increased tremendously (see below) hinting at a substitution of imports and exports by direct production in China.
159

Chapter 5
The trade picture for the Russian Federation has been rather volatile. Throughout the period the country has still experienced some openness in trade with around twenty percent of GDP dedicated to exports and imports. The Russian trade environment presents in anycase a rather unstable surrounding for firms to operate in.The above analysis suggests that becoming voluntarily detached from the world economy– like China and the Russian Federation or India – has been accompanied by growing exports, whereas the more or less involuntary isolation of in particular Japan has lead todecreasing exports and to low relative levels of embeddedness in the world trade system.Go-it-alone strategies are best operationalized in countries’ investment regimes. Table 5.9 considers the trends in inward and outward investment for the five countries over the 1980-1997 period.
Table 5.9: Going it alone: inward and outward FDI stocks as a percentage of GDP, 1980-97
In absolute terms, all five countries are relatively closed towards inward as well as outwardFDI stock. The only exception has become China that has been the prime target country for inward FDI in the 1990s due to a policy of controlled opening up to FDI. Hardly anybodywould dispute that China’s investment regime is still considerably more closed than theinvestment regimes of most other countries.Over the 1980-1997 period all developing countries have experienced increases in inwardFDI: India and Russian Federation modest increases, China major increases. The Chinese development model therefore is much more focused on development aided by FDI. Indiaand the Russian Federation remain the most closed countries in investment terms.The two developed countries of this grouping have amongst the lowest inward FDI as compared to any of the countries in the RIAs discussed above. Compared to India and theRussian Federation they or at least as closed, taking inward and outward FDI flows intoconsideration. Both countries have hardly subscribed to bilateral investment treaties withother OECD countries, creating major risks for companies investing in these countries,which has resulted in stagnant or even negative flows of inward FDI. For Japan inward FDI stagnated at very low levels in the 1980-1990 period and further declined since 1995. For South-Korea inward FDI stagnated in the 1985-1995 period. Stagnation in inward FDI thus appeared in the period in which both countries inaugurated their economic ‘jumpforward’, which got accompanied by an increase in outward FDI. Firms from the same two countries also engaged in retreat strategy at various periods.Japanese firms already declined their outward FDI in the early 1990s as the effect of theformalization of NAFTA and EU (and the lingering fears of fortresses in North-Americaand Europe), and the slow deflation of the domestic bubble economy. South-Korean firmsstarted to retreat to their domestic economies in the second half of the 1990s as the
160
India Japan China South Korea Russian
Federation
In Out In Out In Out In Out In Out
1980 0.7 0.1 0.3 1.9 - - 1.8 0.2 - - 1985 0.5 0.1 0.4 3.3 1.5 - 2.3 0.5 - - 1990 0.4 - 0.3 6.9 5.2 0.7 2.3 0.9 - - 1995 1.6 0.2 0.7 4.7 18.8 2.3 2.3 2.2 1.6 0.9 1997 3.3 0.3 0.6 6.5 23.5 2.2 3.3 0.3 3.2 1.4
Source: UNCTAD, 1999
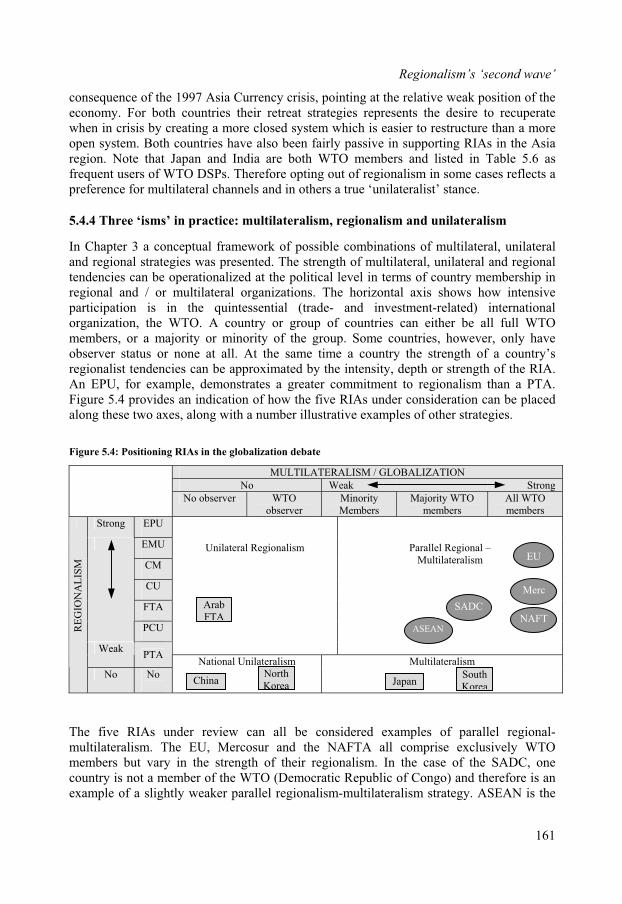
Regionalism’s ‘second wave’
consequence of the 1997 Asia Currency crisis, pointing at the relative weak position of the economy. For both countries their retreat strategies represents the desire to recuperatewhen in crisis by creating a more closed system which is easier to restructure than a moreopen system. Both countries have also been fairly passive in supporting RIAs in the Asiaregion. Note that Japan and India are both WTO members and listed in Table 5.6 as frequent users of WTO DSPs. Therefore opting out of regionalism in some cases reflects a preference for multilateral channels and in others a true ‘unilateralist’ stance.
5.4.4 Three ‘isms’ in practice: multilateralism, regionalism and unilateralism
In Chapter 3 a conceptual framework of possible combinations of multilateral, unilateraland regional strategies was presented. The strength of multilateral, unilateral and regionaltendencies can be operationalized at the political level in terms of country membership inregional and / or multilateral organizations. The horizontal axis shows how intensiveparticipation is in the quintessential (trade- and investment-related) internationalorganization, the WTO. A country or group of countries can either be all full WTOmembers, or a majority or minority of the group. Some countries, however, only have observer status or none at all. At the same time a country the strength of a country’sregionalist tendencies can be approximated by the intensity, depth or strength of the RIA.An EPU, for example, demonstrates a greater commitment to regionalism than a PTA.Figure 5.4 provides an indication of how the five RIAs under consideration can be placed along these two axes, along with a number illustrative examples of other strategies.
Figure 5.4: Positioning RIAs in the globalization debate
MULTILATERALISM / GLOBALIZATION
No Weak Strong
No observer WTOobserver
MinorityMembers
Majority WTOmembers
All WTOmembers
Strong EPU
EMU
CM
CU
FTA
PCU
Unilateral Regionalism Parallel Regional –Multilateralism
WeakPTA
No No
National Unilateralism Multilateralism
The five RIAs under review can all be considered examples of parallel regional-multilateralism. The EU, Mercosur and the NAFTA all comprise exclusively WTOmembers but vary in the strength of their regionalism. In the case of the SADC, onecountry is not a member of the WTO (Democratic Republic of Congo) and therefore is an example of a slightly weaker parallel regionalism-multilateralism strategy. ASEAN is the
RE
GIO
NA
LIS
M
EU
NAFTSADC
ASEAN
Merc
ChinaNorthKorea
ArabFTA
JapanSouthKorea
161
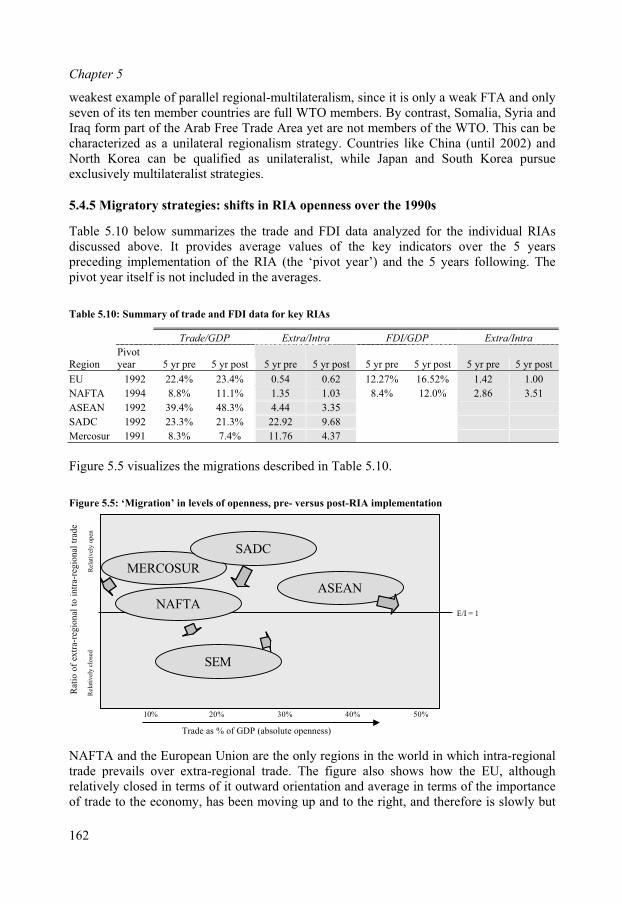
Chapter 5
weakest example of parallel regional-multilateralism, since it is only a weak FTA and onlyseven of its ten member countries are full WTO members. By contrast, Somalia, Syria andIraq form part of the Arab Free Trade Area yet are not members of the WTO. This can be characterized as a unilateral regionalism strategy. Countries like China (until 2002) and North Korea can be qualified as unilateralist, while Japan and South Korea pursueexclusively multilateralist strategies.
5.4.5 Migratory strategies: shifts in RIA openness over the 1990s
Table 5.10 below summarizes the trade and FDI data analyzed for the individual RIAsdiscussed above. It provides average values of the key indicators over the 5 yearspreceding implementation of the RIA (the ‘pivot year’) and the 5 years following. The pivot year itself is not included in the averages.
Table 5.10: Summary of trade and FDI data for key RIAs
Trade/GDP Extra/Intra FDI/GDP Extra/Intra
RegionPivotyear 5 yr pre 5 yr post 5 yr pre 5 yr post 5 yr pre 5 yr post 5 yr pre 5 yr post
EU 1992 22.4% 23.4% 0.54 0.62 12.27% 16.52% 1.42 1.00
NAFTA 1994 8.8% 11.1% 1.35 1.03 8.4% 12.0% 2.86 3.51
ASEAN 1992 39.4% 48.3% 4.44 3.35
SADC 1992 23.3% 21.3% 22.92 9.68
Mercosur 1991 8.3% 7.4% 11.76 4.37
Figure 5.5 visualizes the migrations described in Table 5.10.
Figure 5.5: ‘Migration’ in levels of openness, pre- versus post-RIA implementation
AFTA and the European Union are the only regions in the world in which intra-regionalade prevails over extra-regional trade. The figure also shows how the EU, although
Ntrrelatively closed in terms of it outward orientation and average in terms of the importanceof trade to the economy, has been moving up and to the right, and therefore is slowly but
162
Trade as % of GDP (absolute openness)
Rat
io o
f ex
tra-
regi
onal
to in
tra-
regi
onal
trad
e
Rel
ativ
ely
clos
edR
elat
ivel
y op
en
10% 20% 30% 40% 50%
E/I = 1
MERCOSUR
SADC
NAFTA
SEM
ASEAN
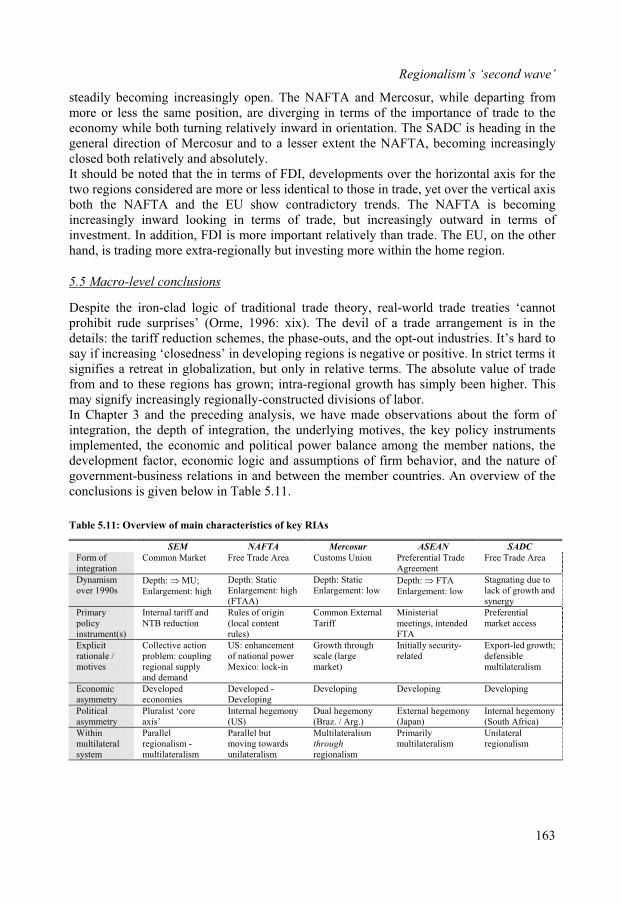
Regionalism’s ‘second wave’
steadily becoming increasingly open. The NAFTA and Mercosur, while departing frommore or less the same position, are diverging in terms of the importance of trade to theeconomy while both turning relatively inward in orientation. The SADC is heading in thegeneral direction of Mercosur and to a lesser extent the NAFTA, becoming increasinglyclosed both relatively and absolutely.It should be noted that the in terms of FDI, developments over the horizontal axis for thetwo regions considered are more or less identical to those in trade, yet over the vertical axisboth the NAFTA and the EU show contradictory trends. The NAFTA is becomingincreasingly inward looking in terms of trade, but increasingly outward in terms ofinvestment. In addition, FDI is more important relatively than trade. The EU, on the otherhand, is trading more extra-regionally but investing more within the home region.
5.5 Macro-level conclusions
Despite the iron-clad logic oprohibit rude surprises’ (Orm
f traditional trade theory, real-world trade treaties ‘cannote, 1996: xix). The devil of a trade arrangement is in the
policy instruments
y RIAs
ASEAN SADC
details: the tariff reduction schemes, the phase-outs, and the opt-out industries. It’s hard tosay if increasing ‘closedness’ in developing regions is negative or positive. In strict terms itsignifies a retreat in globalization, but only in relative terms. The absolute value of tradefrom and to these regions has grown; intra-regional growth has simply been higher. Thismay signify increasingly regionally-constructed divisions of labor.In Chapter 3 and the preceding analysis, we have made observations about the form of integration, the depth of integration, the underlying motives, the keyimplemented, the economic and political power balance among the member nations, the development factor, economic logic and assumptions of firm behavior, and the nature ofgovernment-business relations in and between the member countries. An overview of theconclusions is given below in Table 5.11.
Table 5.11: Overview of main characteristics of ke
SEM NAFTA Mercosur
Form of Common Market Free Trade Area Customs Union Preferential Trade Agreem
Free Trade Area integration ent
Dynamismover 1990s
Depth: ;Enlargement: high
MUd
DeptEnlargement: high
h: Static
(FTAA)
DepEnlargement: low
th: Static DeptEnlargement: low
h: FTA Stagnating due to lack of growth ansynergy
Primarypolicyinstrument(s)
Internal tariff andNTB reduction
Rules of origin(local content rules)
Common ExternalTariff
Ministerialmeetings, intendedFTA
Preferentialmarket access
Explicitrationale /motives
Collective action problem: coupling
ter arge
wth;
regional supplyand demand
US: enhancemenof national powMexico: lock-in
Growth through scale (lmarket)
Initially security-related
Export-led grodefensiblemultilateralism
Economicasymmetry
Developedeconomies
Developed - Developing
Developing Developing Developing
Politicalasymmetry
Pluralist ‘core ony ony ony)axis’
Internal hegem(US)
Dual hegemony(Braz. / Arg.)
External hegem(Japan)
Internal hegem(South Africa
Withinmultilateralsystem
Parallelregionalism - multilateralism
Parallel but moving towardsunilateralism
Multilateralismthrough
regionalism
Primarilymultilateralism
Unilateralregionalism
163

6. INTERNATIONALIZATION AT ‘T-MINUS’: BASELINE 1990
In relation to the policy-level vision of structural change, ‘the reality of integration is likelyto be less tidy’ (Wartick and Wood 1998: 50) due to the myriad complexities in barriers to and patterns in trade and investment. Although the policy mechanisms used on the basis of the policy-level strategic intent combine to determine the policy level outcome, realizedrestructuring is conducted by firms, with core companies at the fore. Since regionalismstrategies may differ between firms and governments, the latter in particular run the risk of basing their choices on oversimplified notions of firm behavior. The macro-data reviewedin Chapter 5 created a backdrop for positioning various regionalism strategies within thebroader multilateral context, but from that data very limited inferences can be drawn as tothe behavior of firms.How did core companies internationalize and restructure over the 1990s, and was there a clear difference between the period prior to regional consolidation (1995) and the periodafterwards? Before embarking on a longitudinal exploration in pursuit of ‘regionalismeffects’, it is necessary to provide a ‘static’ picture of the positioning, internationalizationand control strategies core companies pursued prior to the second wave of regionalism. For this purpose 1990 has been chosen as the ‘baseline’; the post-1990 dynamics will be investigated in Chapter 7. Additionally, many of the empirical constructs are new and assuch require adequate attention before being analyzed over time.The first step in the firm-level empirical investigation is to select a sample of corecompanies for analysis (6.1). These companies will then be categorized in terms of theirhorizontal and vertical positioning strategies (6.2). Section 6.3 explores various measuresof internationalization for the set, and section 6.4 addresses core company networkstructures and control strategies. These analyses will be brought together in Section 6.5 to‘typologize’ the sample according to the strategy framework laid out in Chapter 4.
6.1 Sample selection
Companies as micro actors in regional integration refer to companies, multinational or not,which are not only directly affected by regional integration, but also have a stake inshaping the outcome. In practice this amounts to companies with sufficient geographicscope and financial resources to enact restructuring on a regional level, as well as thebargaining power to influence national and/or regional policy stances. Such companies can also be indicative of industry-wide trends because their restructuring has ripple effects through the rest of the value chain (Lall, 1980). Attempts to explore the power base ofcompanies such as the ‘flagship firms’ of D’Cruz and Rugman (1997) and ‘leader firms’ ofBaden-Fuller and Lorenzoni (1995) are often based on intuitive identification or on asingle indicator. These characterizations tend to miss more subtle aspects of companypower such as technological advantage, political involvement or horizontal / vertical positioning.
6.1.1 The SCOPE database: a selection of core companies
The SCOPE database, initiated in 1997 at the Studies and Competence center for Organizational and Policy research in European Business (SCOPE) at the ErasmusUniversity of Rotterdam, addresses many of these conceptual and methodological gaps and
165
Chapter Six
forms the basis for the current study. The SCOPE database documents financial and strategic information of the 200 world’s largest (non-financial) companies over the 1990s(the Core200), selected by value of total sales in US dollars in 1995 (see Van Tulder et al.,2001). The SCOPE database monitors a predetermined sample of large firms over a longerperiod of time, instead of selecting a sample each year, such as the Fortune 500 or theUNCTAD Top 100 TNCs.SCOPE provides information on the geographic spread of assets, sales, employment, and affiliates of the Core200 from 1990 to the present, in addition to various other aspects of core company activity such as R&D expenditure, historical development and corporatesocial responsibility (CSR) strategies. Some of this output is published annually inUNCTAD’s World Investment Report. Data are collected from annual reports, company
database is intended to function as a tool for research at the Erasmus University as well as collaborative efforts with partner universities, based on a shared theoretical view of theimportance of core companies in national, regional and global economy.Although size is an initial (but by no means exhaustive) criterion, SCOPE explores numerous additional dimensions of core positioning and strategy, such as technologicalstrength (R&D expenditures, patent registration), links between core companies and governments (e.g. public offices of company CEOs and board membership of heads of state), and core company positioning strategies (e.g. the distinction between core power based on extensive vertical control over industries and core power based on a horizontal‘choke-hold’ on distribution). Additionally, the SCOPE database is highly international in composition, representing companies from 15 countries (see table 6.1).
Table 6.1: Core companies per country of incorporation in SCOPE Core200
Country of origin # of companies in
Core200Country of origin
# of companies in
Core200
Brazil 1 Spain 3
Canada 1 Sweden 3
France 20 Switzerland 2
Germany 23 Switz./Sweden 1
Italy 5 United Kingdom 7
Japan 60 UK/Netherlands 2
Mexico 1 United States 61
Netherlands 3 Venezuela 1
South Korea 6
Total 200
The Core200 is a diverse group of companies from many countries, involved in manyactivities. Since the objective of the research is to study the (diversity in) strategicresponses to regionalism among core companies, the sample studied should berepresentative of core companies in general (or even relatively exhaustive) instead of choosing e.g. a sector, or country. Therefore the sample should be broad in order to reflectthose nuances, as opposed to a narrow focus which overemphasizes the role of institutionalfactors in strategy. Cross-sectional research of this nature, first made popular by Bain(1956), can produce useful analysis (Ghemawat, 1994). According to Schmalensee (1989:
166
surveys, interviews and secondary public sources (see also Appendices and ). TheII III
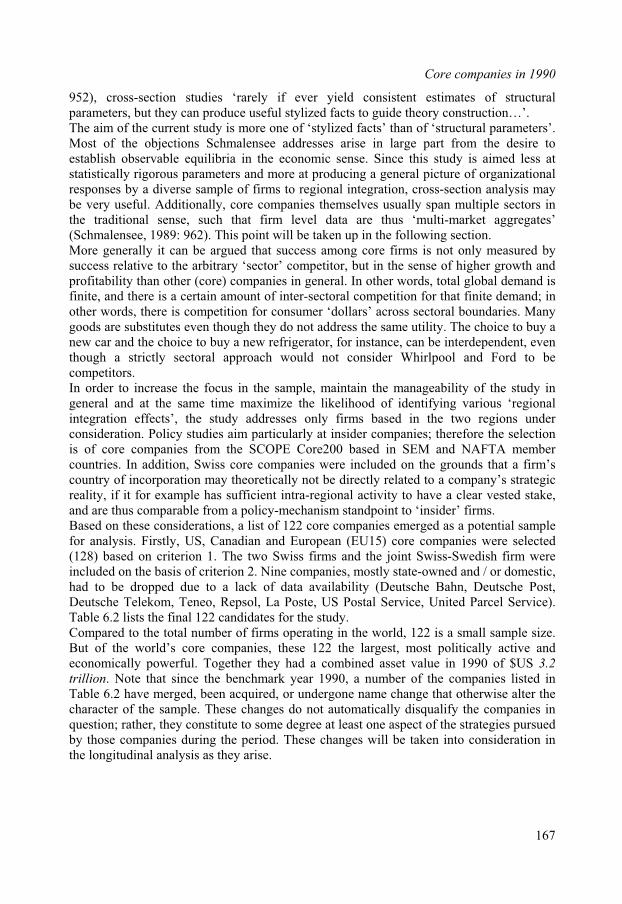
Core companies in 1990
952), cross-section studies ‘rarely if ever yield consistent estimates of structuralparameters, but they can produce useful stylized facts to guide theory construction…’.The aim of the current study is more one of ‘stylized facts’ than of ‘structural parameters’.Most of the objections Schmalensee addresses arise in large part from the desire toestablish observable equilibria in the economic sense. Since this study is aimed less at statistically rigorous parameters and more at producing a general picture of organizationalresponses by a diverse sample of firms to regional integration, cross-section analysis maybe very useful. Additionally, core companies themselves usually span multiple sectors inthe traditional sense, such that firm level data are thus ‘multi-market aggregates’(Schmalensee, 1989: 962). This point will be taken up in the following section.More generally it can be argued that success among core firms is not only measured bysuccess relative to the arbitrary ‘sector’ competitor, but in the sense of higher growth andprofitability than other (core) companies in general. In other words, total global demand is finite, and there is a certain amount of inter-sectoral competition for that finite demand; in other words, there is competition for consumer ‘dollars’ across sectoral boundaries. Many goods are substitutes even though they do not address the same utility. The choice to buy a new car and the choice to buy a new refrigerator, for instance, can be interdependent, even though a strictly sectoral approach would not consider Whirlpool and Ford to be competitors.In order to increase the focus in the sample, maintain the manageability of the study ingeneral and at the same time maximize the likelihood of identifying various ‘regionalintegration effects’, the study addresses only firms based in the two regions under consideration. Policy studies aim particularly at insider companies; therefore the selection is of core companies from the SCOPE Core200 based in SEM and NAFTA membercountries. In addition, Swiss core companies were included on the grounds that a firm’scountry of incorporation may theoretically not be directly related to a company’s strategicreality, if it for example has sufficient intra-regional activity to have a clear vested stake,and are thus comparable from a policy-mechanism standpoint to ‘insider’ firms.Based on these considerations, a list of 122 core companies emerged as a potential samplefor analysis. Firstly, US, Canadian and European (EU15) core companies were selected (128) based on criterion 1. The two Swiss firms and the joint Swiss-Swedish firm wereincluded on the basis of criterion 2. Nine companies, mostly state-owned and / or domestic,had to be dropped due to a lack of data availability (Deutsche Bahn, Deutsche Post, Deutsche Telekom, Teneo, Repsol, La Poste, US Postal Service, United Parcel Service).Table 6.2 lists the final 122 candidates for the study.Compared to the total number of firms operating in the world, 122 is a small sample size.But of the world’s core companies, these 122 the largest, most politically active and economically powerful. Together they had a combined asset value in 1990 of $US 3.2
trillion. Note that since the benchmark year 1990, a number of the companies listed inTable 6.2 have merged, been acquired, or undergone name change that otherwise alter thecharacter of the sample. These changes do not automatically disqualify the companies inquestion; rather, they constitute to some degree at least one aspect of the strategies pursuedby those companies during the period. These changes will be taken into consideration inthe longitudinal analysis as they arise.
167

Chapter Six
Table 6.2: Core companies in the sample
Core companies, alphabetically
3M Digital Equipment IRI Rhone Poulenc
ABB Dow J C Penney Robert Bosch
Ahold Du Pont J Sainsbury Royal Dutch Shell
Albertson's EDF Johnson & Johnson RWE
Alcatel Electrolux Karstadtquelle Safeway
AlliedSignal Elf Aquitaine Kmart Saint-Gobain
Amoco Enel Kodak Sara Lee
AMR ENI Kroger Sears Roebuck
ARCO Ericsson Lockheed Martin Siemens
AT&T Exxon Lufthansa Suez
BASF Federated Dept Stores Mannesmann Supervalu
BAT Ferruzzi Marathon Oil Target
Bayer Fiat McDonnell Douglas Telefonica
BCE Fleming Merck Tesco
BellSouth Ford Metro Texaco
BMW France Telecom Mobil Thomson
Boeing Franz Haniel Motorola Thyssen
Bouygues Fried. Krupp Nabisco Total Fina
BP Gen. des Eaux Nestlé UAL
BT General Electric Novartis Unilever
BTR General Motors Pechiney United Technologies
Carrefour Georgia-Pacific Pepsico Usinor
Caterpillar GTE Peugeot Veba
Chevron HCA Philip Morris Viag
Chrysler Hoechst Philips Volkswagen
Coca-Cola Home Depot Pinault-Printemps-Redoute Volvo
Compaq HP Preussag Wal-Mart
Conagra IBM Procter & Gamble Worldcom
Costco ICI Promodes Xerox
Daimler-Benz Intel Rag
Danone International Paper Renault
6.1.2 National origins
Table 6.3 shows the breakdown by home country (country of incorporation). Of the 122companies, 55 percent are based in Europe and another 45 percent are based in NorthAmerica (all but one in the US). As a subset of companies in general, the sample is fairly small. As core companies, however, the sample is representative for the overall corecompany population in the two regions. In that sense ‘200’ is a relatively arbitrary cutoffpoint since there are of course other firms that may function as core companies but falloutside the scope of the study. Yet the measurement indicators of core status – size inparticular– decline dramatically below that point. The largest core company measured bytotal assets in 1990 (General Motors) was more than 500 times larger than the smallest
168
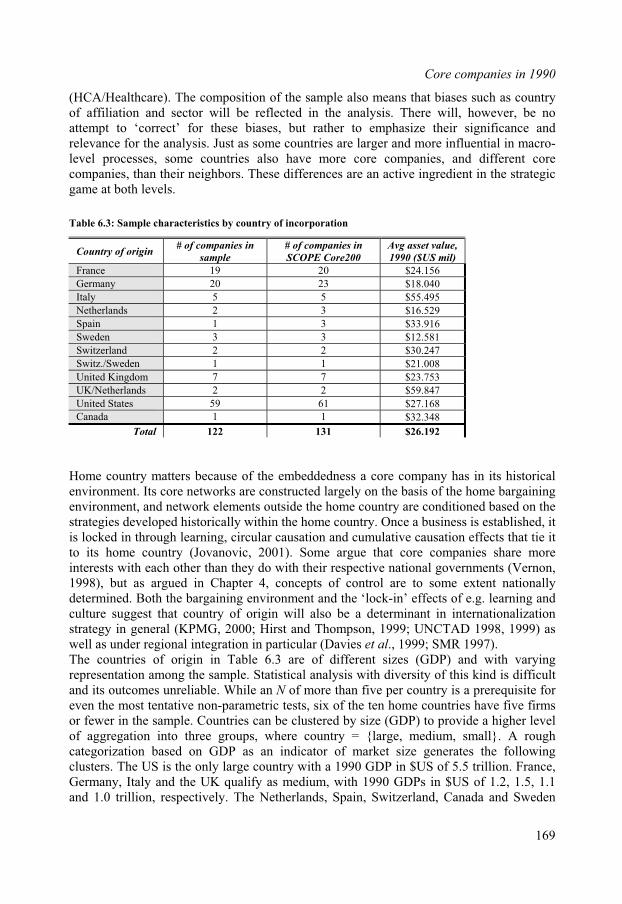
Core companies in 1990
(HCA/Healthcare). The composition of the sample also means that biases such as countryof affiliation and sector will be reflected in the analysis. There will, however, be noattempt to ‘correct’ for these biases, but rather to emphasize their significance and relevance for the analysis. Just as some countries are larger and more influential in macro-level processes, some countries also have more core companies, and different core companies, than their neighbors. These differences are an active ingredient in the strategicgame at both levels.
Table 6.3: Sample characteristics by country of incorporation
Country of origin # of companies in
sample
# of companies in
SCOPE Core200
Avg asset value,
1990 ($US mil)
France 19 20 $24.156
Germany 20 23 $18.040
Italy 5 5 $55.495
Netherlands 2 3 $16.529
Spain 1 3 $33.916
Sweden 3 3 $12.581
Switzerland 2 2 $30.247
Switz./Sweden 1 1 $21.008
United Kingdom 7 7 $23.753
UK/Netherlands 2 2 $59.847
United States 59 61 $27.168
Canada 1 1 $32.348
Total 122 131 $26.192
Home country matters because of the embeddedness a core company has in its historicalenvironment. Its core networks are constructed largely on the basis of the home bargainingenvironment, and network elements outside the home country are conditioned based on the strategies developed historically within the home country. Once a business is established, itis locked in through learning, circular causation and cumulative causation effects that tie itto its home country (Jovanovic, 2001). Some argue that core companies share moreinterests with each other than they do with their respective national governments (Vernon, 1998), but as argued in Chapter 4, concepts of control are to some extent nationallydetermined. Both the bargaining environment and the ‘lock-in’ effects of e.g. learning and culture suggest that country of origin will also be a determinant in internationalization strategy in general (KPMG, 2000; Hirst and Thompson, 1999; UNCTAD 1998, 1999) as well as under regional integration in particular (Davies et al., 1999; SMR 1997). The countries of origin in Table 6.3 are of different sizes (GDP) and with varyingrepresentation among the sample. Statistical analysis with diversity of this kind is difficultand its outcomes unreliable. While an N of more than five per country is a prerequisite for even the most tentative non-parametric tests, six of the ten home countries have five firmsor fewer in the sample. Countries can be clustered by size (GDP) to provide a higher levelof aggregation into three groups, where country = {large, medium, small}. A rough categorization based on GDP as an indicator of market size generates the followingclusters. The US is the only large country with a 1990 GDP in $US of 5.5 trillion. France, Germany, Italy and the UK qualify as medium, with 1990 GDPs in $US of 1.2, 1.5, 1.1 and 1.0 trillion, respectively. The Netherlands, Spain, Switzerland, Canada and Sweden
169
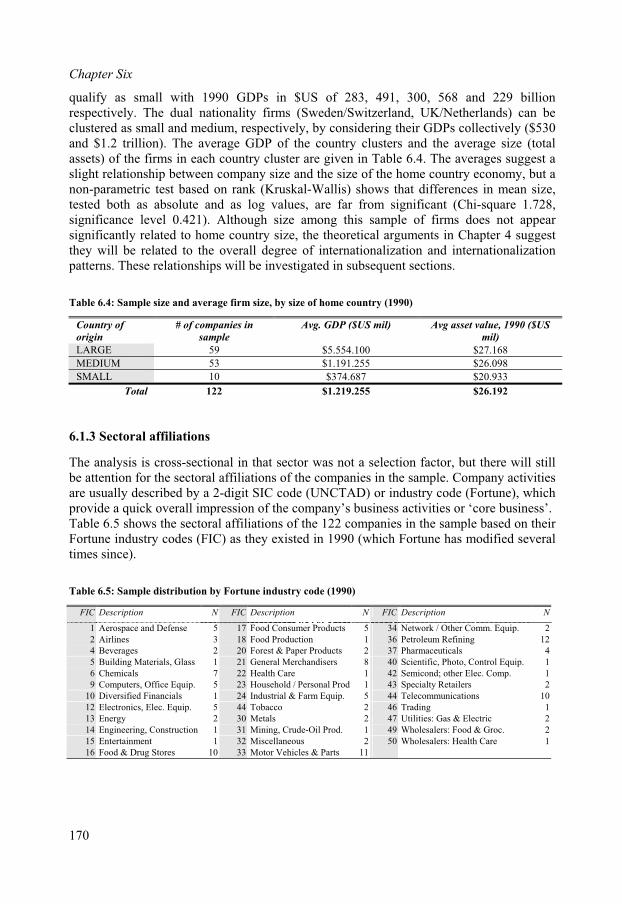
Chapter Six
qualify as small with 1990 GDPs in $US of 283, 491, 300, 568 and 229 billion respectively. The dual nationality firms (Sweden/Switzerland, UK/Netherlands) can beclustered as small and medium, respectively, by considering their GDPs collectively ($530 and $1.2 trillion). The average GDP of the country clusters and the average size (totalassets) of the firms in each country cluster are given in Table 6.4. The averages suggest a slight relationship between company size and the size of the home country economy, but anon-parametric test based on rank (Kruskal-Wallis) shows that differences in mean size, tested both as absolute and as log values, are far from significant (Chi-square 1.728, significance level 0.421). Although size among this sample of firms does not appear significantly related to home country size, the theoretical arguments in Chapter 4 suggestthey will be related to the overall degree of internationalization and internationalizationpatterns. These relationships will be investigated in subsequent sections.
Table 6.4: Sample size and average firm size, by size of home country (1990)
Country of
origin
# of companies in
sample
Avg. GDP ($US mil) Avg asset value, 1990 ($US
mil)
LARGE 59 $5.554.100 $27.168
MEDIUM 53 $1.191.255 $26.098
SMALL 10 $374.687 $20.933
Total 122 $1.219.255 $26.192
6.1.3 Sectoral affiliations
The analysis is cross-sectional in that sector was not a selection factor, but there will still be attention for the sectoral affiliations of the companies in the sample. Company activitiesare usually described by a 2-digit SIC code (UNCTAD) or industry code (Fortune), whichprovide a quick overall impression of the company’s business activities or ‘core business’.Table 6.5 shows the sectoral affiliations of the 122 companies in the sample based on theirFortune industry codes (FIC) as they existed in 1990 (which Fortune has modified severaltimes since).
Table 6.5: Sample distribution by Fortune industry code (1990)
FIC Description N FIC Description N FIC Description N
1 Aerospace and Defense 5 17 Food Consumer Products 5 34 Network / Other Comm. Equip. 2
2 Airlines 3 18 Food Production 1 36 Petroleum Refining 12
4 Beverages 2 20 Forest & Paper Products 2 37 Pharmaceuticals 4
5 Building Materials, Glass 1 21 General Merchandisers 8 40 Scientific, Photo, Control Equip. 1
6 Chemicals 7 22 Health Care 1 42 Semicond; other Elec. Comp. 1
9 Computers, Office Equip. 5 23 Household / Personal Prod 1 43 Specialty Retailers 2
10 Diversified Financials 1 24 Industrial & Farm Equip. 5 44 Telecommunications 10
12 Electronics, Elec. Equip. 5 44 Tobacco 2 46 Trading 1
13 Energy 2 30 Metals 2 47 Utilities: Gas & Electric 2
14 Engineering, Construction 1 31 Mining, Crude-Oil Prod. 1 49 Wholesalers: Food & Groc. 2
15 Entertainment 1 32 Miscellaneous 2 50 Wholesalers: Health Care 1
16 Food & Drug Stores 10 33 Motor Vehicles & Parts 11
170
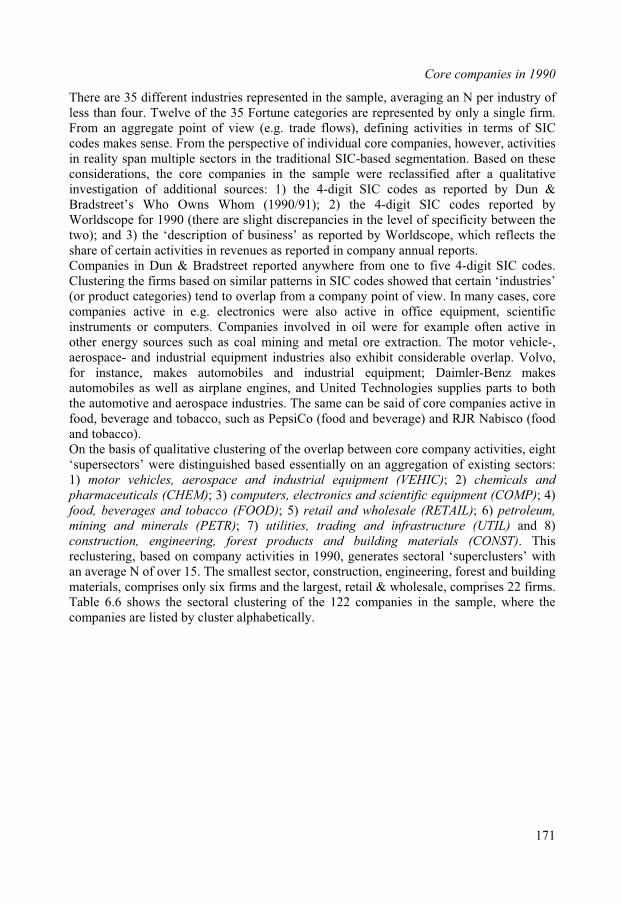
Core companies in 1990
There are 35 different industries represented in the sample, averaging an N per industry of less than four. Twelve of the 35 Fortune categories are represented by only a single firm.From an aggregate point of view (e.g. trade flows), defining activities in terms of SIC codes makes sense. From the perspective of individual core companies, however, activitiesin reality span multiple sectors in the traditional SIC-based segmentation. Based on theseconsiderations, the core companies in the sample were reclassified after a qualitativeinvestigation of additional sources: 1) the 4-digit SIC codes as reported by Dun & Bradstreet’s Who Owns Whom (1990/91); 2) the 4-digit SIC codes reported byWorldscope for 1990 (there are slight discrepancies in the level of specificity between thetwo); and 3) the ‘description of business’ as reported by Worldscope, which reflects theshare of certain activities in revenues as reported in company annual reports.Companies in Dun & Bradstreet reported anywhere from one to five 4-digit SIC codes.Clustering the firms based on similar patterns in SIC codes showed that certain ‘industries’(or product categories) tend to overlap from a company point of view. In many cases, corecompanies active in e.g. electronics were also active in office equipment, scientificinstruments or computers. Companies involved in oil were for example often active inother energy sources such as coal mining and metal ore extraction. The motor vehicle-,aerospace- and industrial equipment industries also exhibit considerable overlap. Volvo, for instance, makes automobiles and industrial equipment; Daimler-Benz makesautomobiles as well as airplane engines, and United Technologies supplies parts to boththe automotive and aerospace industries. The same can be said of core companies active in food, beverage and tobacco, such as PepsiCo (food and beverage) and RJR Nabisco (food and tobacco).On the basis of qualitative clustering of the overlap between core company activities, eight‘supersectors’ were distinguished based essentially on an aggregation of existing sectors:1) motor vehicles, aerospace and industrial equipment (VEHIC); 2) chemicals and
pharmaceuticals (CHEM); 3) computers, electronics and scientific equipment (COMP); 4)food, beverages and tobacco (FOOD); 5) retail and wholesale (RETAIL); 6) petroleum,mining and minerals (PETR); 7) utilities, trading and infrastructure (UTIL) and 8) construction, engineering, forest products and building materials (CONST). This reclustering, based on company activities in 1990, generates sectoral ‘superclusters’ with an average N of over 15. The smallest sector, construction, engineering, forest and buildingmaterials, comprises only six firms and the largest, retail & wholesale, comprises 22 firms.Table 6.6 shows the sectoral clustering of the 122 companies in the sample, where thecompanies are listed by cluster alphabetically.
171
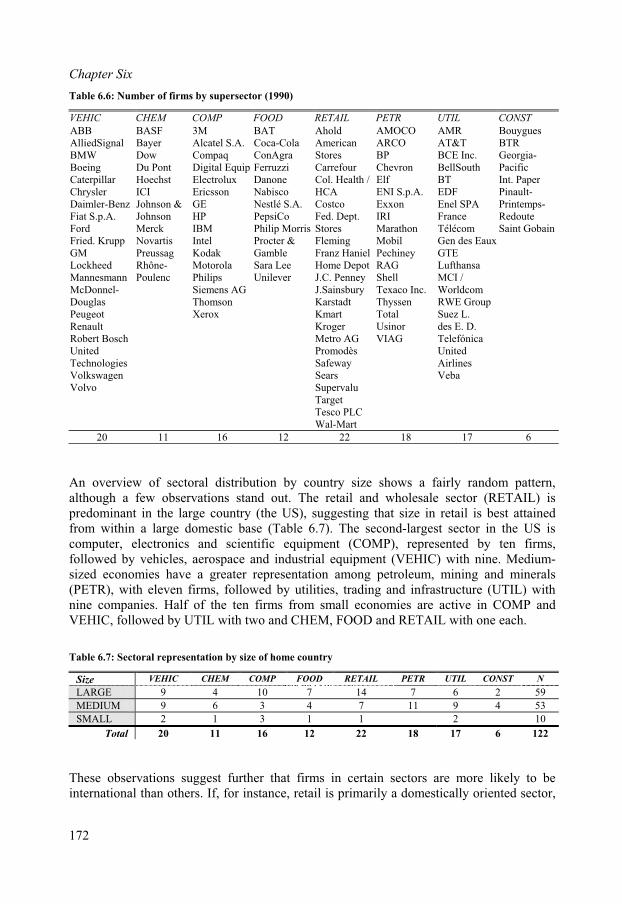
Chapter Six
Table 6.6: Number of firms by supersector (1990)
VEHIC CHEM COMP FOOD RETAIL PETR UTIL CONST
ABBAlliedSignalBMWBoeingCaterpillarChryslerDaimler-BenzFiat S.p.A. FordFried. KruppGMLockheedMannesmannMcDonnel-DouglasPeugeotRenaultRobert Bosch UnitedTechnologiesVolkswagenVolvo
BASFBayerDowDu Pont HoechstICIJohnson &JohnsonMerckNovartisPreussagRhône-Poulenc
3MAlcatel S.A. CompaqDigital EquipElectroluxEricssonGEHPIBMIntelKodakMotorolaPhilipsSiemens AG ThomsonXerox
BATCoca-ColaConAgraFerruzziDanoneNabiscoNestlé S.A. PepsiCoPhilip Morris Procter & GambleSara Lee Unilever
AholdAmericanStoresCarrefourCol. Health /HCACostcoFed. Dept.StoresFlemingFranz Haniel Home Depot J.C. PenneyJ.SainsburyKarstadtKmartKrogerMetro AG PromodèsSafewaySearsSupervaluTargetTesco PLC Wal-Mart
AMOCOARCOBPChevronElfENI S.p.A.ExxonIRIMarathonMobilPechineyRAGShellTexaco Inc. ThyssenTotalUsinorVIAG
AMRAT&TBCE Inc. BellSouthBTEDFEnel SPA FranceTélécomGen des EauxGTELufthansaMCI / WorldcomRWE GroupSuez L.des E. D.TelefónicaUnitedAirlinesVeba
BouyguesBTRGeorgia-PacificInt. PaperPinault-Printemps-RedouteSaint Gobain
20 11 16 12 22 18 17 6
An overview of sectoral distribution by country size shows a fairly random pattern,although a few observations stand out. The retail and wholesale sector (RETAIL) ispredominant in the large country (the US), suggesting that size in retail is best attainedfrom within a large domestic base (Table 6.7). The second-largest sector in the US iscomputer, electronics and scientific equipment (COMP), represented by ten firms,followed by vehicles, aerospace and industrial equipment (VEHIC) with nine. Medium-sized economies have a greater representation among petroleum, mining and minerals(PETR), with eleven firms, followed by utilities, trading and infrastructure (UTIL) withnine companies. Half of the ten firms from small economies are active in COMP and VEHIC, followed by UTIL with two and CHEM, FOOD and RETAIL with one each.
Table 6.7: Sectoral representation by size of home country
Size VEHIC CHEM COMP FOOD RETAIL PETR UTIL CONST N
LARGE 9 4 10 7 14 7 6 2 59
MEDIUM 9 6 3 4 7 11 9 4 53
SMALL 2 1 3 1 1 2 10
Total 20 11 16 12 22 18 17 6 122
These observations suggest further that firms in certain sectors are more likely to be international than others. If, for instance, retail is primarily a domestically oriented sector,
172
Core companies in 1990
it is likely that ceteris paribus a retail firm from a small country would not be large enough to meet the primary sample selection criterion of size due to the lack of growth potential ina small domestic market. Similarly, the representation of small countries in COMP andVEHIC suggests that these sectors may be relatively more internationalized. The relationship between sector, country and internationalization will be explored in subsequent sections.
6.1.4 Cross-border integration
Although strategic decisions are taken at the firm level, the strategic options available tothe firm (as well as previous strategic decisions) are in part driven by sectoral considerations. It is expected that sector will not only be a factor in the 1990 baseline strategy clustering, but also in the post-1990 strategy migrations. The sectoral clusteringalso forms the basis for the distinction between the cross-border integrated strategies andthe multidomestic strategies. In the strategy typology developed in Chapter 4, each geographically oriented strategy type was segmented into those firms whose strategyhinges on vertically integrated production across borders and those with relativelyautonomous national units. The former are the regional division of labor (RDL), bi-regional division of labor (BiRDL) and globally integrated strategy (GLOB); the latter are regional multidomestic (RMDM), bi-regional multidomestic (BiRMDM) and global
multidomestic (GLMDM).Cross-border integrated production as referred to here is the movement of intermediategoods across borders one or more times between stages in the production process. This can involve e.g. shipping parts to destination markets for final assembly, or the import ofintermediate goods for final assembly in the home country before final export sales are conducted. Autonomous production in nationally based units means that inputs aresourced, processed and final goods are consumed within the local business and marketenvironment. In practice this may have a micro-regional character (e.g. ‘the Benelux’) butgenerally it refers to a fragmented market agglomeration, whereas cross-border integratedproduction generates relatively more homogeneous goods and where the locus of production and locus of consumption are relatively disjointed.In the sparse literature on cross-border integration, intra-firm sales are traditionally used asa proxy of measurement (Harzing, 2000; Kobrin, 1991). Although intra-firm salesreporting is an excellent starting point, companies are not uniformly required to disclosethe intra-firm share of sales (and even less so its geographic makeup), particularly inEuropean countries (see also Appendix 2). The cross-border integrated character of production is largely a matter of industry. Certain industries, for instance, are known to behighly integrated across borders, such as automobiles and electronics. Others, such as food and other fast-moving consumer goods, tend to be oriented towards national markets.Using available information on intra-firm sales for the firms in the sample, it can be shownthat a clear relationship exists between supercluster affiliation and the likelihood to report intra-firm sales (Table 6.8). The supersectors are sorted in terms of the percentage ofcompanies in the cluster reporting intra-firm sales (IFS) and the degree of verticalintegration (IFS as percentage of total sales, or TS).Table 6.8 shows that five superclusters of core companies are, to varying degrees,vertically integrated across borders (shaded rows), namely computers, electronics and scientific equipment (COMP); petroleum, mining and minerals (PETR); chemicals and
173
Chapter Six
pharmaceuticals (CHEM); motor vehicles, aerospace and industrial equipment (VEHIC); and construction, engineering, forest and building materials cluster (CONST). Firmsoperating in the clusters food, beverages and tobacco (FOOD); retail and wholesale (RETAIL); and utilities, trading and infrastructure (UTIL) are far less likely to report intra-firm sales (seven of 51 combined) and if they do, their intra-firm sales represent a considerably lower share of total sales (on average less than three percent). These considerations will form the basis for allocating firms to the various multidomestic andintegrated clusters below.
Table 6.8: Cross-border vertical integration by sector (1990)
Total N Firms w/ IFS Pct of N IFS as % of TS
COMP 15 12 80% 18.2%
PETR 18 12 67% 9.0%
CHEM 11 6 55% 11.3%
VEHIC 20 7 35% 20.4%
CONST 6 3 50% 6.4%
FOOD 12 3 25% 2.6%
UTIL 17 2 12% 4.2%
RETAIL 22 2 9% 1.3%
122 47 39% 11.8%
6.2 Dimensions for analysis
In Chapter 4, the theoretical characteristics of two dimensions of core companyinternationalization strategies were explored: on the one hand, the geographic spread of production activities, and on the other the organizational aspects of strategy. Regional integration is first and foremost a matter of restructuring economic activity throughgeographic space. The typology of internationalization strategies (Chapter 4) is based solely on the regional characteristics of firms’ spatial organization of production. The organizational dimensions will form a basis for analysis, but not the basis for generatingregionally-relevant clusters.
6.2.1 Measuring the scale and scope of internationalization
Studying the restructuring of core company activity in an international setting requires afirm-level measure of internationalization. Although FDI has been the primary means bywhich to (indirectly) analyze firm-level trends, dissatisfaction with FDI has grown inrecent years. FDI is not a good indicator of internationalization given its shortcomings for drawing firm-level inferences (Cantwell, 1992; Ramstetter, 1998; Hirst and Thompson,1999; Vernon, 1998; Hennart, 2000; Stephan and Pfaffmann, 2001; Lipsey, 2001).An increasing numbers of scholars have considered internationalization at the firm level inrecent years (Stopford et al., 1992; Dunning and Pearce, 1985; Ramaswamy et al., 1996;see also Dunning, 1993). Measuring the significance of location, the value of economicactivity, added value or production in a given location underlies the meaning given tointernationalization processes and outcomes, and ultimately determines how the
174
Core companies in 1990
multinational enterprise is conceptualized and defined. Various authors have attempted todevelop sound and objective firm-level measures of internationalization (Ramaswamy etal., 1996; Sullivan, 1994 and 1996). Three of the more common indicators are sales, assets and employment by geographic area as proxies for the spread of activity.Firm-level indicators of internationalization are quite diverse and there is little agreementas to their applicability (Ramaswamy et al., 1996). Multinationality is a multidimensionalconcept considered in varying degrees in terms of operations, ownership or orientation
(Perlmutter and Heenan, 1979; Anavarjula and Beldona, 2000). Peck et al. (1999), for example, address orientation when considering the foreignness or foreign experience of directory boards. Saudagaran and Biddle (1995), on the other hand, deal with ownershipissues when looking at company listings on foreign stock exchanges. Yet others measureforeignness in terms of psychic distance to trade and investment destinations, number of subsidiaries abroad as a percentage of the total, or a composite based on multiple variables(Sullivan, 1994).In terms simply of the significance for a firm of a given location (the operational
dimension of foreignness), however, three of the more prevalent indicators are foreignsales (FS), foreign assets (FA) and foreign employment (FE) measured as percentages of the total (cf. Oxley and Schnietz, 2001; Kwok and Reeb, 2000), or the Transnationality index (TNI) developed by UNCTAD (a composite indicator based on all three). Often theobjective is to link international operations to firm ‘performance’ (Michel and Shaked,1986; Daniels and Bracker, 1989; Qian and Li, 1998; Gomes and Ramaswamy, 1999; Luand Beamish, 2000; Ruigrok and Wagner, 2003; Gestrin, Rugman and Knight, 2001;Goerzen and Beamish, 2002), whereby the nature of that link remains hotly debated.The three indicators can be criticized because e.g. their firm-specific nature arguably creates difficulties in cross-firm comparison, or that they do not provide accurate representation of true value added. But they do share characteristics of revealinggeographic significance for firms, and have been shown to be correlated and effectivemeasures of internationalization (Ietto-Gilles, 1998; Lee and Kwok, 1988; Rugman, 1976). At the same time the three indicators differ in important ways and as such complementeach other well in providing a well-rounded overall picture of the spatial organization of a firm’s activities. Assets give an indication of a firm’s productive capacity or the extent to which it controls economic resources, and the share of a firm’s assets in a given locationprovides an indicator of the importance of that location in the firm’s overall strategy. ‘Thevalue of capital that TNCs mobilize and control abroad annually in direct investmentprojects can be approximated by looking at year-to-year changes in total assets of foreignaffiliates. The value of these assets reflects funds from sources other than the TNC itself, and as such gives a more accurate picture of the size of annual investments abroad by TNCs’ (UNCTAD, 1997: 25).Sales, on the other hand, are a measure of a firm’s output and relative participation in aneconomy. The foreign sales to total sales (FS/TS) ratio can be viewed as a proxy for afirm’s dependence on overseas markets for revenues as well as production. In general itcan be viewed as a surrogate for the value of production in the foreign subsidiaries of theMNE and a measure of the geographic scale of international production (Gomes and Ramaswamy, 1999; Ietto-Gillies, 1998; UNCTAD, 1998). The ratio is the most commonand widely applied indicator of the multinationality of a MNE (cf. Dunning, 1981),especially in studies analyzing the relationship between multinationality and performance(Sullivan, 1994).
175
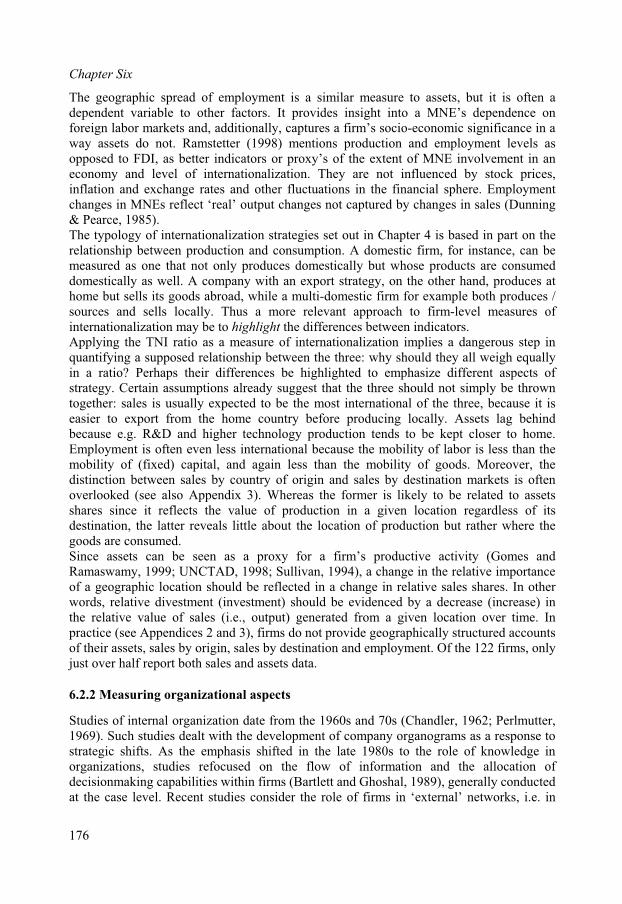
Chapter Six
The geographic spread of employment is a similar measure to assets, but it is often a dependent variable to other factors. It provides insight into a MNE’s dependence onforeign labor markets and, additionally, captures a firm’s socio-economic significance in away assets do not. Ramstetter (1998) mentions production and employment levels asopposed to FDI, as better indicators or proxy’s of the extent of MNE involvement in aneconomy and level of internationalization. They are not influenced by stock prices,inflation and exchange rates and other fluctuations in the financial sphere. Employmentchanges in MNEs reflect ‘real’ output changes not captured by changes in sales (Dunning& Pearce, 1985).The typology of internationalization strategies set out in Chapter 4 is based in part on therelationship between production and consumption. A domestic firm, for instance, can be measured as one that not only produces domestically but whose products are consumeddomestically as well. A company with an export strategy, on the other hand, produces athome but sells its goods abroad, while a multi-domestic firm for example both produces /sources and sells locally. Thus a more relevant approach to firm-level measures ofinternationalization may be to highlight the differences between indicators.Applying the TNI ratio as a measure of internationalization implies a dangerous step inquantifying a supposed relationship between the three: why should they all weigh equallyin a ratio? Perhaps their differences be highlighted to emphasize different aspects ofstrategy. Certain assumptions already suggest that the three should not simply be throwntogether: sales is usually expected to be the most international of the three, because it is easier to export from the home country before producing locally. Assets lag behindbecause e.g. R&D and higher technology production tends to be kept closer to home.Employment is often even less international because the mobility of labor is less than the mobility of (fixed) capital, and again less than the mobility of goods. Moreover, the distinction between sales by country of origin and sales by destination markets is oftenoverlooked (see also Appendix 3). Whereas the former is likely to be related to assetsshares since it reflects the value of production in a given location regardless of itsdestination, the latter reveals little about the location of production but rather where the goods are consumed.Since assets can be seen as a proxy for a firm’s productive activity (Gomes andRamaswamy, 1999; UNCTAD, 1998; Sullivan, 1994), a change in the relative importanceof a geographic location should be reflected in a change in relative sales shares. In otherwords, relative divestment (investment) should be evidenced by a decrease (increase) inthe relative value of sales (i.e., output) generated from a given location over time. Inpractice (see Appendices 2 and 3), firms do not provide geographically structured accountsof their assets, sales by origin, sales by destination and employment. Of the 122 firms, onlyjust over half report both sales and assets data.
6.2.2 Measuring organizational aspects
Studies of internal organization date from the 1960s and 70s (Chandler, 1962; Perlmutter,1969). Such studies dealt with the development of company organograms as a response tostrategic shifts. As the emphasis shifted in the late 1980s to the role of knowledge inorganizations, studies refocused on the flow of information and the allocation ofdecisionmaking capabilities within firms (Bartlett and Ghoshal, 1989), generally conducted at the case level. Recent studies consider the role of firms in ‘external’ networks, i.e. in
176
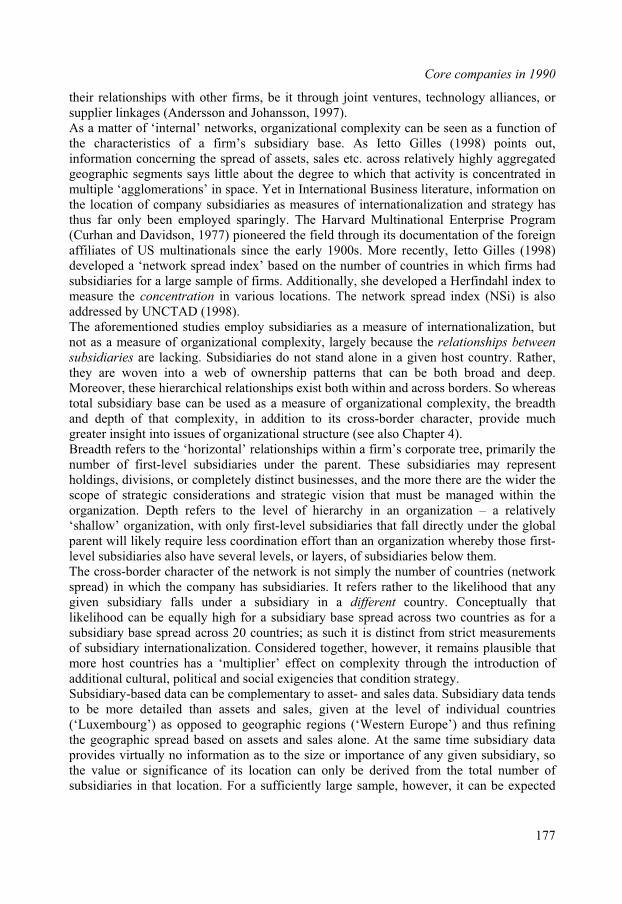
Core companies in 1990
their relationships with other firms, be it through joint ventures, technology alliances, or supplier linkages (Andersson and Johansson, 1997).As a matter of ‘internal’ networks, organizational complexity can be seen as a function of the characteristics of a firm’s subsidiary base. As Ietto Gilles (1998) points out, information concerning the spread of assets, sales etc. across relatively highly aggregated geographic segments says little about the degree to which that activity is concentrated in multiple ‘agglomerations’ in space. Yet in International Business literature, information onthe location of company subsidiaries as measures of internationalization and strategy hasthus far only been employed sparingly. The Harvard Multinational Enterprise Program(Curhan and Davidson, 1977) pioneered the field through its documentation of the foreignaffiliates of US multinationals since the early 1900s. More recently, Ietto Gilles (1998)developed a ‘network spread index’ based on the number of countries in which firms had subsidiaries for a large sample of firms. Additionally, she developed a Herfindahl index tomeasure the concentration in various locations. The network spread index (NSi) is alsoaddressed by UNCTAD (1998). The aforementioned studies employ subsidiaries as a measure of internationalization, butnot as a measure of organizational complexity, largely because the relationships between
subsidiaries are lacking. Subsidiaries do not stand alone in a given host country. Rather,they are woven into a web of ownership patterns that can be both broad and deep.Moreover, these hierarchical relationships exist both within and across borders. So whereastotal subsidiary base can be used as a measure of organizational complexity, the breadthand depth of that complexity, in addition to its cross-border character, provide muchgreater insight into issues of organizational structure (see also Chapter 4).Breadth refers to the ‘horizontal’ relationships within a firm’s corporate tree, primarily the number of first-level subsidiaries under the parent. These subsidiaries may representholdings, divisions, or completely distinct businesses, and the more there are the wider thescope of strategic considerations and strategic vision that must be managed within theorganization. Depth refers to the level of hierarchy in an organization – a relatively ‘shallow’ organization, with only first-level subsidiaries that fall directly under the globalparent will likely require less coordination effort than an organization whereby those first-level subsidiaries also have several levels, or layers, of subsidiaries below them.The cross-border character of the network is not simply the number of countries (networkspread) in which the company has subsidiaries. It refers rather to the likelihood that anygiven subsidiary falls under a subsidiary in a different country. Conceptually thatlikelihood can be equally high for a subsidiary base spread across two countries as for a subsidiary base spread across 20 countries; as such it is distinct from strict measurementsof subsidiary internationalization. Considered together, however, it remains plausible thatmore host countries has a ‘multiplier’ effect on complexity through the introduction of additional cultural, political and social exigencies that condition strategy. Subsidiary-based data can be complementary to asset- and sales data. Subsidiary data tendsto be more detailed than assets and sales, given at the level of individual countries(‘Luxembourg’) as opposed to geographic regions (‘Western Europe’) and thus refiningthe geographic spread based on assets and sales alone. At the same time subsidiary dataprovides virtually no information as to the size or importance of any given subsidiary, so the value or significance of its location can only be derived from the total number of subsidiaries in that location. For a sufficiently large sample, however, it can be expected
177
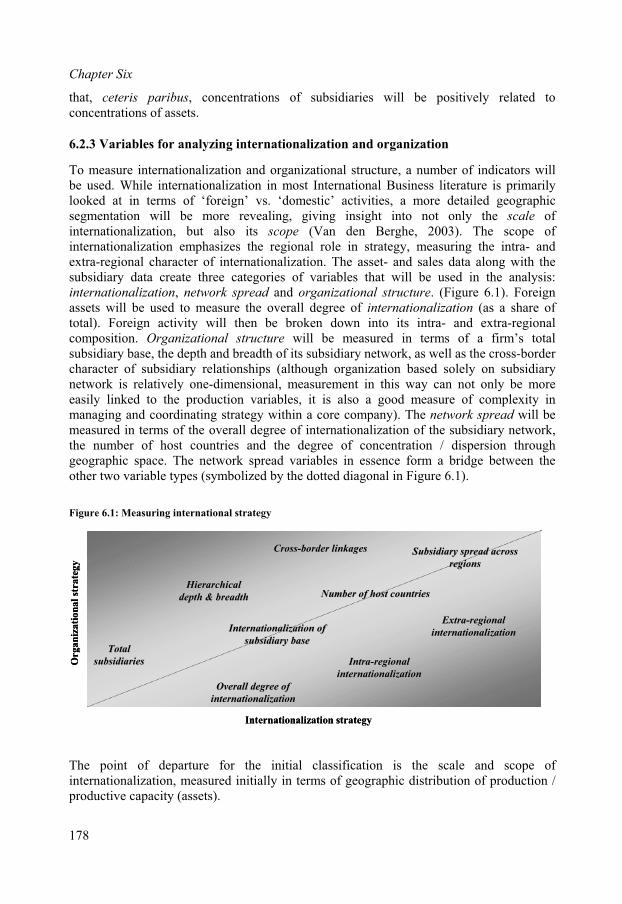
Chapter Six
that, ceteris paribus, concentrations of subsidiaries will be positively related toconcentrations of assets.
6.2.3 Variables for analyzing internationalization and organization
To measure internationalization and organizational structure, a number of indicators will be used. While internationalization in most International Business literature is primarilylooked at in terms of ‘foreign’ vs. ‘domestic’ activities, a more detailed geographic segmentation will be more revealing, giving insight into not only the scale of internationalization, but also its scope (Van den Berghe, 2003). The scope ofinternationalization emphasizes the regional role in strategy, measuring the intra- andextra-regional character of internationalization. The asset- and sales data along with thesubsidiary data create three categories of variables that will be used in the analysis:internationalization, network spread and organizational structure. (Figure 6.1). Foreignassets will be used to measure the overall degree of internationalization (as a share of total). Foreign activity will then be broken down into its intra- and extra-regionalcomposition. Organizational structure will be measured in terms of a firm’s totalsubsidiary base, the depth and breadth of its subsidiary network, as well as the cross-border character of subsidiary relationships (although organization based solely on subsidiarynetwork is relatively one-dimensional, measurement in this way can not only be moreeasily linked to the production variables, it is also a good measure of complexity inmanaging and coordinating strategy within a core company). The network spread will bemeasured in terms of the overall degree of internationalization of the subsidiary network,the number of host countries and the degree of concentration / dispersion throughgeographic space. The network spread variables in essence form a bridge between theother two variable types (symbolized by the dotted diagonal in Figure 6.1).
Figure 6.1: Measuring international strategy
The point of departure for the initial classification is the scale and scope ofinternationalization, measured initially in terms of geographic distribution of production / productive capacity (assets).
178
Org
an
iza
tio
na
l st
rate
gy
Internationalization strategy
Subsidiary spread acrossSubsidiary spread across
regionsregions
Number of host countriesNumber of host countries
Internationalization of Internationalization of
subsidiary basesubsidiary baseTotalTotal
subsidiariessubsidiaries
CrossCross--border linkagesborder linkages
Overall degree ofOverall degree of
internationalizationinternationalization
IntraIntra--regionalregional
internationalizationinternationalization
HierarchicalHierarchical
depth & breadthdepth & breadth
ExtraExtra--regionalregional
internationalizationinternationalization
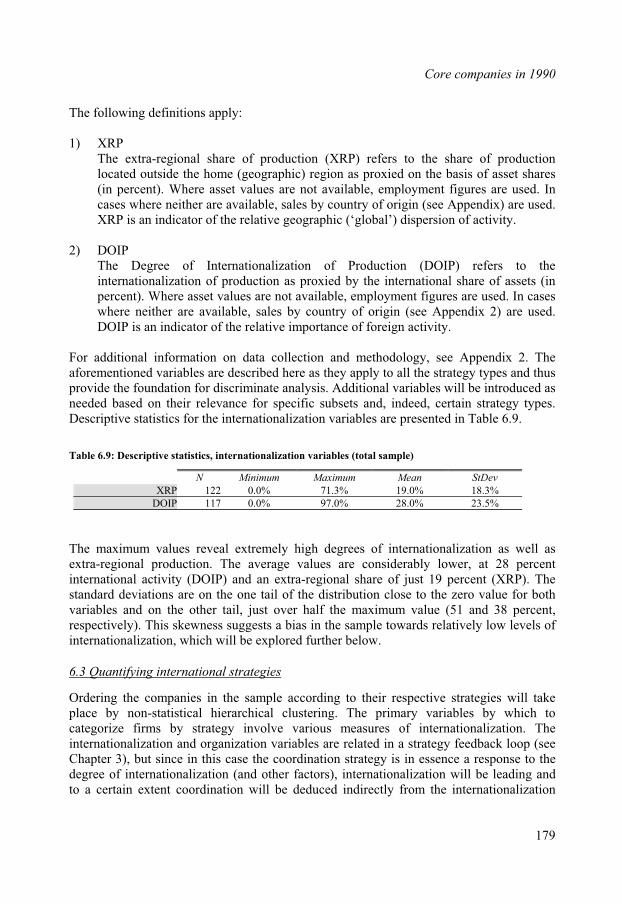
Core companies in 1990
The following definitions apply:
1) XRPThe extra-regional share of production (XRP) refers to the share of productionlocated outside the home (geographic) region as proxied on the basis of asset shares (in percent). Where asset values are not available, employment figures are used. In cases where neither are available, sales by country of origin (see Appendix) are used. XRP is an indicator of the relative geographic (‘global’) dispersion of activity.
2) DOIP The Degree of Internationalization of Production (DOIP) refers to theinternationalization of production as proxied by the international share of assets (inpercent). Where asset values are not available, employment figures are used. In caseswhere neither are available, sales by country of origin (see Appendix 2) are used.DOIP is an indicator of the relative importance of foreign activity.
For additional information on data collection and methodology, see Appendix 2. Theaforementioned variables are described here as they apply to all the strategy types and thusprovide the foundation for discriminate analysis. Additional variables will be introduced as needed based on their relevance for specific subsets and, indeed, certain strategy types.Descriptive statistics for the internationalization variables are presented in Table 6.9.
Table 6.9: Descriptive statistics, internationalization variables (total sample)
N Minimum Maximum Mean StDev
XRP 122 0.0% 71.3% 19.0% 18.3%
DOIP 117 0.0% 97.0% 28.0% 23.5%
The maximum values reveal extremely high degrees of internationalization as well as extra-regional production. The average values are considerably lower, at 28 percentinternational activity (DOIP) and an extra-regional share of just 19 percent (XRP). Thestandard deviations are on the one tail of the distribution close to the zero value for bothvariables and on the other tail, just over half the maximum value (51 and 38 percent,respectively). This skewness suggests a bias in the sample towards relatively low levels ofinternationalization, which will be explored further below.
6.3 Quantifying international strategies
Ordering the companies in the sample according to their respective strategies will take place by non-statistical hierarchical clustering. The primary variables by which to categorize firms by strategy involve various measures of internationalization. The internationalization and organization variables are related in a strategy feedback loop (see Chapter 3), but since in this case the coordination strategy is in essence a response to thedegree of internationalization (and other factors), internationalization will be leading andto a certain extent coordination will be deduced indirectly from the internationalization
179
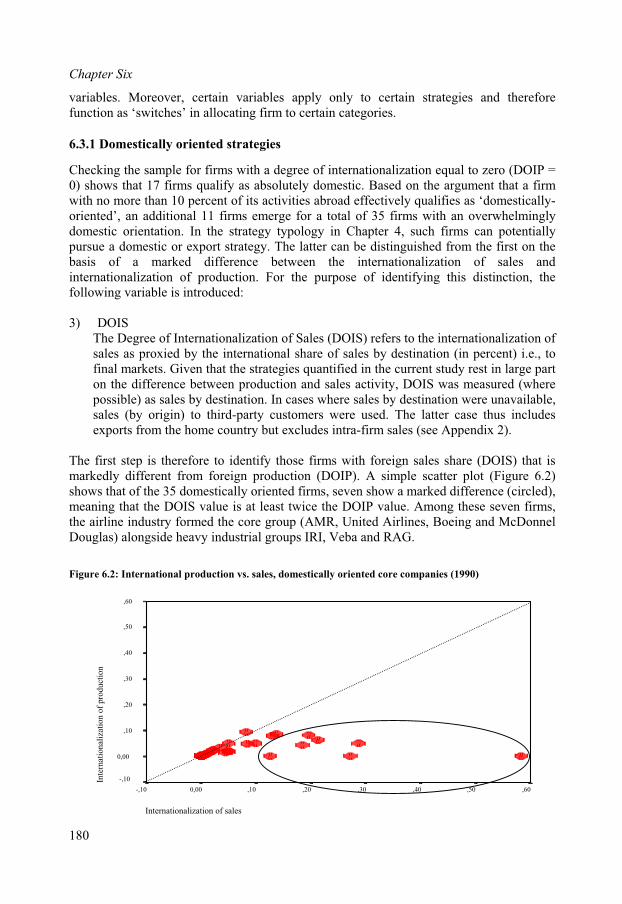
Chapter Six
variables. Moreover, certain variables apply only to certain strategies and thereforefunction as ‘switches’ in allocating firm to certain categories.
6.3.1 Domestically oriented strategies
Checking the sample for firms with a degree of internationalization equal to zero (DOIP =0) shows that 17 firms qualify as absolutely domestic. Based on the argument that a firmwith no more than 10 percent of its activities abroad effectively qualifies as ‘domestically-oriented’, an additional 11 firms emerge for a total of 35 firms with an overwhelminglydomestic orientation. In the strategy typology in Chapter 4, such firms can potentiallypursue a domestic or export strategy. The latter can be distinguished from the first on thebasis of a marked difference between the internationalization of sales andinternationalization of production. For the purpose of identifying this distinction, thefollowing variable is introduced:
3) DOIS The Degree of Internationalization of Sales (DOIS) refers to the internationalization ofsales as proxied by the international share of sales by destination (in percent) i.e., tofinal markets. Given that the strategies quantified in the current study rest in large parton the difference between production and sales activity, DOIS was measured (where possible) as sales by destination. In cases where sales by destination were unavailable,sales (by origin) to third-party customers were used. The latter case thus includesexports from the home country but excludes intra-firm sales (see Appendix 2).
The first step is therefore to identify those firms with foreign sales share (DOIS) that is markedly different from foreign production (DOIP). A simple scatter plot (Figure 6.2) shows that of the 35 domestically oriented firms, seven show a marked difference (circled),meaning that the DOIS value is at least twice the DOIP value. Among these seven firms,the airline industry formed the core group (AMR, United Airlines, Boeing and McDonnelDouglas) alongside heavy industrial groups IRI, Veba and RAG.
Figure 6.2: International production vs. sales, domestically oriented core companies (1990)
Internationalization of sales
,60,50,40,30,20,100,00-,10
Inte
rnat
ional
izat
ion o
f pro
duct
ion
,60
,50
,40
,30
,20
,10
0,00
-,10
180
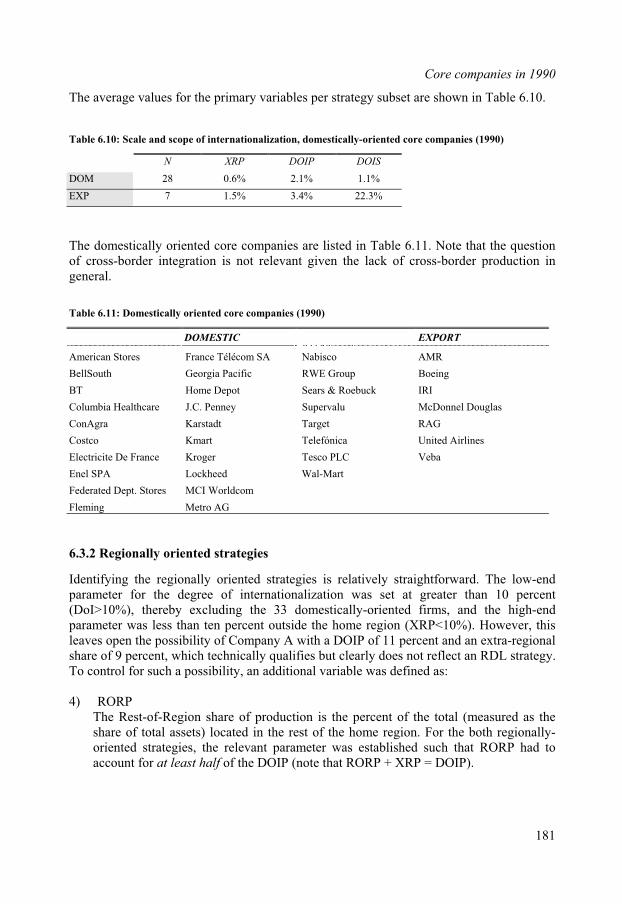
Core companies in 1990
The average values for the primary variables per strategy subset are shown in Table 6.10.
Table 6.10: Scale and scope of internationalization, domestically-oriented core companies (1990)
N XRP DOIP DOIS
DOM 28 0.6% 2.1% 1.1%
EXP 7 1.5% 3.4% 22.3%
The domestically oriented core companies are listed in Table 6.11. Note that the questionof cross-border integration is not relevant given the lack of cross-border production ingeneral.
Table 6.11: Domestically oriented core companies (1990)
DOMESTIC EXPORT
American Stores France Télécom SA Nabisco AMR
BellSouth Georgia Pacific RWE Group Boeing
BT Home Depot Sears & Roebuck IRI
Columbia Healthcare J.C. Penney Supervalu McDonnel Douglas
ConAgra Karstadt Target RAG
Costco Kmart Telefónica United Airlines
Electricite De France Kroger Tesco PLC Veba
Enel SPA Lockheed Wal-Mart
Federated Dept. Stores MCI Worldcom
Fleming Metro AG
6.3.2 Regionally oriented strategies
Identifying the regionally oriented strategies is relatively straightforward. The low-endparameter for the degree of internationalization was set at greater than 10 percent(DoI>10%), thereby excluding the 33 domestically-oriented firms, and the high-endparameter was less than ten percent outside the home region (XRP<10%). However, thisleaves open the possibility of Company A with a DOIP of 11 percent and an extra-regionalshare of 9 percent, which technically qualifies but clearly does not reflect an RDL strategy.To control for such a possibility, an additional variable was defined as:
4) RORP The Rest-of-Region share of production is the percent of the total (measured as theshare of total assets) located in the rest of the home region. For the both regionally-oriented strategies, the relevant parameter was established such that RORP had toaccount for at least half of the DOIP (note that RORP + XRP = DOIP).
181
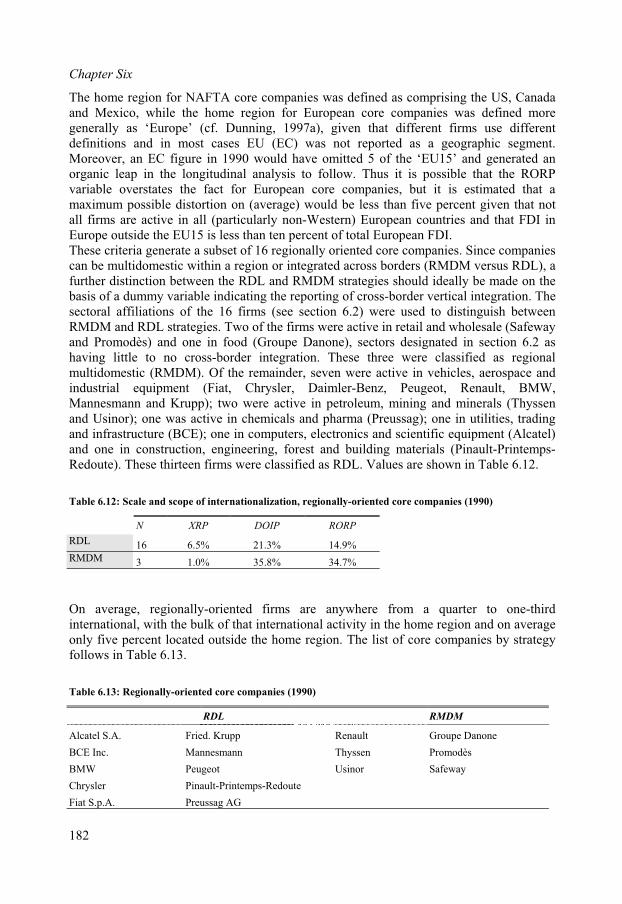
Chapter Six
The home region for NAFTA core companies was defined as comprising the US, Canadaand Mexico, while the home region for European core companies was defined moregenerally as ‘Europe’ (cf. Dunning, 1997a), given that different firms use differentdefinitions and in most cases EU (EC) was not reported as a geographic segment.Moreover, an EC figure in 1990 would have omitted 5 of the ‘EU15’ and generated an organic leap in the longitudinal analysis to follow. Thus it is possible that the RORP variable overstates the fact for European core companies, but it is estimated that a maximum possible distortion on (average) would be less than five percent given that notall firms are active in all (particularly non-Western) European countries and that FDI inEurope outside the EU15 is less than ten percent of total European FDI. These criteria generate a subset of 16 regionally oriented core companies. Since companiescan be multidomestic within a region or integrated across borders (RMDM versus RDL), afurther distinction between the RDL and RMDM strategies should ideally be made on thebasis of a dummy variable indicating the reporting of cross-border vertical integration. Thesectoral affiliations of the 16 firms (see section 6.2) were used to distinguish between RMDM and RDL strategies. Two of the firms were active in retail and wholesale (Safeway and Promodès) and one in food (Groupe Danone), sectors designated in section 6.2 as having little to no cross-border integration. These three were classified as regionalmultidomestic (RMDM). Of the remainder, seven were active in vehicles, aerospace and industrial equipment (Fiat, Chrysler, Daimler-Benz, Peugeot, Renault, BMW,Mannesmann and Krupp); two were active in petroleum, mining and minerals (Thyssenand Usinor); one was active in chemicals and pharma (Preussag); one in utilities, tradingand infrastructure (BCE); one in computers, electronics and scientific equipment (Alcatel)and one in construction, engineering, forest and building materials (Pinault-Printemps-Redoute). These thirteen firms were classified as RDL. Values are shown in Table 6.12.
Table 6.12: Scale and scope of internationalization, regionally-oriented core companies (1990)
N XRP DOIP RORP
RDL 16 6.5% 21.3% 14.9%
RMDM 3 1.0% 35.8% 34.7%
On average, regionally-oriented firms are anywhere from a quarter to one-thirdinternational, with the bulk of that international activity in the home region and on averageonly five percent located outside the home region. The list of core companies by strategyfollows in Table 6.13.
Table 6.13: Regionally-oriented core companies (1990)
RDL RMDM
Alcatel S.A. Fried. Krupp Renault Groupe Danone
BCE Inc. Mannesmann Thyssen Promodès
BMW Peugeot Usinor Safeway
Chrysler Pinault-Printemps-Redoute
Fiat S.p.A. Preussag AG
182
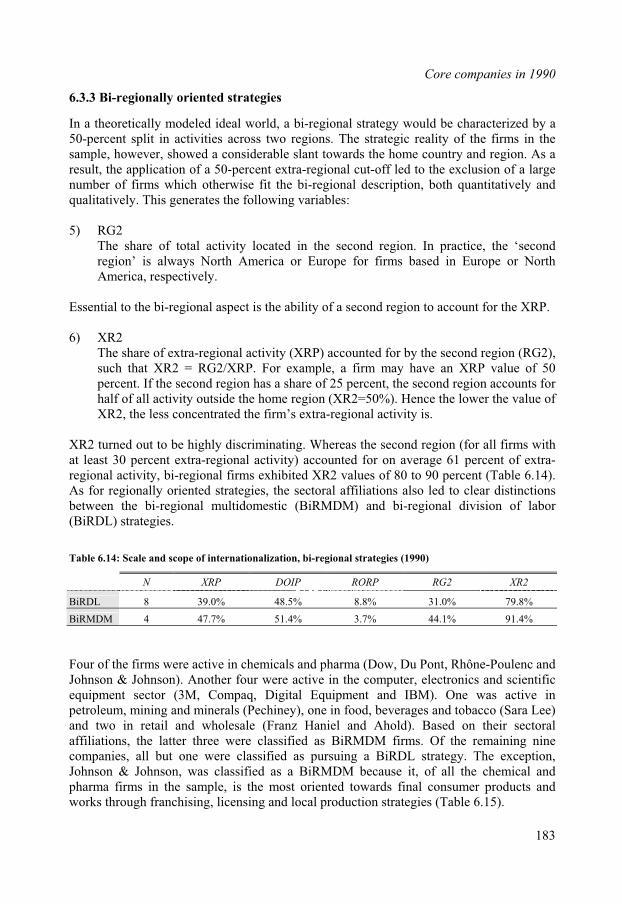
Core companies in 1990
6.3.3 Bi-regionally oriented strategies
In a theoretically modeled ideal world, a bi-regional strategy would be characterized by a50-percent split in activities across two regions. The strategic reality of the firms in thesample, however, showed a considerable slant towards the home country and region. As aresult, the application of a 50-percent extra-regional cut-off led to the exclusion of a largenumber of firms which otherwise fit the bi-regional description, both quantitatively andqualitatively. This generates the following variables:
5) RG2The share of total activity located in the second region. In practice, the ‘second region’ is always North America or Europe for firms based in Europe or NorthAmerica, respectively.
Essential to the bi-regional aspect is the ability of a second region to account for the XRP.
6) XR2The share of extra-regional activity (XRP) accounted for by the second region (RG2),such that XR2 = RG2/XRP. For example, a firm may have an XRP value of 50percent. If the second region has a share of 25 percent, the second region accounts forhalf of all activity outside the home region (XR2=50%). Hence the lower the value of XR2, the less concentrated the firm’s extra-regional activity is.
XR2 turned out to be highly discriminating. Whereas the second region (for all firms withat least 30 percent extra-regional activity) accounted for on average 61 percent of extra-regional activity, bi-regional firms exhibited XR2 values of 80 to 90 percent (Table 6.14). As for regionally oriented strategies, the sectoral affiliations also led to clear distinctionsbetween the bi-regional multidomestic (BiRMDM) and bi-regional division of labor(BiRDL) strategies.
Table 6.14: Scale and scope of internationalization, bi-regional strategies (1990)
N XRP DOIP RORP RG2 XR2
BiRDL 8 39.0% 48.5% 8.8% 31.0% 79.8%
BiRMDM 4 47.7% 51.4% 3.7% 44.1% 91.4%
Four of the firms were active in chemicals and pharma (Dow, Du Pont, Rhône-Poulenc andJohnson & Johnson). Another four were active in the computer, electronics and scientificequipment sector (3M, Compaq, Digital Equipment and IBM). One was active in petroleum, mining and minerals (Pechiney), one in food, beverages and tobacco (Sara Lee)and two in retail and wholesale (Franz Haniel and Ahold). Based on their sectoralaffiliations, the latter three were classified as BiRMDM firms. Of the remaining ninecompanies, all but one were classified as pursuing a BiRDL strategy. The exception,Johnson & Johnson, was classified as a BiRMDM because it, of all the chemical andpharma firms in the sample, is the most oriented towards final consumer products andworks through franchising, licensing and local production strategies (Table 6.15).
183
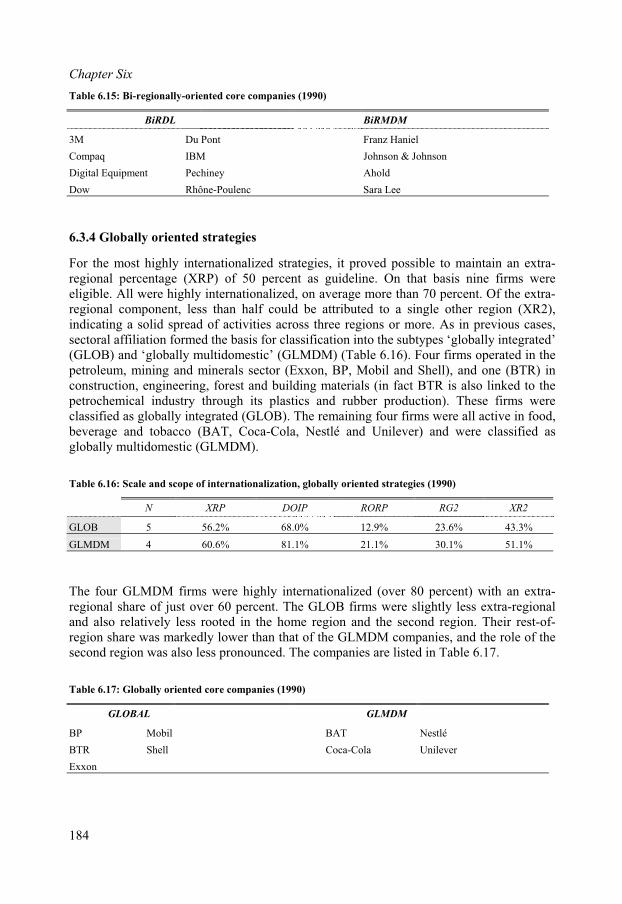
Chapter Six
Table 6.15: Bi-regionally-oriented core companies (1990)
BiRDL BiRMDM
3M Du Pont Franz Haniel
Compaq IBM Johnson & Johnson
Digital Equipment Pechiney Ahold
Dow Rhône-Poulenc Sara Lee
6.3.4 Globally oriented strategies
For the most highly internationalized strategies, it proved possible to maintain an extra-regional percentage (XRP) of 50 percent as guideline. On that basis nine firms were eligible. All were highly internationalized, on average more than 70 percent. Of the extra-regional component, less than half could be attributed to a single other region (XR2),indicating a solid spread of activities across three regions or more. As in previous cases,sectoral affiliation formed the basis for classification into the subtypes ‘globally integrated’(GLOB) and ‘globally multidomestic’ (GLMDM) (Table 6.16). Four firms operated in thepetroleum, mining and minerals sector (Exxon, BP, Mobil and Shell), and one (BTR) inconstruction, engineering, forest and building materials (in fact BTR is also linked to thepetrochemical industry through its plastics and rubber production). These firms were classified as globally integrated (GLOB). The remaining four firms were all active in food,beverage and tobacco (BAT, Coca-Cola, Nestlé and Unilever) and were classified as globally multidomestic (GLMDM).
Table 6.16: Scale and scope of internationalization, globally oriented strategies (1990)
N XRP DOIP RORP RG2 XR2
GLOB 5 56.2% 68.0% 12.9% 23.6% 43.3%
GLMDM 4 60.6% 81.1% 21.1% 30.1% 51.1%
The four GLMDM firms were highly internationalized (over 80 percent) with an extra-regional share of just over 60 percent. The GLOB firms were slightly less extra-regionaland also relatively less rooted in the home region and the second region. Their rest-of-region share was markedly lower than that of the GLMDM companies, and the role of thesecond region was also less pronounced. The companies are listed in Table 6.17.
Table 6.17: Globally oriented core companies (1990)
GLOBAL GLMDM
BP Mobil BAT Nestlé
BTR Shell Coca-Cola Unilever
Exxon
184
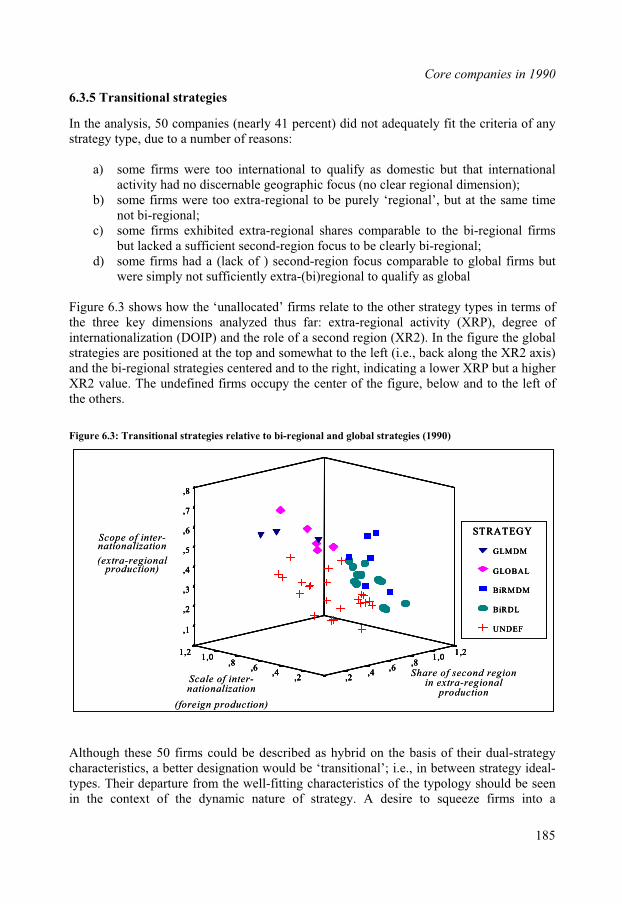
Core companies in 1990
6.3.5 Transitional strategies
In the analysis, 50 companies (nearly 41 percent) did not adequately fit the criteria of anystrategy type, due to a number of reasons:
a) some firms were too international to qualify as domestic but that internationalactivity had no discernable geographic focus (no clear regional dimension);
b) some firms were too extra-regional to be purely ‘regional’, but at the same timenot bi-regional;
c) some firms exhibited extra-regional shares comparable to the bi-regional firmsbut lacked a sufficient second-region focus to be clearly bi-regional;
d) some firms had a (lack of ) second-region focus comparable to global firms butwere simply not sufficiently extra-(bi)regional to qualify as global
Figure 6.3 shows how the ‘unallocated’ firms relate to the other strategy types in terms of the three key dimensions analyzed thus far: extra-regional activity (XRP), degree of internationalization (DOIP) and the role of a second region (XR2). In the figure the globalstrategies are positioned at the top and somewhat to the left (i.e., back along the XR2 axis)and the bi-regional strategies centered and to the right, indicating a lower XRP but a higherXR2 value. The undefined firms occupy the center of the figure, below and to the left of the others.
Figure 6.3: Transitional strategies relative to bi-regional and global strategies (1990)
lthough these 50 firms could be described as hybrid on the basis of their dual-strategyharacteristics, a better designation would be ‘transitional’; i.e., in between strategy ideal-
Actypes. Their departure from the well-fitting characteristics of the typology should be seenin the context of the dynamic nature of strategy. A desire to squeeze firms into a
STRATEGY
GLMDM
GLOBAL
BiRMDM
BiRDL
UNDEF
Scope of inter-nationalization
(extra-regionalproduction)
Scale of inter-nationalization
(foreign production)
1,21,2
,1
,2
,3
1,01,0
,4
,5
,6
,7
,8,8
,8
,6,6,4,4
,2,2
1,21,2
,1
,2
,3
1,01,0
,4
,5
,6
,7
,8,8
,8
,6,6,4,4
,2,2Share of second region
in extra-regionalproduction
STRATEGY
GLMDM
GLOBAL
BiRMDM
BiRDL
UNDEF
STRATEGY
GLMDM
GLOBAL
BiRMDM
BiRDL
UNDEF
Scope of inter-nationalization
(extra-regionalproduction)
Scale of inter-nationalization
(foreign production)
1,21,2
,1
,2
,3
1,01,0
,4
,5
,6
,7
,8,8
,8
,6,6,4,4
,2,2
1,21,2
,1
,2
,3
1,01,0
,4
,5
,6
,7
,8,8
,8
,6,6,4,4
,2,2Share of second region
in extra-regionalproduction
185
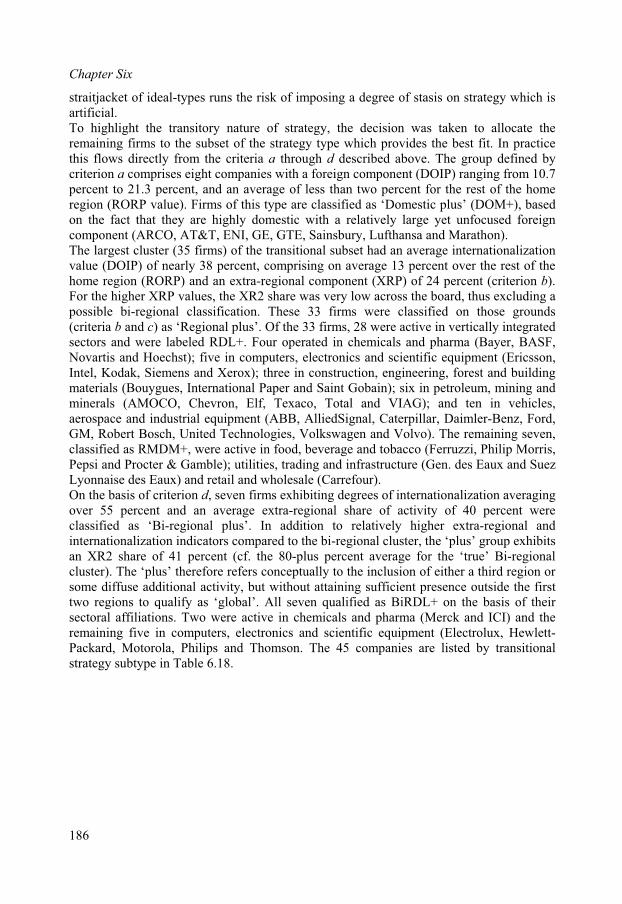
Chapter Six
straitjacket of ideal-types runs the risk of imposing a degree of stasis on strategy which isartificial.To highlight the transitory nature of strategy, the decision was taken to allocate theremaining firms to the subset of the strategy type which provides the best fit. In practice
t of the
activity of 40 percent were
this flows directly from the criteria a through d described above. The group defined bycriterion a comprises eight companies with a foreign component (DOIP) ranging from 10.7 percent to 21.3 percent, and an average of less than two percent for the rest of the homeregion (RORP value). Firms of this type are classified as ‘Domestic plus’ (DOM+), based on the fact that they are highly domestic with a relatively large yet unfocused foreigncomponent (ARCO, AT&T, ENI, GE, GTE, Sainsbury, Lufthansa and Marathon).The largest cluster (35 firms) of the transitional subset had an average internationalizationvalue (DOIP) of nearly 38 percent, comprising on average 13 percent over the reshome region (RORP) and an extra-regional component (XRP) of 24 percent (criterion b).For the higher XRP values, the XR2 share was very low across the board, thus excluding apossible bi-regional classification. These 33 firms were classified on those grounds(criteria b and c) as ‘Regional plus’. Of the 33 firms, 28 were active in vertically integratedsectors and were labeled RDL+. Four operated in chemicals and pharma (Bayer, BASF,Novartis and Hoechst); five in computers, electronics and scientific equipment (Ericsson,Intel, Kodak, Siemens and Xerox); three in construction, engineering, forest and buildingmaterials (Bouygues, International Paper and Saint Gobain); six in petroleum, mining andminerals (AMOCO, Chevron, Elf, Texaco, Total and VIAG); and ten in vehicles,aerospace and industrial equipment (ABB, AlliedSignal, Caterpillar, Daimler-Benz, Ford, GM, Robert Bosch, United Technologies, Volkswagen and Volvo). The remaining seven, classified as RMDM+, were active in food, beverage and tobacco (Ferruzzi, Philip Morris, Pepsi and Procter & Gamble); utilities, trading and infrastructure (Gen. des Eaux and SuezLyonnaise des Eaux) and retail and wholesale (Carrefour).On the basis of criterion d, seven firms exhibiting degrees of internationalization averagingover 55 percent and an average extra-regional share ofclassified as ‘Bi-regional plus’. In addition to relatively higher extra-regional andinternationalization indicators compared to the bi-regional cluster, the ‘plus’ group exhibitsan XR2 share of 41 percent (cf. the 80-plus percent average for the ‘true’ Bi-regional cluster). The ‘plus’ therefore refers conceptually to the inclusion of either a third region orsome diffuse additional activity, but without attaining sufficient presence outside the firsttwo regions to qualify as ‘global’. All seven qualified as BiRDL+ on the basis of theirsectoral affiliations. Two were active in chemicals and pharma (Merck and ICI) and theremaining five in computers, electronics and scientific equipment (Electrolux, Hewlett-Packard, Motorola, Philips and Thomson. The 45 companies are listed by transitionalstrategy subtype in Table 6.18.
186
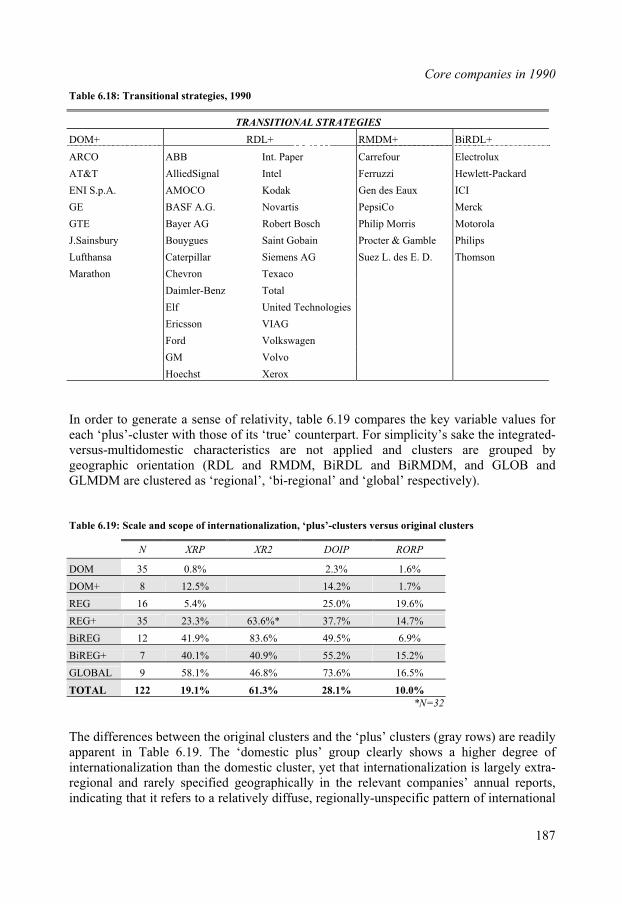
Core companies in 1990
Table 6.18: Transitional strategies, 1990
SITIONAL STRATEGIESTRAN
DOM+ RDL+ + BiRDL+RMDM
ARCO ABB PaperInt. Carrefour Electrolux
AT&T AlliedSignal kardIntel Ferruzzi Hewlett-Pac
ENI S.p.A. auxAMOCO Kodak Gen des E ICI
GE BASF A.G. Novartis PepsiCo Merck
GTE sch Philip rris aBayer AG Robert Bo Mo Motorol
J.Sainsbury bleBouygues Saint Gobain Procter & Gam Philips
Lufthansa Caterpillar Siemens AG Suez L. des E. D. Thomson
Marathon Chevron Texaco
Daimler-Benz Total
Elf United Technologies
Ericsson VIAG
Ford Volkswagen
GM Volvo
Hoechst Xerox
In order to generate a sense of relativity, table 6.19 compares the key variable values for
able 6.19: Scale and scope of internationalization, ‘plus’-clusters versus original clusters
each ‘plus’-cluster with those of its ‘true’ counterpart. For simplicity’s sake the integrated-versus-multidomestic characteristics are not applied and clusters are grouped bygeographic orientation (RDL and RMDM, BiRDL and BiRMDM, and GLOB andGLMDM are clustered as ‘regional’, ‘bi-regional’ and ‘global’ respectively).
T
N XRP XR2 DOIP RORP
DOM 35 0.8% 2.3% 1.6%
DOM+ 8 12.5% 14.2% 1.7%
REG 16 5.4% 25.0% 19.6%
REG+ 35 23.3% 63. *6% 37.7% 14.7%
BiREG 12 41.9% 83.6% 49.5% 6.9%
BiREG+ 7 40.1% 40.9% 55.2% 15.2%
GLOBAL 9 58.1% 46.8% 73.6% 16.5%
TOTAL 122 19.1% 61.3% 28.1% 10.0%
32*N=
The differenc s between the iginal clusters and the ‘plus’ clusters (gray rows) are readilye orapparent in Table 6.19. The ‘domestic plus’ group clearly shows a higher degree of internationalization than the domestic cluster, yet that internationalization is largely extra-regional and rarely specified geographically in the relevant companies’ annual reports,indicating that it refers to a relatively diffuse, regionally-unspecific pattern of international
187
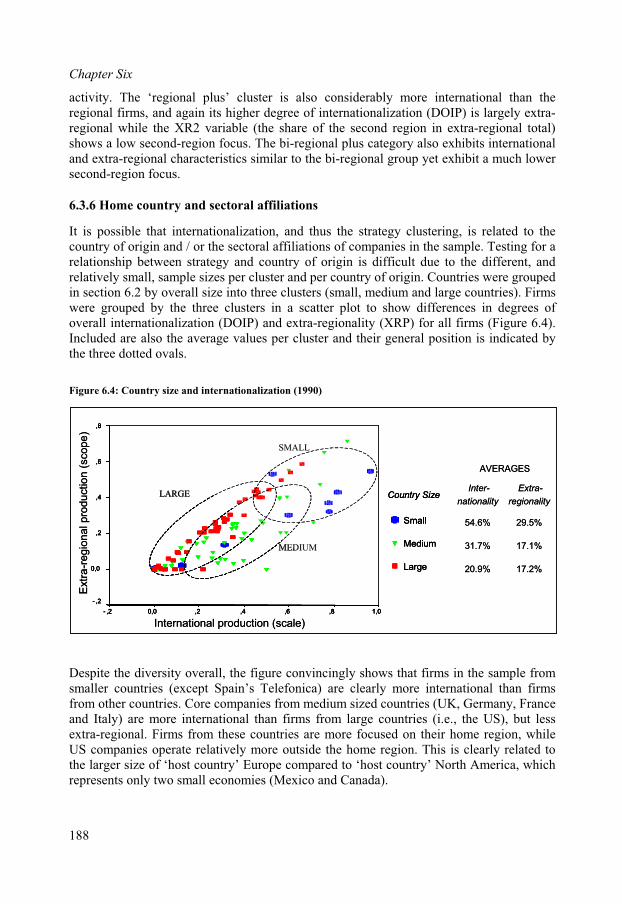
Chapter Six
activity. The ‘regional plus’ cluster is also considerably more international than theregional firms, and again its higher degree of internationalization (DOIP) is largely extra-regional while the XR2 variable (the share of the second region in extra-regional total)shows a low second-region focus. The bi-regional plus category also exhibits internationaland extra-regional characteristics similar to the bi-regional group yet exhibit a much lowersecond-region focus.
6.3.6 Home country and sectoral affiliations
the strategy clustering, is related to thepanies in the sample. Testing for a
internationalization (1990)
espite the diversity overall, the figure convincingly shows that firms in the sample fromaller countries (except Spain’s Telefonica) are clearly more international than firms
International production (scale)
Ext
ra-r
egio
na
l pro
duct
ion (
sco
pe
)
1,0,8,6,4,20,0- ,2
,6
,4
,2
0,0
- ,2
It is possible that internationalization, and thuscountry of origin and / or the sectoral affiliations of comrelationship between strategy and country of origin is difficult due to the different, andrelatively small, sample sizes per cluster and per country of origin. Countries were grouped in section 6.2 by overall size into three clusters (small, medium and large countries). Firmswere grouped by the three clusters in a scatter plot to show differences in degrees of overall internationalization (DOIP) and extra-regionality (XRP) for all firms (Figure 6.4).Included are also the average values per cluster and their general position is indicated bythe three dotted ovals.
igure 6.4: Country size andF
Dsmfrom other countries. Core companies from medium sized countries (UK, Germany, France and Italy) are more international than firms from large countries (i.e., the US), but lessextra-regional. Firms from these countries are more focused on their home region, whileUS companies operate relatively more outside the home region. This is clearly related tothe larger size of ‘host country’ Europe compared to ‘host country’ North America, whichrepresents only two small economies (Mexico and Canada).
,8
1,0,8,6,4,20,0- ,2
,6
,4
,2
0,0
- ,2
,8
LARGELARGE
MEDIUMMEDIUM
SMALLSMALL
Country Size
Small
Medium
Large
AVERAGES
Inter-
nationality
54.6%
31.7%
20.9%
Extra-
regionality
29.5%
17.1%
17.2%
International production (scale)
Ext
ra-r
egio
na
l pro
duct
ion (
sco
pe
)
1,0,8,6,4,20,0- ,2
,6
,4
,2
0,0
- ,2
,8
1,0,8,6,4,20,0- ,2
,6
,4
,2
0,0
- ,2
,8
LARGELARGE
MEDIUMMEDIUM
SMALLSMALL
Country Size
Small
Medium
Large
Country Size
Small
Medium
Large
AVERAGES
Inter-
nationality
54.6%
31.7%
20.9%
Extra-
regionality
29.5%
17.1%
17.2%
188
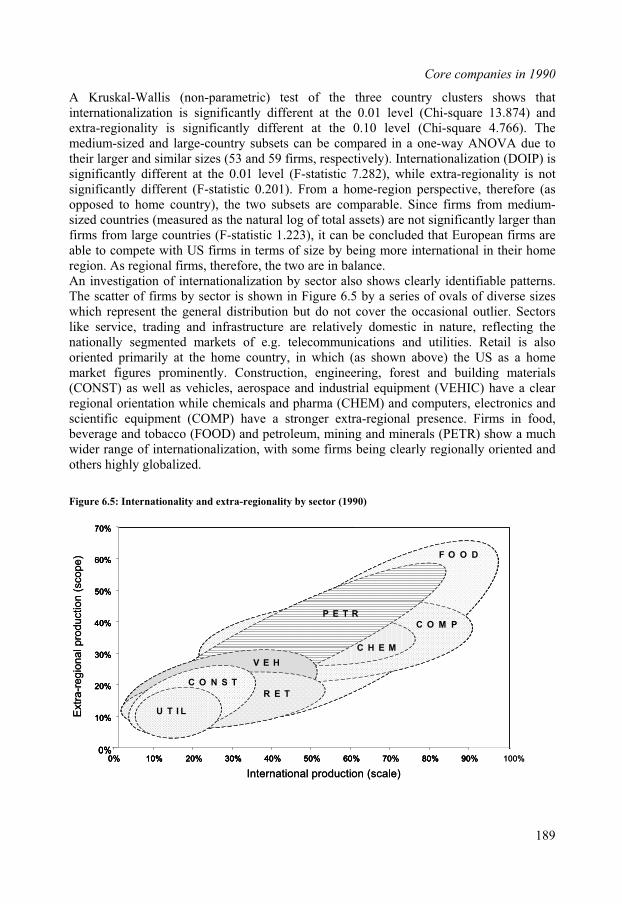
Core companies in 1990
A Kruskal-Wallis (non-parametric) test of the three country clusters shows thatinternationalization is significantly different at the 0.01 level (Chi-square 13.874) and
eries of ovals of diverse sizes
extra-regionality by sector (1990)
extra-regionality is significantly different at the 0.10 level (Chi-square 4.766). The medium-sized and large-country subsets can be compared in a one-way ANOVA due totheir larger and similar sizes (53 and 59 firms, respectively). Internationalization (DOIP) is significantly different at the 0.01 level (F-statistic 7.282), while extra-regionality is notsignificantly different (F-statistic 0.201). From a home-region perspective, therefore (as opposed to home country), the two subsets are comparable. Since firms from medium-sized countries (measured as the natural log of total assets) are not significantly larger thanfirms from large countries (F-statistic 1.223), it can be concluded that European firms areable to compete with US firms in terms of size by being more international in their homeregion. As regional firms, therefore, the two are in balance.An investigation of internationalization by sector also shows clearly identifiable patterns.The scatter of firms by sector is shown in Figure 6.5 by a swhich represent the general distribution but do not cover the occasional outlier. Sectors like service, trading and infrastructure are relatively domestic in nature, reflecting thenationally segmented markets of e.g. telecommunications and utilities. Retail is alsooriented primarily at the home country, in which (as shown above) the US as a homemarket figures prominently. Construction, engineering, forest and building materials(CONST) as well as vehicles, aerospace and industrial equipment (VEHIC) have a clear regional orientation while chemicals and pharma (CHEM) and computers, electronics andscientific equipment (COMP) have a stronger extra-regional presence. Firms in food, beverage and tobacco (FOOD) and petroleum, mining and minerals (PETR) show a muchwider range of internationalization, with some firms being clearly regionally oriented and others highly globalized.
igure 6.5: Internationality andF
V E H
U T I L
C O N S T
R E T
P E T R
F O O D
C O M P
C H E M
V E H
U T I L
C O N S T
R E T
P E T R
F O O D
C O M P
C H E M
0%0% 10% 20% 30% 40% 50% 60% 70% 80% 90%
International production (scale)
0%0% 10% 20% 30% 40% 50% 60% 70% 80% 90%
10%
20%
30%
40%
50%
60%
70%
10%
20%
30%
40%
50%
60%
Extr
a-r
egio
nal pro
ductio
n (
scope)
70%
100%
V E H
U T I L
C O N S T
R E T
P E T R
F O O D
C O M P
C H E M
V E H
U T I L
C O N S T
R E T
P E T R
F O O D
C O M P
C H E M
0%0% 10% 20% 30% 40% 50% 60% 70% 80% 90%
International production (scale)
0%0% 10% 20% 30% 40% 50% 60% 70% 80% 90%
10%
20%
30%
40%
50%
60%
70%
10%
20%
30%
40%
50%
60%
Extr
a-r
egio
nal pro
ductio
n (
scope)
70%
100%
189
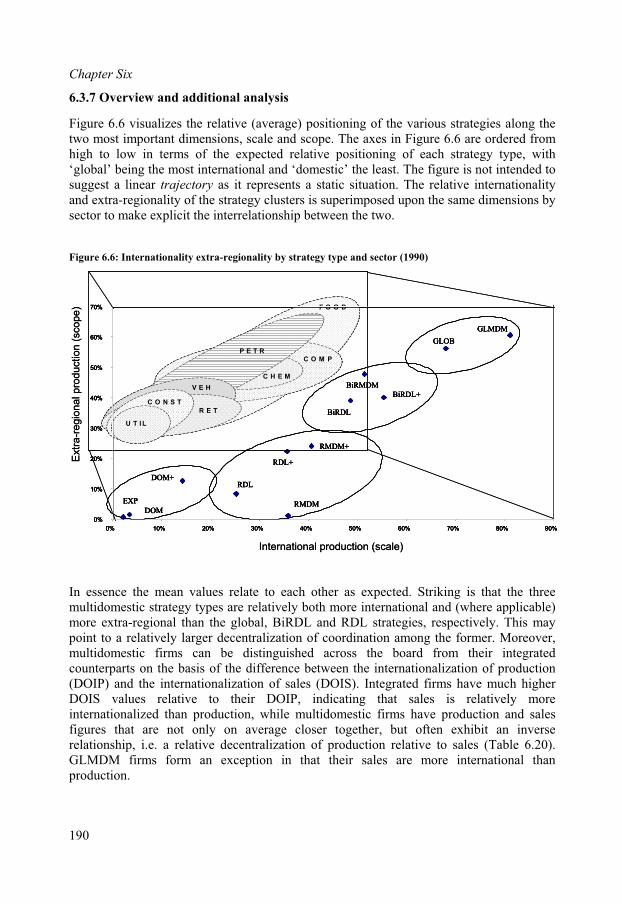
Chapter Six
6.3.7 Overview and additional analysis
gure 6.6 visualizes the relative (average) positioning of the various strategies along thescope. The axes in Figure 6.6 are ordered from
tive positioning of each strategy type, with
nd (where applicable)ore extra-regional than the global, BiRDL and RDL strategies, respectively. This may
oint to a relatively larger decentralization of coordination among the former. Moreover,
Fitwo most important dimensions, scale andhigh to low in terms of the expected rela‘global’ being the most international and ‘domestic’ the least. The figure is not intended tosuggest a linear trajectory as it represents a static situation. The relative internationalityand extra-regionality of the strategy clusters is superimposed upon the same dimensions by sector to make explicit the interrelationship between the two.
Figure 6.6: Internationality extra-regionality by strategy type and sector (1990)
V E H
U T I L
C O N S T
R E T
P E T R
F O O D
C O M P
C H E M
V E H
U T I L
C O N S T
R E T
P E T R
F O O D
C O M P
C H E M
0%
10%
20%
30%
40%
50%
60%
70%
0% 10% 20% 30% 40% 50% 60% 70% 80% 90%
EXP
DOM
RDLDOM+
RMDM
RDL+
RMDM+
BiRDL
BiRDL+
GLOB
GLMDM
BiRMDM
Extr
a-r
egio
nal pro
ductio
n (
scope)
0%
10%
20%
30%
40%
50%
60%
70%
0% 10% 20% 30% 40% 50% 60% 70% 80% 90%
EXP
DOM
RDLDOM+
RMDM
RDL+
RMDM+
BiRDL
BiRDL+
GLOB
GLMDM
BiRMDM
International production (scale)
V E H
U T I L
C O N S T
R E T
P E T R
F O O D
C O M P
C H E M
V E H
U T I L
C O N S T
R E T
P E T R
F O O D
C O M P
C H E M
0%
10%
20%
30%
40%
50%
60%
70%
0% 10% 20% 30% 40% 50% 60% 70% 80% 90%
EXP
DOM
RDLDOM+
RMDM
RDL+
RMDM+
BiRDL
BiRDL+
GLOB
GLMDM
BiRMDM
Extr
a-r
egio
nal pro
ductio
n (
scope)
0%
10%
20%
30%
40%
50%
60%
70%
0% 10% 20% 30% 40% 50% 60% 70% 80% 90%
EXP
DOM
RDLDOM+
RMDM
RDL+
RMDM+
BiRDL
BiRDL+
GLOB
GLMDM
BiRMDM
International production (scale)
In essence the mean values relate to each other as expected. Striking is that the threemultidomestic strategy types are relatively both more international ampmultidomestic firms can be distinguished across the board from their integratedcounterparts on the basis of the difference between the internationalization of production(DOIP) and the internationalization of sales (DOIS). Integrated firms have much higherDOIS values relative to their DOIP, indicating that sales is relatively moreinternationalized than production, while multidomestic firms have production and salesfigures that are not only on average closer together, but often exhibit an inverserelationship, i.e. a relative decentralization of production relative to sales (Table 6.20). GLMDM firms form an exception in that their sales are more international thanproduction.
190
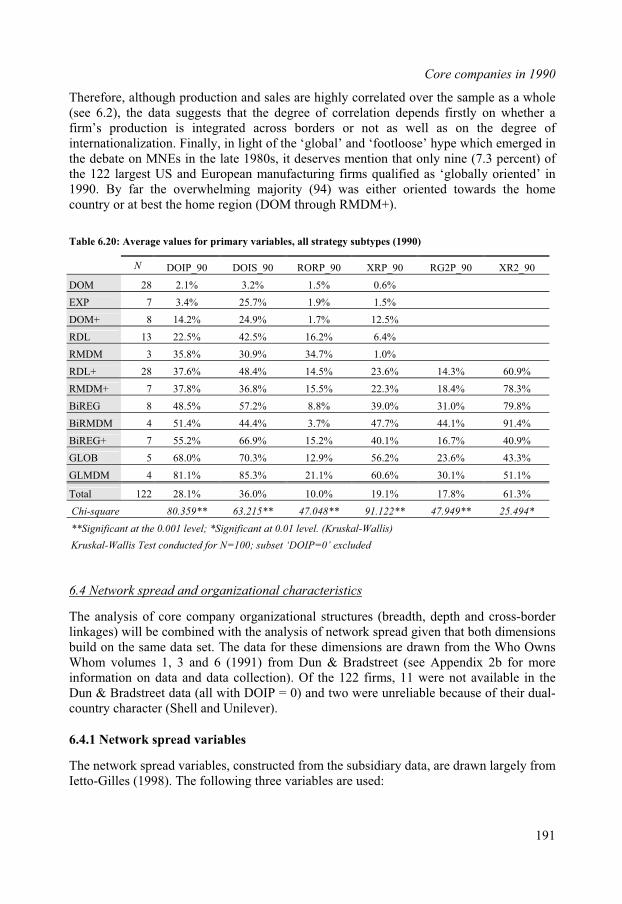
Core companies in 1990
Therefore, although production and sales are highly correlated over the sample as a whole(see 6.2), the data suggests that the degree of correlation depends firstly on whether afirm’s production is integrated across borders or not as well as on the degree of
N DOIP_90 DOIS_90 RORP_90 XRP_90 RG2P_90 XR2_90
internationalization. Finally, in light of the ‘global’ and ‘footloose’ hype which emerged inthe debate on MNEs in the late 1980s, it deserves mention that only nine (7.3 percent) of the 122 largest US and European manufacturing firms qualified as ‘globally oriented’ in1990. By far the overwhelming majority (94) was either oriented towards the homecountry or at best the home region (DOM through RMDM+).
Table 6.20: Average values for primary variables, all strategy subtypes (1990)
DOM 28 2.1% 3.2% 1.5% 0.6%
EXP 7 3.4% 25.7% 1.9% 1.5%
DOM+ 8 14.2% 24.9% 1.7% 12.5%
RDL 13 22.5% 42.5% 16.2% 6.4%
RMDM 3 35.8% 30.9% 34.7% 1.0%
RDL+ 2 14. % 60. %8 37.6% 48.4% 14.5% 23.6% 3 9
RMDM+ 7 37.8% 36.8% 15.5% 22.3% 18. % 78. %4 3
BiREG 8 48.5% 57.2% 8.8% 39.0% 31. % 79. %0 8
BiRMDM 4 51.4% 44.4% 3.7% 47.7% 44.1% 91.4%
BiREG+ 7 55.2% 66.9% 15.2% 40.1% 16.7% 40.9%
GLOB 5 68.0% 70.3% 12.9% 56.2% 23.6% 43.3%
GLMDM 4 81.1% 85.3% 21.1% 60.6% 30.1% 51.1%
Total 122 28.1% 36.0% 10.0% 19.1% 17.8% 61.3%
Chi-square 8 6 4 9 40.359** 3.215** 7.048** 1.122** 7.949** 25.494*
**Significant at t 0.0 *Signi 0.01 le skal-Whe 01 level; ficant at vel. (Kru allis)
Kruskal-Wallis Test conducted for N=1 et ‘DO xcluded00; subs IP=0’ e
6.4 Network spread and organizational characteristics
The analysis of core company organizational structures (breadth, depth and cross-border spread given that both dimensions
from the Who Owns
d from the subsidiary data, are drawn largely fromIetto-Gilles (1998). The following three variables are used:
linkages) will be combined with the analysis of networkbuild on the same data set. The data for these dimensions are drawn Whom volumes 1, 3 and 6 (1991) from Dun & Bradstreet (see Appendix 2b for moreinformation on data and data collection). Of the 122 firms, 11 were not available in theDun & Bradstreet data (all with DOIP = 0) and two were unreliable because of their dual-country character (Shell and Unilever).
6.4.1 Network spread variables
The network spread variables, constructe
191
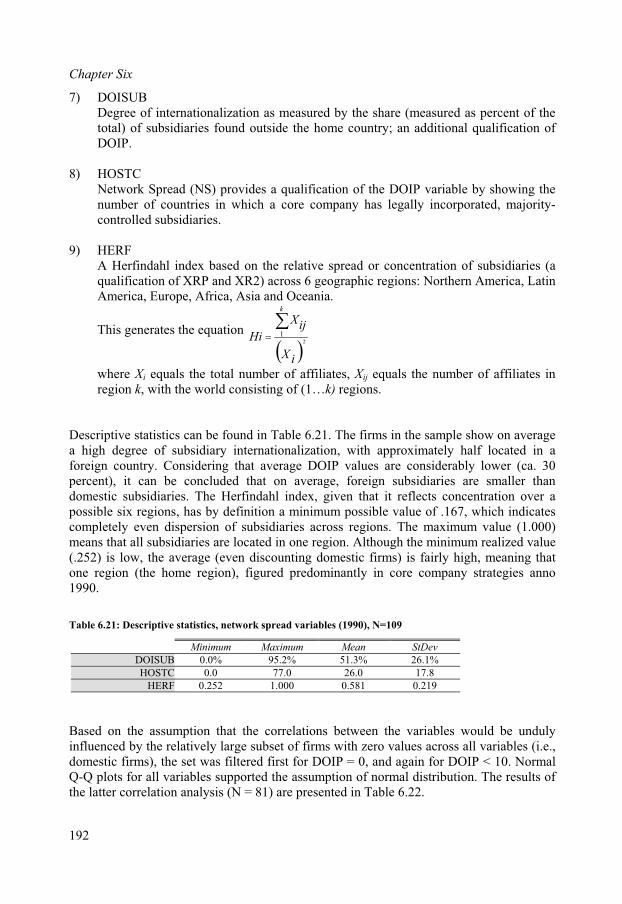
Chapter Six
7) DOISUB Degree of internationalization as measured by the share (measured as percent of the total) of subsidiaries found outside the home country; an additional qualification of DOIP.
8) HOSTC Network Spread (NS) provides a qualification of the DOIP variable by showing thenumber of countries in which a core company has legally incorporated, majority-controlled subsidiaries.
Asia and Oceania.
9) HERFA Herfindahl index based on the relative spread or concentration of subsidiaries (a qualification of XRP and XR2) across 6 geographic regions: Northern America, LatinAmerica, Europe, Africa,
This generates the equation
iX
Hi2
1
where X
ijXk
, Xij equals the number of affiliates inregion k, with the world consisting of (1…k) regions.
Descri ata higforei re considerably lower (ca. 30
), it can be concluded that on average, foreign subsidiaries are smaller than
i equals the total number of affiliates
ptive st istics can be found in Table 6.21. The firms in the sample show on average h degree of subsidiary internationalization, with approximately half located in a
gn country. Considering that average DOIP values apercentdomestic subsidiaries. The Herfindahl index, given that it reflects concentration over a possible six regions, has by definition a minimum possible value of .167, which indicatescompletely even dispersion of subsidiaries across regions. The maximum value (1.000)means that all subsidiaries are located in one region. Although the minimum realized value(.252) is low, the average (even discounting domestic firms) is fairly high, meaning thatone region (the home region), figured predominantly in core company strategies anno 1990.
Table 6.21: Descriptive statistics, network spread variables (1990), N=109
Minimum Maximum Mean StDev
DOISUB 0.0% 95.2% 51.3% 26.1%
HOSTC 0.0 77.0 26.0 17.8
HERF 0.252 1.000 0.581 0.219
Based on t pti at the tions b the es would be undulyinfluenced b ativ e sub firms with zero values across all variables (i.e.,
omestic firm set iltered first for DOIP d aga 0. Normal-Q plots for all variables supported the assumption of normal distribution. The results ofe latter correlation analysis (N = 81) are presented in Table 6.22.
he assum on th correla etween variably the rel ely larg set of
dQ
s), the was f = 0, an in for DOIP < 1
th
192

Core companies in 1990
The correlation matrix clearly shows the interrelated nature of the variousinternationalization measures. Correlations between variables were moderately strong (andhighly significant) across the sample. As would be expected, a higher share of extra-regional activity would imply a higher degree of internationalization, and the internationalproduction variables are related to the number of countries in a firm’s network and theshare of its total subsidiary base abroad. Similarly, the first four variables are negativelycorrelated to the Herfindahl index, which returns lower values for higher values of theremaining variables.
Table 6.22: Correlation matrix, internationalization and network spread variables (1990), N = 81
DOIP XRP DOISUB HOSTC HERF
DOIP 1.000
XRP 0.761** 1.000
DOISUB 0.459** 0.387** 1.000
HOSTC 0.460** 0.382** 0.552** 1.000
HERF -0.277* -0.540** -0.622** -0.599** 1.000
**Corr s significan 0.001 level (One-way ANOVA, 2-tailed). orrel significant at the 0.05 level (One-way ANOVA, 2-tailed).
6.4.2 Organiz
he subsidiary-based nalization ofroduction such that organizational variables can be meaningfully defined and analyzed
strategy subtypes. These include the number of subsidiaries, the number of levels inare of first-level, or primary, subsidiaries (breadth), the
country, and the extent of cross-border linkages in
1) MAXLEVthe ‘depth’ of the hierarchy. Hierarchical
2) PRIMbsidiaries (directly under the parent) as a percentage of TOTSUBS
13)he chance that any given subsidiary has a parent in a different country. The most
expression of organizational complexity as it focuses specifically on the
elation i t at the*C ation is
ational structure
T data is thus shown to be sufficiently related to internatiopacrossa firm’s hierarchy (depth), the shaverage number of subsidiaries per hostthe subsidiary network. The variables are defined as follows:
10) TOTSUBS The total number of majority-owned subsidiaries, considered to be an expression of organizational complexity.
1The highest level in a corporate tree; i.e. depth is also expected to be an expression of organizational complexity.
1First-level su
CBLTimportantcross-border linkages between subsidiaries.
193
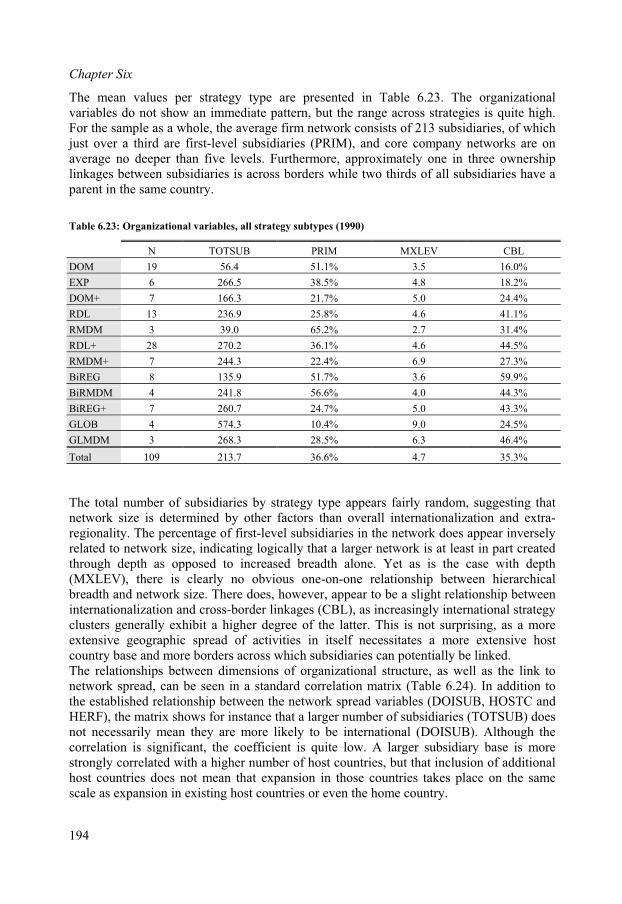
Chapter Six
ThevariaFor t rk consists of 213 subsidiaries, of whichjust a third are first-level subsidiaries (PRIM), and core company networks are on
TSUB PRIM MXLEV CBL
mean values per strategy type are presented in Table 6.23. The organizationalbles do not show an immediate pattern, but the range across strategies is quite high.he sample as a whole, the average firm netwoover
average no deeper than five levels. Furthermore, approximately one in three ownershiplinkages between subsidiaries is across borders while two thirds of all subsidiaries have aparent in the same country.
Table 6.23: Organizational variables, all strategy subtypes (1990)
N TO
DOM 19 56.4 51.1% 3.5 16.0%
EXP 6 266.5 38.5% 4.8 18.2%
DOM+ 7 166.3 21.7% 5.0 24.4%
RDL 13 236.9 25.8% 4.6 41.1%
RMDM 3 39.0 65.2% 2.7 31.4%
RDL+ 28 270.2 36.1% 4.6 44.5%
RMDM+ 7 244.3 22.4% 6.9 27.3%
BiREG 8 135.9 51.7% 3.6 59.9%
BiRMDM 4 241.8 56.6% 4.0 44.3%
BiREG+ 7 260.7 24.7% 5.0 43.3%
GLOB 4 574.3 10.4% 9.0 24.5%
GLMDM 3 268.3 28.5% 6.3 46.4%
Total 109 213.7 36.6% 4.7 35.3%
The total num of subsid by strateg appears fair ndom, sugg thatze etermined ther factor overall inte ionalization tra-
gionality. The percentage of first-level subsidiaries in the network does appear inverselylated to network size, indicating logically that a larger network is at least in part created
) does
ber iaries y type ly ra estingnetwork si is d by o s than rnat and exrerethrough depth as opposed to increased breadth alone. Yet as is the case with depth(MXLEV), there is clearly no obvious one-on-one relationship between hierarchicalbreadth and network size. There does, however, appear to be a slight relationship betweeninternationalization and cross-border linkages (CBL), as increasingly international strategyclusters generally exhibit a higher degree of the latter. This is not surprising, as a moreextensive geographic spread of activities in itself necessitates a more extensive hostcountry base and more borders across which subsidiaries can potentially be linked.The relationships between dimensions of organizational structure, as well as the link tonetwork spread, can be seen in a standard correlation matrix (Table 6.24). In addition tothe established relationship between the network spread variables (DOISUB, HOSTC and HERF), the matrix shows for instance that a larger number of subsidiaries (TOTSUBnot necessarily mean they are more likely to be international (DOISUB). Although thecorrelation is significant, the coefficient is quite low. A larger subsidiary base is morestrongly correlated with a higher number of host countries, but that inclusion of additional host countries does not mean that expansion in those countries takes place on the samescale as expansion in existing host countries or even the home country.
194
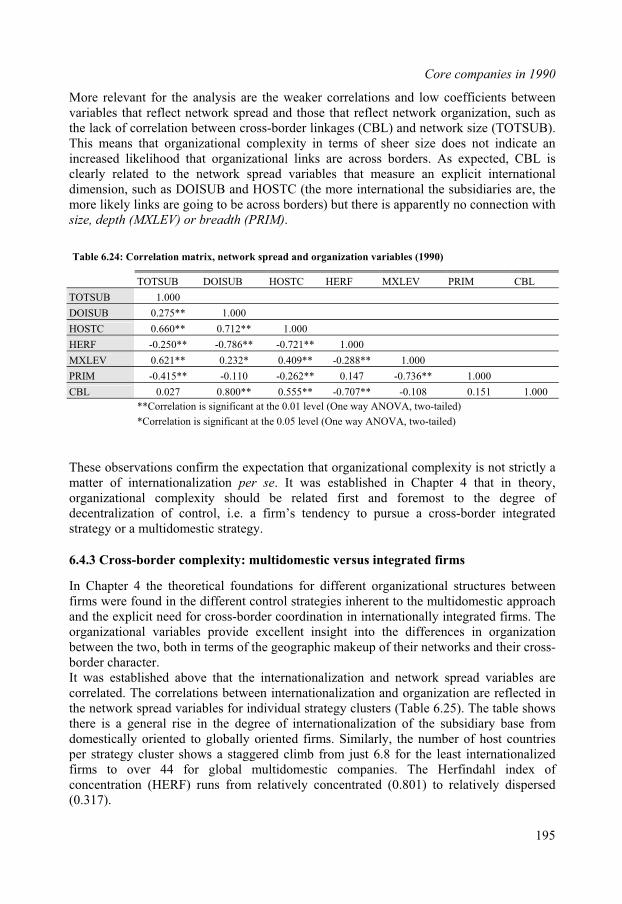
Core companies in 1990
More relevant for the analysis are the weaker correlations and low coefficients between variables that reflect network spread and those that reflect network organization, such as the lack of correlation between cross-border linkages (CBL) and network size (TOTSUB).This means that organizational complexity in terms of sheer size does not indicate an
C HERF MXLEV PRIM CBL
increased likelihood that organizational links are across borders. As expected, CBL isclearly related to the network spread variables that measure an explicit internationaldimension, such as DOISUB and HOSTC (the more international the subsidiaries are, themore likely links are going to be across borders) but there is apparently no connection withsize, depth (MXLEV) or breadth (PRIM).
Table 6.24: Correlation matrix, network spread and organization variables (1990)
TOTSUB DOISUB HOST
TOTSUB 1.000
DOISUB 0.275** 1.000
HOSTC 0.660** 0.712** 1.000
HERF -0.250** * * 0-0.786* -0.721* 1.00
MXLEV 0 0.232* 0.409** -0.288** 1..621** 000
PRIM -0.415** -0.110 -0.262** 0. -0.736** 1.147 000
CBL 0.027 0.800** 0 -0.707** -0. 8 0. 1..555** 10 151 000
** is s t th l (O ANOVA, o-tailed)Correlation ignificant a e 0.01 leve ne way tw
*C is sig t the (O OVA ailed)
hese obser is not strictly a atter of in that in theory,
rganizational complexity should be related first and foremost to the degree ofecentralization of control, i.e. a firm’s tendency to pursue a cross-border integrated
to the multidomestic approach ted firms. The
n organization
rise in the degree of internationalization of the subsidiary base from
orrelation nificant a 0.05 level ne way AN , two-t
T vations confirm the expectation that organizational complexitym ternationalization per se. It was established in Chapter 4odstrategy or a multidomestic strategy.
6.4.3 Cross-border complexity: multidomestic versus integrated firms
In Chapter 4 the theoretical foundations for different organizational structures betweenfirms were found in the different control strategies inherent and the explicit need for cross-border coordination in internationally integraorganizational variables provide excellent insight into the differences ibetween the two, both in terms of the geographic makeup of their networks and their cross-border character. It was established above that the internationalization and network spread variables are correlated. The correlations between internationalization and organization are reflected inthe network spread variables for individual strategy clusters (Table 6.25). The table showsthere is a generaldomestically oriented to globally oriented firms. Similarly, the number of host countriesper strategy cluster shows a staggered climb from just 6.8 for the least internationalizedfirms to over 44 for global multidomestic companies. The Herfindahl index ofconcentration (HERF) runs from relatively concentrated (0.801) to relatively dispersed(0.317).
195
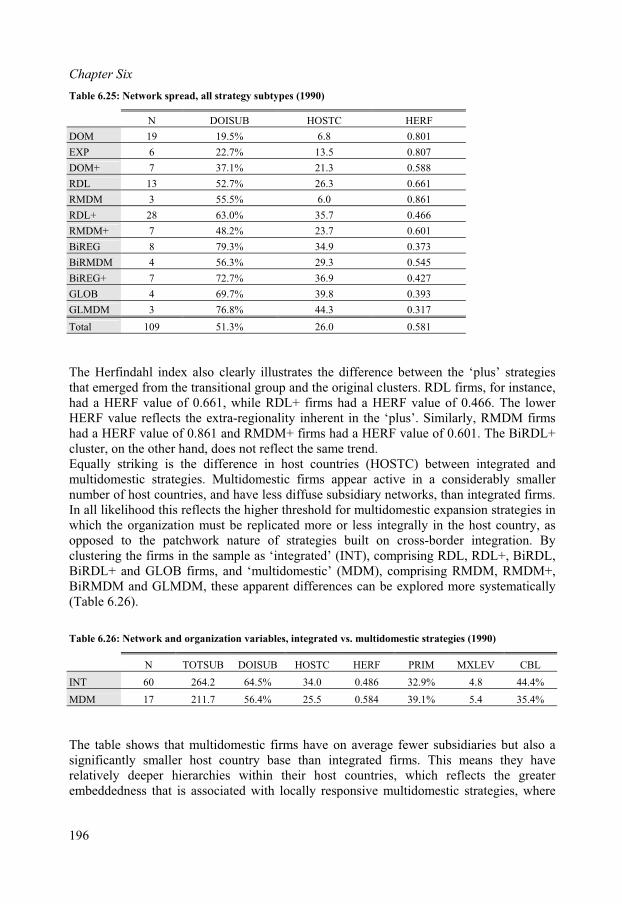
Chapter Six
Table 6.25: Network spread, all strategy subtypes (1990)
N DOISUB HOSTC HERF
DOM 19 19.5% 6.8 0.801
EXP 6 22.7% 13.5 0.807
DOM+ 7 37.1% 21.3 0.588
RDL 13 52.7% 26.3 0.661
RMDM 3 55.5% 6.0 0.861
RDL+ 28 63.0% 35.7 0.466
RMDM+ 7 48.2% 23.7 0.601
BiREG 8 79.3% 34.9 0.373
BiRMDM 4 56.3% 29.3 0.545
BiREG+ 7 72.7% 36.9 0.427
GLOB 4 69.7% 39.8 0.393
GLMDM 3 76.8% 44.3 0.317
Total 1 0.58109 51.3% 26.0
The Hererged fromfindah ndex also y illustrates difference b n the ‘plus’ strategies
the transi group and t ginal cluste DL firms, for instance,HERF e of 0.661, while RDL+ fi ad a HERF lower
ERF value reflects the extra-regionality inherent in the ‘plus’. Similarly, RMDM firms
l i clearl the etweethat em
ad ational he ori
rms hrs. R value of 0.466. The h valu
Hhad a HERF value of 0.861 and RMDM+ firms had a HERF value of 0.601. The BiRDL+cluster, on the other hand, does not reflect the same trend.Equally striking is the difference in host countries (HOSTC) between integrated and multidomestic strategies. Multidomestic firms appear active in a considerably smallernumber of host countries, and have less diffuse subsidiary networks, than integrated firms.In all likelihood this reflects the higher threshold for multidomestic expansion strategies inwhich the organization must be replicated more or less integrally in the host country, as opposed to the patchwork nature of strategies built on cross-border integration. By clustering the firms in the sample as ‘integrated’ (INT), comprising RDL, RDL+, BiRDL, BiRDL+ and GLOB firms, and ‘multidomestic’ (MDM), comprising RMDM, RMDM+,BiRMDM and GLMDM, these apparent differences can be explored more systematically
Table 6.26: Network and organization variables, integrated vs. multidomestic strategies (1990)
N TOTSUB DOISUB HOSTC HERF PRIM MXLEV CBL
INT 60 264.2 64.5% 34.0 0.486 32.9% 4.8 44.4%
MDM 17 211.7 56.4% 25.5 0.584 39.1% 5.4 35.4%
The table shows thatcantly smaller host ntegrat rm s m heyely deeper hie s w hei st c s, refl the
mbeddedness that is associated with locally responsive multidomestic strategies, where
multidomestic firms on average fewer subsidiaries but also a havesignifielativ
countrarchie
ry base tithin t
han ir ho
ed fiountrie
s. Thiwhich
eans tects
have greaterr
e
196
(Table 6.2 ). 6
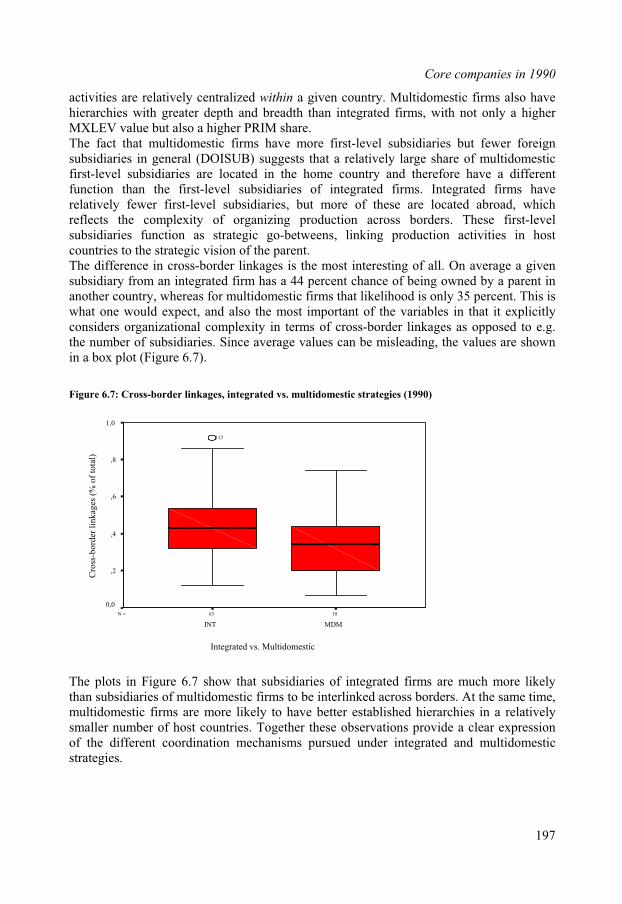
Core companies in 1990
activities are relatively centralized within a given country. Multidomestic firms also have hierarchies with greater depth and breadth than integrated firms, with not only a higherMXLEV value but also a higher PRIM share.The fact that multidomestic firms have more first-level subsidiaries but fewer foreign subsidiaries in general (DOISUB) suggests that a relatively large share of multidomesticfirst-level subsidiaries are located in the home country and therefore have a differentfunction than the first-level subsidiaries of integrated firms. Integrated firms have
portant of the variables in that it explicitly
s are much more likelyrs. At the same time,
ies in a relativelyaller number of host countries. Together these observations provide a clear expression
relatively fewer first-level subsidiaries, but more of these are located abroad, which reflects the complexity of organizing production across borders. These first-levelsubsidiaries function as strategic go-betweens, linking production activities in host countries to the strategic vision of the parent.The difference in cross-border linkages is the most interesting of all. On average a givensubsidiary from an integrated firm has a 44 percent chance of being owned by a parent inanother country, whereas for multidomestic firms that likelihood is only 35 percent. This is what one would expect, and also the most imconsiders organizational complexity in terms of cross-border linkages as opposed to e.g.the number of subsidiaries. Since average values can be misleading, the values are shown in a box plot (Figure 6.7).
Figure 6.7: Cross-border linkages, integrated vs. multidomestic strategies (1990)
1863N =
Integrated vs. Multidomestic
MDMINT
Cro
ss-b
ord
er l
ink
ages
(%
of
tota
,6
,4
,2
0,0
1,0
112
l) ,8
The plots in Figure 6.7 show that subsidiaries of integrated firmthan subsidiaries of multidomestic firms to be interlinked across bordemultidomestic firms are more likely to have better established hierarchsmof the different coordination mechanisms pursued under integrated and multidomesticstrategies.
197
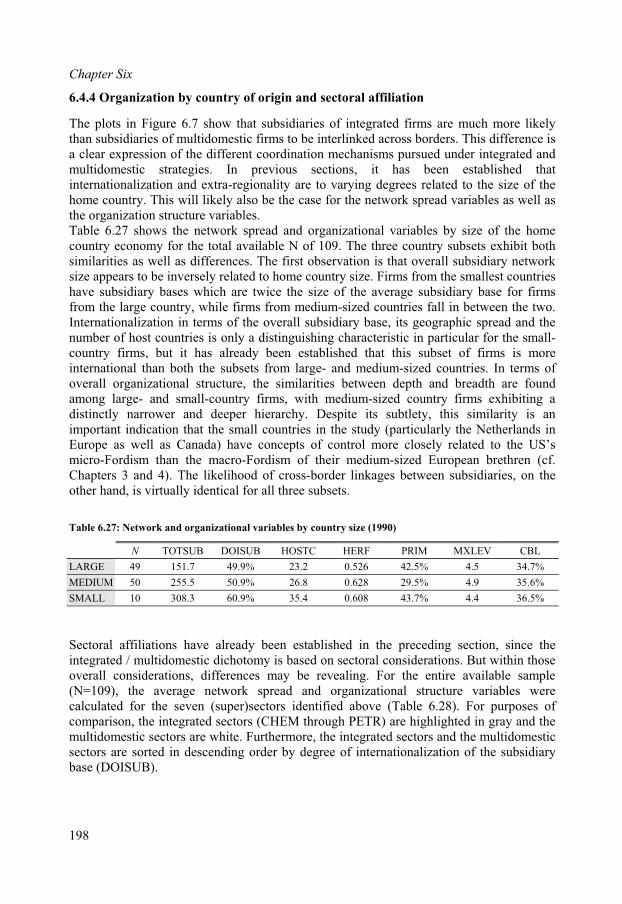
Chapter Six
6.4.4 Organization by country of origin and sectoral affiliation
The plots in Figure 6.7 show that subsidiaries of integrated firms are much more likelyders. This difference is
ntegrated and
e first observation is that overall subsidiary network
N TOTSUB DOISUB HOSTC HERF PRIM MXLEV CBL
than subsidiaries of multidomestic firms to be interlinked across bora clear expression of the different coordination mechanisms pursued under imultidomestic strategies. In previous sections, it has been established thatinternationalization and extra-regionality are to varying degrees related to the size of thehome country. This will likely also be the case for the network spread variables as well asthe organization structure variables.Table 6.27 shows the network spread and organizational variables by size of the homecountry economy for the total available N of 109. The three country subsets exhibit bothsimilarities as well as differences. Thsize appears to be inversely related to home country size. Firms from the smallest countrieshave subsidiary bases which are twice the size of the average subsidiary base for firmsfrom the large country, while firms from medium-sized countries fall in between the two.Internationalization in terms of the overall subsidiary base, its geographic spread and thenumber of host countries is only a distinguishing characteristic in particular for the small-country firms, but it has already been established that this subset of firms is moreinternational than both the subsets from large- and medium-sized countries. In terms ofoverall organizational structure, the similarities between depth and breadth are foundamong large- and small-country firms, with medium-sized country firms exhibiting a distinctly narrower and deeper hierarchy. Despite its subtlety, this similarity is animportant indication that the small countries in the study (particularly the Netherlands inEurope as well as Canada) have concepts of control more closely related to the US’s micro-Fordism than the macro-Fordism of their medium-sized European brethren (cf. Chapters 3 and 4). The likelihood of cross-border linkages between subsidiaries, on theother hand, is virtually identical for all three subsets.
Table 6.27: Network and organizational variables by country size (1990)
LARGE 49 151.7 49.9% 23.2 0.526 42.5% 4.5 34.7%
MEDIUM 50 255.5 50.9% 26.8 0.628 29.5% 4.9 35.6%
SMALL 10 308.3 60.9% 35.4 0.608 43.7% 4.4 36.5%
Sectoral a ation e al been blished in the preceding section, since the tegrated / multidomestic dichotomy is based on sectoral considerations. But within those
verall considerations, differences may be revealing. For the entire available sample
ffili s hav ready estaino(N=109), the average network spread and organizational structure variables were calculated for the seven (super)sectors identified above (Table 6.28). For purposes of comparison, the integrated sectors (CHEM through PETR) are highlighted in gray and themultidomestic sectors are white. Furthermore, the integrated sectors and the multidomesticsectors are sorted in descending order by degree of internationalization of the subsidiarybase (DOISUB).
198

Core companies in 1990
Table 6.28: Network and organizational variables by sector (1990)
N TOTSUB DOISUB HOSTC HERF PRIM MXLEV CBL
CHEM 11 258.6 76.7% 48.5 0.365 42.0% 4.82 54.3%
COMP 16 213.8 72.3% 36.6 0.415 42.9% 4.06 53.1%
VEHIC 20 242.3 55.5% 25.0 0.584 45.2% 4.10 39.4%
CONST 6 318.0 50.7% 26.2 0.552 22.0% 5.83 31.9%
PETR 17 268.6 43.7% 26.6 0.605 15.8% 5.59 29.0%
FOOD 11 207.5 63.7% 30.5 0.475 27.5% 6.27 38.1%
RETAIL 13 56.4 27.2% 4.6 0.841 61.0% 2.62 20.9%
UTIL 15 179.0 25.7% 14.0 0.747 29.6% 5.13 15.8%
Total 109 213.7 51.3% 26.0 0.581 36.6% 4.68 35.3%
of tMany he pos obse s fr able hav ady been mad esu an
omestic counterparts. In fact, none of the thr ltido secto s an eetwork as large as the smallest average network for integrated sectors. Although
sible rvation om T 6.28 e alre e. Thintegrated sectors, for inst
ultidance, clearly have larger
ee mubsidiary b
mesticases thrs ha
theiraveragm
nmultidomestic sectors have on average lower degrees of network internationalization,FOOD-based firm networks are more international, more dispersed, and involved in morehost countries on average than three of the five integrated sectors.For integrated sectors, internationality of the subsidiary base appears to have a positivecorrelation to network breadth (PRIM) and a negative correlation to network depth(MXLEV). The positive relation is also expressed relative to cross-border linkages (CBL). These interrelationships show that cross-border vertically integrated strategies are similarin design, even across sectors, such that differences in organizational structure are primarily traced to overall internationalization patterns.Multidomestic sectors, on the other hand, are less homogenous. Between the three sectors,which are most similar differs for each variable. In terms of network spread, RETAIL and UTIL are the most similar, while FOOD and UTIL are most similar in terms of organization structure. This higher level of diversity is perhaps yet again a sign of theincreased responsiveness to local pressures under a multidomestic strategy.
6.5 Strategies in the EU and NAFTA
Building on the preceding analysis of core companies in general and theirinternationalization strategies and organizational characteristics, the sample can now bedivided along regional lines. After briefly comparing and contrasting the two, each
dividually. The regional analysis will be addressed
0 firms from North America. For these respective subsets, the primary internationalization indicators as explored above are compared in Table 6.29.
regional subset will be dealt with inonly briefly here as it forms the basis for the longitudinal analysis and will be explored inmore detail in Chapter 7.
6.5.1 Internationalization and organization variables by home region
Dividing the 122 firms in the sample by home region generates balanced subsets of 62firms from Europe and 6
199

Chapter Six
Table 6.29: Scale and scope of internationalization by home region (1990)
N XRP XR2 DOIP RORP
EU 62 21.0% 57.7%a 35.6% 16.3%
NAF 60 17.2% 65.8% 20.7% 3.8%b
aN=40bN=32
pa n 1990 were on t ole moreinternational, ligh ore ex gional, eir No erican c s. Byconclusion they were considerably more regional in relation to their overall activity. Thiss not surprising the fact that the European region is made up of a larger number of
As the table shows, European core com nies i he whand s tly m tra-re than th rth Am ounterpart
ire
givenlatively smaller countries and the US, home to 59 of the 60 North American companies
in the sample, itself accounts for the lion’s share of the North American region and thuswill account for a proportionally much larger share of regional activity. The RORP data should be qualified, however, in that ‘rest of Europe’ often includes countries outside theEU15 and the ‘rest of North America’ on occasion excludes Canada or Mexico (due to data constraints) and is thus a conservative estimate. Strictly speaking, the EU value is probablyone to two percent lower and the NAFTA value as much as one percent higher.For the firms for which it was possible to calculate the share of extra-regional activityaccounted for by a second region, the results are also in line with expectations. On average,over 57 percent of European firms’ extra-regional activity was located in North America,and nearly 66 percent of North American firms’ extra-regional activity was located inEurope. Since both groups were on average close to 80 percent home-region centric in1990 and over half the remainder was in the other respective region, the conclusion is thaton average the two regions accounted for nearly 95 percent of the activities of both European and North American core companies. In other words, the largest Westerncompanies in the world in 1990, taken as a whole, were far from global.The network spread variables can be considered in conjunction with the organizationalstructure variables (Table 6.30). As the table shows, the average European core companyhas a subsidiary base more than 75 percent larger than its North American counterpart(TOTSUB). Since this is not related to a higher degree of subsidiary internationalization(DOISUB), it is likely that the larger network is symptomatic of the macro-Fordistcharacter of production and its higher levels of embeddedness (i.e., more subsidiaries per host country) based on intensive relations with local stakeholders in host (macro-Fordist)countries. Host country embeddedness can also be seen in the greater depth of EU firms(MXLEV). North American firms, on the other hand, not only have shallower hierarchies;they also exhibit a markedly higher share of first-level subsidiaries among their networks,which is characteristic of the micro-Fordist tendency to maintain strategic control close tocorporate headquarters.
Table 6.30: All key variables for internationalized companies by home region (1990)
N TOTSUB DOISUB HOSTC HERF PRIM MXLEV CBL
EU 59 264.9 52.4% 28.3 0.626 32.3% 4.83 35.8%
NAF 50 153.2 50.1% 23.3 0.527 41.8% 4.50 34.7%
200
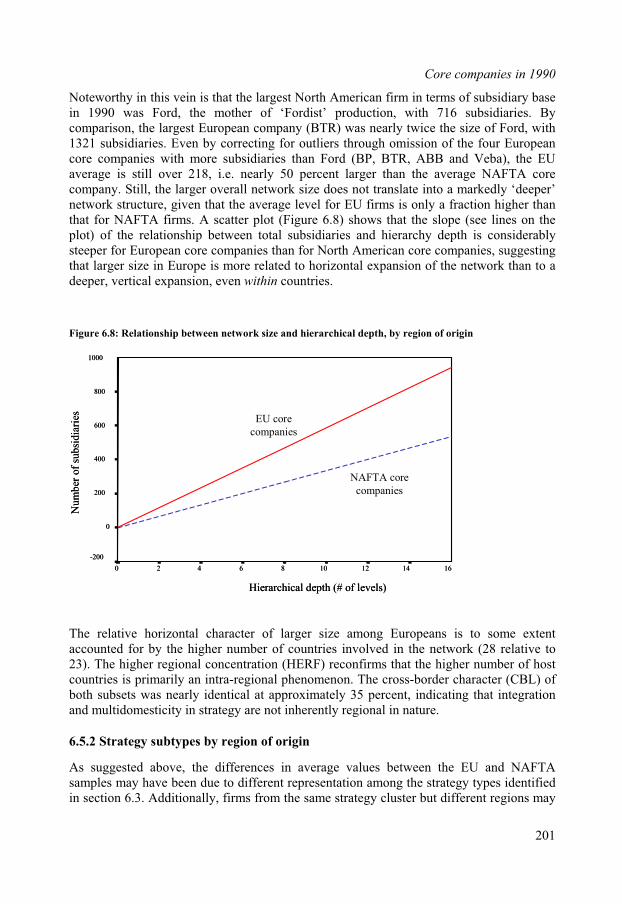
Core companies in 1990
Noteworthy in is lar rth an f term bsid asein 1990 was Ford, the of ist’ ction 71 bsidi Bycom he t Eu com (BTR nea ce th of F ith
cal depth, by region of origin
s to some extentccounted for by the higher number of countries involved in the network (28 relative to3). The higher regional concentration (HERF) reconfirms that the higher number of host
samples may have been due to different representation among the strategy types identifiedin section 6.3. Additionally, firms from the same strategy cluster but different regions may
Hierarchical depth (# of levels)
1614121086420
Nu
mb
er o
fsu
bsi
dia
ries
1000
600
400
200
0
-200
this vein that the gest No Americ irm in s of su iary bmother ‘Ford produ , with 6 su aries.
parison, t larges ropean pany ) was rly twi e size ord, w1321 subsidiaries. Even by correcting for outliers through omission of the four European core companies with more subsidiaries than Ford (BP, BTR, ABB and Veba), the EUaverage is still over 218, i.e. nearly 50 percent larger than the average NAFTA core company. Still, the larger overall network size does not translate into a markedly ‘deeper’network structure, given that the average level for EU firms is only a fraction higher thanthat for NAFTA firms. A scatter plot (Figure 6.8) shows that the slope (see lines on theplot) of the relationship between total subsidiaries and hierarchy depth is considerablysteeper for European core companies than for North American core companies, suggestingthat larger size in Europe is more related to horizontal expansion of the network than to a deeper, vertical expansion, even within countries.
Figure 6.8: Relationship between network size and hierarchi
The relative horizontal character of larger size among Europeans ia2countries is primarily an intra-regional phenomenon. The cross-border character (CBL) of both subsets was nearly identical at approximately 35 percent, indicating that integrationand multidomesticity in strategy are not inherently regional in nature.
6.5.2 Strategy subtypes by region of origin
As suggested above, the differences in average values between the EU and NAFTA
800
NAFTA core
companies
EU core
companies
Hierarchical depth (# of levels)
1614121086420
Nu
mb
er o
fsu
bsi
dia
ries
1000
600
400
200
0
-200
NAFTA core
companies
EU core
companies
800
201
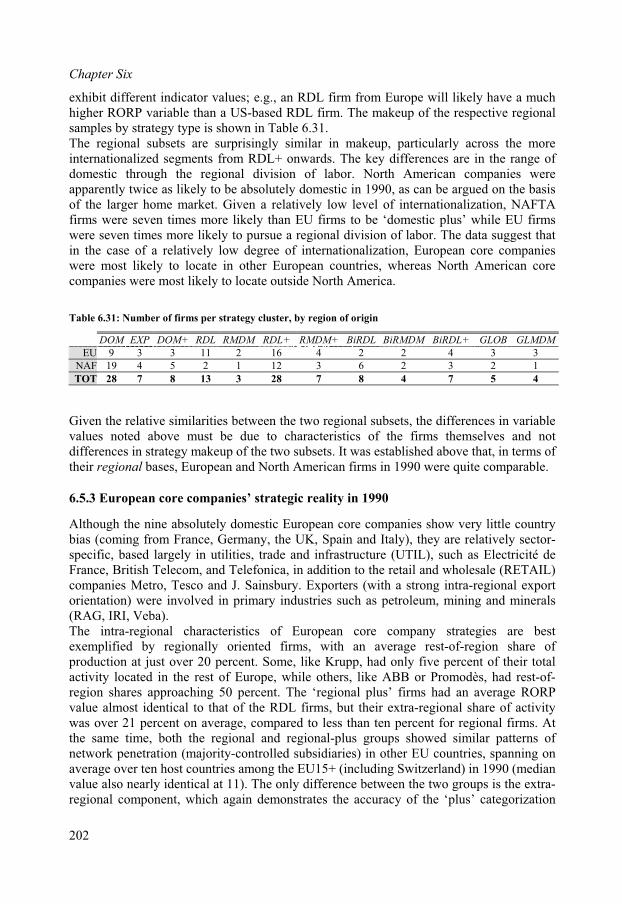
Chapter Six
exhibit different indicator values; e.g., an RDL firm from Europe will likely have a muchhigher RORP variable than a US-based RDL firm. The makeup of the respective regionalsamples by strategy type is shown in Table 6.31. The regional subsets are surprisingly similar in makeup, particularly across the moreinternationalized segments from RDL+ onwards. The key differences are in the range of domestic through the regional division of labor. North American companies wereapparently twice as likely to be absolutely domestic in 1990, as can be argued on the basisof the larger home market. Given a relatively low level of internationalization, NAFTAfirms were seven times more likely than EU firms to be ‘domestic plus’ while EU firmswere seven times more likely to pursue a regional division of labor. The data suggest thatin the case of a relatively low degree of internationalization, European core companieswere most likely to locate in other European countries, whereas North American corecompanies were most likely to locate outside North America.
Table 6.31: Number of firms per strategy cluster, by region of origin
DOM EXP DOM+ RDL RMDM RDL+ RMDM+ BiRDL BiRMDM BiRDL+ GLOB GLMDM
EU 9 3 3 11 2 16 4 2 2 4 3 3
NAF 19 4 5 2 1 12 3 6 2 3 2 1
TOT 28 7 8 13 3 28 7 8 4 7 5 4
Given relativ the io u e d nv note above mu hara stic f th rms t selves and notd e s i trat y m up the sub s. It was estab hed above that n terms of
eir regional bases, European and North American firms in 1990 were quite comparable.
specific, based largely in utilities, trade and infrastructure (UTIL), such as Electricité detail and wholesale (RETAIL)
the e ilaritiessim between tw ego r n sal bsets, th i reffe ces in variablealues d st be due to c cteri s o e fi hemiffer nce n s eg ake of two set lis , i
th
6.5.3 European core companies’ strategic reality in 1990
Although the nine absolutely domestic European core companies show very little country bias (coming from France, Germany, the UK, Spain and Italy), they are relatively sector-
France, British Telecom, and Telefonica, in addition to the recompanies Metro, Tesco and J. Sainsbury. Exporters (with a strong intra-regional exportorientation) were involved in primary industries such as petroleum, mining and minerals(RAG, IRI, Veba). The intra-regional characteristics of European core company strategies are bestexemplified by regionally oriented firms, with an average rest-of-region share ofproduction at just over 20 percent. Some, like Krupp, had only five percent of their totalactivity located in the rest of Europe, while others, like ABB or Promodès, had rest-of-region shares approaching 50 percent. The ‘regional plus’ firms had an average RORPvalue almost identical to that of the RDL firms, but their extra-regional share of activitywas over 21 percent on average, compared to less than ten percent for regional firms. Atthe same time, both the regional and regional-plus groups showed similar patterns of network penetration (majority-controlled subsidiaries) in other EU countries, spanning onaverage over ten host countries among the EU15+ (including Switzerland) in 1990 (medianvalue also nearly identical at 11). The only difference between the two groups is the extra-regional component, which again demonstrates the accuracy of the ‘plus’ categorization
202

Core companies in 1990
since it clearly is additional and does not constitute a substitution effect. It deservesmention, however, that many firms only have one or two subsidiaries in a number of theirhost countries, and that the penetration rate drops by half (to under six) when per firm onlythe host countries with at least five subsidiaries are considered.The inside-out characteristics of geographic dispersion are best expressed in bi-regionalstrategies as well as globally-oriented strategies. The two European BiRDL firms(Pechiney and Rhône-Poulenc) have comparable levels of RORP as the regional and regional-plus firms, but extra-regional activity in the 40 percent range. That extra-regionalactivity was located for over 85 percent in North America, where sectoral concerns such as
America accounted for even less than half of its activities, while Latin America,Asia and Africa all had substantial representation in its network. The most internationalcompany in the sample was the global multidomestic Nestlé, over 95 percentinternationalized in 1990, with 40 percent of its activity in the rest of Europe and a thirdoutside Europe and North America. The globally integrated companies, Shell, BP andBTR, all (at least in part) British, have a global reach associated with sector-specific needs to source raw materials such as oil and rubber from Oceania, Asia and Africa. BTR, for instance, had 188 majority-owned subsidiaries in the Oceania region in 1990, which constituted 18 percent of all majority owned subsidiaries among the 122 core companysubsidiary bases in the region.Of all European companies, only half had subsidiaries in Mexico. These includedparticularly chemical companies (BASF, Bayer, ICI, Hoechst), auto manufacturers (VW,Daimler-Benz and Renault) and electronics firms (Philips, Ericcson, Alcatel andElectrolux). The carmakers are all RDL firms and therefore had relatively small operationsin Mexico, but chemical and electronics companies are bi-regionally oriented and as such
alf of theirinternationalization having been into Canada or Mexico. Sears and Costco, for example,had internationalized nearly five and ten percent, respectively, within North America by1990. The two exporters are United Airlines and Boeing. Although the former is in
access to mines and minerals were the main factor. The French metals company Pechiney, for instance, had one quarter of its assets in North America in 1990 (primarily Canada andthe US) and more than a third of its total sales, while a third of Rhône-Poulenc’sproduction was located in Canada and the United States. The two bi-regionalmultidomestic firms, Ahold and Franz Haniel, were both retailers with a fairly even split inactivities between the home country (the Netherlands and Germany, respectively) and the US.The four ‘bi-regional plus’ companies, Electrolux, Thomson, Imperial Chemical and Philips, were all highly internationalized beyond both Europe and North America (as muchas 25 percent), whereby Asia played an important role in particular for the latter two. Theglobally-oriented companies were even more extreme; in the case of Unilever Europe and North
included Mexico in a larger, integrated network. Hoechst, for instance, through itssubsidiary Celanese (51 percent ownership), was the largest European-controlledsubsidiary in Mexico in 1990 with assets worth nearly two billion US dollars.
6.5.4 North American core companies’ strategic reality in 1990
In the US, domestic core companies are overwhelmingly in retail, such as Wal-Mart, Sears,J.C. Penney, and Supervalu. In some cases these firms did, however, have a modestregional presence (on average less than two percent), with more than h
203
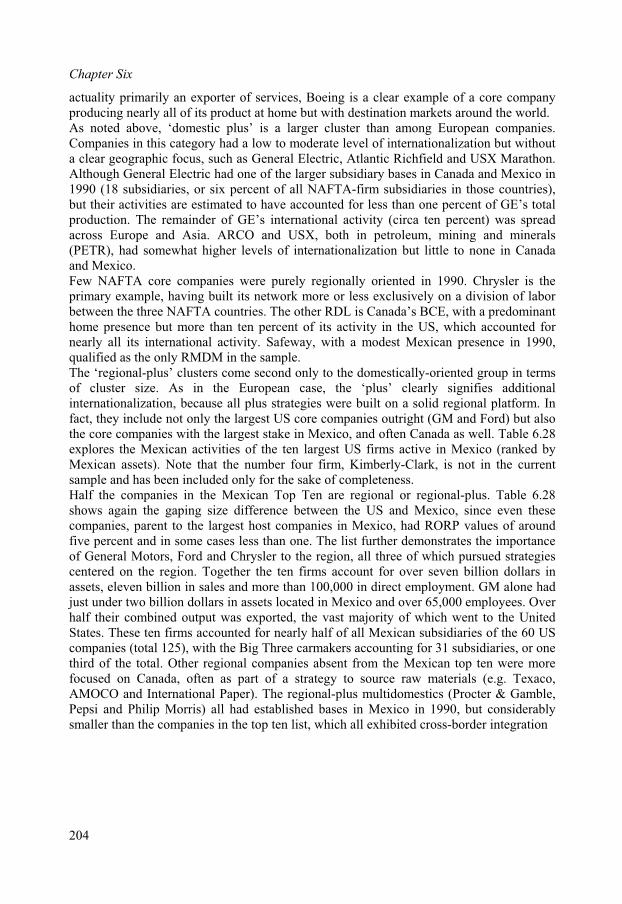
Chapter Six
actuality primarily an exporter of services, Boeing is a clear example of a core companyproducing nearly all of its product at home but with destination markets around the world.As noted above, ‘domestic plus’ is a larger cluster than among European companies.Companies in this category had a low to moderate level of internationalization but withouta clear geographic focus, such as General Electric, Atlantic Richfield and USX Marathon.Although General Electric had one of the larger subsidiary bases in Canada and Mexico in1990 (18 subsidiaries, or six percent of all NAFTA-firm subsidiaries in those countries),but their activities are estimated to have accounted for less than one percent of GE’s totalproduction. The remainder of GE’s international activity (circa ten percent) was spreadacross Europe and Asia. ARCO and USX, both in petroleum, mining and minerals(PETR), had somewhat higher levels of internationalization but little to none in Canada and Mexico.Few NAFTA core companies were purely regionally oriented in 1990. Chrysler is theprimary example, having built its network more or less exclusively on a division of laborbetween the three NAFTA countries. The other RDL is Canada’s BCE, with a predominanthome presence but more than ten percent of its activity in the US, which accounted for nearly all its international activity. Safeway, with a modest Mexican presence in 1990,qualified as the only RMDM in the sample.The ‘regional-plus’ clusters come second only to the domestically-oriented group in termsof cluster size. As in the European case, the ‘plus’ clearly signifies additionalinternationalization, because all plus strategies were built on a solid regional platform. In fact, they include not only the largest US core companies outright (GM and Ford) but alsothe core companies with the largest stake in Mexico, and often Canada as well. Table 6.28 explores the Mexican activities of the ten largest US firms active in Mexico (ranked byMexican assets). Note that the number four firm, Kimberly-Clark, is not in the currentsample and has been included only for the sake of completeness.Half the companies in the Mexican Top Ten are regional or regional-plus. Table 6.28shows again the gaping size difference between the US and Mexico, since even thesecompanies, parent to the largest host companies in Mexico, had RORP values of around five percent and in some cases less than one. The list further demonstrates the importanceof General Motors, Ford and Chrysler to the region, all three of which pursued strategiescentered on the region. Together the ten firms account for over seven billion dollars inassets, eleven billion in sales and more than 100,000 in direct employment. GM alone had just under two billion dollars in assets located in Mexico and over 65,000 employees. Over half their combined output was exported, the vast majority of which went to the UnitedStates. These ten firms accounted for nearly half of all Mexican subsidiaries of the 60 UScompanies (total 125), with the Big Three carmakers accounting for 31 subsidiaries, or one third of the total. Other regional companies absent from the Mexican top ten were morefocused on Canada, often as part of a strategy to source raw materials (e.g. Texaco, AMOCO and International Paper). The regional-plus multidomestics (Procter & Gamble,Pepsi and Philip Morris) all had established bases in Mexico in 1990, but considerably smaller than the companies in the top ten list, which all exhibited cross-border integration
204

Core companies in 1990
Table 6.32: Top 10 US firms in Mexico, 1991 (currency values $US million)
Company Strategy Mex. assets Mex. sales Mex. empl. Mex. subsa Export
General Motors RDL+ 1,869 3,382 65,605 22 69.0%
Chrysler RDL 1,286 2,657 11,383 6 57.1%
Ford RDL+ 1,183 2,996 8,840 13 45.8%
Kimberly-Clark n.a. 896 923 4,437 n.a. 2.2%
Du Pont BiRDL 716 272 1,328 1 12.5%
Kodak RDL+ 478 318 3,036 5 30.8%
IBM BiRDL 418 115 2,145 .1%1 38
Xerox RDL+ 222 317 3,912 3 30.1%
Hewlett-Packard BiRDL+ 144 269 1,024 3 24.2%
Motorola BiRDL+ 50* 153 2,702 3 96.0%
Total 7, 11, 10 4262 401 4,412 57 9.2%
*EstimateSource: Author’s calculations based on A a
ia and Dun treet data a1990
ctivities were gene part trategy with a eographici-region ). Th usters is range had ROR u ow as one
t and as high as over 18 percent, ere ere fro 2 to 50 percentonal. For the bi-regional s about his ext ivity was
bi-regional plus and globally orient had similarares of total activity (i.e., circa 30 percent) in Europe. The 13 companies in the rangeom bi-regional to global were active in on average 12.4 of the EU15, although if only
meric
Econom & Brads
Smaller-scale Mexican a rally of a s wider gscope (b al to global e cl in th P val es as lpercenextra-regi
but w80 percent
anywh of t
m 3r
over act firm a-regional
ed firmssituated in Europe, while theshfrcountries host to at least five subsidiaries are considered, the average drops to less thanfour, with many companies having only a ‘substantial’ presence in one or two Europeancountries.The regional-plus and globally-oriented companies, similar to their European counterparts,had a more sizeable portion (20 to 25 percent) of total activity outside both North Americaand Europe. Companies in these segments include Hewlett-Packard, Motorola and IBM, as well as two global oil companies (Exxon and Mobil). The most internationalized NorthAmerican company in 1990 (perhaps intuitively given its brand presence in every corner of the world) was Coca-Cola, with an extra-regional component of nearly 55 percent, justunder half of which was located in Asia, Latin America and Africa. By and large, however, it must be reemphasized that even more than for European companies, the geographic scope of North American core company activity in 1990 was centered on the home countryor region, and additionally on Europe as a host region. Asia, Latin America, Africa and Oceania on the aggregate represent an almost insignificant share of core company activity, and only a limited case-by-case basis were firms identified for which these regionsperformed important, let alone central, roles in their internationalization strategies.
6.6 Conclusions
The current chapter quantifies and qualifies the extent and pattern of internationalization,network spread and organizational structure for North American and European core companies in 1990, with the purpose of setting the stage for integration in both regions.
205
Chapter Six
The evidence shows that firms pursued diverse strategies in the run up to integration in the1990s and that they cannot be discussed in terms of ‘the quintessential firm’ as is often thecase in policy approaches. Strategies of varying geographic scale and scope form a range
ties and in all likelihood a variety of strategic intent with respect to the
e of a regionally based classification for the analysis athand. In the literature, the criteria for good strategy typologies are that they should be 1) based on all key strategic characteristics of the entities being classified; 2) hierarchical,consisting of at least two levels; 3) timeless; and 4) parsimonious (Chrisman, Hofer and Boulton, 1988). Such a typology must have a spatial dimension, must describe both intra-as well as extra-regional dimensions. Additionally, the typology must be generalizable todifferent RIAs, including existing typologies, and be relevant for the structure and analysis
of strategic realiintegration process and outcomes.The typology as it was developed contains both ‘clean’ as well as ‘plus’ categories, which reflects the fact that strategy is fluid and firms are continually in transition. The result is atypology which progresses from absolutely domestic strategies to absolutely global ones. This is not to suggest a strict linear path as the typology does not follow any one firmthrough time; rather it positions them relative to one another at a given moment (1990). In fact it will be posited in the following chapter that multiple paths or migrations are possible from one position or another.The typology stresses the importanc
of both strategic intent with regard to regionalism as well as realized outcomes. Thetypology meets these criteria. The subsets and characteristics of European companies versus North American companieswere surprisingly similar. Differences between the sample makeup and the values for theindividual clusters are not significant, which makes them comparable subsets andprecludes the likelihood that differences in subset composition would distort the analysis. In all objectivity, for both subsets the extent of internationalization in 1990 was fairlylimited. The world beyond North America and Europe was only marginally integrated inall but the most internationalized firms’ spatial organization of activity. Despite the fad ofglobal and footloose firms that raged in management literature in the late 1980s and early 1990s, only very few if any deserved such a predicate.Lastly, the typology emphasizes and reveals a number of differences betweenmultidomestic and integrated firms, harking back to debates initiated by Porter (1986) and Prahalad and Hamel. The distinction is clear, not only on the basis of intra-firm salesreporting, but also in terms of the likelihood of cross-border relationships betweensubsidiaries. Also, multidomestic firms tend to be more international overall, and moredeeply embedded in a relatively smaller number of countries than integrated firms. This islogical if, as the concept ‘multidomestic’ suggests, firms have to replicate their entirestructure and decentralize a broader range of functions in their host countries than do integrated companies. The only exception seem to form the global multidomestics, whichappear to have enough experience, resources and momentum to build vast multidomesticnetworks spanning dozens of countries.
206

7. REALIZED REGIONALISM STRATEGIES OVER THE 1990s
As the second wave of regionalism took shape in the course of the 1990s, core companieshad to address and asses their new institutional environment. The management of somecore companies had taken an active stance, lobbying directly for (further) broadening and deepening of regional integration, while others adopted a ‘wait and see’ attitude and somemay even have been surprised by the scale of regional dynamism in the 1990s. Thepolitical intentions behind (and expectations of) integration in Europe and North Americawere dealt with in Chapter 5. This chapter analyzes core company strategies longitudinallyover the period 1990 through 2001.First, more ‘subjective’ dimensions will be examined of the way core companies perceivedregionalism to be a strategic issue (section 7.1). The analysis will then move on to moreobjective measures, also taking into account the way changes to the sample through mergerand acquisition (M&A) activity might affect the strategic profiles (section 7.2). Thediscussion of strategic migrations will be structured by region of origin (section 7.3 onEurope and section 7.4 on North America) and within four larger strategic clusters:domestically oriented, regionally oriented, bi-regionally oriented and globally orientedcompanies.
7.1 Reflections of regionalism as a strategic issue
The ‘game’ of strategic intent and strategic reality is played out in part at a rhetorical level.Actors, be they governments or core companies, are keen to present themselves to theoutside world in a positive light. While the analysis in this study hinges on a quantitativeassessment of realized core company restructuring, it is also important to consider theways in which companies portray their own restructuring and to what extent they appear toconsider regionalism a strategic issue.
7.1.1 Anecdotal testimony of regionalism as a strategic issue
At the anecdotal level, the media and annual reports provide considerable insight into theattitudes of core company management towards integration. Managerial arguments forintegration, generally echoed by regionalism’s political rationalizations, tend to focus onissues like increased scale and efficiency, increased competition or the benefits ofdeveloping regional brands. ‘Outsider’ firms have traditionally agitated against the dangersof creating regional ‘Fortresses’.US firms, for instance, have traditionally been eager to present themselves as havingdeveloped ‘a North American focus in … strategy and structure’, in most cases involving‘an integration of North American operations’ (Blank and Haar, 1998). In some cases thisoccurred as a ‘wave of joint ventures’ with Mexican firms, involving e.g. GTE (Wall Street
Journal: December 21, 1993). Digital Equipment and Daimler-Benz were also acquiring interests to establish pan-European positions (Computerworld: July 29, 1991) and US and European chemical companies were ‘swapping’ assets in Europe to gain scale (The
Economist: October 3, 1992).DuPont suggested that the NAFTA led to increased competition, and that as a result ‘all ofour manufacturing operations must be internationally competitive’ (Business Mexico: Vol7/8, issue 12/1, 1998). Shell, meanwhile, centralized decisionmaking in its petrochemical
207
Chapter Seven
division to ‘better meet customer demand in the [European] single market’ (Chemcal
Week: November 18, 1992) and Renault has been active in closing down less efficientfactories in Europe (The Economist: March 15, 1997). Firms from different countries were described as having different approaches tointegration. According to a survey by Business Quarterly (1995, vol. 59/4), Canadian firmsare aiming their restructuring at delivering higher quality and service, while Mexican firmsare targeting cost reduction. US companies, on the other hand, are working on loweringcosts but also on ‘improved supply chain management’. This was described by othersources as the increased integration (‘capture’) of suppliers in Mexico, for example byChrysler (Country Monitor, April 20, 1994) and BASF (Purchasing, February 6, 2003).European food companies such as Nestlé and Unilever, both ardent supporters of the SEMwithin the European Round Table of Industrialists, saw potential for the development ofEuropean brands (Marketing: April 26, 1990). Companies in businesses where consumertastes differ widely, such as Philips’ domestic appliance division, expected gains to comenot from product harmonization but from a consolidation of physical distribution. DuPont,Bosch-Siemens and Exxon were also described as having rationalized their logistics and distribution in Europe (Management Today: April, 1994). Others, however, used theexample of Unilever’s increased control of distribution channels to warn against decreased competition under the Single Market (Reynolds, 1995).Core companies also tended to position regionalization as an alternative to globalization. Inthe words of Campbell Soup CEO Johnson, ‘the strategy for North America is very simpleYou market locally, manufacture regionally, and source globally – with commontechnology, knowledge and supplies’ (Blank and Haar 1998). Others consideredregionalism a stepping stone towards greater regional integration, such as Shell’s explicitview that countries like Switzerland and Norway were de facto part of Europe from a business point of view (Herkströter, 1996). Outsiders also had strategic perspectives on integration. In the wake of Europeanintegration, 3M announced a drastic restructuring of its European structure (BusinessEurope: November 1, 1993). Swiss companies, with Nestlé and Ciba-Geigy in the lead,were positioned as expanding proactively in EC countries to prevent being locked out inthe wake of integration (Wall Street Journal: August 31, 1988).Not all firms were openly positive and some worried that integration would fail to live upto ‘the hype’ (Marketing: April 26, 1991). Many firms argued openly that integration couldonly be successful behind tariff walls, such as French electronics giant Thomson (Fortune:April 20, 1992) and Fiat, Peugeot and Renault (Wall Street Journal: November 29, 1990). By 1998, companies like ICI were complaining that the single market was not yet workingsmoothly (Merriden, 1998). Meanwhile retailers were described as ‘taking a wait and see attitude’ amid concerns that NAFTA alone is not a recipe for success in entering Mexico and Canada (Chain Store Executive, January, 1995). They thereby further nurtured the fear of the real outsiders of European and North American integration of being faced with two increasingly impenetrable ‘fortresses’.More critically, it is not always evident that core company promises of e.g. job creation through integration, on the basis of which the RIA was ‘sold’ to governments and to thepublic, ever actually materialized. Public Citizen, for example, published a study in 1997 in which the promise of new jobs through the NAFTA, made in media appearances bydozens of core companies in the run-up to integration, were evaluated ex post. The reportconcludes that three years into the NAFTA, 60 of the 67 concrete promises they
208
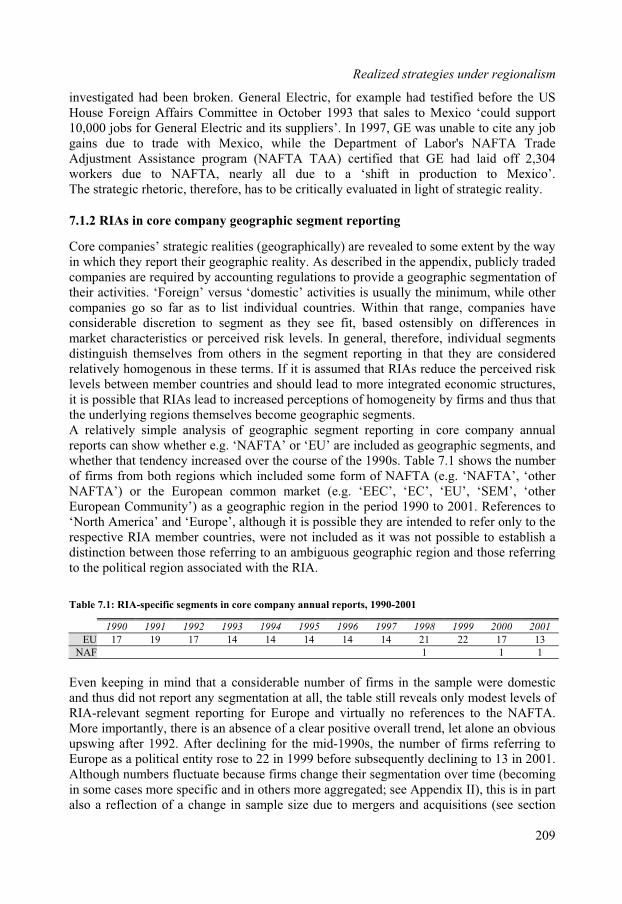
Realized strategies under regionalism
investigated had been broken. General Electric, for example had testified before the UHouse Foreign Affairs Committee in October 1993 that sales to Mexico ‘could supp
Sort
eographically) are revealed to some extent by the way in which they report their geographic reality. As described in the appendix, publicly tradedcompanies are required by accounting regulations to provide a geographic segmentation of their activities. ‘Foreign’ versus ‘domestic’ activities is usually the minimum, while othercompanies go so far as to list individual countries. Within that range, companies have considerable discretion to segment as they see fit, based ostensibly on differences inmarket characteristics or perceived risk levels. In general, therefore, individual segmentsdistinguish themselves from others in the segment reporting in that they are consideredrelatively homogenous in these terms. If it is assumed that RIAs reduce the perceived risklevels between member countries and should lead to more integrated economic structures,
ns of homogeneity by firms and thus that
c region in the period 1990 to 2001. References totended to refer only to theot possible to establish a
10,000 jobs for General Electric and its suppliers’. In 1997, GE was unable to cite any job gains due to trade with Mexico, while the Department of Labor's NAFTA TradeAdjustment Assistance program (NAFTA TAA) certified that GE had laid off 2,304 workers due to NAFTA, nearly all due to a ‘shift in production to Mexico’.The strategic rhetoric, therefore, has to be critically evaluated in light of strategic reality.
7.1.2 RIAs in core company geographic segment reporting
Core companies’ strategic realities (g
it is possible that RIAs lead to increased perceptiothe underlying regions themselves become geographic segments.A relatively simple analysis of geographic segment reporting in core company annualreports can show whether e.g. ‘NAFTA’ or ‘EU’ are included as geographic segments, and whether that tendency increased over the course of the 1990s. Table 7.1 shows the numberof firms from both regions which included some form of NAFTA (e.g. ‘NAFTA’, ‘otherNAFTA’) or the European common market (e.g. ‘EEC’, ‘EC’, ‘EU’, ‘SEM’, ‘otherEuropean Community’) as a geographi‘North America’ and ‘Europe’, although it is possible they are inrespective RIA member countries, were not included as it was ndistinction between those referring to an ambiguous geographic region and those referringto the political region associated with the RIA.
Table 7.1: RIA-specific segments in core company annual reports, 1990-2001
1990 1991 1992 1993 1994 1995 1996 1997 1998 1999 2000 2001
EU 17 19 17 14 14 14 14 14 21 22 17 13
NAF 1 1 1
Even keeping in mind that a considerable number of firms in the sample were domesticand thus did not report any segmentation at all, the table still reveals only modest levels ofRIA-relevant segment reporting for Europe and virtually no references to the NAFTA.More importantly, there is an absence of a clear positive overall trend, let alone an obvious upswing after 1992. After declining for the mid-1990s, the number of firms referring toEurope as a political entity rose to 22 in 1999 before subsequently declining to 13 in 2001.Although numbers fluctuate because firms change their segmentation over time (becomingin some cases more specific and in others more aggregated; see Appendix II), this is in part also a reflection of a change in sample size due to mergers and acquisitions (see section
209
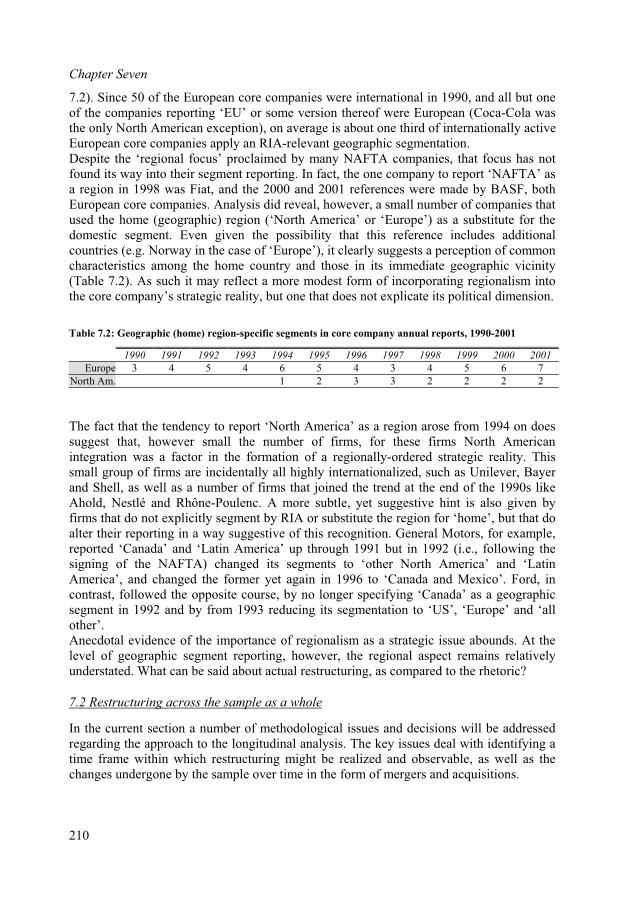
Chapter Seven
7.2). Since 50 of the European core companies were international in 1990, and all but one of the companies reporting ‘EU’ or some version thereof were European (Coca-Cola wasthe only North American exception), on average is about one third of internationally active
l
European core companies apply an RIA-relevant geographic segmentation.Despite the ‘regional focus’ proclaimed by many NAFTA companies, that focus has notfound its way into their segment reporting. In fact, the one company to report ‘NAFTA’ as a region in 1998 was Fiat, and the 2000 and 2001 references were made by BASF, bothEuropean core companies. Analysis did reveal, however, a small number of companies that used the home (geographic) region (‘North America’ or ‘Europe’) as a substitute for thedomestic segment. Even given the possibility that this reference includes additionacountries (e.g. Norway in the case of ‘Europe’), it clearly suggests a perception of commoncharacteristics among the home country and those in its immediate geographic vicinity(Table 7.2). As such it may reflect a more modest form of incorporating regionalism intothe core company’s strategic reality, but one that does not explicate its political dimension.
Table 7.2: Geographic (home) region-specific segments in core company annual reports, 1990-2001
1990 1991 1992 1993 1994 1995 1996 1997 1998 1999 2000 2001
Europe 3 4 5 4 6 5 4 3 4 5 6 7
North Am. 1 2 3 3 2 2 2 2
The fact that the tendency to report ‘North America’ as a region arose from 1994 on doessuggest that, however small the number of firms, for these firms North Americanintegration was a factor in the formation of a regionally-ordered strategic reality. Thissmall group of firms are incidentally all highly internationalized, such as Unilever, Bayerand Shell, as well as a number of firms that joined the trend at the end of the 1990s likeAhold, Nestlé and Rhône-Poulenc. A more subtle, yet suggestive hint is also given byfirms that do not explicitly segment by RIA or substitute the region for ‘home’, but that doalter their reporting in a way suggestive of this recognition. General Motors, for example,reported ‘Canada’ and ‘Latin America’ up through 1991 but in 1992 (i.e., following thesigning of the NAFTA) changed its segments to ‘other North America’ and ‘LatinAmerica’, and changed the former yet again in 1996 to ‘Canada and Mexico’. Ford, incontrast, followed the opposite course, by no longer specifying ‘Canada’ as a geographicsegment in 1992 and by from 1993 reducing its segmentation to ‘US’, ‘Europe’ and ‘allother’.Anecdotal evidence of the importance of regionalism as a strategic issue abounds. At thelevel of geographic segment reporting, however, the regional aspect remains relativelyunderstated. What can be said about actual restructuring, as compared to the rhetoric?
7.2 Restructuring across the sample as a whole
In the current section a number of methodological issues and decisions will be addressed regarding the approach to the longitudinal analysis. The key issues deal with identifying atime frame within which restructuring might be realized and observable, as well as thechanges undergone by the sample over time in the form of mergers and acquisitions.
210
Realized strategies under regionalism
7.2.1 Methodological considerations
In Chapter 6, 1990 was taken as the ‘pre-RIA baseline’ in order to establish clear periodsfor a before-and-after comparison. Strictly speaking, for a given RIA, t=0 is the year inwhich the RIA took effect. For the EU this would be 1993 and for the NAFTA region1994. According to Jovanovic (2001: 75), however, it should take ‘several years’ before the dynamic effects of integration in Europe ‘such as the restructuring of production’ kiin. For the NAFTA countries, on the other hand, an existing de facto level of integratio
ckn
changes will occur moreinto a first period (1991-
e missing. The common
close to hypothetical missing values, bute clusters are too small to generate reliable estimates. An excellent predictor of any of
ime t is the value of theailable foreign asset
ercen (t g i ti a fo ears fro 0 g 11146 of 1342 t l po e rva s (1 firm imes 11 years), th alue t va
era e less han two percent from the value at -1, wi h a st dard eviat of
since 1987 plus ‘shallower’ integration make it likely thatquickly. On these grounds, the longitudinal analysis was divided1995) and a second period (1996-2001), to be analyzed relative to the baseline 1990. Sincethe variables underlying the data are relatively volatile (currency-based and thus subject to relatively substantial year-on-year exchange rate and valuation fluctuations), the values are averaged out over each period.The decision to average is also based on two related considerations that revolve around theproblem of missing values. Percentages of e.g. degree of internationalization, or extra-regional activity could not be calculated for all 122 firms for each year. Sometimes this was related to changes in reporting styles, sometimes due to the simple unavailability ofreliable data (see Appendix II). In at least 17 cases, missing values after 1997 were relatedto a merger or acquisition by which the firm simply ceased to exist as a distinct,measurable entity. Therefore for any given year, and increasingly so through time,anywhere from ten to twenty values for a given variable may boption in that case is to calculate the averages for the available N each year, assuming the missing values each year are random, from a representative subset of firms and normallydistributed. This option was rejected for two reasons.Firstly, there exists considerable variability across the sample in internationalizationvariables. The overall degree of internationalization, for instance, ranges from a minimumof 0 percent to a maximum of 97 percent. For the sample of 122 firms as a whole, an average of an available 110 firms per year may be adequate. But since the analysis is based on splitting the sample into region- and strategy-based clusters, using the average valuesfor the sample as a whole will distort the analysis of individual clusters. The averagevalues of other strategy cluster members may beththe internationalization variables for any given missing value at tsame variable for that firm at t-1. This can be illustrated by using all avp tages he de ree of nterna onaliz tion) r all y m 199 throu h 200 .With
ota ssibl obse tion 22 s t e v at riedon av g t t t an d ion ninepercent. Thus the firm with the missing value at t actually provides a reasonable estimateof its own missing value.The second consideration involves the issue of mergers and acquisitions (see also below). Since the sample size actually decreases over time due to the acquisition of somecompanies in the sample by other companies in the sample, averaging values over the sample as a whole for each individual year will place too much emphasis on the overall effects of those acquisitions. The objective of this study is to consider the spatialorganization of firms in the period prior to 1995 and the period after 1995, regardless ofwhether the period after 1995 ended in 1998, 1999 or 2001 for any individual firm. Taking
211
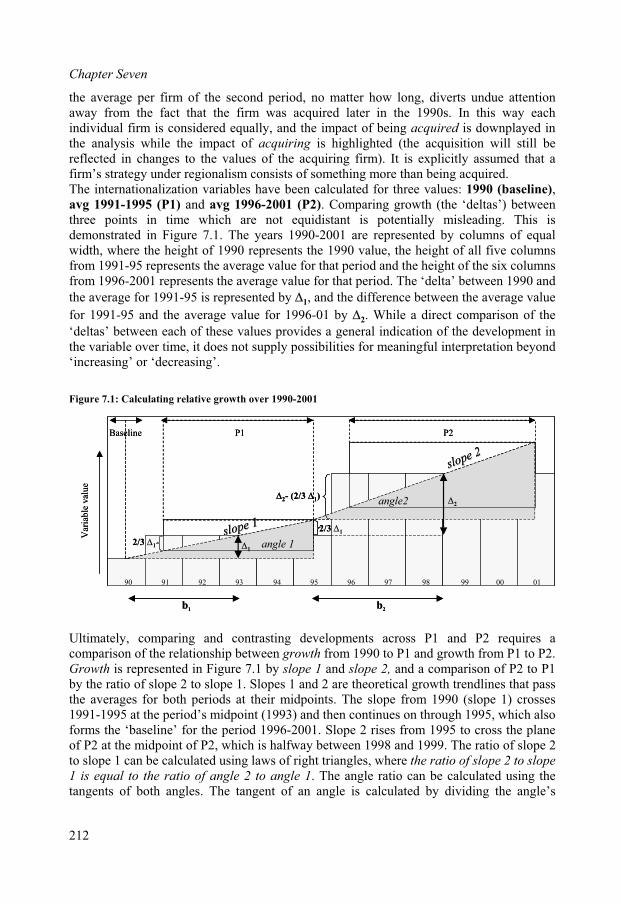
Chapter Seven
the average per firm of the second period, no matter how long, diverts undue attentionaway from the fact that the firm was acquired later in the 1990s. In this way each individual firm is considered equally, and the impact of being acquired is downplayed inthe analysis while the impact of acquiring is highlighted (the acquisition will still be
r 1991-95 and the average value for 1996-01 by 2. While a direct comparison of the
ent ine, it does not supply possi beyond
‘de as
igure 7.1: Calculating relative growth over 1990-2001
to P1 by the ratio of slope 2 to slope 1. Slopes 1 and 2 are theoretical growth trendlines that pass
ts. The slope from 1990 (slope 1) crosses1991-1995 at the period’s midpoint (1993) and then continues on through 1995, which also
g thetangents of both angles. The tangent of an angle is calculated by dividing the angle’s
reflected in changes to the values of the acquiring firm). It is explicitly assumed that a firm’s strategy under regionalism consists of something more than being acquired.The internationalization variables have been calculated for three values: 1990 (baseline),avg 1991-1995 (P1) and avg 1996-2001 (P2). Comparing growth (the ‘deltas’) betweenthree points in time which are not equidistant is potentially misleading. This isdemonstrated in Figure 7.1. The years 1990-2001 are represented by columns of equalwidth, where the height of 1990 represents the 1990 value, the height of all five columnsfrom 1991-95 represents the average value for that period and the height of the six columnsfrom 1996-2001 represents the average value for that period. The ‘delta’ between 1990 and
the average for 1991-95 is represented by 1, and the difference between the average value
fo
‘deltas’ between each of these values provides a general indication of the developmthe variable over tim‘in g
bilities for meaningful interpretation creasin ’ ro cre in .g’
F
90 91 92 93 94 95 96 97 98 00 01
b1
angle 1angle 11
slope 1slope 1
angle2angle2
slope 2slope 2
P1 P2
Var
iab
le v
alu
e
Baseline
2/3 1
2- (2/3 1)
99
2/3 1
2
b2
90 91 92 93 94 95 96 97 98 00 01
b1
angle 1angle 11
slope 1slope 1
angle2angle2
slope 2slope 2
P1 P2
Var
iab
le v
alu
e
Baseline
2/3 1
2- (2/3 1)
99
2/3 1
2
b2
Ultimately, comparing and contrasting developments across P1 and P2 requires acomparison of the relationship between growth from 1990 to P1 and growth from P1 to P2. Growth is represented in Figure 7.1 by slope 1 and slope 2, and a comparison of P2
the averages for both periods at their midpoin
forms the ‘baseline’ for the period 1996-2001. Slope 2 rises from 1995 to cross the planeof P2 at the midpoint of P2, which is halfway between 1998 and 1999. The ratio of slope 2 to slope 1 can be calculated using laws of right triangles, where the ratio of slope 2 to slope
1 is equal to the ratio of angle 2 to angle 1. The angle ratio can be calculated usin
212
Realized strategies under regionalism
opposite leg by the angle’s adjacent leg. The opposite leg of angle 1 is equal to 1 and its
*
adjacent leg b1. Since 1993 equals 1990 plus three, b1 always equals three.
The opposite leg of angle 2 is equal to the difference between the value for 1995 (its‘baseline’) and the midpoint of P2, halfway between 1998 and 1999 (i.e. 1998.5). This is
not equal to 2 because 2 is calculated from the average value of P1. The vertical
difference between the value at the midpoint 1998.5 and the baseline, 1995, is 2 minus
two-thirds of 1. The midpoint of P2, 1998.5, is 3.5 points away from 1995, such that the
adjacent leg of angle 2 (b2) equals 3.5.
Thus the slope of angle 1 is equal to 2/3 and the slope of angle 2 is equal to [ 2-
(2 1/3)]/3.5, such that the relationship between slope 2 and slope 1 is:
slope 2 (tan) angle 2 3 [ 2 – (2 1/3)]= =
slope 1 (tan) angle 1 3.51
The relationship between slopes over 1990-1995 and 1996-2001 will be used to show acceleration / deceleration trends in the rate of internationalization, termed relative growth(RELGR), to compare and contrast trends in the two respective periods under study.The subsidiary data, on the other hand, have been collected for three distinct time frames:1990, 1995 and 2001. The data reflect the status of core company subsidiary bases at theend of the year. Although the strategy variables are based on running averages over 1991-95 and 1996-01 respectively and the organization variables on single years (1995 and2001, respectively), correlations can be expected on the grounds that assets and salesshares, as continuous variables subject to fluctuations and based on figures rounded to thenearest million (in currencies), will generate more reliable and stable figures if averagedover a number of years. It is assumed that individual subsidiaries do not fluctuate as muchin absolute numbers nearly as much as they do in terms of their ‘dollar’ value.It is also relevant to note that the strategy typology identified in the previous chapter isbased on the 1990 values for the variables in question. Analysis over time allows for thepossibility that the underlying values change such that a given case remains classified as a given strategy type even though this is no longer the case. For the sake of continuity theclusters will be followed over time, but at the end ‘reclassified’ according to their mostrecent data. In this way overall strategy migrations remain the focus. This approach not only preserves the continuity but also allows for a clear comparison between ‘before’ and ‘after’, considering not only growth rates but also the baseline position. In this way firmswith similar growth rates but different starting points will not necessarily be on the samestrategic path.Given the small sample size relative to the number of clusters (across two home regions),no large-scale abstract modeling is attempted here. The strategy migrations will be dealtwith descriptively, delving into the changes and allowing for departures from the ‘norm’where necessary. Generalizability is not a problem since the study largely deals with thepopulation of European and North American core companies and is not intended torepresent the behavior of firms in general.The longitudinal analysis will be opened with a discussion of overall trends among the sample. The second step is to discuss the sample in terms of the two central differentiatingaspects: region of origin and strategy clusters. In keeping with the exploratory nature of the
213
Chapter Seven
study, the discussion over the three dimensions of analysis (scale and scope ofinternationalization, network spread and organizational structure) will focus on the salientaspects as relevant for the various strategies. An analysis of extra-regionality, for instance,is considerably less relevant for domestically- or regionally oriented firm strategies thanfor bi-regional and global strategies. For the former therefore the emphasis will be more onoverall internationalization and intra-regionality as opposed to extra-regionality.
also for tapping into human capital and other forms ofreated assets’. Cross-border (majority held) mergers and acquisitions in the second half
per cent between 1997 and 1998. In 1997 arise of more than 45 per cent was noted (UNCTAD, 1999) and in 1999 the increase was 35 per cent, reaching – according to UNCTAD estimates - $720 billion in over 6,000 deals (UNCTAD, 2000: 10). Companies in the Core200 were major players in the flurry of M&A activity in the late 1990s. In a small number of cases, M&A activity took placeamong the Core200. By 1998, 195 of the original Core200 selected in 1995 were left asindependent entities. The M&A trend accelerated between 1998 and 2000. Including the M&As up through 2001, the number of core companies eventually left is reduced to 185(excluding the merger between Chevron and Texaco, which took place nearly at the end ofthe period under study).While mergers and acquisitions are grouped together conceptually, only less than 3 per cent are pure mergers (UNCTAD, 2000). Although the distinction is often difficult toidentify, acquisitions predominate. In fact many announced mergers are de factoacquisitions by stronger partners (e.g. the DaimlerBenz takeover of Chrysler was portrayedas a merger between two equal partners, but in practice quickly turned out to be an
Additionally, some strategy clusters represent small numbers of firms with potentiallydivergent strategies. Thus although the analysis will be principally concerned with overall patterns and average values per cluster, where relevant individual cases will be discussedin order to create nuances and make the link to ‘real practice’. Before moving to theanalysis, the issue of changes to the sample over time will be addressed.
7.2.2 The inclusion of acquired firms in the longitudinal analysis
Since the mid-1990s cross-border M&As have become the primary mode through whichinternationally operating companies (especially European and US companies) expand abroad. M&As, as opposed to greenfield investments, are considered a fast way forcompanies to build up a locational portfolio and gain access to foreign markets – not only or inputs and sales growth, butf
‘cof the 1990s increased in number by almost 74
acquisition after most of the US top managers left the Board). While the Core200 are major actors in the current M&A wave, they are also subject to takeovers by othercorporations – in all but three cases (Vodafone, Albertson’s, Bell Atlantic) at the hand of a fellow Core200 company (Table 7.3).
214

Realized strategies under regionalism
Table 7.3: The impact of the M&A wave on the sample, 1990-2002
Company name Country Deal Company name Country Date New name
Ciba-Geigy Switzerland Merged Sandoz Switzerland Dec. 1996 Novartis
Lyonnaise des Eaux
France Acquired Cie. de Suez France June 1997 Suez Lyonnaisedes Eaux
Boeing US Acquired McDonnelDouglas
US Aug. 1997 Boeing
Compaq US Acquired DigitalEquipment
US June 1998 Compaq
WorldCom US Acquired MCI Com US Sept. 1998 Worldcom
Thyssen Germany Acquired Krupp / Hoesch-Krupp
Germany Oct. 1998 Thyssen Krupp
Daimler-Benz Germany Acquired Chrysler US Nov. 1998 DaimlerChrysler
BP UK Acquired Amoco; ARCO US Dec. 1998; April2000
BP
BTR UK Merged ithw Siebe UK Feb. 1999 Invensys
Total France Acquired Petrofina; Elf Belgium;France
June 1999, Feb.2000
Total Fina Elf
Albertson’s US Acquired American Stores US June 1999 American Stores
Carrefour France Acquired Promodes France Oct. 1999 Carrefour
Exxon US Acquired Mobil US Nov. 1999 Exxon Mobil
Allied Signal US Merged with Honeywell US Dec. 1999 Honeywell
Rhône-Poulenc France Acquired Hoechst Germany Dec. 1999 Aventis
VodafoneAirTouch
UK Acquired Mannesman AG Germany April 2000 VodafoneAirTouch
Veba AG Germany Acquired Viag Germany June 2000 E.ON
Bell Atlantic US Acquired GTE Corp US June 2000 Verizon
Chevron US Acquired Texaco US Oct. 2000 ChevronTexaco
Philip Morris US Acquired RJR Nabisco US Dec. 2000 Philip Morris
Source: based on Van Tulder et al., 2001
Table 7.3 shows that most of the major deals among the Core200 were acquisitions as opposed to mergers. Further, the data show that the majority of all deals are made betweencore companies from the same country, and only three took place between firms fromdifferent regions (BP’s purchase of Amoco and ARCO, and the DaimlerChrysler deal). Anoverview of M&As by size of home country and sector (of the acquired firm) shows thatcore companies were largely acquired in large and medium countries (eight and seven cases, respectively) and in vehicles, aerospace and industrial equipment (VEHIC) andpetroleum, mining and metals (PETR), in which four and seven core companies were acquired, respectively (Table 7.4).
Table 7.4: M&As by sector and size of home country, 1990-2002
Country size VEHIC CHEM COMP FOOD RETAIL PETR SERV CONST N
LARGE 1 2 1 5 8
MEDIUM 3 1 1 2 7
SMALL
Total 4 1 2 1 1 7 16
215
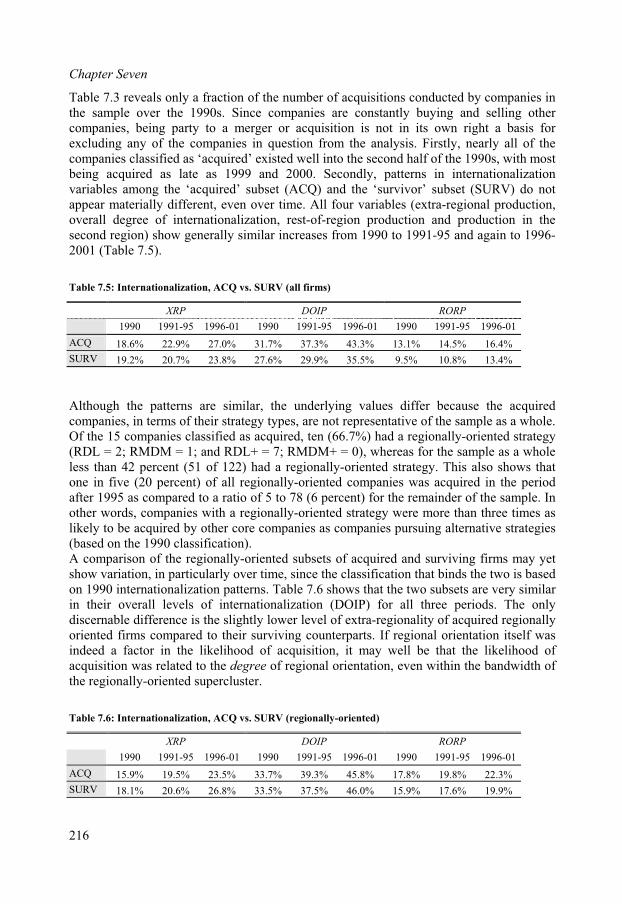
Chapter Seven
Table 7.3 reveals only a fraction of the number of acquisitions conducted by companies inthe sample over the 1990s. Since companies are constantly buying and selling other companies, being party to a merger or acquisition is not in its own right a basis forexcluding any of the companies in question from the analysis. Firstly, nearly all of thecompanies classified as ‘acquired’ existed well into the second half of the 1990s, with mostbeing acquired as late as 1999 and 2000. Secondly, patterns in internationalizationvariables among the ‘acquired’ subset (ACQ) and the ‘survivor’ subset (SURV) do notappear materially different, even over time. All four variables (extra-regional production,overall degree of internationalization, rest-of-region production and production in thesecond region) show generally similar increases from 1990 to 1991-95 and again to 1996-2001 (Table 7.5).
Table 7.5: Internationalization, ACQ vs. SURV (all firms)
XRP DOIP RORP
1990 1991-95 1996-01 1990 1991-95 1996-01 1990 1991-95 1996-01
ACQ 18.6% 22.9% 27.0% 31.7% 37.3% 43.3% 13.1% 14.5% 16.4%
SURV 19.2% 20.7% 23.8% 27.6% 29.9% 35.5% 9.5% 10.8% 13.4%
Although the patterns are similar, the underlying values differ because the acquired companies, in terms of their strategy types, are not representative of the sample as a whole. Of the 15 companies classified as acquired, ten (66.7%) had a regionally-oriented strategy(RDL = 2; RMDM = 1; and RDL+ = 7; RMDM+ = 0), whereas for the sample as a wholeless than 42 percent (51 of 122) had a regionally-oriented strategy. This also shows thatone in five (20 percent) of all regionally-oriented companies was acquired in the periodafter 1995 as compared to a ratio of 5 to 78 (6 percent) for the remainder of the sample. In other words, companies with a regionally-oriented strategy were more than three times aslikely to be acquired by other core companies as companies pursuing alternative strategies (based on the 1990 classification).A comparison of the regionally-oriented subsets of acquired and surviving firms may yetshow variation, in particularly over time, since the classification that binds the two is basedon 1990 internationalization patterns. Table 7.6 shows that the two subsets are very similarin their overall levels of internationalization (DOIP) for all three periods. The onlydiscernable difference is the slightly lower level of extra-regionality of acquired regionallyoriented firms compared to their surviving counterparts. If regional orientation itself wasindeed a factor in the likelihood of acquisition, it may well be that the likelihood of acquisition was related to the degree of regional orientation, even within the bandwidth of the regionally-oriented supercluster.
Table 7.6: Internationalization, ACQ vs. SURV (regionally-oriented)
XRP DOIP RORP
1990 1991-95 1996-01 1990 1991-95 1996-01 1990 1991-95 1996-01
ACQ 15.9% 19.5% 23.5% 33.7% 39.3% 45.8% 17.8% 19.8% 22.3%
SURV 18.1% 20.6% 26.8% 33.5% 37.5% 46.0% 15.9% 17.6% 19.9%
216
Realized strategies under regionalism
Given that a as b ablishe nizatio ableseg e r 6 ely gan and ne
e values would reveal fferent ure. Si the ional aren one- alues (1990, 1995 and 2001) as o ng pe rages
rateg ariable the 1990 and 1995 values able firmsin the od 1995 shows the netw he
ally ented he ich shows that region edve a et ead than acquire ll firms
Table 7.7: Network spread, ACQ vs. SURV (regionally-oriented)
HO F
solid correlation h een est d between the orga nal variand the stratvariab
y variabl s (Chapte ), it is unlik that or izational twork spreadvariablesl
based o a di pict nce
opposed torganizat the runnioff v riod ave
of the stacquired
y vperi
s, onlyto 2001.
are availork spread vari
for theables for tTable 7.7
two region -ori subsets. T data, wh surviving ally orientfirms ha greater n work spr d regiona y oriented , support thedata in Table 7.6.
DOISUB STC HER
1990 1995 1990 1995 1990 1995
ACQ 46.7% 50.5% 727. 32.8 0.611 0.608
SURV 60.6% 59.5% 5 .430. 34 0.545 0.541
The third and l argu inc i itudin is isership change d re ignal an abrupt departure from a atial
hry s acti ex nsta i e exte theyerger mle n fac quisiti ave be
fo pursuit of an extra ven t the o ggional activity in the early 1990s (after having retreated
t the brink of bankruptcy in the 1980s). Whatever the motivation behind an acquisition,cquired firms are not always seamlessly ‘absorbed’ (cf. De Wit and Meyer, 2003) and the
nceptually be expected to show differences such as the tal number of subsidiaries, number of host countries, or organizational depth do in fact
1995 (pre-acquisition) and 2001ents the subset
o and ng e
T parison of growt es, BUYERS vs. THER ( 95-2001)
fina ment for luding acquired firms n the long al analysspthat own oes not di ctly s firm’s
strategy. Cr to
sler’ vities in M ico, for i. I
nce, rema n to a larg nt whatwere prio the m with Dai r-Benz t, ac on may h en Chrysler’sbest option r the -regional strategy gi hat it was nly of the BiThree without significant extra-reaaacquired subsidiaries often persist within the new core company network, simply being‘passed on’ to new owners. Moreover, these changes and subsequent alterations in strategyand structure under that new ownership, will be reflected in the internationalization andorganization of the acquiring firm. Since the same argument applies to all the otheracquisitions undertaken over the 1990s that did not involve other Core200 companies and are therefore not listed in Table 7.3, there is no reason to omit those acquisitions that didinvolve other Core200 companies. This is demonstrated by exploring changes betweenthose firms that acquired other core companies (BUYER) and those survivors that did not(OTHER). Variables which may cotoshow no material differences in growth rates between(post-acquisition) (Table 7.8). On the basis of these and the preceding argum
f acquired ( acquiri ) firms is includ d.
able 7.8: A com h rat O 19
N TOTSUB HOSTC MXLEV
BUYER 15 21.9% 2.5% 19.8%
OTHER 74 24.2% 2.1% 24.4%
217
Chapter Seven
The decision to include the acquired firms in the overall analysis has consequences for theindicator values across the entire sample given the nature of the variables. Since the variables are based on average values over 1991-1995 and 1996-2001, a firm acquired in1999 will have average values for 1996-01 based on the values for 1996-1998. Theacquiring firm’s values will be based on the average over the entire period (1996-2001)and thus to some extent the acquisition will be counted ‘double’ in the overall values for the sample. However, this only creates potential for serious distortion in cases where the acquired firm’s strategy (and geographic spread) differs considerably from that of the acquiring firm. In other words, if a firm with 45 percent extra-regional activity acquiresanother firm with 45 percent extra-regional activity, the average for the new merged firmwill still be 45 percent over the period, assuming they are based in the same region. This
ill for instance be the case for Exxon and Mobil, both global companies in 1990 withwith RDL+ strategies. Cross-regional
sition of Amoco and ARCO will clearly ad to significa creases in the ext onal character ofternatio at s an p of the
gy s a l ill be disc u tio
.2.3 Internationalization across the sample
wsimilar profiles, or Chevron and Texaco, bothM&As, such as DaimlerChrysler and BP’s acquile nt in ra-regi Daimler’s and BP’s in naliz ion strategy. The effect of ownership ch ge on the com ositionstrate subset nd on individua firms w ussed in subseq ent sec ns.
7
An overview of average changes in internationalization, network spread and organizationalstructure for the sample as a whole provides a backdrop for the discussion of sectors,countries and strategy clusters. Table 7.9 compares intra-regional and extra-regionalinternationalization in 1990, 1991-95 and 1996-01. The last two columns represent thedifference (deltas) between 1990 and 1991-95, and 1991-95 and 1996-01, respectively.
Table 7.9: Intra- vs. extra-regional internationalization, all companies (1990-2001)
Variables 1990 1991-95 1996-01 Slope P1 Slope P2 RELGR
DOIPa28.1% 30.8% 36.5% 0.92% 1.10% 1.20
RoRPb10.0% 11.3% 13.8% 0.44% 0.45% 1.03
XRP 19.1% 21.0% 24.2% 0.61% 0.58% 0.95
a: N=117 Excludes Shell, Unilever, Novartis, Bayer and Compaq (home region instead of home country)b: N=116 Excludes Lockheed, for which no regional data were available
On the whole, the sample has become more international, with internationalizationcontributing both to intra-regional and extra-regional growth. The overall degree of internationalization increased from 28 percent in 1990 to an average of over 30 percent in
991-95 and over 36 percent in 1996-01. This represents an average rise in the DOIP ade. The extra-regional share of
internationalization increased by just over half a percentage point per year and the intra-egional share by under half a percent int, meaning that o extra-regionalxpansio ounted fo g a n n io ional
sion.
1percentage of about one percent point per year over the dec
r just age po verall,e n acc r a lar er sh re of i ternatio alizat n than intra-reg
expan
218

Realized strategies under regionalism
The slopes show that the rate of internationalization from 1990-1995 was just under one ercent per year and just over one percent per year from 1996-2001. The ratio of these two
after 1995 was an intra-regional phenomenon.he fact that extra-regional expansion was larger does not necessarily make it more
fact that the ratio of rest-of-regiont t 19.1%) in 1990 to
.57 (13.8% / over 1996-2 Table 7.9). A e extra-regional share of theorld eco (as ia t for ’ eco c act s larger than the intra-
regional share of the world economy f rms oth Europe and North America.Focusing on just th d re (Nor erica or Europ ’ regions) may help
ut the extra-regional and intra-regional components of internationalization in betterperspective. Table 7.10 shows that activity in the second region (RG2P) as a share of the
pslopes is 1.20:1, which shows that the rate of internationalization in the second period was 20 percent higher than the rate in the first period. Despite the larger overall extra-regionalpush over the decade, the ratios of slope 2 to slope 1 for extra-regional internationalization is below one, which indicates that the rate of internationalization actually decreased over the second period. Meanwhile the ratio of slope 2 to slope 1 for intra-regionalinternationalization is higher than one, showing that the rate of internationalization withinthe home region increased after 1995. While overall extra-regional expansion was greaterthan overall intra-regional expansion in both periods, the acceleration in the rate of
internationalizationTimportant ‘pound for pound’. This is evidenced by theactivi y o extra-regional activity increased from just over 0.52 (10% /0 24.2%) 001 (see lso, thw nomy a potent l targe firms nomi ivity) i
or fi from be secon gion th Am e as ‘host
p
whole increased only very slightly over the decade (from under 18 percent in 1990 tonearly 20 percent in 1996-01), but that the rate of expansion in the second region after1995 was close to zero (0.09 percent). Compared to the rate of internationalization withinthe home region, expansion aimed at the second region was much more modest.
Table 7.10: The role of the second region in extra-regionality, RDL+ through GLMDM (1990-2001)
Variables 1990 1991-95 1996-01 Slope P1 Slope P2 RELGR
RG2Pc17.8% 18.8% 19.7% 0.32% 0.09% 0.27
XR2Pc61.3% 60.2% 58.0% -0.37% -0.41% 1.10
c: N=72 Excludes companies with less than ten percent production in second region
Expansion in the second region was also much more modest than overall extra-regionalinternationalization. This is evidenced by the declining role of the second region as a shareof extra-regional activity (XR2P) over time. While the second region accounted for over 61 percent of all extra-regional activity in 1990, over 1996-01 that share had been reduced to 58 percent. Thus whereas the second region grew as a share of total activity, it accounted for a smaller share of overall extra-regionality and was therefore not the focus
of the extra-regional internationalization thrust. Also, the deceleration in growth forsecond-region activity (RG2P) in 1996-01 relative to 1990-95 means that the rate of
ecline in the importance of the second region (RELGR of XR2P) increased from 1996-01 second region, therefore,enefited primarily intra-
egional expansion and came in larg t the exp he second region.h focus s s on the i tionalization of production, the
analysis c exte include changes to the geographic composition of sales activity
d
relative to 1990-95. When comparing the home region with thethe acceleration in the rate of internationalization after 1995 br e part a ense of tAlthoug the in the current tudy i nterna
an be nded to
219
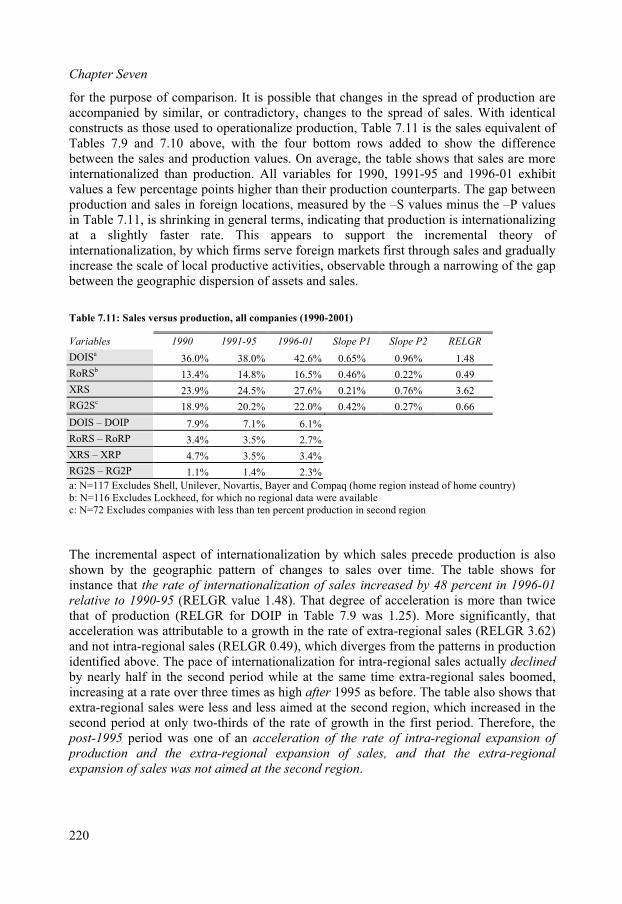
Chapter Seven
for the purpose of comparison. It is possible that changes in the spread of production are accompanied by similar, or contradictory, changes to the spread of sales. With identical constructs as those used to operationalize production, Table 7.11 is the sales equivalent of Tables 7.9 and 7.10 above, with the four bottom rows added to show the differencebetween the sales and production values. On average, the table shows that sales are moreinternationalized than production. All variables for 1990, 1991-95 and 1996-01 exhibitvalues a few percentage points higher than their production counterparts. The gap betweenproduction and sales in foreign locations, measured by the –S values minus the –P valuesin Table 7.11, is shrinking in general terms, indicating that production is internationalizingat a slightly faster rate. This appears to support the incremental theory ofinternationalization, by which firms serve foreign markets first through sales and graduallyincrease the scale of local productive activities, observable through a narrowing of the gap between the geographic dispersion of assets and sales.
Table 7.11: Sales versus production, all companies (1990-2001)
Variables 1990 1991-95 1996-01 Slope P1 Slope P2 RELGR
DOISa36.0% 38.0% 42.6% 0.65% 0.96% 1.48
RoRSb13.4% 14.8% 16.5% 0.46% 0.22% 0.49
XRS 23.9% 24.5% 27.6% 0.21% 0.76% 3.62
RG2Sc18.9% 20.2% 22.0% 0.42% 0.27% 0.66
DOIS – DOIP 7.9% 7.1% 6.1%
RoRS – RoRP 3.4% 3.5% 2.7%
XRS – XRP 4.7% 3.5% 3.4%
RG2S – RG2P 1.1% 1.4% 2.3%
a: N=117 Excludes Shell, Unilever, Novartis, Bayer and Compaq (home region instead of home country)
c: N=72 Excludes companies with less than ten percent production in second regionb: N=116 Excludes Lockheed, for which no regional data were available
The incremental aspect of in iona by sales precede production is alson by the geographic p of s to over The ta for
96-01
acceleration is more than twiceat of production (RELGR for DOIP in Table 7.9 was 1.25). More significantly, that
cceleration was attributable to a growth in the rate of extra-regional sales (RELGR 3.62)
ternat lization whichshow attern change sales time. ble showsinstance that the rate of internationalization of sales increased by 48 percent in 19
relative to 1990-95 (RELGR value 1.48). That degree of thaand not intra-regional sales (RELGR 0.49), which diverges from the patterns in productionidentified above. The pace of internationalization for intra-regional sales actually declinedby nearly half in the second period while at the same time extra-regional sales boomed,increasing at a rate over three times as high after 1995 as before. The table also shows thatextra-regional sales were less and less aimed at the second region, which increased in thesecond period at only two-thirds of the rate of growth in the first period. Therefore, thepost-1995 period was one of an acceleration of the rate of intra-regional expansion of production and the extra-regional expansion of sales, and that the extra-regional
expansion of sales was not aimed at the second region.
220
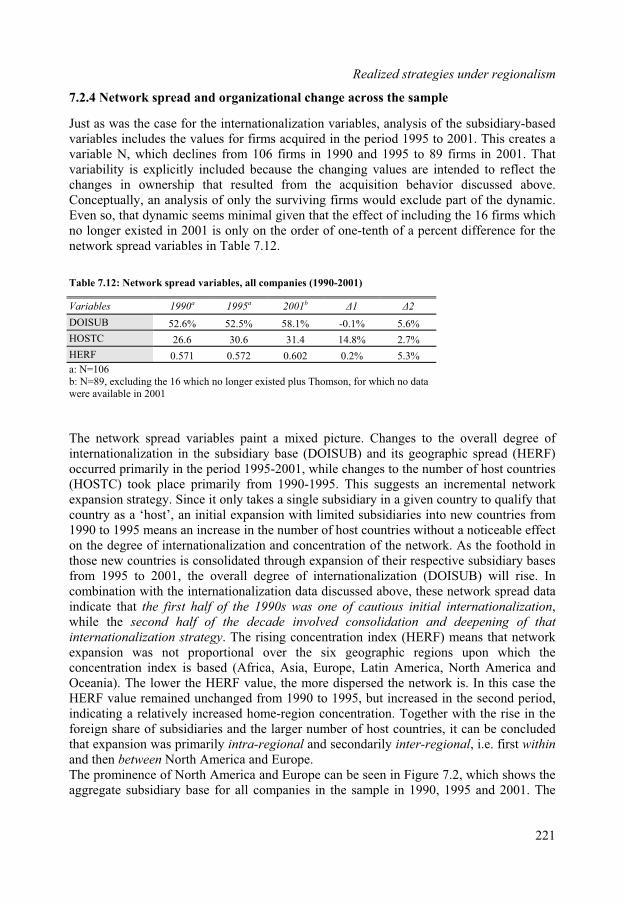
Realized strategies under regionalism
7.2.4 Network spread and organizational change across the sample
Just as was the case for the internationalization variables, analysis of the subsidiary-basedvariables includes the values for firms acquired in the period 1995 to 2001. This creates a variable N, which declines from 106 firms in 1990 and 1995 to 89 firms in 2001. Thatvariability is explicitly included because the changing values are intended to reflect the changes in ownership that resulted from the acquisition behavior discussed above.Conceptually, an analysis of only the surviving firms would exclude part of the dynamic.Even so, that dynamic seems minimal given that the effect of including the 16 firms whichno longer existed in 2001 is only on the order of one-tenth of a percent difference for thenetwork spread variables in Table 7.12.
Table 7.12: Network spread variables, all companies (1990-2001)
Variables 1990a 1995a 2001b 1 2
DOISUB 52.6% 52.5% 58.1% -0.1% 5.6%
HOSTC 26.6 30.6 31.4 14.8% 2.7%
HERF 0.571 0.572 0.602 0.2% 5.3%
a: N=106b: N=89, excluding the 16 which no longer existed plus Thomson, for which no data were available in 2001
The network spread variables paint a mixed picture. Changes to the overall degree ofinternationalization in the subsidiary base (DOISUB) and its geographic spread (HERF)
ccurred primarily in the period 1995-2001, while changes to the number of host countriestwork
rategy. Si t onl di ven country to thats a ‘host’ itial n w
to 1995 means an increase in the num host countries without a noticeable effect degree of in onali and c ration w s the old in
ective subsidiary bases om 1995 to 2001, the overall degree of internationalization (DOISUB) will rise. Inombination with the internationalization data discussed above, these network spread data
he
o(HOSTC) took place primarily from 1990-1995. This suggests an incremental neexpansion stcountry a
nce i, an in
y takes a siexpansio
ngle subsiith limited subsidiaries into new countries from
ary in a gi qualify
1990 ber ofon the ternati zation oncent of the net ork. A fooththose new countries is consolidated through expansion of their respfrcindicate that the first half of the 1990s was one of cautious initial internationalization,while the second half of the decade involved consolidation and deepening of that
internationalization strategy. The rising concentration index (HERF) means that networkexpansion was not proportional over the six geographic regions upon which theconcentration index is based (Africa, Asia, Europe, Latin America, North America and Oceania). The lower the HERF value, the more dispersed the network is. In this case the HERF value remained unchanged from 1990 to 1995, but increased in the second period,indicating a relatively increased home-region concentration. Together with the rise in theforeign share of subsidiaries and the larger number of host countries, it can be concludedthat expansion was primarily intra-regional and secondarily inter-regional, i.e. first within
and then between North America and Europe.The prominence of North America and Europe can be seen in Figure 7.2, which shows taggregate subsidiary base for all companies in the sample in 1990, 1995 and 2001. The
221
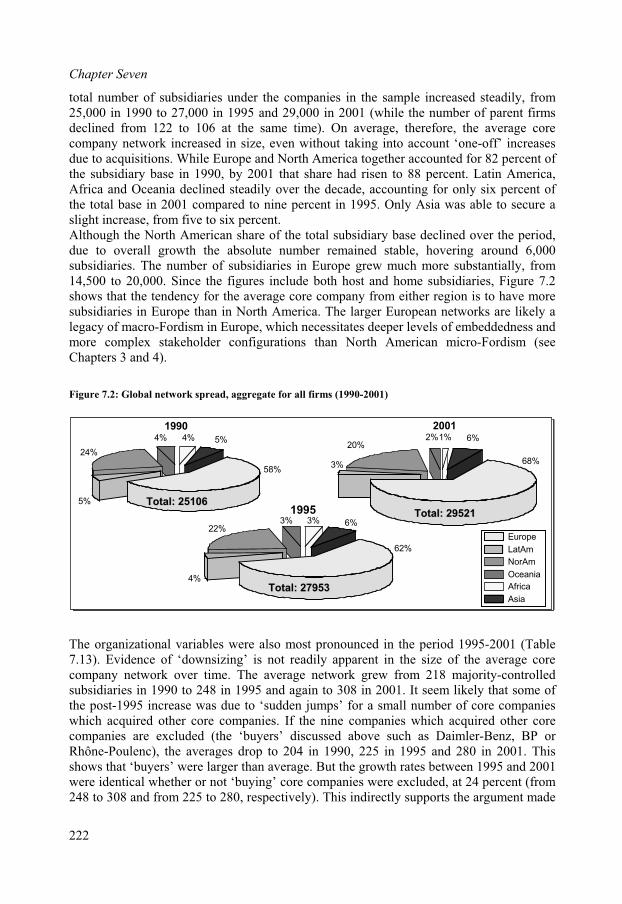
Chapter Seven
total number of subsidiaries under the companies in the sample increased steadily, from25,000 in 1990 to 27,000 in 1995 and 29,000 in 2001 (while the number of parent firmsdeclined from 122 to 106 at the same time). On average, therefore, the average corecompany network increased in size, even without taking into account ‘one-off’ increases due to acquisitions. While Europe and North America together accounted for 82 percent of the subsidiary base in 1990, by 2001 that share had risen to 88 percent. Latin America,Africa and Oceania declined steadily over the decade, accounting for only six percent of the total base in 2001 compared to nine percent in 1995. Only Asia was able to secure aslight increase, from five to six percent.Although the North American share of the total subsidiary base declined over the period,due to overall growth the absolute number remained stable, hovering around 6,000subsidiaries. The number of subsidiaries in Europe grew much more substantially, from14,500 to 20,000. Since the figures include both host and home subsidiaries, Figure 7.2
ows that the tendency for the average core company from either region is to have morea rger European networks are likely a
s deeper levels of embeddedness andmplex st lder ur a ordism (see
ers 3 and 4).
7.2: Global netwo ad, aggregate for s ( 01)
rowth rates between 1995 and 2001were identical whether or not ‘buying’ core companies were excluded, at 24 percent (from248 to 308 and from 225 to 280, respectively). This indirectly supports the argument made
shsubsidi ries in Europe than in North America. The lalegacy of macro-Fordism in Europe, which necessitatemore co akeho config ations th n North American micro-FChapt
Figure rk spre all firm 1990-20
The organizational variables were also most pronounced in the period 1995-2001 (Table7.13). Evidence of ‘downsizing’ is not readily apparent in the size of the average corecompany network over time. The average network grew from 218 majority-controlledsubsidiaries in 1990 to 248 in 1995 and again to 308 in 2001. It seem likely that some of the post-1995 increase was due to ‘sudden jumps’ for a small number of core companieswhich acquired other core companies. If the nine companies which acquired other corecompanies are excluded (the ‘buyers’ discussed above such as Daimler-Benz, BP or Rhône-Poulenc), the averages drop to 204 in 1990, 225 in 1995 and 280 in 2001. Thisshows that ‘buyers’ were larger than average. But the g
222
19904% 5%
58%
5%
24%
4%
Africa
Asia
Europe
LatAmNorAm
Oceania
20011% 6%
68%3%
20%2%
Total: 25106Total: 25106Total: 29521Total: 295211995
3% 6%
62%
4%
22%3%
Total: 27953Total: 27953
19904% 5%
58%
5%
24%
4%
Africa
Asia
Europe
LatAmNorAm
Oceania
20011% 6%
68%3%
20%2%
Total: 25106Total: 25106Total: 29521Total: 295211995
3% 6%
62%
4%
22%3%
Total: 27953Total: 27953

Realized strategies under regionalism
earlier that the acquisition of another core company does not make a core company eligible for special methodological consideration.
Table 7.13: Organizational variables, all companies (1990-2001)
Variables 1990a 1995a 2001b 1 2
TOTSUB 218.1 247.7 308.3 13.6% 24.5%
MAXLEV 4.7 4.9 6.0 3.2% 23.5%
PRIM 36.0% 38.2% 24.4% 2.3% -13.8%
CBL 36.1% 38.0% 30.0% 1.9% -8.0%
ab:: N=106; no data for 16 firms
N=89, excluding the16 acquired firms plus Thomson, for which no data wereavailable in 2001
As visualized in F .3, this network growth was prima e of hierarchical depth,given the increase i ximum level (M V) a subsidiaries as a
f the whole (PRIM). T epening involved expansi thin individual countriesas opposed to across countries, as evidenced by the declining share of subsidiary
kages in the subsidiarym between 35 and 40 percent in 1990-95 (CBL) to 30 percent in 2001.
st as for the network spread variables, the inclusion of the acquired firms in 1990 and
or
In Chapter 6 it was demonstrated that country size was negatively related tointernationalization in 1990. Core companies from large countries were the least
igure 7 rily onn ma XLE nd decrease in first-level
share o his de on wi
relationships extending across borders. The share of cross-border linnetwork shrank froJu1995 had almost no effect on the average values shown in Table 7.13.
Figure 7.3: Narrowing and deepening of core company networks (1990-2001)
For the sample in its entirety, therefore, all indicators show a tendency towards greatergeographic dispersion of production both intra- and extra-regionally. Change after 1995 was significantly greater than change before 1995, and the post-1995 acceleration was primarily intra-regional. To what extent these changes are suggestive of a ‘regionalintegration effect’ is best pursued at the level of individual regions and strategies.
7.2.5 Dynamics by country of origin and sect
Level 1
Level 2
Corp HQ
Level 3
Level 1
Level 2
Corp HQ
Level 3
223
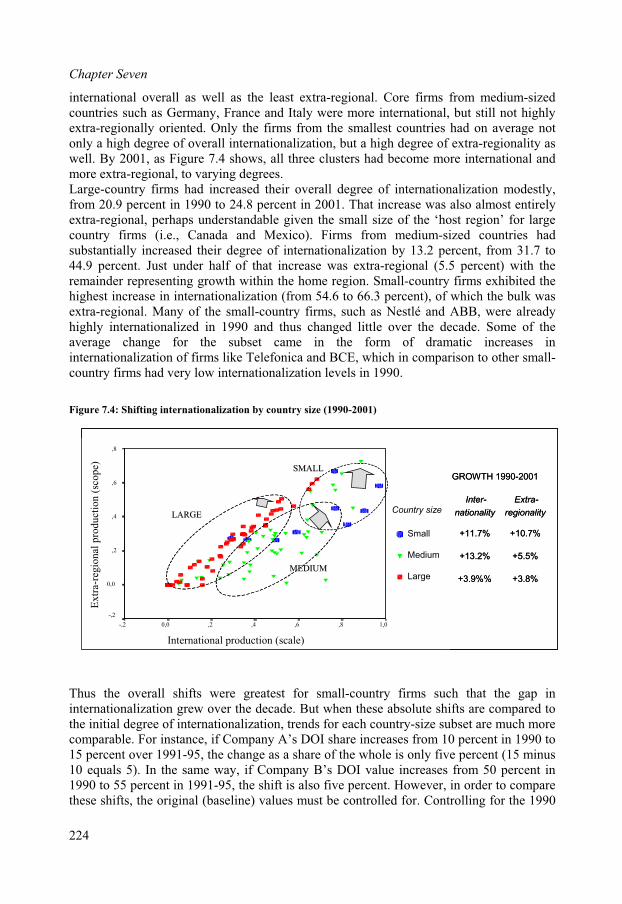
Chapter Seven
international overall as well as the least extra-regional. Core firms from medium-sizedcountries such as Germany, France and Italy were more international, but still not highly extra-regionally oriented. Only the firms from the smallest countries had on average notonly a high degree of overall internationalization, but a high degree of extra-regionality as well. By 2001, as Figure 7.4 shows, all three clusters had become more international andmore extra-regional, to varying degrees.Large-country firms had increased their overall degree of internationalization modestly,from 20.9 percent in 1990 to 24.8 percent in 2001. That increase was also almost entirelyextra-regional, perhaps understandable given the small size of the ‘host region’ for large
f firms like Telefonica and BCE, which in comparison to other small-country firms had very low internationalization levels in 1990.
Figure 7.4: Shifting internationalization by country size (1990-2001)
Thus the overall shifts were greatest for small-country firms such that the gap ininternationalization grew over the decade. But when these absolute shifts are compared to the initial degree of internationalization, trends for each country-size subset are much morecomparable. For instance, if Company A’s DOI share increases from 10 percent in 1990 to15 percent over 1991-95, the change as a share of the whole is only five percent (15 minus10 equals 5). In the same way, if Company B’s DOI value increases from 50 percent in 1990 to 55 percent in 1991-95, the shift is also five percent. However, in order to comparethese shifts, the original (baseline) values must be controlled for. Controlling for the 1990
country firms (i.e., Canada and Mexico). Firms from medium-sized countries hadsubstantially increased their degree of internationalization by 13.2 percent, from 31.7 to44.9 percent. Just under half of that increase was extra-regional (5.5 percent) with theremainder representing growth within the home region. Small-country firms exhibited thehighest increase in internationalization (from 54.6 to 66.3 percent), of which the bulk was extra-regional. Many of the small-country firms, such as Nestlé and ABB, were alreadyhighly internationalized in 1990 and thus changed little over the decade. Some of the average change for the subset came in the form of dramatic increases ininternationalization o
International production (scale)
1,0,8,6,4,20,0-,2
Extr
a-re
gio
nal
pro
du
ctio
n(s
cop
e)
,8
,6
,4
,2
0,0
-,2
CNTRYSZ
Small
Medium
Large
LARGELARGE
MEDIUMMEDIUM
SMALLSMALL
Country size
Small
Medium
Large
GROWTH 1990-2001
Inter-
nationality
+11.7%
+13.2%
+3.9%%
Extra-
regionality
+10.7%
+5.5%
+3.8%
224
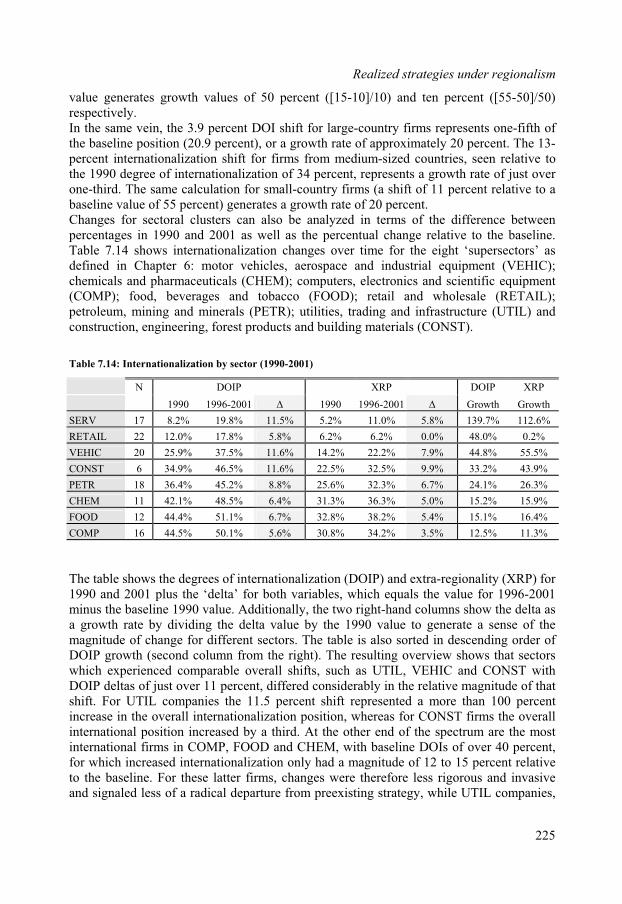
Realized strategies under regionalism
value generates growth values of 50 percent ([15-10]/10) and ten percent ([55-50]/50)respectively.
the same vein, the 3.9 percent DOI shift for large-country firms represents one-fifth of e approximately 20 percent. The 13-i um-sized countries, seen relative todegree o io tion of 34 perce epresents a growth rate of just over . The same calculat sm ntry (a shift of 11 percent relative to a
baseline value of 55 percent) generates a growth ra 20 pes for secto sters can also alyzed in ter the difference between
ntages in 1990 and 20 well per al change relative to the baseline.tionalization changes over time for the eight ‘supersectors’ as
ial equipment (VEHIC); pharmaceuticals (CHEM); computers, electronics and scientific equipment
OMP); food, beverages and tobacco (FOOD); retail and wholesale (RETAIL);
Inthe bas line position (20.9 percent), or a growth rate ofpercent nternationalization shift for firms from medithe 1990 f internat naliza nt, rone-third ion for all-cou firms
te of ercent.Chang ral clu be an ms ofperce 01 as as the centuTable 7.14 shows internadefined in Chapter 6: motor vehicles, aerospace and industrhemicals andc
(Cpetroleum, mining and minerals (PETR); utilities, trading and infrastructure (UTIL) andconstruction, engineering, forest products and building materials (CONST).
Table 7.14: Internationalization by sector (1990-2001)
N DOIP XRP DOIP XRP
1990 1996-2001 1990 1996-2001 Growth Growth
SERV 17 8.2% 19.8% 11.5% 5.2% 11.0% 5.8% 139.7% 112.6%
RETAIL 22 12.0% 17.8% 5.8% 6.2% 6.2% 0.0% 48.0% 0.2%
VEHIC 20 25.9% 37.5% 11.6% 14.2% 22.2% 7.9% 44.8% 55.5%
CONST 6 34.9% 46.5% 11.6% 22.5% 32.5% 9.9% 33.2% 43.9%
PETR 18 36.4% 45.2% 8.8% 25.6% 32.3% 6.7% 24.1% 26.3%
CHEM 11 42.1% 48.5% 6.4% 31.3% 36.3% 5.0% 15.2% 15.9%
FOOD 12 44.4% 51.1% 6.7% 32.8% 38.2% 5.4% 15.1% 16.4%
COMP 16 44.5% 50.1% 5.6% 30.8% 34.2% 3.5% 12.5% 11.3%
The table shows the degrees of internationalization (DOIP) and extra-regionality (XRP) for1990 and 2001 plus the ‘delta’ for both variables, which equals the value for 1996-2001 minus the baseline 1990 value. Additionally, the two right-hand columns show the delta as a growth rate by dividing the delta value by the 1990 value to generate a sense of the
agnitude of change for different sectors. The table is also sorted in descending order of OIP growth (second column from the right). The resulting overview shows that sectors
which experienced comparable overall shifts, such as UTIL, VEHIC and CONST with DOIP deltas of just over 11 percent, differed considerably in the relative magnitude of thatshift. For UTIL companies the 11.5 percent shift represented a more than 100 percentincrease in the overall internationalization position, whereas for CONST firms the overallinternational position increased by a third. At the other end of the spectrum are the mostinternational firms in COMP, FOOD and CHEM, with baseline DOIs of over 40 percent,
magnitude of 12 to 15 percent relative
mD
for which increased internationalization only had ato the baseline. For these latter firms, changes were therefore less rigorous and invasiveand signaled less of a radical departure from preexisting strategy, while UTIL companies,
225
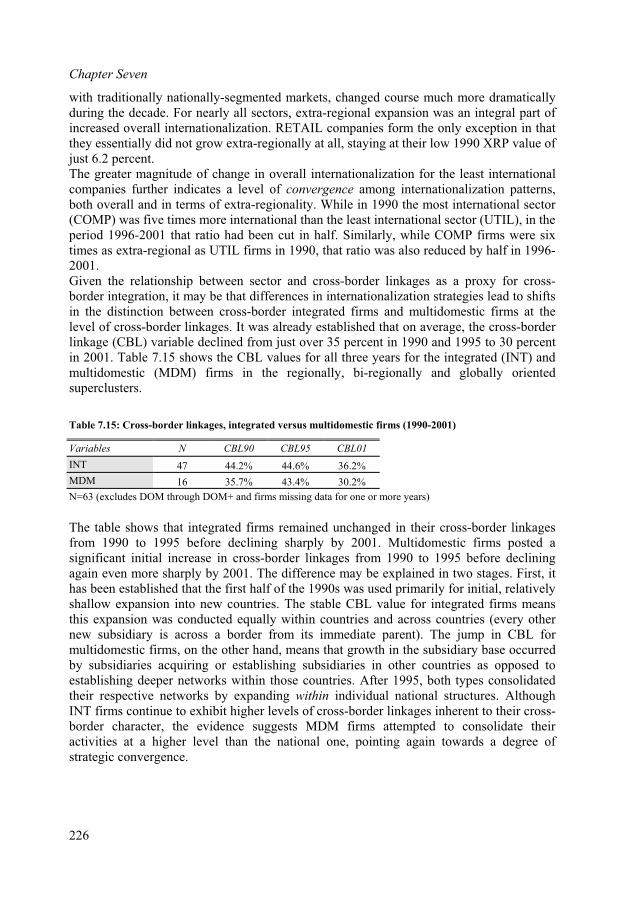
Chapter Seven
with traditionally nationally-segmented markets, changed course much more dramaticallyduring the decade. For nearly all sectors, extra-regional expansion was an integral part of increased overall internationalization. RETAIL companies form the only exception in thatthey essentially did not grow extra-regionally at all, staying at their low 1990 XRP value of just 6.2 percent.The greater magnitude of change in overall internationalization for the least international
ly and globally orientedperclusters.
Table 7.15: Cross-border linkages, integrated versus multidomestic firms (1990-2001)
Variables N CBL90 CBL95 CBL01
companies further indicates a level of convergence among internationalization patterns,both overall and in terms of extra-regionality. While in 1990 the most international sector (COMP) was five times more international than the least international sector (UTIL), in theperiod 1996-2001 that ratio had been cut in half. Similarly, while COMP firms were sixtimes as extra-regional as UTIL firms in 1990, that ratio was also reduced by half in 1996-2001.Given the relationship between sector and cross-border linkages as a proxy for cross-border integration, it may be that differences in internationalization strategies lead to shiftsin the distinction between cross-border integrated firms and multidomestic firms at thelevel of cross-border linkages. It was already established that on average, the cross-border linkage (CBL) variable declined from just over 35 percent in 1990 and 1995 to 30 percentin 2001. Table 7.15 shows the CBL values for all three years for the integrated (INT) andmultidomestic (MDM) firms in the regionally, bi-regionalsu
INT 47 44.2% 44.6% 36.2%
MDM 16 35.7% 43.4% 30.2%
N=63 (excludes DOM through DOM+ and firms missing data for one or more years)
The table shows that integrated firms remained unchanged in their cross-border linkagesfrom 1990 to 1995 before declining sharply by 2001. Multidomestic firms posted a significant initial increase in cross-border linkages from 1990 to 1995 before declining again even more sharply by 2001. The difference may be explained in two stages. First, ithas been established that the first half of the 1990s was used primarily for initial, relatively shallow expansion into new countries. The stable CBL value for integrated firms meansthis expansion was conducted equally within countries and across countries (every othernew subsidiary is across a border from its immediate parent). The jump in CBL for multidomestic firms, on the other hand, means that growth in the subsidiary base occurred
y subsidiaries acquiring or establishing subsidiaries in other countries as opposed toestablishing deeper networks within those countries. After 1995, both types consolidatedb
their respective networks by expanding within individual national structures. AlthoughINT firms continue to exhibit higher levels of cross-border linkages inherent to their cross-border character, the evidence suggests MDM firms attempted to consolidate theiractivities at a higher level than the national one, pointing again towards a degree ofstrategic convergence.
226
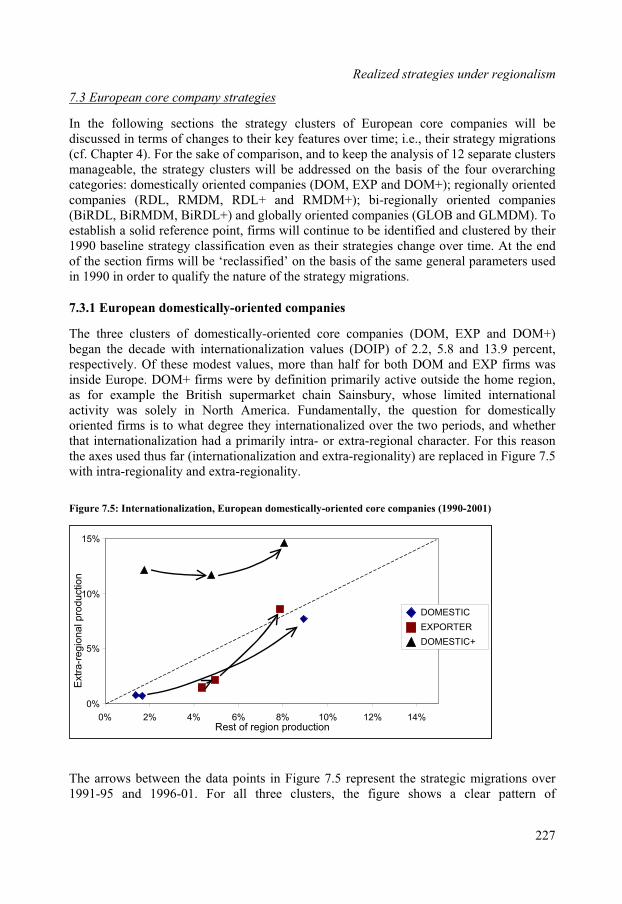
Realized strategies under regionalism
7.3 European core company strategies
In the following sections the strategy clusters of European core companies will bediscussed in terms of changes to their key features over time; i.e., their strategy migrations(cf. Chapter 4). For the sake of comparison, and to keep the analysis of 12 separate clustersmanageable, the strategy clusters will be addressed on the basis of the four overarchingcategories: domestically oriented companies (DOM, EXP and DOM+); regionally orientedcompanies (RDL, RMDM, RDL+ and RMDM+); bi-regionally oriented companies
and DOM+)egan the decade with internationalization values (DOIP) of 2.2, 5.8 and 13.9 percent,
iv an half for both DOM and EXP firms wasside Europe. DOM+ firm e by definition primari ive outside t e r ,
s for exam e th ritis erma et chain ain hos limity wa e Nort eri Fun nt qu e
fir is t degree the zed he t erirna al ha a tra- tra- nal ter is
s use u te ali and -re ty) pla igra-re na d e gio
5: Int ionaliz ion, ically- ed core companies ( 2001)
(BiRDL, BiRMDM, BiRDL+) and globally oriented companies (GLOB and GLMDM). To establish a solid reference point, firms will continue to be identified and clustered by their1990 baseline strategy classification even as their strategies change over time. At the end of the section firms will be ‘reclassified’ on the basis of the same general parameters usedin 1990 in order to qualify the nature of the strategy migrations.
7.3.1 European domestically-oriented companies
he three clusters of domestically-oriented core companies (DOM, EXPTbrespect ely. Of these modest values, more thina
s werh sup
ly actbury,
he homed intern
egionationapl e B
ly inrca.k S
dames w
ally, thee t l
sticallyactivioriented
s solms
h Amy internat
estion for domwo pto wha ionali over t ods, and whether
that inte tion ization d a prim rily in or ex regio charac . For th reasonthe axe d th s far (in rnation zation extra gionali are re ced in F ure 7.5with int gio lity an xtra-re nality.
Figure 7. ernat at European domest orient 1990-
15%
The arrows between the data points in Figure 7.5 represent the strategic migrations over1991-95 and 1996-01. For all three clusters, the figure shows a clear pattern of
0%
5%
10%
0% 2% 4% 6% 8% 10% 12% 14%Rest of region production
Extr
a-r
eg
iona
l p
rodu
ctio
n
DOMESTIC
EXPORTER
DOMESTIC+
0%
5%
10%
0% 2% 4% 6% 8% 10% 12% 14%Rest of region production
Extr
a-r
eg
iona
l p
rodu
ctio
n
15%
DOMESTIC
EXPORTER
DOMESTIC+
227

Chapter Seven
internationalization, whereby in particular for DOM and EXP firms the main thrust tookplace after 1995. The dotted diagonal shows the line along which internationalization isevenly spread between intra- and extra-regional shifts. Both DOM and EXP companiesfollowed this line to some extent, although two of the three exporters in fact show anincreasing tendency to seek expansion outside the home region. As argued in Chapter 4, exporters are most likely to be impacted by reductions in regional tariff structures and thusthe need for tariff-jumping regional internationalization is reduced. This supposition, which remains anecdotal given the small sample size, is supported by changes in theinternationalization of sales relative to production (Table 7.16)
Table 7.16: Changing sales-to-production ratios for European exporters (1990-2001)
DOIP DOIS Ratio S/P
90 1991-95 1996-01 90 1991-95 1996-01 90 1991-95 1996-01
Veba 5.0% 8.9% 25.3% 28.8% 27.8% 41.1% 5.8 3.1 1.6
IRI 4.5% 4.5% 6.0% 18.4% 19.6% 35.0% 4.1 4.3 5.8
RAG 7.9% 7.8% 18.0% 12.9% 12.8% 23.0% 1.6 1.6 1.3
Both Veba and RAG followed an extra-regional internationalization pattern over the990s, which, ceteris paribus, was more likely to face barriers to trade than intra-regional
e ratio of foreignsales to foreign production declined as production, in relative terms, internationalized more
than sales. r IRI e ot nd, strateg marily aimed atpe, internationalization e 1990s has re in an int fication of the export-
strategy.rst half of the decade,
owed a more dispersed pattern after 1995, with some developing an explicit regional
y, but this did not lead to a significant increase in the overall degree of dispersion (i.e., a lower HERF index). This supports the evidence above that most DOMcompanies focused their internationalization strategies on the home region. Similarly,DOM+ companies increased the number of host countries significantly after 1995 but
1internationalization in the wake of the Single European Market. Hence, th
quickly Fo , on th her ha whose y was priEuro over th sulted ensibasedThe nine domestic companies, which were uniformly stable in the fishorientation (e.g., Metro, RWE, France Telecom, British Telecom and Tesco) while inparticular Telefonica focused primarily on extra-regional expansion into Latin America,increasing its XRP value from virtually nil in 1990 to 27 percent in 2001. DOM+companies, on the other hand, may have seen their core positions threatened by moreregionally oriented competitors in a regionalizing world. All three (Sainsbury, Lufthansaand ENI) shifted proactively towards a more solid regional base in the run-up to the SingleMarket before steering into a more balanced internationalization pattern after 1995.The network spread variables substantiate the location shifts identified in the strategy data.Table 7.17 shows how the foreign share of the subsidiary base grew rapidly over thesecond period, as well as the number of countries. For the three exporters, the number of countries in which they have subsidiaries first rose in 1995 in combination with a higherHerfindahl index (HERF), suggesting that internationalization of the subsidiary base was primarily intra-regional. By 2001, however, the number of host countries had declined andthe HERF value dropped slightly, indicating some degree of intra-regional rationalization.Domestic companies increased their degree of internationalization and the number of hostcountries fairly radicall
228
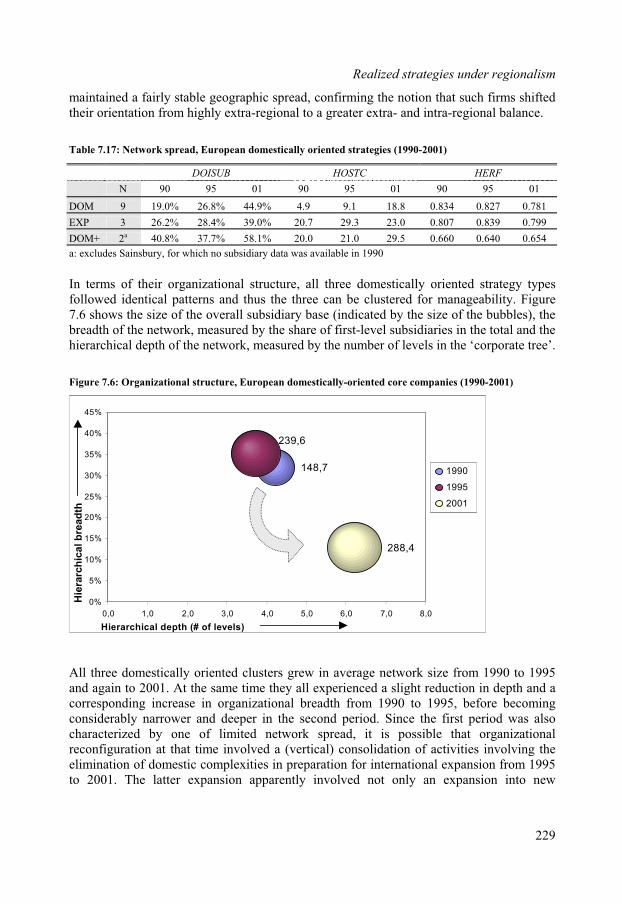
Realized strategies under regionalism
maintained a fairly stable geographic spread, confirming the notion that such firms shiftedtheir orientation from highly extra-regional to a greater extra- and intra-regional balance.
Table 7.17: Network spread, European domestically oriented strategies (1990-2001)
DOISUB HOSTC HERF
N 90 95 01 90 95 01 90 95 01
DOM 9 19.0% 26.8% 44.9% 4.9 9.1 18.8 0.834 0.827 0.781
EXP 3 26.2% 28.4% 39.0% 20.7 29.3 23.0 0.807 0.839 0.799
DOM+ 2a 40.8% 37.7% 58.1% 20.0 21.0 29.5 0.660 0.640 0.654
a: excludes Sainsbury, for which no subsidiary data was available in 1990
In terms of their organizational structure, all three domestically oriented strategy typese clustered for manageability. Figureicated by the size of the bubbles), the
All three domestically oriented clusters grew in average network size from 1990 to 1995and again to 2001. At the same time they all experienced a slight reduction in depth and a corresponding increase in organizational breadth from 1990 to 1995, before becomingconsiderably narrower and deeper in the second period. Since the first period was alsocharacterized by one of limited network spread, it is possible that organizational
configuration at that time involved a (vertical) consolidation of activities involving the limination of domestic complexities in preparation for international expansion from 1995
followed identical patterns and thus the three can b7.6 shows the size of the overall subsidiary base (indbreadth of the network, measured by the share of first-level subsidiaries in the total and thehierarchical depth of the network, measured by the number of levels in the ‘corporate tree’.
Figure 7.6: Organizational structure, European domestically-oriented core companies (1990-2001)
148,7
239,6
30%
35%
40%
45%
reeto 2001. The latter expansion apparently involved not only an expansion into new
288,4
0%
5%
10%
15%
25%
0,0 1,0 2,0 3,0 4,0 5,0 6,0 7,0 8,0
Hierarchical depth (# of levels)
Hie
rarc
hic
al b
rea 20%d
th
1990
1995
2001
148,7
239,6
30%
35%
40%
45%
288,4
0%
5%
10%
15%
25%
0,0 1,0 2,0 3,0 4,0 5,0 6,0 7,0 8,0
Hierarchical depth (# of levels)
Hie
rarc
hic
al b
rea
1990
1995
2001
1990
1995
20%dth
2001
229

Chapter Seven
countries (see Table 7.17), but therefore also an extensive deepening of networkpenetration in existing host countries.
7.3.2 European regionally-oriented companies
The four regionally-oriented clusters of firms together comprise the largest group of theEuropean core companies in the sample (N=33), and hence their strategic migrations have a proportionately large impact on the sample as a whole. Hence, the trends in intra- versusextra-regional growth (Figure 7.7) do not come unexpected. At the same time, the averages
sed to plot the figure represent a great number of firms wiu th mildly heterogeneousic m eterogeneity will
s shown in Figure 7.7, integrated European companies (RDL an followedearly ide al p e cad n b s pa sl ore extra-
regionally than int ion d es that expansion was more significa fter1995. Multidomes rate RM nd M ev ppea to co rge
an sifi - l fwi lust ex co ab ee ersi articu y am the
tegrated firms (RDL and RDL+). Some firms, like BMW, expanded intra-regionally in
ionalization, European regionally oriented core companies (1990-2001)
strateg igrations and is therefore best seen as purely indicative. That hbe addressed with specific examples as needed.A core d RDL+)n ntic aths ov r the de e. I oth case they ex nded ightly m
ra-reg ally, an in both cas nt atic st gies ( DM a RMD +), how er, a red nve
withinirms
intenthin c
ed intra
ers doregionahibit a
ocus.nsiderF le degr of div ty, p larl ong
in1991-95 (with the Rover acquisition in 1994). Renault expanded within Europe over both periods, but its expansion was largely in Eastern and Central Europe. Others even contracted slightly, such as Peugeot, Usinor, Total and Siemens, before expanding in theregion more dramatically in 1996-01. In fact, three RDL companies ended the decade with a smaller regional share than they began with (Usinor, Ericsson and Alcatel).
Figure 7.7: Internat
0%
10%
0% 10% 20% 30% 40% 50%Rest of region production
Extr
Regional div. oflabor
Regionalmultidomestic
20%
30%
40%
50%
a-r
eg
ion
al p
rod
uctio
n
Regionalmultidomestic +Regional div. of
labor +
0%
10%
0% 10% 20% 30% 40% 50%Rest of region production
Extr
Regional div. oflabor
Regionalmultidomestic
20%
30%
40%
50%
a-r
eg
ion
al p
rod
uctio
n
Regionalmultidomestic +Regional div. of
labor +
Nearly all RDL firms expanded extra-regionally over the decade, and in all casesexpansion was significantly greater after 1995. In 1990, the 11 RDL companies had an extra-regional share of production of 9.5 percent, rising slightly to 10.7 percent in 1991-95before climbing to 18.9 percent in 1996-01. RDL+ firms were on average more likely to
230

Realized strategies under regionalism
expand aggressively outside the region. In some cases (e.g. Total and Daimler), this alsocontributed to a reduction in the share of activity in the home region (due to acquisitions of
etrofina / Elf Acquitaine and Chrysler, respectively).yonnais des Eaux)
arrefour, on the other hand, moved upward and right along the dia n Figure.7 while ez a Ferru vely within pe. ath tifie or
o D s od Danone) on the other hand in reality reflects the gy Da a u an ssi tra-
so n A as e second hal he , w ro 1998). The greater degree of
iversity of multidomestic strategies relative to integrated strategies may very well be a
r RDL companies (Figure 7.8). This suggests that RDL firms were also developing aregionally organized strategy in North America, in effect transplanting their home regionstrategy (and possibly even growing in the direction of a BiRDL strategy), while RDL+firms were exporting the ‘extra-regional’ characteristics of their existing strategy to the restof the world (Daimler, however, clearly opted for a BiRDL strategy through its acquisition of Chrysler).
Figure 7.8: Expansion into North America, European regionally oriented core companies (1990-2001)
PThe four RMDM+ firms (Ferruzzi, Carrefour, Gen. des Eaux and Suez Lwere also not entirely consistent in their internationalization patterns. Gen. des Eaux and C to the gonal i7 Su nd zzi expanded aggressi Euro The p iden d fthe tw RM M firm (Prom es andstrate of none. D none p rsued aggre ve ex regional acquisition strategy in Asia and to me exte t in the meric in th f of t 1990s hile P modeswas relatively stable (before being acquired by Carrefour indreflection of the diverse ‘local responsiveness’ pressures experienced by the former.Shifts in regional activity were in most cases related to shifts in extra-regional activity andthe role of North America as the ‘second’ region. In general, both RDL and RDL+companies expanded activity in North America, but the North American share as a percentage of total extra-regional activity declined for RDL+ companies while it increasedfo
0%
In theory, regionally organized companies can be expected to experience major networkspread effects in the wake of integration, in the form of reduced geographic spread(concentration) or, as discussed in Chapter 4, increased geographic spread (dispersion). To explore the regional aspects of network spread effects, variables were adapted to the homeregion context. Firstly, a Herfindahl index of concentration was developed for thesubsidiary base in only the EU15 (plus Switzerland, since ABB, an RDL+ firm, is both
10%
20%
30%
40%
50%
60%
70%
1990 1991-95 1996-01
Regional div. ofRegional div. oflaborlabor
Regional div. oflabor +
Regional div. oflabor +
North America as share of totalextra-regionality
Production in North America
Regional div. ofRegional div. of
laborlabor
0%
20%
30%
40%
50%
60%
70%
1990 1991-95 1996-01
10%Regional div. ofRegional div. of
laborlabor
Regional div. oflabor +
Regional div. oflabor +
North America as share of totalextra-regionality
Production in North America
Regional div. ofRegional div. of
laborlabor
231
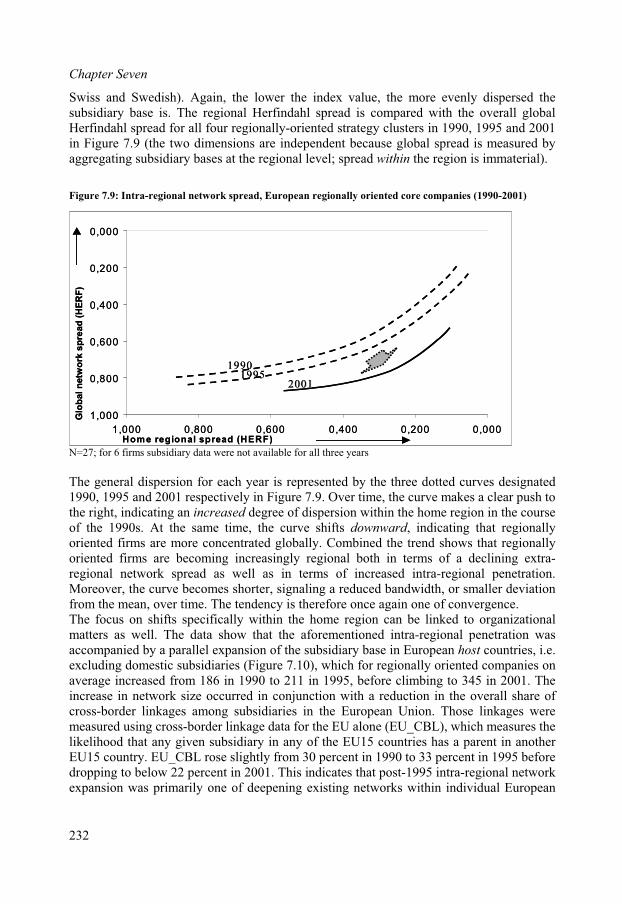
Chapter Seven
Swiss and Swedish). Again, the lower the index value, the more evenly dispersed the subsidiary base is. The regional Herfindahl spread is compared with the overall globalHerfindahl spread for all four regionally-oriented strategy clusters in 1990, 1995 and 2001in Figure 7.9 (the two dimensions are independent because global spread is measured by
within the region is immaterial).
he general dispersion for each year is represented by the three dotted curves designated 1990, 1995 and 2001 respectively in Figure 7.9. Over time, the curve makes a clear push tothe right, indicating an increased degree of dispersion within the home region in the courseof the 1990s. At the same time, the curve shifts downward, indicating that regionallyoriented firms are more concentrated globally. Combined the trend shows that regionallyoriented firms are becoming increasingly regional both in terms of a declining extra-regional network spread as well as in terms of increased intra-regional penetration.Moreover, the curve becomes shorter, signaling a reduced bandwidth, or smaller deviationfrom the mean, over time. The tendency is therefore once again one of convergence. The focus on shifts specifically within the home region can be linked to organizationalmatters as well. The data show that the aforementioned intra-regional penetration wasaccompanied by a parallel expansion of the subsidiary base in European host countries, i.e.excluding domestic subsidiaries (Figure 7.10), which for regionally oriented companies on average increased from 186 in 1990 to 211 in 1995, before climbing to 345 in 2001. Theincrease in network size occurred in conjunction with a reduction in the overall share ofcross-border linkages among subsidiaries in the European Union. Those linkages were measured using cross-border linkage data for the EU alone (EU_CBL), which measures the
nt in anotherU15 country. EU_CBL rose slightly from 30 percent in 1990 to 33 percent in 1995 beforeropping to below 22 percent in 2001. This indicates that post-1995 intra-regional networkxpansion was primarily one of deepening existing networks within individual European
aggregating subsidiary bases at the regional level; spread
Figure 7.9: Intra-regional network spread, European regionally oriented core companies (1990-2001)
0,000
0,200
N=27; for 6 firms subsidiary data were not available for all three years
T
likelihood that any given subsidiary in any of the EU15 countries has a pareEde
0,0000,2000,4000,6000,800Home regional spread (HERF)
0,400
0,600
sp
read
(H
ER
F)
0,800
1,000
1,000
Glo
bal n
etw
ork
19901995
20012001
0,0000,2000,4000,6000,800Home regional spread (HERF)
0,000
0,200
0,400
0,600
sp
read
(H
ER
F)
0,800
1,000
1,000
Glo
bal n
etw
ork
19901995
20012001
232
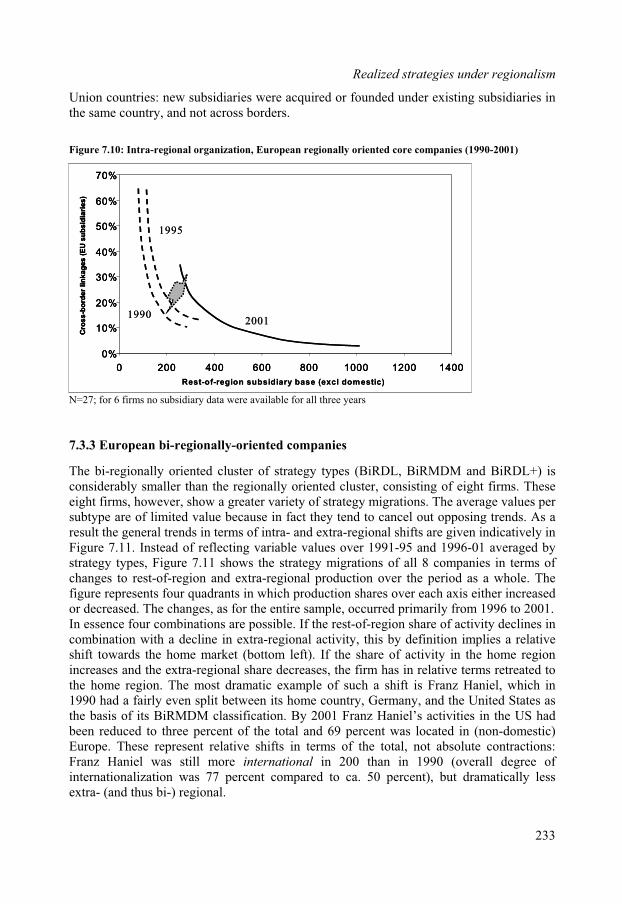
Realized strategies under regionalism
Union countries: new subsidiaries were acquired or founded under existing subsidiaries inthe same country, and not across borders.
Figure 7.10: Intra-regional organization, European regionally oriented core companies (1990-2001)
70%
N=27; for 6 firms no subsidiary data were available for all three years
7.3.3 European bi-regionally-oriented companies
The bi-regionally oriented cluster of strategy types (BiRDL, BiRMDM and BiRDL+) isconsiderably smaller than the regionally oriented cluster, consisting of eight firms. These ight firms, hoe
suwever, show a greater variety of strategy migrations. The average values per
btype are of limited value because in fact they tend to cancel out opposing trends. As a y in
Figure 7.11. Instead of reflecting variable values over 1991-95 and 1996-01 averaged bystrategy types, Figure 7.11 shows the strategy migrations of all 8 companies in terms ofchanges to rest-of-region and extra-regional production over the period as a whole. The figure represents four quadrants in which production shares over each axis either increased or decreased. The changes, as for the entire sample, occurred primarily from 1996 to 2001.In essence four combinations are possible. If the rest-of-region share of activity declines in combination with a decline in extra-regional activity, this by definition implies a relativeshift towards the home market (bottom left). If the share of activity in the home regionincreases and the extra-regional share decreases, the firm has in relative terms retreated tothe home region. The most dramatic example of such a shift is Franz Haniel, which in1990 had a fairly even split between its home country, Germany, and the United States as the basis of its BiRMDM classification. By 2001 Franz Haniel’s activities in the US had been reduced to three percent of the total and 69 percent was located in (non-domestic)Europe. These represent relative shifts in terms of the total, not absolute contractions:
ranz Haniel was still more international in 200 than in 1990 (overall degree of
result the general trends in terms of intra- and extra-regional shifts are given indicativel
Finternationalization was 77 percent compared to ca. 50 percent), but dramatically less extra- (and thus bi-) regional.
0 200 400 600 800 1000 1200 1400
Rest-of-region subsidiary base (excl domestic)
0%
10%
20%
30%
40%
50%
60%
Cro
ss
-bo
rde
r li
nk
ag
es
(E
Us
ub
sid
iari
es
)
1990
1995
20012001
70%70%
10%
20%
30%
40%
50%
60%
Cro
ss
-bo
rde
r li
nk
ag
es
(E
Us
ub
sid
iari
es
)
10%
20%
30%
40%
50%
60%
Cro
ss
-bo
rde
r li
nk
ag
es
(E
Us
ub
sid
iari
es
)
0 200 400 600 800 1000 1200 14000 200 400 600 800 1000 1200 1400
Rest-of-region subsidiary base (excl domestic)
0%0%
1990
1995
20012001
233
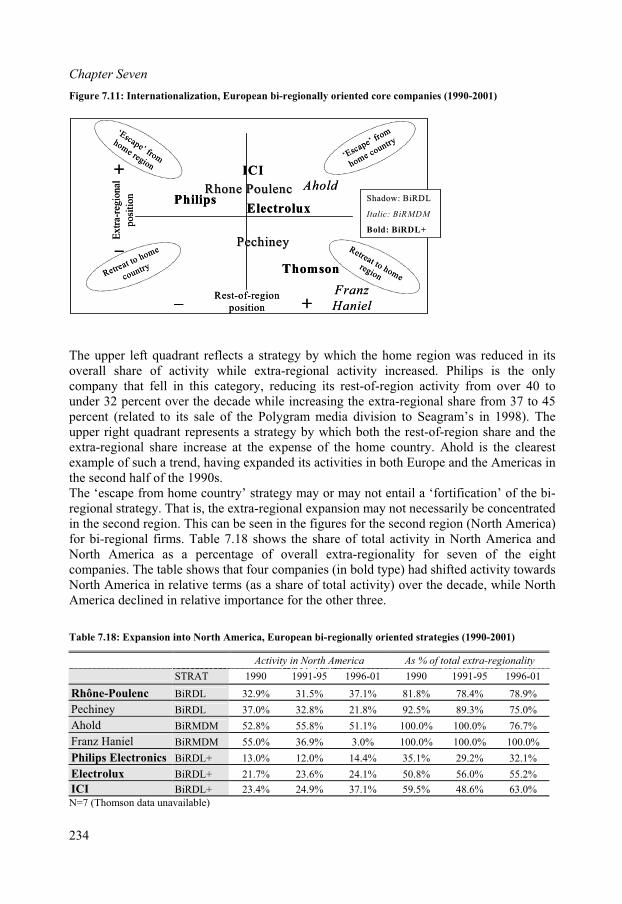
Chapter Seven
Figure 7.11: Internationalization, European bi-regionally oriented core companies (1990-2001)
Rest-of-region
position
E
Franz
Haniel
Thomson
PechineyPechiney_
_ +
xtr
a-re
gio
nal
posi
tion
ElectroluxPhilips
ICI
AholdRhone PoulencRhone Poulenc
+
‘Escape’ from
home region‘E
scape’ from
home country
The upper left quadrant reflects a strategy by which the home region was reduced in itsoverall share of activity while extra-regional activity increased. Philips is the onlycompany that fell in this category, reducing its rest-of-region activity from over 40 to under 32 percent over the decade while increasing the extra-regional share from 37 to 45 percent (related to its sale of the Polygram media division to Seagram’s in 1998). The upper right quadrant represents a strategy by which both the rest-of-region share and theextra-regional share increase at the expense of the home country. Ahold is the clearestexample of such a trend, having expanded its activities in both Europe and the Americas inthe second half of the 1990s.The ‘escape from home country’ strategy may or may not entail a ‘fortification’ of the bi-
y not necessarily be concentratedhe second region (North America)
regional strategy. That is, the extra-regional expansion mathe second region. This can be seen in the figures for tin
for bi-regional firms. Table 7.18 shows the share of total activity in North America andNorth America as a percentage of overall extra-regionality for seven of the eightcompanies. The table shows that four companies (in bold type) had shifted activity towardsNorth America in relative terms (as a share of total activity) over the decade, while North America declined in relative importance for the other three.
Table 7.18: Expansion into North America, European bi-regionally oriented strategies (1990-2001)
Activity in North America As % of total extra-regionality
STRAT 1990 1991-95 1996-01 1990 1991-95 1996-01
Rhône-Poulenc BiRDL 32.9% 31.5% 37.1% 81.8% 78.4% 78.9%
Pechiney BiRDL 37.0% 32.8% 21.8% 92.5% 89.3% 75.0%
Ahold BiRMDM 52.8% 55.8% 51.1% 100.0% 100.0% 76.7%
Franz Haniel BiRMDM 55.0% 36.9% 3.0% 100.0% 100.0% 100.0%
Philips Electronics BiRDL+ 13.0% 12.0% 14.4% 35.1% 29.2% 32.1%
Electrolux BiRDL+ 21.7% 23.6% 24.1% 50.8% 56.0% 55.2%
ICI BiRDL+ 23.4% 24.9% 37.1% 59.5% 48.6% 63.0%
N=7 (Thomson data unavailable)
Retrcountreat to home
y
Retreat tor homeegion
Shadow: BiRDLShadow: BiRDL
Italic: BiRMDM
Bold: BiRDL+
Rest-of-region
position
E
Franz
Haniel
Thomson
PechineyPechiney_
_ +
xtr
a-re
gio
nal
posi
tion
ElectroluxPhilips
ICI
AholdRhone PoulencRhone Poulenc
+
‘Escape’ from
home region‘E
scape’ from
home country
Retrcountreat to home
y
Retreat tor homeegion
Shadow: BiRDLShadow: BiRDL
Italic: BiRMDM
Bold: BiRDL+
234

Realized strategies under regionalism
The shift towards North America, however, does not necessarily represent a narrowing of acompany’s extra-regional strategy. In fact, for only two of the eight bi-regional companies(ICI and Electrolux) did North America account for a larger share of its overall extra-regional activity in 2001 than in 1990. Ahold, on the other hand, grew absolutely in theUnited States in the 1990s while at the same time expanding in South America through itscquisitions in Brazil and Chile. As a result its RG2P value dropped only slightly over the
decade, from 52 to 50 percent, but while that RG2P value in 1990 represented 100 percent of Ahold’s extra-regional activity, by 2001 it only accounted for 76 percent.The fairly rigorous shifts either out of the home region or out of the second region suggestthat the bi-regional strategy may have become less viable after 1995. Firms either tried tomove in the direction of global or retreated back to more of a regional emphasis in an attempt to adapt to changing priorities. These developments may also be evident in thenetwork spread variables. Figure 7.12 shows the average changes in the foreign percentageof the subsidiary base, the number of host countries and the Herfindahl concentration index(beside the bubbles) for the BiRDL(+) and BiRMDM strategy types.
Figure 7.12: Network spread, European bi-regionally oriented core companies (1990-2001)
a
1990
1995
0,525
0,442
0,474
0,807ati
on BiRDL(+)BiRDL(+)
1995
0,736
40%
80%
naliz
ub
sid
iary
base
BiRMDMBiRMDM1990
1995
2001
1990
200160%
of
s
The BiRDL and BiRDL+ firms are combined here because the values for these variables are not materially different (the difference is in the degree of involvement in countriesoutside the EU and North America, i.e. the size of the subsidiaries, not their absolutenumbers). The figure shows that the two multidomestic firms, Ahold and Franz Haniel,grew both in terms of degree of internationalization and number of host countries. These migrations can be qualified by the internationalization variables above, which alreadyshowed that in the case of Franz Haniel the change was primarily a shift back to Europe,whereas for Ahold it involved an expansion strategy in Europe, North and South America.Both strategies produced a relatively stable overall subsidiary concentration over time.The cross-border integrated firms, on the other hand, showed on average the oppositetrend. The number of host countries declined as did the overall degree ofinternationalization of the subsidiary base (the major exception was Rhône-Poulenc, which
0,73820%rn
ati
o
0%
0 10 20 30 40 50
Number of host countries
Inte
1990
1995
0,525
0,442
0,474
0,736
40%
80%
naliz
ub
sid
iary
base
BiRMDMBiRMDM1990
1995
2001
1990
2001
0,807ati
on BiRDL(+)BiRDL(+)
1995
60%
of
s
0,73820%rn
ati
o
0%
0 10 20 30 40 50
Number of host countries
Inte
235
Chapter Seven
was considerably larger in 2001 than in 1995, due to its acquisition of Hoechst in 1999). Moreover, after declining slightly from 1990 to 1995, the Herfindahl index rose in 2001. The declining number of host countries shows that this increased overall concentration of the subsidiary base involved not only a shift towards a limited number of regions, but alsoaway from some countries. Philips, for instance, had majority-controlled subsidiaries in 69 countries as of 1995 but in only 45 countries in 2001. This reduction was largely at theexpense of Sub-Saharan African countries and other less-developed countries, while thesubsidiary base in developed countries increased.These trends among integrated firms are all the more striking when compared to theaverage network shifts over the entire sample which show an increase in both the numberof host countries and the overall degree of internationalization. Thus integrated bi-regionalstrategies exhibit a radical departure from the overall trend, which reinforces theconclusion that these strategies were less and less viable in a regionalizing world. Theevidence has shown this to be less of a factor for the multidomestic strategy, reiteratingonce again how regionalism has a different significance for integrated production versuslocal responsiveness. The apparent convergence between integrated and multidomesticpatterns underscores the trends identified for the sample as a whole.Bi-regional firms also experienced some degree of convergence in terms of organizationalstructures (Table 7.19). Both types of networks showed a gradual deepening of theirhierarchies accompanied by a reduction in the share of first-level subsidiaries (hierarchical
. were very
ansforming their structures to a deep and narrow pyramid in 2001. Cross-border linkages
breadth) The latter change was particularly dramatic for BiRMDM firms, whichand shallow in 1990, then experienced moderate deepening in 1995 before broad
trfollowed the same pattern as for regionally oriented strategies, rising first from 1990 to1995 before falling below the 1990 level in 2001.
Table 7.19: Organizational structure, European bi-regionally oriented strategies (1990-2001)
BiRDL(+) BiRMDM
1990 1995 2001 1990 1995 2001
TOTSUB 390 324 260 158 200 395
PRIM 26% 30% 25% 48% 48% 9%
MXLEV 5,80 6,40 6,40 3,50 4,50 7,00
CBL 41% 44% 36% 23% 30% 12%
The table also shows that overall network size developed in opposite directions, withBiRDL firms becoming significantly more streamlined over time and BiRMDM firmsconsiderably larger such that the two virtually reversed positions. In 1990, BiRDL firmshad networks consisting on average of 390 subsidiaries, which dropped steadily to 260 in2001, while BiRMDM firms grew from 158 in 1990 to 395 in 2001.
u
he greater a comp y’s scale and there ndus the more face trateg su c Eu as to x
d c es in three of whi ed ross-border integrated
7.3.4 E ropean globally-oriented companies
T an scope, the more room is in which to maneuver ath ts of s y are bject to hange. rope w home only siglobally oriente ompani 1990, ch bas on a c
236
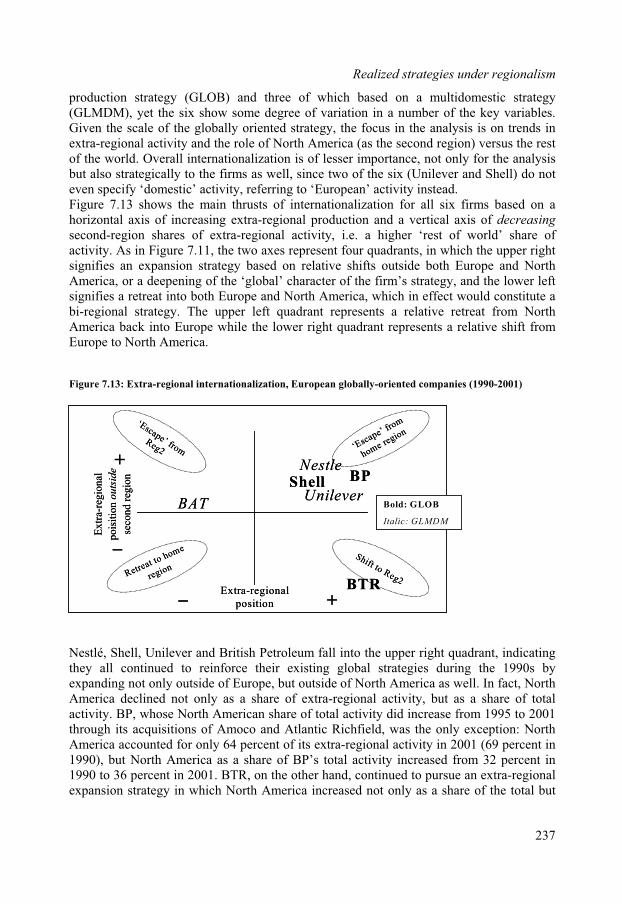
Realized strategies under regionalism
production strategy B) ree ich o ult tic gy), yet the s gre riation in a o y v s.
le of lly s , th s i alysis is onhe r or eric e second region) versu st
. Overa atio on sse rtance, not o the sisegicall firm ell, two six ever and Shel
ivity, referring to ‘European’ activity instead.
North
Nestlé, Shell, Unilever and British Petroleum fall into the upper right quadrant, indicating they all continued to reinforce their existing global strategies during the 1990s byexpanding not only outside of Europe, but outside of North America as well. In fact, North
merica declined not only as a share of extra-regional activity, but as a share of totalctivity. BP, whose North American share of total activity did increase from 1995 to 2001
(GLO and th of wh based n a m idomes strate(GLMDM six show ome de e of va number f the ke ariableGiven the sca the globa oriented trategy e focu n the an trends inextra-regional activity and t ole of N th Am a (as th s the reof the world
lso stratll intern nalizati is of le r impo nly for analy
but a y to the s as w since of the (Unil l) do noteven specify ‘domestic’ actFigure 7.13 shows the main thrusts of internationalization for all six firms based on a horizontal axis of increasing extra-regional production and a vertical axis of decreasing
second-region shares of extra-regional activity, i.e. a higher ‘rest of world’ share ofactivity. As in Figure 7.11, the two axes represent four quadrants, in which the upper rightsignifies an expansion strategy based on relative shifts outside both Europe and NorthAmerica, or a deepening of the ‘global’ character of the firm’s strategy, and the lower left signifies a retreat into both Europe and North America, which in effect would constitute abi-regional strategy. The upper left quadrant represents a relative retreat fromAmerica back into Europe while the lower right quadrant represents a relative shift fromEurope to North America.
Figure 7.13: Extra-regional internationalization, European globally-oriented companies (1990-2001)
Extra-regional
position
Extr
a-re
gio
nal
po
isit
ion
ou
tsid
e
seco
nd
reg
ion
+
_
_+
Retreat to home
region
‘Escape
e regio’ fro
mn
Aathrough its acquisitions of Amoco and Atlantic Richfield, was the only exception: North America accounted for only 64 percent of its extra-regional activity in 2001 (69 percent in1990), but North America as a share of BP’s total activity increased from 32 percent in1990 to 36 percent in 2001. BTR, on the other hand, continued to pursue an extra-regionalexpansion strategy in which North America increased not only as a share of the total but
‘Escape’ frRe omg2hom
Shift to Reg2
Bold: GLOB
Italic: GLMDM
BTR
BAT
BPShellUnilever
Nestle
Extra-regional
position
Extr
a-re
gio
nal
po
isit
ion
ou
tsid
e
seco
nd
reg
ion
+
_
_+
Retreat to home
region
‘Escape
e regio’ fro
mn
‘Escape’ frRehomomg2
Shift to Reg2
Bold: GLOB
Italic: GLMDM
BTR
BAT
BPShellUnilever
Nestle
237
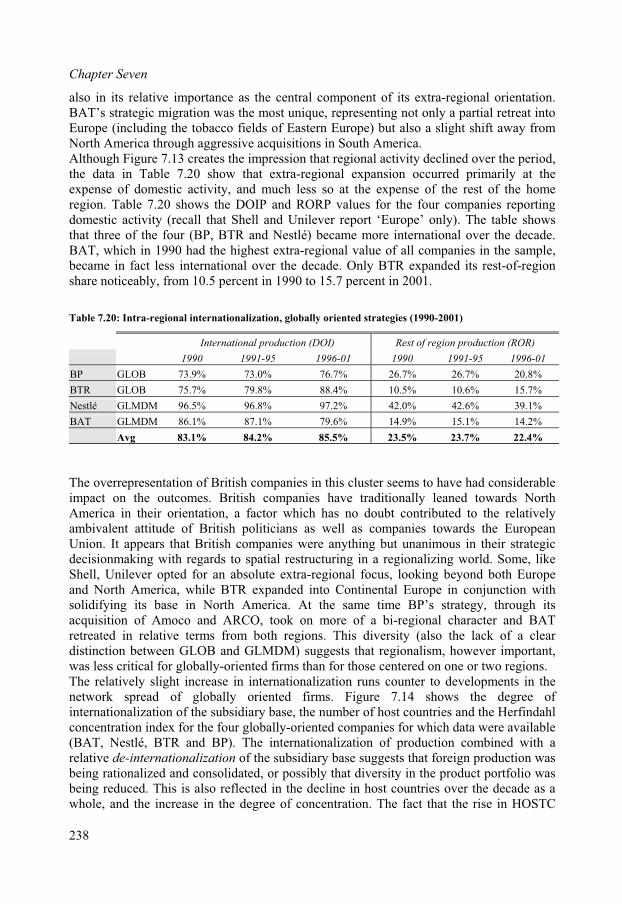
Chapter Seven
also in its relative importance as the central component of its extra-regional orientation.BAT’s strategic migration was the most unique, representing not only a partial retreat intoEurope (including the tobacco fields of Eastern Europe) but also a slight shift away fromNorth America through aggressive acquisitions in South America.Although Figure 7.13 creates the impression that regional activity declined over the period,the data in Table 7.20 show that extra-regional expansion occurred primarily at theexpense of domestic activity, and much less so at the expense of the rest of the homeregion. Table 7.20 shows the DOIP and RORP values for the four companies reportingdomestic activity (recall that Shell and Unilever report ‘Europe’ only). The table showsthat three of the four (BP, BTR and Nestlé) became more international over the decade. BAT, which in 1990 had the highest extra-regional value of all companies in the sample,became in fact less international over the decade. Only BTR expanded its rest-of-region share noticeably, from 10.5 percent in 1990 to 15.7 percent in 2001.
Table 7.20: Intra-regional internationalization, globally oriented strategies (1990-2001)
International production (DOI) Rest of region production (ROR)
1990 1991-95 1996-01 1990 1991-95 1996-01
BP GLOB 73.9% 73.0% 76.7% 26.7% 26.7% 20.8%
BTR GLOB 75.7% 79.8% 88.4% 10.5% 10.6% 15.7%
Nestlé GLMDM 96.5% 96.8% 97.2% 42.0% 42.6% 39.1%
BAT GLMDM 86.1% 87.1% 79.6% 14.9% 15.1% 14.2%
Avg 83.1% 84.2% 85.5% 23.5% 23.7% 22.4%
The overrepresentation of British companies in this cluster seems to have had considerableimpact on the outcomes. British companies have traditionally leaned towards NorthAmerica in their orientation, a factor which has no doubt contributed to the relativelyambivalent attitude of British politicians as well as companies towards the EuropeanUnion. It appears that British companies were anything but unanimous in their strategicdecisionmaking with regards to spatial restructuring in a regionalizing world. Some, likeShell, Unilever opted for an absolute extra-regional focus, looking beyond both Europend North America, while BTR expanded into Continental Europe in conjunction with
i through itsacquisition of Amoco and ARCO, took on more of a bi-regional character and BATretreated in relati th reg ns. This d ersity lack of a cleardistin ion betw LOB and GLMDM gests gional oweve ortant,w itical for globally- ted firm hose centered on one or tw ions.Th vely sl ncreas nternat zation runs counter evelopm in thene spread global riented s. Fi he degree of inte izat f the su ry base number st cou and the Herfindahloncentration index for the four globally-oriented companies for which data were available
AT, Nestlé, BTR and BP). The internationalization of production combined with a
whole, and the increase in the degree of concentration. The fact that the rise in HOSTC
asolidify ng its base in North America. At the same time BP’s strategy,
ve terms from bo io iv (also thect een G ) sug that re ism, h r imp
as less cr orien s than for t o rege relati ight i e in i ionali to d entstwork of ly o firm gure 7.14 shows t
rnational ion o bsidia , the of ho ntriesc(Brelative de-internationalization of the subsidiary base suggests that foreign production wasbeing rationalized and consolidated, or possibly that diversity in the product portfolio was being reduced. This is also reflected in the decline in host countries over the decade as a
238

Realized strategies under regionalism
from 1990 to 1995 had little impact on the concentration index shows that the additional countries did not represent any large-scale expansions, whereas the shift from 1995 to2001 was clearly more substantial.
verage subsidiary base contracted over the decade from an verage of 659 in 1990 to 537 in 2001, parallel to the reduction in the degree of
wasprimarily aimed at foreign subsidiaries. The contraction of the network base affected notonly the breadth, but also the depth of the globally oriented organization. The share offirst-level subsidiaries dropped from over 20 percent in 1990 to just over ten percent in2001, while maximum depth declined from 8.3 levels to 7.5. The overall decline in theshare of cross-border linkages over the decade is in all likelihood related to the decline in the number of host countries and de-internationalization of the subsidiary base.
Table 7.21: Organizational structure, European globally oriented strategies (1990-2001)
1990 1995 2001
Figure 7.14: Extra-regional internationalization, European globally-oriented companies (1990-2001)
0,386
0,376
68%
70%
72%
74%
ion
ali
zati
on
of
ry b
ase
These developments are also reflected in the organizational structure of globally-orientedfirms (Table 7.21). Their aainternationalization of the subsidiary base, indicating that network contraction
TOTSUB 659 586 537
PRIM 21.6% 25.0% 10.9%
MXLEV 8.3 7.8 7.5
CBL 37.8% 40.7% 27.7%
.3.5 Interim conclusions, pt. 17
The more international and extra-regional a firm is, the more difficult it becomes topinpoint trends. This is not only obvious from a methodological and managerial point of
0,53764%
66%
48 50 52 54 56 58Number of host countries
Inte
rnat
su
bsid
ia
19901990
19951995
20012001
0,386
0,376
68%
70%
72%
74%
ion
ali
zati
on
of
ry b
ase
0,53764%
66%
48 50 52 54 56 58Number of host countries
Inte
rnat
su
bsid
ia
19901990
19951995
19901990
19951995
2001200120012001
239
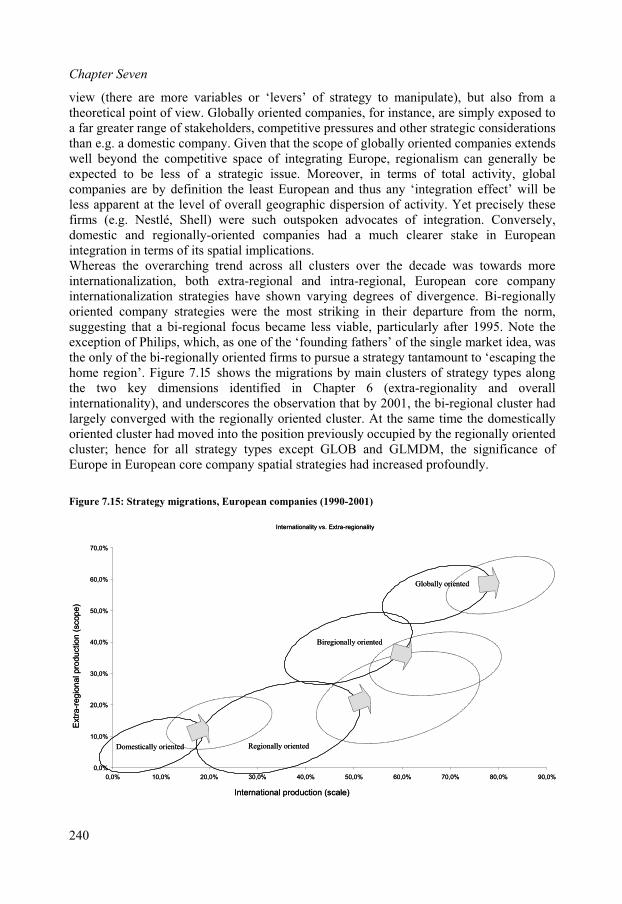
Chapter Seven
view (there are more variables or ‘levers’ of strategy to manipulate), but also from a theoretical point of view. Globally oriented companies, for instance, are simply exposed toa far greater range of stakeholders, competitive pressures and other strategic considerationsthan e.g. a domestic company. Given that the scope of globally oriented companies extendswell beyond the competitive space of integrating Europe, regionalism can generally be expected to be less of a strategic issue. Moreover, in terms of total activity, globalcompanies are by definition the least European and thus any ‘integration effect’ will beless apparent at the level of overall geographic dispersion of activity. Yet precisely these firms (e.g. Nestlé, Shell) were such outspoken advocates of integration. Conversely,domestic and regionally-oriented companies had a much clearer stake in Europeanintegration in terms of its spatial implications.Whereas the overarching trend across all clusters over the decade was towards moreinternationalization, both extra-regional and intra-regional, European core companyinternationalization strategies have shown varying degrees of divergence. Bi-regionallyoriented company strategies were the most striking in their departure from the norm,suggesting that a bi-regional focus became less viable, particularly after 1995. Note the exception of Philips, which, as one of the ‘founding fathers’ of the single market idea, was the only of the bi-regionally oriented firms to pursue a strategy tantamount to ‘escaping the
the two key dimensions identified in Chapter 6 (extra-regionality and overallternationality), and underscores the observation that by 2001, the bi-regional cluster had
c he domesticallyed cl onally oriented
luster; ence for all s B and G ofurope i European core company spatial stra ad inc pro
7.1 gy m s, European companies
inlargely onverged with the regionally oriented cluster. At the same time torient uster had moved into the position previously occupied by the regic h trategy types except GLO LMDM, the significanceE n tegies h reased foundly.
Figure 5: Strate igration (1990-2001)
Regionally orientedDomestically oriented
Biregionally oriented
Globally oriented
Internationality ionality
70,0%
vs. Extra-reg
0,0%
10,0%
20,0%
30,0%
40,0%
50,0%
60,0%
0,0% 10,0% 20,0% 30,0% 40,0% 50,0% 60,0% 70,0% 80,0% 90,0%
Ext
ra-r
eg
iona
l pro
du
ctio
n (
scope)
Regionally oriented
International production (scale)
Domestically oriented
Biregionally oriented
Globally oriented
Internationality ionality
70,0%
vs. Extra-reg
0,0%
10,0%
20,0%
30,0%
40,0%
50,0%
60,0%
0,0% 10,0% 20,0% 30,0% 40,0% 50,0% 60,0% 70,0% 80,0% 90,0%
Ext
ra-r
eg
iona
l pro
du
ctio
n (
scope)
International production (scale)
240
home region’. Figure 7.1 shows the migrations by main clusters of strategy types along5
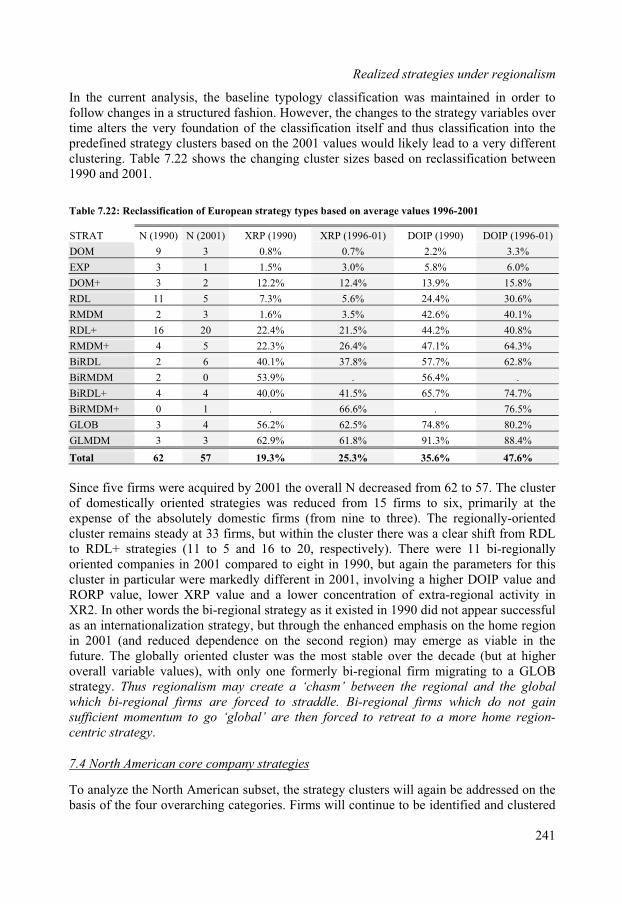
Realized strategies under regionalism
In the current analysis, the baseline typology classification was maintained in order tofollow changes in a structured fashion. However, the changes to the strategy variables over time alters the very foundation of the classification itself and thus classification into thepredefined strategy clusters based on the 2001 values would likely lead to a very differentclustering. Table 7.22 shows the changing cluster sizes based on reclassification between1990 and 2001.
Table 7.22: Reclassification of European strategy types based on average values 1996-2001
STRAT N (1990) N (2001) XRP (1990) XRP (1996-01) DOIP (1990) DOIP (1996-01)
DOM 9 3 0.8% 0.7% 2.2% 3.3%
EXP 3 1 1.5% 3.0% 5.8% 6.0%
DOM+ 3 2 12.2% 12.4% 13.9% 15.8%
RDL 11 5 7.3% 5.6% 24.4% 30.6%
RMDM 2 3 1.6% 3.5% 42.6% 40.1%
RDL+ 16 20 22.4% 21.5% 44.2% 40.8%
RMDM+ 4 5 22.3% 26.4% 47.1% 64.3%
BiRDL 2 6 40.1% 37.8% 57.7% 62.8%
BiRMDM 2 0 53.9% . 56.4% .
BiRDL+ 4 4 40.0% 41.5% 65.7% 74.7%
BiRMDM+ 0 1 . 66.6% . 76.5%
GLOB 3 4 56.2% 62.5% 74.8% 80.2%
GLMDM 3 3 62.9% 61.8% 91.3% 88.4%
Total 62 57 19.3% 25.3% 35.6% 47.6%
Since five firms were acquired by 2001 the overall N decreased from 62 to 57. The clusterof domestically oriented strategies was reduced from 15 firms to six, primarily at theexpense of the absolutely domestic firms (from nine to three). The regionally-orientedluster remains steady at 33 firms, but within the cluster there was a clear shift from RDL RDL+ strategies (11 to 5 and 16 to 20, respectively). There were 11 bi-regionally
not gainufficient momentum to go ‘global’ are then forced to retreat to a more home region-
7.4 N ore com strate
ctooriented companies in 2001 compared to eight in 1990, but again the parameters for thiscluster in particular were markedly different in 2001, involving a higher DOIP value and RORP value, lower XRP value and a lower concentration of extra-regional activity inXR2. In other words the bi-regional strategy as it existed in 1990 did not appear successful as an internationalization strategy, but through the enhanced emphasis on the home regionin 2001 (and reduced dependence on the second region) may emerge as viable in thefuture. The globally oriented cluster was the most stable over the decade (but at higheroverall variable values), with only one formerly bi-regional firm migrating to a GLOBstrategy. Thus regionalism may create a ‘chasm’ between the regional and the global
which bi-regional firms are forced to straddle. Bi-regional firms which dos
centric strategy.
orth American c pany gies
To e the Ameri bset, t tegy clusters will again be addressed on theba e four rarching ories. Firms will continue to be identified and clustered
analyz North can su he strasis of th ove categ
241
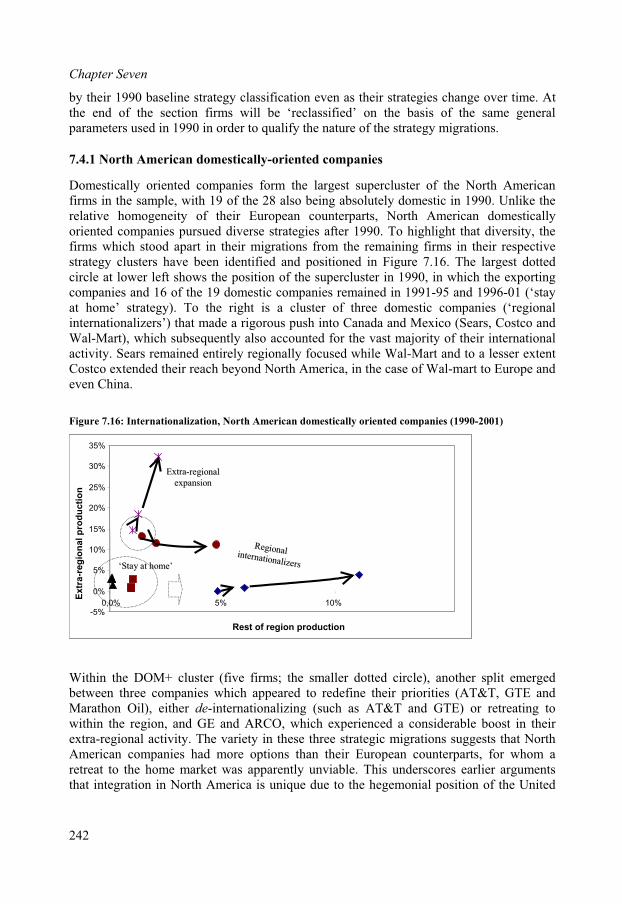
Chapter Seven
by b rate fic en as their strategies change over time. Atthe end of the section firms will be ‘reclassified’ on the basis of the same generalparameters used in 1990 in order to qualify the nature of the strategy migrations.
sed while Wal-Mart and to a lesser extent
Within the DOM+ cluster (five firms; the smaller dotted circle), another split emergedbetween three companies which appeared to redefine their priorities (AT&T, GTE andMarathon Oil), either de-internationalizing (such as AT&T and GTE) or retreating towithin the region, and GE and ARCO, which experienced a considerable boost in theirextra-regional activity. The variety in these three strategic migrations suggests that NorthAmerican companies had more options than their European counterparts, for whom aretreat to the home market was apparently unviable. This underscores earlier argumentsthat integration in North America is unique due to the hegemonial position of the United
their 1990 aseline st gy classi ation ev
7.4.1 North American domestically-oriented companies
Domestically oriented companies form the largest supercluster of the North Americanfirms in the sample, with 19 of the 28 also being absolutely domestic in 1990. Unlike therelative homogeneity of their European counterparts, North American domesticallyoriented companies pursued diverse strategies after 1990. To highlight that diversity, thefirms which stood apart in their migrations from the remaining firms in their respectivestrategy clusters have been identified and positioned in Figure 7.16. The largest dottedcircle at lower left shows the position of the supercluster in 1990, in which the exportingcompanies and 16 of the 19 domestic companies remained in 1991-95 and 1996-01 (‘stayat home’ strategy). To the right is a cluster of three domestic companies (‘regional internationalizers’) that made a rigorous push into Canada and Mexico (Sears, Costco andWal-Mart), which subsequently also accounted for the vast majority of their internationalactivity. Sears remained entirely regionally focuCostco extended their reach beyond North America, in the case of Wal-mart to Europe and even China.
Figure 7.16: Internationalization, North American domestically oriented companies (1990-2001)
5%
10%
15%
20%
25%
30%
35%
-reg
ion
al
pro
du
cti
on
-5%0,0 5% 10%
0%
%
Rest of region production
Extr
a
RegionalRegionalinternationalizers
internationalizers‘Stay at home’‘Stay at home’
ExtraExtra--regionalregional
expansionexpansion
5%
10%
15%
20%
25%
30%
35%
-reg
ion
al
pro
du
cti
on
-5%0,0 5% 10%
0%
%
Rest of region production
Extr
a
RegionalRegionalinternationalizers
internationalizers‘Stay at home’‘Stay at home’
ExtraExtra--regionalregional
expansionexpansion
242
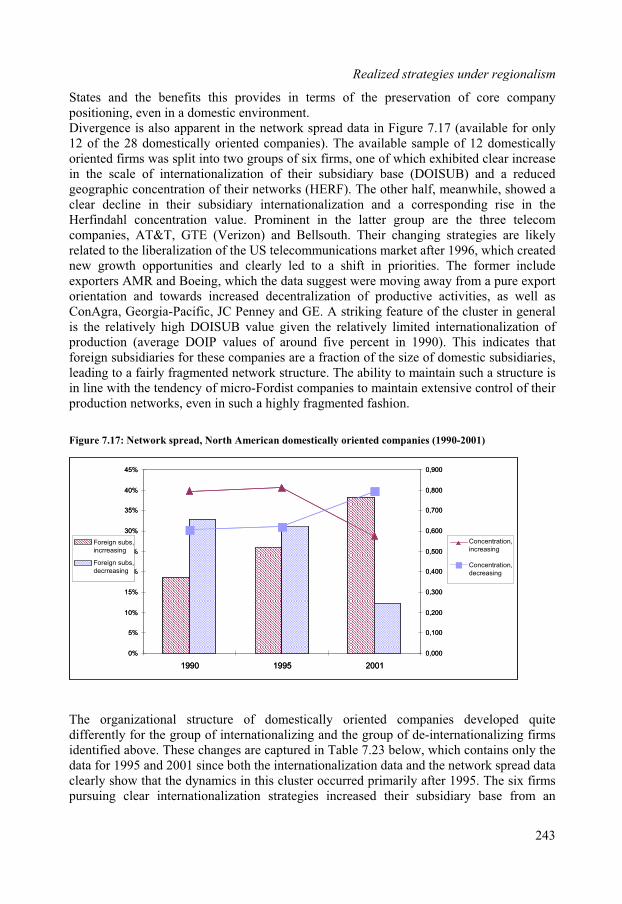
Realized strategies under regionalism
States and the benefits this provides in terms of the preservation of core companypositioning, even in a domestic environment.Divergence is also apparent in the network spread data in Figure 7.17 (available for only12 of the 28 domestically oriented companies). The available sample of 12 domesticallyoriented firms was split into two groups of six firms, one of which exhibited clear increase in the scale of internationalization of their subsidiary base (DOISUB) and a reduced
eographic concentration of their networks (HERF). The other half, meanwhile, showed arise in the
ndahl hree telecomies, AT&T, GTE (Veri ell ch ego the lib lizati he U muni s market 996, whic ted
growth op rtuniti and clearly led to a in priorities. The forme uders AMR d Boei , which ta sugge moving a pure export
tation and wards creased ntralization of productive activities, as well asa, Geor fi JC Pen d GE. A ur cluster ral
relatively high DOISUB v ven the limit rnationa ofon (average DOIP values of around fiv ent in 1990). This indi hatsubsidia s for t se comp are a frac the size of domestic su es,
a fairly fragm netw ucture. Th ility to m such a stru ure isith the dency micro- t compan aintain ive contr eir
netw ks, ev in such a y fragm ashion.
7: Netwo rth American domestically pan -2001)
nternationalizing and the group of de-internationalizing firmsidentified above. These changes are captured in Table 7.23 below, which contains only the
ionalization data and the network spread data
gclear decline in their subsidiary internationalization and a correspondingHerfi concentration value. Prominent in the latter group are the tcompan zon) and B south. Their anging strat ies are likelyrelated t era on of t S telecom cation after 1 h creanew po es shift r inclexporte an ng the da st were away fromorien to in deceConAgr gia-Paci c, ney an striking feat e of the in geneis the alue gi relatively ed inte lizationproducti e perc cates tforeign rie he anies tion of bsidiarileading to ented ork str e ab aintain ctin line w ten of Fordis ies to m extens ol of thproduction or en highl ented f
Figure 7.1 rk spread, No oriented com ies (1990
The organizational structure of domestically oriented companies developed quitedifferently for the group of i
0%
5%
10%
15%
20%
25%
30%
35%
40%
1990 1995 2001
0,000
0,100
0,200
0,300
0,400
0,500
0,600
0,700
0,800
45% 0,900
Concentration,increasing
Foreign subs,incrreasing
Foreign subs,decrreasing
Concentration,decreasing
0%
5%
10%
15%
20%
25%
30%
35%
40%
1990 1995 2001
0,000
0,100
0,200
0,300
0,400
0,500
0,600
0,700
0,800
45% 0,900
Concentration,increasing
Foreign subs,incrreasing
Foreign subs,decrreasing
Concentration,decreasing
data for 1995 and 2001 since both the internatclearly show that the dynamics in this cluster occurred primarily after 1995. The six firmspursuing clear internationalization strategies increased their subsidiary base from an
243
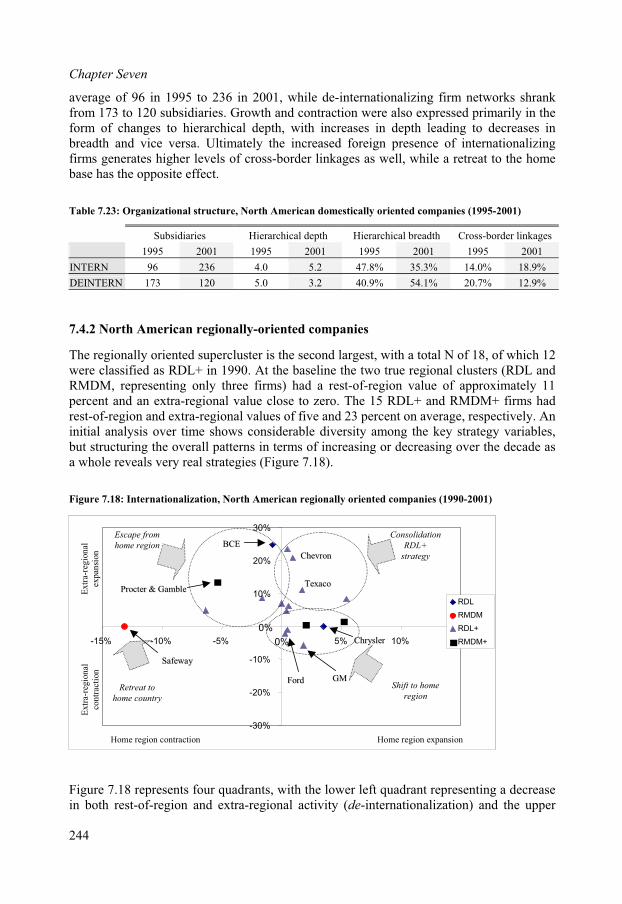
Chapter Seven
average of 96 in 1995 to 236 in 2001, while de-internationalizing firm networks shrankfrom 173 to 120 subsidiaries. Growth and contraction were also expressed primarily in theform of changes to hierarchical depth, with increases in depth leading to decreases inbreadth and vice versa. Ultimately the increased foreign presence of internationalizing
ell, while a retreat to the homefirms generates higher levels of cross-border linkages as wbase has the opposite effect.
Table 7.23: Organizational structure, North American domestically oriented companies (1995-2001)
Subsidiaries Hierarchical depth Hierarchical breadth Cross-border linkages
1995 2001 1995 2001 1995 2001 1995 2001
INTERN 96 236 4.0 5.2 47.8% 35.3% 14.0% 18.9%
DEINTERN 173 120 5.0 3.2 40.9% 54.1% 20.7% 12.9%
7.4.2 North American regionally-oriented companies
The regionally oriented supercluster is the second largest, with a total N of 18, of which 12 were classified as RDL+ in 1990. At the baseline the two true regional clusters (RDL and RMDM, representing only three firms) had a rest-of-region value of approximately 11
ercent and an extra-regional value close to zero. The 15 RDL+ and RMDM+ firms had rest-of-region and extra-regional values of five and 23 percent on average, respectively. An initial analysis over time shows considerable diversity among the key strategy variables,but structuring the overall patterns in terms of increasing or decreasing over the decade as a whole reveals very real strategies (Figure 7.18).
Figure 7.18: Internationalization, North American regionally oriented companies (1990-2001)
p
-20%
0%
10%
20%
30%
-15% -10% -5% 0% 5% 10% 15%
Figure 7.18 represents four quadrants, with the lower left quadrant representing a decreasein both rest-of-region and extra-regional activity (de-internationalization) and the upper
-30%
-10%
RDL
RMDM
RDL+
RMDM+
BCEBCEConsolidation
RDL+
strategy
Escape from
home region
Shift to home
Procter & GambleProcter & Gamble
regionRetreat to
ChryslerChrysler
home country
SafewaySafeway
FordFord GMGM
ChevronChevron
TexacoTexaco
egio
nal
ntr
acti
on
Extr
a-re
gio
nal
expan
sion
Home region expansionHome region contraction
Extr
a-r
co
-20%
0%
10%
20%
30%
-15% -10% -5% 0% 5% 10% 15%
-30%
-10%
RDL
RMDM
RDL+
RMDM+
BCEBCEConsolidation
RDL+
strategy
Escape from
home region
Shift to home
Procter & GambleProcter & Gamble
Retreat to
ChryslerChrysler
SafewaySafeway
regionhome country
FordFord GMGM
ChevronChevron
TexacoTexaco
egio
nal
ntr
acti
on
Extr
a-re
gio
nal
expan
sion
Home region expansionHome region contraction
Extr
a-r
co
244
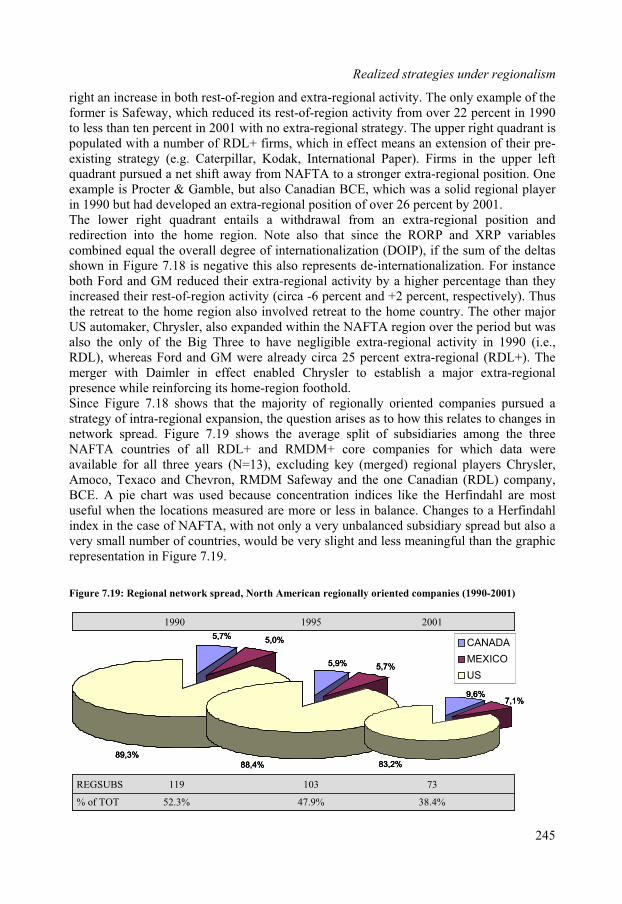
Realized strategies under regionalism
right an increase in both rest-of-region and extra-regional activity. The only example of the former is Safeway, which reduced its rest-of-region activity from over 22 percent in 1990 to less than ten percent in 2001 with no extra-regional strategy. The upper right quadrant is
this relates to changes inetwork spread. Figure 7.19 shows the average split of subsidiaries among the three
a were ble hrysler,
Amoco, Texaco and Chevron, RMDM Safeway and the one Canadian (RDL) company,BCE. A pie chart was used because concentration indices like the Herfindahl are mostuseful when the locations measured are more or less in balance. Changes to a Herfindahlindex in the case of NAFTA, with not only a very unbalanced subsidiary spread but also a very small number of countries, would be very slight and less meaningful than the graphicrepresentation in Figure 7.19.
Figure 7.19: Regional network spread, North American regionally oriented companies (1990-2001)
populated with a number of RDL+ firms, which in effect means an extension of their pre-existing strategy (e.g. Caterpillar, Kodak, International Paper). Firms in the upper left quadrant pursued a net shift away from NAFTA to a stronger extra-regional position. One example is Procter & Gamble, but also Canadian BCE, which was a solid regional playerin 1990 but had developed an extra-regional position of over 26 percent by 2001. The lower right quadrant entails a withdrawal from an extra-regional position and redirection into the home region. Note also that since the RORP and XRP variablescombined equal the overall degree of internationalization (DOIP), if the sum of the deltasshown in Figure 7.18 is negative this also represents de-internationalization. For instanceboth Ford and GM reduced their extra-regional activity by a higher percentage than theyincreased their rest-of-region activity (circa -6 percent and +2 percent, respectively). Thus the retreat to the home region also involved retreat to the home country. The other majorUS automaker, Chrysler, also expanded within the NAFTA region over the period but was also the only of the Big Three to have negligible extra-regional activity in 1990 (i.e.,RDL), whereas Ford and GM were already circa 25 percent extra-regional (RDL+). The merger with Daimler in effect enabled Chrysler to establish a major extra-regionalpresence while reinforcing its home-region foothold.Since Figure 7.18 shows that the majority of regionally oriented companies pursued astrategy of intra-regional expansion, the question arises as to hownNAFTA countries of all RDL+ and RMDM+ core companies for which datavaila for all three years (N=13), excluding key (merged) regional players C
5,7% 5,0% CANADA
MEXICO
US5,9% 5,7%
89,3%88,4%
9,6%7,1%
1990 1995 2001
83,2%
119 103 73REGSUBS
52.3% 47.9% 38.4%% of TOT
5,7% 5,0%
89,3%
5,7% 5,0% CANADA
MEXICO
US5,9% 5,7%
89,3%88,4%
5,9% 5,7%
9,6%7,1%
83,2%88,4%
9,6%7,1%
1990 1995 2001
83,2%
119 103 73REGSUBS
52.3% 47.9% 38.4%% of TOT
245

Chapter Seven
The three pie charts decrease in size over time to reflect the shrinking overall regionalsubsidiary base (REGSUBS). Thus the number of subsidiaries in Canada and Mexico mayin fact be shrinking over time (e.g. for Mexico from 5.9 subsidiaries on average in 1990 to5.2 in 2001), but since the domestic subsidiary base contracted more rapidly, the rest-of-region share of regional subsidiaries increased. Juxtaposed against this trend is the overallregional share (including domestic) relative to the total subsidiary base. The figure shows
ctiono the
xtra-regional e aracte us’Since Figure show at m gion ient s h pan eir r -
tivity e shrin subsi bas st be n th text e 1.1 e average rest-of-region production share cl fro per
1990 to 4.8 percent over 1991-1995, and finally to 5.1 percent over 1996-2001. In themeantime their average domestic share was reduced from 71.5 percent in 1990 to 67.4
d. These shifts in the geographicscope of strategy correspond precisely with changes in network spread. Total regional
oreuickly), but that contraction was not at the expense of hierarchical depth or breadth. In
hierarchiescontinue to deepen over the decade (MXLEV). This suggests that ‘dead-end’ branches of the corporate tree were being pruned while the hierarchy around core activities was being deepened. The modest decline in the share of cross-border linkages between subsidiariesindicates that the ‘dead-end’ branches were mainly domestic subsidiaries with a very smallnumber (e.g. one or two) subsidiaries of their own located in foreign countries. Thiscombination of dynamics can be described as a streamlining of organizational structure.
Table 7.24: Organizational structure, North American regionally oriented strategies (1990-2001)
1990 1995 2001
(‘% of TOT’) that the absolute contraction of the regional base must be seen in conjunwith extra-regional expansion of the subsidiary base. This corresponds generally te xpansive ch r of ‘regional-pl firms.
7.18 ed th ost re ally or ed firm ave ex ded th est-ofregion ac , th king diary e mu seen i is con . For th 3 firmsin Figure 7 9, th imbed m 4.3 cent in
percent in the first period and 65.4 in the second perio
activity and the regional subsidiary base declined in relation to total activity and totalnetwork spread, and within the region there was a relative shift towards Mexico andCanada. In conjunction, the burden of an increase in intra-regional activity was borne byan ever-shrinking number of subsidiaries, indicating a tendency to rationalize activities ona regional scale. Rationalization is evidenced in fact by changes to the organizational structure of regionallyoriented firms. Table 7.24 shows how the overall subsidiary base contracted over thedecade (while Figure 7.19 shows that the regional subsidiary base contracted even mqfact, the network breadth variable (PRIM) remains constant for the group while
TOTSUB 226.5 210.6 186.2
PRIM 35.1% 34.6% 36.4%
MXLEV 4.9 5.2 5.9
CBL 40.0% 43.4% 35.5%
246

Realized strategies under regionalism
7.4.3 Bi-regionally oriented companies
The extra-regional character of their spatial organization is the basic characteristic of bi-regionally oriented companies. Yet the North American bi-regional supercluster (N=11) shows a striking similarity to its European counterpart in that it too experienced a relativedecline in extra-regional activity, particularly after 1995. Only three companies (Hewlett-Packard, Motorola and Dow) expanded extra-regionally after 1995, raising their XRP sharefrom 41 percent in 1991-95 to 45 percent in 1996-01. The remaining eight in fact retreatedfrom their extra-regional position, as shown in Table 7.25.
Table 7.25: Intra- vs. extra-regionality, North American bi-regionally oriented companies (1990-2001)
Rest-of-region (RORP) Extra-regionality (XRP)
N 1990 1991-95 1996-01 1990 1991-95 1996-01
XRP incr 3 2.1% 2.4% 2.8% 40.9% 41.0% 45.0%
XRP decr 8 4.7% 5.4% 5.8% 39.1% 41.6% 36.3%
The table shows the average RORP and XRP values for firms whose extra-regional activityincreased and those for whom it decreased. Both groups exhibit nearly identical extra-regional shares of activity in 1990 and from 1991 to 1995. Subsequently, however, theirtrajectories diverged to such an extent that their respective XRP values in the period 1996-
declined from 59 percent to 55 percent.irms which expanded extra-regionally after 1995, however, had a markedly lower rest-of-
. Thiso
choose focus after 1995, either to opt for an expansionist global strategy or consolidatewithin the home region. Only the few bi-regional firms with a relatively modest home-
region position in 1990 were able to pursue continued global expansion, while for thosewith a more solid regional base opted for consolidation within the home region.As in the case of extra-regional retreat by European firms, the withdrawal by North American companies is best qualified by considering shifts in the share of activity inEurope (RG2P), and Europe as a percentage of overall extra-regional activity (XR2).Figure 7.21 shows the average values for RG2P and XR2 for the three firms whichcontinued to expand extra-regionally compared with the values for the eight firms inretreat. Firms in extra-regional retreat withdrew slightly from Europe, which declined as a share of the total from over 29 percent in the first period to just over 27 percent in the
2001 were nearly 10 percentage points apart (36 percent and 45 percent). The data alsoshow that both groups continued to expand into the home region over the decade as a whole. However, the increase in RORP after 1995 for the latter group (from 5.4 percent inthe first period to 5.8 percent in the second) does not account for the dramatic drop in extra-regionality. This means that the extra-regional contraction was a matter of overall de-
internationalization. While the overall degree of internationalization for both groups was quite comparable in 1990 (approximately 43 percent), after 1995 firms in retreat had anoverall DOI of 42 percent compared to the 49 percent of firms in extra-regional expansion.Alternately, this means firms in retreat had increased their overall home region position(including domestic) from 61 percent in 1990 to 64 percent after 1995, while the regionalposition of firms in expansionFregion share of activity than firms which reduced their extra-regional positionsuggests once again that firms pursuing bi-regional strategies in 1990 were forced t
247
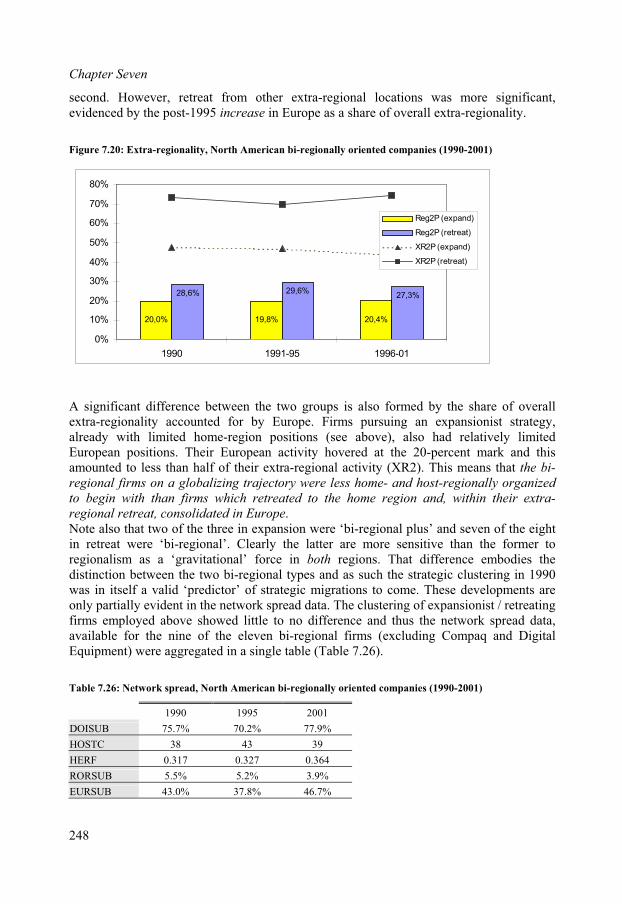
Chapter Seven
second. However, retreat from other extra-regional locations was more significant,videnced by the post-1995 increase in Europe as a share of overall extra-regionality.
grms employed above showed little to no difference and thus the network spread data,
DigitalEquipment) were aggregated in a single table (Table 7.26).
Ta wo d, Nort ican b lly oriented companies (1990-2001)
1990 95 01
e
Figure 7.20: Extra-regionality, North American bi-regionally oriented companies (1990-2001)
20,0% 19,8% 20,4%
28,6% 29,6%27,3%
0%
10%
20%
30%
40%
1990 1991-95 1996-01
50%
60%
70%
80%
Reg2P (expand)
Reg2P (retreat)
XR2P (expand)
XR2P (retreat)
A significant difference between the two groups is also formed by the share of overallextra-regionality accounted for by Europe. Firms pursuing an expansionist strategy,already with limited home-region positions (see above), also had relatively limitedEuropean positions. Their European activity hovered at the 20-percent mark and thisamounted to less than half of their extra-regional activity (XR2). This means that the bi-
regional firms on a globalizing trajectory were less home- and host-regionally organized
to begin with than firms which retreated to the home region and, within their extra-regional retreat, consolidated in Europe.Note also that two of the three in expansion were ‘bi-regional plus’ and seven of the eightin retreat were ‘bi-regional’. Clearly the latter are more sensitive than the former toregionalism as a ‘gravitational’ force in both regions. That difference embodies thedistinction between the two bi-regional types and as such the strategic clustering in 1990was in itself a valid ‘predictor’ of strategic migrations to come. These developments are only partially evident in the network spread data. The clustering of expansionist / retreatinfiavailable for the nine of the eleven bi-regional firms (excluding Compaq and
b Netle 7.26: rk sprea h Amer i-regiona
19 20
DOISUB 75.7% 70.2% 77.9%
HOSTC 38 43 39
HERF 0.317 0.327 0.364
RORSUB 5.5% 5.2% 3.9%
EURSUB 43.0% 37.8% 46.7%
248

Realized strategies under regionalism
The data paint a mixed picture of modest fluctuations in internationalization of the
95 (43 to 37.8 percent) was ompensated by an increase in the domestic share of subsidiaries (i.e., a drop in DOISUB
iaryime
the role exico and gional strategy sh ine (and with tha ht sh from a and rds M m e
share of subsidiaries together with est-of- and E were s lyc nting 2.8 perc f all sub es in 1990 and 72.7 percent in 2
rganizationally, bi-regional firms followed a similar path as regionally oriented firms as ell as their European counterparts, involving a reduction in network breadth and an
subsidiary base and the number of host countries. The only indication of the pattern ofregional retreat discerned above is given by the overall concentration index (HERF), whichrose moderately over the decade. To explore whether this rise was related to aconsolidation of the North American and European position, and thereby ‘bi-regionality’ ingeneral, the percentage of the subsidiary base in Europe was also calculated (EURSUB)and that of the rest of North America (RORSUB).The data do substantiate the general consolidation across two regions. Since the drop in theEuropean share of the subsidiary base from 1990 to 19cfrom over 75 percent to less than 71 percent), the data suggest that shifts in the subsidnetwork occurred overwhelmingly between the home country and Europe. In the meant
of M Canada in the bi-re owed a gradual declin t decline a slig ift away Canad towa exico). Co bined, th
domestic the r region urope trikingstable, ac ou for 7 ent o sidiari 001.Owincrease in network depth. Figure 7.21 shows these two dimensions along the horizontaland vertical axes, respectively. In terms of depth there was essentially no change between1990 and 1995, while there was a slight increase across the horizontal. After 1995, however, bi-regional firms became significantly more vertical in orientation, with a jumpin depth from fewer than four levels in 1995 to six in 2001 and a reduction in breadth fromover 30 percent in 1995 to 20 percent in 2001. In terms of overall network size, bi-regionalfirms changed little, hovering just above or just below 300 subsidiaries.
Figure 7.21: Organizational structure, North American bi-regionally oriented companies (1990-2001)
323,6288,7
3,0
4,0
5,0
298,46,0
7,0
2,0
0% 5% 10% 15% 20% 25% 30% 35% 40% 45%
1990
1995
2001
Hierarchical breadth
Hie
rarc
hic
al d
epth
323,6288,7
3,0
4,0
5,0
298,46,0
7,0
2,0
0% 5% 10% 15% 20% 25% 30% 35% 40% 45%
1990
1995
2001
Hierarchical breadth
Hie
rarc
hic
al d
epth
249
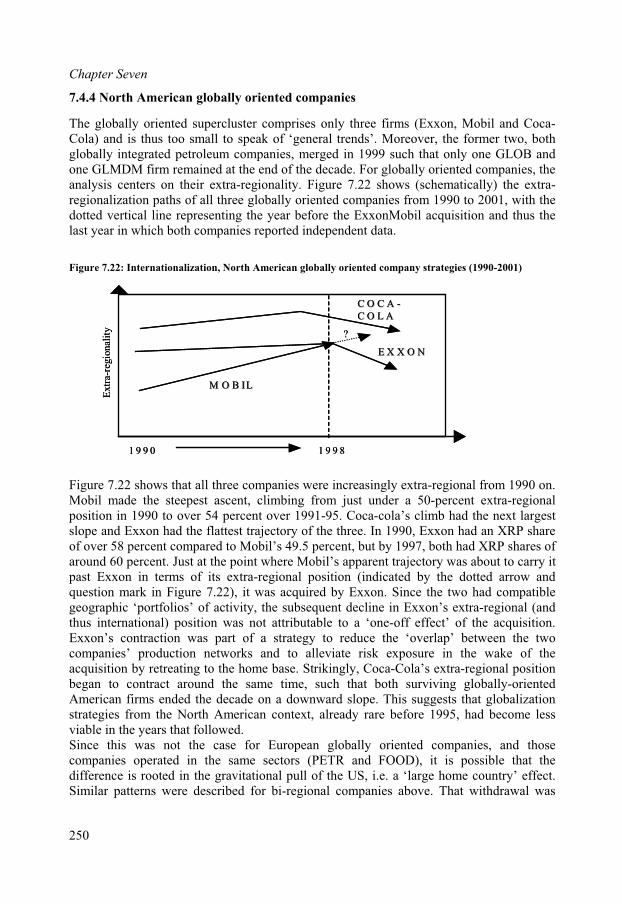
Chapter Seven
7.4.4 North American globally oriented companies
he globally oriented supercluster comprises only three firms (Exxon, Mobil and CTC
oca-ola) and is thus too small to speak of ‘general trends’. Moreover, the former two, both
i andone GLMDM firm remained at the end of the decade. For globally oriented companies, the analysis centers on their extra-regionality. Figure 7.22 shows (schematically) the extra-regionalization paths of all three globally oriented companies from 1990 to 2001, with thedotted vertical line representing the year before the ExxonMobil acquisition and thus the last year in which both companies reported independent data.
Figure 7.22: Internationalization, North American globally oriented company strategies (1990-2001)
Coca-cola’s climb had the next largest
posure in the wake of thecquisition by retreating to the home base. Strikingly, Coca-Cola’s extra-regional position
t lly-oriented
rategies from th rth Am contex rare before 1995, had become less the year ollowe
his was n the case Europea globally oriented companies, and thosenies opera the s ectors (PETR and FOOD), it is possible that the
e is root the gra nal pul e US, i.e. a ‘large home country’ effect.atterns were described for bi-reg companies above. That withdrawal was
globally ntegrated petroleum companies, merged in 1999 such that only one GLOB
1 9 9 81 9 9 0
Extr
a-re
gio
nal
ity
E X X O NE X X O N
C O C AC O C A --
C O L AC O L A
M O B ILM O B IL
?
1 9 9 81 9 9 0
Extr
a-re
gio
nal
ity
E X X O NE X X O N
C O C AC O C A --
C O L AC O L A
M O B ILM O B IL
?
Figure 7.22 shows that all three companies were increasingly extra-regional from 1990 on.Mobil made the steepest ascent, climbing from just under a 50-percent extra-regionalposition in 1990 to over 54 percent over 1991-95.slope and Exxon had the flattest trajectory of the three. In 1990, Exxon had an XRP share of over 58 percent compared to Mobil’s 49.5 percent, but by 1997, both had XRP shares ofaround 60 percent. Just at the point where Mobil’s apparent trajectory was about to carry itpast Exxon in terms of its extra-regional position (indicated by the dotted arrow andquestion mark in Figure 7.22), it was acquired by Exxon. Since the two had compatiblegeographic ‘portfolios’ of activity, the subsequent decline in Exxon’s extra-regional (and thus international) position was not attributable to a ‘one-off effect’ of the acquisition.Exxon’s contraction was part of a strategy to reduce the ‘overlap’ between the twocompanies’ production networks and to alleviate risk exabegan o contract around the same time, such that both surviving globaAmerican firms ended the decade on a downward slope. This suggests that globalization st e No erican t, alreadyviable in s that f d.Since t ot for ncompa ted in ame sdifferenc ed in vitatio l of thSimilar p ional
250
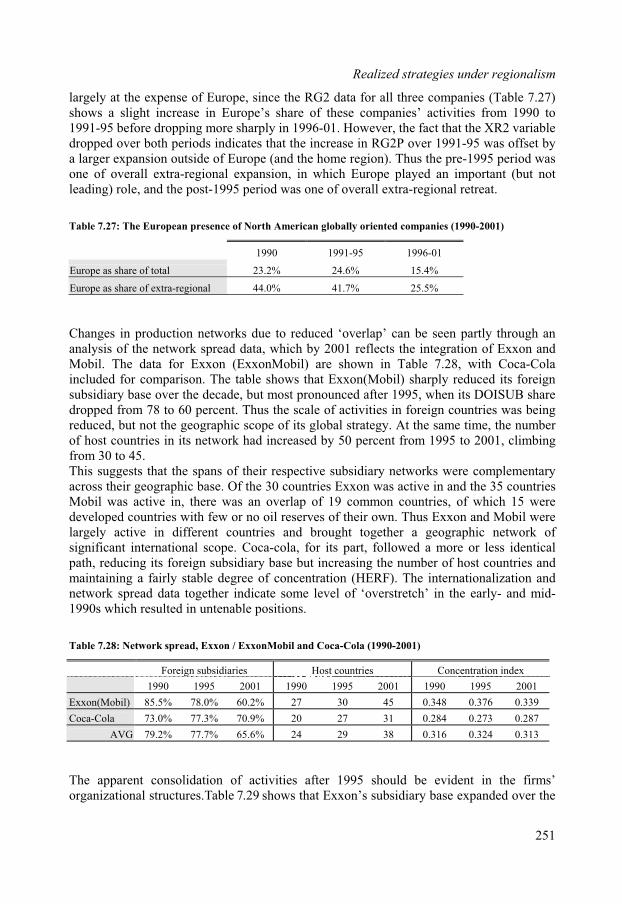
Realized strategies under regionalism
largely at the expense of Europe, since the RG2 data for all three companies (Table 7.27)shows a slight increase in Europe’s share of these companies’ activities from 1990 to 1991-95 before dropping more sharply in 1996-01. However, the fact that the XR2 variabledropped over both periods indicates that the increase in RG2P over 1991-95 was offset bya larger expansion outside of Europe (and the home region). Thus the pre-1995 period wasone of overall extra-regional expansion, in which Europe played an important (but notleading) role, and the post-1995 period was one of overall extra-regional retreat.
Table 7.27: The European presence of North American globally oriented companies (1990-2001)
1990 1991-95 1996-01
Europe as share of total 23.2% 24.6% 15.4%
Europe as share of extra-regional 44.0% 41.7% 25.5%
Changes in production networks due to reduced ‘overlap’ can be seen partly through ananalysis of the network spread data, which by 2001 reflects the integration of Exxon and Mobil. The data for Exxon (ExxonMobil) are shown in Table 7.28, with Coca-Colaincluded for comparison. The table shows that Exxon(Mobil) sharply reduced its foreignsubsidiary base over the decade, but most pronounced after 1995, when its DOISUB sharedropped from 78 to 60 percent. Thus the scale of activities in foreign countries was being reduced, but not the geographic scope of its global strategy. At the same time, the numberof host countries in its network had increased by 50 percent from 1995 to 2001, climbingfrom 30 to 45.
his suggests that the spans of their respective subsidiary networks werTa
e complementarycross their geographic base. Of the 30 countries Exxon was active in and the 35 countries
developed countries with few or no oil reserves of their own. Thus Exxon and Mobil were largely active in different countries and brought together a geographic network of significant international scope. Coca-cola, for its part, followed a more or less identicalpath, reducing its foreign subsidiary base but increasing the number of host countries and maintaining a fairly stable degree of concentration (HERF). The internationalization andnetwork spread data together indicate some level of ‘overstretch’ in the early- and mid-1990s which resulted in untenable positions.
Table 7.28: Network spread, Exxon / ExxonMobil and Coca-Cola (1990-2001)
Foreign subsidiaries Host countries Concentration index
Mobil was active in, there was an overlap of 19 common countries, of which 15 were
1990 1995 2001 1990 1995 2001 1990 1995 2001
Exxon(Mobil) 85.5% 78.0% 60.2% 27 30 45 0.348 0.376 0.339
Coca-Cola 73.0% 77.3% 70.9% 20 27 31 0.284 0.273 0.287
AVG 79.2% 77.7% 65.6% 24 29 38 0.316 0.324 0.313
he apparent consolidation of activities after 1995 should be evident in the firms’T
251
Table 7.29 organizational structures. shows that Exxon’s subsidiary base expanded over the

Chapter Seven
decade as a whole, but that the expansion prior to 1995 was one of breadth as opposed to
Subsidiary base Hierarchical breadth Hierarchical depth Cross-border linkages
depth, whereas its network after 1995 deepened both relatively and absolutely, no doubtdue to the absorption of Mobil’s activities. The enhanced streamlining of its organizationalstructure is also demonstrated by an increase in cross-border linkages after 1995 (from24.5 to 29 percent) despite the overall reduction in the foreign share of the subsidiary base.That means that host country networks were considerably ‘leaner’ and spanned morecountries in the second half of the decade than in the first.
Table 7.29: Organizational structure, Exxon / ExxonMobil and Coca-Cola (1990-2001)
1990 1995 2001 1990 1995 2001 1990 1995 2001 1990 1995 2001
Exxon(Mobil) 166 200 244 25.5% 31.5% 24.5% 6 5 8 29.5% 24.5% 29.0%
Coca-Cola 122 75 79 8.2% 14.7% 31.6% 8 6 5 28.7% 52.0% 54.4%
AVG 144.0 137.5 161.5 16.9% 23.1% 28.1% 7.0 5.5 6.5 29.1% 38.3% 41.7%
Joining forces was part of an internationalization strategy for both companies. Analyzed asa (fictitious) combined entity over the entire decade (in effect weighing for size and differences in geographic scale and scope), their internationalization data exhibit surprisingstability. For the combined entity the overall degree of internationalization climbed from63 percent in 1990 to 64.5 percent over 1991-95, holding steady over 1996-01 at 65.3 percent. The extra-regional share followed the same path, rising from 55.6 percent in 1990to 57.3 over the first period and again remaining constant thereafter at 57.2 percent. The ombined entity’s rest-of-region share actually climbed after 1995, from 7.2 percent over c
1991-95 to 8.1 percent over 1996-01.Coca-Cola, meanwhile, had significantly reduced its European activity, from 40 percent in1991-95 to just 20 percent in 1996-01 (seen also in the rising HERF index). There was still a noticeable increase in the number of countries with productive activity over both periods and a general reduction in the size of the subsidiary base, suggesting that Coca-Cola was trimming the fat at all levels. The modest size of its subsidiary base stands in stark contrastwith the European GLMDM companies, which are many times larger. Coca-Cola’s tendency to work through licensed bottling operations makes its control strategy more one of ‘core technologies’ (the secret Coca-Cola recipe) than one of direct managementcontrol. This is quite possibly the only way in which a non-vertically integrated companyfrom a micro-Fordist environment can attain global status, through the use of ‘soft control’tactics that permit centralization within a decentralized industry (cf. also for exampleMcDonald’s).
7.4.5 Interim conclusions, pt. 2
The strategy migrations pursued by North American core companies are in most ways similar to the strategies of their European counterparts. The overall trend towards moreinternational activity, both inside and outside (although to a lesser extent in relative terms)the NAFTA region, is undeniable, yet there are some differences. As a whole,internationalization strategies for North American core companies can be said to have converged, with the least international in 1990 becoming more so over the decade and the
252

Realized strategies under regionalism
most international in 1990 becoming less so. This shrinking bandwidth is evident in Figure7.23, which shows the migrations for the 52 surviving North American core companies in2001.While domestic companies have internationalized to some extent, many have remained(absolutely) domestic, showing that the US as a home base can still guarantee a relativelysecure position for its core companies, even within the context of the NAFTA. Regionallyoriented firms show divergent tendencies, with some firms retreating into the home regionnd even home country, and others moving out of the regional orbit. Ironically, therefore, a
strategy,
cquisitions.
, North an core co s (1990-20
rategies became less extra-regional and moreoncentrated, in some cases in the home region and in others focused on the two core
onalism may have polarized the strategy field, inducing some firms to concentrate on protecting the regional
ase of their co thers to ‘e onfines of andeconstitute th iti the s o rap pre lob rie om s,
t ui of by xon acc , w parently su toessu bi a and ded u ret afte 5, w e
home c e ethe 52 surviving firms were reclassified in the strategy typology according to their
ctivity in 1996-01 (Table 7.30), the changes would be less dramatic than for European
astrictly regional strategy appears an insufficient basis for maintaining a coreespecially when one considers the overrepresentation of regional firms in the wave of a
Figure 7.23: Strategy migrations Americ mpanie 01)
For the bi-regional supercluster as a whole, st
Regionally oriented
cregions. This suggests that from the North American context regi
b re position and o scape’ the c the home regionr at pos on on basi f geog hic s ad. G ally o nted c panieeven taking he acq sition Mobil Ex into ount ere ap bjectsimilar pr res as -region l firms en p in reat r 199 both to ards th
ountry and th home r gion.Ifacore companies. Only twelve companies changed their classification. The changes in Table 7.30 are in part a reflection of new cluster membership, i.e. through new companies joining
Domestically oriented
Biregionally oriented
Globally oriented
Internationality vs. Extra-regionality
0,0%
10,0%
20,0%
0,0% 10,0% 20,0% 30,0% 40,0% 50,0% 60,0% 70,0% 80,0% 90,0%
International production (scale)
Ext
ra-r
eg
iona
30,0%
40,0%
50,0%
60,0%
70,0%
l pro
du
ctio
n(s
co
pe)
Regionally orientedDomestically oriented
Biregionally oriented
Globally oriented
Internationality vs. Extra-regionality
0,0%
10,0%
20,0%
0,0% 10,0% 20,0% 30,0% 40,0% 50,0% 60,0% 70,0% 80,0% 90,0%
International production (scale)
Ext
ra-r
eg
iona
30,0%
40,0%
50,0%
60,0%
70,0%
l pro
du
ctio
n(s
co
pe)
253
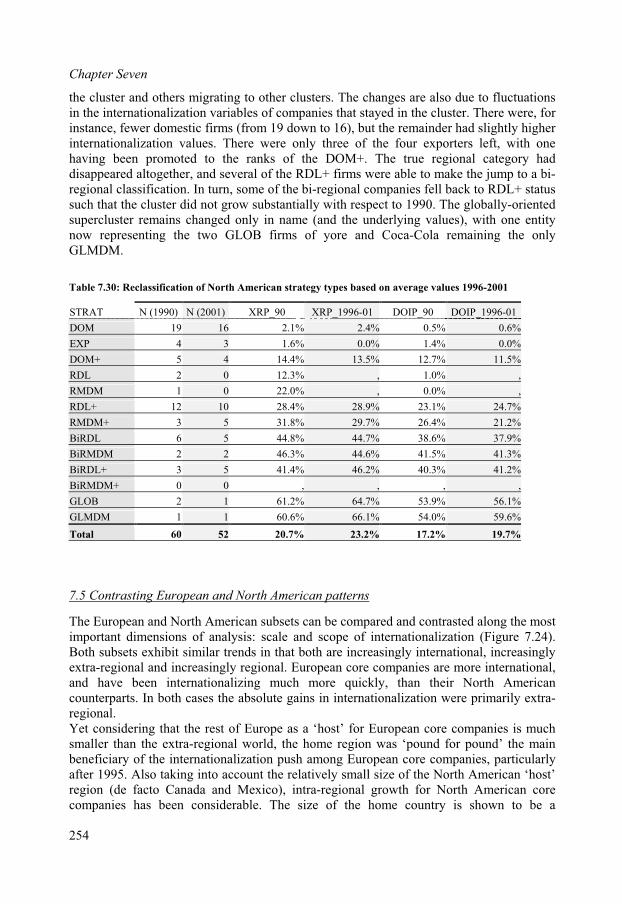
Chapter Seven
the cluster and others migrating to other clusters. The changes are also due to fluctuations in the internationalization variables of companies that stayed in the cluster. There were, forinstance, fewer domestic firms (from 19 down to 16), but the remainder had slightly higher internationalization values. There were only three of the four exporters left, with onehaving been promoted to the ranks of the DOM+. The true regional category haddisappeared altogether, and several of the RDL+ firms were able to make the jump to a bi-regional classification. In turn, some of the bi-regional companies fell back to RDL+ status
ch that the cluster did not grow substantially with respect to 1990. The globally-orientedwith one entity
aining the onlyLMDM.
cl cat f N A g ba on rage ue
STRAT
susupercluster remains changed only in name (and the underlying values),now representing the two GLOB firms of yore and Coca-Cola remG
Table 7.30: Re assifi ion o orth merican strate y types sed ave val s 1996-2001
N (1990) N (2001) XRP_90 XRP_1996-01 DOIP_90 DOIP_1996-01
DOM 19 16 2.1% 2.4% 0.5% 0.6%
EXP 4 3 1.6% 0.0% 1.4% 0.0%
DOM+ 5 4 14.4% 13.5% 12.7% 11.5%
RDL 2 0 12.3% , 1.0% ,
RMDM 1 0 22.0% , 0.0% ,
RDL+ 12 10 28.4% 28.9% 23.1% 24.7%
RMDM+ 3 5 31.8% 29.7% 26.4% 21.2%
BiRDL 6 5 44.8% 44.7% 38.6% 37.9%
BiRMDM 2 2 46.3% 44.6% 41.5% 41.3%
BiRDL+ 3 5 41.4% 46.2% 40.3% 41.2%
BiRMDM+ 0 0 , , , ,
GLOB 2 1 61.2% 64.7% 53.9% 56.1%
GLMDM 1 1 60.6% 66.1% 54.0% 59.6%
Total 60 52 20.7% 23.2% 17.2% 19.7%
7.5 Contrasting European and North American patterns
The European and North American subsets can be compared and contrasted along the mostimportant dimensions of analysis: scale and scope of internationalization (Figure 7.24).Both subsets exhibit similar trends in that both are increasingly international, increasingly extra-regional and increasingly regional. European core companies are more international, and have been internationalizing much more quickly, than their North American
solute gains in internationalization were primarily extra-counterparts. In both cases the abregional.Yet considering that the rest of Europe as a ‘host’ for European core companies is muchsmaller than the extra-regional world, the home region was ‘pound for pound’ the mainbeneficiary of the internationalization push among European core companies, particularlyafter 1995. Also taking into account the relatively small size of the North American ‘host’ region (de facto Canada and Mexico), intra-regional growth for North American core companies has been considerable. The size of the home country is shown to be a
254
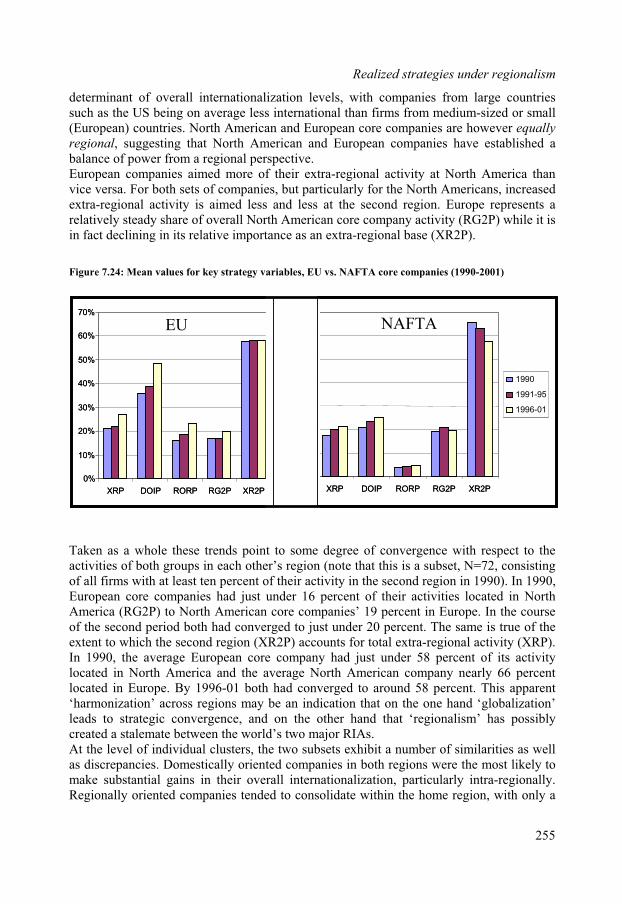
Realized strategies under regionalism
determinant of overall internationalization levels, with companies from large countriessuch as the US being on average less international than firms from medium-sized or small(European) countries. North American and European core companies are however equally
igure 7.24: Mean values for key strategy variables, EU vs. NAFTA core companies (1990-2001)
Taken as a whole these trends point to some degree of convergence with respect to theactivities of both groups in each other’s region (note that this is a subset, N=72, consisting
l firms with at least ten percent of their activity in the second region in 1990). In 1990,uropean core companies had just under 16 percent of their activities located in North
wo major RIAs.
regional, suggesting that North American and European companies have established a balance of power from a regional perspective.European companies aimed more of their extra-regional activity at North America thanvice versa. For both sets of companies, but particularly for the North Americans, increased extra-regional activity is aimed less and less at the second region. Europe represents arelatively steady share of overall North American core company activity (RG2P) while it isin fact declining in its relative importance as an extra-regional base (XR2P).
F
0%
10%
20%
30%
40%
50%
60%
70%
XRP DOIP RORP RG2P XR2P
1990
P1
P2
0,0%
10,0%
20,0%
30,0%
40,0%
50,0%
60,0%
70,0%
XRP DOIP RORP RG2P XR2P
1990
1991-95
1996-01
NAFTAEU
0%
10%
20%
30%
40%
50%
60%
70%
XRP DOIP RORP RG2P XR2P
1990
P1
P2
0,0%
10,0%
20,0%
30,0%
40,0%
50,0%
60,0%
70,0%
XRP DOIP RORP RG2P XR2P
1990
1991-95
1996-01
NAFTAEU
of alEAmerica (RG2P) to North American core companies’ 19 percent in Europe. In the course of the second period both had converged to just under 20 percent. The same is true of theextent to which the second region (XR2P) accounts for total extra-regional activity (XRP).In 1990, the average European core company had just under 58 percent of its activitylocated in North America and the average North American company nearly 66 percent located in Europe. By 1996-01 both had converged to around 58 percent. This apparent‘harmonization’ across regions may be an indication that on the one hand ‘globalization’leads to strategic convergence, and on the other hand that ‘regionalism’ has possiblycreated a stalemate between the world’s tAt the level of individual clusters, the two subsets exhibit a number of similarities as well as discrepancies. Domestically oriented companies in both regions were the most likely tomake substantial gains in their overall internationalization, particularly intra-regionally.Regionally oriented companies tended to consolidate within the home region, with only a
255

Chapter Seven
few ‘migrating’ into a bi-regionally oriented strategy. Bi-regionally oriented companiesfrom both regions tended to become less extra-regionally oriented over the decade, and those that became more extra-regional tended to concentrate that extra-regional activity more and more in the second (‘host’) region. This suggests that regionalism exerts agravitational pull on the geographic spread of activity, from which only the most highlyinternationalized companies can break free. For bi-regionally oriented companies thatcreates a ‘chasm’ between the regional and the truly global that few were able to leapacross.
256
8. SYNTHESIS: OPENNESS AND THE MACRO-MICRO LINK
One of the key conclusions in Chapter 2 was that the mainstream literature on regionalintegration tends to be macro-oriented. Core companies and their strategies form the bridgebetween the macro- and micro-levels of analysis. They control, both directly andindirectly, significant volumes of economic activity. In Chapter 5, trends at the macro-levelwere analyzed on the basis of trade and investment data to draw conclusions about thelevel of inward- and outward openness of the SEM and the NAFTA. In Chapters 6 and 7, trends in the spatial organization of core companies from both were analyzed on the basisof their internationalization of production, network spread and organizational structure.
ince core companies are the lynch pin between the micro and macro levels of analysis, n t larger
economic shifts and ultimately about regional openness. It must be recognized, however, that such an analysis distorts the firm-level perspective by overemphasizing the largestfirms. In the end this distortion is a major component of the ‘level of analysis problem’identified in Chapter 2.
8.1 Openness in European competitive space
Sdiscussi g their activities at the aggregate level can reveal a great deal abou
The most crucial form of openness from the policymaker’s perspective is inside-in, or thedegree to which insider companies interpenetrate each other’s home markets. The second form of openness is that of outward openness (from the inside-out), or the tendencyregionalism has to foster extra-regional expansion. Thirdly, inward (outside-in) openness will be discussed, meaning the scale and scope of outsider firm activity (North Americanfirms in the case of Europe and vice versa). Although theoretically outside-out openness was addressed in Chapter 3, it falls beyond the scope of the micro-level data under consideration in this study. For such analysis ‘third party’ firm activity in the world
ond North America and Europe would need to be considered; this remains a focus for ture research.
ugh exchange rate fluctuations.
beyfu
8.1.1 Inside-in openness, Europe
There are several ways in which inside-in openness can be investigated with the data athand. Firstly, on the basis of the aggregated value of production of all the companies inquestion within Europe. This also removes the problem of whether or not to omit firmswhich have been acquired (as shown above almost exclusively at the hands of other core companies), since their activity will have been absorbed by the acquiring firm and thus willstill be reflected in the aggregate numbers. If the acquisition was cross-regional, theeconomic activity remains more or less in the same location but through the change ofownership, becomes e.g. part of the ‘outside-in’ instead of the inside-in perspective.Analysis in this way also biases the outcomes towards the larger firms, but remains a representation of overall economic activity if ownership is not considered.Aggregating asset positions creates a possibility of bias throFor instance, a European firm’s assets in the US may appreciate, and therefore take on alarger significance in the firm’s overall portfolio, simply through an appreciation of thedollar relative to the Euro. No attempt is made here to correct for this potential bias, on the
257

Chapter Eight
one hand for technical reasons of feasibility and on the other to maintain a level of‘strategic reality’ in the analysis.Technically, it would be nearly impossible to correct for exchange rate effects because there is no universal adjustor for companies with a complex geographic spread of activities. It would be nearly impossible to recalculate the value of activity in any given country because these have already been converted from host-country currencies to home-country currencies and aggregated in the annual report. Given the level of geographicdisclosure provided in the average company annual report, individual countries (within the
eographic segments reported) could only be indicatively aggregated and weighted, introducing other possibilities for random bias.Strategically, the appreciation of US assets in the aforementioned example is relevant notonly because it reflects a real situation that affects business behavior (such as the ability to export or the cost of borrowing capital), but also because it affects the firm’s relative bargaining power and positioning in the host country. This latter consideration is verymuch in keeping with the strategic actor approach central to this study (see Chapter 3). Figure 8.1 shows the cumulative domestic and rest-of-region positions for European corecompanies as a group against the backdrop of regional GDP growth.
Figure 8.1: European core company regional production (agg.) vs. EU GDP (1990-2001)
The values are shown in US dollars, which introduces an additional bias through exchangerate fluctuations. However, since the companies in question themselves report in differentcurrencies, and through their international activity carry exchange rate fluctuations over into their balance sheets, correcting for that bias becomes impossible without knowing theexact value of activities in distinct countries for each firm in each year, or being able to make corrections for e.g. transfer pricing and arbitrage activities. The figures also reflectother Europe besides the EU15, since most companies do not specify the one versus the
distinction had on average less than five percent of their European activity in non-EU Europe. Therefore the figures may overstate the case slightly but as an indication continue
g
$0
$200
$400
$600
$800
$1.000
$1.200
$1.400
$1.600
$1.800
1990 1991-95 1996-01
$1.000
$2.000
$3.000
$4.000
$5.000
$6.000
$7.000
$8.000
$9.000
Domestic
Rest-of-region
EU GDP
Region total
Cum
ula
ted
ass
ets
(bil
lions)
GD
P (b
illions)+4.2%
+2.8%
+10.3%
+4.4%
+6.5%
-0.1%
+12.3%
+0.2%
$0
$200
$400
$600
$800
$1.000
$1.200
$1.400
$1.600
$1.800
1990 1991-95 1996-01
$1.000
$2.000
$3.000
$4.000
$5.000
$6.000
$7.000
$8.000
$9.000
Domestic
Rest-of-region
EU GDP
Region total
Domestic
Rest-of-region
EU GDP
Region total
Cum
ula
ted
ass
ets
(bil
lions)
GD
P (b
illions)+4.2%
+2.8%
+10.3%
+4.4%
+6.5%
-0.1%
+12.3%
+0.2%
258
other (see Appendix ). However, the circa 14 companies which did make such a II
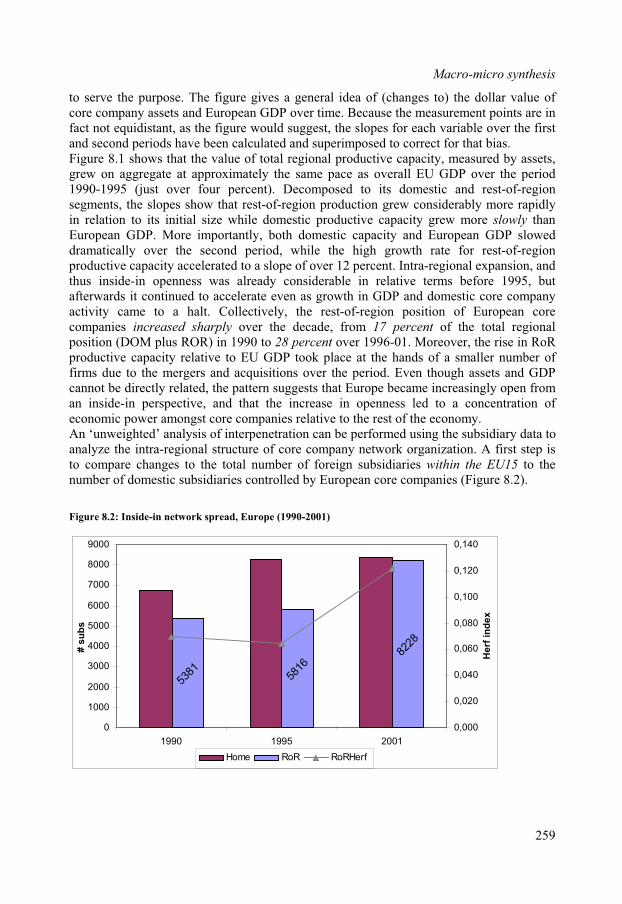
Macro-micro synthesis
259
e of
position (DOM plus ROR) in 1990 to 28 percent over 1996-01. Moreover, the rise in RoRk place at the hands of a smaller number of
he period. Even though assets and GDP
to serve the purpose. The figure gives a general idea of (changes to) the dollar valucore company assets and European GDP over time. Because the measurement points are in fact not equidistant, as the figure would suggest, the slopes for each variable over the firstand second periods have been calculated and superimposed to correct for that bias.Figure 8.1 shows that the value of total regional productive capacity, measured by assets,grew on aggregate at approximately the same pace as overall EU GDP over the period 1990-1995 (just over four percent). Decomposed to its domestic and rest-of-regionsegments, the slopes show that rest-of-region production grew considerably more rapidlyin relation to its initial size while domestic productive capacity grew more slowly thanEuropean GDP. More importantly, both domestic capacity and European GDP sloweddramatically over the second period, while the high growth rate for rest-of-regionproductive capacity accelerated to a slope of over 12 percent. Intra-regional expansion, and thus inside-in openness was already considerable in relative terms before 1995, butafterwards it continued to accelerate even as growth in GDP and domestic core companyactivity came to a halt. Collectively, the rest-of-region position of European core companies increased sharply over the decade, from 17 percent of the total regional
productive capacity relative to EU GDP toofirms due to the mergers and acquisitions over tcannot be directly related, the pattern suggests that Europe became increasingly open froman inside-in perspective, and that the increase in openness led to a concentration of economic power amongst core companies relative to the rest of the economy.An ‘unweighted’ analysis of interpenetration can be performed using the subsidiary data toanalyze the intra-regional structure of core company network organization. A first step isto compare changes to the total number of foreign subsidiaries within the EU15 to thenumber of domestic subsidiaries controlled by European core companies (Figure 8.2).
Figure 8.2: Inside-in network spread, Europe (1990-2001)
5381 58
1682
28
1000
2000
3000
4000
5000
6000
7000
# s
ub
s
0,020
0,040
0,060
0,080
0,100
0,120
He
rf i
nd
ex
8000
9000
0
1990 1995 2001
0,000
0,140
Home RoR RoRHerf
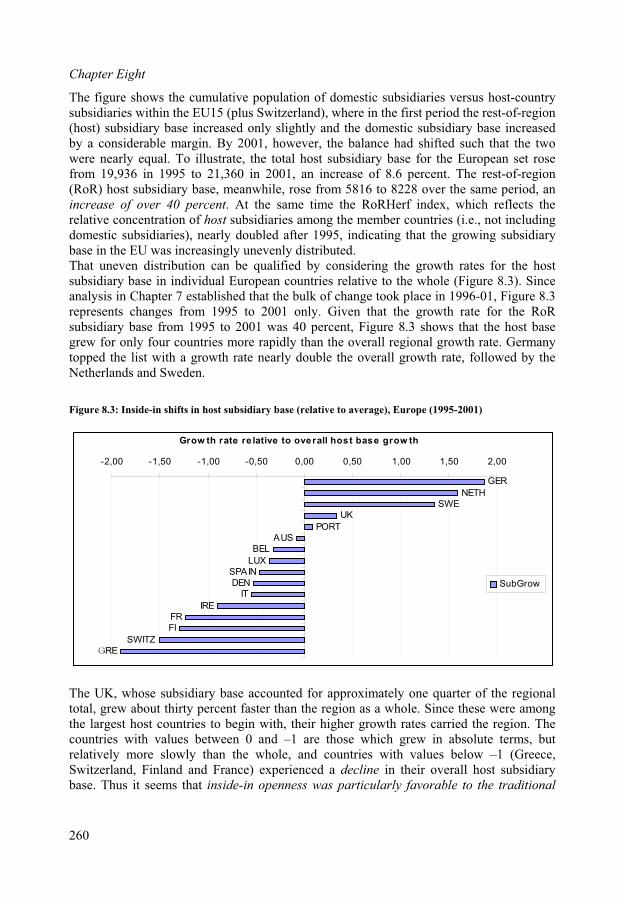
Chapter Eight
The figure shows the cumulative population of domestic subsidiaries versus host-countrysubsidiaries within the EU15 (plus Switzerland), where in the first period the rest-of-region
5, indicating that the growing subsidiary
rowth rate. Germanyhe list with a growth rate nearly double the overall growth rate, followed by the
Figure 8.3: Inside-in shifts in host subsidiary base (relative to average), Europe (1995-2001)
(host) subsidiary base increased only slightly and the domestic subsidiary base increased by a considerable margin. By 2001, however, the balance had shifted such that the twowere nearly equal. To illustrate, the total host subsidiary base for the European set rosefrom 19,936 in 1995 to 21,360 in 2001, an increase of 8.6 percent. The rest-of-region(RoR) host subsidiary base, meanwhile, rose from 5816 to 8228 over the same period, anincrease of over 40 percent. At the same time the RoRHerf index, which reflects therelative concentration of host subsidiaries among the member countries (i.e., not includingdomestic subsidiaries), nearly doubled after 199base in the EU was increasingly unevenly distributed.That uneven distribution can be qualified by considering the growth rates for the hostsubsidiary base in individual European countries relative to the whole (Figure 8.3). Sinceanalysis in Chapter 7 established that the bulk of change took place in 1996-01, Figure 8.3 represents changes from 1995 to 2001 only. Given that the growth rate for the RoRsubsidiary base from 1995 to 2001 was 40 percent, Figure 8.3 shows that the host basegrew for only four countries more rapidly than the overall regional gtopped tNetherlands and Sweden.
GER
NETHSWE
UK
PORTAUS
BEL
LUXSPAINDEN
IT
IREFRFI
SWITZGREGRE
-2,00 -1,50 -1,00 -0,50 0,00 0,50 1,00 1,50 2,00
GERNETHSWE
UKPORTAUS
BELLUX
SPAINDEN
ITIREFR
FISWITZ
Grow th rate re lative to overall host base grow th
SubGrow
The UK, whose subsidiary base accounted for approximately one quarter of the regionaltotal, grew about thirty percent faster than the region as a whole. Since these were amongthe largest host countries to begin with, their higher growth rates carried the region. Thecountries with values between 0 and –1 are those which grew in absolute terms, butrelatively more slowly than the whole, and countries with values below –1 (Greece, Switzerland, Finland and France) experienced a decline in their overall host subsidiarybase. Thus it seems that inside-in openness was particularly favorable to the traditional
260
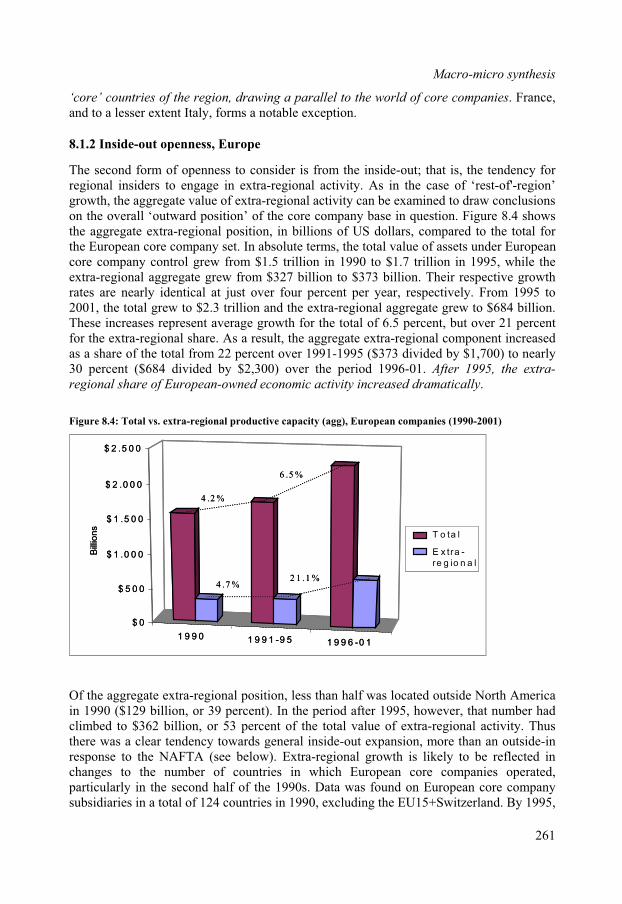
Macro-micro synthesis
‘core’ countries of the region, drawing a parallel to the world of core companies. France, and to a lesser extent Italy, forms a notable exception.
8.1.2 Inside-out openness, Europe
The second form of openness to consider is from the inside-out; that is, the tendency forregional insiders to engage in extra-regional activity. As in the case of ‘rest-of'-region’growth, the aggregate value of extra-regional activity can be examined to draw conclusionson the overall ‘outward position’ of the core company base in question. Figure 8.4 shows the aggregate extra-regional position, in billions of US dollars, compared to the total forthe European core company set. In absolute terms, the total value of assets under Europeancore company control grew from $1.5 trillion in 1990 to $1.7 trillion in 1995, while the extra-regional aggregate grew from $327 billion to $373 billion. Their respective growth rates are nearly identical at just over four percent per year, respectively. From 1995 to2001, the total grew to $2.3 trillion and the extra-regional aggregate grew to $684 billion. These increases represent average growth for the total of 6.5 percent, but over 21 percentfor the extra-regional share. As a result, the aggregate extra-regional component increasedas a share of the total from 22 percent over 1991-1995 ($373 divided by $1,700) to nearly30 percent ($684 divided by $2,300) over the period 1996-01. After 1995, the extra-
regional share of European-owned economic activity increased dramatically.
Figure 8.4: Total vs. extra-regional productive capacity (agg), European companies (1990-2001)
Of the aggregate extra-regional position, less than half was located outside North Americain 1990 ($129 billion, or 39 percent). In the period after 1995, however, that number had climbed to $362 billion, or 53 percent of the total value of extra-regional activity. Thus there was a clear tendency towards general inside-out expansion, more than an outside-inresponse to the NAFTA (see below). Extra-regional growth is likely to be reflected in
to the number of countries in which European core companies operated,articularly in the second half of the 1990s. Data was found on European core company
subsidiaries in a total of 124 countries in 1990, excluding the EU15+Switzerland. By 1995,
1 9 9 0 1 9 9 1 -9 5 1 9 9 6 -0 1
$ 0
$ 5 0 0
$ 1 .0 0 0
$ 2 .0 0 0
$ 2 .5 0 0
changesp
$ 1 .5 0 0
T o ta l
E x tra -re g io n a l
4 .2 %
4 .7 %2 1 .1 %
Bill
ions
6 .5 %
1 9 9 0 1 9 9 1 -9 5 1 9 9 6 -0 1
$ 0
$ 5 0 0
$ 1 .0 0 0
$ 2 .0 0 0
$ 2 .5 0 0
$ 1 .5 0 0
T o ta l
E x tra -re g io n a l
4 .2 %
4 .7 %2 1 .1 %
Bill
ions
6 .5 %
261
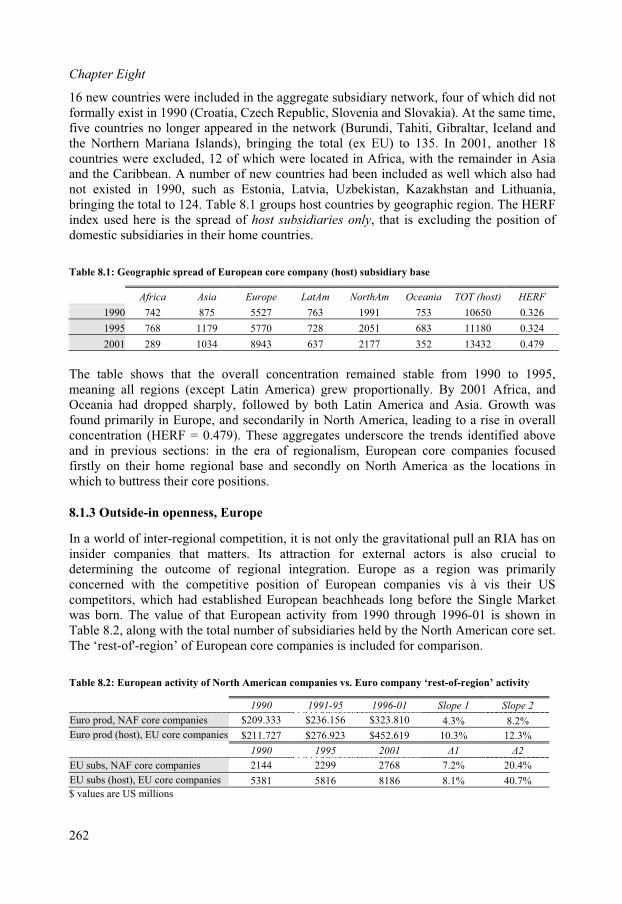
Chapter Eight
16 new countries were included in the aggregate subsidiary network, four of which did notformally exist in 1990 (Croatia, Czech Republic, Slovenia and Slovakia). At the same time,five countries no longer appeared in the network (Burundi, Tahiti, Gibraltar, Iceland and the Northern Mariana Islands), bringing the total (ex EU) to 135. In 2001, another 18 countries were excluded, 12 of which were located in Africa, with the remainder in Asiaand the Caribbean. A number of new countries had been included as well which also hadnot existed in 1990, such as Estonia, Latvia, Uzbekistan, Kazakhstan and Lithuania, bringing the total to 124. Table 8.1 groups host countries by geographic region. The HERFindex used here is the spread of host subsidiaries only, that is excluding the position of domestic subsidiaries in their home countries.
Table 8.1: Geographic spread of European core company (host) subsidiary base
Africa Asia Europe LatAm NorthAm Oceania TOT (host) HERF
1990 742 875 5527 763 1991 753 10650 0.326
1995 768 1179 5770 728 2051 683 11180 0.324
2001 289 1034 8943 637 2177 352 13432 0.479
The table shows that the overall concentration remained stable from 1990 to 1995,eaning all regions (except Latin America) grew proportionally. By 2001 Africa, and
Growth wasse in overall
concentration (HERF = 0.479). These aggregates underscore the trends identified above and in previous sections: in the era of regionalism, European core companies focused firstly on their home regional base and secondly on North America as the locations inwhich to buttress their core positions.
8.1.3 Outside-in openness, Europe
In a world of inter-regional competition, it is not only the gravitational pull an RIA has on insider companies that matters. Its attraction for external actors is also crucial todetermining the outcome of regional integration. Europe as a region was primarilyconcerned with the competitive position of European companies vis à vis their UScompetitors, which had established European beachheads long before the Single Market was born. The value of that European activity from 1990 through 1996-01 is shown inTable 8.2, along with the total number of subsidiaries held by the North American core set.The ‘rest-of'-region’ of European core companies is included for comparison.
mOceania had dropped sharply, followed by both Latin America and Asia.found primarily in Europe, and secondarily in North America, leading to a ri
Table 8.2: European activity of North American companies vs. Euro company ‘rest-of-region’ activity
1990 1991-95 1996-01 Slope 1 Slope 2
Euro prod, NAF core companies $209.333 $236.156 $323.810 4.3% 8.2%
Euro prod (host), EU core companies $211.727 $276.923 $452.619 10.3% 12.3%
1990 1995 2001 1 2
EU subs, NAF core companies 2144 2299 2768 7.2% 20.4%
EU subs (host), EU core companies 5381 5816 8186 8.1% 40.7%
$ values are US millions
262
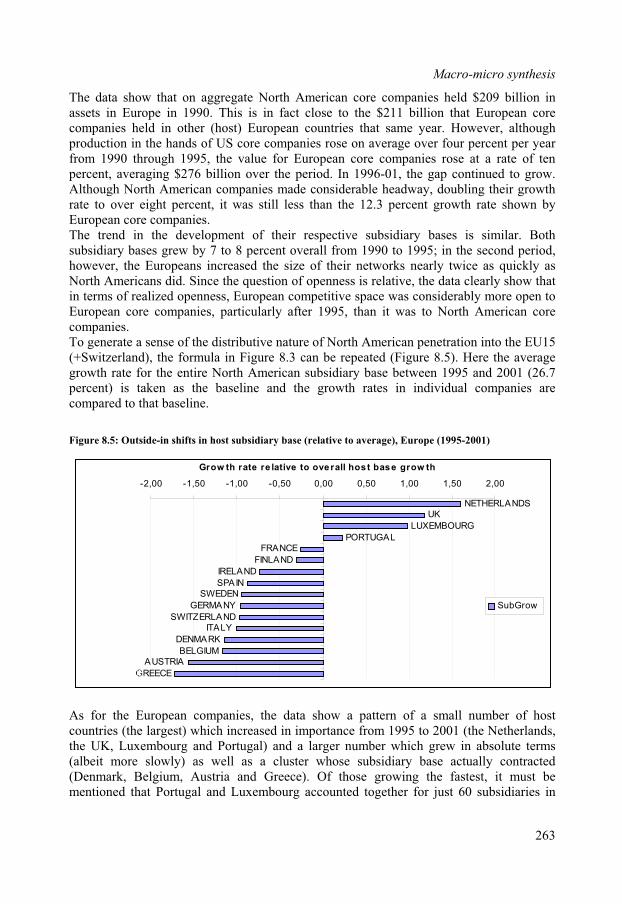
Macro-micro synthesis
The data show that on aggregate North American core companies held $209 billion in assets in Europe in 1990. This is in fact close to the $211 billion that European corecompanies held in other (host) European countries that same year. However, although
ompanies rose on average over four percent per year
panies are ompared to that baseline.
Figure 8.5: Outside-in shifts in host subsidiary base (relative to average), Europe (1995-2001)
production in the hands of US core cfrom 1990 through 1995, the value for European core companies rose at a rate of tenpercent, averaging $276 billion over the period. In 1996-01, the gap continued to grow. Although North American companies made considerable headway, doubling their growthrate to over eight percent, it was still less than the 12.3 percent growth rate shown byEuropean core companies.The trend in the development of their respective subsidiary bases is similar. Bothsubsidiary bases grew by 7 to 8 percent overall from 1990 to 1995; in the second period,however, the Europeans increased the size of their networks nearly twice as quickly as North Americans did. Since the question of openness is relative, the data clearly show thatin terms of realized openness, European competitive space was considerably more open toEuropean core companies, particularly after 1995, than it was to North American core companies.To generate a sense of the distributive nature of North American penetration into the EU15 (+Switzerland), the formula in Figure 8.3 can be repeated (Figure 8.5). Here the average growth rate for the entire North American subsidiary base between 1995 and 2001 (26.7percent) is taken as the baseline and the growth rates in individual comc
NETHERLANDSUK
LUXEMBOURG
PORTUGALFRANCE
FINLAND
IRELAND
SPAINSWEDEN
GERMANY
SWITZERLANDITALY
DENMARK
BELGIUMAUSTRIA
GREECEGREECE
-2,00 -1,50 -1,00 -0,50 0,00 0,50 1,00 1,50 2,00
NETHERLANDS
UKLUXEMBOURG
PORTUGAL
FRANCEFINLAND
IRELAND
SPAINSWEDEN
GERMANY
SWITZERLANDITALY
DENMARK
BELGIUMAUSTRIA
Grow th rate re lative to overall host base grow th
SubGrow
As for the European companies, the data show a pattern of a small number of hostcountries (the largest) which increased in importance from 1995 to 2001 (the Netherlands,the UK, Luxembourg and Portugal) and a larger number which grew in absolute terms(albeit more slowly) as well as a cluster whose subsidiary base actually contracted(Denmark, Belgium, Austria and Greece). Of those growing the fastest, it must bementioned that Portugal and Luxembourg accounted together for just 60 subsidiaries in
263
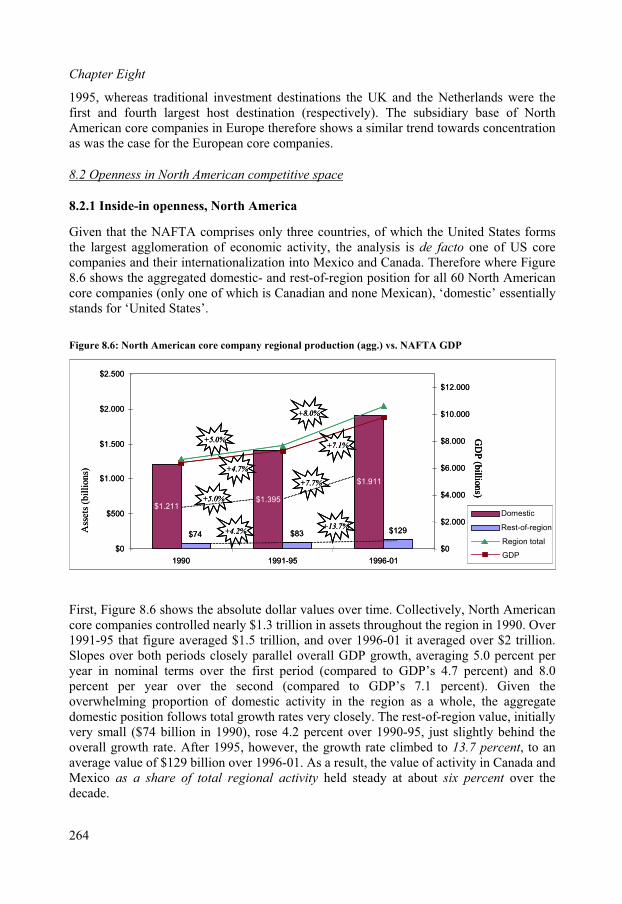
Chapter Eight
1995, whereas traditional investment destinations the UK and the Netherlands were the first and fourth largest host destination (respectively). The subsidiary base of NorthAmerican core companies in Europe therefore shows a similar trend towards concentrationas was the case for the European core companies.
8.2 Openness in North American competitive space
8.2.1 Inside-in openness, North America
Given that the NAFTA comprises only three countries, of which the United States formsthe largest agglomeration of economic activity, the analysis is de facto one of US core companies and their internationalization into Me
.6 shows the aggregated domestic- and rest-of-region position for all 60 North Amxico and Canada. Therefore where Figure
ericanestic’ essentially
Figure ort erican core company regional production NA GDP
ven theming proportion of domestic activity in the region as a whole, the aggregate
allyery small ($74 billion in 1990) 4.2 over 1990-95, just slightly behind the
1995 r, th perc anv 01. lt, of in C and
exico as a share of total regi ivit stead over the
8core companies (only one of which is Canadian and none Mexican), ‘domstands for ‘United States’.
8.6: N h Am (agg.) vs. FTA
$2.500
First, Figure 8.6 shows the absolute dollar values over time. Collectively, North Americancore companies controlled nearly $1.3 trillion in assets throughout the region in 1990. Over 1991-95 that figure averaged $1.5 trillion, and over 1996-01 it averaged over $2 trillion. Slopes over both periods closely parallel overall GDP growth, averaging 5.0 percent per year in nominal terms over the first period (compared to GDP’s 4.7 percent) and 8.0
ercent per year over the second (compared to GDP’s 7.1 percent). Gipoverwheldomestic position follows total growth rates very closely. The rest-of-region value, initiv , rose percentoverall growth rate. After , howeve the grow rate climbed to 13.7 ent, toaverage value of $129 billion o er 1996- As a resu the value activity anadaM onal act y held y at about six percent
decade.
$74
$0
$83 $129
$0
$2.000
$12.000
$1.911
$1.211$1.395
$500
$1.000
$1.500
$2.000
$4.000
$6.000
$8.000
$10.000
1990 1991-95 1996-01GDP
Domestic
Rest-of-region
Region total
GD
P (b
illion
s)
+4.7%
+7.1%
+5.0%
+7.7%
+4.2%+13.7%
+5.0%
+8.0%
sets
(b
illi
on
s)A
s
GDP
$2.500
$83 $129
$0
$2.000
$12.000
$1.911
$1.211$1.395
$500
$1.000
$1.500
$2.000
$4.000
$6.000
$8.000
$10.000
$74
$0
1990 1991-95 1996-01GDPGDP
Domestic
Rest-of-region
Region total
GD
P (b
illion
s)
+4.7%
+7.1%
+5.0%
+7.7%
+4.2%+13.7%
+5.0%
+8.0%
GD
P (b
illion
s)
+4.7%
+7.1%
+5.0%
+7.7%
+4.2%+13.7%
+5.0%
+8.0%
sets
(b
illi
on
s)A
s
GDP
264
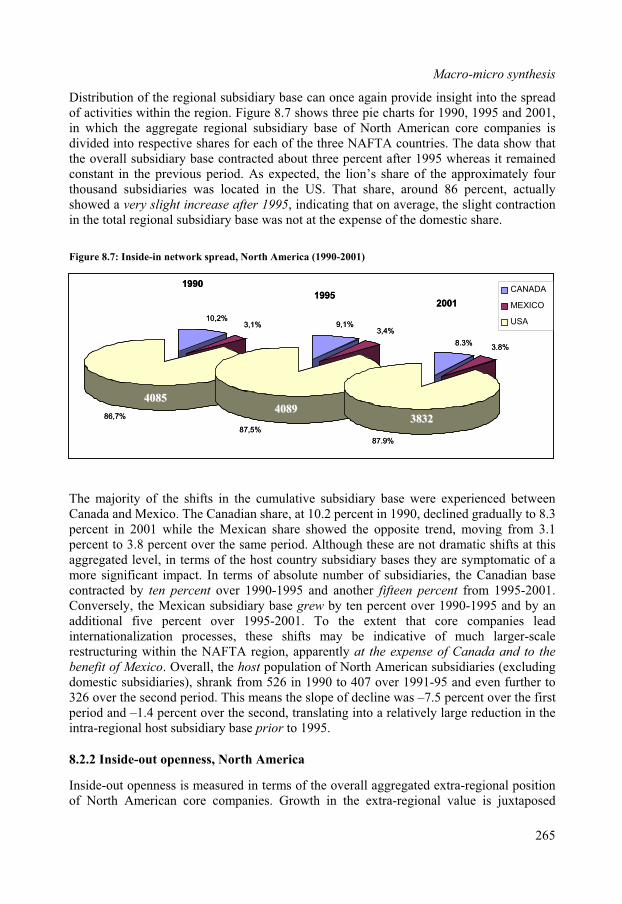
Macro-micro synthesis
Distribution of the regional subsi vide i into eade region. Figure 8.7 shows three pie charts for 1990, 1995 and 2001,
The majority of the shifts in the cumulative subsidiary base were experienced betweenCanada and Mexico. The Canadian share, at 10.2 percent in 1990, declined gradually to 8.3 percent in 2001 while the Mexican share showed the opposite trend, moving from 3.1 percent to 3.8 percent over the same period. Although these are not dramatic shifts at thisaggregated level, in terms of the host country subsidiary bases they are symptomatic of amore significant impact. In terms of absolute number of subsidiaries, the Canadian base contracted by ten percent over 1990-1995 and another fifteen percent from 1995-2001.Conversely, the Mexican subsidiary base grew by ten percent over 1990-1995 and by an additional five percent over 1995-2001. To the extent that core companies leadinternationalization processes, these shifts may be indicative of much larger-scalerestructuring within the NAFTA region, apparently at the expense of Canada and to the
benefit of Mexico. Overall, the host population of North American subsidiaries (excludingdomestic subsidiaries), shrank from 526 in 1990 to 407 over 1991-95 and even further to326 over the second period. This means the slope of decline was –7.5 percent over the firstperiod and –1.4 percent over the second, translating into a relatively large reduction in the
tra-regional host subsidiary base prior to 1995.
diary base can once again pro nsight the sprof activities within thin which the aggregate regional subsidiary base of North American core companies is divided into respective shares for each of the three NAFTA countries. The data show that the overall subsidiary base contracted about three percent after 1995 whereas it remainedconstant in the previous period. As expected, the lion’s share of the approximately four thousand subsidiaries was located in the US. That share, around 86 percent, actuallyshowed a very slight increase after 1995, indicating that on average, the slight contractionin the total regional subsidiary base was not at the expense of the domestic share.
Figure 8.7: Inside-in network spread, North America (1990-2001)
CANADA
MEXICO
USA
1990
10,2%3,1%
in
8.2.2 Inside-out openness, North America
Inside-out openness is measured in terms of the overall aggregated extra-regional positionof North American core companies. Growth in the extra-regional value is juxtaposed
86,7%
1995
9,1%3,4%
87,5%
2001
8.3%3.8%
4085408540894089
38323832
87.9%
CANADA
MEXICO
USA
CANADA
MEXICO
USA
1990
10,2%3,1%
1995
9,1%3,4%
87,5%
2001
8.3%3.8%
4085408540894089
3832383286,7%
87.9%
265
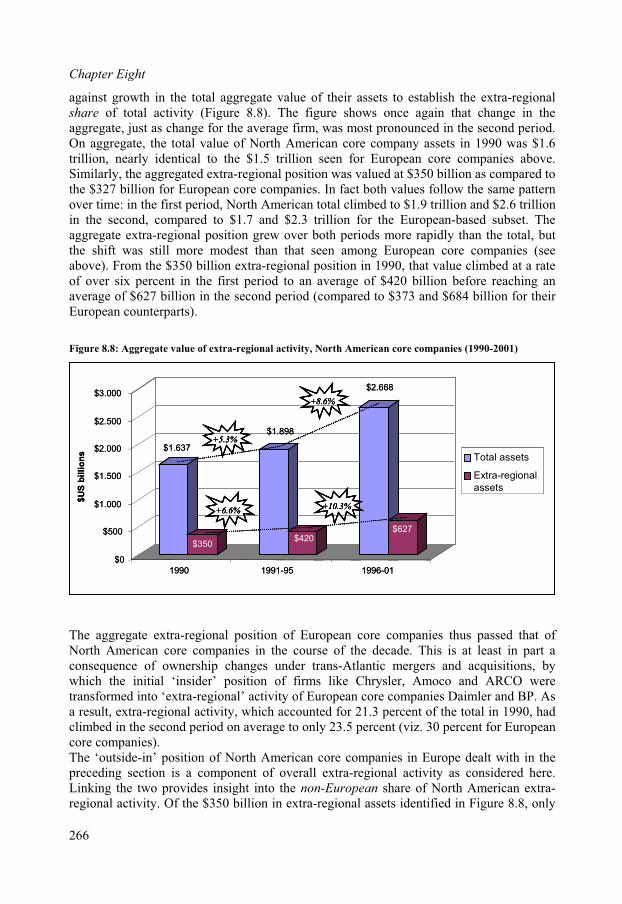
Chapter Eight
against growth in the total aggregate value of their assets to establish the extra-regionalshare of total activity (Figure 8.8). The figure shows once again that change in theaggregate, just as change for the average firm, was most pronounced in the second period.On aggregate, the total value of North American core company assets in 1990 was $1.6 trillion, nearly identical to the $1.5 trillion seen for European core companies above. Similarly, the aggregated extra-regional position was valued at $350 billion as compared to
act both values follow the same pattern over time: in the first period, North American total climbed to $1.9 trillion and $2.6 trillion
trillion for the European-based subset. The aggregate extra-regional position grew over both periods more rapidly than the total, but
igure 8.8: Aggregate value of extra-regional activity, North American core companies (1990-2001)
he aggregate extra-regional position of European core companies thus passed that of
the $327 billion for European core companies. In f
in the second, compared to $1.7 and $2.3
the shift was still more modest than that seen among European core companies (see above). From the $350 billion extra-regional position in 1990, that value climbed at a rateof over six percent in the first period to an average of $420 billion before reaching an average of $627 billion in the second period (compared to $373 and $684 billion for their European counterparts).
F
$1.637
$350
$1.898
$420
$2.668
$627
$0
$500
$1.000
$1.500
$2.000
$2.500
$3.000
$U
S b
illi
on
s
1990 1991-95 1996-01
+5.3%
+8.6%
+6.6%+10.3%
+5.3%
+8.6%
+6.6%+10.3%
Total assets
Extra-regionalassets
$1.637
$350
$1.898
$420
$2.668
$627
$0
$500
$1.000
$1.500
$2.000
$2.500
$3.000
$U
S b
illi
on
s
1990 1991-95 1996-01
+5.3%
+8.6%
+6.6%+10.3%
+5.3%
+8.6%
+6.6%+10.3%
Total assets
Extra-regionalassets
Total assets
Extra-regionalassets
TNorth American core companies in the course of the decade. This is at least in part a consequence of ownership changes under trans-Atlantic mergers and acquisitions, bywhich the initial ‘insider’ position of firms like Chrysler, Amoco and ARCO weretransformed into ‘extra-regional’ activity of European core companies Daimler and BP. As a result, extra-regional activity, which accounted for 21.3 percent of the total in 1990, hadclimbed in the second period on average to only 23.5 percent (viz. 30 percent for European core companies).The ‘outside-in’ position of North American core companies in Europe dealt with in thepreceding section is a component of overall extra-regional activity as considered here.Linking the two provides insight into the non-European share of North American extra-regional activity. Of the $350 billion in extra-regional assets identified in Figure 8.8, only
266
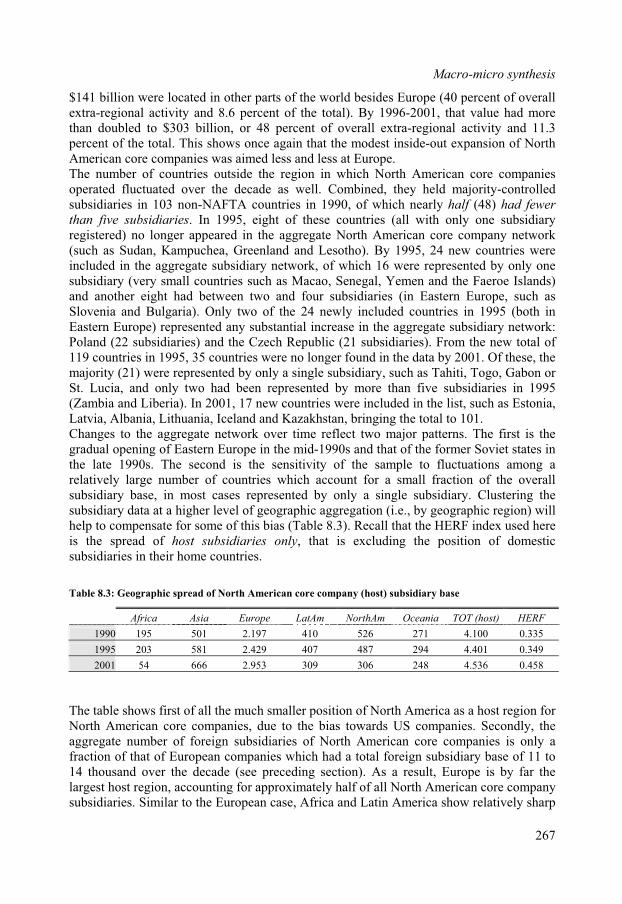
Macro-micro synthesis
$141 billion were located in other parts of the world besides Europe (40 percent of overallextra-regional activity and 8.6 percent of the total). By 1996-2001, that value had morethan doubled to $303 billion, or 48 percent of overall extra-regional activity and 11.3
y onebsidiary (very small countries such as Macao, Senegal, Yemen and the Faeroe Islands)
ries (in Eastern Europe, such as a and B cluded countries in 1995 (both in
Eastern Europe) represented any substantial increase in the aggregate subsidiary network:Poland (22 subsidiaries) and the Czech Republic (21 subsidiaries). From the new total of 119 countries in 1995, 35 countries were no longer found in the data by 2001. Of these, themajority (21) were represented by only a single subsidiary, such as Tahiti, Togo, Gabon or St. Lucia, and only two had been represented by more than five subsidiaries in 1995(Zambia and Liberia). In 2001, 17 new countries were included in the list, such as Estonia,Latvia, Albania, Lithuania, Iceland and Kazakhstan, bringing the total to 101.Changes to the aggregate network over time reflect two major patterns. The first is thegradual opening of Eastern Europe in the mid-1990s and that of the former Soviet states inthe late 1990s. The second is the sensitivity of the sample to fluctuations among a relatively large number of countries which account for a small fraction of the overall subsidiary base, in most cases represented by only a single subsidiary. Clustering the
bsidiary data at a higher level of geographic aggregation (i.e., by geographic region) willelp to compensate for some of this bias (Table 8.3). Recall that the HERF index used here
percent of the total. This shows once again that the modest inside-out expansion of NorthAmerican core companies was aimed less and less at Europe. The number of countries outside the region in which North American core companiesoperated fluctuated over the decade as well. Combined, they held majority-controlledsubsidiaries in 103 non-NAFTA countries in 1990, of which nearly half (48) had fewerthan five subsidiaries. In 1995, eight of these countries (all with only one subsidiaryregistered) no longer appeared in the aggregate North American core company network(such as Sudan, Kampuchea, Greenland and Lesotho). By 1995, 24 new countries were included in the aggregate subsidiary network, of which 16 were represented by onlsuand another eight had between two and four subsidiaSloveni ulgaria). Only two of the 24 newly in
suhis the spread of host subsidiaries only, that is excluding the position of domesticsubsidiaries in their home countries.
Table 8.3: Geographic spread of North American core company (host) subsidiary base
Africa Asia Europe LatAm NorthAm Oceania TOT (host) HERF
1990 195 501 2.197 410 526 271 4.100 0.335
1995 203 581 2.429 407 487 294 4.401 0.349
2001 54 666 2.953 309 306 248 4.536 0.458
The table shows first of all the much smaller position of North America as a host region forNorth American core companies, due to the bias towards US companies. Secondly, theaggregate number of foreign subsidiaries of North American core companies is only a fraction of that of European companies which had a total foreign subsidiary base of 11 to14 thousand over the decade (see preceding seclargest host region, accounting for approximately hal
tion). As a result, Europe is by far thef of all North American core company
subsidiaries. Similar to the European case, Africa and Latin America show relatively sharp
267
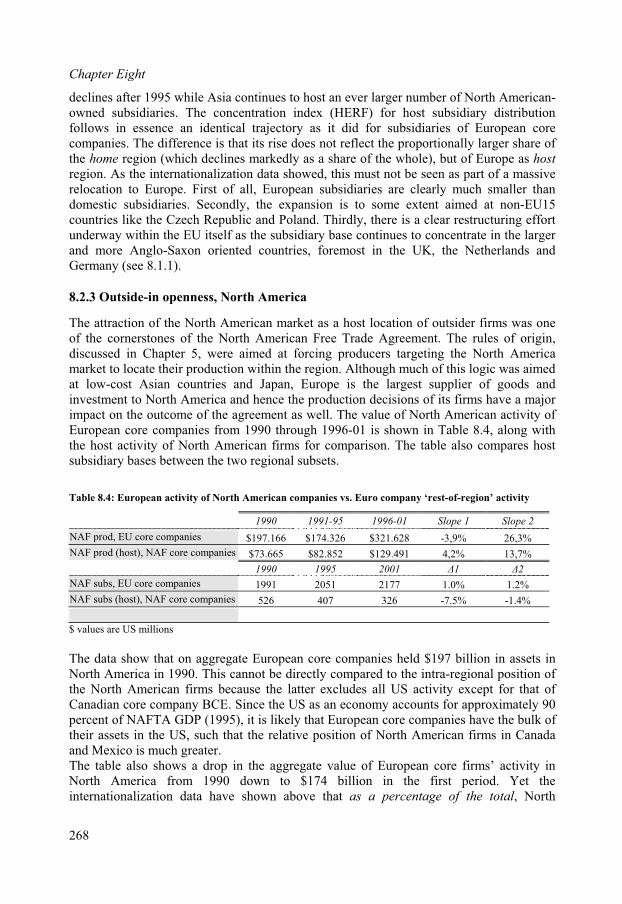
Chapter Eight
declines after 1995 while Asia continues to host an ever larger number of North American-
uction within the region. Although much of this logic was aimedt low-cost Asian countries and Japan, Europe is the largest supplier of goods and
investment to North America and hence the production decisions of its firms have a majorimpact on the outcome of the agreement as well. The value of North American activity ofEuropean core companies from 1990 through 1996-01 is shown in Table 8.4, along withthe host activity of North American firms for comparison. The table also compares host subsidiary bases between the two regional subsets.
Table 8.4: European activity of North American companies vs. Euro company ‘rest-of-region’ activity
1990 1991-95 1996-01 Slope 1 Slope 2
owned subsidiaries. The concentration index (HERF) for host subsidiary distributionfollows in essence an identical trajectory as it did for subsidiaries of European core companies. The difference is that its rise does not reflect the proportionally larger share ofthe home region (which declines markedly as a share of the whole), but of Europe as hostregion. As the internationalization data showed, this must not be seen as part of a massiverelocation to Europe. First of all, European subsidiaries are clearly much smaller thandomestic subsidiaries. Secondly, the expansion is to some extent aimed at non-EU15 countries like the Czech Republic and Poland. Thirdly, there is a clear restructuring effortunderway within the EU itself as the subsidiary base continues to concentrate in the largerand more Anglo-Saxon oriented countries, foremost in the UK, the Netherlands and Germany (see 8.1.1).
8.2.3 Outside-in openness, North America
The attraction of the North American market as a host location of outsider firms was oneof the cornerstones of the North American Free Trade Agreement. The rules of origin,discussed in Chapter 5, were aimed at forcing producers targeting the North Americamarket to locate their proda
NAF prod, EU core companies $197.166 $174.326 $321.628 -3,9% 26,3%
NAF prod (host), NAF core companies $73.665 $82.852 $129.491 4,2% 13,7%
1990 1995 2001 1 2
NAF subs, EU core companies 1991 2051 2177 1.0% 1.2%
NAF subs (host), NAF core companies 526 407 326 -7.5% -1.4%
$ values are US millions
The data show that on aggregate European core companies held $197 billion in assets in ion of
e North American firms because the latter excludes all US activity except for that of anadian core company BCE. Since the US as an economy accounts for approximately 90
North America in 1990. This cannot be directly compared to the intra-regional positthCpercent of NAFTA GDP (1995), it is likely that European core companies have the bulk of their assets in the US, such that the relative position of North American firms in Canadaand Mexico is much greater.The table also shows a drop in the aggregate value of European core firms’ activity inNorth America from 1990 down to $174 billion in the first period. Yet theinternationalization data have shown above that as a percentage of the total, North
268
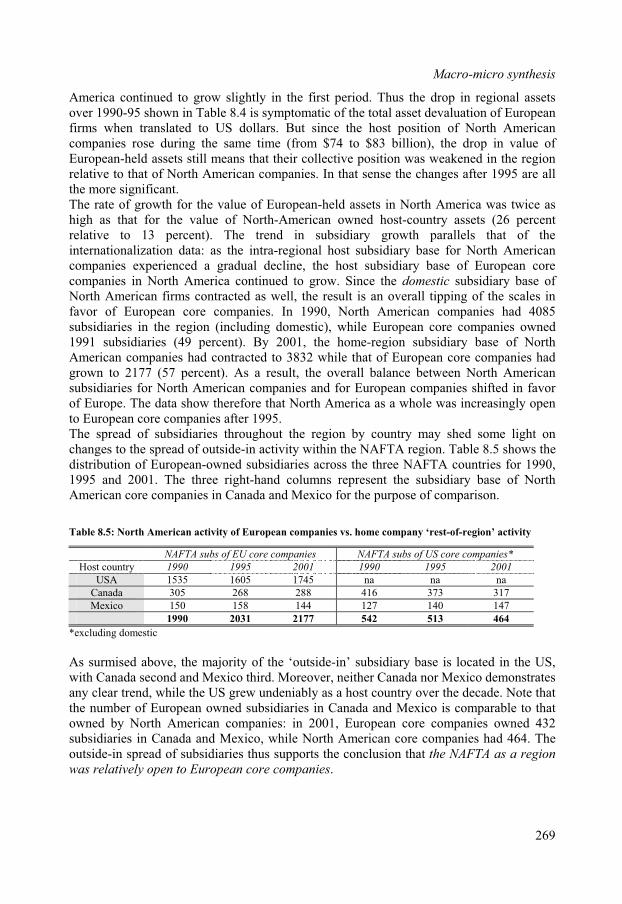
Macro-micro synthesis
America continued to grow slightly in the first period. Thus the drop in regional assetsover 1990-95 shown in Table 8.4 is symptomatic of the total asset devaluation of European
y base for North American
firms when translated to US dollars. But since the host position of North Americancompanies rose during the same time (from $74 to $83 billion), the drop in value of European-held assets still means that their collective position was weakened in the regionrelative to that of North American companies. In that sense the changes after 1995 are allthe more significant.The rate of growth for the value of European-held assets in North America was twice as high as that for the value of North-American owned host-country assets (26 percentrelative to 13 percent). The trend in subsidiary growth parallels that of theinternationalization data: as the intra-regional host subsidiarcompanies experienced a gradual decline, the host subsidiary base of European corecompanies in North America continued to grow. Since the domestic subsidiary base of North American firms contracted as well, the result is an overall tipping of the scales infavor of European core companies. In 1990, North American companies had 4085subsidiaries in the region (including domestic), while European core companies owned1991 subsidiaries (49 percent). By 2001, the home-region subsidiary base of NorthAmerican companies had contracted to 3832 while that of European core companies had grown to 2177 (57 percent). As a result, the overall balance between North Americansubsidiaries for North American companies and for European companies shifted in favor of Europe. The data show therefore that North America as a whole was increasingly open to European core companies after 1995.The spread of subsidiaries throughout the region by country may shed some light on changes to the spread of outside-in activity within the NAFTA region. Table 8.5 shows thedistribution of European-owned subsidiaries across the three NAFTA countries for 1990, 1995 and 2001. The three right-hand columns represent the subsidiary base of NorthAmerican core companies in Canada and Mexico for the purpose of comparison.
Table 8.5: North American activity of European companies vs. home company ‘rest-of-region’ activity
NAFTA subs of EU core companies NAFTA subs of US core companies*
Host country 1990 1995 2001 1990 1995 2001
USA 1535 1605 1745 na na na
Canada 305 268 288 416 373 317
Mexico 150 158 144 127 140 147
1990 2031 2177 542 513 464
*excluding domestic
As surmised above, the majority of the ‘outside-in’ subsidiary base is located in the US,ico demonstratesecade. Note that
e number rope ne iari a M s leowned by N n com s: in 1, E an co omp own 2subs es anada and Mex hile h Am n cor mpan d 46 eoutsi sp d of su iarie supp he co sion t e NA as a n
as relatively open to European core companies.
with Canada second and Mexico third. Moreover, neither Canada nor Mexany clear trend, while the US grew undeniably as a host country over the dth of Eu an ow d subsid es in C nada and exico i comparab to that
orth America panie 200 urope re c anies ed 43idiari in C ico, w Nort erica e co ies ha 4. Thde-in rea bsid s thus orts t nclu hat th FTA regio
w
269
Chapter Eight
8.3 Conclusions on the aggregate
The aggregate evidence strongly shows an opening up inside-in, both in absolute terms and more importantly, relative to the aggregate growth of the total activity controlled byEuropean core companies, particularly in the period after 1995. More striking, however, isthe role of extra-regional activity, which grew more rapidly than all other indicators.Moreover, North American core companies were clearly much less able to reinforce their European positions relative to European core companies although Europe was clearly afocus of growth. From this perspective, European competitive space can be characterized as most open from an inside-out perspective, then from an inside-in perspective, and onlythen from an outside-in perspective. In all likelihood the priority for European companieswas to establish a platform from which they could resist pressure from their (North American) competitors freeing up resources for their own extra-regional expansion.Aggregate home-region activity of North American and European core companies grewmore rapidly than GDP. Although assets and GDP are not directly comparable, this maypoint to a concentration of activity within the region and thus power in the hands of(larger) core companies. This balance is particularly evident at the level of aggregate assetsand also the even split in subsidiaries in Canada and Mexico between core companies fromboth regions. Europe tells a similar story but more one of subsidiaries than of aggregatevalue of activity. This is a reflection of the difference between micro- and macro-Fordism:
there are fewer of them, while in Europe thef them. That is the result of the gravitational
l picked up in the second period. Thisas described in section 7.4 at the firm level, where numerous firms experienced a process
s av ing
orth American operations can be consider ar r of ordi itsl hege e con ed in nal
xtra-regional expansion of Nor eric re com es was proportion lessheir Eur coun ts, but at the same time it was ely
or tside o rope as main h gion.gainst the apparent role of Euro as the main focus of growth the total North
bsidiary base, suggesting that the growing number of subsidiaries inurope was more part of a process of deeper embedding than a major organic expansion of
in North America, subsidiaries are larger andsubsidiaries are smaller and there are more opull of bargaining partners under macro-Fordism versus the centralization of power under micro-Fordism.In the 1990s, North America became increasingly inside-in open, but less so than Europe.
The inside-in position of North American core companies grew over the decade such that the aggregate rest-of-region position remained stable despite its much smaller overall value. In terms of the intra-regional subsidiary base, an overall process of consolidationtook place by which the increased value of output was spread over a shrinking subsidiary base. Within that contraction, there was a small but undeniable shift from Canada toMexico. Inside-out North America was also less open, particularly as the pace ofinternationalization among core companies in generawof relative de-internationalization. The inward orientation of NAFTA (in part adefensi e measure in response to the EU) and the direct-control strategy of integratN ed a cle eflection micro-F sm andinability to maintain globa mony. Th defensive position is solidat a regiohegemony.E th Am an co pani allypronounced than that for t opean terpar relativmore aimed at the rest of the w ld ou f Eu the ost re This runsa pe inAmerican-owned suEproductive capacity. Conversely, North America was increasingly inwardly open toEuropean core companies (outside-in from the European perspective). The value ofEuropean-owned assets in the region grew more rapidly than intra-regional host-country
270

Macro-micro synthesis
activity of North American core companies. Moreover, as the latter’s subsidiary base in theregion shrank, that of European core companies expanded. In Canada and Mexico, theirrespective aggregate subsidiary bases were more or less equal in size. From an outside-inperspective, North America became increasingly open to European firms and remained on
ually refers to openness to assets (investment) while underplaying
aggregate more of a destination for European firms than Europe did for North Americanfirms.Aggregating core company activity by region of origin allows for certain conclusions as tothe openness of European competitive space for European core companies and their North American counterparts. It must be recognized that aggregating company data allows for agreater sense of the overall (macro) impact of restructuring, but creates a major bias at the level of individual firm strategies. Since the largest firms in the sample are 20 to 30 timeslarger than the smallest firms, their role (and generally greater scale and scope ofinternationalization) distort the outcome. Therefore while the discussion centers onopenness to ‘firms’, it actindividual firm ownership of those assets. As a result the aggregated positions lead todifferent results than the strictly firm-based analysis in Chapter 7. This bias is an inherentelement of the ‘level of analysis problem’.
271

9. CONCLUSIONS
This study shows that core companies exhibited a wide range of strategic responses to theregionalizing institutional environment after 1995. Did core companies respond to regionalintegration in ways that policymakers expected? The short answer is that they did not,given the diversity they have shown in comparison to the relatively simple view of firmstrategy one can distill from government policy models. This study hinged on the assumption that integration is more than just a trade agreement between governmentofficials. The key actors in regional integration processes and outcomes are governmentsand firms, and integration is a phenomenon that involves the strategic visions and behaviorof both types of actors. The differences between the strategic considerations governmentsface (strategic realities) and their plans for action (strategic intents) and those of firmscreated the potential for unexpected outcomes.The answer to the second part of the leading research question of this study – what thisimplied for the nature, significance and viability of regional integration as a vehicle ofinternational restructuring – is more complex. Regionalism has clearly eclipsed themultilateral system as the ‘fast track’ for international economic restructuring. With trade and investment talks within the WTO all but dead after the debacle at Cancun, a new ‘regionalism’ push – the ‘Third Wave’ – is in the offing as Europe prepares to welcome tennew members in May 2004 and the US seeks to consolidate its hemispheric hegemony inLatin America with the Free Trade of the Americas (FTAA) initiative. These two regionshave emerged as the bi-polar core of the global economic system that not only govern a vast proportion of the world’s economic activity, but also serve as role models to othernascent or fledgling regions. Their development over the past ten years shows thatregionalism is very much alive. Moreover, the nascent ‘Third Wave’ of regionalism showsthat tensions continue to exist between political strategies and core company strategies. Forexample, Western European companies are once again threatening to relocate as EUgovernments issue caps on labor migration from the new members.The main conclusions will be grouped around the individual research questions posed in Chapter 1. Section 9.1 deals with the theoretical questions dealt with in Part 1 (Chapters 2 through 4). Section 9.2 focuses on synthesizing the empirical analyses and 9.3 discussesthe ramifications of the results in the context of the broader debates on the relationshipbetween regionalism and multilateralism, inter-regional competition and the crisis of post-Fordism. Section 9.4 introduces policy recommendations and Section 9.5 reviews thelimitations of the study and suggests directions for future research.
9.1 Macro- and micro- dimensions of international restructuring
The first question to be investigated involved the search for ‘missing links’ in theliterature:
1. How is regional integration addressed in the traditional literature?
In studying the mainstream literature on regional integration, three fundamental missinglinks came to light. First, a lack of attention for firm-level strategies with respect toregionalism; second, an overemphasis on intrinsic, efficiency-related arguments forintegration and a tendency to downplay extrinsic, power-related motivations; and third, a
273
Chapter Nine
general failure to compare and contrast the rationale of government policymakers’intentions with the actual restructuring behavior of firms. Yet regionalism does not arise ina vacuum. A wide spectrum of policy motivations lies at its foundations. Moreover, thesemotivations hinge either implicitly or explicitly on expectations of firm responses tointegration. The second research question addressed the way in which regionalism arises:
2. What is the nature and the outcome of dynamic firm-government interaction in
regional integration as a process of international restructuring?
Companies, as the primary agents of economic restructuring, are the main actors involvedin the actual economic restructuring in the wake of regional integration agreements (RIAs).Companies are not generic, however. Some companies lead restructuring processes through their size and financial muscle, their control of vital segments of the economy ortheir strategic positioning in (multiple) value chains. Perhaps more importantly, somecompanies have political vision as well as the access to political decision-makers by whichto manifest that vision. These ‘core companies’ straddle the political and economic divide,and form the linking pin between the macro-level reality of the policymaker and the micro-level reality of the firm.Core companies, through lobby activity as well as the media, are often the standard bearersof regionalism and its benefits to society. This last point is crucial because the significance of regionalism rests in no small part on the assumption of its benefit to the societies of thecountries it involves. Regionalism is ‘sold’ to the general public on the merits of arguments of societal gain for instance through dynamic growth, increased X-efficienciesand raised competitiveness. Most of these arguments, however, are based on highlyabstract macro-realities that characterize policy decisions and the policy models thatunderlie them.
9.1.1 The ‘muddled’ macro-world of policy strategy
The first step in the analysis was to investigate the policy-level strategies behindregionalism. The policy level was dealt with first based on the assumption that regionalismis most easily understood as a political process and an economic outcome. The third research question read as follows:
3. How can regional integration in its various forms be seen as a ‘strategic repertoire’ of
policymaking behavior, or typology of geopolitical ambitions?
A range of policy-level motivations for integration are described in the literature, such as domestic demand for reduced transaction costs (economic rationale); protectionism; a government strategy to pressure domestic stakeholders; an attempt to solve collectiveaction problems at the inter-state level; as a form of ‘defensible’ multilateralism; or a naked strategy to maximize national power.These visions are rooted in different notions of the relationship between actors at differentlevels: between states, between states and home companies, between states and host companies, and between states and civil society. Relationships are perceived as either harmonious or conflicting and governments, just as other actors, will try to manage their relationships and dependencies in such a way that they keep conflict at one or more levels
274
Conclusions
to a minimum. The policy ominimization strategies, played out through bargaining pro
utcome of regionalism represents the culmination of conflictcesses at multiple levels.
actors. Core companieso minimize conflict, suchs of relocation or other
her core companies (‘gentleman’s agreements’).r ore status to theirg e identified in this
The significance of regionalism is often juxtaposed against the background of the‘multilateral’ system. Governments can adopt different positions in the ‘multilateralismversus regionalism’ debate, of which ‘parallel regional multilateralism’ is the mostcommon. There are differences, however; while many European governments seeregionalism as complementary to multilateralism, the US government is generally morepragmatic, opting for regionalism, multilateralism or even bi-lateralism depending on thecircumstances.Regionalism itself also has different meanings. In political terms, integration is first andforemost a matter of the form of integration, such as a Free Trade Area (FTA) or a Customs Union (CU). Integration is also described in terms of the depth or intensity of cooperation, the degree of ‘legalization’ or the balance of power between members.Economically, an RIA is judged in terms of its relative openness to trade and investmentand thus whether it is trade- or investment- creating or diverting.In dealing with these macro-level and geopolitical considerations, explicit understanding of the role of firms is often lacking. The perceived necessity of sweeping conclusions in orderto ‘sell’ the agreement generates a reliance on highly abstract models in which theunderlying assumptions of firm behavior are not even always clear. In reality, however, restructuring outcomes are contingent upon the behavior of individual firms, and core companies in particular.
9.1.2 Getting the firm out of the black box
Firms are strategic actors, not black boxes. Regional integration is designed to affect thestrategies of firms, in particular with respect to their internationalization strategies andtheir organizational structures. The fourth research question dealt with the significance of regionalism for the strategies of core companies.
4. What is the significance of regional integration for the spatial configuration and
organizational structures of core companies?
As strategic actors for whom their core positioning is in itself a strategic motivator, corecompanies face potential conflicts at different levels: with their value chain partners, withgovernments at home and abroad, and with other core companies. The risk of conflictcreates a need for strategic response that involves not only intrinsic (efficiency- or cost-related) motives but also e.g. the reduction of conflict with certainhave various market- and non-market strategies they can apply tas increasing dependencies within their core complexes, threatactions that have direct negative impacts on governments, or even anti-competitivebehavior towards otCo e companies are a heterogeneous group. They tend to owe their cori ins within the bargaining arenas of their home countries, and thus arstudy based on their home country – and more importantly, home region – origins. Corecompanies are also affiliated with different sectors, in practice straddling several sectors at the same time. Core companies involved in the automotive industry, for instance, tend alsoto be involved in industrial machinery or aerospace. Core companies involved in consumer
275
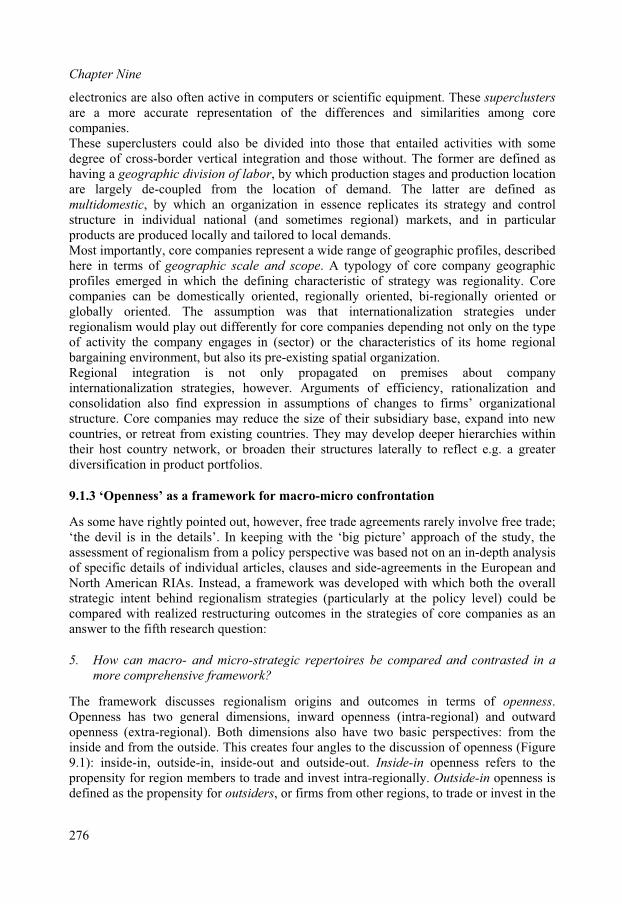
Chapter Nine
electronics are also often active in computers or scientific equipment. These superclusters
are a more accurate representation of the differences and similarities among corecompanies.These superclusters could also be divided into those that entailed activities with somedegree of cross-border vertical integration and those without. The former are defined as
mul trategy and control
engages in (sector) or the characteristics of its home regional
in product portfolios.
frontation
icles, clauses and side-agreements in the European andNorth American RIAs. Instead, a framework was developed with which both the overall
com core companies as an answer to the fifth research question:
ins and outcomes in terms of openness.
defined as the propensity for outsiders, or firms from other regions, to trade or invest in the
having a geographic division of labor, by which production stages and production locationare largely de-coupled from the location of demand. The latter are defined as
tidomestic, by which an organization in essence replicates its sstructure in individual national (and sometimes regional) markets, and in particularproducts are produced locally and tailored to local demands.Most importantly, core companies represent a wide range of geographic profiles, describedhere in terms of geographic scale and scope. A typology of core company geographicprofiles emerged in which the defining characteristic of strategy was regionality. Corecompanies can be domestically oriented, regionally oriented, bi-regionally oriented orglobally oriented. The assumption was that internationalization strategies underregionalism would play out differently for core companies depending not only on the typeof activity the companybargaining environment, but also its pre-existing spatial organization.Regional integration is not only propagated on premises about companyinternationalization strategies, however. Arguments of efficiency, rationalization andconsolidation also find expression in assumptions of changes to firms’ organizationalstructure. Core companies may reduce the size of their subsidiary base, expand into new countries, or retreat from existing countries. They may develop deeper hierarchies withintheir host country network, or broaden their structures laterally to reflect e.g. a greaterdiversification
9.1.3 ‘Openness’ as a framework for macro-micro con
As some have rightly pointed out, however, free trade agreements rarely involve free trade;‘the devil is in the details’. In keeping with the ‘big picture’ approach of the study, theassessment of regionalism from a policy perspective was based not on an in-depth analysisof specific details of individual art
strategic intent behind regionalism strategies (particularly at the policy level) could bepared with realized restructuring outcomes in the strategies of
5. How can macro- and micro-strategic repertoires be compared and contrasted in a
more comprehensive framework?
The framework discusses regionalism origOpenness has two general dimensions, inward openness (intra-regional) and outwardopenness (extra-regional). Both dimensions also have two basic perspectives: from theinside and from the outside. This creates four angles to the discussion of openness (Figure9.1): inside-in, outside-in, inside-out and outside-out. Inside-in openness refers to thepropensity for region members to trade and invest intra-regionally. Outside-in openness is
276
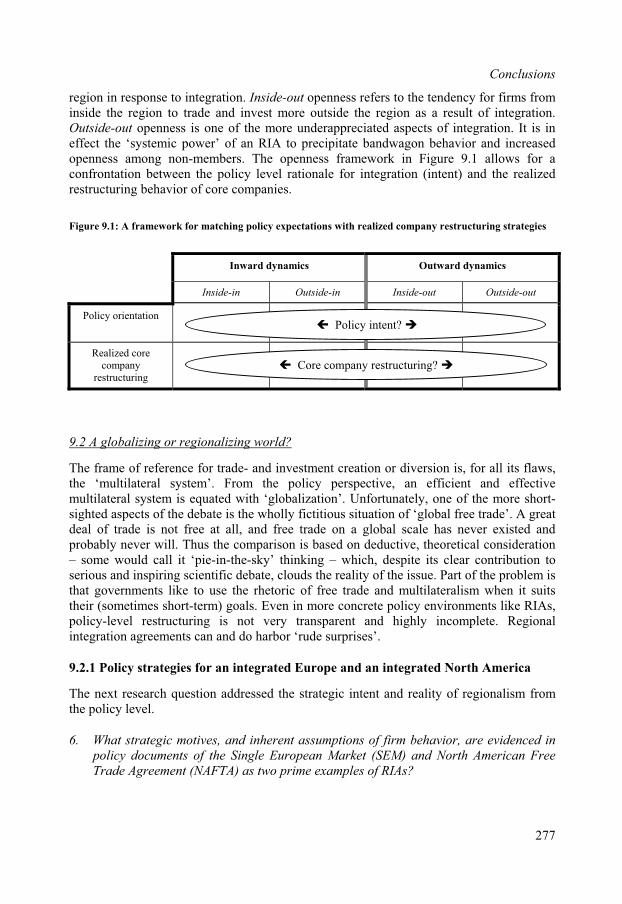
Conclusions
region in response to integration. Inside-out openness refers to the tendency for firms frominside the region to trade and invest more outside the region as a result of integration.Outside-out openness is one of the more underappreciated aspects of integration. It is ineffect the ‘systemic power’ of an RIA to precipitate bandwagon behavior and increasedopenness among non-members. The openness framework in Figure 9.1 allows for a confrontation between the policy level rationale for integration (intent) and the realizedrestructuring behavior of core companies.
1: A framewFigure 9. ork for matching policy expectations with realized company restructuring strategies
Inward dynamics Outward dynamics
Inside-in Outside-in Inside-out Outside-out
Policy orientation
Realized core company
restructuring
Policy intent?
Core company restructuring?
9.2 A globalizing or regionalizing world?
The frame of reference for trade- and investment creation or diversion is, for all its flaws,the ‘multilateral system’. From the policy perspective, an efficient and effectivemultilateral system is equated with ‘globalization’. Unfortunately, one of the more short-sighted aspects of the debate is the wholly fictitious situation of ‘global free trade’. A greatdeal of trade is not free at all, and free trade on a global scale has never existed andprobably never will. Thus the comparison is based on deductive, theoretical consideration– some would call it ‘pie-in-the-sky’ thinking – which, despite its clear contribution toserious and inspiring scientific debate, clouds the reality of the issue. Part of the problem is that governments like to use the rhetoric of free trade and multilateralism when it suits their (sometimes short-term) goals. Even in more concrete policy environments like RIAs,policy-level restructuring is not very transparent and highly incomplete. Regionalintegration agreements can and do harbor ‘rude surprises’.
9.2.1 Policy strategies for an integrated Europe and an integrated North America
The next research question addressed the strategic intent and reality of regionalism fromthe policy level.
6. What strategic motives, and inherent assumptions of firm behavior, are evidenced in
policy documents of the Single European Market (SEM) and North American Free
Trade Agreement (NAFTA) as two prime examples of RIAs?
277
Chapter Nine
A summary of the intended dynamics of regional integration in the SEM and the NAFTA is given below in Figure 9.2. The SEM was primarily an inward-looking solution toEurope’s perceived problems of ‘Eurosclerosis’, segmented markets and low productivity.
mpetition for those outsiders
By opening up national markets to firms from other European countries (increased inside-in openness), greater competition and scale would provide opportunities for growth andlead to industry consolidation. The ‘firm’ in European policy models was quite clearly oneforced to produce locally to circumvent tariff and other barriers which would naturallyretreat to export servicing given the opportunity. At the same time it was expected thatincreased competitiveness among European firms would raise barriers to new entrants from outside the region (outside-in) or at least create stiffer coalready active in Europe. The gains from inside-in openness should also enhance theexport competitiveness of European firms in extra-regional markets (inside-out) as well. In terms of outside-out openness, the European Union has always been more active instimulating liberalization through multilateral channels than through integration itself. Still, it was understood that the systemic power of the world’s leading RIA and fears of its exclusivity might lead to liberalization among outsider countries wishing to establish or maintain a preferential relationship with the EU.
Figure 9.2: The policy-level strategic intent behind the SEM and the NAFTA
Inward dynamics Outward dynamics
RIA Inside-in Outside-in Inside-out Outside-out
Single EuropeanMarket (SEM)
Concentration and consolidation: export replaces local production.
Raise entry barriers to outsiders through common external
Increased overall competitivenessshould lead to export
Not explicit in SEM;Multilateralism via WTO remained
Efficiency gains lead tariff and increased competitiveness of
competitiveness in extra-regional
active.
to virtuous cycles of growth and demand.
insider firms. markets.
North American Free Trade Agreement
(NAFTA)
Greater regional division of labor consistent withpatterns of comparativeadvantage.Rationalization of existing production.
Force outsiders to invest locally so that more of the gains from free trade and investment accrue to NAFTA countries. Insider firms still have ‘home court advantage’.
Not explicit in NAFTA; outwarddynamics governed by multilateralefforts at liberalization.
Force of integration to increase pace of liberalization in rest of world(Multilateralism).
The NAFTA was not only a shallower and less centralized integration effort, it was alsomo e ideologically driven. The inward dynamics were focused on the ability of (primarily
firms to establish regionally structr
US) ured production networks based on comparativeadvantage in which access to Mexico as an intermediate production location played the key role. Outside in openness was aimed at investment, not trade, by forcing outsider firms toinvest locally to meet rules of origin requirements. The need for local investment from theoutside was in part a way to avoid using the cheapest point of entry as an export platformto the rest of NAFTA, but also a way to keep the US current account balanced. Inside-outopenness in NAFTA played a subordinate and indirect role in combination with outside-out openness. The NAFTA was aimed at a consolidation of US hegemony in the region
278
Conclusions
through which leverage could be exercised upon other countries and regions as a strategyof ‘competitive liberalization’.The intended dynamics of the two regions can be related to analyses of realized structuring behavior to evaluate the match between policy strategy and core company strategy. Thisleads to the final research question:
7. What realized restructuring behavior do core companies exhibit in their spatial
configuration and organizational structures under the SEM and NAFTA, respectively?
trade and investment) to analyze the outcomes of regionalism; therefore the analysis includes data at this level. To ut of its ‘black bo light on‘muddled’ macro-reality, however, the restructuring behavior of ‘real’ core companies was also anal ed. Finally, c any acti tudied a egate le ndbri ween the macro and the micro. This complexity, and a desire to put them us ns ‘in the spotlight’ individually, necessitates a multi-stage response.
9.2. d w onalism and the bi-regional core
From maker’s perspective, macro-level data are traditionally used to understande outcomes of integration, despite the ‘muddled’ nature of such data. In terms of trade,
the SEM and the NAFTA are (increasingly) inward-oriented. By comparison, the otherthree RIAs evaluated in the study (Mercosur, ASEAN and SADC) are all many times more
In the case of the SEM its inward orientation has
he US is by far thelargest market and largest investor. Since Canada and Mexico are so much smaller, and
increased dramatically.
befoman more high-profile tradecases have involved the export of (US-owned) Central American bananas to Europe and
This question was considered at different levels. Policymakers tend to use macro-level data(
bring the firm o x’ and shed some
yz ore comp vity was s t the aggr vel to try adge the gap bet
ost salient concl io
2 The secon
the policy
ave of regi
th
outward-oriented in their export behavior.existed at least since the mid-1980s, while the NAFTA only became relatively inward-oriented in the late 1990s.As investors, the countries of the EU have turned slightly more inward in their orientation,with the growth in FDI stock increasingly aimed at other EU countries. The countries ofthe NAFTA region, however, are increasingly externally oriented as investors. But theinterpretation of increased inside-out openness in the case of the NAFTA must be madewith caution, since the US dominates regional investment and Canada and Mexico remainvery small investment targets compared to the rest of the (extra-regional) world. In relation to their respective GDPs, inward investment stock from the US in Canada and Mexico has climbed dramatically over the second half of the 1990s.The differences between the SEM and the NAFTA in this respect are in large partsymptomatic of their different regional makeup. The EU is comprised of more countries,whose economies are more evenly balanced, while in the NAFTA t
‘foreign’ in the region is defined by only three borders, it is not surprising that the bulk of investment growth should be found outside the region. This does not detract from the factthat intra-regional trade and investment, relative to the size of the Canadian and Mexicaneconomies, haveThe divergent strategies of North America and Europe are also evident in the multilateraldimension of their parallel regional multilateralism strategies, namely that of trade disputes
re the WTO. EU and NAFTA countries are by far the chief litigants, and in a good y disputes their cases are aimed at one another. Some of the
279
Chapter Nine
the export of European steel to the US. In the first few years of the WTO, many of thedisputes involving NAFTA countries were against other NAFTA countries. This has been less and less the case over time and as the North American RIA is consolidated, under theBush administration in the US the atmosphere of inter-regional conflict has only increased.In fact the recent unilateralist tendency in US policy in general, and the ‘twin deficit’-induced appreciation of the Euro, have been major factors in more recent Europeantendencies to ‘look inward’.If the veneer of multilateralism is peeled away, what remains are the origins of bothregions as a strategic response to one another, in which regional core companies played a central role. Even as the US continues to try and assert itself as the world’s only hegemon,the EU remains a force to be reckoned with. As geopolitical and geoeconomic forces, the EU and North America represent a formidable dyad, albeit one with a mix of harmoniousand adversarial interests. Core company internationalization outside the bi-regional core isin all likelihood an attempt to establish a foothold in ‘non-captive’ competitive spaces. These forces are creating a ‘chasm’ between these two regions, and an additional chasmbetween these regions and the rest of the world. The parallel regionalism–multilateralismstrategy has thus far amounted to ‘having the cake and eating it too’. Trade with the USnd Europe is far from free and far from a level playing field for other countries. More
o regions in the worldy ration of economic
power (du poly) on a global sc recently have other rld beenable to fi e strength in rs to start bargaining more , such as ngtogether of twenty two oun O n Cancun in 2003.One of the reasons re nt he Southern AfricanDev mu C) or t om ercosur) in LatinAm d to r er the playing field isnot level. Only for a v p with leverage does ‘going italone’ appear to rema a, India or the Russian Federation. For thebulk of th world’s seco i cilit ’between th ad of N a and o e ron
9.2.3 R sm, th e a ional chasm
The globalization debate has its micro-l terpart in the myth of the ‘global firm’. Ine 1990s, ‘going global’ was all the rage, even though being global was never very clearly
aimportantly, the increasingly central role played by these tweconom is only making the playing field less level, akin to a concent
o ale. Only very parts of the wond th numbe as equals the bandi
developing cgionalism amongnity (SADdeliver on the pery select grouin viable, such as Chin
tries at the WTdeveloping couhe Mercado Comise of prospof countries
negotiations iries such as tún del Sur (M
ity is becausesufficient
elopment Comerica has faile
e nations, theorth Americ
e ‘global’ hyp
nd wave of regEurope on the
nd the bi-reg
evel coun
onalism is fane hand, and th
ating a ‘chasmest of the worlde dy
the other.
egionali
thdefined. Its persistence is in part a result of its ambiguity. In reality, the pervasiveness ofthe ‘global firm’ rarely lives up to the hype. The analysis in Chapters 6 and 7 of the spatialorganization of the North American and European core companies clearly demonstratesthat ‘global’ is a predicate that (still) can only be reserved for only the select few.On average, core companies had more domestic activity than foreign activity. Even at thebeginning of the new millennium, the average degree of internationalization among the largest core firms was 36 percent and only a quarter of their activity was located outside the home region. The regional aspect was clearly at the core of the dynamic of core company restructuring but also the dynamics between core companies. Regionally orientedcompanies, for instance, were several times more likely than core companies with anyother geographic orientation to be acquired at the hands of other core companies. In most
280

Conclusions
cases, this also involved acquisitions by core companies from the same region.Consolidation was therefore also evident among firms and not just within firms.
onal growth was relatively more important. Morecritically, the pace of internationalization accelerated after 1995, and the acceleration was
suggsubsequent deepening of host-country networks afterwards.European and North American core companies in most cases did not primarily target each other’s region as the locus for expansion; in fact their ‘second region’ positions tended to decline over the decade (more so for US core companies). Sales in the second region, however, grew more rapidly than production in the second region. That suggests thatproduction is increasingly replacing sales in increasingly peripheral (extra-regional)locations. Such a gradual outward expansion of first sales followed by production, in effectincreasing the geographic scope of activity, is suggestive of a bi-polar core (North America
itantly, sales growth is
While these developments underscore the trend towards consolidation of a bi-regionalcore, it does not indicate that ‘bi-regionalism’ is the core company strategy of choice. Thisis because the relationship between the two regions in the bi-regional core is one of conflict, while a bi-regional strategy at the firm level is only possible if some degree ofharmonization is possible. The increased polarization between the two regions had as a result that of all strategy types, the bi-regional strategy appeared particularly ill-suited tothe second wave of regionalism.
Compared directly, extra-regional growth was greater than intra-regional growth.However, if the difference in size between the home region and the rest of the world istaken into consideration, intra-regi
intra-regional. Meanwhile the number of host countries increased prior to 1995, whichests shallow explorative internationalization prior to regional integration and a
and Europe) complemented by an extra-regional periphery. Concomsubstituting for production growth in the second region.
9.3 The political economy of regionalism
Integration in both regions has its similarities and core companies from both regionsdemonstrate to some extent comparable strategic migrations. But processes and outcomesin both regions can be contrasted as well. In evaluating the differences between Europeanand North American integration, the analysis also provides a stepping stone towardsbroader conclusions on the significance and viability of regionalism as a vehicle forinternational restructuring in general.
9.3.1 European integration versus North American integration
Policy strategies differed between Europe and North America in both the policy measuresand the expectations of firms. Figure 9.3 summarizes the macro-micro confrontation forthe SEM and the NAFTA, respectively. For each of the three dimensions of openness addressed in the study a conclusion is given as to the degree to which the strategic intent at the policy level matched realized restructuring outcomes at the firm level.Inside-in, European integration has led more to an intra-regional expansion of productionthan consolidation within home countries and export to the rest of Europe. In the meantimetheir North American competitors have shifted their focus away from Europe to someextent. Clearly, the intended reduction in outside-in openness has been successful. Overall,therefore, restructuring has led to a greater prominence of European core companies in the
281
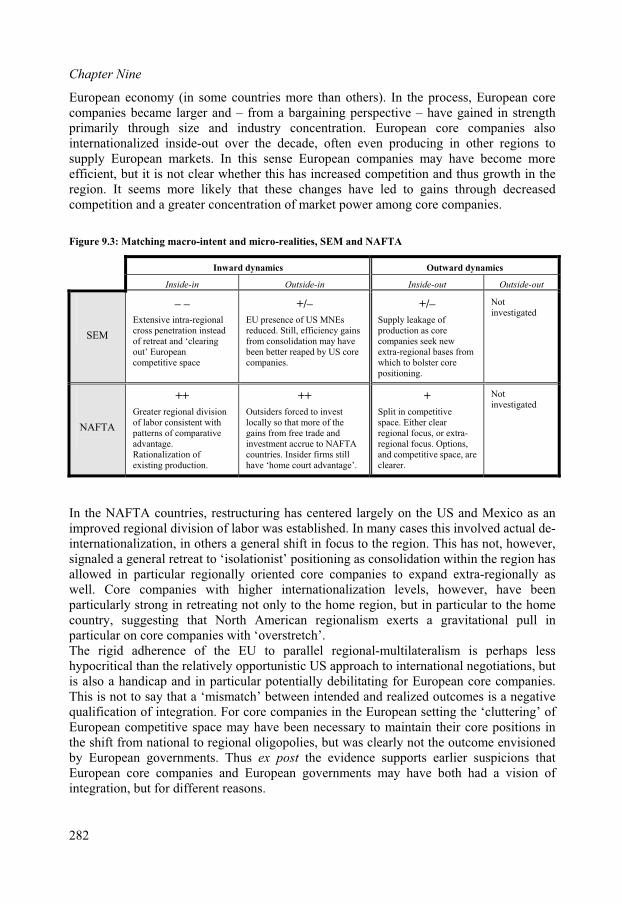
Chapter Nine
European economy (in some countries more than others). In the process, European corecompanies became larger and – from a bargaining perspective – have gained in strength primarily through size and industry concentration. European core companies alsointernationalized inside-out over the decade, often even producing in other regions to supply European markets. In this sense European companies may have become moreefficient, but it is not clear whether this has increased competition and thus growth in theregion. It seems more likely that these changes have led to gains through decreased competition and a greater concentration of market power among core companies.
Figure 9.3: Matching macro-intent and micro-realities, SEM and NAFTA
Inward dynamics Outward dynamics
Inside-in Outside-in Inside-out Outside-out
SEM
– –
Extensive intra-regional cross penetration instead of retreat and ‘clearingout’ Europeancompetitive space
+/–
EU presence of US MNEsreduced. Still, efficiency gains from consolidation may have been better reaped by US core companies.
+/–
Supply leakage of production as core companies seek newextra-regional bases fromwhich to bolster core positioning.
Notinvestigated
NAFTA
++
Greater regional division of labor consistent withpatterns of comparative
++
Outsiders forced to invest locally so that more of the gains from free trade and
+
Split in competitivespace. Either clear regional focus, or extra-
Notinvestigated
advantage.Rationalization of existing production.
investment accrue to NAFTAcountries. Insider firms still have ‘home court advantage’.
regional focus. Options,and competitive space, are clearer.
In the NAFTA countries, restructuring has centered largely on the US and Mexico as animproved regional division of labor was established. In many cases this involved actual de-internationalization, in others a general shift in focus to the region. This has not, however, signaled a general retreat to ‘isolationist’ positioning as consolidation within the region has allowed in particular regionally oriented core companies to expand extra-regionally as well. Core companies with higher internationalization levels, however, have beenparticularly strong in retreating not only to the home region, but in particular to the homecountry, suggesting that North American regionalism exerts a gravitational pull inparticular on core companies with ‘overstretch’.The rigid adherence of the EU to parallel regional-multilateralism is perhaps lesshypocritical than the relatively opportunistic US approach to international negotiations, butis also a handicap and in particular potentially debilitating for European core companies.This is not to say that a ‘mismatch’ between intended and realized outcomes is a negativequalification of integration. For core companies in the European setting the ‘cluttering’ ofEuropean competitive space may have been necessary to maintain their core positions in the shift from national to regional oligopolies, but was clearly not the outcome envisionedby European governments. Thus ex post the evidence supports earlier suspicions thatEuropean core companies and European governments may have both had a vision ofintegration, but for different reasons.
282
Conclusions
Integration in North America has arguably been more ‘brazen’, and subject to significantly lower levels of strategic ‘disconnect’ between (US) core companies and (the US)
atively coherent group of
threats made prior to the Single
ism outcomes and the characteristics of European and links the analysis to the power struggle between
f post-Fordist crisis. It can be argued that the
ean core company subsidiary networks have grown,particularly intra-regionally, which suggests a greater degree of interpenetration, but not
s purported to entail.
government, which has in turn made it less hypocritical. This had in part to do with the pluralist character of the EU versus the hegemonial character of the NAFTA. In the case of the EU, a greater number of countries took part in policy formulation, each with potentially divergent interests despite the shared vision of regional integration (as an abstraction).Moreover, each country in Europe is home to its own base of core companies, with theirpotentially divergent interests with respect to e.g. nationally segmented markets. TheNAFTA, on the other hand, revolves around the interests of a relUS-based core companies. The NAFTA also has less of a ‘human face’; despite the pro-NAFTA public relations campaign in the early 1990s, the agreement is still seen by mostas a ‘gift’ to US core companies and not a tool for socioeconomic improvement.European governments continue to carry the ‘burden’ of social policies that in the eyes of many European core companies were largely the reason for integration in the first place. As the European Union prepares to expand east in May 2004, why have nearly all EU member governments agreed to caps on labor migration from Central and Eastern Europe?To protect the welfare state. To this European core companies say ‘if they can’t come here, we’ll go there’, which sounds eerily reminiscent of theEuropean Act in 1986. This may be the legacy of European bargaining environments;European core companies may be less able to be honest in their interactions withpolicymakers. The cost of Europe’s social face may be disjointed communication between business and government that leads to ‘muddled’ outcomes.
9.3.2 The crisis of post-Fordism
The relationship between regionalNorth American bargaining environmentsthe EU and NAFTA in the context oefficiency motives behind integration, in the form of e.g. a smaller subsidiary base, are more easily realized in a micro-Fordist environment. The evidence shows that the typicallymacro-Fordist environment of European core companies is characterized by a much larger subsidiary base, reflecting the ‘stickiness’ of the European bargaining environment. Thatstickiness is a major component of the problem of ‘Eurosclerosis’ which the SEM was intended to combat. Over time, Europ
necessarily the consolidation and efficiency gain which the SEM waFrom the perspective of the ‘selling points’ of integration, North America has come closer.Despite popular opposition to the agreement, the NAFTA seems to be a success (from theperspective of its proponents). Intra-regional activity has grown dramatically, both in termsof general trade and core company restructuring. Subsidiary bases have been streamlined,reducing the ‘drag’ which cumbersome networks create and which are symptomatic of business activity in Europe. The NAFTA has been a boon mostly to vertically integratedcore companies with a solid regional position (such as General Motors, Ford and Chrysler)with an increased regional division of labor, which also explains why the NAFTA becameinwardly oriented in trade in the late 1990s. The NAFTA has served as the motor behindthe establishment of a regional base within which to bolster the waning micro-Fordistconcept of control and thus reestablish American hegemony. This is also evident in the
283
Chapter Nine
greater tendency of the more highly internationalized North American core companies toretreat over the 1990s. As the gravitational forces of both regions increase, the ‘chasm’makes in particular the direct control strategies of North American bi-regional companiesless tenable as strategic vision becomes too incoherent and overall coordination isdisrupted.
9.3.3 The viability of regionalism
orth American integration may be more successful in that its outcomes better reflectNst
itsrategic origins. Economic logic, and even the superficial evidence of prosperity over the
y. But it remains unclear ifthis h s led to more equal justice’ in terms of the w een richand poor, or between M xion th other. That ains hotly debat h in society and among the experte.g. t e debate betw Mexican and US economists in Fo Policy, r /Octo r 20Ad all re s of integration likethe NAFTA er for U s due to theperception tegrati primarily corpo oiling the wheelsof commerce without a clear sense among the general public that they will themselvesbene from any ns that might de from integration (despite hi itygovernment e io with not only de-re tion incre at other levels(positive integration). In this w rp bound to someextent by th rnme io aining power
to maneuver for the sake of the region as a whole.tegration agreements such as the NAFTA and its potential successor the FTAA are
second half of the 1990s, would suggest this is a gain to societa ity and ‘social
co and Canada on telfare gap betw
onaleissue rem
he one hand and ted bot
he US as regi hegemons (see e
h een trade reign Septembebe 02).
y, society seems tothan to deep
that shallow in
dition act more skeptically toms like the Europeanon serves
hallower formsnion. This is perhaprate interests by
fit gai rive gh-intenscampaigns to that
(negative integra
e fact that gove
ffect). Deeper integrat), but also withay the public sees conts also make concess
n is associatedased regulationorate interests asns in their own barg
gulation
and roomInunlikely to serve as permanent alternatives to a true multilateral order (i.e., one notdominated by a relatively small number of large and powerful Western ‘core’ countries).Regionalism is also a form of ‘defensible multilateralism’ for firms, which are themselvesprimarily regional in nature and of whom only a select few have the geographic scope toexercise true global systemic power. A parallel regional-multilateral strategy will onlysucceed as a sustainable, viable strategy in the long term if the two strategies are convergent in their objectives. Similarly, parallel regional-multilateralism will fail unless countries pursuing that strategy (the US and EU members foremost among them) do notmake more of an effort to level the playing field for other countries via the multilateralsystem. The EU and the NAFTA have a role model function to fulfill; in that sense theirattitudes towards sustainable, equitable open regionalism will be crucial to fosteringsimilar integration elsewhere as ‘building blocs’ of a sustainable, equitable multilateralsystem.
9.4 Policy recommendations
The observations and conclusions of this study lead to a number of policyrecommendations. First and foremost, the need to understand the ‘big picture’ at the macrolevel should not come at the expense of the micro level. It is important to recognize thatthere are different kinds of firms, whose strategies are shaped by concerns that cannot be
284
Conclusions
reduced to simple efficiency-related or welfare-enhancing motives or even to the level of sectoral dynamics. Core companies need more attention, not just in the lobby arena, butalso as the leading economic actors which largely determine restructuring outcomes,directly and indirectly. Moreover, the fact that firms express a ‘shared strategic vision’similar to that of policymakers does not mean they hold that vision for the same reasons.Fiat did not support market integration because they were hoping for more competition inthe Italian car market and the inevitable loss of market share; Fiat (and many others)supported integration hoping to rationalize their supply chains and gain from increasedcompetition between, and scale opportunities for, their suppliers; in addition, the companyhoped to keep foreign competitors – in particular Japanese car producers – out of its hometurf through European policies rather than through national policies. Other core companiesadopted a pro-Europe stance on the basis of simple ‘herding’ behavior, i.e. following the
conflict even if an agreementis reached.
ariables tend to be the mainstay of policy analysis. This
competition in order not to be left behind.These are legitimate strategic considerations, albeit ones based on extrinsic motives andthe preservation of core positioning. These dimensions are lacking in policy models, whichtend to be a poor estimate of core company behavior because e.g. price signals are notalways transmitted effectively and also because price signals, production frontiers, marketstructure and elasticities are certainly not the only factors core positioning is based upon.In addition to the real-world shroud of uncertainty surrounding such variables, corecompanies (and governments for that matter) are also unlikely to reveal their cards fully inany up-front bargaining processes. Bargaining is a complex process for which it should be assumed, or at least considered, that interests will continue to
Still, ‘tidy’ models based on such vis not to say they are not useful, because such models do establish parameters within whichoutcomes are likely to play out. But in isolation they create the risk of self-fulfilling prophecy when ‘businessmen parrot economic theory’ based on the ‘bright side’ ofexpected firm behavior. This applies particularly to smaller, non-core players that are notin an adequate position to know what the stakes of integration are. The result may be a shift in (market-, bargaining) power towards core companies and away from other smallerstakeholders. International restructuring is, after all, a ‘small numbers game’ in which therules are set at least as much on the basis of extrinsic, strategic considerations as on thebasis of intrinsic, economically rational ones. The firm is not a black box. If the variation among firms is taken beyond strict sectorallines firm-level responses can be analyzed perhaps less rigorously, but more accurately. Moreover, the baseline needs to be taken into account. What is the firm’s pre-existingspatial organization strategy? Is its strategy based on a cross-border division of labor, or on (semi)autonomous multidomestic bases? What strategic considerations emerge on the basis of that ‘strategic reality’ and how do they translate into ‘strategic intent’ with respect toregional integration? These are feedback loops of strategic positioning and migration that set the stage for future core company restructuring. Restructuring can be thought of at different levels. In this study the consequences ofrestructuring were considered in terms of ‘openness’, which itself has different dimensions.Regional integration is not only a matter of changing ‘inside-in’ openness (and indirectlyoutside-in); it has ramifications for restructuring from the inside-out as well as outside-out.Considering the impact of restructuring on openness means understanding not only thestrategic reality and intent of core companies, but also the positioning strategy of the
285

Chapter Nine
government itself and thus how institution-building at the regional level is intended to fit into the wider multilateral world.Making regionalism a viable strategy within multilateralism requires more effort to ‘levelthe playing field’ with respect to in particular developing countries. If the inherentdifficulties developing countries incur in accessing regional markets and the externally imposed barriers to climbing the value-added ladder are institutionalized through regional
will never be a multilateral building ‘bloc’. In doingintegration agreements, regionalismso Europe and the NAFTA, as the world’s flagship regions, will deliver the ‘wrong’ message to developing countries and reinforce their suspicions of inequity. The specter ofmultilateral collapse in this context has been seen at WTO meetings in Seattle, Doha andCancun, and the risks are high.Assuming democracy works, governments will be held accountable for the policydecisions they take. Regionalism may be actively ‘sold’ on the wrong premises, it maylead to unexpected outcomes or it may simply fail to deliver what was promised. In eachcase, governments, policy think tanks or academia may present the ‘muddy’ macro-realityof regionalism as ‘proof’ of the positive outcomes. A ‘match’ between macro intentionsand micro realities is not necessarily positive if integration was portrayed differently and civil society perceives that match as a ‘conspiracy’ between government and ‘bigbusiness’. The NAFTA ‘gone wrong’ as a theme in the 2004 Democratic campaign for theUS presidency is demonstrative of the lack of social embeddedness of integration in NorthAmerica; in Canada and Mexico these feelings are even stronger.
9.5 Limitations and directions for future research
This study has contributed to an improved view of the dynamic process of regionalinstitution-building as a vehicle for international company restructuring by focusing on the
ame time core company positioning- and internationalization strategies have been explicated as consisting of vertical- and horizontal positioning within the value chain, thescale and scope of internationalization, and the level of cross-border coordination.
potential tension between governments and core companies. By emphasizing the feedbackloops between strategic reality, strategic intent and realized restructuring strategies, the stage is set for a small numbers’ game of perception and misperception. Governments andfirms do not share the same strategic intent and strategic reality, and thus macro (policy)intentions do not always play out as micro (company strategy) realities.The existing bias towards intrinsic (rational, economic efficiency oriented) motivations inthe literature on regional integration has been complemented with extrinsic (power-based)motives that center on power relationships between stakeholders. These extrinsic issues translate into strategies by which core companies and governments try to manage conflictat multiple levels to preserve their position within the international ‘oligopolistic’ structures in which they operate and compete. In analyzing these issues, the study has explicated government positioning- and internationalization strategies as dimensions of unilateralism, regionalism and multilateralism.At the s
Moreover, the study contributes organizational and network spread dimensions to give thediscussion on core company strategies more depth. This has generated an appealingtypology of strategy that not only allows for the identification of existing strategy (static),but also allows for strategy ‘migration’ over time.
286
Conclusions
The ‘openness’ framework presented here provides a convincing means to analyzestrategic intent and realized restructuring at both the macro- and the micro level. Thisframework forms not only a bridge between levels of analysis but also, through its‘inward’ and two ‘outward’ dimensions, the link between regionalism and multilateralism.In doing so the study unravels the tangled traditional macro-understanding of regionalismand international restructuring more generally. Finally, the study provides conclusiveevidence that globalization, despite its ‘mass appeal’, is reserved only for the ‘happy’ few.These contributions still leave plenty of room for future research. For instance, noperformance indicators have been taken into account to identify whether regionalismseems to have led to higher profits or larger market shares. It has also for example not yetbeen established whether European core companies have actually become morecompetitive or whether the creation of a European competitive space has amounted to regional protectionism.Future research is also needed to supplement the analysis of openness with the ‘outside-out’ dimension. For instance, the internationalization strategies of Japanese corecompanies over the same period would shed considerable light on the impact ofregionalism on outsiders. Although others have contributed work on Japaneseinternationalization in Europe in anticipation of ‘Fortress Europe’ after 1992 and on theircapitalization of gains through NAFTA, research is needed to investigate theirrestructuring strategies in particular in Asia, and thus their efforts to secure their valuechains outside of existing RIAs.In trying to bridge the gap between the macro and the micro, the study risks criticism foraddressing neither level with complete adequacy. It was, however, deemed more important
s, core companies in services would be a
egists has many risks, foremost among
to ‘set the stage’ of debate through this study and leave room for more in-depth research inthe future, for instance at the case level of individual firms as well as investigating in muchmore detail changes to backward- and forward linkages at the empirical level. The sameapplies to horizontal linkages between core companies, through e.g. joint ventures or cooperation agreements.A much larger sample of firms would also allow for the possibility of statistical relationships between e.g. asset distribution and FDI stocks. Macro, for that matter, clearlyrepresents a wider range of sectors than those identified in this study; services, forinstance, represent a larger share of value added than manufacturing. Although their corepositioning is derived from different variablewelcome addition.Similarly, the study might be criticized for not identifying an explicit ‘RIA effect’. Thiscan be countered on the basis of three arguments. Firstly, a major assumption of the studyis that economic (or political) actors are not fully rational actors and thus do not respond to ‘exogenous’ policy as a behavioral ‘switch’. Secondly, the study explicitly takes a holisticapproach by which no effort is made to isolate a region which is only one part of the worldeconomy, or only one part of a firm’s strategy, and that is inextricably intertwined with therest. Thirdly, the option of interviews with firm stratthem the potential for ‘PR spin’ given the ten to fifteen years of hindsight and the fact thatmany of the individuals from the relevant time period (late 1980s – early 1990s) would bedifficult to trace. Additionally, given the conscious choice to build a bridge between the macro and the micro, in-depth case studies would likely have been too specific and too far removed from the broader context. Clearly, however, it would be worthwhile to use thisstudy as a backdrop for future interviews with policymakers and with core companies.
287


APPENDICES
Appendix I: The SCOPE Core200
ID # Company name Country ID # Company name Country
1 Mitsubishi Corporation Japan 57 Samsung Corporation South Korea
2 Mitsui & Co., Ltd. Japan 58 Kmart Corporation United States
3 Itochu Corporation Japan 59 ABB Asea Brown Boveri Ltd Switzerland
4 General Motors Corporation United States 60 The Procter & Gamble Company United States
5 Sumitomo Corporation Japan 61 The Daiei, Inc. Japan
6 Marubeni Corporation Japan 62 Peugeot S. A. France
7 Ford Motor Company United States 63 Vivendi France
8 Toyota Motor Corporation Japan 64 BASF A.G. Germany
9 Exxon Corporation United States 65 Bayerische Motoren Werke AG Germany
10 Royal Dutch/Shell Group** Netherlands 66 Alcatel S.A.* France
11 Nissho Iwai Corporation Japan 67 Chevron Corporation United States
12 Wal-Mart Stores, Inc. United States 68 Hewlett-Packard Company United States
13 Hitachi, Ltd. Japan 69 Mitsubishi Heavy Industries, Ltd. Japan
14 Nippon Telegraph & Telephone Corp. Japan 70 Bayer AG Germany
15 AT&T Corp. United States 71 Nippon Steel Corporation Japan
16 Daimler Benz A.G. Germany 72 PepsiCo, Inc. United States
17 International Business Machines Corp. United States 73 Ito-Yokado Co., Ltd. Japan
18 Matsushita Electric Industrial Co., Ltd. Japan 74 France Télécom SA France
19 General Electric Company (GE) United States 75 VIAG Aktiengesellschaft* Germany
20 Tomen Corporation Japan 76 Carrefour France
21 Mobil Corporation* United States 77 Thyssen Krupp AG Germany
22 Nissan Motor Co., Ltd. Japan 78 Amoco Corporation* United States
23 Volkswagen AG Germany 79 Total Fina S.A. France
24 Siemens AG Germany 80 Motorola, Inc. United States
25 BP (Amoco) UK 81 The Kansai Electric Power Co., Inc. Japan
26 Metro AG Switz/Ger 82 Petroleos de Venezuela, S.A. Venezuela
27 United States Postal Service (USPS) United States 83 East Japan Railway Company Japan
28 Chrysler Corporation* United States 84 Ssangyong Corporation South Korea
29 Philip Morris Companies Inc. United States 85 Nippon Mitsubishi Oil Corporation Japan
30 Toshiba Corporation Japan 86 Robert Bosch GmbH Germany
31 The Tokyo Electric Power Co., Inc. Japan 87 SK (Sunkyong) South Korea
32 Daewoo Corporation South Korea 88 Samsung Electronics Co., Ltd. South Korea
33 Nichimen Corporation Japan 89 ConAgra, Inc. United States
34 Kanematsu Corporation Japan 90 British American Tobacco p.l.c. UK
35 Unilever N.V./ Unilever PLC** Netherlands 91 AB Volvo Sweden
36 Nestlé S.A. Switzerland 92 The Kroger Company United States
37 Sony Corporation Japan 93 Dayton Hudson Corporation United States
38 Fiat S.p.A. Italy 94 Hyundai Corp. South Korea
39 Veba AG Germany 95 Canon Inc. Japan
40 Deutsche Telekom AG Germany 96 Lockheed Martin Corporation United States
41 NEC Corporation Japan 97 United Technologies Corporation United States
42 Honda Motor Co., Ltd. Japan 98 British Telecommunications PLC UK
43 Elf Aquitaine* France 99 Japan Postal Service Japan
44 Electricite De France (EDF) France 100 Mannesmann AG* Germany
45 Istituto Por La Ricostruzione Industriale Italy 101 Pemex (Petróleos Mexicanos) Mexico
46 Royal Philips Electronics Netherlands 102 Enel SPA Italy
47 Fujitsu Limited Japan 103 Jusco Co., Ltd. Japan
48 E.I. du Pont de Nemours and Company United States 104 Chubu Electric Power Co., Inc. Japan
49 RWE Group Germany 105 J.C. Penney Company, Inc. United States
50 Renault France 106 Suez Lyonnaise des Eaux France
51 Texaco Inc.* United States 107 United Parcel Service of America United States
52 Mitsubishi Motors Corporation Japan 108 The Dow Chemical Company United States
53 Hoechst Aktiengesellschaft Germany 109 Deutsche Bahn AG Germany
54 ENI S.p.A. Italy 110 Japan Tobacco Inc. Japan
55 Mitsubishi Electric Corporation Japan 111 Promodès S.A.* France
56 Sears, Roebuck and Co. United States 112 GTE Corporation United States
289
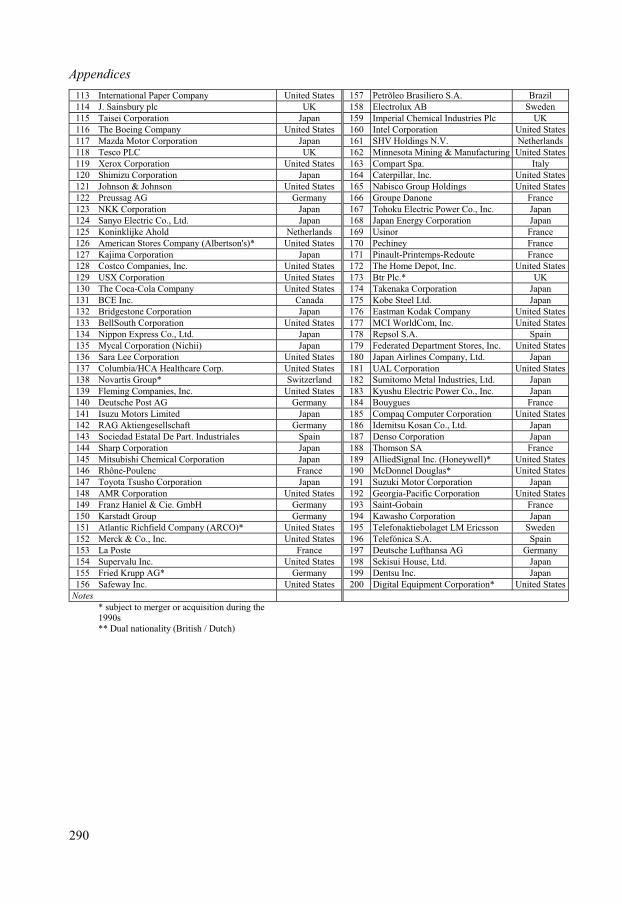
Appendices
113 International Paper Company United States 157 Petrõleo Brasiliero S.A. Brazil
114 J. Sainsbury plc UK 158 Electrolux AB Sweden
115 Taisei Corporation Japan 159 Imperial Chemical Industries Plc UK
116 The Boeing Company United States 160 Intel Corporation United States
117 Mazda Motor Corporation Japan 161 SHV Holdings N.V. Netherlands
118 Tesco PLC UK 162 Minnesota Mining & Manufacturing United States
119 Xerox Corporation United States 163 Compart Spa. Italy
120 Shimizu Corporation Japan 164 Caterpillar, Inc. United States
121 Johnson & Johnson United States 165 Nabisco Group Holdings United States
122 Preussag AG Germany 166 Groupe Danone France
123 NKK Corporation Japan 167 Tohoku Electric Power Co., Inc. Japan
124 Sanyo Electric Co., Ltd. Japan 168 Japan Energy Corporation Japan
125 Koninklijke Ahold Netherlands 169 Usinor France
126 American Stores Company (Albertson's)* United States 170 Pechiney France
127 Kajima Corporation Japan 171 Pinault-Printemps-Redoute France
128 Costco Companies, Inc. United States 172 The Home Depot, Inc. United States
129 USX Corporation United States 173 Btr Plc.* UK
130 The Coca-Cola Company United States 174 Takenaka Corporation Japan
131 BCE Inc. Canada 175 Kobe Steel Ltd. Japan
132 Bridgestone Corporation Japan 176 Eastman Kodak Company United States
133 BellSouth Corporation United States 177 MCI WorldCom, Inc. United States
134 Nippon Express Co., Ltd. Japan 178 Repsol S.A. Spain
135 Mycal Corporation (Nichii) Japan 179 Federated Department Stores, Inc. United States
136 Sara Lee Corporation United States 180 Japan Airlines Company, Ltd. Japan
137 Columbia/HCA Healthcare Corp. United States 181 UAL Corporation United States
138 Novartis Group* Switzerland 182 Sumitomo Metal Industries, Ltd. Japan
139 Fleming Companies, Inc. United States 183 Kyushu Electric Power Co., Inc. Japan
140 Deutsche Post AG Germany 184 Bouygues France
141 Isuzu Motors Limited Japan 185 Compaq Computer Corporation United States
142 RAG Aktiengesellschaft Germany 186 Idemitsu Kosan Co., Ltd. Japan
143 Sociedad Estatal De Part. Industriales Spain 187 Denso Corporation Japan
144 Sharp Corporation Japan 188 Thomson SA France
145 Mitsubishi Chemical Corporation Japan 189 AlliedSignal Inc. (Honeywell)* United States
146 Rhône-Poulenc France 190 McDonnel Douglas* United States
147 Toyota Tsusho Corporation Japan 191 Suzuki Motor Corporation Japan
148 AMR Corporation United States 192 Georgia-Pacific Corporation United States
149 Franz Haniel & Cie. GmbH Germany 193 Saint-Gobain France
150 Karstadt Group Germany 194 Kawasho Corporation Japan
151 Atlantic Richfield Company (ARCO)* United States 195 Telefonaktiebolaget LM Ericsson Sweden
152 Merck & Co., Inc. United States 196 Telefónica S.A. Spain
153 La Poste France 197 Deutsche Lufthansa AG Germany
154 Supervalu Inc. United States 198 Sekisui House, Ltd. Japan
155 Fried Krupp AG* Germany 199 Dentsu Inc. Japan
156 Safeway Inc. United States 200 Digital Equipment Corporation* United States
Notes
* subject to merger or acquisition during the 1990s** Dual nationality (British / Dutch)
290
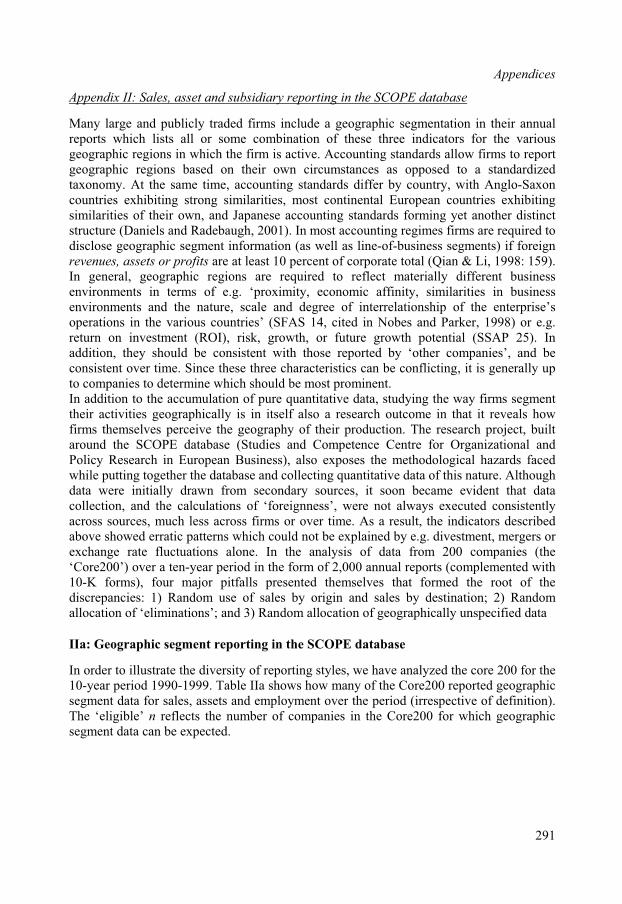
Appendices
Appendix II: Sales, asset and subsidiary reporting in the SCOPE database
Many large and publicly traded firms include a geographic segmentation in their annualmbination of these three indicators for the various
geographic regions in which the firm is active. Accounting standards allow firms to reportg sed on their o umst o a stanta n e time, accounting standards f ith Anglcountries exhibiting st ilaritie nti exsi l nd Japanes g erstructure (Daniels and Radebaugh, 200 most accounting regimes firms are required to di ent informati ess segments) ifreven s are at least 1 f c 99I egions are to l ally different business e r of e.g. ‘prox no s ine r e nature, scale a o to a es’ (SFAS 14, cite n and Parker, 1998r nt (ROI), risk, g fut SSAPa t nt with those report mpanies’, and be c three cteristic a , it is gene pto ich shoul proI cumulation of pur ive t way firmsth activities geographically is in itself also a res c at it revef perceive the geograp heir p research projea n OPE database (Studies and Compe c nal and Policy Research in European Busines expo azardwhile putting together the database and qu it e. Adata were initially drawn from seco rcec culations of ‘fo ness’, w cuted cona s ss firm ime da atterns which c ex i , mee tions alone. In analysis f ani (the‘ eriod in th 2,0 mplement1 forms), four major pitfalls pr em v rootdi 1) Random use of sal igin stination; 2) al ons’; and 3) Ran ocatio cifie
I ent reporting i SCOPE
In order to illustrate the diversity of reporting styles 20010-y 9. Table IIa sh ma re200 reported geograsegm p ver definiT ber o es i geosegm a can be expected.
reports which lists all or some co
e gro aphic regions baam
wn circ a enc s as opposed tw
dardizedxo omy. At the s dif er by country, o-Saxon
rong simn, a
s, most coountin
nental European countriesyet anoth
hibitingmi arities of their ow e acc standards forming distinct
1). Insclose geographic segm
profit
on (as well as line-of-busin foreignues, assets or 0 percent o orporate total (Qian & Li, 1 8: 159).
n general, geographic r required ref ect materinvi onments in terms imity, eco
egreemic affinity, similaritie business
nvi onments and th nd d f interrelationship of the en erprise’sper tions in the various countri d i Nobes ) or e.g.eturn on investme rowth, or ure growth potential ( 25). Inddi ion, they should be consiste ed by ‘other coonsistent over time. Since these chara s c n be conflicting rally u
companies to determine wh d be most minent.n addition to the ac e quantitat da a, studying the segmenteir ear h outcome in th als how
irms themselves hy of t roduction. The ct, builtrou d the SC ten e Centre for Organizatio
s), also ses the methodological h s facedcollecting ant ative data of this natur lthough
tandary sou s, it soon became evident that daollection, and the cal reign ere not always exe sistentlycro s sources, much less acro s or over t . As a result, the indicators
divestmentescribed
bove showed erratic p ould not be pla ned by e.g. rgers or xchange rate fluctua the o data from 200 comp esCore200’) over a ten-year p e form of
d th00 annual reports (co ed with
0-K esente sel es that formed the of thescrepancies: es by or and sales by de Randomlocation of ‘eliminati dom all n of geographically unspe d data
Ia: Geographic segm n the database
, we have analyzed the core for theear period 1990-199 ows how ny of the Co phicent data for sales, assets and em
n reflects the numloyment o
anithe period (irrespective of
chtion).
he ‘eligible’ f comp n the Core200 for whi graphicent dat
291
Appendices
1990 1991 1992 1 1998993 1994 1995 1996 1997 1999
Eligible n 160 160 160 16 162 1 167 169 168 167 164
Sales 112 114 121 0130 136 145 147 149 14 136
Assets 65 65 65 102 98 97 7 731 98 98
Employment 49 48 47 5 56 1 62 60 61 62 52
T easons why 30-40 c f e the ep as accounting regulat an or the general corporate atttowards disclosure), companies may chang ir re ct, regulain a ess disclosure),i -1996 report g les. Secot panies in the in riod by a7 quisitions that o t de. Thirdly, sc red to report c ng not publ cretive or otherwis fort is natuS . Fourthly, some ers estic-onlyt phic segmentation requir s. Although this sub-set dover the period, by 1999 22 core compa u ’. As othersi cade, the s es e sample.‘ e IIa is defined at any f g gmentation, varying‘ to the specifica account ity betw ors. Diffi s because on ely e vaS hile employ is relativ lucreport (beyond the level required by acc ng the perceiveds n. Addition verf e.g. sal rep set-reporting
IIb: Subsidiary location data, Dun & Bradstreet
I sset and employment av of geographics times political) regions (i.e., the ‘g s ny
vidual untries. Data on the lo ion of a company’ssubsi t into the breakdown of activities across geographic regio cator types are to a certain extent co plementary: while asales etc. give an indication of a geographic segment’s relative importance, they say littleabout the role of individual countries within the segment; and while subsidiary locationsays a great deal about the place of different countries in a company’s network, it says little about that country’s relative importance (or indeed that of the individual subsidiary itself).Dun and Bradstreet (D&B) is an agency which maintains continuously updated records on the activities of companies worldwide for the purpose of issuing credit reports to partiesinterested in conducting business with companies in the D&B database. These data havebeen structured in the ‘Who Owns Whom’ database, containing the ‘family trees’ of thousands of the world’s largest companies. The family tree consists of the global ultimateparent (GUP, e.g. ‘Ford Motor Corp.’) and various types of companies which fall under that parent. Originally subsidiaries were described as full subsidiaries (at least 50%
here are multiple r ompanies o the Core200 fall outsid ligible n
er year. Firstly, i hons c ge ( itudee the porting procedures. In fa tions
many countries were relaxed fromed by the post
1997 onw rd (requiring l a factmmediately evidenc in drop in all three variab ndly,he number of core com itial sample is reduced over the pe total of
due to mergers and acere not requi
ccurred in he course of the decaot bei
omeompanies w ( ae.g. as onsequence of n liclyisted), or are highly se e not hcoming with data of th re (e.g. outh Korean chaebols) memb of the Core200 are dom and
hus not subject to geogra ement eclinednies still q alified as ‘wholly domestic
nternationalized over the de y became ubject to reporting requirem nts and ubsequently ‘joined’ thReporting’ in Tabl level o eographic se fromforeign vs. domestic’ tion of
een reporttivities in as many a
cats 20 individual
ries. Striking is the dispar ing of the three indi erentndicators generate different n
common, wly rar do companies report all thre
eral, reriables.
ales is the most ment ely rare. In gen tance toounti standards) is related to
ensitivity of the informatio ally, there is variation within firms o time, as irms do on occasion switch from es-only orting to sales and as .
n practice, sales, a data are ailable at the level (andome eographic egments’ identified in compa annual
reports), but rarely at the level of indidiaries can provide more insigh
co cat
ns. Moreover, the two indi m
292
T he Core200,able IIa: Data reporting among t 1990-1999
Appendices
ownership), affiliates (less than 50% ownership), trade investments (no controlling shares)
l
ries by country of legalphysically present in that
whether only legal or in fact physical, does not alwaysdicate productive activities. In 1990, for example, the Dutch Antilles were 30th in the list
f countries with most subsidiaries registered on its territory. It can, however, easily be ised that the vast majority of those subsid aries have a financial function and not a
locations such as the Cayman Islands,
and dormant (no registered economic activity). Each subsidiary (where relevant) has inturn its own subsidiaries, and so on, such that a ‘tree’ is formed (only the subsidiaries ofmajority-controlled subsidiaries are included, generating a great variety of hierarchicaldepth. The corporate tree of BTR, for instance, was comprised of subsidiaries at 14 levelsin 1990, while e.g. all of Compaq’s subsidiaries were first-level subsidiaries. Eachsubsidiary is registered according to the country in which it is legally incorporated. The family trees are published annually in book form (and more recently on CD-ROM) in several volumes corresponding to geographic regions (e.g. Great Britain and Ireland,Continental Europe, North America, Australasia). The CD-ROM and on-line accessed versions of the database contain additional information per subsidiary where available(sales, employment, SIC-codes). While forming a treasure trove of information, the D&Bdata are subject to serious methodological considerations.Firstly, it is not always clear where the data were drawn from and whether the data arecomplete. D&B claims to purchase their data from ‘every Chamber of Commerce aroundthe world’ (i.e., where firms are required to register their activities) yet seriousdiscrepancies have emerged between the D&B data and e.g. the lists of companysubsidiaries in their annual reports and 10-K forms. It is unclear at this time whether thereare Chambers of Commerce with which D&B does not have purchasing agreements. It is therefore difficult to verify whether the data reflect complete corporate trees or not.This discrepancy can also be related to two other issues: firstly, D&B no longer includesminority-controlled subsidiaries in its database; therefore the discrepancies betweensubsidiaries reported by companies themselves and those noted by D&B may conceivablybe attributed entirely to this omission (in by far the most cases, companies themselvesreported a greater number of subsidiaries than D&B). The analytical implications of these omission is likely to be an understatement of the role of developing countries in a givencompany’s network, since developing countries are more likely to have investmentprovisions restricting majority control by foreign companies. In 1990, for instance, theCore200 had subsidiaries in ca. 160 countries, of which more than 100 could be qualifiedas ‘developing’. For their entire collective base of more than 31,000 subsidiaries, 17.7percent were minority-controlled (5500). In developing countries, that percentage climbed(based on aggregate values) to 28 percent while the figure for developed countries was 16.6 percent. It is possible that this discrepancy has been reduced or eliminated over timeas e.g. investment provisions converge worldwide (see 1995??), but we can’t say…More fundamentally, however, is the distinction between legal location and physica
location. Since D&B registers companies and their subsidiaincorporation, that does not always imply that the company iscountry. In practice this usually means subsidiaries physically located abroad are registeredin the home country for reasons of e.g. legal liability. As a consequence,internationalization measures based on D&B data are likely to understate fact, and again,this is likely to have a disproportionate bearing on the weight of developing countries in agiven analysis.
imilarly, subsidiary location,Sinosurm iproductive one. For this reason subsidiaries in
293

Appendices
Bermuda and t tc ill re ed d inimize b t gspread of productF , the legal re of the D data se’s ins po he question whether a l ship i n a a into economic ation p. In ermshi nstance, th egal) relationshi or the vert vs horizontcharacteristics of a corporate tree, is used as a proxy for the required level of coordination,
he Du h Ant es we omitt in or er to m ias in he geo raphicion.
inally natu &B ba orig also ses tegal relation
erarch for is i ny way
e dept translh of (l
tes an rel shiical
t ofaly, ps,
particularly where those relationships are across borders. Yet it is hypothetically possiblethat those ‘vertical’ relationships are in no way related to e.g. trade relations betweensubsidiaries. Still, it seems intuitively likely (unless all the vertical relationships refer totrade investments, where in fact no control is exercised) that a complex vertical, cross-border legal structure would entail a greater effort to coordinate than e.g. a shalloworganization in which all subsidiaries answer (legally) directly to the ultimate parent.Moreover, an obvious explanation for a complex legal structure in the absence of complexeconomic and strategic relationsips is not in evidence.
294
Appendices
Appendix III: Methods for manipulating the key variables
Data collection on the geographic segmentation of the three indicators form an integral partof research conducted since 1997 at the Erasmus University of Rotterdam to document theinternationalization patterns and behavior of the world’s 200 largest (non-financial)companies over the 1990s, measured by value of total sales in US dollars in 1995 (see VanTulder et al., 2001). In addition to the accumulation of pure quantitative data, studying the way firms segment their activities geographically is in itself also a research outcome in thatit reveals how firms themselves perceive the geography of their production. The researchproject, built around the SCOPE database (Studies and Competence Centre forOrganizational and Policy Research in European Business), also exposes themethodological hazards faced while putting together the database and collecting quantitative data of this nature. Although data were initially drawn from secondary sources, it soon became evident that data collection, and the calculations of ‘foreignness’, were not always executed consistently across sources, much less across firms or over time.As a result, the indicators described above showed erratic patterns which could not be explained by e.g. divestment, mergers or exchange rate fluctuations alone. In the analysisof data from 200 companies (the ‘Core200’) over a ten-year period in the form of 2,000 annual reports (complemented with 10-K forms), three major pitfalls presented themselves
setaxes, windfall profit taxes, value added taxes (VAT) and general and services taxes(GST). In the US, UK and Dutch accounting standards, for example, companies arerequired to publish both sales by origin and sales by destination, ‘unless the two are notmaterially different’ (Nobes and Parker, 1998).For many companies and certain sectors more generally, the two will not be ‘materiallydifferent’ if, for example, a company sources all its inputs locally. Each type of sales has a common denominator in terms of e.g. market share or the attributability of sales to
that formed the root of the discrepancies: 1) random use of sales by origin and sales bydestination; 2) random allocation of ‘eliminations’; and 3) random allocation ofgeographically unspecified data. The current section explores the significance and extentof these issues and offers methodological tools through which they can be addressed consistently and systematically, based on the research in the SCOPE database.
IIIa: Sales by origin and sales by destination
A company’s sales can be defined either by origin or by destination. Sales by origin (SO)are equal to the sum of net sales (gross sales minus value added taxes and similar levies)generated from subsidiaries in a certain location, while sales by destination (SD) are equalto the sum of net sales (gross sales minus value added taxes and similar levies) generatedfrom subsidiaries in the location in question plus sales imported from the headquarters or subsidiaries in other countries (Van Tulder et al., 2001). The former definition is also applied by Worldscope (Worldscope data definitions guide: p. 213) but excludes exci
production within a particular location or to a specific division of management.Furthermore, each says something different about the importance of the location to thatcompany in general, and equally importantly, the significance of the company for the location. For industries which exhibit vertical integration across widely dispersed locationssuch as the automobile industry, the difference can be quite remarkable. For Daimler-Benz
295
Appendices
in 1995, for instance, foreign sales by origin (FSO) accounted for 45.6 percent of the total, while the figure for foreign sales by destination (FSD) was 63.2 percent (a difference of 17.6 percent). Canon, in the same year, exhibited FSO of 64.1 percent and FSD of 66.9 percent (a difference of 2.8 percent). In some cases the differences may seem minor or insignificant, but it should be noted that for these indicators, a two percent change year-on-year is considerable, even in large firms (cf. Muller and Van Tulder, 2002). It is vital that‘fluctuations’ in internationalization indicators are not attributable to random use of thesevariables. When comparing the significance for a company of a given location, particularlywithin industries, it must be clear which type of sales figure is being used. Moreover, thistype should ideally be used consistently across firms, but in any case for individual firmsover time.Table IIIa illustrates the significance of the problem. Theoretically, companies have three possibilities: reporting SO, SD or BOTH. The data show that, of the three options, SO is by far the most frequently reported, outscoring SD by a ratio of about five to one. The figure also reveals an increased tendency to report BOTH over the decade, rising from only 7 percent of those firms reporting geographically segmented sales in 1990 to a high of over20 percent in 1996 before tapering off again in the late 1990s. Since firms are onlyrequired to report both if ‘materially different’, the rise in BOTH may reflect an increasing geographic diversification in production and marketing structures.
Table IIIa: Sales reporting, 1990-99 Core200
1990 1991 1992 1993 1994 1995 1996 1997 1998 1999
Total N 112 114 121 130 136 145 147 149 140 136
% BOTH 7,1 7,0 9,1 11,5 15,4 18,6 20,4 18,1 17,9 15,4
% SO 79,5 78,9 78,5 78,5 75,0 72,4 71,4 69,8 67,1 69,1
% SD 13,4 14,0 12,4 10,0 9,6 9,0 8,2 12,1 15,0 15,4
If reporting only SO or SD suggests that the difference is immaterial, they can in theory beused interchangeably. However, since a considerable number of firms disclosinggeographically segmented sales data report BOTH, the sales type must be selected whichmost accurately reflects the concept it is intended to measure, and that consistency over time is maintained.
IIIb: Calculating shares based on geographic sales data
The calculation of a geographic segment’s relative importance as a percentage of the wholeseems at first glance rather straightforward. For any company X, it is logical to express the share of any segment i, as a share of the total, as follows:
TotalX
iXiX
Sales
SalesShare (Equation 1)
where ShareiX is expressed as a percentage.
When reporting revenues data, however, companies often include some form of eliminations in alongside the geographic segment data. Eliminations generally refer tointra-firm sales, or intermediate goods that are consumed in the production process andmust be accounted for in the balance in such a way that they are not re-counted at each
296
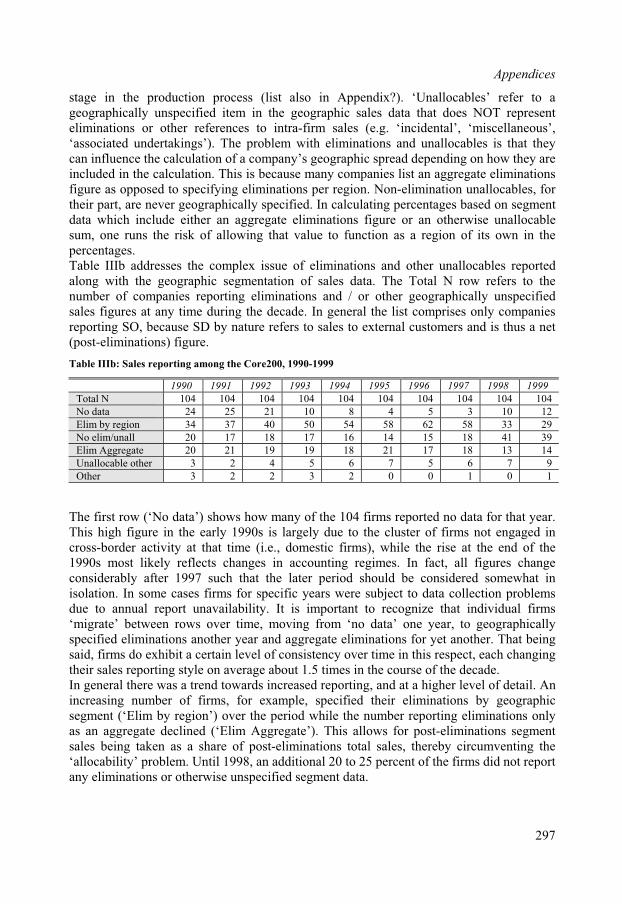
Appendices
stage in the production process (list also in Appendix?). ‘Unallocables’ refer to a data that does NOT representgeographically unspecified item in the geographic sales
eliminations or other references to intra-firm sales (e.g. ‘incidental’, ‘miscellaneous’,‘associated undertakings’). The problem with eliminations and unallocables is that theycan influence the calculation of a company’s geographic spread depending on how they are included in the calculation. This is because many companies list an aggregate eliminationsfigure as opposed to specifying eliminations per region. Non-elimination unallocables, fortheir part, are never geographically specified. In calculating percentages based on segmentdata which include either an aggregate eliminations figure or an otherwise unallocablesum, one runs the risk of allowing that value to function as a region of its own in thepercentages.Table IIIb addresses the complex issue of eliminations and other unallocables reportedalong with the geographic segmentation of sales data. The Total N row refers to thenumber of companies reporting eliminations and / or other geographically unspecifiedsales figures at any time during the decade. In general the list comprises only companiesreporting SO, because SD by nature refers to sales to external customers and is thus a net (post-eliminations) figure.
Table IIIb: Sales reporting among the Core200, 1990-1999
1990 1991 1992 1993 1994 1995 1996 1997 1998 1999
Total N 104 104 104 104 104 104 104 104 104 104
No data 24 25 21 10 8 4 5 3 10 12
Elim by region 34 37 40 50 54 58 62 58 33 29
No elim/unall 20 17 18 17 16 14 15 18 41 39
Elim Aggregate 20 21 19 19 18 21 17 18 13 14
Unallocable other 3 2 4 5 6 7 5 6 7 9
Other 3 2 2 3 2 0 0 1 0 1
The first row (‘No data’) shows how many of the 104 firms reported no data for that year.This high figure in the early 1990s is largely due to the cluster of firms not engaged incross-border activity at that time (i.e., domestic firms), while the rise at the end of the1990s most likely reflects changes in accounting regimes. In fact, all figures changeconsiderably after 1997 such that the later period should be considered somewhat inisolation. In some cases firms for specific years were subject to data collection problemsdue to annual report unavailability. It is important to recognize that individual firms‘migrate’ between rows over time, moving from ‘no data’ one year, to geographicallyspecified eliminations another year and aggregate eliminations for yet another. That beingsaid, firms do exhibit a certain level of consistency over time in this respect, each changing their sales reporting style on average about 1.5 times in the course of the decade.In general there was a trend towards increased reporting, and at a higher level of detail. An increasing number of firms, for example, specified their eliminations by geographicsegment (‘Elim by region’) over the period while the number reporting eliminations onlyas an aggregate declined (‘Elim Aggregate’). This allows for post-eliminations segmentsales being taken as a share of post-eliminations total sales, thereby circumventing the‘allocability’ problem. Until 1998, an additional 20 to 25 percent of the firms did not report any eliminations or otherwise unspecified segment data.
297

Appendices
The ‘Unallocable other’ row refers to the number of firms reporting a geographicallyunspecified item in their geographic sales data that does NOT represent eliminations or other references to intra-firm sales (e.g. ‘incidental’, ‘miscellaneous’, ‘associatedundertakings’). The last row (‘other’) comprises a small number of firms reporting ageographically unspecified (unallocable) item in addition to eliminations, be they specifiedor not. Both ‘Unallocable other’ and ‘other’, together with ‘Elim Aggregate’, requiremethodological interventions in order to prevent the eliminations and otherwisegeographically unspecified value from skewing the percentages. These three categories taken together consist of 20 to 30 percent of the firms reporting in any given year.Example 5.2 below describes such a case, drawing on Motorola in 1998 (based on dataprovided in the 1999 annual report, page 30). Following Equation 1, Share inUSMotorola
example 5.2 = 20,397 / 29,398, or 69.4 percent. However, calculating ShareUSMotorola based on SalesTotalMotorola as listed on the balance sheet implicitly allocates the eliminations figure(-9,520) to the other segments; i.e., to segments other than SalesUSMotorola.
Example 1: Aggregate eliminations in geographic segment reporting: Motorola, 1998
Geographic segment Sales (millions $US)
United States 20,397
United Kingdom 5,709
Other nations 12,812
Adjus s and eliminattment ions -9,520
Total 29,398
Companies do on occasion segment their eliminations (intra-firm sales) by region as well,
ill imperfect) calculation would be as follows:
which allows for analysis of net revenues per segment. Since geographic segment datareported as in Example 1, however, provides no information as to the proper segmentationof the eliminations figure, there is no theoretical basis for allocating the eliminations toother segments, or any segment for that matter. Given that fact, a methodologicallysounder (arguably st
ElmnationXTotalX
iXiX
SalesSales
SalesShare (Equation 2)
ring a pre-eliminations segmenttotal with a post-eliminatio to have post-eliminations segment ise (seefollowing section). Moreover, in practice, the absolute value of eliminations when
gher than the value of one or more individual
The calculation for Motorola (1998) is then 20,397 / (29,398- [-9,520]), or 52.4 percent, or a difference of 17 percent. The comparison of a pre-eliminations segment total with a pre-eliminations company total is more accurate than compa
ns company total. Although it may be more desireabletotals, the reality of firm reporting is often otherw
aggregated as in Example 1 will often be hi
geographic segments and can thus create a margin of error greater than the value of a smallsegment (e.g., if the absolute value of the eliminations is higher than the absolute value ofa given segment).
298
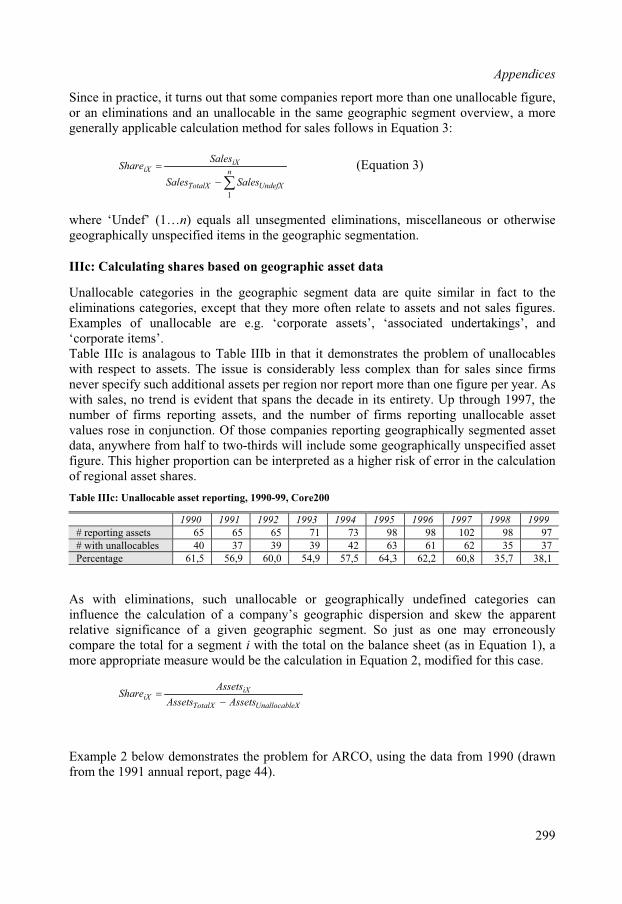
Appendices
Since in practice, it turns out that some companies report more than one unallocable figure,or an eliminations and an unallocable in the same geographic segment overview, a moregenerally applicable calculation method for sales follows in Equation 3:
n
UndefXTotalX
iXiX
SalesSales
SalesShare
1
(Equation 3)
where ‘Undef’ (1…n) equals all unsegmented eliminations, miscellaneous or otherwisegeographically unspecified items in the geographic segmentation.
IIIc: Calculating shares based on geographic asset data
Unallocable categories in the geographic segment data are quite similar in fact to theeliminations categories, except that they more often relate to assets and not sales figures.Examples of unallocable are e.g. ‘corporate assets’, ‘associated undertakings’, and‘corporate items’.Table IIIc is analagous to Table IIIb in that it demonstrates the problem of unallocables
less complex than for sales since firmsnever specify such io se r n o e n re ew s, no trend is evid hat ns ecade in its entirety. Up through 1997, the num s reporting assets, and the mber of fi ing unallocable asv conjun hose comp s reporting gra cally gme d asd from to two-thi d me grap ally specified assetfi er pro rtion n be terpreted as ghe sk o rror he c ulatio asset shares.
able IIIc: Unallocable asset reporting, 1990-99, Core200
with respect to assets. The issue is considerablyaddit nal as ts per egion or rep rt mor than o e figu per y ar. As
ith sale ent t spa the dber of firm nu rms report set
alues rose in ction. Of t anieinclu
geo phi se nte setata, anywhere half rds will e so geo hic ungure. This high po ca in a hi r ri f e in t alc onf regional
T
1990 1991 1992 1993 1994 1995 1996 1997 1998 1999
# reporting assets 65 65 65 71 73 98 98 102 98 97
# with unallocables 40 37 39 39 42 63 61 62 35 37
Percentage 61,5 56,9 60,0 54,9 57,5 64,3 62,2 60,8 35,7 38,1
As with eliminations, such unallocable or geographically undefined categories can influence the calculation of a company’s geographic dispersion and skew the apparentrelative significance of a given geographic segment. So just as one may erroneouslycompare the total for a segment i with the total on the balance sheet (as in Equation 1), a more appropriate measure would be the calculation in Equation 2, modified for this case.
eXUnallocablTotalX
iXiX
AssetsAssets
AssetsShare
Example 2 below demonstrates the problem for ARCO, using the data from 1990 (drawn from the 1991 annual report, page 44).
299
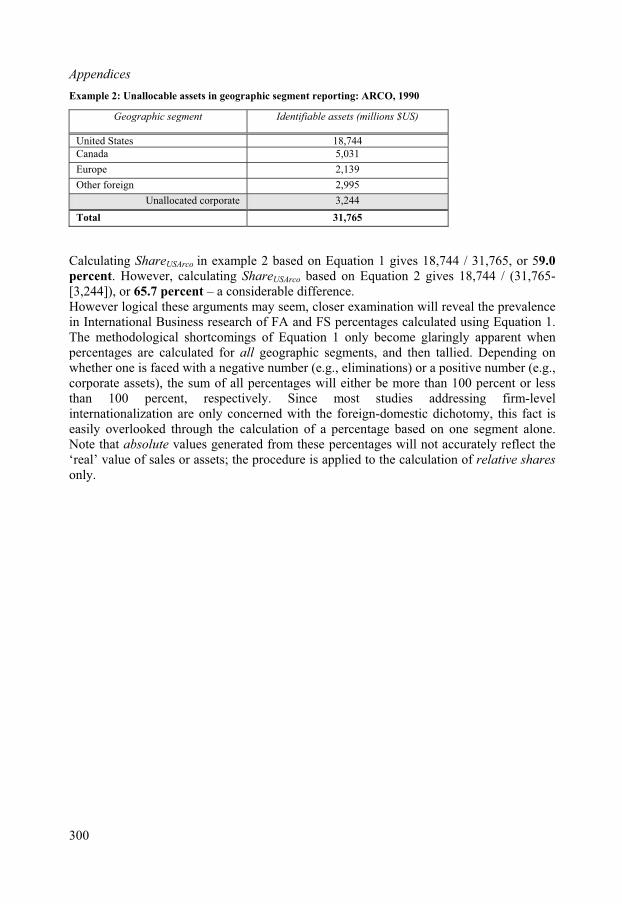
Appendices
Example 2: Unallocable assets in geographic segment reporting: ARCO, 1990
Geographic segment Identifiable assets (millions $US)
United States 18,744
Canada 5,031
Europe 2,139
Other foreign 2,995
Unallocated corporate 3,244
Total 31,765
Calculating ShareUSArco in example 2 based on Equation 1 gives 18,744 / 31,765, or 59.0
percent. However, calculating ShareUSArco based on Equation 2 gives 18,744 / (31,765-[3,244]), or 65.7 percent – a considerable difference.Howeve ogical these arguments may seem, closer examination will revealr l the prevalencein International Business research of FA and FS percentages calculated using Equation 1.
ly apparent when percentages are calculated for all geograp d then tallied. Depending onwhether one is faced with a negative number (e.g., eliminations) or a positive number (e.g., corporate assets), the sum of all percentages will either be more than 100 percent or less t rcent, respectively. Since studies addressing firm-leveli zation are only concerned with the n-domestic dichotomy, this fact iseasily o alculation of a tage based on one segment alone.Note that absolute values generated from these will not accurately reflect the ‘real’ value of sales or assets; the procedure is applied to the calculation of relative shares
only.
The methodological shortcomings of Equation 1 only become glaringhic segments, an
han 100 pe mostnternationali foreig
verlooked through the c percenpercentages
300
REFERENCES
Aglietti, Michel. 1979. A Theory of Capitalist Regulation: the US Experience. London:NLB.
Aharoni, Yair. 1966. The Foreign Investm cisio n: HBS.Alt, James and John T. Woolley. 1982. Reaction Functions, Optimization and Politics:
Modelling the Political Economy of Macroeconomic Policy. American Journal of
Political Science, vol. 26(4): 709-740. Andersson, U. And Johansson, J. 1997. International Business Enterprise. In: I. Björkman
and M. Forsgren, eds., The Nature of the International Firm. Copenhagen:
y-Performance Relationship: a
Common Market Studies, 34(4): 571-83. Arthur, W. Brian. 1989. Competing Technologies, Increasing Returns and Lock-in by
Historical Events. The Economic Journal, 99(394): 116-31. Athanassiou, Nicolas & Douglas Nigh. 2002. The Impact of the Top Management Team’s
International Business Experience on the Firm’s Internationalization: SocialNetworks at Work. Management International Review, 42(2): 157-81.
Atkinson, Glen. 1999. Developing Global Institutions: Lessons to be Learned fromRegional Integration Experiences. Journal of Economic Issues, 33(2): 335-44.
Baden-Fuller, Charles & Gianni Lorenzoni. 1995. Creating a Strategic Centre to Manage a 37(3): 146-163.
Fordism: the Emergence of Alternative Forms of Sta dm ra n tp : o ra ed
ainst Markets e Li of ion. ndo ou e.B nn y ivi oed ni ssel . 2
pe, Inc.: and G l Restruc g e o porate PoLondon: Pluto Press.
Perspectives of Economists and Political Scientists. In R. Feenstra, G. Grossman & D. Irwin, editors, The Political Economy of Trade Policy. London: MIT Press.
Baldwin, Robert. 1999. Agglomeration and Endogenous Capital. European Economic
Review, Vol 43, pp. 253-280.
ent De n Process. Bosto
Handelshøjskolans Förlag.Annavarula, Madan & Sam Beldona. 2000. Multinationalit
Review and Reconceptualization. International Journal of Organizational Analysis.8 (1): 48-67.
Aristotelous, Kyriacos & Stilanos Fountas. 1996. An Empirical Analysis of Inward FDI Flows in the EU with Emphasis on the Market Enlargement Hypothesis. Journal of
Web of Partners. The California Management Review
Bakker, Isabella & Riel Miller. 1996. Escape fromte A inist tion a d Ou ut. In R. B yer & D. D che, itors,
States Ag : th mits Globalizat Lo n: R tledgalanyá, Belen, A Dohert
Regional
, Ol eloba
r H eman, Adam Mand th
a’a t & EriRise
kf Cor
We ius 0wer.00.
Euro turin
Balassa, Bela. 1961. The Theory of Economic Integration. Homewood, Il: Richard D. Irwin.
Baldwin, Richard. The Growth Effects of 1992. Economic Policy 9: 247-81. Baldwin, Robert. 1985. The Political Economy of US Import Policy. Cambridge: MIT
Press.Baldwin, Robert. 1996. The Political Economy of Trade Policy: Integrating the
Baran, Paul & Paul Sweezy. 1966. Monopoly Capital. Harmondsworth: Penguin.Barnes, I. & L. Davidson. 1994. European Business: Text and Cases. Oxford, UK:
Butterworth-Heinemann.
301

References
Baron, David. 2000. Business and Its Environment (3rd Edition). Upper Saddle River:P
Barrell, R. & N. Pain. 1999. Trade restraints and Japanese direct investment flows.ean Economic Review, 43: 29-45.
B Christopher & Sumantra Ghoshal. 1989. Managing Across Borders: The ransnational Corporation. Boston, MA: Harvard Business Press.
B liam J. 1982. Contestable markets in the theory of industry structu mic Review, Vol 1): 1-15.
B os, René & Leo Sleuwagen. 1996. Jap Firms and the decision to investabroad: business groups and regional core networks. The Review of Economics and
.
Internationalization: Process, Context and Markets. London: Macmillan.jörkman, I. & M. Forsgren, eds. 1996. The Nature of the International Firm.
Copenhagen: Copenhagen Business School Press. Blank, Stephen & Jeffrey Haar. 1998. Making NAFTA work: US firms and the new North
American Business Environment. North-South Center Press, University of Miami.Blomström, Magnus & Ari Kokko. 1997. Regional integration and foreign direct
investment. Working Paper Series in Economics and Finance no. 172, StockholmSchool of Economics.
Blomström, Magnus, Ari Kokko & Stephen Globerman. 1998. Regional EconomicIntegration and Foreign Direct Investment: The North American Experience. NBERWorking Paper Series in Economics and Finance no. 269.
Bosworth, Barry, Robert Lawrence & Nora Lustig. 1992. Introduction. In: B. Bosworth, R.Lawrence & N. Lustig, editors, Assessing the Impact of North American Free
Trade. Washington, DC: The Brookings Institution. Bowen, Harry, Abraham Hollander & Jean-Marie Viaene. 1998. Applied International
Trade Analysis. London: MacMillan Press. Boyer, Robert & Jean-Pierre Durand. 1993. After Fordism. London: MacMillan Press, Ltd. Brainard, Susan. 1997. An empirical assessment of the proximity-concentration trade-off
between multinational sales and trade. American Economic Review, vol. 87 (4). Braithwaite, John & Peter Drahos. 2000. Global Business Regulation. Cambridge:
University Press.
rentice Hall.
Europ
artlett,T
aumol, Wil : an uprisingre. American Econo . 72 (
elderb anese
Statistics, volBelderbos, René. 1997. Antidumping and tariff jumping: Japanese firms’ DFI in the
European Union and the United States. In: Weltwirtschaftliches Archiv: Zeitschriftdes Instituts für Weltwirtschaft Kiel, Vol. 133(3), 419-457 (39).
Bergsten, C. Fred. 1997. Open regionalism. Working Paper 97-3, Institute for International Economics.
Bhagwati, Jagdish. 1991. The World Trading System at Risk. Princeton: Princeton University Press.
Bhagwati, Jagdish. 1993. Regionalism and multilateralism: an overview. In J. de Melo &A. Panagariya, editors, New Dimensions in Regional Integration. Cambridge:Cambridge University Press.
Bilkey, W. & G. Tesar. 1977. The Export Behavior of Smaller-sized Wisconsin Firms.Journal of International Business Studies, vol. 8 (spring/summer): 93-98.
Birkinshaw, Julian & Neil Hood. 1997. Determinants of Subsidiary Mandates andSubsidiary Initiative: A Three-Country Study. In: R. Loveridge ed.,
B
302

References
Branch, Ann & Jakodichotomy: a r
b Øhrgaard. 1999. Trapped in the supranational intergovernmentalesponse to Stone Sweet and Sandholtz. Journal of European Public
tledge.
Buckle
Centra
Policy. 6(1): 123-43. Brodie, Janine. 1997. New state forms, new political spaces. In: R. Boyer & D. Drache,
editors, States Against Markets: the Limits of Globalization. London: RouBuckley, Peter & Marc Casson. 1976. The Future of the Multinational Enterprise. London:
MacMillan.y, Peter & Parvez Gauri. 1999. The Internationalization of the Firm: A Reader. 2nd ed. London: International Thomson Business Press.
Cable, Vincent & David Henderson. 1994. Overview. In: V. Cable & D. Henderson, editors, Trade Blocs? The Future of Regional Integration. London: The RoyalInstitute of International Affairs.
Cameron, David. 1992. The 1992 initiative: causes and consequences. In: Sbragia, A., editor, Europolitics: Institutions and Policymaking in the “New” European
Community. Wash, D.C.: The Brookings Institution.Cameron, Maxwell & Brian Tomlin. 2000. The Making of NAFTA: How the Deal was
Done. Ithaca: Cornell University Press. Cameron, Maxwell et al. 1992. North American free trade: cooperation and conflict in
Canada-Mexico relations. In: F.O. Hampson and C. Maule, editors, Canada Among Nations 1992-93: A New World Order? Ottawa: Carlton University Press.
Cantwell, John. 1992. The methodological problems raised by the collection of foreigndirect investment data. Scandinavian International Busienss Review, 1(1): 86-103.
Cantwell, John. 1993. The reorganization of European industries after integration: selectedevidence on the role of multinational enterprise activities. In: J. Dunning & P.Robson, editors, Multinationals and the European Community. Oxford: BasilBlackwell.
Cantwell, John. 2000. A survey of theories of international production. In C. Pitelis & R.Sugden, editors, The Nature of the Transnational Firm. (2nd Ed.) London:Routledge.
Carr, Edward Hallett. 1951. The New Society. London: MacMillan Press. Casson, Marc & P. McCann. 1999. Globalization, competition and the corporation: the UK
experience. In: The Evolving Corporation: Global Imperatives and National
Responses. The Group of Thirty, Washington, D.C.Caves, Richard. 1976. Economic models of political choice: Canada’s tariff structure.
Canadian Journal of Economics, vol. 9: 278-300. Caves, Richard. 1971. International Corporations: The Industrial Economics of Foreign
Investment. Economica, 38(Feb): 1-27. Caves, Richard. 1996. Multinational Enterprise and Economic Analysis. Cambridge
Surveys of Economic Literature, Cambridge University Press. al Plan Bureau. 1997. The interplay of institutions, trade-offs, performance and trends. In Challenging Neighbours, Berlin: Springer Verlag.
Cerny, Philipp. 1999. Globalization, governance and complexity. In: A. Prakash & J. Hart,editors, Globalization and Governance. London: Routledge.
Chang, Ha-Joon & Robert Rowthorn. 1995a. Introduction. In: Chang, H. & R. Rowthorn,editors, The Role of the State in Economic Change. Oxford, UK: Clarendon Press.
303
References
Chang, Ha-Joon & Robert Rowthorn. 1995b. Role of the state in economic change:entrepreneurship and conflict management. In: Chang, H. & R. Rowthorn, editors,
Chang Industrial Policy. New York: St Martin’s
Clegg, : the USA and
Cleme illiam A. Kerr, Alan J.
tegration: Europe, Asia and the Americas. London: Routledge.
y 35.
Connol . 1999. Mercosur: Implications for growth in member
Cowle 1992.
Cox, R
itors, Political Economy and the
Criekmregulation in the EU and USA. PSW paper 1998/3, University of Antwerp.
Crouch, Colin & Wolfgang Streeck. 1997. Introduction: the future of capitalist diversity. In: C. Crouch & W. Streeck, editors, Political Economy of Modern Capitalism.
Cyert,
D’Cru or Canadian Competitiveness,
Daniel ance: do foreign operations make a
David, iew
The Role of the State in Economic Change. Oxford, UK: Clarendon Press. , Ha-Joon. 1994. The Political Economy of
Press.Jeremy & Susan Scott-Green. 1999. FDI capital flows into the ECJapan compared. Journal of Common Market Studies, 37(4): 597-616. nt, Norris, Gustavo del Castillo Vera, James Gerber, WMacFadyen, Stanford Shedd, Eduardo Zepeda and Diana Alarcón. 1999. North
American Economic Integration: Theory and Practice. Cheltenham, UK: Edward Elgar.
Cohen, Benjamin. 1997. The political economy of currency regions. In: E. Mansfield & H. Milner, editors, The Political Economy of Regionalism. New York: ColumbiaUniversity Press.
Coleman, William & Geoffrey Underhill, editors. 1998. Regionalism and Global
Economic InCommission of the European Communities (CEC). 1988. The economics of 1992.
European Econom
Conn, H. & G.Yip. Global Transfer of Critical Capabilities. 1997. Business Horizons,40(1): 22-31. ly, Melissa & Jessica Gunthercountries. Current Issues in Economics and Finance, 5(7).s, Maria G. 1995. Setting the agenda for a new Europe: the ERT and ECJournal of Common Market Studies, 33(4): 501-26. obert. 1989. Production, Power and World Order. New York: Columbia UniversityPress.
Cox, Robert. 1994. Global restructuring: making sense of the changing internationalpolitical economy. In: R. Stubbs & G. Underhill, edChanging Global Order. London: MacMillan. ans, David. 1998. Symbiosis or controversy? Governmental appraisal of lobbying
London: Sage Publications.Richard & James March. 1963. A Behavioral Theory of the Firm. New Jersey:Prentice Hall.
D’Cruz, Joseph & Alan Rugman. 1997. The theory of the flagship firm. European
Management Journal 15(4): 403-412. z, Joseph, & Alan Rugman. 1992. New Compacts fToronto: Kodak Canada.s, J.D. & Bracker, J. 1989. Profit performdifference? Management International Review, 29: 46-56.
Davenport, M. & S. Page. 1991. Europe: 1992 and the Developing World. London : ODI. Paul. 1985. Clio and the economics of QWERTY. American Economic Rev
Proceedings, 75: 332-7.
304
References
Davies, Stephen, Catherine Matraves, David Petts & Lars-Hendrik Röller. 1999. Thecorporate structure of UK and German manufacturing firms: changes in response tothe SEM. The Anglo-German Foundation for the Study of Industrial Society.
, New Dimensions in Regional
Dent, CDevinn tower. 1991. European Markets after 1992.
Dicken
ional Economics, 21: 233-50.
Doz, Y , editor,
Dudley
Dunnintin's Press.
Dunning, John. 1986. Japanese Participation in British Industry. London: Croom Helm.my. New York:
DunninMarket Studies, 35(2).
Dunnin ization of Economic Activity: A
s. Oxford, UK: Oxford University Press.
ica. Calgary: Univ. of
Econo ?
:383-400.
De Bondt, G., P van Els, & A. Stokman. 1997. A macroeconomic multi-country model for the EU. DNB Staff Reports, De Nederlandsche Bank.
De Bono, Edward. 1970. Lateral Thinking: A Textbook of Creativity. London: Ward Lock International.
De Melo, Jaime, Arvind Panagariya & Dani Rodrik. 1993. The new regionalism: a countryperspective. In: J. de Melo & A. Panagariya, editorsIntegration. Cambridge: Cambridge University Press. hristopher. 1997. The New European Economy. London: Routledge.ey, Timothy & William HighLexington, MA: Lexington Books., Peter. 1992. Global Shift: Transforming the World Economy. London: PaulChapman Publishing.
Dixit, Avanash & Gene Grossman. 1986. Targeted Export Promotion with SeveralOligopolistic Industries. Journal of Internat
Douglas, Susan & Yoram Wind. 1987. The Myth of Globalization. Columbia Journal of
World Business, Winter 1987 (reprinted in De Wit & Meyer, 1998). ves. 1986. Government Policies and Global Industries. In M. Porter
Competition in Global Industries. Boston, MA: HBS., Geoffrey & Jeremy Richardson. 1997. Competing Policy Frames in EU PolicyMaking: The Rise of Free Market Ideas in EU Steel Policy 1985-1996. EIOP vol. 1, 1997.g, J. & Pearce, R. 1985. The world's largest industrial enterprises 1962-1983. New York: St. Mar
Dunning, John & Alan Rugman. 1985. The Influence of Hymer’s Dissertation on theTheory of Foreign Direct Investment. American Economic Review, May.
Dunning, John. 1993. Multinational Enterprises and the Global Econo
Addison Wesley.g, John. 1997a. The European Internal Market Programme and Inbound ForeignDirect Investment (Pts I and II). Journal of Common
Dunning, John. 1997b. Alliance Capitalism and Global Business. London: Routledge.g, John. 1997c. Governments and the Macro-organHistorical and Spatial Perspective. In: J. Dunning, editor, Governments,Globalization and International Busines
Dunning, John. 1998. Location and the Multinational Enterprise: A Neglected Factor?Journal of International Business, 29(1): 45-66.
Eaton, C., R. Lipsey & E. Safarian. 1994. The Theory of Multinational Plant Location in an RTA. In: L. Eden, editor, Multinationals in North Amer
Calgary Press. mist. Oct. 28, 2000. Survey Mexico: If not for NAFTA, When
Eden, Lorraine & Stefanie Lenway. 2001. Introduction to the Symposium Multinationals: the Janus Face of Globalization. Journal of International Business Studies, 32, 3
305

References
Eden, Lorraine, editor. 1993. Multinationals in the Global Political Economy. New York: St. Martin’s Press. Lorraine, editor. 1994. Multinationals in North America. Calgary: UnivEden, ersity of
Encarn ells, Jr. 1986. Competitive strategies in global industries: a
Ethier,Paper series.
nstitute Briefing Paper
iew of Economics and Statistics, vol. 83: 118-132.
ns in Regional Integration. Cambridge: Cambridge University Press.
. European Economic Review, vol. 39: 391-97.
Gawan n, bargaining and the pursuit of ‘free
Gestrin TA. in:
Gestrin and Alan M. Rugman. 2000. Templeton Global
Ghema 94. The Short Run versus the Long Run in Cross-sectional Industrial
Pergamon.
Political Economy and the Changing Global Order.
Gilpin ding the International
olumbia: University of South Carolina Press.
Calgary Press. ation, Dennis & Louis Wview from host governments. In M. Porter, editor, Competition in Global Industries.Boston, MA: HBS.
Ethier, Wilfred. 1998. Regionalism in a Multilateral World. The Journal of PoliticalEconomy, 106(6): 1214-45. Wilfred. 2001. Punishments and dispute settlement in trade agreements. PENN
WorkingFaux, Jeff & Richard Rothstein. 1991. Fast Track, Fast Shuffle: The Economic
Consequences of the Administration’s Proposed Trade Agreement with Mexico.Economic Policy I
Feenstra, Robert, Gene Grossman & Douglas Irwin, editors, The Political Economy of
Trade Policy. London: MIT Press. Feinberg, Susan & Michael Keane. 2001. U.S.-Canada Trade Liberalization and MNC
Production Location, Rev
Findlay, Ronald. 1993. Discussion to chapter 6, In: J. De Melo & A. Panagariya, editors,New Dimensio
Flam, Harry. 1992. Product Markets and 1992: Full Integration, Large Gains? Journal of
Economic Perspectives, vol. 6(4): 7-30. Fujita, M., P. Krugman & A. Venables. 1999. The Spatial Economy: Cities, Regions and
International Trade. London: MIT Press. Gatsios, K. & L. Karp. 1995. Delegation in a General Equilibrium Model of Customs
UnionsGatz, Jürgen. 1997. The Socio-Economic Impact of NAFTA’s FDI Potential for Mexico.
Frankfurt: Peter Lang.de, Kishore & Wendy Hansen. 1999. Retaliatioand fair’ trade. International Organization, 53(1)., Michael & Alan Rugman. 1994. The strategic response of MNEs to NAFRugman, A., editor, Foreign Investment and NAFTA. Columbia: University ofSouth Carolina Press., Michael V, Rory F. KnightPerformance Index. Templeton College, Oxford (sponsored by the ESRC).wat, Pankaj. 19Organization. In: H. Daems & H. Thomas, editors, Strategic Groups, Strategic
Moves and Performance. Oxford, UK:Gill, Stephen. 1994. Knowledge, politics and neo-liberal political economy. In: R. Stubbs
& G. Underhill, editors,London: MacMillan.
, Robert. 2001. Global Political Economy: UnderstanEconomic Order. Princeton, NJ: Princeton University Press.
Globerman, Steven. 1994. The economics of NAFTA. In: Rugman, A., editor, Foreign
Investment and NAFTA. C
306
References
Goerzen, A. & Beamish, P. 2002. Geographic scope and multimational enterprise performance. Paper presented at the Annual Meeting of the Academy ofInternational Business, San Juan Puerto Rico.
Gomes, Leonard & Kannan Ramaswamy. 1999. An empirical examination of the form ofthe relationship between multinationality and performance. Journal of International
Graham 7. Should there be multilateral rules on FDI? In: J. Dunning, editor,
Greenw
an Economic
Grossm 1995. The politics of free-trade agreements.
Haas, E of Europe. Stanford: Stanford University Press.
ionalism.
Hanch & M. Moran,
Harzin tension of the Bartlett and
Helpm hanan & Paul Krugman. 1989. Trade Policy and Market Structure.
Helpm inational Corporations and Trade Structure. Review of
Helpm Sapir and.
Henna 000. Transaction Cost Economics. In: C. Pitelis & R. Sugden,
Herkst l. 8(1):
Hirsch ty
Hirst, n Question: The International
HoekmATT to WTO. Oxford: Oxford University Press.
ry Capitalism: The
Hufbaual Economics.
Business Studies 30: 173-188. , Edward. 199
Governments, Globalization and International Business. Oxford University Press. ood, Justin. 1997. Representing Interests in the European Union. London:
MacMillan Press.Grossman, Gene & Elhanan Helpman. 1994. Protection for sale. Americ
Review, vol. 84(4): 833-51. an, Gene & Elhanan Helpman.
American Economic Review, vol. 85(4): 667-690. rnst. 1958. The Uniting
Haggard, Stephen. 1997. The political economy of regionalism in Asia and the Americas.In: E. Mansfield and H. Milner, editors, The Political Economy of Reg
New York: Columbia University Press. er, Leigh & Michael Moran. 1989. Introduction. In: L. Hanchereditors, Captialism, Culture and Regulation. Oxford: Clarendon Press. g, Anne-Wil. 2000. An Empirical Ananlysis and ExGhoshal Typology of Multinational Companies. Journal of International BusinessStudies, 31(1): 101-20. an, ElCambridge, MA: MIT Press.an, Elhanan. 1985. MultEconomic Studies, vol.. 52: 443-58.an, Elhanan. 1999. Politics and trade policy. In: R. Baldwin, D. Cohen, A.A. Venables, editors, Market Integration, Regionalism and the Global Economy
London: Centre for Economic Policy Research.rt, Jean-François. 2editors, The Nature of the Transnational Firm. (2nd Ed.) London: Routledge.röter, C.J. 1996. Breaking European Barriers. European Business Journal, vo56-59.
Hettne, Björn & Frederik Söderbaum. 2000. Theorising the rise of regionness. New
Political Economy, 5(3): 457-473. man, Albert. 1970. Exit, Voice and Loyalty. Cambridge, MA: Harvard UniversiPress.Paul & Grahame Thompson. 1999. Globalization iEconomy and the Possibilities of Governance. Cambridge UK: Polity Press. an, Bernard & Michel Kostecki. 1995. The Political Economy of the World Trading
System: from GHollingsworth, J. Rogers. & Robert Boyer, editors. 1996. Contempora
Embeddedness of Institutions. Cambridge UK: Cambridge University Press. er, Gary & Jeffrey Schott. 1993. NAFTA: An Assessment. Washington: Institute forInternation
307

References
Hufbauer, Gary & Jeffrey Schott. 1994. Western Hemisphere Economic Integration.Washington: Institute for International Economics.
Hymer, Stephen & Robert Rowthorn. 1970. Multinational Corporations and International
Hymer e Efficiency (Contradictions) of Multinational Corporations.
Hymer tionalization of Capital. Journal of Economic Issues,
Hymer ternational Operations of National Firms: A Study of Direct
Hymerand J. van Liere, editors, The
op 100
IISD-W
ILO. 1 Cone: Mercosur: The impact of economic
Industr ol 3(10), December. Ottawa.
pean Economic Review, 32:
Jessop l Embeddedness of the Economy and Its Implications for
s Studies, 8(1): 23-32.
Global
Johnso
Jovano
mics, vol. 6: 95-97.
Kindle orporation.Columbia Journal of World Business, 1, pp. 65-73.
Hufbauer, Gary. 1990. Europe 1992 : An American Perspective. DC, Brookings.
Oligopoly: the non-American Challenge. In: C. Kindleberger, editor, TheInternational Corporation. Cambridge, MA: MIT Press. , Stephen. 1970. ThAmerican Economic Review, vol 60, no 2: 441-448. , Stephen. 1972. The Internavol 6, no 1: 91-111. , Stephen. 1976. The InForeign Investment. Cambridge, MA: MIT Press (PhD thesis from 1960). , Stephen. 1979. The Multinational Corporation and the International Division of Labor. In: R.B. Cohen, N. Felton, M. NkosiMultinational Corporation: A Radical Approach. Cambridge University Press: Cambridge, UK.
Ietto-Gilles, Grazia. 1998. Different conceptual frameworks in the assessment of the degree of internationalization: empirical analysis of various indices for the tTNCs. Transnational Corporations 7(1). WF. 2001. Private Rights, Public Concerns: A Guide to NAFTA’s Controversial
Chapter on Investor Rights. Canada.997. Common Market of the Southernintegration: a case study. y Canada. 2001. Monthly Trade Bulletin, v
Jacquemin, Alexis & André Sapir. 1988. International Trade and Integration of theEuropean Community: An Econometric Analysis. Euro
1439-49., Bob. 1999. The SociaEconomic Governance. In: F. Adaman & P. Devine, eds., The Socially Embedded
Economy, Montreal: Black Rose Books.Johanson, J. & J-E. Vahlne. 1977. The Internationalization Process of the Firm – a Model
of Knowledge Development and Increasing Foreign Market Commitments. Journalof International Busines
Johanson, J. & L.-G. Mattsson. 1988. Internationalization in Industrial Systems – aNetwork Approach. In: N. Hood & J.-E. Vahlne, editors, Strategies in
Competition. New York: Croom Helm.n, Debra & Colin Turner. 2000. European Business: Policy Challenges for the New
Commercial Environment. London: Routledge.Jovanovic, Miroslav. 1992. International Economic Integration. London: Routledge.
vic, Miroslav. 2001. Geography of Production and Economic Integration. London:Routledge.
Kemp, Murray & Henry Wan, Jr. 1976. An elementary proposition concerning theformation of Customs Unions. Journal of International Econo
Keohane, Robert. 1984. After Hegemony. Princeton, NJ: Princeton University Press. berger, Charles. 1966. European integration and the international c
308
References
Kindleberger, Charles. 1969. American Business Abroad: Six Lectures on Direct
Investment. New Haven: Yale University Press. rbocker, Fredrick. 1973. Oligopolistic ReacKnicke tion and Multinational Enterprise.
Kobrinonal Studies Quarterly, 28(3): 329-48.
ent Journal, 12: 17-31.
ation. Journal of International Business Studies, Vol.
Kogut, ional Value-Added Chain and 51-168.
Krasneton University Press.
Krugm phy and Trade. Cambridge, MA: MIT Press.
Policy. Cambridge, MA: MIT Press.
ions in Regional Integration. Cambridge, MA:
Krugm
orld Bank Conference on Development in Latin America and the
Lake, relational contracting approach. In: A. Prakash
Lall, Sanjaya. 1976. Theories of Direct Foreign Private Investment and Multinational
Lane, s and
Lazoni l and international
Leame NBER
Boston, MA: Division of Research, Harvard University., Stephen. 1984. Expropriation as an Attempt to Control Foreign Firms in LDCs:Trends from 1960-79. Internati
Kobrin, Stephen. 1987. Testing the Bargaining Hypothesis in the Manufacturing Sector inDeveloping Countries. International Organization, vol. 41(4): 609-38.
Kobrin, Stephen. 1991. An Empirical Analysis of the Determinants of Global Integration.Strategic Managem
Kogut, Bruce & Udo Zander. 1993. Knowledge of the Firm and the Evolutionary Theoryof the Multinational Corpor24(4): 625-46.Bruce. 1984. Normative Observations on the InternatStrategic Groups. Journal of International Business Studies, vol. 15(2): 1
KPMG. 2000. Euro report. KPMG.r, Stephen. 1978. Defending the National Interest: Raw Materials, Investments and
US Foreign Policy. Princeton, NJ: PrinceKrugman, Paul. 1986. Strategic Trade Policy and the New International Economics.
Cambridge MA: MIT Press.Krugman, Paul. 1990. Increasing Returns and Economic Geography. NBER Working
Papers 3275, National Bureau of Economic Research.an, Paul. 1991a. Geogra
Krugman, Paul. 1991b. Is bilateralism bad? In: E. Helpman and A. Razin, editors,International Trade and Trade
Krugman, Paul. 1993. Regionalism vs. multilateralism: analytical notes. In J. de Melo &A. Panagariya, editors, New Dimens
Cambridge University Press. an, Paul. 1994. Competitiveness: a dangerous obsession. Foreign Affairs. March-April: 28-44.
Kwok, C. & Reeb, D. 2000. Internationalization and firm risk. Journal of InternationalBusiness Studies, vol. 31(4): 611-629.
Laird, Sam. 1997. Mercosur: Objectives and Achievements. WTO Paper presented at ThirdAnnual WCaribbean, June 29 - July 1, 1997, Montevideo, Uruguay.David. 1999. Global governance: aand J. Hart, editors, Globalization and Governance. London: Routledge.
Behaviour. Economic and Political Weekly, 11: 31-3. Christel. 1992. In: R.Whitley, editor, 1992. European Business Systems: Firm
Markets in their National Contexts. London: Sage Publications.ck, William & M. O’Sullivan, 1996. Organizational, financiacompetition. Industrial and Corporate Change, 5 (1) pp. 1-49. r, Edward. 1995. In search of Stolper-Samuelson effects on US wages.Research Paper no. 5427.
309
References
Leaver, Richard. 1994. International political economy and the changing world order:evolution or involution? In: R. Stubbs & G. Underhill, editors, Political Economy
d data. NBER Working Paper Series, no. 8665. Cambridge,
System.
Lipsey
Lu, J.W n and performance: an examination of the
. Foray & a. C. Freeman, editors, Technology and the
on: Pinter
Lung,. Lung & Rob van Tulder, editors. Cars, Carriers of Regionalism.
Lustig, D.C.: The Brookings Institution.
Marku eral-Equilibrium Approaches to the
Marku ultinational Enterprises and the Theory of
Marku ernational Business. In: A. ness.
Martin, Andrew. 1994. Labour and the Keynesian state. In: R. Stubbs & G. Underhill, editors, Political Economy and the Changing Global Order. London: MacMillan.
Mattli, Walter. 1999a. Explaining regional outcomes. Journal of European Public Policy,6(1): 1-27.
and the Changing Global Order. London: MacMillan. Lee, K.C. & Kwok, C. 1988. Multinational corporations vs. domestic corporations:
international environmental factors and determinants of capital structure. Journal ofInternational Business Studies, vol. 19(2): 195-217.
Levy, Philip. 2000. Assymetric Information and Inference from Free Trade Agreements.Unpublished Working Paper.
Lipsey, R. 2001. Foreign direct investment and the operations of multinational firms:concepts, history anMA: National Bureau of Economic Research. Abbott, Frederick. 1999. The NorthAmerican Integration Regime and Its Implications for the World TradingJean Monnet Working Paper no. 2/99., Richard. 1997. Globalization and National Government Policies. In: J. Dunning,editor, Governments, Globalization and International Business. Oxford UniversityPress.
Lipsey, Robert. 1990. American Firms Facing Europe: 1992. In: M. Feldstein and Y. Kosai, editors, US-Japan Economic Forum. Cambridge, MA: NBER. . & Beamish, P. 2000. Internationalizatio
different effects of exporting and FDI. Paper presented at Academy ofManagement, Toronto.
Lundvall, B. 1993. User-producer Relationships, National Systems of Innovation andInternationalization. In: DWealth of Nations: The Dynamics of Constructed Advantage. LondPublishers.Yannick & Rob van Tulder. 2004. In Search of a Viable Automobile Space. In: J. Carillo, YPalgrave.
, Nora, Barry Bosworth & Robert Lawrence, editors. 1992. Assessing the Impact of
North American Free Trade. WashingtonMansfield, Edward & Helen Milner. 2000. The New Wave of Regionalism. International
Organization, 53(3): 589-627. sen, James R. & Keith E. Maskus. 2001. GenMultinational Firm: A Review of Theory and Evidence. Draft paper presented atNBER, March 2001. sen, James. 1995. The Boundaries of MInternational Trade. Journal of Economic Perspectives, 9(2): 169-189. sen, James. 2001. International Trade Theory and IntRugman & T. Brewer, editors, The Oxford Handbook of International BusiOxford, UK: Oxford University Press.
Mattli, Walter. 1999b. The Logic of European Integration: Europe and Beyond.Cambridge, UK: Cambridge University Press.
310
References
McCall Smith, James. 2000. The politics of dispute settlement design: explaining legalismin Regional Trade Pacts. International Organization, 54(1).
mic Integration. (2 ed.).
McDo den, editors,
McGil th customs
ty, April 2000.
McLaren, John. 2000. Free trade agreements, customs unions and the dynamics of political influence. Paper presented at the Leitner Conference on Political and Economic
on, Yale University, April 2000.
Melin, egic Management
Merrid le’ is the Single Market ? Management Review, vol.
Messe l Economy of Protection:
Meunier, Sophie. 2000. What single voice? European institutions and EU-US tradenegotiations. International Organization, 54(1).
Government as Constraints on Trade
Milnerress.
Mokyr ivity and Economic Progress.
Molle, investment. In B.
Molle, mics of European Integration: Theory, Practice, Policy.(4 ed.) Aldershot, UK: Ashgate.
McDonald, Frank & Margaret Potton. 1994. Industrial policy in the EU. In: FrankMcDonald & Stephen Dearden, editors, European Econo nd
London: Longman.nald, Frank. 1994. Introduction. In: Frank Macdonald & Stephen DearEuropean Economic Integration. (2nd ed.). London: Longman.vray, Fiona. 2000. Bargaining leverage for smaller states: south-souunions. Paper presented at the Leitner Conference on Political and EconomicAspects of Regional Integration, Yale Universi
McGinnis, Michael. 1999. Rent-seeking, Redistribution and Reform in the Governance ofGlobal Markets. In: A. Prakash & J. Hart, editors, Globalization and Governance.London: Routledge.
Aspects of Regional IntegratiMeade, James. 1956. The Theory of Customs Unions. Amsterdam: North Holland.
Leif. 1992. Internationalization as a Strategy Process. Strat
Journal, vol. 13: 99-118. en, Trevor. 1998. How ‘sing87(3): 27-31.
rlin, Patrick. 1983. Bureaucracies and the PoliticaReflections of a Continental European. World Bank.
Michel, A. & Shaked, I. 1986. Multinational coporations vs. domestic corporations: financial performance and chracteristics. Journal of International Business Studies,13(4): 18-25.
Miller, Danny. 1996. Configurations Revisited. Strategic Management Journal, vol. 17(7):505-512.
Milner, Helen & Peter B. Rosendorff. 1997. Democratic Politics and International Trade Negotiations: Elections and DividedLiberalization. The Journal of Conflict Resolution, vol. 41(1): 117-146. , Helen. 1988. Resisting Protectionism: Global Industries and the Politics of
International Trade. Princeton, NJ: Princeton University PMintzberg, Henry & J. Waters. 1998. Of strategies, deliberate and emergent. In S. Segal-
Horn, editor, The Strategy Reader. Oxford: Blackwell Publishers.Mitrany, David. 1975. A Functional Theory of Politics. London: Robertson.
, Joel. 1990. The Lever of Riches: Technological CreatNew York : Oxford University Press. Willem & Robert Morsink. 1991. Intra-European direct
Bürgenmeier & J. Mucchielli, editors, Multinationals and Europe 1992: Strategiesfor the Future. London: Routledge.
Molle, Willem. 1990. The Economics of European Integration. Aldershot: Dartmouth.Willem. 2000. The Econo
th
311
References
Moran, Theodore. 1985. Multinational Corporations: The Political Economy of Foreign
Direct Investment. Lexington: D.C. Heath.csik, Andrew. 1998. The Choice for Europe: Social PuMorav rpose and State Power from
MoravInternational Organization 45,
Winter 1991: 25-6. Morrison, Allen and Kendall Roth. 1992. The Regional Solution: an Alternative to
Morris
Morsintterdam.
: Routledge.
iness Review,
Munde
Nelson University Press.
Nobes rker, R., editors. 2000. Comparative international accounting. 6 ed.
North, mance.
North, e Journal of Economic Perspectives, 5(1): 97-112.
Ogata, Responses. The Group of Thirty, Washington, D.C.
Ostry, orations in a Shrinking World: Trade and
. 32(3): 479-496.
omy of Regionalism. New York: Columbia University Press.
Messina to Maastricht. Ithaca, NY: Cornell University Press. scik, Andrew. 1991. Negotiating the Single European Act: national interests and conventional statecraft in the European Community.
Globalization. Transnational Corporations, vol. 1(2):on, Allen. 1990. Strategies for Global Industries: How US Businesses Compete.New York: Quorum Books.k, Robert. 1997. Corporate Networking and Foreign Direct Investment. PhD Dissertation, Erasmus University of Ro
Mucchielli, J. Strategic Advantages for European Firms. In B. Bürgenmeier & J.Mucchielli, editors, Multinationals and Europe 1992: Strategies for the Future.London
Muller, Alan & Rob van Tulder. 2002. Macro Intentions, Micro Realities: a Two-levelStrategic Approach to the Single European Market. Multinational Bus
vol. X(2): 1-10. ll, Robert. 1961. A Theory of Optimum Currency Areas. American Economic
Review, 51, November: 509-17. Nelson and Winter, 1982. An Evolutionary Theory of Economic Change. Cambridge, MA:
Belknap Press. , Richard, editor. 1993. National Innovation Systems: A Comparative Analysis. New York: Oxford
Neto, Raul de Gouvea. 1998. Mercosur: fostering regional economic integration.Thunderbird International Business Review, Vol. 40 (6), pp. 585-604
, C. & PaLondon: Prentice Hall.Douglass. 1985. Institutions, Institutional Change and Economic Perfor
Cambridge, UK: Cambridge University Press. Douglass. 1991. Institutions. Th
OECD. 1996. Regionalism and its Place in the Multilateral Trading System. Paris: OECD. S. 1999. Changes in Japanese corporations. In: The Evolving Corporation: Global
Imperatives and National
Ohmae, Kenichi. 1990. The Borderless World: Power and Strategy in the GlobalMarketplace. London: Collins.
Orme, William A. 1996. Understanding NAFTA: Mexico, Free Trade and the New North
America. Austin, TX: University of Texas Press. Sylvia. 1990. Governments and Corp
Innovation Policies in the US, Europe and Japan. New York: Council on ForeignRelations.
Oxley, J. & Schnietz, K. 2001. Globalization derailed? Journal of International Business
Studies, volPadoan, Pier C. 1997. Regional agreements as clubs: the European case. In: E. Mansfield
and H. Milner, editors, The Political Econ
312
References
Padoa-Schioppa, Tommaso et al. 1987. Efficiency, Stability, and Equity: a Strategy for the
Evolution of the Economic System of the European Community. Oxford University
Panagaunions. In R. Feenstra, G. Grossman & D. Irwin, editors, The
Pani , nomic policy. In B.
Pani , ng role of
Pasque nal Market Integration in North America and Corporate Social
Pauwelrical Extreme. In: C.
Peck, 91. Regulation Theory and the Geographies of Flexible
ersity of Manchester School of Geography.
allen FIM Working Paper.
al Affairs.
People Sugden. 2000. Divide and Rule by Transnational Corporations.
: London.
Perrou of
Phelps de, Investment and
Piore, : Possibilities for
Porter, Michael. 1985. Competitive Advantage. New York: Free Press. Porter, Michael. 1986. Competition in Global Industries: A Conceptual Framework. In M.
Porter, ntage of Nations. New York: Free Press. ool
Press, London. riya, Arvind & Robert Findlay. 1996. A political economy analysis of free-trade areas and customsPolitical Economy of Trade Policy. London: MIT Press. Mi a. 1991. The impact of multinationals on national ecoBürgenmeier & J. Mucchielli, editors, Multinationals and Europe 1992: Strategiesfor the Future. London: Routledge.Mi a. 1995. International economic integration and the changi
governments. In: Chang, H. and R. Rowthorn, editors, The Role of the State inEconomic Change. Oxford, UK: Clarendon Press. ro, Jean. 2000. RegioManagement. Business & Society, vol. 39(1): 6-23. s, Pieter & Paul Matthyssens. 2001. Toward a (More) Dynamic Theory of Internationalization: International Market Withdrawal as EmpiAxinn & P. Matthyssens, editors, Reassessing the International Firm. Series: Advances in International Marketing, vol. 11. Amsterdam: Elsevier.
Jamie & Adam Tickell. 19Accumulation: Transitions in Capitalism, Transitions in Theory. SPA WorkingPaper 12, Univ
Peck, S., W. Ruigrok & C. van der Linde. 2000. Strange Bedfellows? Foreigners on Boards and Top Management Teams. Universität St. G
Pelkmans, Jacques & L. Alan Winters. 1988. Europe’s Domestic Market. Chatham House Paper 43, London: Royal Institute for Internation
Pelkmans, Jacques. 1997. European Integration: Methods and Economic Analysis. The Netherlands: Longman.s, James & RogerIn: C. Pitelis and R. Sugden, eds. The Nature of the Transnational Firm. 2nd edition,Routledge
Perlmutter, H. & Heenan, D. 1979. Multinational organization development. Reading, MA: Addison-Wesley.x, François. 1950. Economic Space: Theory and Applications. Quarterly JournalEconomics, vol. 64: 89-104. , Nicholas. 1997. Multinationals and European Integration: Tra
Regional Development. London: Jessica Kingsley.Michael J. & Charles F. Sabel. 1984. The Second Industrial Divide
Prosperity. USA: Basic Books.
Porter, ed., Competition in Global Industries. Boston, MA: Harvard UniversityPress.Michael. 1990. The Competitive Adva
Porter, Michael. 1998. Clusters and Competition. Boston, MA: Harvard Business SchPress.
313
References
Prahalad, C.K. & Gary Hamel. 1994. Strategy as a Field of Study: Why Search for a newParadigm? Strategic Management Journal, vol. 15, (Summer); Special Issue:
Prahal orporation. Harvard
Prahalew York: Free Press.
rnance. London: Routledge.
. Volume 11(2): 231-250.
.
Putnam iplomacy and domestic politics: the logic of two-level games.
Qian,the largest U.S. firms. Journal of International Management, 4(2):
Ramas . 1996. Measuring the degree of
1): 167-177.
c Dynamism in the Asia-Pacific: The Growth of
Rein, M , C. Hirschon
d Theoretical Crossroads. Cambridge: University Press.
Rubery and
Rugman, Alan & Alain Verbeke. 1991. Competitive strategies for non-European firms. In
niversity of South Carolina Press.
, vol. 7(2): 75-80.
Strategy: Search for New Paradigms: 5-16. ad, C. K. & Gary Hamel. 1990. The Core Competence of the CBusiness Review, Vol. 68, No. 5/6.
ad, C.K. & Yves Doz. 1987. The Multinational Mission: Balancing Local Demands
and Global Vision. NPrakash, Aseem & Jeffrey Hart. 1999. Globalization and governance: an introduction. In:
A. Prakash and J. Hart, editors, Globalization and Gove
Proff, Heike. 2002. Business Unit Strategies between Regionalisation and Globalisation.International Business Review
Prusa, Thomas & Susan Skeath. 2001. The economic and strategic motives for antidumping filings. NBER Working Paper 8424
Public Citizen. 1997. NAFTA’s Broken Promises: Failure to Create US Jobs.http://www.publiccitizen.org/trade/nafta/jobs/articles.cfm?ID=1767 (9/12/2003) , Robert D. 1988. DInternational Organization 42(3): 427-60. G. & Li, J. 1998. Multinationality, global market diversification, and riskperformance for149-70.wamy, K.,. Galen Kroeck, K. & Renforth, Winternationalization of a firm: a comment. Journal of International BusinessStudies, vol. 27(
Ramstetter, E.D. 1998. Measuring the size of foreign multinationals in the Asia-Pacific.In Thompson, G., editor, EconomiIntegration and Competitiveness. London & New York: Routledge.. & D. Schön. 1991. Frame-reflective policy discourse. In P. Wagner
Weiss, B. Wittrock & H. Wollman, editors, Social Science and Modern States,National Experiences an
Reynolds, Michael. 1995. Proceedings against Unilever. International Financial Law
Review, vol. 14(4): 63. Robson, Peter, editor. 1993. Transnational Corporations and Regional Economic
Integration. United Nations’ Library on Transnational Corporations, vol. 9.London: Routledge., J. 1994. The British production regime: a societal-specific system? Economy
Society, 23 (3) pp. 355-73.
B. Bürgenmeier & J. Mucchielli, editors, Multinationals and Europe 1992:
Strategies for the Future. London: Routledge.Rugman, Alan & Alain Verbeke. 1994. Foreign Direct Investment and NAFTA: A
conceptual framework. In: Rugman, A., editor, Foreign Investment and NAFTA.Columbia: U
Rugman, Alan. 1976. Risk Reduction by International Diversification. Journal of
International Business Studies
Rugman, Alan. 2000. The End of Globalization. New York: Random House.
314
References
Ruigrok, Winfried & Hardy Wagner. 2003. Internationalization and Performance: An Organizational Learning Perspective. Management International Review, vol 43(1):63-83.
Ruigrok, Winfried & Rob van Tulder. 1995. The Logic of International Restructuring.London: Routledge.ald, Frédérique. 1993. Competitiveness and competition:Sachw which theory of the firm?
Sandho d the evolution of rules. In: A. Prakash & J.
Saudagnal Business Studies, vol. 26(2):
Scharp from German Federalism and
Schlie,
Schmal alensee &
Schmitter, Philippe. 1974. Still the Century of Corporatism? The Review of
Schmi
ess.
Scott, The Limits of Globalization: Cases and Arguments. London:
Scott, tions and Organizations. Thousand Oaks, CA: Sage
Shin, S and Foreign Direct Investment in the EU: The case of
Sietses ion of Big Dutch Business in the
.
SlagerSoskice, David. 1991. The institutional Infrastructure for international competitiveness: a
etta,
Stepha & Pfaffmann, E. 2001. Detecting the pitfalls of data on foreign directinvestment: scope and limits of FDI data. Management International Review, 41(2):189-218.
In F. Sachwald, editor, European integration and competitiveness: Acquisitions and
Alliances in Industry. Aldershot, UK: Edward Elgar Publishing.ltz, Wayne. 1999. Globalization anHart, editors, Globalization and Governance. London: Routledge.aran, S. & Biddle, G. 1995. Foreign listing location: a study of MNCs and stockexchanges in eight countries. Journal of Internatio
319-41.f, Fritz. 1988. The Joint-Decision Trap: LessonsEuropean Integration. Public Administration, 66(3): 239-278. Erik & George S. Yip, Regional Follows Global: Strategy Mixes in the World
Automotive Industry, European Management Journal, Vol. 18, No. 4: 343-354.ensee, Richard. 1989. Studies of Structure and Performance. In: R. SchmR. Willig, editors, Handbook of Industrial Organization, vol. II. Amsterdam: NorthHolland Press.
Politics, Vol.36, no.1: 93-94. tter, Philippe. 1996. Imagining the future of the Euro-polity with the help of newconcepts. in: Marks et al., eds. Governance in the European Union. London: Sage Publications, p. 121-150.
Schotter, Andrew. 1981. The Economic Theory of Social Institutions. New York:Cambridge University Pr
Schwartz, Herman. 1994. States versus Markets: History, Geography, and theDevelopment of the International Political Economy. New York: St. Martin’s Press. Alan (editor). 1997.Routledge.Richard. 1995. Institu
Publishing.. 1998. European Integration
the Korean consumer electronics industry. London: Routledge., Hugo. 2000. The Fragmented Interest RepresentatEuropean Union. Master’s Thesis, University of Rotterdam Faculty of BusinessStudies.
Single Market Review. 1997. Business Survey 1997. Luxembourg: CECSklair, Leslie. 2001. The Transnationalist Capitalist Class. Oxford: Blackwell.
, Alfred. 2004. The Internationalization of Banks. PhD Thesis, ERIM (Rotterdam)
comparative analysis of the UK and Germany. In: A.B. Atkinson & R. Bruneditors, Economics for the New Europe. New York: MacMillan.n, M.
315

References
Stone Sweet, Alec & Wayne Sandholtz. 1997. European Integration and SupranationalGovernance. Journal of European Public Policy, vol. 4(3): 297-317. rd, J.M., Dunning, J.H. & Haberich, K.O. 19Stopfo 92. Directory of multinationals. 4th ed.
Stopfo val States, Rival Firms: Competition for World
Strang e in the international political economy:
Strang rspective. In: J. Dunning,
m.
Sugden tional Considerations. In: C. Pitelis and
Sullivaonal Business Studies, vol. 2: 325-342.
Tallma 001. Strategy and the multinational enterprise. In A.
Ten N thesis, Faculty
UNCT
UNCT ent Report. Geneva.
Van de reldorde en Machtspolitiek. Amsterdam: Het Spinhuis.
n Business Systems: Firms and Markets in their
Van Ts of Regionalism. Palgrave.
Van T undaries. Rotterdam: Sviib/Erasmus
Van T ctories: The national and regionalea Eckhardt,
Holm-Detlev Koehler, Ludger Pries (editors) Global Players in lokalen Bindungen,Berlin: Edition Sigma, pp.53-79
Basingstoke: Macmillan.rd, John & Susan Strange. 1991. RiMarket Share. Cambridge: Cambridge University Press. e, Susan. 1994. Rethinking structural changstates, firms and diplomacy. In: R. Stubbs & G. Underhill, editors, PoliticalEconomy and the Changing Global Order. London: MacMillan.
Strange, Susan. 1995. The Defective State. Daedalus, 124(2), Spring: 55-74. e, Susan. 1997a. An international political economy peeditor, Governments, Globalization and International Business. Oxford UniversityPress.
Strange, Susan. 1997b. The future of global capitalism; or, will divergence persist forever?In: C. Crouch & W. Streeck, editors, Political Economy of Modern Capitalis
London: Sage Publications., Roger. 1991. The Importance of DistribuR. Sugden, eds. The Nature of the Transnational Firm. Routledge: London. n, Daniel. 1994. Measuring the degree of internationalization of a firm. Journal ofInternati
Sullivan, Daniel. 1996. Measuring the degree of internationalization of a firm: a reply. Journal of International Business Studies, vol. 27(1): 179-192. n, Stephen & George Yip. 2Rugman & T. Brewer, editors, The Oxford Handbook of International Business.Oxford: Oxford University Press.
apel, Stephanie. 1998. SADC and the TNCs: Crossing Borders? MAof Business Studies, Erasmus Universiteit Rotterdam.AD. 1996. Handbook of Economic Integration and Cooperation Groupings of Developing Countries: Vol. 1. Geneva..
UNCTAD. 1997. World Investment Report. Geneva. AD. 1998. World Investm
Van den Berghe, Douglas. 2003. Working Across Borders: Multinational Enterprises and
the Internationalization of Employment. Rotterdam: ERIM. r Pijl, Kees. 1992. We
Van Iterson, A. & R. Olie. 1992. European Business Systems: the Dutch Case. In:R.Whitley, editor, EuropeaNational Contexts. London: Sage Publications.
ulder, Rob & Denis Audet. 2004. The Faster Lane of Regionalism. In: J. Carillo, Y. Lung & Rob van Tulder, editors. Cars, Carrier
Van Tulder, Rob, Douglas van den Berghe & Alan Muller. 2001. The Scoreboard of Core
Companies. ERIM, Rotterdam.ulder, Rob. 1999. Redrawing Organizational BoUniversity Rotterdam.ulder, Rob. 1999. Rival Internationalisation Trajeembeddedness of core firms' internationalisation strategies In: Andr
316
References
Vernon, Raymond. 1966. International Investment and International Trade in the ProductCycle. Quarterly Journal of Economics, pp. 190-207. , RaymVernon ond. 1971. Sovereignty at Bay: The Multinational Spread of US Enterprises.
Vernon overeignty at Bay: 20 Years After. In L. Eden, editor,
Vernonof Calgary Press.
Waltz, Theory of International Politics. Reading, MA: Addison-Wesley.
n:
Weintr: A Trinational Analysis. Vancouver, BC: The Fraser Institute.
itors, Assessing the Impact of North American Free
Weisfech Tradition. In: C. Axinn & P. Matthyssens, editors,
Whitley, Richard & Peer Hull Kristensen, editors. 1996. The Changing European Firm:Limits to Convergence. London: Routledge.
f Economic Relations. Oxford: Oxford University Press.
texts. London: Sage Publications.
Wilkin 983. Productive systems. Cambridge Journal of Economics, 7 (3-4) pp.
ompetition
Centre for Economic Policy Research.
New York: Basic Books, Inc., Raymond. 1993. SMultinationals In the Global Political Economy. London: MacMillan Press. , Raymond. 1994. Multinationals and governments: key actors in the NAFTA. In: L. Eden, editor, Multinationals in North America. Calgary: Univ.
Vernon, Raymond. 1998. In the Hurricane’s Eye. Cambridge, MA: Harvard UniversityPress.
Viner, Jacob. 1950. The Customs Union Issue. New York: Carnegie Endowment for International Peace. Kenneth. 1979.
Wartick, Steven & Donna Wood. 1998. International Business & Society. Oxford: Blackwell Publishers.
Waverman, L.. 1991. Strategic Trade Policy and 1992. In B. Bürgenmeier & J. Mucchielli, editors, Multinationals and Europe 1992: Strategies for the Future. LondoRoutledge.aub, Sidney. 1992. NAFTA: A US Perspective. In: S. Globerman & M. Walker,editors, NAFTA
Weintraub, Sidney. 1993. Modeling the Industrial Effects of NAFTA. In: N. Lustig, B.Bosworth & R. Lawrence, edTrade. Washington, DC: The Brookings Institution. lder, Christine. 2001. Internationalization and the Multinational Enterprise:Development of a ResearReassessing the International Firm. Series: Advances in International Marketing,vol. 11. Amsterdam: Elsevier.
Whitley, Richard & Peer Hull Kristensen, editors. 1997. Governance at Work: the Social
Regulation oWhitley, Richard, editor. 1992. European Business Systems: Firms and Markets in their
National ConWhitley, Richard. 1994. Dominant forms of economic organization in market economies.
In: Organization Studies, vol. 15(2) pp. 153-182. Whitley, Richard. 1999. Divergent Capitalism. The Social Structuring and Change of
Business Systems. Oxford: Oxford University Press. son, F. 1413-30.
Willenbockel, Dirk. 1994. Applied General Equilibrium Modelling: Imperfect C
and European Integration. Chichester, UK: Wiley.Winters, Alan L. 1993. The European Union: a case of successful integration? In: J. de
Melo & A. Panagariya, editors, New Dimensions in Regional Integration.Cambridge: Cambridge University Press.
Winters, Alan L. 1999. Regionalism versus Multilateralism. In: R. Baldwin, D. Cohen, A. Sapir and A. Venables, editors, Market Integration, Regionalism and the Global
Economy. London:
317
References
Winters, L. Alan & Anthony Venables. 1991. European Integration: Trade and Industry.London: Cambridge University Press.
Winters, L. Alan. 1992. Trade Flows and Trade Policy after 1992. London: CambridgeUniversity Press.
WTO. 1995. Regionalism and the World Trading System. Switzerland: Geneva. 2000. Mapping of Regional Trade Agreements. WT/REGWTO. /W/41, 11 October 2000.
Yanno et. In: J. Cantwell,ction in the
Yetati,rint for Mercosur? mimeo, Universidad Torcutato di Tella Business School.
Yoshid Masayuki Nohara and Kimitoshi Sato. 1994. Regional
ion.
Young ion: the European Union and the
Young tionals. Aldershot,
Zou, Sarketing, 30(1): 52-69.
Yamin, Mohammad. 1991. Hymer’s Contribution to TNC Theory. In: C. Pitelis and R.Sugden, eds. The Nature of the Transnational Firm. Routledge: London. poulos, G. 1992. Multinational Corporations and the Single Markeditor. Multinational Investment in Modern Europe: Strategic Intera
Integrated Community. Aldershot UK: Edward Elgar. Eduardo & Frederico Sturzenegger. 1999. The Euro and Latin America III: Is EMUa Bluep
Yeung, M. & N. Perdikis. 1999. Regional Trading Blocs in the Global Economy: The EU
and ASEAN. Cheltenam, UK: Elgar Publishing.a, Masami, Ichiro Akimune,Economic Integration in East Asia: Special Features and Policy Implications. In: V. Cable & D. Henderson, editors, Trade Blocs? The Future of Regional Integrat
London: The Royal Institute of International Affairs. , Alisdair. 2001. Extending European Cooperat‘New’ International Trade Agenda. Workshop Paper, ECPR Joint Sessions, April., Stephen. & J. Hamill, editors. 1992. Europe and the MultinaUK: Edward Elgar. . & T. Cavusgil. 1996. Global Strategy: A Review and an Integrated ConceptualFramework. European Journal of M
Zylbersztajn, D. & M. S. Jank. 1998. Agribusiness in Mercosur: Building NewInstitutional Apparatus. Agribusiness, 14 (4).
318
SAMENVATTING (IN DUTCH)
Het fenomeen ‘globalisering’, door velen in verband gebracht met liberalisering, vrijhandelen sterk toegenomen internationale investeringen, is een van de meest besproken – maarook een van de slechts begrepen – begrippen van de jaren negentig. Er wordt vaak gedachtaan multinationale ondernemingen, die een steeds grotere reikwijdte zouden hebben ensteeds beter in staat zouden zijn hun productie over de hele wereld te kunnen verplaatsen.
e overheden zien hierin een dreiging voor hun eigen beleid en proberen viaNationalinternationale- of supranationale afspraken vat te krijgen op de mondiale economie en de
ontwik
ze de u
dat iswetens
werkel
heel an
positie van hun eigen economie en ondernemingen daarin zeker te stellen. Paradoxaal wellicht, is een van de meest voorkomende vormen van supranationale samenwerkingdaarbij marktintegratie op regionale schaal.De sterke groei in de jaren negentig van het aantal regionale integratieovereenkomsten(‘Regional Integration Agreements’, of RIAs), heeft ervoor gezorgd dat ‘regionalisering’weer hoog op de agenda staat als onderwerp van onderzoek en theorievorming. De ‘eerstegolf’ van regionalisering vond plaats in de jaren zestig en zeventig, vooral tussen
kelingslanden en werd veelal beschouwd als een mislukking. De huidige ‘tweedegolf’ verschilt van de eerste golf in meerdere opzichten en is veelzijdiger, waardoor het als fenomeen op zich al veel complexer is. De betekenis van integratie kan daarbij opverschillende manieren worden geanalyseerd en opgevat; soms positief, soms negatief en soms gewoon als ‘niets nieuws onder de zon’. Zijn RIAs duurzaam – here to stay – of zijn
iting van politiek realisme, improvisatietalent en korte-termijn denken? Zijn ze eenstap naar globalisering, of juist barrière daartoe? De verwarring is groot omdat de huidigenetwerkeconomie geen makkelijke eenduidige antwoorden toelaat, maar vooral ook – en
de insteek van deze studie – omdat de complexiteit van het probleem in zowelchap, bedrijfsstrategie als beleid onderschat wordt.
Regionale integratie kan worden gezien als een proces van internationale herstructurering,waarbij nieuwe instituties vorm krijgen door het gedrag van – en interacties tussen – verschillende belanghebbende actoren. Ondernemingen en overheden zijn daarbij debelangrijkste actoren. Het begrijpen van internationale herstructureringsprocessen en hun uitkomst is daarmee onderhevig aan de spanning tussen verschillende analyseniveaus. Nationale overheden percipiëren ‘de’ wereld namelijk op macroniveau, omdat ditnoodzakelijk is voor het formuleren van beleid op het niveau van samenlevingen en geheleeconomieën. Ondernemingen daarentegen opereren vanuit een micro-perspectief, vooralrekening houdend met hun eigen belangen en die van hun partners in de waardeketen en de concurrenten. Strategische belangen van overheden en ondernemingen kunnen sterkverschillen, terwijl ze wel verweven zijn door de tijd en ruimte. In de praktijk blijkt vaak dat overheden en ondernemingen dezelfde strategische intenties noch dezelfde perceptie van de werkelijkheid delen.De interactie tussen percepties en intenties bepaalt echter in sterke mate het succes van de uitkomst van de gekozen strategieën. Als actoren in een dynamisch proces hebbenoverheden en ondernemingen percepties van elkaars strategische intenties en strategische
ijkheid. Hierdoor kunnen deze actoren elkaar verkeerd inschatten en uitgaan van foutieve assumpties. Overheden kunnen bijvoorbeeld beleid aannemen met de verwachtingdat ondernemingen op een bepaalde manier zullen reageren, terwijl ondernemingen daar
ders over denken – of daar nog geen specifieke gedachten over hebben. Dit kan
319
Samenvatting
gevolgen hebben voor de uitkomsten van herstructureringsprocessen, vooral in termen van mtelijke configuratie van economische actde rui iviteit en de daarmee gepaard gaande
verdeling van economische- en maatschappelijke meerwaarde. Machtsverhoudingen spelenbij dergelijke verdelingsvraagstukken altijd een rol. Een relatief kleine groep
, politieke
Interna een spel
zowelDe me egionale integratie vertonen
opzich
ratione welvaart. Integratie kan echter ook
integraRegionmaar e ouden met de daadwerkelijke
overee t
gebase acro-economische modellen van de werkelijkheid,
sprake van rationaliteit wordt
Op een microniveaus aan elkaar probeert tekoppelen schaars gebleven. Theorievorming op het gebied van internationalisering richtzich bijna uitsluitend op de kenmerken van ondernemingen en gaat zelden in op dediscussie over ‘locatie’ op zich. Empirisch onderzoek komt vaak niet verder dan geaggregeerde data en verwachtingen, vooral op basis van stromen van directebuitenlandse investeringen (DBI). DBI is misschien een indicator vanondernemingsactiviteit, maar zegt weinig over de vraag wie internationaliseert en waarom.Andere studies gaan wel in op de motieven van ondernemingen maar behandelen de argumenten achter regionale integratie vaak oppervlakkig. Kleinschalig onderzoek gerichtop een bepaalde regio en een bepaalde sector (zoals de automobiel- of de textielindustrie)komt wel voor, maar plaatst de analyse zelden in een breder (politiek-economisch)raamwerk. Deze studie hoort bij een nieuwe onderzoeksagenda die meer aandacht schenkt aan de geografische spreiding van economische activiteit binnen de context van ondernemingsstrategieën.In de onderzoeksvraag van deze studie is regionale integratie nadrukkelijk benaderd als een institutionele en economische uitkomst gerealiseerd door het strategisch gedrag van ondernemingen en overheden. De studie gaat specifiek in op de misvattingen die kunnen bestaan tussen macro- en micro en hoe gerealiseerde uitkomsten kunnen verschillen van de verwachte uitkomsten. De overkoepelende vraag luidt als volgt:
‘kernondernemingen’, meestal grote bedrijven met sleutelposities in de economievisie en toegang tot politieke actoren, geven bepaalde politieke trajecten niet alleenlegitimiteit, maar bepalen ook in sterke mate hun effectiviteit van implementatie.
tionale politieke- en economische herstructurering is in de praktijk vaakmet een relatief beperkt aantal spelers, gekenmerkt door oligopolistische ‘concurrentie’ op
macro- als microniveau.est gangbare wetenschappelijke benaderingen van r
vanuit dit perspectief tekortkomingen in zowel descriptief, prescriptief als voorspellendt. Ten eerste wordt integratie vaak als een eenvoudige zaak gezien. In menig model
worden RIAs zelfs als exogeen gezien (niet beïnvloedbaar door de spelers), of als eenle beslissing gericht op een maximalisering van
als wenselijk worden gezien in een politiek-realistische benadering waarin regionaletie belangrijk is om macht te genereren in de concurrentie tussen regionale blokken.ale integratie is dan zeker geen ‘tweederangs’ aanpak van mondiale vrijhandel,en doel op zich. Ten tweede wordt zelden rekening geh
strategieën van ondernemingen, noch als actoren betrokken bij de totstandkoming van denkomst, noch als strategisch diverse spelers in een herstructureringsspel me
mogelijk ‘sub-optimale’ uitkomsten. Veel Regionale Integratie Overeenkomsten zijnerd op sterk geabstraheerde m
waarbij het ondernemingsstrategisch niveau er tamelijk bekaaid van af komt, er nauwelijksis van meerdere strategieën en ondernemers een hoge vorm
toegedicht die in de bedrijfskundige literatuur zelden wordt aangetroffen.paar studies na, is onderzoek dat macro en
320

Samenvatting
In hoeverre organiseren ondernemingen na
tegratie de geografische spreiding van
ar aanleiding van de tweede golf van regionale
hun activiteiten op de manier die overheden inverwachten, en welke conclusies kunnen we hieruit trekken voor de betekenis en
duurzaamheid van regionale integratie als strategie voor internationale herstructurering?
Deze vraag is onderzocht door de achtergronden van verschillende RIAs te onderzoeken. De gemeenschappelijke markt, of ‘Single European Market’ (SEM) in Europa en de vrijhandelsovereenkomst in Noord Amerika, het North American Free Trade Agreement(NAFTA) zijn van alle RIAs veruit de twee belangrijkste. Achterliggende motieven van overheden voor regionale integratie zijn geanalyseerd naar de verwachte uitkomsten intermen van regionale ‘openheid’. Openheid heeft betrekking tot de effecten van integratieop verschuiving in productie 1) binnen de regio door lokale (regionale) ondernemingen(‘inside-in’); 2) naar de regio door ondernemingen van buiten de regio (‘outside-in’); 3) naar buiten toe door regionale ondernemingen (‘inside-out’); en als laatste 4)verschuivingen tussen niet-lidstaten door spelers van buiten de regio (‘outside-out’).‘Openheid’ is ten eerste bekeken aan de hand van handels- en investeringsdata om tekijken of macro-data de macro-verwachtingen onderbouwen. Uit de analyse vaninternationale handelsdata wordt bijvoorbeeld duidelijk dat Europa naar binnen toegekeerd is omdat intra-regionale handel veel omvangrijker is dan handel met partnersbuiten de regio. De NAFTA-landen daarentegen waren van oudsher naar buiten gericht,maar zijn dat sinds 1997 niet meer. De relatieve geslotenheid van ’s werelds tweebelangrijkste regio’s staat in schril contrast met de oriëntatie van andere regio’s zoals de Mercado Común del Sur (Mercosur), de Association of South East Asian Nations
(ASEAN) en de Southern African Development Community (SADC), die allemaal erg naarbuiten toe gericht waren en dat onder de tweede regionaliseringsgolf steeds meer zijngeworden.Tegelijkertijd laten internationale investeringsstromen zien dat Europese economieënnauwelijks een externe oriëntatie hebben omdat ze net zoveel in elkaar investeren als in de hele rest van de wereld. Hoewel door Noord Amerikaanse actoren wel meer dan drie keer zoveel buiten de eigen regio wordt geïnvesteerd als daarbinnen, moet dit vooral gezienworden in het licht van de dominantie van de VS als enige betekenisvolle investeerderbinnen de regio en de kleine omvang van de Mexicaans en Canadese economieën in verhouding tot de rest van de wereld. Investeringen vanuit de VS naar de twee andere lidstaten groeiden veel sneller dan hun bruto binnenlands product (BBP), hetgeen tevens deconclusie rechtvaardigt dat regionale integratie aanleiding tot een relatief naar-binnengerichte oriëntatie heeft gegeven.Uit deze macro-ontwikkelingen blijft het echter nog steeds moeilijk omondernemingstrategieën te destilleren. Deze studie heeft deze kloof proberen teoverbruggen door de gerealiseerde internationaliseringstrategieën van de 122 grootsteindustriële ondernemingen uit Europa en Noord Amerika over de periode 1990-2001 inkaart te brengen. Deze kernondernemingen zijn bij uitstek de actoren die het beste in staatzijn op de institutionele veranderingen in te springen en hebben ook een voorbeeldfunctie voor andere bedrijven. Daarbij hebben deze ondernemingen een belangrijke rol gespeeldbij integratie in Europa en Noord Amerika door via lobbypraktijken en een sterkeaanwezigheid in de media sterk aan te dringen op regionale integratie.Het onderzoek laat zien dat regionalisering het multilateraal systeem heeft ingehaald als debelangrijkste strategie voor internationale herstructurering. Daarbinnen zijn de SEM en de
321
Samenvatting
NAFTA de bi-regionale kern geworden van de mondiale economie. Voorkernondernemingen uit deze twee regio’s is regionalisering het meest effectieveinstitutionele kader gebleken waarbinnen zij hun kernposities kunnen verdedigen enverstevigen. Deze studie differentieert sterk tussen de verschillende strategieën die ondernemingen aan (kunnen) nemen binnen een scala van oriëntaties: op het thuislandgericht (‘domestic’), op de thuisregio gericht (‘regionaal’), verspreid over twee regio’s (‘bi-regionaal’, hetgeen in de praktijk altijd Europa en Noord Amerika bleek te zijn) ofover (meer dan) drie regio’s verspreid (‘mondiaal’). In tegenstelling tot de ‘ideologie’ vanglobalisering/mondialisering blijken de strategieën van kernondernemingen en demigraties hierin over de jaren negentig – in anticipatie en als gevolg van regionalisering –
ontwikkelingen is in ieder geval een toenemende polarisering
golf van regionalisering’iddels uitbreiding van de EU en de onderhandelingen voor een vrijhandelsakkoord voor
het gehele Amerikaanse halfrond, de FTAA) heeft ook veel steun ondervonden bij
zich voornamelijk in de thuisregio afgespeeld hebben. Regionaal georiënteerdeondernemingen bijvoorbeeld, in beide regio’s de grootste cluster, vormden in 2001 nogsteeds de grootste groep. De golf van fusies en acquisities in de tweede helft van de jarennegentig betrof ook voornamelijk kernondernemingen met een regionale oriëntatie, dierelatief gesproken drie keer zoveel kans maakten overgenomen te worden alsondernemingen met een andere oriëntatie.Het beeld is allerminst statisch – er is veel migratie tussen ‘oriëntaties’ geweest en degemiddelde graad van internationalisering (ook extra-regionaal) is toegenomen. Veelondernemingen die in 1990 nog voornamelijk op het thuisland waren gericht hebben sterkbinnen de regio geïnternationaliseerd, terwijl veel ondernemingen die voorheen alregionaal georiënteerd waren, dat in toenemende mate zijn geworden. Maar andere regionale spelers, vooral in Europa, hebben integratie in de thuisregio juist gebruikt als‘springplank’ om extra-regionale posities op te bouwen. Het relatief kleine aantal mondialeondernemingen – maar negen van de 122 ondernemingen in de studie – heeft deze positie weten te behouden. Maar deze groep is in de loop van de jaren negentig niet groter geworden.Er heeft teglijkertijd echter ook de-internationalisering plaatsgevonden. De NoordAmerikaanse ondernemingen die onder de vorming van NAFTA hun strategieën het meesthebben aangepast, zoals de grote Amerikaanse autofabrikanten, hebben zich voor een deelteruggetrokken in hun thuisregio. Veel bi-regionale ondernemingen (zowel Europees alsNoord-Amerikaans) hadden veel moeite met de parallele ‘zuigkracht’ van de twee regio’sen hebben zich gedeeltelijk uit de tweede regio teruggetrokken, of activiteiten buiten de twee regio’s afgestoten om zich op hun bi-regionale kern te concentreren. Zo is er een ‘kloof’ ontstaan tussen regionaal- en mondiaal georiënteerde strategieën. Maar ook bijsommige ‘global’ ondernemingen, die weliswaar mondiaal zijn gebleven, heeft de-internationalisering plaatsgevonden. Bij de meeste ondernemingen is ook de rol van de tweede regio (Europa voor Noord Amerikaanse kernondernemingen en vice versa) relatiefen soms ook absoluut verminderd; groei is voornamelijk gezocht binnen de eigen regio en /of buiten de tweede regio.Het resultaat van al dezetussen Noord Amerikaanse en Europese kernondernemingen en dus ook een sterk‘diadiserende’ wereldeconomie met een bi-regionale kern en voor elke regio een eigen‘periferie’. Hieruit blijkt dat regionalisering beter lijkt te stroken met de belangen vankernondernemingen dan met die van (sommige) overheden. De neiging naar verdere regionalisering en consolidatie van bestaande regio’s (de ‘derdem
322

Samenvatting
kernondernemingen die graag hun regionale productienetwerken willen uitbreiden. Maar de aarzeling bijvoorbeeld onder Europese overheden om arbeiders uit de nieuwe lidstatentoe te laten wijst er ook op dat ook bij deze derde golf van regionalisering de visies van ondernemingen en overheden nog steeds uiteen kunnen lopen.
323


BIOGRAPHY
Alan Muller is currently a researcher at the Erasmus University Rotterdam and research director of the SCOPE Expert Center, through which he has been involved in researchprojects for inter alia the Dutch Directorate for Development Cooperation and ICCO. Hisresearch focuses on company strategies under regional integration, business-governmentinteraction, development issues, bargaining dynamics and international political economy.He has published in the Multinational Business Review and presented numerous papers atacademic conferences such as the AIB and AOM annual meetings. At the annual meetingof the European International Business Academy in 2001, he was awarded the ‘MostChallenging Thesis Proposal Award’ along with a cash prize in recognition of his ground-breaking approach to his PhD research topic.Alan Muller was born in the United States and attended high school at Garfield HighSchool in Seattle, Washington. He received his undergraduate degree cum laude from the University of Washington’s Department of History in 1993, and participated in anexchange program with the University of Aberdeen, Scotland in 1991-92. Followinggraduation Alan went to Vienna, Austria as a Fulbright Teaching Assistant, where he assisted English teachers at several high schools while continuing his study in Modern European History. In 1995 he entered a Master’s degree program in International Relationsat the University of Amsterdam, graduating cum laude in 1998 with a thesis on ‘Stolper-Samuelson and the Effects of Trade on Mexican Wages’.Previous jobs include work as a strategy consultant for Fource Consultancy Group in high-tech industries. Alan has also worked as desk editor for the ANP (Dutch national press agency) and taught English freelance at language institutes in Vienna and Amsterdam. He lives in Haarlem, the Netherlands, with his wife Sofie and two sons, Carter and Finn.
325

ERASMUS RESEARCH INSTITUTE OF MANAGEMENT (ERIM)
ERIM PH.D. SERIES
RESEARCH IN MANAGEMENT
ERIM Electronic Series Portal: http://hdl.handle.net/1765/1
Berghe, D.A.F., Working Across Borders: Multinational Enterprises and theInternationalization of Employment. (co) Promotor(s): Prof.dr. R.J.M. van Tulder & Prof.dr. E.J.J. Schenk, EPS-2003-029-ORG, ISBN 90-5892-05-34, http://hdl.handle.net/1041
Bijman, W.J.J., Essays on Agricultural Co-operatives; Governance Structure in Fruit and Vegetable Chains, (co-) Promotor(s): Prof.dr. G.W.J. Hendrikse, EPS-2002-015-ORG,ISBN: 90-5892-024-0, http://hdl.handle.net/1765/867
Brito, M.P. de, Managing Reverse Logistics or Reversing Logistics Management? (co-)Promotor(s): Prof.dr.ir. R. Dekker & Prof.dr. M. B. M. de Koster, EPS-2004-035-LIS,ISBN: 90-5892-058-5, http://hdl.handle.net/1765/1132
Campbell, R.A.J., Rethinking Risk in International Financial Markets, (co-) Promotor(s):Prof.dr. C.G. Koedijk, EPS-2001-005-F&A, ISBN: 90-5892-008-9, http://hdl.handle.net/1765/306
Chen, Y., Labour flexibility in China’s companies: an empirical study, (co-) Promotor(s):Prof.dr. A. Buitendam & Prof.dr. B. Krug, EPS-2001-006-ORG, ISBN: 90-5892-012-7, http://hdl.handle.net/1765/307
Delporte-Vermeiren, D.J.E., Improving the flexibility and profitability of ICT-enabled business networks: an assessment method and tool, (co-) Promotor(s): Prof.mr.dr. P.H.M.Vervest & Prof.dr.ir. H.W.G.M. van Heck, EPS-2003-021-LIS, ISBN: 90-5892-040-2, http://hdl.handle.net/1765/359
Dijksterhuis, M., Organizational dynamics of cognition and action in the changing Dutch and U.S. banking industries, (co-) Promotor(s): Prof.dr. F.A.J. van den Bosch & Prof.dr. H.W. Volberda, EPS-2003-026-STR, ISBN: 90-5892-048-8, http://hdl.handle.net/1037
Fenema, P.C. van, Coordination and Control of Globally Distributed Software Projects,(co-) Promotor(s): Prof.dr. K. Kumar, EPS-2002-019-LIS, ISBN: 90-5892-030-5, http://hdl.handle.net/1765/360
327
Fleischmann, M., Quantitative Models for Reverse Logistics, (co-) Promoter(es):Prof.dr.ir. J.A.E.E. van Nunen & Prof.dr.ir. R. Dekker, EPS-2000-002-LIS, ISBN: 3540 417 117, http://hdl.handle.net/1044
Flier, B., Strategic Renewal of European Financial Incumbents; Coevolution of
Environmental Selection, Institutional Effects, and Managerial Intentionality, (co Promotor(s): Prof.dr.ing. F.A.J. van den Bosch & Prof.dr. H.W. Volberda, EPS-2003-033-STR, ISBN: 90–5892–055–0, http://hdl.handle.net/1765/1071
Fok, D., Advanced Econometric Marketing Models, (co-) Promotor(s): Prof.dr. P.H.B.F. Franses, EPS-2003-027-MKT, ISBN: 90-5892-049-6, http://hdl.handle.net/1035
Ganzaroli , A., Creating Trust between Local and Global Systems, (co-) Promotor(s):Prof.dr. K. Kumar & Prof.dr. R.M. Lee, EPS-2002-018-LIS, ISBN: 90-5892-031-3, http://hdl.handle.net/1765/361
Gilsing, V.A., Exploration, Exploitation and Co-evolution in Innovation Networks. (co) Promotor(s): Prof.dr. B. Nooteboom & Prof.dr. J.P.M. Groenewegen, EPS-2003-032-ORG, ISBN 90-5892-05-42, http://hdl.handle.net/1040
Graaf, G. de, Tractable Morality. Customer discourses of bankers, veterinarians and
charity workers. (co-) Promotor(s): Prof.dr. F. Leijnse & Prof.dr. T. van Willigenburg.EPS-2003-031-ORG, ISBN 90–5892–051–8, http://hdl.handle.net/1038
Heugens, P.M.A.R., Strategic Issues Management: Implications for CorporatePerformance, (co-) Promotor(s): Prof.dr.ing. F.A.J. van den Bosch & Prof.dr. C.B.M. van Riel, EPS-2001-007-STR, ISBN: 90-5892-009-7, http://hdl.handle.net/1765/358
Hooghiemstra, R., The Construction of Reality, (co-) Promotor(s): Prof.dr. L.G. van der Tas RA & Prof.dr. A.Th.H. Pruyn, EPS-2003-025-F&A, ISBN: 90-5892-047-X, http://hdl.handle.net/1765/871
Jong, C. de, Dealing with Derivatives: Studies on the role, informational content and
pricing of financial derivatives, (co-) Promotor(s): Prof.dr. C.G. Koedijk, ISBN: 90-5892-043-7, http://hdl.handle.net/1043
Koppius, O.R., Information Architecture and Electronic Market Performance, (co-) Promotor(s): Prof.dr. P.H.M. Vervest & Prof.dr.ir. H.W.G.M. van Heck, EPS-2002-013-LIS, ISBN: 90-5892-023-2, http://hdl.handle.net/1765/921
Langen, P.W. de, The Performance of Seaport Clusters; A Framework to Analyze ClusterPerformance and an Application to the Seaport Clusters of Durban, Rotterdam and the
Lower Mississippi, (co-) Promotor(es): Prof.dr. B. Nooteboom & Prof.drs. H.W.H. Welters,
EPS-2004-034-LIS, ISBN: 90-5892-056-9, http://hdl.handle.net/1765/1133
328
Loef, J.,Promotor(s): Prof.dr. W.F. van Raaij & prof. dr. G. Antonides, EPS-2002-017-MKT,ISBN: 90-5892-028-3, http://hdl.h
Meer, J.R. van der, Operatio (co-) Promotor(s): Prof.dr. M.B.M. de Koster & Prof.dr.ir. R. Dekker, EPS-2000-001-LIS, ISBN:90-5892-004-6,http://hdl.handle
iltenburg, P.R., Effects of modular sourcing on manufacturing flexibility in the
omotive indust
upplier-relations and Internationalisation: Global Source
Strategy as a chinese puzzle, (co-) Promotor(s): Prof.dr. R.J.M. van Tulder, EPS-2001-
ority and Responsibility inGovernance, (co-) Promotor(s): Prof.dr. T. van Willigenburg & Prof.mr. H.R. van
, (co-) Promotor(s): Prof. Dr. L.G.
nterorganizational Trust in Business to Business E-
Commerce, (co-) Promotor(s): Prof.dr. K. Kumar & Prof.dr. H.G. van Dissel, EPS-2001-
ion Problems in Supply Chain Management, (co-) Promotor(s): Prof.dr.ir. J.A.E.E. van Nunen & Dr. H.E. Romeijn, EPS-2000-003-LIS,
of.dr.ir. J.A.E.E. van Nunen, EPS-2001-004-LIS, ISBN:
011-9, http://hdl.handle.net/1765/357
-)N: 90-
t/1765/868
Incongruity between Ads and Consumer Expectations of Advertising, (co-)
andle.net/1765/869
nal Control of Internal Transport,
.net/1765/859
Maut ry. A study among German OEMs. (co) Promotor(s): Prof.dr. J. Paauwe & Prof.dr. H.R. Commandeur, EPS-2003-030-ORG, ISBN 90-5892-052-6, http://hdl.handle.net/1039
Mol, M.M., Outsourcing, S
010-ORG, ISBN: 90-5892- 014-3, http://hdl.handle.net/1765/355
Oosterhout, J. van., The Quest for Legitimacy; On Auth
Gunsteren, EPS-2002-012-ORG, ISBN: 90-5892-022-4, http://hdl.handle.net/1765/362
Peeters, L.W.P., Cyclic Railway Timetable Optimization
Kroon & Prof.dr.ir. J.A.E.E. van Nunen, EPS-2003-022-LIS, ISBN: 90-5892-042-9, http://hdl.handle.net/1765/429
Puvanasvari Ratnasingam , P., I
009-LIS, ISBN: 90-5892-017-8, http://hdl.handle.net/1765/356
Romero Morales, D., Optimizat
ISBN: 90-9014078-6, http://hdl.handle.net/1765/865
Roodbergen , K.J., Layout and Routing Methods for Warehouses, (co-) Promotor(s):Prof.dr. M.B.M. de Koster & Pr90-5892-005-4, http://hdl.handle.net/1765/861
Speklé, R.F., Beyond Generics; A closer look at Hybrid and Hierarchical Governance,(co-) Promotor(s): Prof.dr. M.A. van Hoepen RA, EPS-2001-008-F&A, ISBN: 90-5892-
Teunter, L.H., Analysis of Sales Promotion Effects on Household Purchase Behavior, (coPromotor(s):Prof.dr. ir. B. Wierenga & Prof.dr. T. Kloek, EPS-2002-015-ORG, ISB5892-029-1, http://hdl.handle.ne
329
Vis, I.F.A., Planning and Control Concepts for Material Handling Systems, (co-)Promotor(s): Prof.dr. M.B.M. de Koster & Prof. dr. ir. R. Dekker, EPS-2002-014-LIS, ISBN: 90-5892-021-6, http://hdl.handle.net/1765/866
nditioning andKnowledge-Creating View. (co) Promotor(s): Prof.dr. H.W. Volberda & Prof.dr. C.W.F.
Wolters, M.J.J., The Business of Modularity and the Modularity of Business, (co-) -
Wijk, R.A.J.L. van, Organizing Knowledge in Internal Networks. A Multilevel Study, (co-) -
Waal, T. de, Processing of Erroneous and Unsafe Data, (co-) Promotor(s): Prof.dr.ir. R. Dekker, EPS-2003-024-LIS, ISBN: 90-5892-045-3, http://hdl.handle.net/1765/870
Wielemaker, M.W., Managing Initiatives. A Synthesis of the Co
Baden-Fuller, EPS-2003-28-STR, ISBN 90-5892-050-X, http://hdl.handle.net/1036
Promotor(s): Prof. mr.dr. P.H.M. Vervest & Prof.dr.ir. H.W.G.M. van Heck, EPS-2002011-LIS, ISBN: 90-5892-020-8, http://hdl.handle.net/1765/920
Promotor(s): Prof.dr.ing. F.A.J. van den Bosch, EPS-2003-021-STR, ISBN: 90-5892-0399, http://hdl.handle.net/1765/347
330
The Rise of RegionalismRegionalism has eclipsed the multilateral system as the ‘fast track’for international economic restructuring. Within that framework,the Single European Market (SEM) and North American Free TradeAgreement (NAFTA) have emerged as the bi-polar core of the globaleconomic system. Both agreements were sold to the public onrelatively abstract terms, employing complex economic models as thebasis for projected growth and increased competitive advantage.National governments at the time tended to take a relativelysimplistic view of ‘the firm’ and ignore the strategic diversity amongeconomic actors. Partly as a result, ten years into the ‘Second Wave’of regionalism there are few uncontested conclusions as to itsoutcomes or significance.Regional integration in Europe and North America was largely facili-tated through the lobby activity of Western ‘core companies’: large,powerful firms that lead economic restructuring and operate withone foot in the political process. For Western core companies,regionalism has become the institutional framework of choice withinwhich the struggle for the preservation and consolidation of theircore positions is played out. Taking their spatial organization ofproduction in 1990 as a baseline, this study is the first to systema-tically unravel the traditional macro-aggregated understanding ofintegration outcomes. The evidence shows that, despite the persis-tence of ‘globalization’ ideology, regionalism has fueled a diversepattern of strategic migrations among core companies, particularlysince 1995. The outcome is one of growing polarization betweenNorth American and European core companies, and consequentlywithin an increasingly dyadic world economy.
ERIMThe Erasmus Research Institute of Management (ERIM) is the Research
School (Onderzoekschool) in the field of management of the Erasmus
University Rotterdam. The founding participants of ERIM are the
Rotterdam School of Management and the Rotterdam School of
Economics. ERIM was founded in 1999 and is officially accredited by
the Royal Netherlands Academy of Arts and Sciences (KNAW). The
research undertaken by ERIM is focussed on the management of the
firm in its environment, its intra- and inter-firm relations, and its
business processes in their interdependent connections. The objective
of ERIM is to carry out first rate research in management, and to
offer an advanced graduate program in Research in Management.
Within ERIM, over two hundred senior researchers and Ph.D. candi-
dates are active in the different research programs. From a variety of
academic backgrounds and expertises, the ERIM community is united
in striving for excellence and working at the forefront of creating
new business knowledge.
www.erim.eur.nl ISBN 90-5892-062-3
ALAN R. MULLER
AL
AN
R. M
UL
LE
R
Th
e R
ise o
f Rg
ion
alism
38
The Rise of RegionalismCore Company Strategies underthe Second Wave of Integration
Erim - 04 omslag Mullerxp5 01-04-2004 11:55 Pagina 1