Embed Size (px)
Citation preview

Journal of Economic Perspectives—Volume 26, Number 2—Spring 2012—Pages 41–64
II n the recent global fi nancial crisis, there was a sharp divide in the economic n the recent global fi nancial crisis, there was a sharp divide in the economic performance of high-income and emerging-market nations. The United States, performance of high-income and emerging-market nations. The United States, the countries of the European Union, and Japan suffered most. They have been the countries of the European Union, and Japan suffered most. They have been
slow to recover, with heavy debt burdens and enfeebled banks promising continued slow to recover, with heavy debt burdens and enfeebled banks promising continued sluggishness. Many emerging economies, in contrast, hardly paused during 2008 sluggishness. Many emerging economies, in contrast, hardly paused during 2008 and 2009. Led by China and India, their robust growth is now fueling the recovery and 2009. Led by China and India, their robust growth is now fueling the recovery of the global economy. The shift in economic power is palpable. Brazilian, Chinese, of the global economy. The shift in economic power is palpable. Brazilian, Chinese, and Indian multinational fi rms are eagerly acquiring assets abroad; U.S. and Euro-and Indian multinational fi rms are eagerly acquiring assets abroad; U.S. and Euro-pean leadership in the World Trade Organization, once unassailable, has failed to pean leadership in the World Trade Organization, once unassailable, has failed to consummate the Doha round of global trade negotiations; and the IMF has been consummate the Doha round of global trade negotiations; and the IMF has been spending more time worrying about the balance sheets of high-income nations than spending more time worrying about the balance sheets of high-income nations than of lower-income ones.of lower-income ones.
Although events since 2007 have brought these changes in the world economy Although events since 2007 have brought these changes in the world economy into sharp focus, the rise of low- and middle-income countries in global trade into sharp focus, the rise of low- and middle-income countries in global trade has been decades in the making. China’s economic transition, which accelerated has been decades in the making. China’s economic transition, which accelerated in the 1990s, allowed the country to realize a latent comparative advantage in in the 1990s, allowed the country to realize a latent comparative advantage in labor-intensive products (Amiti and Freund 2010; Harrigan and Deng 2010). labor-intensive products (Amiti and Freund 2010; Harrigan and Deng 2010). India’s surge of growth, which began even before the reforms it initiated in 1991 India’s surge of growth, which began even before the reforms it initiated in 1991 (Rodrik and Subramanian 2004), was, like China’s, aided by industries beginning (Rodrik and Subramanian 2004), was, like China’s, aided by industries beginning far inside the technology frontier (Hsieh and Klenow 2009). The result of China’s far inside the technology frontier (Hsieh and Klenow 2009). The result of China’s
The Rise of Middle Kingdoms: Emerging Economies in Global Trade
■■ Gordon H. Hanson is Professor of Economics and Director of the Center on Emerging and Pacifi c Economies, University of California–San Diego, La Jolla, California. He is also a Research Associate, National Bureau of Economic Research, Cambridge, Massachusetts. His e-mail address is ⟨⟨[email protected]⟩⟩.
http://dx.doi.org/10.1257/jep.26.2.41. doi=10.1257/jep.26.2.41
Gordon H. Hanson

42 Journal of Economic Perspectives
and India’s openings has been an immense global export supply shock. Between and India’s openings has been an immense global export supply shock. Between 1992 and 2008, average annual growth in exports was 18 percent in China and 1992 and 2008, average annual growth in exports was 18 percent in China and 14 percent in India. These two are not the only signifi cant new players in global 14 percent in India. These two are not the only signifi cant new players in global trade. Consider the next 15 middle-income countries, which (in order of market trade. Consider the next 15 middle-income countries, which (in order of market size) are Brazil, Korea, Mexico, Russia, Argentina, Turkey, Indonesia, Poland, size) are Brazil, Korea, Mexico, Russia, Argentina, Turkey, Indonesia, Poland, South Africa, Thailand, Egypt, Colombia, Malaysia, the Philippines, and Chile. South Africa, Thailand, Egypt, Colombia, Malaysia, the Philippines, and Chile. In 2008, they each had a GDP above $100 billion; as a group, their collective In 2008, they each had a GDP above $100 billion; as a group, their collective GDP is 1.4 times China and India’s combined total. From 1992 to 2008, these GDP is 1.4 times China and India’s combined total. From 1992 to 2008, these 15 countries had average annual export growth of 8 percent. During this period, 15 countries had average annual export growth of 8 percent. During this period, low- and middle-income countries overall saw their share of global exports more low- and middle-income countries overall saw their share of global exports more than double, from 21 to 43 percent.than double, from 21 to 43 percent.
In this paper, I examine changes in international trade associated with the In this paper, I examine changes in international trade associated with the integration of low- and middle-income nations into the global economy. From integration of low- and middle-income nations into the global economy. From the 1950s to the 1980s, trade was dominated by fl ows between high-income coun-the 1950s to the 1980s, trade was dominated by fl ows between high-income coun-tries both because they accounted for most of global GDP and because many tries both because they accounted for most of global GDP and because many developing countries maintained high barriers to imports. In the international developing countries maintained high barriers to imports. In the international economics literature, the exchange of goods between the United States, Canada, economics literature, the exchange of goods between the United States, Canada, the nations of Western Europe, and Japan is often referred to as North-North the nations of Western Europe, and Japan is often referred to as North-North trade. However, we are moving toward a world in which South-South commerce trade. However, we are moving toward a world in which South-South commerce (trade between developing countries) and North-South commerce (trade between (trade between developing countries) and North-South commerce (trade between developed and developing countries) are overtaking North-North fl ows. Whereas developed and developing countries) are overtaking North-North fl ows. Whereas high-income economies accounted for four-fi fths of global trade in 1985, they will high-income economies accounted for four-fi fths of global trade in 1985, they will account for less than half by the middle of this decade.account for less than half by the middle of this decade.
I start by focusing on the growth in South-South trade. In part, this pattern has I start by focusing on the growth in South-South trade. In part, this pattern has arisen because urbanization and industrialization in China and India have contrib-arisen because urbanization and industrialization in China and India have contrib-uted to strong demand for raw materials needed to build cities and factories. Other uted to strong demand for raw materials needed to build cities and factories. Other developing economies are abundant in these materials and have become important developing economies are abundant in these materials and have become important sources of global supply. Growth in low- and middle-income economies has also sources of global supply. Growth in low- and middle-income economies has also deepened global production networks, with lengthening production chains in the deepened global production networks, with lengthening production chains in the South increasing cross-border fl ows of parts and components.South increasing cross-border fl ows of parts and components.
I then turn to the rise in North-South trade. During the 1980s, when North-I then turn to the rise in North-South trade. During the 1980s, when North-North trade was dominant, explanations for global trade patterns shifted away North trade was dominant, explanations for global trade patterns shifted away from classic theories of comparative advantage. Models explaining trade as the from classic theories of comparative advantage. Models explaining trade as the result of differences in national factor supplies, as in the Heckscher–Ohlin tradi-result of differences in national factor supplies, as in the Heckscher–Ohlin tradi-tion, or differences in sectoral labor productivities, as in the Ricardian tradition, tion, or differences in sectoral labor productivities, as in the Ricardian tradition, seemed incapable of accounting for substantial trade fl ows between high-income seemed incapable of accounting for substantial trade fl ows between high-income countries. The literature instead explained these types of trade fl ows using countries. The literature instead explained these types of trade fl ows using models based on product differentiation and economies of scale (Helpman and models based on product differentiation and economies of scale (Helpman and Krugman 1985).Krugman 1985).
The rise in North-South trade has rekindled interest in the role of compara-The rise in North-South trade has rekindled interest in the role of compara-tive advantage in global production. Countries export different types of goods at tive advantage in global production. Countries export different types of goods at different stages of development, with low-income countries producing a narrow different stages of development, with low-income countries producing a narrow range of goods (Imbs and Wacziarg 2003; Cadot, Carrère, and Strauss-Kahn 2011) range of goods (Imbs and Wacziarg 2003; Cadot, Carrère, and Strauss-Kahn 2011) and moving up the product ladder in terms of capital intensity and quality as their and moving up the product ladder in terms of capital intensity and quality as their

Gordon H. Hanson 43
incomes rise (Schott 2003, 2004). For some countries, and for China in particular, incomes rise (Schott 2003, 2004). For some countries, and for China in particular, industrial specialization evolves rapidly (Rodrik 2006), revealing a capacity to speed industrial specialization evolves rapidly (Rodrik 2006), revealing a capacity to speed up product ladders. For other countries, specialization in primary commodities, up product ladders. For other countries, specialization in primary commodities, long seen as a hallmark of underdevelopment, has been a pathway to economic long seen as a hallmark of underdevelopment, has been a pathway to economic growth. Concomitant with recent changes in global trade, trade theorists have growth. Concomitant with recent changes in global trade, trade theorists have revived the Ricardian model (Eaton and Kortum 2002), which for years was used as revived the Ricardian model (Eaton and Kortum 2002), which for years was used as little more than a tool for introducing undergraduates to international economics. little more than a tool for introducing undergraduates to international economics. The new theories rightly emphasize differences in national industrial capabilities The new theories rightly emphasize differences in national industrial capabilities as a driver of trade, but are not yet suffi ciently developed to account for the full as a driver of trade, but are not yet suffi ciently developed to account for the full richness of the trade patterns that we see emerging.richness of the trade patterns that we see emerging.
Growth in South-South Trade
As a starting point, I describe growth in trade between nations grouped by As a starting point, I describe growth in trade between nations grouped by income level. I assign countries to income categories based on their per capita GDP income level. I assign countries to income categories based on their per capita GDP in 1990, which characterizes their level of development at the beginning of the in 1990, which characterizes their level of development at the beginning of the recent global trade surge.recent global trade surge.11 Low-income countries are those with per capita GDP of Low-income countries are those with per capita GDP of less than $800 (in 2000 U.S. dollars); middle-income countries have per capita GDP less than $800 (in 2000 U.S. dollars); middle-income countries have per capita GDP of $800 to $10,000; and high-income countries have per capita GDP of $10,000 to of $800 to $10,000; and high-income countries have per capita GDP of $10,000 to $33,000. These categories correspond closely to World Bank defi nitions of country $33,000. These categories correspond closely to World Bank defi nitions of country income status in 1990. China and India have their own category (whereas by the income status in 1990. China and India have their own category (whereas by the above cutoffs they would be defi ned as low-income countries).above cutoffs they would be defi ned as low-income countries).
Table 1 shows trade fl ows, normalized by (regional) GDP, between country Table 1 shows trade fl ows, normalized by (regional) GDP, between country income groups over the period 1994 to 2008 based on data from UN Comtrade (as income groups over the period 1994 to 2008 based on data from UN Comtrade (as are all other fi gures presented in the paper). Two properties of global trade are are all other fi gures presented in the paper). Two properties of global trade are immediately apparent. One is that for low- and middle-income countries, trade immediately apparent. One is that for low- and middle-income countries, trade as a share of regional GDP has grown sharply. Exports over GDP rise from 26 as a share of regional GDP has grown sharply. Exports over GDP rise from 26 to 55 percent in low-income countries, from 25 to 55 percent in middle-income to 55 percent in low-income countries, from 25 to 55 percent in middle-income countries, and from 25 to 44 percent in China and India. For high-income coun-countries, and from 25 to 44 percent in China and India. For high-income coun-tries, the change is much smaller, from 17 to 26 percent. Changes in imports as a tries, the change is much smaller, from 17 to 26 percent. Changes in imports as a share of GDP are similar.share of GDP are similar.
The shifting pattern of international trade involves much larger South-South The shifting pattern of international trade involves much larger South-South fl ows. Between 1994 and 2008, the share of exports from low-income countries fl ows. Between 1994 and 2008, the share of exports from low-income countries going to low- and middle-income markets (including China and India) rose from going to low- and middle-income markets (including China and India) rose from 24 to 42 percent, with China and India accounting for about half of this growth. The 24 to 42 percent, with China and India accounting for about half of this growth. The share of exports from middle-income countries going to low- and middle-income share of exports from middle-income countries going to low- and middle-income markets (including China and India) rose from 33 to 46 percent, with China and markets (including China and India) rose from 33 to 46 percent, with China and India accounting for two-fi fths of this growth.India accounting for two-fi fths of this growth.
Growth in trade shares for low- and middle-income countries far exceeds the Growth in trade shares for low- and middle-income countries far exceeds the increase in their relative economic size. Between 1994 and 2008, the share of increase in their relative economic size. Between 1994 and 2008, the share of
1 I calculate per capita GDP in 1990 as the average over 1985 to 1995 to account for missing annual data in some countries and the creation of new nations after 1990.

44 Journal of Economic Perspectives
low- and middle-income countries (including China and India) in global GDP low- and middle-income countries (including China and India) in global GDP increased from 22 to 29 percent. The gravity model of trade, which is a work-increased from 22 to 29 percent. The gravity model of trade, which is a work-horse for empirical research on trade fl ows, expresses exports from one country horse for empirical research on trade fl ows, expresses exports from one country to another as a function of the countries’ GDPs, bilateral trade costs, and relative to another as a function of the countries’ GDPs, bilateral trade costs, and relative prices (Anderson and van Wincoop 2004). Following the gravity logic, the share prices (Anderson and van Wincoop 2004). Following the gravity logic, the share of low- and middle-income countries in global trade should increase in rough of low- and middle-income countries in global trade should increase in rough proportion to their share of global income. But Southern trade has grown much proportion to their share of global income. But Southern trade has grown much faster than Southern GDP.faster than Southern GDP.
What accounts for the surge in South-South commerce? A fi rst possible expla-What accounts for the surge in South-South commerce? A fi rst possible expla-nation is falling trade costs in emerging economies, resulting from unilateral trade nation is falling trade costs in emerging economies, resulting from unilateral trade reform, growth in World Trade Organization membership, or reduced costs of reform, growth in World Trade Organization membership, or reduced costs of shipping goods. But these explanations are not well-supported by more detailed shipping goods. But these explanations are not well-supported by more detailed research. Hummels (2007) documents in this journal that while the costs of air research. Hummels (2007) documents in this journal that while the costs of air
Table 1Exports and Imports Relative to GDP by Regional Trading Partner
Exports to partner relative to regional GDP
Imports from partner relative to regional GDP
Region Trade partner 1994 2008
Percentage point
change 1994 2008
Percentage point
change
Low-income Low-income countries 0.8% 3.2% 2.4 0.8% 3.2% 2.4 countries Middle-income countries 4.5% 11.6% 7.1 6.0% 17.1% 11.1
China, India 1.1% 8.3% 7.2 1.8% 10.7% 8.9High-income countries 20.0% 31.8% 11.8 15.1% 23.0% 7.9World 26.3% 55.0% 28.6 23.7% 54.0% 30.4
Mid-income Low-income countries 0.7% 2.1% 1.4 0.5% 1.4% 0.9 countries Middle-income countries 5.3% 15.6% 10.3 5.3% 15.6% 10.3
China, India 2.2% 7.5% 5.3 2.4% 7.4% 5.0High-income countries 16.9% 29.6% 12.7 18.6% 26.0% 7.4World 25.1% 54.8% 29.8 26.8% 50.4% 23.6
China and Low-income countries 0.8% 2.7% 1.9 0.5% 2.1% 1.6 India Middle-income countries 9.5% 15.2% 5.7 8.6% 15.4% 6.8
China, India 0.1% 1.2% 1.1 0.1% 1.2% 1.1High-income countries 14.3% 25.3% 11.0 9.8% 14.1% 4.3
World 24.8% 44.4% 19.6 19.0% 32.7% 13.7
High-income Low-income countries 0.3% 0.7% 0.4 0.5% 1.0% 0.5 countries Middle-income countries 3.7% 6.6% 2.9 3.4% 7.5% 4.1
China, India 0.5% 1.7% 1.2 0.7% 3.1% 2.4High-income countries 12.8% 16.9% 4.1 12.8% 16.9% 4.1World 17.4% 26.0% 8.6 17.4% 28.6% 11.2
Source: UN Comtrade, ⟨http://comtrade.un.org/⟩.

The Rise of Middle Kingdoms: Emerging Economies in Global Trade 45
transport have fallen signifi cantly in recent decades, the costs of ocean transport, the transport have fallen signifi cantly in recent decades, the costs of ocean transport, the mode of transport for most developing-country trade, have not. Between 1994 and mode of transport for most developing-country trade, have not. Between 1994 and 2008, policy barriers to trade have fallen, with the average applied tariff rate across 2008, policy barriers to trade have fallen, with the average applied tariff rate across all goods (weighted by imports) declining from 12 to 4 percent in middle-income all goods (weighted by imports) declining from 12 to 4 percent in middle-income countries and from 29 to 8 percent in China. In high-income nations, already-low countries and from 29 to 8 percent in China. In high-income nations, already-low tariffs meant further reductions were small, with average tariffs falling from 5 to tariffs meant further reductions were small, with average tariffs falling from 5 to 3 percent. However, estimates by Yi (2003), using data for an earlier period, suggest 3 percent. However, estimates by Yi (2003), using data for an earlier period, suggest that such modest tariff changes are too small to explain the more than doubling of that such modest tariff changes are too small to explain the more than doubling of trade as a share of GDP in developing economies.trade as a share of GDP in developing economies.
The importance of the World Trade Organization in expanding trade appears The importance of the World Trade Organization in expanding trade appears to be overblown. Since 1995, when the WTO was created out of the General Agree-to be overblown. Since 1995, when the WTO was created out of the General Agree-ment on Trade and Tariffs, 41 new nations have joined the organization, bringing ment on Trade and Tariffs, 41 new nations have joined the organization, bringing membership to 153 countries. Yet, the literature provides ambiguous support for membership to 153 countries. Yet, the literature provides ambiguous support for the idea that WTO membership expands trade. Rose (2004a) fi nds that, conditional the idea that WTO membership expands trade. Rose (2004a) fi nds that, conditional on GDP, WTO members do not trade signifi cantly more than nonmembers, which on GDP, WTO members do not trade signifi cantly more than nonmembers, which he attributes to WTO members not having more liberal trade policies (Rose 2004b), he attributes to WTO members not having more liberal trade policies (Rose 2004b), partly as a result of the WTO placing weak demands on developing countries to partly as a result of the WTO placing weak demands on developing countries to liberalize trade.liberalize trade.
An alternative explanation is that the growth in Southern trade is a result of An alternative explanation is that the growth in Southern trade is a result of expanding multistage global production networks. Much of the recent increase in expanding multistage global production networks. Much of the recent increase in trade appears to be the result of offshoring, in which fi rms fragment manufacturing trade appears to be the result of offshoring, in which fi rms fragment manufacturing across borders by locating individual production stages in the countries where they across borders by locating individual production stages in the countries where they can be performed at least cost (Hummels, Ishii, and Yi 2001). A consequence may can be performed at least cost (Hummels, Ishii, and Yi 2001). A consequence may be that be that gross trade fl ows (that is, total exports) overstate trade fl ows (that is, total exports) overstate net trade fl ows (that is, trade fl ows (that is, exports net of imported intermediate inputs); if true, this would imply that the exports net of imported intermediate inputs); if true, this would imply that the expansion of South-South trade is in part a statistical artifact. If goods are produced expansion of South-South trade is in part a statistical artifact. If goods are produced through a sequence of stages, as modeled by Costinot, Vogel, and Wang (2011), through a sequence of stages, as modeled by Costinot, Vogel, and Wang (2011), each country will add value as a product is transformed from raw inputs into a fi nal each country will add value as a product is transformed from raw inputs into a fi nal output along a production chain than spans national borders; the value added of output along a production chain than spans national borders; the value added of countries participating earlier in the chain will therefore be counted in trade fl ows countries participating earlier in the chain will therefore be counted in trade fl ows multiple times. The Intel Corporation, for example, produces semiconductors by multiple times. The Intel Corporation, for example, produces semiconductors by fi rst manufacturing silicon wafers in the United States, Ireland, and Israel and then fi rst manufacturing silicon wafers in the United States, Ireland, and Israel and then assembling and testing integrated circuits made out of these wafers at plants in assembling and testing integrated circuits made out of these wafers at plants in China, Costa Rica, Malaysia, and the Philippines. Silicon wafers are counted in trade China, Costa Rica, Malaysia, and the Philippines. Silicon wafers are counted in trade twice, fi rst in shipments of the raw wafers from the United States to Costa Rica, and twice, fi rst in shipments of the raw wafers from the United States to Costa Rica, and again in the shipment of integrated circuits that embody the wafers from Costa Rica again in the shipment of integrated circuits that embody the wafers from Costa Rica to the fi nal destination market.to the fi nal destination market.
Global production networks, however, need not be based on sequential Global production networks, however, need not be based on sequential manufacturing. Dell follows an alternative model in making computers, in which it manufacturing. Dell follows an alternative model in making computers, in which it subcontracts the production of parts and components to suppliers in many countries subcontracts the production of parts and components to suppliers in many countries and has these parts shipped to fi nal destination markets, where they are assembled and has these parts shipped to fi nal destination markets, where they are assembled into computers for fi nal consumers. If production networks tend to follow the Intel into computers for fi nal consumers. If production networks tend to follow the Intel model, total exports may greatly exceed trade in value added, whereas if they tend model, total exports may greatly exceed trade in value added, whereas if they tend to follow the Dell model they may not.to follow the Dell model they may not.

46 Journal of Economic Perspectives
What fraction of measured trade fl ows is subject to concerns over double What fraction of measured trade fl ows is subject to concerns over double counting? In the case of China, half of its manufacturing exports in the late 1990s counting? In the case of China, half of its manufacturing exports in the late 1990s and early 2000s were produced by processing plants that assemble imported parts and early 2000s were produced by processing plants that assemble imported parts and components into fi nal goods for export, primarily in consumer products and components into fi nal goods for export, primarily in consumer products (Feenstra and Hanson 2005). Within export processing plants, value added in (Feenstra and Hanson 2005). Within export processing plants, value added in China as a share of total exports is only 36 percent. However, domestic value China as a share of total exports is only 36 percent. However, domestic value added in China’s exports outside of processing plants appears to be much higher. added in China’s exports outside of processing plants appears to be much higher. Koopmans, Powers, Wang, and Wei (2010) estimate that for China’s overall Koopmans, Powers, Wang, and Wei (2010) estimate that for China’s overall exports, domestic value added accounts for 65 percent of total exports. For the exports, domestic value added accounts for 65 percent of total exports. For the world as a whole, 75 percent of exports consists of value added in the country of world as a whole, 75 percent of exports consists of value added in the country of export. Among middle-income countries, the share of domestic value added in export. Among middle-income countries, the share of domestic value added in total exports is relatively low in Malaysia (59 percent), Mexico (62 percent), the total exports is relatively low in Malaysia (59 percent), Mexico (62 percent), the Philippines (58 percent), and Thailand (60 percent) and relatively high in Brazil Philippines (58 percent), and Thailand (60 percent) and relatively high in Brazil (87 percent), Indonesia (77 percent), Russia (89 percent), and South Africa (87 percent), Indonesia (77 percent), Russia (89 percent), and South Africa (81 percent). The latter group of countries specializes in producing commodi-(81 percent). The latter group of countries specializes in producing commodi-ties, in which fragmentation of production is less feasible, whereas the fi rst group ties, in which fragmentation of production is less feasible, whereas the fi rst group specializes in manufacturing, where production chains are more common. In specializes in manufacturing, where production chains are more common. In Mexico, for instance, half of manufacturing exports are by Mexico, for instance, half of manufacturing exports are by maquiladoras, plants , plants that assemble fi nal goods in electronics, automotive goods, and machinery from that assemble fi nal goods in electronics, automotive goods, and machinery from parts and components imported from the United States (Bergin, Feenstra, and parts and components imported from the United States (Bergin, Feenstra, and Hanson 2009).Hanson 2009).
Other evidence confi rms that double counting in recorded total trade Other evidence confi rms that double counting in recorded total trade fl ows is more severe for manufactured goods. Johnson and Noguera (2012) fi nd fl ows is more severe for manufactured goods. Johnson and Noguera (2012) fi nd that the ratio of export value added to total exports is lower in manufacturing that the ratio of export value added to total exports is lower in manufacturing (44 percent) than in agriculture and natural resources (109 percent, where a value (44 percent) than in agriculture and natural resources (109 percent, where a value of greater than 100 percent indicates that a large fraction of exports in the sector of greater than 100 percent indicates that a large fraction of exports in the sector are indirect in the form of value added embodied in the fi nal exports of other are indirect in the form of value added embodied in the fi nal exports of other sectors). Many middle-income countries specialize in manufacturing exports, sectors). Many middle-income countries specialize in manufacturing exports, suggesting that global production networks are part of the reason their trade is suggesting that global production networks are part of the reason their trade is expanding so rapidly. But double-counting as a result of such networks cannot expanding so rapidly. But double-counting as a result of such networks cannot be the entire story. Most low-income and some middle-income nations specialize be the entire story. Most low-income and some middle-income nations specialize in primary products, including minerals and farm goods. For these countries, in primary products, including minerals and farm goods. For these countries, the increase in exports to GDP is not an artifact of total exports overstating the increase in exports to GDP is not an artifact of total exports overstating value added in exports but is instead a refl ection of increasing specialization for value added in exports but is instead a refl ection of increasing specialization for global markets.global markets.
Evidence on the share of value added in total exports is based largely on Evidence on the share of value added in total exports is based largely on cross-sectional data; there is little work providing clues on the expansion path cross-sectional data; there is little work providing clues on the expansion path of production chains. We do not know whether the share of value added in total of production chains. We do not know whether the share of value added in total exports is rising or falling. There is some evidence that emerging economies exports is rising or falling. There is some evidence that emerging economies are deepening their productive capacity, capturing production of interme-are deepening their productive capacity, capturing production of interme-diate inputs that they previously imported from abroad, a phenomenon that is diate inputs that they previously imported from abroad, a phenomenon that is pronounced in China. By the mid-2000s, exports of completed computers had pronounced in China. By the mid-2000s, exports of completed computers had become China’s top export good. Many of these computers are assembled in become China’s top export good. Many of these computers are assembled in export processing plants, requiring China to import components from abroad. export processing plants, requiring China to import components from abroad.

Gordon H. Hanson 47
However, over time China’s reliance on imports in the sector has declined mark-However, over time China’s reliance on imports in the sector has declined mark-edly. Figure 1 shows exports and imports of computers, computer parts, and edly. Figure 1 shows exports and imports of computers, computer parts, and computer peripheral devices (Standard International Trade Classifi cation prod-computer peripheral devices (Standard International Trade Classifi cation prod-ucts 752, 7512 and 7559) in China over the period 1994 to 2008. In 1994, exports ucts 752, 7512 and 7559) in China over the period 1994 to 2008. In 1994, exports were 1.6 times imports in the sector; by 2008, they were 4.2 times imports. While were 1.6 times imports in the sector; by 2008, they were 4.2 times imports. While it is unclear how much one can generalize from China’s experience, growth it is unclear how much one can generalize from China’s experience, growth in trade involving middle-income manufacturers does not necessarily go hand in trade involving middle-income manufacturers does not necessarily go hand in hand with greater back and forth fl ows of intermediate inputs.in hand with greater back and forth fl ows of intermediate inputs.
As China develops, it may continue to take over the manufacture of inputs, As China develops, it may continue to take over the manufacture of inputs, making production in some sectors less fragmented globally. This experience is making production in some sectors less fragmented globally. This experience is similar to that of Hong Kong, Korea, Singapore, and Taiwan, which also entered similar to that of Hong Kong, Korea, Singapore, and Taiwan, which also entered global production networks by specializing in product assembly and later expanded global production networks by specializing in product assembly and later expanded into input production and the design and distribution of goods. But not all countries into input production and the design and distribution of goods. But not all countries that begin as assemblers succeed in graduating into other manufacturing stages. that begin as assemblers succeed in graduating into other manufacturing stages. After nearly three decades of global manufacturing, most exporters in Mexico and After nearly three decades of global manufacturing, most exporters in Mexico and Central America remain in the assembly stage.Central America remain in the assembly stage.
Growth in South-South trade is a major part of the recent global trade Growth in South-South trade is a major part of the recent global trade boom. Falling trade barriers and expanding global production networks have boom. Falling trade barriers and expanding global production networks have surely contributed to Southern trade growth. However, they appear insuffi cient surely contributed to Southern trade growth. However, they appear insuffi cient on their own to explain why trade to GDP ratios have risen so much in low- and on their own to explain why trade to GDP ratios have risen so much in low- and
Figure 1China’s Imports and Exports of Computers and Parts
Source: Author’s calculations using (World Bank) World Development Indicators and UN Comtrade.Note: The fi gure shows exports and imports of computers, computer parts, and computer peripheral devices (Standard International Trade Classifi cation products 752, 7512, and 7519) in China over the period 1994 to 2008.
Exports of computers, parts, & peripheralsImports of computers, parts, & peripherals
0
Trad
e fl
ow/G
DP
0.02
0.04
0.06
0.08
20082006200420022000199819961994

48 Journal of Economic Perspectives
middle-income countries. What else could be behind the rapid expansion of trade middle-income countries. What else could be behind the rapid expansion of trade relative to GDP? One possibility, as yet unexplored in the literature, is that the relative to GDP? One possibility, as yet unexplored in the literature, is that the greater role of emerging economies in global trade is inducing a much fi ner degree greater role of emerging economies in global trade is inducing a much fi ner degree of international specialization than occurred during previous decades, in which of international specialization than occurred during previous decades, in which North-North trade predominated. As I discuss next, such an explanation would North-North trade predominated. As I discuss next, such an explanation would require that comparative advantage is assuming a larger role in determining global require that comparative advantage is assuming a larger role in determining global trade fl ows than it did in the past.trade fl ows than it did in the past.
The Return of Comparative Advantage
The 1980s and 1990s were not kind to theories of trade based on compara-The 1980s and 1990s were not kind to theories of trade based on compara-tive advantage. The dominance of high-income countries in global commerce tive advantage. The dominance of high-income countries in global commerce led international economists to develop models that explain trade as the result led international economists to develop models that explain trade as the result of increasing returns to scale and monopolistic competition in differentiated of increasing returns to scale and monopolistic competition in differentiated products (Helpman and Krugman 1985). The Heckscher–Ohlin model, once a products (Helpman and Krugman 1985). The Heckscher–Ohlin model, once a staple of graduate training in international trade, failed repeatedly to explain staple of graduate training in international trade, failed repeatedly to explain prevailing trade patterns (Feenstra 2003). And the Ricardian model (based on prevailing trade patterns (Feenstra 2003). And the Ricardian model (based on sectoral labor productivities) remained little more than an intellectual curiosity, sectoral labor productivities) remained little more than an intellectual curiosity, given its tendency to predict extreme patterns of industry specialization, seem-given its tendency to predict extreme patterns of industry specialization, seem-ingly at odds with the data (at least for Northern countries). Further, the robust ingly at odds with the data (at least for Northern countries). Further, the robust success of the gravity model, in which country size and trade costs are the primary success of the gravity model, in which country size and trade costs are the primary determinants of trade fl ows, seemed to defy a signifi cant role for comparative determinants of trade fl ows, seemed to defy a signifi cant role for comparative advantage (Anderson and van Wincoop 2003). If we can explain much of bilateral advantage (Anderson and van Wincoop 2003). If we can explain much of bilateral trade using the size and location of the importer and exporter, why do we need trade using the size and location of the importer and exporter, why do we need comparative advantage at all?comparative advantage at all?
Much has changed in the last decade. On the empirical side, China’s and Much has changed in the last decade. On the empirical side, China’s and India’s growth are powerful reminders that cross-country differences in tech-India’s growth are powerful reminders that cross-country differences in tech-nology and resources are potent motivations for commerce. On the theory side, nology and resources are potent motivations for commerce. On the theory side, Eaton and Kortum (2002) show that Ricardian comparative advantage is consis-Eaton and Kortum (2002) show that Ricardian comparative advantage is consis-tent with the gravity model. In their formulation, an exporter captures a share of tent with the gravity model. In their formulation, an exporter captures a share of an importer’s market according to its technological capability and its trade costs an importer’s market according to its technological capability and its trade costs in delivering goods. They avoid the knife-edge feature of the textbook Ricardian in delivering goods. They avoid the knife-edge feature of the textbook Ricardian model, in which a country tends to supply either the entire market for a good or model, in which a country tends to supply either the entire market for a good or none, by having productivity vary randomly across fi rms within a country and the none, by having productivity vary randomly across fi rms within a country and the position of the country’s productivity distribution in an industry be given by its position of the country’s productivity distribution in an industry be given by its predetermined technological capability, which they liken to absolute advantage. predetermined technological capability, which they liken to absolute advantage. These technological capabilities (along with the dispersion of productivity across These technological capabilities (along with the dispersion of productivity across fi rms) are the key primitives of the model. Other models have comparative advan-fi rms) are the key primitives of the model. Other models have comparative advan-tage arising from country differences in factor supplies that result in trade in tage arising from country differences in factor supplies that result in trade in intermediate inputs associated with the formation of global production networks intermediate inputs associated with the formation of global production networks (Feenstra 2010). In either set of theories, it is differences between countries, (Feenstra 2010). In either set of theories, it is differences between countries, whether in terms of their technological capabilities or their factor supplies, that whether in terms of their technological capabilities or their factor supplies, that cause trade.cause trade.

The Rise of Middle Kingdoms: Emerging Economies in Global Trade 49
International SpecializationA role for comparative advantage in trade is evident in the pattern of net exports A role for comparative advantage in trade is evident in the pattern of net exports
by sector across country income groups, as shown in Figures 2A–D. I group non-oil by sector across country income groups, as shown in Figures 2A–D. I group non-oil exports into nine categories: agriculture and food products; minerals and other raw exports into nine categories: agriculture and food products; minerals and other raw materials; apparel, footwear, and textiles; metals and metal products; chemicals; materials; apparel, footwear, and textiles; metals and metal products; chemicals; machinery; electronics and electrical machinery; transportation equipment; and machinery; electronics and electrical machinery; transportation equipment; and other manufactures.other manufactures.22 Agriculture and raw materials are intensive in the use of land, Agriculture and raw materials are intensive in the use of land, mineral reserves, and in some cases raw labor. Apparel, footwear, textiles, some mineral reserves, and in some cases raw labor. Apparel, footwear, textiles, some electronics, and other manufactures (which include furniture, toys, and games) electronics, and other manufactures (which include furniture, toys, and games) are intensive in the use of low-skilled labor. And chemicals, machinery, some elec-are intensive in the use of low-skilled labor. And chemicals, machinery, some elec-tronics, and transportation equipment are intensive in human and physical capital.tronics, and transportation equipment are intensive in human and physical capital.
International specialization, at least in broad overview, follows perceived International specialization, at least in broad overview, follows perceived patterns of comparative advantage. Low-income countries (Figure 2A) have positive patterns of comparative advantage. Low-income countries (Figure 2A) have positive net exports in three resource- or labor-intensive sectors—agriculture, raw materials, net exports in three resource- or labor-intensive sectors—agriculture, raw materials, and apparel and shoes—and negative net exports in other sectors. China and India and apparel and shoes—and negative net exports in other sectors. China and India (Figure 2B) have positive net exports in three labor-intensive sectors—apparel and (Figure 2B) have positive net exports in three labor-intensive sectors—apparel and shoes, electronics, and other manufactures—and negative or negligible net exports shoes, electronics, and other manufactures—and negative or negligible net exports in other sectors. Middle-income countries (Figure 2C) have negative net exports in in other sectors. Middle-income countries (Figure 2C) have negative net exports in the three capital-intensive sectors—chemicals, machinery, and transportation equip-the three capital-intensive sectors—chemicals, machinery, and transportation equip-ment—and export strength in other goods. And high-income countries (Figure 2D) ment—and export strength in other goods. And high-income countries (Figure 2D) have positive net exports in the three capital-intensive sectors and negative net have positive net exports in the three capital-intensive sectors and negative net exports elsewhere.exports elsewhere.
Underlying these specialization patterns is growing South-South trade along Underlying these specialization patterns is growing South-South trade along comparative advantage lines, with resource-poor emerging economies purchasing comparative advantage lines, with resource-poor emerging economies purchasing raw materials from ones that are resource rich. For low-income countries over the raw materials from ones that are resource rich. For low-income countries over the period 1994 to 2008, shipments to low- and middle-income markets (including period 1994 to 2008, shipments to low- and middle-income markets (including China and India) accounted for 70 percent of their export growth in agriculture China and India) accounted for 70 percent of their export growth in agriculture and food products and 73 percent of their export growth in raw materials. China and food products and 73 percent of their export growth in raw materials. China and India are particularly important sources of raw material demand, absorbing and India are particularly important sources of raw material demand, absorbing 40 percent of low-income country growth in exports of these goods over the period. 40 percent of low-income country growth in exports of these goods over the period. Not surprisingly, emerging economies are a relatively unimportant source of Not surprisingly, emerging economies are a relatively unimportant source of demand for apparel and textiles, absorbing only 25 percent of low-income country demand for apparel and textiles, absorbing only 25 percent of low-income country export growth in that sector. Low-income countries send most of their output of export growth in that sector. Low-income countries send most of their output of clothing and shoes to high-income markets.clothing and shoes to high-income markets.
Middle-income countries export a diverse set of goods, owing to the hetero-Middle-income countries export a diverse set of goods, owing to the hetero-geneity of countries within the group. Individual countries tend to specialize in a geneity of countries within the group. Individual countries tend to specialize in a
2 The corresponding one- and two-digit Standard International Trade Classifi cation (SITC) products are: agriculture and food products (SITC 0, 1, 4, 21, 22, 29, and 94); raw materials, which include rubber, wood, paper, iron ore, and other minerals (SITC, 23–25, 27–28, 62–64, and 66); apparel, footwear, and textiles (SITC 26, 61, 65, and 83–85); metals and metal products (SITC 67–69), chemicals (SITC 5), machinery (SITC 71–74), electronics and electrical machinery (SITC 75–77), transportation equipment (SITC 78–79, 95), and other manufactures, which include toys and games, plumbing and light fi xtures, furniture, professional and scientifi c equipment, photographic and optical equipment, watches, and miscellaneous goods (SITC 81–82, 87–89). Petroleum, coal, and natural gas (SITC 3) are excluded.

50 Journal of Economic Perspectives
Figure 2Sector Trade Shares of GDP, by Income Group
B: China and India
A: Low-income countries
Food, agriculture
Raw materials
Apparel, shoes
Metals
Chemicals
Machinery
Electronics
Transport equipment
Other manufacturing
0 .02 .04 .06 .08 .10 .12 .14 0 .02 .04 .06 .08 .10 .12 .14
0 .02 .04 .06 .08 .10 .12 .14 0 .02 .04 .06 .08 .10 .12 .14
1994 2008
1994 2008
Food, agriculture
Raw materials
Apparel, shoes
Metals
Chemicals
Machinery
Electronics
Transport equipment
Other manufacturing
Food, agriculture
Raw materials
Apparel, shoes
Metals
Chemicals
Machinery
Electronics
Transport equipment
Other manufacturing
Food, agriculture
Raw materials
Apparel, shoes
Metals
Chemicals
Machinery
Electronics
Transport equipment
Other manufacturing
Exports/GDP Imports/GDP
Exports/GDP Imports/GDP

Gordon H. Hanson 51
Source: Author’s calculations using (World Bank) World Development Indicators and UN Comtrade.
Figure 2 (continued)
D: High-income countries
C: Middle-income countries
Food, agriculture
Raw materials
Apparel, shoes
Metals
Chemicals
Machinery
Electronics
Transport equipment
Other manufacturing
Food, agriculture
Raw materials
Apparel, shoes
Metals
Chemicals
Machinery
Electronics
Transport equipment
Other manufacturing
0 .02 .04 .06 .08 .10 .12 .14 0 .02 .04 .06 .08 .10 .12 .14
Food, agriculture
Raw materials
Apparel, shoes
Metals
Chemicals
Machinery
Electronics
Transport equipment
Other manufacturing
Food, agriculture
Raw materials
Apparel, shoes
Metals
Chemicals
Machinery
Electronics
Transport equipment
Other manufacturing
0 .02 .04 .06 .08 .10 .12 .14 0 .02 .04 .06 .08 .10 .12 .14
1994 2008
1994 2008
Exports/GDP Imports/GDP
Exports/GDP Imports/GDP
52 Journal of Economic Perspectives
subset of sectors. Overall, middle-income countries have had strong export growth subset of sectors. Overall, middle-income countries have had strong export growth in agriculture, led by Argentina and Brazil; metals, led by Russia, Korea, South in agriculture, led by Argentina and Brazil; metals, led by Russia, Korea, South Africa, and Chile; electronics, led by Korea, Malaysia, Thailand, and the Philippines; Africa, and Chile; electronics, led by Korea, Malaysia, Thailand, and the Philippines; and transportation equipment, led by Korea, Mexico, Poland, and Turkey. In each and transportation equipment, led by Korea, Mexico, Poland, and Turkey. In each of these sectors, except autos, low- and middle-income markets absorbed 50 percent of these sectors, except autos, low- and middle-income markets absorbed 50 percent or more of middle-income country export growth over the period 1994 to 2008. or more of middle-income country export growth over the period 1994 to 2008. China and India alone accounted for more than 25 percent of absorption of the China and India alone accounted for more than 25 percent of absorption of the export growth of middle-income countries in raw materials and electronics. Their export growth of middle-income countries in raw materials and electronics. Their raw material demand refl ects the need for iron ore, copper, and other minerals raw material demand refl ects the need for iron ore, copper, and other minerals they require to build their economies; their electronics demand, coming primarily they require to build their economies; their electronics demand, coming primarily from China, represents the deepening of production networks among emerging from China, represents the deepening of production networks among emerging economies. China and India are distinct among low- and middle-countries for being economies. China and India are distinct among low- and middle-countries for being reliant on high-income markets to absorb their ever-growing exports. High-income reliant on high-income markets to absorb their ever-growing exports. High-income countries absorbed over 70 percent of China’s and India’s export growth in apparel, countries absorbed over 70 percent of China’s and India’s export growth in apparel, footwear, and other manufactures and over 55 percent in electronics (one of China’s footwear, and other manufactures and over 55 percent in electronics (one of China’s strengths) and metals (one of India’s).strengths) and metals (one of India’s).
Foreign direct investment is abetting the growth of emerging-economy trade. Foreign direct investment is abetting the growth of emerging-economy trade. North-to-South fl ows of foreign direct investment are well known to international North-to-South fl ows of foreign direct investment are well known to international economists. A large literature documents the importance of these fl ows in building economists. A large literature documents the importance of these fl ows in building global production chains (for example, Hanson, Mataloni, and Slaughter 2005; global production chains (for example, Hanson, Mataloni, and Slaughter 2005; Harrison and MacMillan 2011; Becker and Muendler 2010). Between 1994 and 2008, Harrison and MacMillan 2011; Becker and Muendler 2010). Between 1994 and 2008, infl ows of foreign direct investment as a share of GDP rose from 2.1 to 3.4 percent infl ows of foreign direct investment as a share of GDP rose from 2.1 to 3.4 percent in low-income countries, rose from 1.3 to 4.4 percent in middle-income countries, in low-income countries, rose from 1.3 to 4.4 percent in middle-income countries, and held steady at 3 percent in China and India. Much less appreciated is the growth and held steady at 3 percent in China and India. Much less appreciated is the growth in in outward foreign direct investment by emerging economies. Outfl ows of foreign foreign direct investment by emerging economies. Outfl ows of foreign direct investment as a share of GDP rose over the 1994 to 2008 period from 0.2 to direct investment as a share of GDP rose over the 1994 to 2008 period from 0.2 to 2.2 percent of GDP in middle-income countries and from 0.2 to 1.2 percent of GDP 2.2 percent of GDP in middle-income countries and from 0.2 to 1.2 percent of GDP in India and China. For comparison, outfl ows of foreign direct investment from in India and China. For comparison, outfl ows of foreign direct investment from high-income countries were 3.6 percent of GDP in 2008.high-income countries were 3.6 percent of GDP in 2008.
Dynamics in SpecializationThe cross-sectional view of trade data seen in the last section highlights what The cross-sectional view of trade data seen in the last section highlights what
appears to be specialization according to comparative advantage, whether Heck-appears to be specialization according to comparative advantage, whether Heck-scher–Ohlin (resource-based) or Ricardian (technology-based) in origin. A dynamic scher–Ohlin (resource-based) or Ricardian (technology-based) in origin. A dynamic view of trade reveals that specialization in low- and middle-income countries can view of trade reveals that specialization in low- and middle-income countries can change rapidly over time.change rapidly over time.
The data from Figure 2C show that for middle-income countries in 1994, The data from Figure 2C show that for middle-income countries in 1994, apparel and footwear was the top sector for net exports, but that by 2008, electronics apparel and footwear was the top sector for net exports, but that by 2008, electronics had displaced it. This change is consistent with middle-income economies accu-had displaced it. This change is consistent with middle-income economies accu-mulating human and physical capital, pushing them out of labor-intensive clothes mulating human and physical capital, pushing them out of labor-intensive clothes and shoes and into more capital-intensive goods (Schott 2003). Low-income coun-and shoes and into more capital-intensive goods (Schott 2003). Low-income coun-tries, including Bangladesh and Vietnam, are moving in to fi ll the space vacated by tries, including Bangladesh and Vietnam, are moving in to fi ll the space vacated by middle-income countries in apparel. The largest changes in specialization occur middle-income countries in apparel. The largest changes in specialization occur in China and India. As shown in Figure 2B, China’s and India’s net exports as a in China and India. As shown in Figure 2B, China’s and India’s net exports as a

The Rise of Middle Kingdoms: Emerging Economies in Global Trade 53
share of GDP decline over 1994–2008 in apparel and footwear, the sector with their share of GDP decline over 1994–2008 in apparel and footwear, the sector with their largest net exports in 1994. Since the early 1990s, China has been moving into more largest net exports in 1994. Since the early 1990s, China has been moving into more sophisticated products, including cellphones and computers. The sector with the sophisticated products, including cellphones and computers. The sector with the largest growth in net exports is electronics, with an increase in net exports to GDP largest growth in net exports is electronics, with an increase in net exports to GDP of 10 percentage points, followed by metals and machinery, each with increases of of 10 percentage points, followed by metals and machinery, each with increases of net exports to GDP of 2.8 percentage points. In the future, China and India may net exports to GDP of 2.8 percentage points. In the future, China and India may acquire comparative advantage in new sectors, such as chemicals or transportation acquire comparative advantage in new sectors, such as chemicals or transportation equipment, as occurred in the last decade with machinery.equipment, as occurred in the last decade with machinery.
China’s recent experience is worth a closer look. Figure 3 shows the share of four China’s recent experience is worth a closer look. Figure 3 shows the share of four (Standard International Trade Classifi cation four-digit) products in China’s total (Standard International Trade Classifi cation four-digit) products in China’s total exports. The fi rst two, footwear and children’s toys, were China’s top two exports exports. The fi rst two, footwear and children’s toys, were China’s top two exports in 1994, the former accounting for 7.3 percent of total shipments and the latter for in 1994, the former accounting for 7.3 percent of total shipments and the latter for 7.0 percent. By 2008, the export shares of these two products had declined to 2.4 7.0 percent. By 2008, the export shares of these two products had declined to 2.4 and 3.5 percent, respectively. Joining shoes and toys among China’s top exports and 3.5 percent, respectively. Joining shoes and toys among China’s top exports are completed computers, with 4.5 percent of total shipments in 2008, making this are completed computers, with 4.5 percent of total shipments in 2008, making this the country’s top export good, and cellphones, TVs, and radio transmitters, with the country’s top export good, and cellphones, TVs, and radio transmitters, with 3.0 percent of total shipments in 2008, making this category China’s third–largest 3.0 percent of total shipments in 2008, making this category China’s third–largest export. China’s transition into computer production happened virtually overnight, export. China’s transition into computer production happened virtually overnight, with most of its export growth in the product occurring between 2002 and 2005.with most of its export growth in the product occurring between 2002 and 2005.
Of course, if China is just progressing from assembling tennis shoes to assem-Of course, if China is just progressing from assembling tennis shoes to assem-bling laptops, the change in its export patterns would not be all that impressive. bling laptops, the change in its export patterns would not be all that impressive.
Figure 3China’s Top Export Products, 1994–2008
Source: Author’s calculations using (World Bank) World Development Indicators and UN Comtrade.
2008
Footwear (SITC 8510)Children’s toys & indoor games (SITC 8942)Completed computers (SITC 7522)Cell phones, TV & radio transmitters (SITC 7643)
2006200420022000199819961994
Shar
e of
Ch
ina’
s to
tal e
xpor
ts
.08
.06
.04
.02
0

54 Journal of Economic Perspectives
While export processing plants continue to account for a large share of China’s While export processing plants continue to account for a large share of China’s total shipments abroad, as Figure 1 showed earlier, China’s exports of computers total shipments abroad, as Figure 1 showed earlier, China’s exports of computers and computer parts have grown much more rapidly than its imports of fi nal and and computer parts have grown much more rapidly than its imports of fi nal and intermediate goods in the sector, suggesting that at least part of China’s graduation intermediate goods in the sector, suggesting that at least part of China’s graduation from apparel to electronics also involves capturing more links in global production from apparel to electronics also involves capturing more links in global production chains. Huawei and Lenovo, companies based in China and controlled by Chinese chains. Huawei and Lenovo, companies based in China and controlled by Chinese investors, are respectively the world’s second-largest manufacturer of mobile investors, are respectively the world’s second-largest manufacturer of mobile telecommunications equipment and the world’s fourth-largest manufacturer of telecommunications equipment and the world’s fourth-largest manufacturer of laptops and personal computers. Over time, China is both manufacturing more laptops and personal computers. Over time, China is both manufacturing more technologically advanced goods and accounting for a larger share of value added technologically advanced goods and accounting for a larger share of value added in their production.in their production.
Is China’s specialization in computers unusual for a country at its level of Is China’s specialization in computers unusual for a country at its level of development? Rodrik (2006) doubts that China’s export strength in electronics is development? Rodrik (2006) doubts that China’s export strength in electronics is attributable to comparative advantage, suggesting instead that the country has used attributable to comparative advantage, suggesting instead that the country has used industrial policy to expand high-tech production. Figure 4 plots countries’ revealed industrial policy to expand high-tech production. Figure 4 plots countries’ revealed comparative advantage in offi ce machines—Standard International Trade Classifi -comparative advantage in offi ce machines—Standard International Trade Classifi -cation (SITC) industry 75—averaged over 2006 to 2008, against the average years of cation (SITC) industry 75—averaged over 2006 to 2008, against the average years of schooling of the adult population in 2005 (Barro and Lee 2010). Revealed compara-schooling of the adult population in 2005 (Barro and Lee 2010). Revealed compara-tive advantage in computers is defi ned as the log ratio of a country’s share of world tive advantage in computers is defi ned as the log ratio of a country’s share of world exports of SITC 75 to its share of world exports of all merchandise.exports of SITC 75 to its share of world exports of all merchandise.33 China is above China is above the regression line, indicating that its specialization in the sector is greater than the regression line, indicating that its specialization in the sector is greater than one would expect given its level of education, but it is hardly an extreme outlier. one would expect given its level of education, but it is hardly an extreme outlier. Other middle-income countries—including Costa Rica, the Philippines, Malaysia, Other middle-income countries—including Costa Rica, the Philippines, Malaysia, and Thailand—have larger positive residuals. While China’s rapid export growth and Thailand—have larger positive residuals. While China’s rapid export growth in electronics grabs one’s attention, its current specialization in the sector does not in electronics grabs one’s attention, its current specialization in the sector does not seem unwarranted given its stock of human capital.seem unwarranted given its stock of human capital.
The results in Figure 4 suggest that international specialization in computers is The results in Figure 4 suggest that international specialization in computers is associated with cross-country variation in the supply of skilled labor. More generally, associated with cross-country variation in the supply of skilled labor. More generally, we would like to know whether the accumulation of human and physical capital by we would like to know whether the accumulation of human and physical capital by middle-income countries explains their rapid progression into electronics, which is middle-income countries explains their rapid progression into electronics, which is visible in Figure 2. The literature has yet to address the issue—which is surprising visible in Figure 2. The literature has yet to address the issue—which is surprising given that the growth of international trade in electronics is perhaps the single most given that the growth of international trade in electronics is perhaps the single most important factor behind the expansion of global production networks.important factor behind the expansion of global production networks.
Another perspective on China’s evolution highlights that while the country is Another perspective on China’s evolution highlights that while the country is shifting into more advanced sectors, it remains locked into producing low-priced shifting into more advanced sectors, it remains locked into producing low-priced goods. Schott (2008) fi nds that the overlap between the products that the U.S. goods. Schott (2008) fi nds that the overlap between the products that the U.S. imports from China and from OECD countries is substantial. Between 1983 and imports from China and from OECD countries is substantial. Between 1983 and 2005, the similarity of the U.S. import bundle from China relative to that for the 2005, the similarity of the U.S. import bundle from China relative to that for the OECD jumped from rank 13 among developing countries to rank 4, behind Korea, OECD jumped from rank 13 among developing countries to rank 4, behind Korea, Mexico, and Taiwan. As of 2005, U.S. imports from China covered 89 percent of Mexico, and Taiwan. As of 2005, U.S. imports from China covered 89 percent of
3 To purge the revealed comparative advantage index of the effects of country size, I use the residuals from a regression of the index on log country population.

Gordon H. Hanson 55
all ten-digit products in the Harmonized System,all ten-digit products in the Harmonized System,44 compared to 97 percent for compared to 97 percent for the OECD as a whole. Despite the breadth in the goods that China exports, and the OECD as a whole. Despite the breadth in the goods that China exports, and the similarity of its product categories with far richer countries, China appears to the similarity of its product categories with far richer countries, China appears to occupy a down-market niche within narrowly defi ned goods. Schott (2008) fi nds a occupy a down-market niche within narrowly defi ned goods. Schott (2008) fi nds a large price discount on Chinese imports in the United States. He regresses the unit large price discount on Chinese imports in the United States. He regresses the unit value (average price) of U.S. imports on product-year dummy variables, the distance value (average price) of U.S. imports on product-year dummy variables, the distance between the United States and the exporting country, the U.S. applied tariff rate on between the United States and the exporting country, the U.S. applied tariff rate on the product, and the exporting country’s per capita GDP. In the 2000s, unit values the product, and the exporting country’s per capita GDP. In the 2000s, unit values on Chinese imports are 48 log points lower than those of other countries.on Chinese imports are 48 log points lower than those of other countries.
4 The trade data used in this paper are based on the Standard International Trade Classifi cation system developed by the United Nations (see ⟨http://unstats.un.org/⟩). Recently, trade data have become available based on the Harmonized System of product classifi cation developed by the World Customs Organization (see ⟨http://www.wcoomd.org/⟩), which provides more disaggregated product categories than are available in the SITC system.
Figure 4Education and Exports of Offi ce Machines
Source: Author’s calculations using (World Bank) World Development Indicators and UN Comtrade.Notes: Figure 4 plots countries’ revealed comparative advantage in offi ce machines—Standard International Trade Classifi cation (SITC) industry 75—averaged over 2006 to 2008, against the average years of schooling of the adult population in 2005. Revealed comparative advantage in computers is defi ned as the log ratio of a country’s share of world exports of SITC 75 to its share of world exports of all merchandise. The countries are indicated by their World Bank abbreviations.
Rev
eale
d co
mpa
rati
ve a
dvan
tage
in
offi
ce m
ach
ines
, 200
6–08
0
5
–5
China
Years of schooling, 2005
0 2 4 14121086

56 Journal of Economic Perspectives
Lower unit values for U.S. imports from China may indicate that the country Lower unit values for U.S. imports from China may indicate that the country produces goods of inferior quality, leading to lower market prices. However, China’s produces goods of inferior quality, leading to lower market prices. However, China’s experience isn’t all that different from some comparison countries. For the 2000s, experience isn’t all that different from some comparison countries. For the 2000s, the discount on unit values for U.S. imports from Korea is 45 log points, from Japan the discount on unit values for U.S. imports from Korea is 45 log points, from Japan is 33 log points, and from Mexico is 59 log points (Schott 2008). Whatever accounts is 33 log points, and from Mexico is 59 log points (Schott 2008). Whatever accounts for the relatively low average prices of U.S. imports from China, its unit values are for the relatively low average prices of U.S. imports from China, its unit values are similar to its neighbors in either geographic or product space. Further, lower average similar to its neighbors in either geographic or product space. Further, lower average import prices do not necessarily imply lower quality. Japan and Korea have a strong import prices do not necessarily imply lower quality. Japan and Korea have a strong reputation for quality. And the success of Lenovo, the Chinese manufacturer of reputation for quality. And the success of Lenovo, the Chinese manufacturer of laptops, demonstrates that the country is capable of producing high-quality goods.laptops, demonstrates that the country is capable of producing high-quality goods.
Hyper-specialized ExportersWe have now seen that: 1) at any moment in time, country specialization by We have now seen that: 1) at any moment in time, country specialization by
broad sector appears to be consistent with standard models of comparative advan-broad sector appears to be consistent with standard models of comparative advan-tage, and 2) over time specialization patterns evolve rapidly, perhaps in line with tage, and 2) over time specialization patterns evolve rapidly, perhaps in line with factor accumulation. Missing in the discussion is information on what is happening factor accumulation. Missing in the discussion is information on what is happening inside the broad sectors. When we drill down, we observe a fi ne degree of specializa-inside the broad sectors. When we drill down, we observe a fi ne degree of specializa-tion in which the exports of low- and middle-income countries are concentrated tion in which the exports of low- and middle-income countries are concentrated in a relatively small number of products (Easterly and Reshef 2009). Such hyper-in a relatively small number of products (Easterly and Reshef 2009). Such hyper-specialization is harder to explain with standard trade models.specialization is harder to explain with standard trade models.
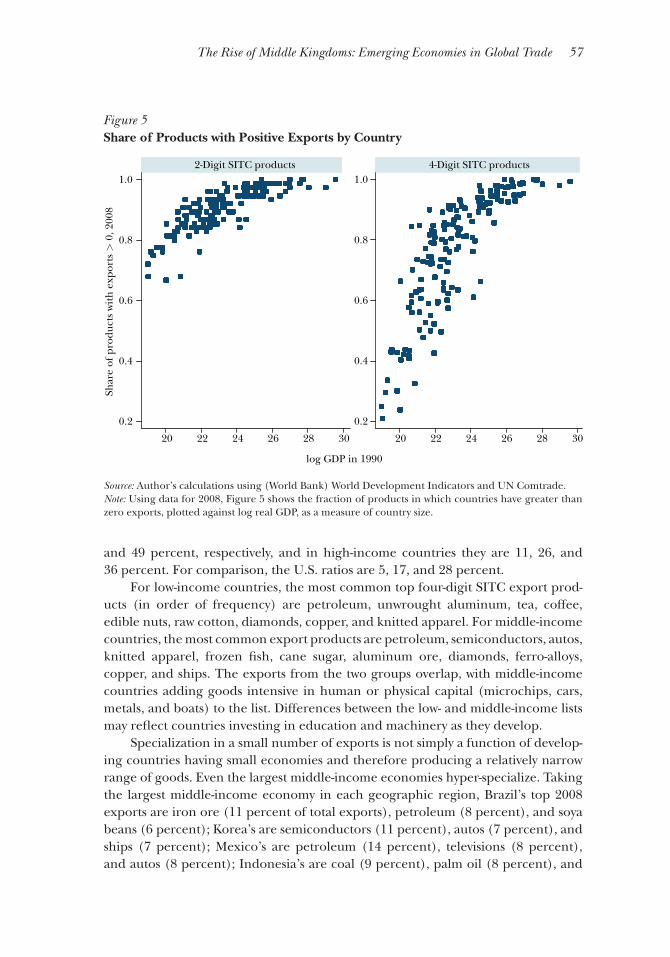
Many developing countries have zero exports in broad swaths of product Many developing countries have zero exports in broad swaths of product space. Using data for 2008, Figure 5 shows the fraction of products in which coun-space. Using data for 2008, Figure 5 shows the fraction of products in which coun-tries have greater than zero exports, plotted against log real GDP, as a measure tries have greater than zero exports, plotted against log real GDP, as a measure of country size. At the two-digit Standard International Trade Classifi cation level, of country size. At the two-digit Standard International Trade Classifi cation level, there are 69 products (examples would include cereals, pharmaceutical products, there are 69 products (examples would include cereals, pharmaceutical products, electrical machinery), and at the four-digit SITC level there are 786 products (for electrical machinery), and at the four-digit SITC level there are 786 products (for example, milled rice, antibiotics, semiconductors). Most countries with GDP of less example, milled rice, antibiotics, semiconductors). Most countries with GDP of less than $3.6 billion (an example would be Senegal) have positive exports in fewer than $3.6 billion (an example would be Senegal) have positive exports in fewer than 60 percent of four-digit products and in fewer than 80 percent of two-digit than 60 percent of four-digit products and in fewer than 80 percent of two-digit products. It is not until countries reach a GDP of $72 billion (Iran) that they tend products. It is not until countries reach a GDP of $72 billion (Iran) that they tend to export the full range of two-digit goods and not until $195 billion (Sweden) that to export the full range of two-digit goods and not until $195 billion (Sweden) that they export the full range of four-digit products.they export the full range of four-digit products.
Further, exports of most countries are concentrated in a small number of Further, exports of most countries are concentrated in a small number of goods. Figure 6 is concerned with the share of a country’s top products in total goods. Figure 6 is concerned with the share of a country’s top products in total trade (its single top product, its four top products, and its eight top products at trade (its single top product, its four top products, and its eight top products at the three-digit SITC level). It shows an export-weighted average of these shares by the three-digit SITC level). It shows an export-weighted average of these shares by country income category for 2000 and 2008. I exclude petroleum exports (although country income category for 2000 and 2008. I exclude petroleum exports (although graphs including them are similar), and I aggregate up to the three-digit level (of graphs including them are similar), and I aggregate up to the three-digit level (of which there are 238 products) to account for reporting anomalies in some coun-which there are 238 products) to account for reporting anomalies in some coun-tries. For low-income countries in 2008, the share of exports accounted for by the tries. For low-income countries in 2008, the share of exports accounted for by the single largest three-digit good is a whopping 21 percent; for the top four goods, single largest three-digit good is a whopping 21 percent; for the top four goods, the share of exports is 45 percent; and for the top eight goods, the share is the share of exports is 45 percent; and for the top eight goods, the share is 58 percent. Hyper-specialization extends beyond poor nations. In middle-income 58 percent. Hyper-specialization extends beyond poor nations. In middle-income countries, the one-, four-, and eight-good export concentration ratios are 16, 37, countries, the one-, four-, and eight-good export concentration ratios are 16, 37,
The Rise of Middle Kingdoms: Emerging Economies in Global Trade 57
and 49 percent, respectively, and in high-income countries they are 11, 26, and and 49 percent, respectively, and in high-income countries they are 11, 26, and 36 percent. For comparison, the U.S. ratios are 5, 17, and 28 percent.36 percent. For comparison, the U.S. ratios are 5, 17, and 28 percent.
For low-income countries, the most common top four-digit SITC export prod-For low-income countries, the most common top four-digit SITC export prod-ucts (in order of frequency) are petroleum, unwrought aluminum, tea, coffee, ucts (in order of frequency) are petroleum, unwrought aluminum, tea, coffee, edible nuts, raw cotton, diamonds, copper, and knitted apparel. For middle-income edible nuts, raw cotton, diamonds, copper, and knitted apparel. For middle-income countries, the most common export products are petroleum, semiconductors, autos, countries, the most common export products are petroleum, semiconductors, autos, knitted apparel, frozen fi sh, cane sugar, aluminum ore, diamonds, ferro-alloys, knitted apparel, frozen fi sh, cane sugar, aluminum ore, diamonds, ferro-alloys, copper, and ships. The exports from the two groups overlap, with middle-income copper, and ships. The exports from the two groups overlap, with middle-income countries adding goods intensive in human or physical capital (microchips, cars, countries adding goods intensive in human or physical capital (microchips, cars, metals, and boats) to the list. Differences between the low- and middle-income lists metals, and boats) to the list. Differences between the low- and middle-income lists may refl ect countries investing in education and machinery as they develop.may refl ect countries investing in education and machinery as they develop.
Specialization in a small number of exports is not simply a function of develop-Specialization in a small number of exports is not simply a function of develop-ing countries having small economies and therefore producing a relatively narrow ing countries having small economies and therefore producing a relatively narrow range of goods. Even the largest middle-income economies hyper-specialize. Taking range of goods. Even the largest middle-income economies hyper-specialize. Taking the largest middle-income economy in each geographic region, Brazil’s top 2008 the largest middle-income economy in each geographic region, Brazil’s top 2008 exports are iron ore (11 percent of total exports), petroleum (8 percent), and soya exports are iron ore (11 percent of total exports), petroleum (8 percent), and soya beans (6 percent); Korea’s are semiconductors (11 percent), autos (7 percent), and beans (6 percent); Korea’s are semiconductors (11 percent), autos (7 percent), and ships (7 percent); Mexico’s are petroleum (14 percent), televisions (8 percent), ships (7 percent); Mexico’s are petroleum (14 percent), televisions (8 percent), and autos (8 percent); Indonesia’s are coal (9 percent), palm oil (8 percent), and and autos (8 percent); Indonesia’s are coal (9 percent), palm oil (8 percent), and
Source: Author’s calculations using (World Bank) World Development Indicators and UN Comtrade.Note: Using data for 2008, Figure 5 shows the fraction of products in which countries have greater than zero exports, plotted against log real GDP, as a measure of country size.
Figure 5Share of Products with Positive Exports by Country
Shar
e of
pro
duct
s w
ith
exp
orts
> 0
, 200
8
0.2
0.4
0.6
0.8
1.02-Digit SITC products 4-Digit SITC products
log GDP in 1990
20 22 24 26 28 30 20 22 24 26 28 30
0.2
0.4
0.6
0.8
1.0

58 Journal of Economic Perspectives
petroleum (7 percent); Poland’s are autos (6 percent), auto parts (5 percent), petroleum (7 percent); Poland’s are autos (6 percent), auto parts (5 percent), and televisions (3 percent); and South Africa’s are platinum (13 percent), coal and televisions (3 percent); and South Africa’s are platinum (13 percent), coal (7 percent), and diamonds (6 percent). Of this group, only Poland’s top three (7 percent), and diamonds (6 percent). Of this group, only Poland’s top three exports account for less than 25 percent of the country’s total foreign shipments. exports account for less than 25 percent of the country’s total foreign shipments. For comparison, the top U.S. exports are aircraft (5 percent), petroleum products For comparison, the top U.S. exports are aircraft (5 percent), petroleum products (4 percent), and microcircuits and transistors (4 percent).(4 percent), and microcircuits and transistors (4 percent).
What explains hyper-specialization in exporting? One account comes from the What explains hyper-specialization in exporting? One account comes from the booming literature on fi rm heterogeneity and trade. Following the empirical fi nd-booming literature on fi rm heterogeneity and trade. Following the empirical fi nd-ings of Bernard and Jensen (1999) that most fi rms do not export, Melitz (2003) ings of Bernard and Jensen (1999) that most fi rms do not export, Melitz (2003) develops a model in which fi rm productivity is a random variable (drawn from a develops a model in which fi rm productivity is a random variable (drawn from a Pareto distribution that is identical across countries) and fi rms face fi xed costs Pareto distribution that is identical across countries) and fi rms face fi xed costs in exporting goods abroad. Helpman, Melitz, and Rubinstein (2008) extend the in exporting goods abroad. Helpman, Melitz, and Rubinstein (2008) extend the Melitz model to account for the fact that the majority of bilateral trade fl ows are Melitz model to account for the fact that the majority of bilateral trade fl ows are zero (that is, most pairs of countries do not trade) (Santos Silva and Tenreyro 2006; zero (that is, most pairs of countries do not trade) (Santos Silva and Tenreyro 2006; Baldwin and Harrigan 2011). Key to their explanation is the perhaps strong assump-Baldwin and Harrigan 2011). Key to their explanation is the perhaps strong assump-tion that the distribution of fi rm productivity is bounded from above, meaning that tion that the distribution of fi rm productivity is bounded from above, meaning that
Figure 6Concentration of Non-Oil Exports in Top Products
Source: Author’s calculations using (World Bank) World Development Indicators and UN Comtrade.Notes: Figure 6 is concerned with the share of a country’s top products in total trade (its single top product, its four top products, and its eight top products at the three-digit SITC level). It shows an export-weighted average of these shares by country income category for 2000 and 2008. I exclude petroleum exports (although graphs including them are similar), and I aggregate up to the three-digit level (of which there are 238 products) to account for reporting anomalies in some countries.
Share of top SITC three-digit product in non-oil exportsShare of top 4 SITC three-digit products in non-oil exportsShare of top 8 SITC three-digit products in non-oil exports
2000
2008
2000
2008
2000
2008
2000
2008
Low-income countries Middle-income countries
High-income countriesChina and India
0 .1 .2 .3 .6.5.4 0 .1 .2 .3 .6.5.4

Gordon H. Hanson 59
in each industry there is a maximum level of productivity that a fi rm can attain. in each industry there is a maximum level of productivity that a fi rm can attain. Consequently, for pairs of countries in which the importer has high trade barriers Consequently, for pairs of countries in which the importer has high trade barriers or a small market, no fi rm in the exporting country will be productive enough to or a small market, no fi rm in the exporting country will be productive enough to justify the fi xed cost of shipping to that market. We will therefore observe zero trade justify the fi xed cost of shipping to that market. We will therefore observe zero trade from the exporter to the importer.from the exporter to the importer.
Returning to Figure 5, the striking fact is that smaller countries have positive Returning to Figure 5, the striking fact is that smaller countries have positive exports of fewer goods. In the Helpman, Melitz, and Rubinstein (2008) model, it is exports of fewer goods. In the Helpman, Melitz, and Rubinstein (2008) model, it is the size of the the size of the importer’s market and not the size of the exporter’s market that predicts market and not the size of the exporter’s market that predicts zero trade. Further, in this model exports will be concentrated zero trade. Further, in this model exports will be concentrated within industries industries (with more productive fi rms doing the lion’s share of the trade) with no obvious (with more productive fi rms doing the lion’s share of the trade) with no obvious pattern pattern between industries (see Bernard, Redding, and Schott 2007, for an exten- industries (see Bernard, Redding, and Schott 2007, for an exten-sion of the Melitz model that incorporates Heckscher–Ohlin features). The Melitz sion of the Melitz model that incorporates Heckscher–Ohlin features). The Melitz model therefore does not offer an obvious account of the hyper-specialization that model therefore does not offer an obvious account of the hyper-specialization that we see in Figure 6.we see in Figure 6.
Can the Eaton and Kortum (2002) Ricardian model explain hyper-specialization? Can the Eaton and Kortum (2002) Ricardian model explain hyper-specialization? Similar to Melitz, the Eaton–Kortum framework allows for heterogeneous fi rm Similar to Melitz, the Eaton–Kortum framework allows for heterogeneous fi rm productivity, but in a Ricardian setting such that country differences in techno-productivity, but in a Ricardian setting such that country differences in techno-logical capabilities dictate the share of import markets captured by exporting logical capabilities dictate the share of import markets captured by exporting countries. Eaton–Kortum would ascribe the patterns of sector specialization in countries. Eaton–Kortum would ascribe the patterns of sector specialization in Figure 2 to country differences in these capabilities (Costinot, Donaldson, and Figure 2 to country differences in these capabilities (Costinot, Donaldson, and Komunjer 2011). To account for the hyper-specialization seen in Figure 6, these Komunjer 2011). To account for the hyper-specialization seen in Figure 6, these capabilities would have to differ sharply across countries. The framework is silent capabilities would have to differ sharply across countries. The framework is silent about where technological capabilities come from, though Chor (2010) fi nds that about where technological capabilities come from, though Chor (2010) fi nds that in cross-section data these capabilities are correlated with country supplies of capital in cross-section data these capabilities are correlated with country supplies of capital and labor and with country institutional characteristics such as fi nancial develop-and labor and with country institutional characteristics such as fi nancial develop-ment and the legal environment. However, there are limits to the applicability of the ment and the legal environment. However, there are limits to the applicability of the Eaton and Kortum approach. It predicts a smoothness to bilateral trade fl ows that Eaton and Kortum approach. It predicts a smoothness to bilateral trade fl ows that does not allow for the preponderance of zeros at the exporter-product level seen does not allow for the preponderance of zeros at the exporter-product level seen in Figure 5. (Eaton, Kortum, and Sotelo 2012 attempt to extend the model to allow in Figure 5. (Eaton, Kortum, and Sotelo 2012 attempt to extend the model to allow for zeros in trade fl ows.) While the Eaton–Kortum model gives us an elegant way of for zeros in trade fl ows.) While the Eaton–Kortum model gives us an elegant way of linking the gravity model of trade to comparative advantage, along the way it loses linking the gravity model of trade to comparative advantage, along the way it loses the extreme specialization of the simple Ricardian model, which matched well with the extreme specialization of the simple Ricardian model, which matched well with trade patterns in many emerging economies.trade patterns in many emerging economies.
A second explanation for hyper-specialization comes from Rodrik (2006) A second explanation for hyper-specialization comes from Rodrik (2006) and Easterly and Reshef (2009), who suggest that exports are subject to exter-and Easterly and Reshef (2009), who suggest that exports are subject to exter-nalities in production. The logic of external economies of scale is that when one nalities in production. The logic of external economies of scale is that when one fi rm expands production in an industry, it lowers costs for other fi rms through fi rm expands production in an industry, it lowers costs for other fi rms through knowledge spillovers or through pecuniary externalities associated with making knowledge spillovers or through pecuniary externalities associated with making inputs available at a lower cost. Externality-based explanations for the location of inputs available at a lower cost. Externality-based explanations for the location of production date back to Alfred Marshall’s (1920) discussion of the development production date back to Alfred Marshall’s (1920) discussion of the development of the English textile industry and are typically associated with understanding of the English textile industry and are typically associated with understanding where and how manufacturing begins and develops. However, the products that where and how manufacturing begins and develops. However, the products that dominate exports for low- and middle-income countries include many primary dominate exports for low- and middle-income countries include many primary commodities. It is not obvious why externalities should be important in the export commodities. It is not obvious why externalities should be important in the export
60 Journal of Economic Perspectives
of soya beans, edible nuts, aluminum ore, or copper. If they are, they have yet to of soya beans, edible nuts, aluminum ore, or copper. If they are, they have yet to be documented in the literature.be documented in the literature.
Available theories of trade are capable of explaining specifi c features of global Available theories of trade are capable of explaining specifi c features of global commerce, such as why trade has a gravity structure, why countries specialize, or commerce, such as why trade has a gravity structure, why countries specialize, or why so few fi rms export, but they do not yet appear capable of explaining the rich why so few fi rms export, but they do not yet appear capable of explaining the rich tableaux of trade patterns that we observe through the growing importance of low- tableaux of trade patterns that we observe through the growing importance of low- and middle-income countries in the world economy. Countries at different income and middle-income countries in the world economy. Countries at different income levels produce different types of goods; specialize according to broad sector and, levels produce different types of goods; specialize according to broad sector and, within these sectors, in a relatively small number of products; export many goods within these sectors, in a relatively small number of products; export many goods not at all; and are capable of progressing rapidly up the ladder in terms of product not at all; and are capable of progressing rapidly up the ladder in terms of product sophistication. A model that could explain these outcomes would need prominent sophistication. A model that could explain these outcomes would need prominent roles for comparative advantage, for extreme specialization even in larger countries, roles for comparative advantage, for extreme specialization even in larger countries, and for rapid changes in specialization associated with factor accumulation or tech-and for rapid changes in specialization associated with factor accumulation or tech-nological progress.nological progress.
Final Discussion
The dramatic growth of China, India, and other middle-income nations is trans-The dramatic growth of China, India, and other middle-income nations is trans-forming the global economy. It is changing who trades with whom, how production forming the global economy. It is changing who trades with whom, how production is organized across borders, and how the global gains from trade are distributed. is organized across borders, and how the global gains from trade are distributed. Research is just beginning to take stock of the emerging-economy trade boom. An Research is just beginning to take stock of the emerging-economy trade boom. An active body of work seeks to explain China’s growth (Song, Storesletten, and Zilibotti active body of work seeks to explain China’s growth (Song, Storesletten, and Zilibotti 2011), its implications for global welfare (Hsieh and Ossa 2011; Levchenko and 2011), its implications for global welfare (Hsieh and Ossa 2011; Levchenko and Zhang 2011), and its effect on economies of high-income countries (for example, Zhang 2011), and its effect on economies of high-income countries (for example, Bernard, Jensen, and Schott 2006; Bloom, Draca, and Van Reenan 2011; Autor, Bernard, Jensen, and Schott 2006; Bloom, Draca, and Van Reenan 2011; Autor, Dorn, and Hanson 2011). Other literature examines motivations for offshoring Dorn, and Hanson 2011). Other literature examines motivations for offshoring and global production networks (for example, Yi 2003; Feenstra and Hanson and global production networks (for example, Yi 2003; Feenstra and Hanson 2005; Hanson, Mataloni, and Slaughter 2005; Grossman and Ross-Hansberg 2008; 2005; Hanson, Mataloni, and Slaughter 2005; Grossman and Ross-Hansberg 2008; Costinot, Vogel, and Wang 2011). We know less about the empirical determinants of Costinot, Vogel, and Wang 2011). We know less about the empirical determinants of export specialization, the dynamics of specialization patterns, or why South-South export specialization, the dynamics of specialization patterns, or why South-South trade looks so different from North-North trade.trade looks so different from North-North trade.
As we look ahead to this research agenda, what are the questions that need to be As we look ahead to this research agenda, what are the questions that need to be answered? I can think of at least four. First, how much of the recent growth in global answered? I can think of at least four. First, how much of the recent growth in global trade represents real value added? We know that for trade in manufactures, the share trade represents real value added? We know that for trade in manufactures, the share of national value added in export shipments is relatively low. China’s export success of national value added in export shipments is relatively low. China’s export success is based in part on export processing plants that import parts and components and is based in part on export processing plants that import parts and components and assemble them into fi nal goods to ship abroad. Is the value-added share in exports assemble them into fi nal goods to ship abroad. Is the value-added share in exports rising or falling over time? Is production becoming more or less fragmented across rising or falling over time? Is production becoming more or less fragmented across borders? How much of the rising share of exports to GDP in developing countries borders? How much of the rising share of exports to GDP in developing countries represents a true increase in specialization for foreign markets?represents a true increase in specialization for foreign markets?
Second, what explains hyper-specialization in exporting? The tendency Second, what explains hyper-specialization in exporting? The tendency for countries to rely on a handful of products for most of their exports makes it for countries to rely on a handful of products for most of their exports makes it tempting to see nonconvexities at work, such as informational spillovers in learning tempting to see nonconvexities at work, such as informational spillovers in learning
The Rise of Middle Kingdoms: Emerging Economies in Global Trade 61
about foreign markets or industry-level distribution networks whose creation entails about foreign markets or industry-level distribution networks whose creation entails substantial up-front investments. But the goods that tend to top the list of devel-substantial up-front investments. But the goods that tend to top the list of devel-oping country exports look less like products that are information-intensive and oping country exports look less like products that are information-intensive and more like ones that require the availability of mineral reserves (copper, iron ore) more like ones that require the availability of mineral reserves (copper, iron ore) or specifi c types of agricultural land (soya beans, tea). Is the high degree of export or specifi c types of agricultural land (soya beans, tea). Is the high degree of export specialization in developing countries consistent with comparative advantage?specialization in developing countries consistent with comparative advantage?
Third, is China’s government pushing the country up the product ladder? Third, is China’s government pushing the country up the product ladder? China’s rapid transition from producing shoes and dolls to laptops and cellphones China’s rapid transition from producing shoes and dolls to laptops and cellphones has created anxiety both in high-income countries that see their competitive advan-has created anxiety both in high-income countries that see their competitive advan-tage in high-tech goods eroding and in emerging economies that fear being left tage in high-tech goods eroding and in emerging economies that fear being left in China’s shadow. But along with its changing export specialization, China has in China’s shadow. But along with its changing export specialization, China has increased its supply of educated labor, attracted investment by multinational fi rms, increased its supply of educated labor, attracted investment by multinational fi rms, and improved its transportation and communications infrastructure, making it and improved its transportation and communications infrastructure, making it plausible that its advantage in electronics is natural and not induced by an indus-plausible that its advantage in electronics is natural and not induced by an indus-trial policy that selectively supports certain industries. Since economists know little trial policy that selectively supports certain industries. Since economists know little about the deep determinants of national export specialization patterns, we have about the deep determinants of national export specialization patterns, we have little basis for saying whether or not China’s export success is unwarranted.little basis for saying whether or not China’s export success is unwarranted.
Finally, what effect has the global commodity boom had on living standards in Finally, what effect has the global commodity boom had on living standards in low-income countries? China’s and India’s immense demand for raw materials has low-income countries? China’s and India’s immense demand for raw materials has meant a sharp increase in the terms of trade for commodity exporters, including meant a sharp increase in the terms of trade for commodity exporters, including many countries in Sub-Saharan Africa. Has the commodity export boom reduced many countries in Sub-Saharan Africa. Has the commodity export boom reduced absolute poverty or otherwise improved the quality of life in the developing absolute poverty or otherwise improved the quality of life in the developing world? Conversely, have low-income countries that are commodity importers seen world? Conversely, have low-income countries that are commodity importers seen a decline in their material well-being? Since the 1980s, the World Bank and the a decline in their material well-being? Since the 1980s, the World Bank and the IMF have been preaching that trade liberalization is part of the path to prosperity IMF have been preaching that trade liberalization is part of the path to prosperity for developing economies. Yet the literature so far (for example, Goldberg and for developing economies. Yet the literature so far (for example, Goldberg and Pavcnik 2007) has not established that lower trade barriers make the poor in those Pavcnik 2007) has not established that lower trade barriers make the poor in those countries better off.countries better off.
References
Amiti, Mary, and Caroline Freund. 2010. “The Anatomy of China’s Export Growth” with a comment by Bin Xu. In China’s Growing Role in World Trade, edited by Robert Feenstra and Shang-Jin Wei, 35–61. Chicago: NBER and University of Chicago Press.
Anderson, James E, and Eric van Wincoop. 2004. “Trade Costs.” Journal of Economic Literature 42(3): 691–761.
Autor, David, David Dorn, and Gordon H. Hanson. 2011. “The China Syndrome: Local Labor Market Effects of Impacts of Import Competition in the United States.” http://irps.ucsd.edu/assets/001/502434.pdf.
Baldwin, Richard E., and James Harrigan. 2011. “Zeros, Quality, and Space: Trade Theory and Trade Evidence.” American Economic Journal: Microeconomics 3(2): 60–88.

62 Journal of Economic Perspectives
Barro, Robert J., and Jong-Wha Lee. 2010. “A New Data Set of Educational Attainment in the World, 1950–2010.” NBER Working Paper 15902.
Becker, Sascha O., and Marc-Andreas Muendler. 2010. “Margins of Multinational Labor Substitution.” American Economic Review 100(5): 1999–2030.
Bergin, Paul R., Robert C. Feenstra, and Gordon H. Hanson. 2009. “Offshoring and Volatility: Evidence from Mexico’s Maquiladora Industry.” American Economic Review 99(4): 1664–71.
Bernard, Andrew B., and J. Bradford Jensen. 1999. “Exceptional Exporter Performance: Cause, Effect, or Both.” Journal of International Economics 47(1): 1–25.
Bernard, Andrew B., J. Bradford Jensen, and Peter K. Schott. 2006. “Survival of the Best Fit: Exposure to Low-Wage Countries and the (Uneven) Growth of U.S. Manufacturing Plants.” Journal of International Economics 68(1): 219–37.
Bernard, Andrew B., Stephen Redding, and Peter K. Schott. 2007. “Comparative Advantage and Heterogeneous Firms.” Review of Economic Studies 74(1): 31–66.
Bloom, Nicholas, Mirko Draca, and John Van Reenen. 2011. “Trade Induced Technical Change? The Impact of Chinese Imports on Innovation, IT, and Productivity.” NBER Working Paper 16717.
Cadot, Olivier, Céine Carrère, and Vanessa Strauss-Kahn. 2011. “Export Diversifi cation: What’s behind the Hump?” Review of Economics and Statis-tics 93(2): 590–605.
Chor, Davin. 2010. “Unpacking Sources of Comparative Advantage: A Quantitative Approach.” Journal of International Economics 82(2): 152–67.
Costinot, Arnaud, David Donaldson, and Ivana Komunjer. 2011. “What Goods Do Countries Trade? A Quantitative Exploration of Ricardo’s Ideas.” Review of Economic Studies, published online September 28.
Costinot, Arnaud, Jonathan Vogel, and Su Wang. 2011. “An Elementary Theory of Global Supply Chains.” NBER Working Paper 16936.
Easterly, William, and Ariell Reshef. 2009. “Big Hits in Manufacturing Exports and Development.” http://williameasterly.files.wordpress.com/2010/08/4_easterly_reshef_bighitsinmanufacturingexportsanddevelopment_wp.pdf.
Eaton, Jonathan, and Samuel Kortum. 2002. “Technology, Geography, and Trade.” Econometrica 70(5): 1741–79.
Eaton, Jonathan, Samuel S. Kortum, and Sebas-tian Sotelo. 2012. “International Trade: Linking Micro and Macro.” NBER Working Paper 17864.
Feenstra, Robert C. 2003. Advanced International Trade: Theory and Evidence. Princeton: Princeton University Press.
Feenstra, Robert C. 2010. Offshoring in the Global Economy: Microeconomic Structure and Macroeconomic Implications. Cambridge, MA: MIT Press.
Feenstra, Robert C., and Gordon H. Hanson. 2005. “Ownership and Control in Outsourcing to China: Estimating the Property-Rights Theory of the Firm.” Quarterly Journal of Economics 120(2): 729–61.
Goldberg, Pinelopi Koujianou, and Nina Pavcnik. 2007. “Distributional Effects of Globaliza-tion in Developing Countries.” Journal of Economic Literature 45(1): 39–82.
Grossman, Gene M., and Esteban Rossi-Hansberg. 2008. “Trading Tasks: A Simple Theory of Offshoring.” American Economic Review 98(5): 1978–97.
Hanson, Gordon H., Raymond J. Mataloni, and Matthew J. Slaughter. 2005. “Vertical Produc-tion Networks in Multinational Firms.” Review of Economics and Statistics 87(4): 664–78.
Harrigan, James, and Haiyan Deng. 2010. “China’s Local Comparative Advantage.” In China’s Growing Role in World Trade, edited by Robert C. Feenstra and Shang-jin Wei, 109–136. Chicago: University of Chicago Press.
Harrison, Ann, and Margaret McMillan. 2011. “Offshoring Jobs? Multinationals and U.S. Manu-facturing Employment.” Review of Economics and Statistics 93(3): 857–75.
Helpman, Elhanan, and Paul R. Krugman. 1985. Market Structure and Foreign Trade: Increasing Returns, Imperfect Competition, and the International Economy. Cambridge, MA: MIT Press.
Helpman, Elhanan, Marc J. Melitz, and Yona Rubinstein. 2008. “Estimating Trade Flows: Trading Partners and Trading Volumes.” Quarterly Journal of Economics 123(2): 441–87.
Hsieh, Chang-Tai, and Peter J. Klenow. 2009. “Misallocation and Manufacturing TFP in China and India.” Quarterly Journal of Economics 124(4): 1403–48.
Hsieh, Chang-Tai, and Ralph Ossa. 2011. “A Global View of Productivity Growth in China.” NBER Working Paper 16778.
Hummels, David. 2007. “Transportation Costs and International Trade in the Second Era of Globalization.” Journal of Economic Perspectives 21(3): 131–54.
Hummels, David, June Ishii, and Kei-Mu Yi. 2001. “The Nature and Growth of Vertical Special-ization in World Trade.” Journal of International Economics 54(1): 75–96.
Imbs, Jean, and Romain Wacziarg. 2003. “Stages of Diversifi cation.” American Economic Review 93(1): 63–86.
Johnson, Robert C., and Guillermo Noguera. 2012. “Accounting for Intermediates: Production

Gordon H. Hanson 63
Sharing and Trade in Value Added.” Journal of International Economics 86(2): 224–36.
Koopmans, Robert, William Powers, Zhi Wang, and Shang-Jin Wei. 2010. “Give Credit where Credit Is Due: Tracing Value Added in Global Production Chains.” NBER Working Paper 16426.
Levchenko, Andrei A., and Jing Zhang. 2011. “The Evolution of Comparative Advantage: Measurement and Welfare Implications.” NBER Working Paper 16806.
Marshal, Alfred. 1920. Principals of Economics. New York: MacMillan.
Melitz, Marc J. 2003. “The Impact of Trade on Intra-industry Reallocations and Aggregate Industry Productivity.” Econometrica 71(6): 1695–1725.
Rose, Andrew K. 2004a. “Do We Really Know that the WTO Increases Trade?” American Economic Review 94(1): 98–114.
Rose, Andrew K. 2004b. “Do WTO Members Have More Liberal Trade Policy?” Journal of Inter-national Economics 63(2): 209–35.
Rodrik, Dani. 2006. “What’s So Special about China’s Exports?” China and the World Economy 14(5): 1–19.
Rodrik, Dani, and Arvind Subramanian. 2004. “From Hindu Growth to Productivity Surge: The Mystery of the Indian Growth Transition.” NBER Working Paper 10376.
Santos Silva, J. M. C., and Silvana Tenreyro. 2006. “The Log of Gravity.” Review of Economics and Statistics 88(4): 641–58.
Schott, Peter K. 2003. “One Size Fits All? Heckscher–Ohlin Specialization in Global Production.” American Economic Review 93(3): 686–708.
Schott, Peter K. 2004. “Across-Product versus Within-Product Specialization in International Trade.” Quarterly Journal of Economics 119(2): 647–78.
Schott, Peter K. 2008. “The Relative Sophistica-tion of Chinese Exports.” Economic Policy 22(53): 5–49.
Song, Zheng, Kjetil Storesletten, and Fabrizio Zilibotti. 2011. “Growing Like China.” American Economic Review 101(1): 196–233.
Yi, Kei-Mu. 2003. “Can Vertical Specialization Explain the Growth of World Trade?” Journal of Political Economy 111(1): 52–102.

64 Journal of Economic Perspectives

This article has been cited by:
1. Marcel P. Timmer, Abdul Azeez Erumban, Bart Los, Robert Stehrer, Gaaitzen J. de Vries. 2014.Slicing Up Global Value Chains†. Journal of Economic Perspectives 28:2, 99-118. [Abstract] [ViewPDF article] [PDF with links]
2. Jonathan A. Schwabish. 2014. An Economist's Guide to Visualizing Data†. Journal of EconomicPerspectives 28:1, 209-234. [Abstract] [View PDF article] [PDF with links]