Embed Size (px)
Citation preview
3
Key Indicators for Asia and the Pacific 2010
SPECIAL CHAPTER
1. Introduction
There has been considerable interest in recent years in the impressive emergence and growth of the Asian middle class, particularly in the wake of the “Great Recession” of 2008–09 in the United States (US) and Europe. Policymakers are wondering how great a role the Asian middle class can play in the coming years and decades in the necessary rebalancing of the world economy. US and European households are engaged in a long and painful process of deleveraging—increasing savings to reduce high debt levels and rebuild lost wealth—which will limit the extent to which they can drive global consumption.
Consumer spending in developing Asia, meanwhile, has shown surprising resilience, even during the recession. It reached an estimated $4.3 trillion in annual expenditures in 2008—nearly a third of private consumption in the Organisation for Economic Co-operation and Development (OECD) countries. Assuming consumption expenditures continue to grow at roughly the same rate as in the past 20 years they are likely to reach $32 trillion and comprise about 43% of worldwide consumption by 2030, placing the region at the forefront of worldwide consumption (Chun 2010a). On this count, as developing Asia’s people secure their middle-class status, its emerging consumers are very much expected to become the next global consumers and assume the traditional role of the US and European middle classes. Moreover, given the call for "rebalancing" Asian economies from export-led to domestic-led consumption growth—to reduce exposure to negative shocks from regional economies outside of Asia (ADO 2009)—it is expected that this process will depend highly on the emergence and expansion of the Asian middle class. This can create more stable and efficient poverty reduction and economic development.
However, as the special chapter argues, this is not a given. While 56% of developing Asia’s population,1 or nearly 1.9 billion people, were already considered part of the middle class based on an absolute definition of per capita consumption of $2–$20 per day in 2008, nearly 1.5 billion Asians were still living on less than $2.0 per day. Moreover, the majority of the Asian middle class still 1 Developing Asia in the special chapter generally refers to 22
countries; Armenia, Azerbaijan, Bangladesh, Cambodia, People’sRepublic of China, Georgia, India, Indonesia, Kazakhstan, KyrgyzRepublic, Lao People’s Democratic Republic,Malaysia,Mongolia,Nepal, Pakistan, Philippines, Sri Lanka, Tajikistan, Thailand,Turkmenistan, Uzbekistan, and Viet Nam. These countries wereselectedonthebasisofdataavailability,andcomprise96%ofthepopulationoftheAsian’sDevelopmentBank’sdevelopingmembercountries.Whentheanalysisdoesnotrefertoallcountriesinthislist,thatisindicated.Foracompletelistofthecountrieswithinthisregionandtheotherregionspresentedinthechapter,pleaseseeAppendixTable1.
falls in the $2–$4 range, leaving them highly vulnerable to slipping back into poverty due to economic shocks. Thus, for the middle class to become a prominent force it will likely depend on its size and spending levels and characteristics. It will require governments to introduce policies that bolster the incomes of those already in the middle class. It will also require social policies to expand the middle class—such as through greater spending in education and health. Through these, it is possible to build a strong and stable middle class that continues to grow.
The focus on the middle class and policies for promoting it is rooted in the belief that the middle class is an important prerequisite for stronger, more sustainable economic growth and development. Economic historians such as Adelman and Morris (1967) and Landes (1998), among others, have argued that the middle class was a driving force in the faster pace of economic development in the United Kingdom and continental Europe in the 19th century. According to the “political economy” argument, societies with a small middle class are generally extremely polarized, and find it difficult to reach consensus on economic issues; they are overly focused on the redistribution of resources between the elite and the impoverished masses, each of which alternates in controlling political power. Societies with a larger middle class are much less polarized and can more easily reach consensus on a broad range of issues and decisions relevant to economic development (Alesina 1994).
Easterly (2001) has developed the latter argument further. According to him, a “middle-class consensus”—defined as a situation of relative equality and ethnic homogeneity in a society—facilitates economic growth by allowing society to agree on the provision of public goods critical to economic development. These include goods such as public education, public health services, and physical infrastructure (e.g. roads and electricity). The elites in control of government in societies without a middle-class consensus tend to underinvest in such goods for fear they will empower opposing factions. In testing this hypothesis, Easterly estimated regressions of economic growth, per-capita income, human capital accumulation, and infrastructure on ethnic diversity (measured by a linguistic fractionalization index) and the size of the middle class (measured as the income share of the middle three income quintiles), using cross-country data on about 175 countries circa 1990.2
2 Toaccountforthepossibleendogeneityofthemiddle-classincomesharevariable(i.e.,thepossibilitythatthecausalitygoesfromeconomicgrowthtothesizeofthemiddleclassinsteadoftheotherwayaround),Easterlyemploysaninstrumentalvariableestimationprocedure,usingthetropicallocationofacountryandwhetheritisanon-oilcommodityexporteroranoilexporterasidentifyinginstruments.
KI2010-Special-Chapter.indd 3 8/12/10 7:01 PM
4
Key Indicators for Asia and the Pacific 2010
THE RISE OF ASIA’S MIddLE CLASS
Easterly finds that, after controlling for ethnic diversity and other control variables, the size of the middle class strongly influences (in the ‘correct’ direction) several variables. These include per capita income, growth of per capita income (over 1950–92), a host of health and educational outcomes (such as secondary and tertiary enrollment rates, life expectancy, infant mortality, and child immunization rates), physical infrastructure, several policy variables (e.g., financial depth, intensity of international trade, inflation, and exchange rate overvaluation), and indicators of democracy and political stability (e.g., civil liberties, political rights, and the incidence of revolutions and coups). His empirical results support the idea that elite-dominated societies typically accumulate less human and infrastructure capital, are less democratic, and formulate worse macroeconomic and trade policies than societies with a large middle class.
Sridharan (2004) makes a similar argument for India. The emergence of a 100–250 million-sized middle class during the 1980s and 1990s, he says, has dramatically changed India’s class structure—from one of a small elite and a large impoverished class—to one dominated by a large intermediate class. According to him, “… the elite-mass class cleavage tended to support a broadly socialistic ideology, while the elite-middle-mass differentiation has created a broader base for capitalism – hence the increased support for economic liberalization.” That successive Indian governments since 1991, from across the political spectrum, have continued to support economic reforms and liberalization, supports his thesis.
Besides helping to reach consensus, Banerjee and Duflo (2008) have discussed three mechanisms through which a large middle class could promote development. First, the middle class may provide the entrepreneurs who create employment and productivity growth in a society.3 Second, “middle-class values”—that is, the values of accumulation of human capital and savings—are critical to economic growth.4 And third, with its willingness and ability to pay extra for higher-quality products, the middle class drives demand for high-quality consumer goods, the production of which typically presents increasing returns to scale. This encourages firms to invest in production and marketing, raising income levels for everyone.5
3 AcemogluandZilibotti(1997)developtheanalyticalargumentforthismechanism.However,basedonanalysisofhouseholdsurveydatafromseveraldevelopingcountries,BanerjeeandDuflo(2008)donotfindthatentrepreneursareover-representedamongthemiddleclass(relativetothepoor).
4 DoepkeandZilibotti(2005,2008)developthisargument.
5 TheanalyticalmodelforthisargumentisdevelopedinMurphy,ShleiferandVishny(1989).
Another reason often cited for the importance of a large middle class is that the poor are too liquidity-constrained to accumulate human capital, a key ingredient in sustained economic development (Galor and Zeira 1993, Alesina and Rodrik 1994). As the middle class grows it raises investment in human capital and, in turn, drives national economic growth. But the causality can also go the other way, with human capital accumulation (typically education) pulling more of the poor into the middle class.
The middle class is not easily defined as it is not necessarily a distinct or unique group in society that has very different attributes or values than other social classes. It may simply represent a range along the income continuum (a group that lies between the poor and the rich) and social class (a group lying between the working class and the ‘upper’ class). To the extent that variables such as consumer spending and education vary monotonically with income, the middle class will possess higher values of these attributes than the poor (but less than the rich).
Is an emphasis on the middle class inimical to the interests of the poor? Most researchers say no. Indeed, Birdsall (2010) argues that “… in the advanced economies the poor have probably benefited from the rule of law, legal protections, and in general the greater accountability of government that a large and politically independent middle class demands, and from the universal and adequately funded education, health and social insurance programs a middle class wants and finances through the tax system… A focus on the middle class does not exclude a focus on the poor but extends it, including on the grounds that growth that is good for the large majority of people in developing countries is more likely to be economically and politically sustainable, both for economic and political reasons.”
Asia’s large population and the rapid expansion of its middle class during a period of global economic rebalancing is fundamentally important as a driver not only of the Asian economy but also the global economy. However greater middle class wealth and consumption is only one factor in the region’s increasing importance. The rise of its middle class is likely to aid not only the growth process, but also result in substantial social, political, and environmental changes. Thus, the contention is that, building on strong growth and continued progress in reducing poverty in Asia, developing a stable middle class requires governments to formulate and implement middle class-friendly policies. In turn, this requires understanding and analyzing the characteristics of the middle class, the factors contributing to its growth, and the various implications—positive and negative—of its rise. These are some of the issues this special chapter addresses.
KI2010-Special-Chapter.indd 4 8/12/10 7:01 PM
5
Key Indicators for Asia and the Pacific 2010
SPECIAL CHAPTERTHE RISE OF ASIA’S MIddLE CLASS
2. Asia’sEmergingMiddleClass:Past,Present,AndFuture
A. DefiningtheMiddleClass
Unlike poverty, which can be defined in absolute terms based on caloric requirements, there is no standard definition of the middle class. Different researchers use different criteria—some absolute, others relative. This report uses an absolute approach defining the middle class as those with consumption expenditures of $2–$20 per person per day in 2005 PPP $.6
Easterly (2001) and others have defined the middle class as those in the second, third, and fourth quintile of the distribution of per capita consumption expenditure, while Birdsall, Graham and Pettinato (2000) have defined it to include individuals earning between 75% and 125% of a society’s median per capita income.
Other researchers have also defined the middle class in absolute terms. Banerjee and Duflo (2008) have used two alternative absolute measures—individuals with daily per capita expenditures of $2–$4 and with daily per capita expenditures of $6–$10. By excluding individuals who would be considered rich in the poorest advanced countries (Portugal) and poor in the richest advanced societies (Luxembourg), Kharas (2010) comes up with daily expenditures of $10–$100 per person, after adjusting household distribution data with national accounts means, as the criterion for a “global middle class”.
Ravallion (2009) has distinguished the “developing world’s middle class” from the “Western world middle class.” To define the former, he uses the median value of poverty lines for 70 national poverty lines as the lower bound ($2 per person per day) and the US poverty line ($13) as the upper bound. Bussolo, De Hoyos, Medvedev, and van der Mensbrugghe (2007) and Bussolo, De Hoyos and Medvedev (2009) have defined the middle class as those with average daily incomes between the poverty lines of Brazil ($10) and Italy ($20).
Finally, Birdsall (2007) has used a hybrid definition that combines the absolute and the relative approaches. According to her, the middle class includes individuals who consume the equivalent of $10 or more per day, but who
6 Throughoutthechapter,theincomerangesreferto2005PPP$perpersonperday,exceptwhereotherwisenoted.
fall below the 90th percentile in the income distribution.7 Her rationale for using the absolute global threshold for the lower bound is that people with consumption below this level are just too poor to be middle class in any society, while her rationale for using the relative and local threshold is to exclude people who are rich in their own society.
The above definitions are all based on consumption expenditure or income. However, the middle class can also be defined in other ways. Historically, in feudal Europe, the middle class represented the group falling between the peasantry and the nobility. Sociologists have typically defined the Western middle class on the basis of education and occupation in a white-collar job.
Since the objective of this chapter is to estimate the size of the middle class across the developing Asian countries considered, over time, it generally uses an absolute approach. In particular, its $2–$20 range of defining the middle class is divided into three groups. The lower-middle class—consuming $2–$4 per person per day—is very vulnerable to slipping back into poverty at this level, which is only slightly above the developing-world poverty line of $1.25 per person per day used by Ravallion, Chen, and Sangraula (2008). The “middle-middle” class—at $4–$10—is living above subsistence and able to save and consume nonessential goods. The upper-middle class consumes $10–$20 per day (roughly the poverty lines of Brazil and Italy, respectively).
The analysis uses a variety of data sources to create the income/consumption distributions and determine the size of the middle class in the different countries. For developing countries, the World Bank’s PovcalNet database is the primary source of the distribution data. For OECD and high-income countries in Asia, it uses decile and quantile distributions compiled by the UNU-WIDER World Income Inequality Database (WIID). It applies mean income or consumption expenditure levels from either household surveys or national accounts to these distributional data to estimate the share and size of the middle class. (See Appendix 1 for details of the data and estimation procedures.)
7 Birdsall(2010)changesthedefinitionofthemiddleclasstoexcludeonlythetop5%(asopposedto10%)oftheincomedistribution.
KI2010-Special-Chapter.indd 5 8/12/10 7:01 PM
6
Key Indicators for Asia and the Pacific 2010
THE RISE OF ASIA’S MIddLE CLASS
B. TheSizeandGrowthofDevelopingAsia’sMiddleClass
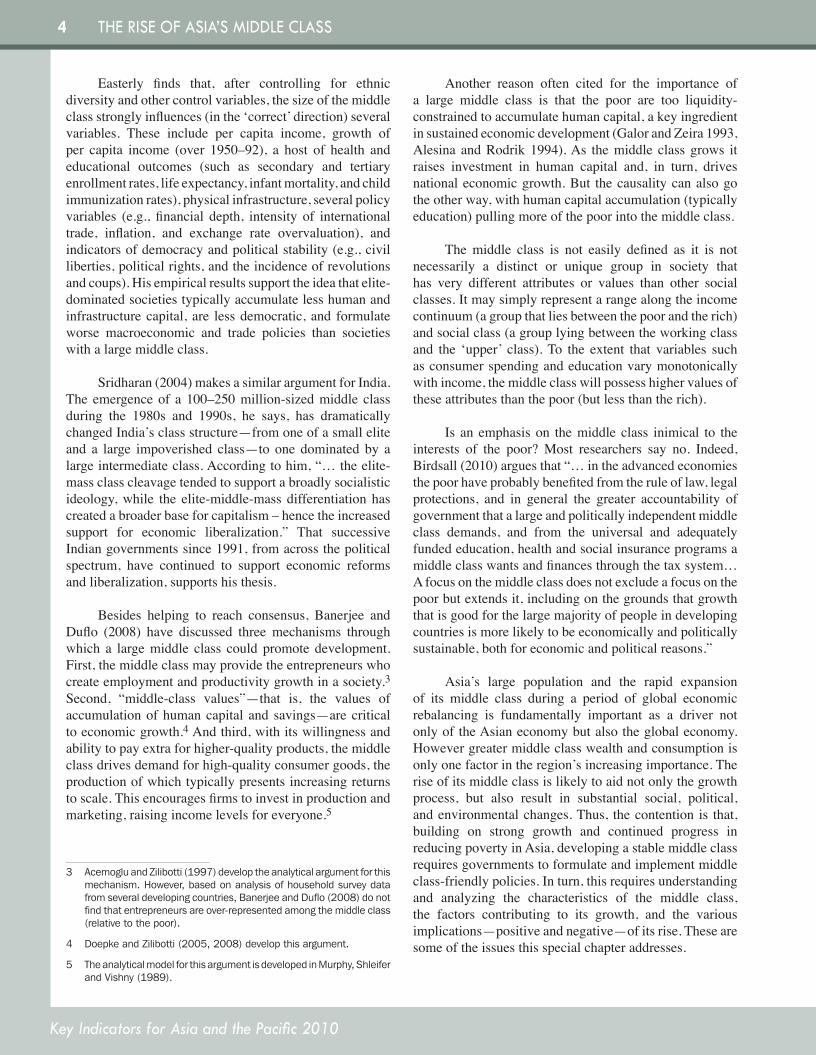
Developing Asia’s middle class ($2–$20) has grown dramatically relative to other world regions in the last couple decades (Tables 2.1 and 2.2).8, 9 While it made up only 21% of the population of the developing Asian countries in 1990 (using survey data), it more than doubled to 56% by 2008; up more than three-fold from 565 million in 1990 to 1.9 billion in 2008 in absolute terms. During the same period, developing Asia’s aggregate annual
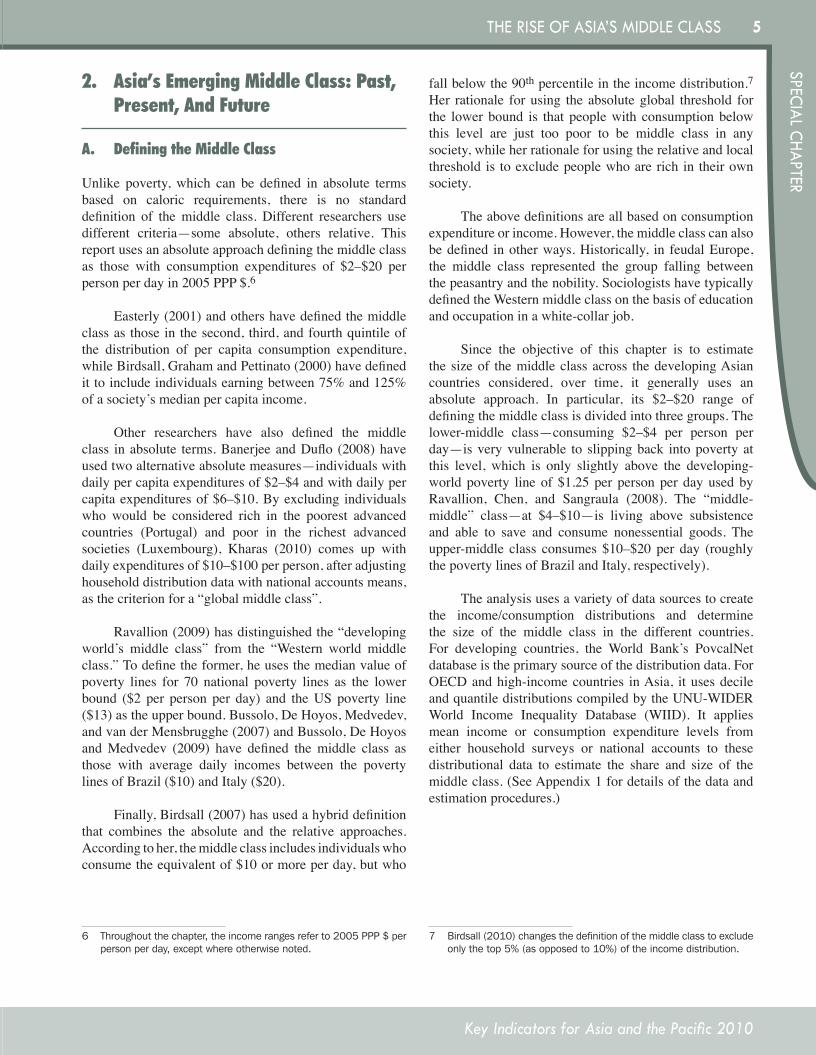
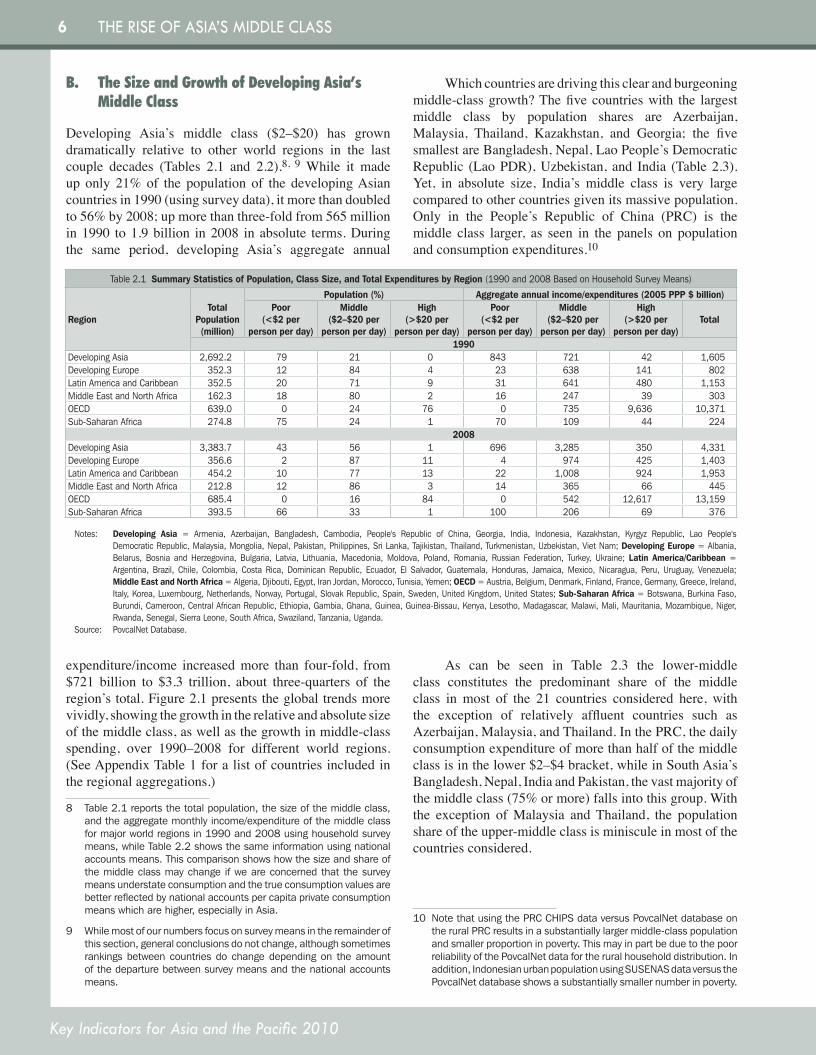
expenditure/income increased more than four-fold, from $721 billion to $3.3 trillion, about three-quarters of the region’s total. Figure 2.1 presents the global trends more vividly, showing the growth in the relative and absolute size of the middle class, as well as the growth in middle-class spending, over 1990–2008 for different world regions. (See Appendix Table 1 for a list of countries included in the regional aggregations.)
8 Table2.1reportsthetotalpopulation,thesizeofthemiddleclass,andtheaggregatemonthlyincome/expenditureofthemiddleclassformajorworldregionsin1990and2008usinghouseholdsurveymeans,whileTable2.2showsthesameinformationusingnationalaccountsmeans.Thiscomparisonshowshowthesizeandshareofthemiddleclassmaychange ifweareconcernedthatthesurveymeansunderstateconsumptionandthetrueconsumptionvaluesarebetterreflectedbynationalaccountspercapitaprivateconsumptionmeanswhicharehigher,especiallyinAsia.
9 Whilemostofournumbersfocusonsurveymeansintheremainderofthissection,generalconclusionsdonotchange,althoughsometimesrankingsbetweencountriesdo changedependingon theamountofthedeparturebetweensurveymeansandthenationalaccountsmeans.
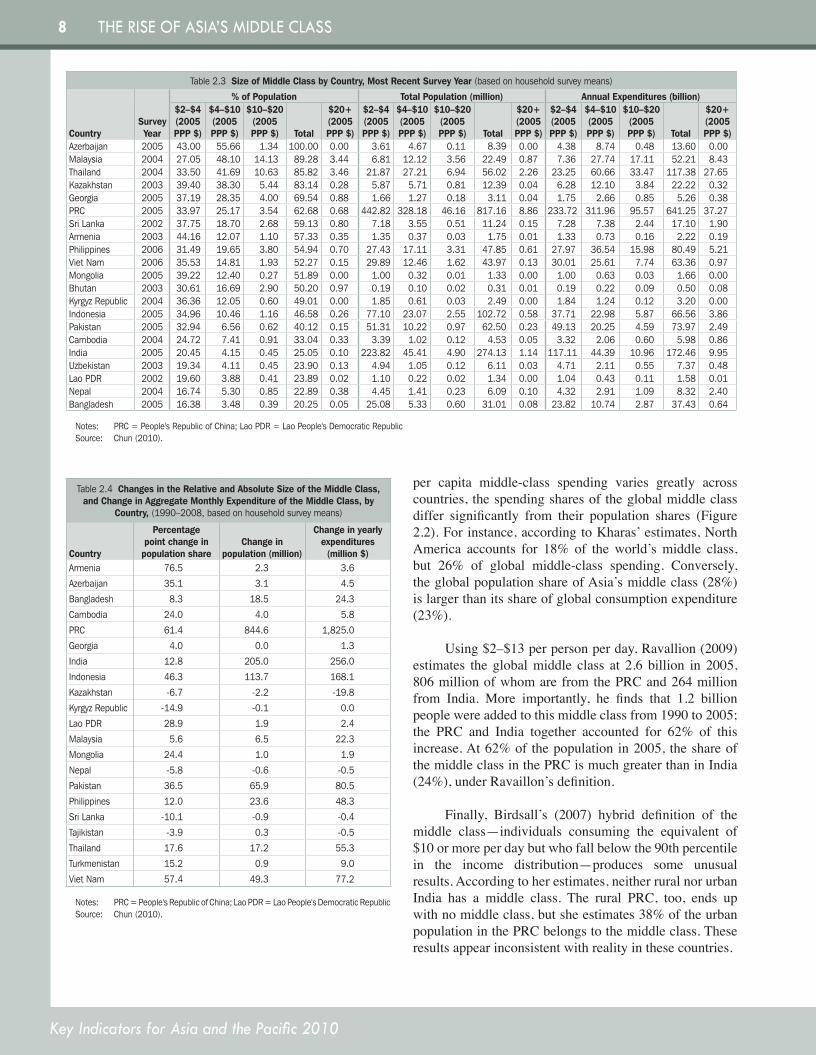
Which countries are driving this clear and burgeoning middle-class growth? The five countries with the largest middle class by population shares are Azerbaijan, Malaysia, Thailand, Kazakhstan, and Georgia; the five smallest are Bangladesh, Nepal, Lao People’s Democratic Republic (Lao PDR), Uzbekistan, and India (Table 2.3). Yet, in absolute size, India’s middle class is very large compared to other countries given its massive population. Only in the People’s Republic of China (PRC) is the middle class larger, as seen in the panels on population and consumption expenditures.10
As can be seen in Table 2.3 the lower-middle class constitutes the predominant share of the middle class in most of the 21 countries considered here, with the exception of relatively affluent countries such as Azerbaijan, Malaysia, and Thailand. In the PRC, the daily consumption expenditure of more than half of the middle class is in the lower $2–$4 bracket, while in South Asia’s Bangladesh, Nepal, India and Pakistan, the vast majority of the middle class (75% or more) falls into this group. With the exception of Malaysia and Thailand, the population share of the upper-middle class is miniscule in most of the countries considered.
10 NotethatusingthePRCCHIPSdataversusPovcalNetdatabaseontheruralPRCresultsinasubstantiallylargermiddle-classpopulationandsmallerproportioninpoverty.ThismayinpartbeduetothepoorreliabilityofthePovcalNetdatafortheruralhouseholddistribution.Inaddition,IndonesianurbanpopulationusingSUSENASdataversusthePovcalNetdatabaseshowsasubstantiallysmallernumberinpoverty.
Table2.1Summary Statistics of Population, Class Size, and Total Expenditures by Region (1990and2008BasedonHouseholdSurveyMeans)
RegionTotal
Population (million)
Population (%) Aggregate annual income/expenditures (2005 PPP $ billion)Poor
(<$2 per person per day)
Middle ($2–$20 per
person per day)
High (>$20 per
person per day)
Poor (<$2 per
person per day)
Middle ($2–$20 per
person per day)
High (>$20 per
person per day)Total
1990DevelopingAsia 2,692.2 79 21 0 843 721 42 1,605DevelopingEurope 352.3 12 84 4 23 638 141 802LatinAmericaandCaribbean 352.5 20 71 9 31 641 480 1,153MiddleEastandNorthAfrica 162.3 18 80 2 16 247 39 303OECD 639.0 0 24 76 0 735 9,636 10,371Sub-SaharanAfrica 274.8 75 24 1 70 109 44 224
2008DevelopingAsia 3,383.7 43 56 1 696 3,285 350 4,331DevelopingEurope 356.6 2 87 11 4 974 425 1,403LatinAmericaandCaribbean 454.2 10 77 13 22 1,008 924 1,953MiddleEastandNorthAfrica 212.8 12 86 3 14 365 66 445OECD 685.4 0 16 84 0 542 12,617 13,159Sub-SaharanAfrica 393.5 66 33 1 100 206 69 376
Notes: Developing Asia = Armenia, Azerbaijan, Bangladesh, Cambodia, People's Republic of China, Georgia, India, Indonesia, Kazakhstan, Kyrgyz Republic, Lao People'sDemocraticRepublic,Malaysia,Mongolia,Nepal,Pakistan,Philippines,SriLanka,Tajikistan,Thailand,Turkmenistan,Uzbekistan,VietNam;Developing Europe=Albania,Belarus, Bosnia and Herzegovina, Bulgaria, Latvia, Lithuania,Macedonia,Moldova, Poland, Romania, Russian Federation, Turkey, Ukraine; Latin America/Caribbean=Argentina, Brazil, Chile, Colombia, Costa Rica, Dominican Republic, Ecuador, El Salvador, Guatemala, Honduras, Jamaica,Mexico, Nicaragua, Peru, Uruguay, Venezuela;Middle East and North Africa=Algeria,Djibouti,Egypt,IranJordan,Morocco,Tunisia,Yemen;OECD=Austria,Belgium,Denmark,Finland,France,Germany,Greece,Ireland,Italy,Korea,Luxembourg,Netherlands,Norway,Portugal,SlovakRepublic,Spain,Sweden,UnitedKingdom,UnitedStates;Sub-Saharan Africa=Botswana,BurkinaFaso,Burundi,Cameroon,CentralAfricanRepublic,Ethiopia,Gambia,Ghana,Guinea,Guinea-Bissau,Kenya,Lesotho,Madagascar,Malawi,Mali,Mauritania,Mozambique,Niger,Rwanda,Senegal,SierraLeone,SouthAfrica,Swaziland,Tanzania,Uganda.
Source: PovcalNetDatabase.
KI2010-Special-Chapter.indd 6 8/12/10 7:01 PM
7
Key Indicators for Asia and the Pacific 2010
SPECIAL CHAPTERTHE RISE OF ASIA’S MIddLE CLASS
Table 2.4 also indicates that Armenia, the PRC, and Viet Nam have made the greatest progress in increasing the population share of the middle class in recent years, with the share of the middle class in the total population increasing 60–80 percentage points. However, in absolute numbers, the PRC stands significantly above every other country. It added more than 800 million people to the middle class during 1990–2008 and increased aggregate annual middle-class spending by more than $1.8 trillion. India comes a second, with 205 million joining the middle
class and $256 billion in additional middle-class annual expenditures.
How do the above size estimates compare with others in the literature? Kharas (2010), who defines a global middle class as those households with daily expenditures from $10 to $100 per person in purchasing power parity, estimates about 1.8 billion people in the global middle class, mostly in North America (338 million), Europe (664 million) and Asia (525 million). However, because
Table2.2 Summary Statistics of Population, Class Size, and Total Expenditures by Region (1990and2008NationalAccountMeans)
RegionTotal
Population (million)
Population (%) Aggregate annual income/expenditures (2005 PPP $ billion)Poor
(<$2 per person per day)
Middle ($2–$20 per
person per day)
High (>$20 per
person per day)
Poor (<$2 per
person per day)
Middle ($2–$20 per
person per day)
High (>$20 per
person per day) Total1990
DevelopingAsia 2,692.2 69 31 0 765 1,102 86 1,952DevelopingEurope 352.3 3 92 5 7 867 175 1,049LatinAmericaandCaribbean 352.5 18 66 16 27 640 1,568 2,235MiddleEastandNorthAfrica 162.3 14 83 2 13 263 38 314OECD 639.0 0 19 81 0 603 10,451 11,053Sub-SaharanAfrica 274.8 74 24 2 66 118 74 257
2008DevelopingAsia 3,383.7 17 82 1 315 4,924 551 5,790DevelopingEurope 356.6 0 68 32 0 965 1,454 2,419LatinAmericaandCaribbean 454.2 6 70 24 14 1,041 1,749 2,803MiddleEastandNorthAfrica 212.8 8 85 7 8 489 191 688OECD 685.4 0 10 90 0 386 15,264 15,650Sub-SaharanAfrica 393.5 67 31 3 95 210 166 472
Notes: PleaseseenoteatbottomofTable2.1foralistofcountriesineachregion.Source: WorldDevelopmentIndicators,householdtabulateddistributiondatafromPovcalNetDatabase,UNU-WIDERWorldIncomeInequalityDatabase.
Note: Developing Asia = Armenia, Azerbaijan, Bangladesh, Cambodia, People’s Republic of China, Georgia, India, Indonesia, Kazakhstan, Kyrgyz Republic, Lao PDR, Malaysia, Mongolia, Nepal, Pakistan, Philippines, Sri Lanka, Tajikistan, Thailand, Turkmenistan, Viet Nam.
Developing Europe = Albania, Belarus, Bosnia and Herzegovina, Bulgaria, Latvia, Lithuania, Macedonia, Moldova, Poland, Romania, Russian Federation, Turkey, Ukraine. Latin America and Carribean = Argentina, Brazil, Chile, Colombia, Costa Rica, Dominican Republic, Ecuador, Honduras, Jamaica, Mexico, Nicaragua, Peru, Uruguay, Venezuela. Middle East and North Africa = Djibouti, Egypt, Iran Jordan, Morocco, Tunisia, Yemen. OECD = Belgium, Denmark, Finland, France, Germany, Greece, Ireland, Italy, Korea, Luxembourg, Netherlands, Norway, Portugal, Slovak Republic, Spain, Sweden, United Kingdom,
United States. Sub-Saharan Africa = Botswana, Burkina Faso, Burundi, Cameroon, Central African Republic, Ethiopia, Gambia, Ghana, Guinea, Kenya, Lesotho, Madagascar, Malawi, Mali,
Mauritania, Mozambique, Niger, Rwanda, Senegal, South Africa, Swaziland, Tanzania, Uganda. Source: Chun (2010).
Figure 2.1 Change in Size of Middle Class By Region(1990–2008, based on household survey means)
−10 0 10 20 30
Latin America and Caribbean
Middle East/North Africa
Developing Europe
Sub-Saharan Africa
Developing Asia
Change (%)
0 200 400 600 800 1,000
Change in population (million)
0 500 1,000 1,500 2,000
Change in annual expenditures (billion)
OECD
KI2010-Special-Chapter.indd 7 8/12/10 7:01 PM
8
Key Indicators for Asia and the Pacific 2010
THE RISE OF ASIA’S MIddLE CLASS
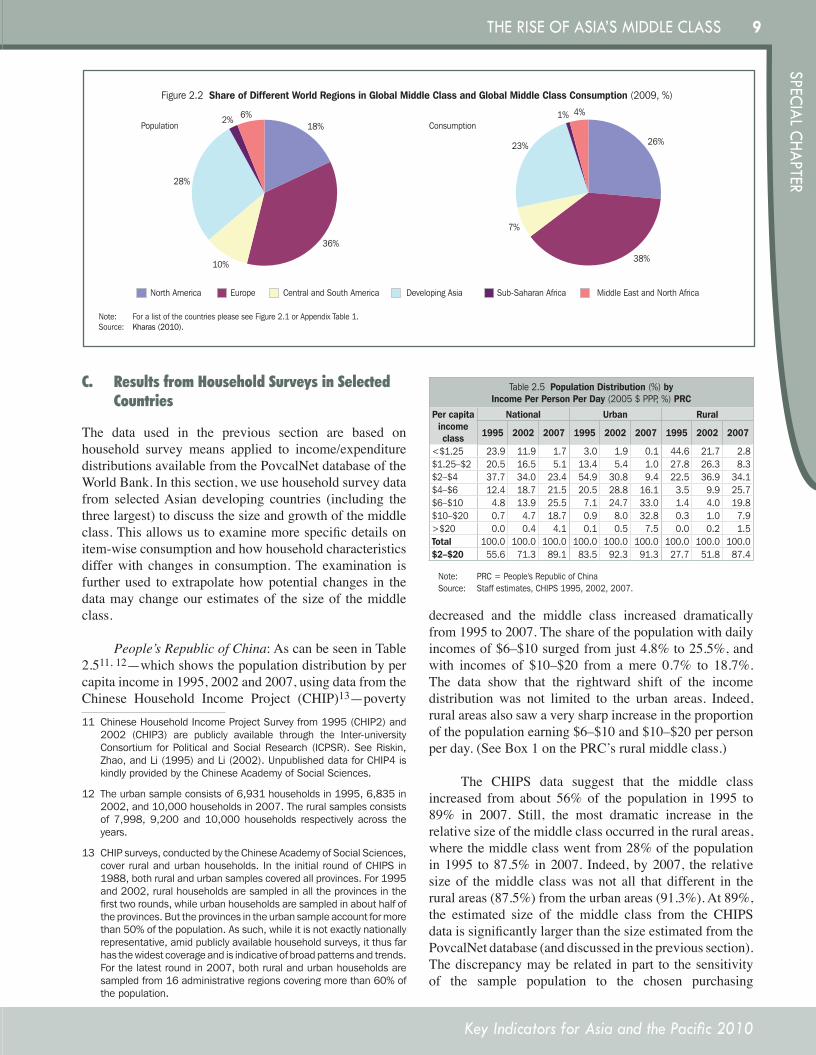
per capita middle-class spending varies greatly across countries, the spending shares of the global middle class differ significantly from their population shares (Figure 2.2). For instance, according to Kharas’ estimates, North America accounts for 18% of the world’s middle class, but 26% of global middle-class spending. Conversely, the global population share of Asia’s middle class (28%) is larger than its share of global consumption expenditure (23%).
Using $2–$13 per person per day, Ravallion (2009) estimates the global middle class at 2.6 billion in 2005, 806 million of whom are from the PRC and 264 million from India. More importantly, he finds that 1.2 billion people were added to this middle class from 1990 to 2005; the PRC and India together accounted for 62% of this increase. At 62% of the population in 2005, the share of the middle class in the PRC is much greater than in India (24%), under Ravaillon’s definition.
Finally, Birdsall’s (2007) hybrid definition of the middle class—individuals consuming the equivalent of $10 or more per day but who fall below the 90th percentile in the income distribution—produces some unusual results. According to her estimates, neither rural nor urban India has a middle class. The rural PRC, too, ends up with no middle class, but she estimates 38% of the urban population in the PRC belongs to the middle class. These results appear inconsistent with reality in these countries.
Table2.3 Size of Middle Class by Country, Most Recent Survey Year (basedonhouseholdsurveymeans)
CountrySurvey Year
% of Population Total Population (million) Annual Expenditures (billion)$2–$4 (2005 PPP $)
$4–$10 (2005 PPP $)
$10–$20 (2005 PPP $) Total
$20+ (2005 PPP $)
$2–$4 (2005 PPP $)
$4–$10 (2005 PPP $)
$10–$20 (2005 PPP $) Total
$20+ (2005 PPP $)
$2–$4 (2005 PPP $)
$4–$10 (2005 PPP $)
$10–$20 (2005 PPP $) Total
$20+ (2005 PPP $)
Azerbaijan 2005 43.00 55.66 1.34 100.00 0.00 3.61 4.67 0.11 8.39 0.00 4.38 8.74 0.48 13.60 0.00Malaysia 2004 27.05 48.10 14.13 89.28 3.44 6.81 12.12 3.56 22.49 0.87 7.36 27.74 17.11 52.21 8.43Thailand 2004 33.50 41.69 10.63 85.82 3.46 21.87 27.21 6.94 56.02 2.26 23.25 60.66 33.47 117.38 27.65Kazakhstan 2003 39.40 38.30 5.44 83.14 0.28 5.87 5.71 0.81 12.39 0.04 6.28 12.10 3.84 22.22 0.32Georgia 2005 37.19 28.35 4.00 69.54 0.88 1.66 1.27 0.18 3.11 0.04 1.75 2.66 0.85 5.26 0.38PRC 2005 33.97 25.17 3.54 62.68 0.68 442.82 328.18 46.16 817.16 8.86 233.72 311.96 95.57 641.25 37.27SriLanka 2002 37.75 18.70 2.68 59.13 0.80 7.18 3.55 0.51 11.24 0.15 7.28 7.38 2.44 17.10 1.90Armenia 2003 44.16 12.07 1.10 57.33 0.35 1.35 0.37 0.03 1.75 0.01 1.33 0.73 0.16 2.22 0.19Philippines 2006 31.49 19.65 3.80 54.94 0.70 27.43 17.11 3.31 47.85 0.61 27.97 36.54 15.98 80.49 5.21VietNam 2006 35.53 14.81 1.93 52.27 0.15 29.89 12.46 1.62 43.97 0.13 30.01 25.61 7.74 63.36 0.97Mongolia 2005 39.22 12.40 0.27 51.89 0.00 1.00 0.32 0.01 1.33 0.00 1.00 0.63 0.03 1.66 0.00Bhutan 2003 30.61 16.69 2.90 50.20 0.97 0.19 0.10 0.02 0.31 0.01 0.19 0.22 0.09 0.50 0.08KyrgyzRepublic 2004 36.36 12.05 0.60 49.01 0.00 1.85 0.61 0.03 2.49 0.00 1.84 1.24 0.12 3.20 0.00Indonesia 2005 34.96 10.46 1.16 46.58 0.26 77.10 23.07 2.55 102.72 0.58 37.71 22.98 5.87 66.56 3.86Pakistan 2005 32.94 6.56 0.62 40.12 0.15 51.31 10.22 0.97 62.50 0.23 49.13 20.25 4.59 73.97 2.49Cambodia 2004 24.72 7.41 0.91 33.04 0.33 3.39 1.02 0.12 4.53 0.05 3.32 2.06 0.60 5.98 0.86India 2005 20.45 4.15 0.45 25.05 0.10 223.82 45.41 4.90 274.13 1.14 117.11 44.39 10.96 172.46 9.95Uzbekistan 2003 19.34 4.11 0.45 23.90 0.13 4.94 1.05 0.12 6.11 0.03 4.71 2.11 0.55 7.37 0.48LaoPDR 2002 19.60 3.88 0.41 23.89 0.02 1.10 0.22 0.02 1.34 0.00 1.04 0.43 0.11 1.58 0.01Nepal 2004 16.74 5.30 0.85 22.89 0.38 4.45 1.41 0.23 6.09 0.10 4.32 2.91 1.09 8.32 2.40Bangladesh 2005 16.38 3.48 0.39 20.25 0.05 25.08 5.33 0.60 31.01 0.08 23.82 10.74 2.87 37.43 0.64
Notes: PRC=People'sRepublicofChina;LaoPDR=LaoPeople'sDemocraticRepublicSource: Chun(2010).
Table2.4 Changes in the Relative and Absolute Size of the Middle Class, and Change in Aggregate Monthly Expenditure of the Middle Class, by
Country, (1990–2008,basedonhouseholdsurveymeans)
Country
Percentage point change in
population shareChange in
population (million)
Change in yearly expenditures
(million $)Armenia 76.5 2.3 3.6
Azerbaijan 35.1 3.1 4.5
Bangladesh 8.3 18.5 24.3
Cambodia 24.0 4.0 5.8
PRC 61.4 844.6 1,825.0
Georgia 4.0 0.0 1.3
India 12.8 205.0 256.0
Indonesia 46.3 113.7 168.1
Kazakhstan -6.7 -2.2 -19.8
KyrgyzRepublic -14.9 -0.1 0.0
LaoPDR 28.9 1.9 2.4
Malaysia 5.6 6.5 22.3
Mongolia 24.4 1.0 1.9
Nepal -5.8 -0.6 -0.5
Pakistan 36.5 65.9 80.5
Philippines 12.0 23.6 48.3
SriLanka -10.1 -0.9 -0.4
Tajikistan -3.9 0.3 -0.5
Thailand 17.6 17.2 55.3
Turkmenistan 15.2 0.9 9.0
VietNam 57.4 49.3 77.2
Notes: PRC=People'sRepublicofChina;LaoPDR=LaoPeople'sDemocraticRepublicSource: Chun(2010).
KI2010-Special-Chapter.indd 8 8/12/10 7:01 PM
9
Key Indicators for Asia and the Pacific 2010
SPECIAL CHAPTERTHE RISE OF ASIA’S MIddLE CLASS
C. ResultsfromHouseholdSurveysinSelectedCountries
The data used in the previous section are based on household survey means applied to income/expenditure distributions available from the PovcalNet database of the World Bank. In this section, we use household survey data from selected Asian developing countries (including the three largest) to discuss the size and growth of the middle class. This allows us to examine more specific details on item-wise consumption and how household characteristics differ with changes in consumption. The examination is further used to extrapolate how potential changes in the data may change our estimates of the size of the middle class.
People’s Republic of China: As can be seen in Table 2.511, 12—which shows the population distribution by per capita income in 1995, 2002 and 2007, using data from the Chinese Household Income Project (CHIP)13—poverty 11 ChineseHouseholdIncomeProjectSurveyfrom1995(CHIP2)and
2002 (CHIP3) are publicly available through the Inter-universityConsortium forPoliticalandSocialResearch (ICPSR).SeeRiskin,Zhao,andLi(1995)andLi(2002).UnpublisheddataforCHIP4iskindlyprovidedbytheChineseAcademyofSocialSciences.
12 Theurbansampleconsistsof6,931householdsin1995,6,835in2002,and10,000householdsin2007.Theruralsamplesconsistsof7,998,9,200and10,000households respectively across theyears.
13 CHIPsurveys,conductedbytheChineseAcademyofSocialSciences,coverruralandurbanhouseholds. Inthe initial roundofCHIPSin1988,bothruralandurbansamplescoveredallprovinces.For1995and2002,ruralhouseholdsaresampledinalltheprovincesinthefirsttworounds,whileurbanhouseholdsaresampledinabouthalfoftheprovinces.Buttheprovincesintheurbansampleaccountformorethan50%ofthepopulation.Assuch,whileitisnotexactlynationallyrepresentative,amidpubliclyavailablehouseholdsurveys,itthusfarhasthewidestcoverageandisindicativeofbroadpatternsandtrends.Forthelatestroundin2007,bothruralandurbanhouseholdsaresampledfrom16administrativeregionscoveringmorethan60%ofthepopulation.
decreased and the middle class increased dramatically from 1995 to 2007. The share of the population with daily incomes of $6–$10 surged from just 4.8% to 25.5%, and with incomes of $10–$20 from a mere 0.7% to 18.7%. The data show that the rightward shift of the income distribution was not limited to the urban areas. Indeed, rural areas also saw a very sharp increase in the proportion of the population earning $6–$10 and $10–$20 per person per day. (See Box 1 on the PRC’s rural middle class.)
The CHIPS data suggest that the middle class increased from about 56% of the population in 1995 to 89% in 2007. Still, the most dramatic increase in the relative size of the middle class occurred in the rural areas, where the middle class went from 28% of the population in 1995 to 87.5% in 2007. Indeed, by 2007, the relative size of the middle class was not all that different in the rural areas (87.5%) from the urban areas (91.3%). At 89%, the estimated size of the middle class from the CHIPS data is significantly larger than the size estimated from the PovcalNet database (and discussed in the previous section). The discrepancy may be related in part to the sensitivity of the sample population to the chosen purchasing
Note: For a list of the countries please see Figure 2.1 or Appendix Table 1.Source: Kharas (2010).
Figure 2.2 Share of Different World Regions in Global Middle Class and Global Middle Class Consumption (2009, %)
18%
36%
10%
28%
2% 6%
26%
38%
7%
23%
1% 4%
North America
Population Consumption
Europe Central and South America Developing Asia Sub-Saharan Africa Middle East and North Africa
Table2.5Population Distribution (%) by Income Per Person Per Day (2005$PPP,%) PRC
Per capita income class
National Urban Rural
1995 2002 2007 1995 2002 2007 1995 2002 2007
<$1.25 23.9 11.9 1.7 3.0 1.9 0.1 44.6 21.7 2.8$1.25–$2 20.5 16.5 5.1 13.4 5.4 1.0 27.8 26.3 8.3$2–$4 37.7 34.0 23.4 54.9 30.8 9.4 22.5 36.9 34.1$4–$6 12.4 18.7 21.5 20.5 28.8 16.1 3.5 9.9 25.7$6–$10 4.8 13.9 25.5 7.1 24.7 33.0 1.4 4.0 19.8$10–$20 0.7 4.7 18.7 0.9 8.0 32.8 0.3 1.0 7.9>$20 0.0 0.4 4.1 0.1 0.5 7.5 0.0 0.2 1.5Total 100.0 100.0 100.0 100.0 100.0 100.0 100.0 100.0 100.0$2–$20 55.6 71.3 89.1 83.5 92.3 91.3 27.7 51.8 87.4
Note: PRC=People'sRepublicofChinaSource: Staffestimates,CHIPS1995,2002,2007.
KI2010-Special-Chapter.indd 9 8/12/10 7:01 PM
10
Key Indicators for Asia and the Pacific 2010
THE RISE OF ASIA’S MIddLE CLASS
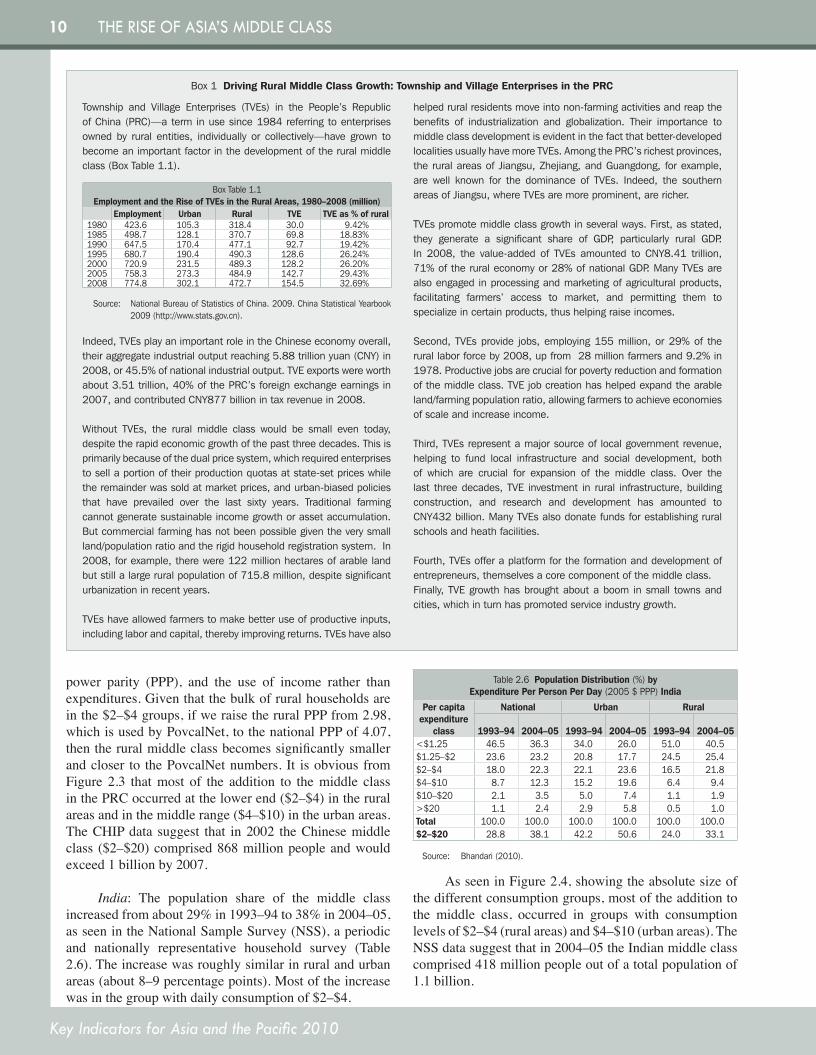
power parity (PPP), and the use of income rather than expenditures. Given that the bulk of rural households are in the $2–$4 groups, if we raise the rural PPP from 2.98, which is used by PovcalNet, to the national PPP of 4.07, then the rural middle class becomes significantly smaller and closer to the PovcalNet numbers. It is obvious from Figure 2.3 that most of the addition to the middle class in the PRC occurred at the lower end ($2–$4) in the rural areas and in the middle range ($4–$10) in the urban areas. The CHIP data suggest that in 2002 the Chinese middle class ($2–$20) comprised 868 million people and would exceed 1 billion by 2007.
India: The population share of the middle class increased from about 29% in 1993–94 to 38% in 2004–05, as seen in the National Sample Survey (NSS), a periodic and nationally representative household survey (Table 2.6). The increase was roughly similar in rural and urban areas (about 8–9 percentage points). Most of the increase was in the group with daily consumption of $2–$4.
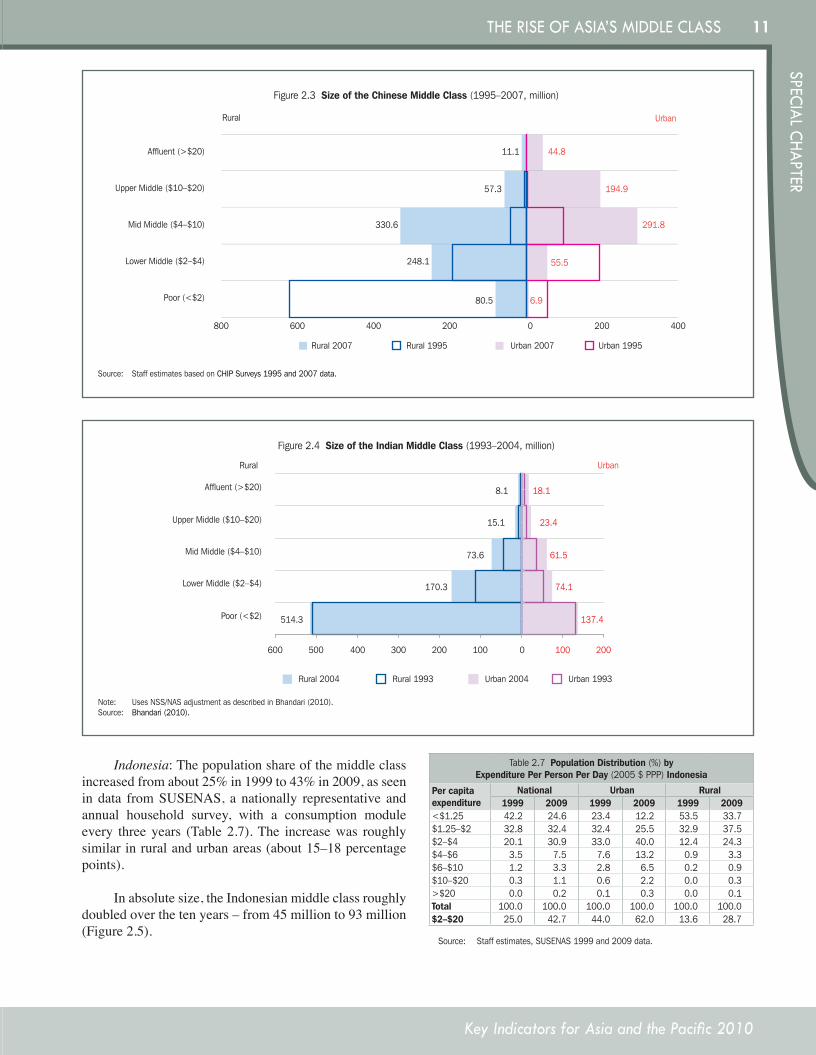
As seen in Figure 2.4, showing the absolute size of the different consumption groups, most of the addition to the middle class, occurred in groups with consumption levels of $2–$4 (rural areas) and $4–$10 (urban areas). The NSS data suggest that in 2004–05 the Indian middle class comprised 418 million people out of a total population of 1.1 billion.
Box 1 Driving Rural Middle Class Growth: Township and Village Enterprises in the PRC
Township and Village Enterprises (TVEs) in the People’s Republic of China (PRC)—a term in use since 1984 referring to enterprises owned by rural entities, individually or collectively—have grown to become an important factor in the development of the rural middle class (Box Table 1.1).
Indeed, TVEs play an important role in the Chinese economy overall, their aggregate industrial output reaching 5.88 trillion yuan (CNY) in 2008, or 45.5% of national industrial output. TVE exports were worth about 3.51 trillion, 40% of the PRC’s foreign exchange earnings in 2007, and contributed CNY877 billion in tax revenue in 2008.
Without TVEs, the rural middle class would be small even today, despite the rapid economic growth of the past three decades. This is primarily because of the dual price system, which required enterprises to sell a portion of their production quotas at state-set prices while the remainder was sold at market prices, and urban-biased policies that have prevailed over the last sixty years. Traditional farming cannot generate sustainable income growth or asset accumulation. But commercial farming has not been possible given the very small land/population ratio and the rigid household registration system. In 2008, for example, there were 122 million hectares of arable land but still a large rural population of 715.8 million, despite significant urbanization in recent years.
TVEs have allowed farmers to make better use of productive inputs, including labor and capital, thereby improving returns. TVEs have also
helped rural residents move into non-farming activities and reap the benefits of industrialization and globalization. Their importance to middle class development is evident in the fact that better-developed localities usually have more TVEs. Among the PRC’s richest provinces, the rural areas of Jiangsu, Zhejiang, and Guangdong, for example, are well known for the dominance of TVEs. Indeed, the southern areas of Jiangsu, where TVEs are more prominent, are richer.
TVEs promote middle class growth in several ways. First, as stated, they generate a significant share of GDP, particularly rural GDP. In 2008, the value-added of TVEs amounted to CNY8.41 trillion, 71% of the rural economy or 28% of national GDP. Many TVEs are also engaged in processing and marketing of agricultural products, facilitating farmers’ access to market, and permitting them to specialize in certain products, thus helping raise incomes.
Second, TVEs provide jobs, employing 155 million, or 29% of the rural labor force by 2008, up from 28 million farmers and 9.2% in 1978. Productive jobs are crucial for poverty reduction and formation of the middle class. TVE job creation has helped expand the arable land/farming population ratio, allowing farmers to achieve economies of scale and increase income.
Third, TVEs represent a major source of local government revenue, helping to fund local infrastructure and social development, both of which are crucial for expansion of the middle class. Over the last three decades, TVE investment in rural infrastructure, building construction, and research and development has amounted to CNY432 billion. Many TVEs also donate funds for establishing rural schools and heath facilities.
Fourth, TVEs offer a platform for the formation and development of entrepreneurs, themselves a core component of the middle class. Finally, TVE growth has brought about a boom in small towns and cities, which in turn has promoted service industry growth.
Box Table 1.1 Employment and the Rise of TVEs in the Rural Areas, 1980–2008 (million)
Employment Urban Rural TVE TVE as % of rural1980 423.6 105.3 318.4 30.0 9.42%1985 498.7 128.1 370.7 69.8 18.83%1990 647.5 170.4 477.1 92.7 19.42%1995 680.7 190.4 490.3 128.6 26.24%2000 720.9 231.5 489.3 128.2 26.20%2005 758.3 273.3 484.9 142.7 29.43%2008 774.8 302.1 472.7 154.5 32.69%
Source: National Bureau of Statistics of China. 2009. China Statistical Yearbook 2009 (http://www.stats.gov.cn).
Table2.6Population Distribution (%)by Expenditure Per Person Per Day (2005$PPP) India
Per capita expenditure
class
National Urban Rural
1993–94 2004–05 1993–94 2004–05 1993–94 2004–05<$1.25 46.5 36.3 34.0 26.0 51.0 40.5$1.25–$2 23.6 23.2 20.8 17.7 24.5 25.4$2–$4 18.0 22.3 22.1 23.6 16.5 21.8$4–$10 8.7 12.3 15.2 19.6 6.4 9.4$10–$20 2.1 3.5 5.0 7.4 1.1 1.9>$20 1.1 2.4 2.9 5.8 0.5 1.0Total 100.0 100.0 100.0 100.0 100.0 100.0$2–$20 28.8 38.1 42.2 50.6 24.0 33.1
Source: Bhandari(2010).
KI2010-Special-Chapter.indd 10 8/12/10 7:01 PM
11
Key Indicators for Asia and the Pacific 2010
SPECIAL CHAPTERTHE RISE OF ASIA’S MIddLE CLASS
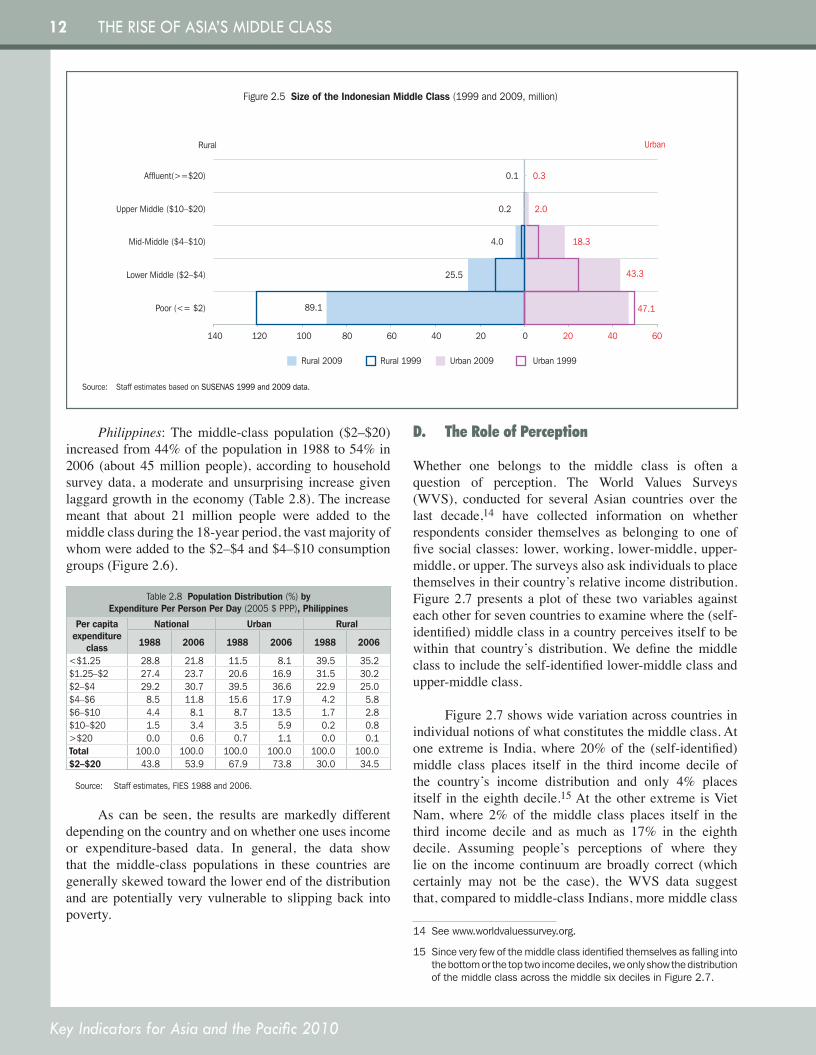
Indonesia: The population share of the middle class increased from about 25% in 1999 to 43% in 2009, as seen in data from SUSENAS, a nationally representative and annual household survey, with a consumption module every three years (Table 2.7). The increase was roughly similar in rural and urban areas (about 15–18 percentage points).
In absolute size, the Indonesian middle class roughly doubled over the ten years – from 45 million to 93 million (Figure 2.5).
Note: Uses NSS/NAS adjustment as described in Bhandari (2010). Source: Bhandari (2010).
Figure 2.4 Size of the Indian Middle Class (1993–2004, million)
18.1
170.3
73.6
15.1
137.4
23.4
61.5
74.1
514.3
8.1
2001000100200300400500600
Poor (<$2)
Lower Middle ($2–$4)
Mid Middle ($4–$10)
Upper Middle ($10–$20)
Affluent (>$20)
Urban 2004Rural 2004 Rural 1993 Urban 1993
Rural Urban
Table2.7Population Distribution (%) by Expenditure Per Person Per Day (2005$PPP) Indonesia
Per capita expenditure
National Urban Rural1999 2009 1999 2009 1999 2009
<$1.25 42.2 24.6 23.4 12.2 53.5 33.7$1.25–$2 32.8 32.4 32.4 25.5 32.9 37.5$2–$4 20.1 30.9 33.0 40.0 12.4 24.3$4–$6 3.5 7.5 7.6 13.2 0.9 3.3$6–$10 1.2 3.3 2.8 6.5 0.2 0.9$10–$20 0.3 1.1 0.6 2.2 0.0 0.3>$20 0.0 0.2 0.1 0.3 0.0 0.1Total 100.0 100.0 100.0 100.0 100.0 100.0$2–$20 25.0 42.7 44.0 62.0 13.6 28.7
Source: Staffestimates,SUSENAS1999and2009data.
Source: Staff estimates based on CHIP Surveys 1995 and 2007 data.
Figure 2.3 Size of the Chinese Middle Class (1995–2007, million)
55.5
291.8
44.8
248.1
330.6
11.1
4002000200400600800
Rural Urban
Rural 2007 Rural 1995 Urban 1995Urban 2007
Poor (<$2)
Lower Middle ($2–$4)
Mid Middle ($4–$10)
Upper Middle ($10–$20)
Affluent (>$20)
194.957.3
6.980.5
KI2010-Special-Chapter.indd 11 8/12/10 7:01 PM
12
Key Indicators for Asia and the Pacific 2010
THE RISE OF ASIA’S MIddLE CLASS
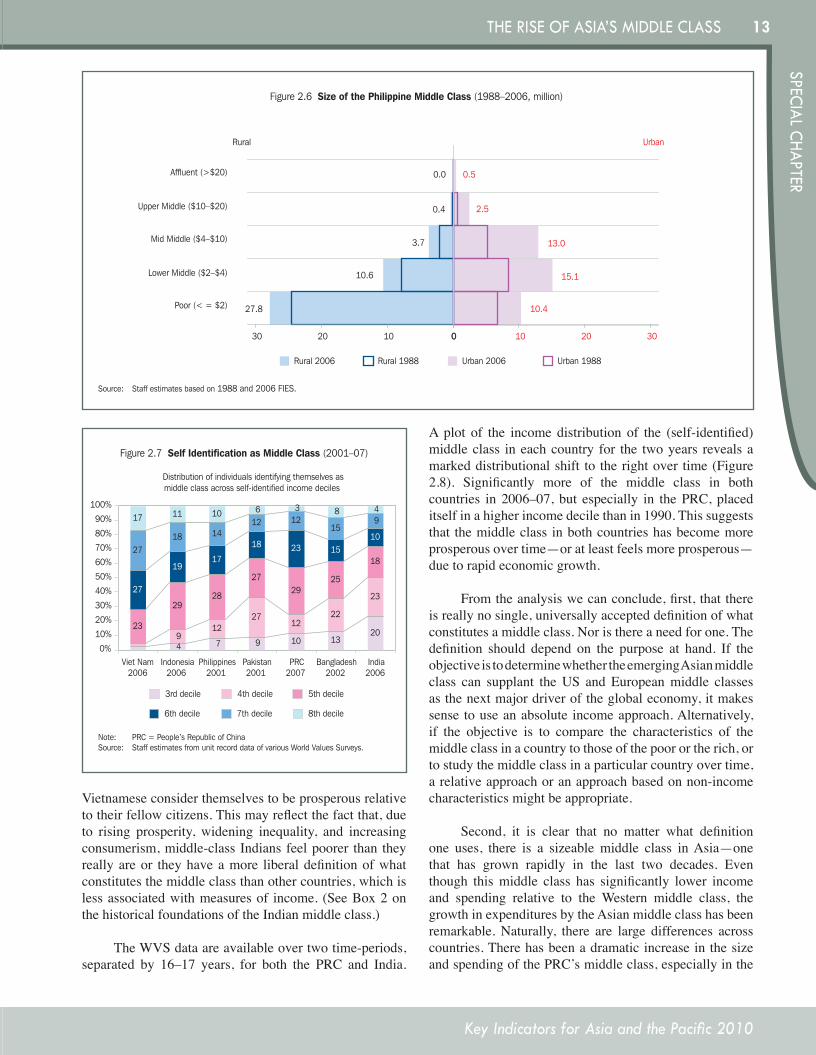
Philippines: The middle-class population ($2–$20) increased from 44% of the population in 1988 to 54% in 2006 (about 45 million people), according to household survey data, a moderate and unsurprising increase given laggard growth in the economy (Table 2.8). The increase meant that about 21 million people were added to the middle class during the 18-year period, the vast majority of whom were added to the $2–$4 and $4–$10 consumption groups (Figure 2.6).
As can be seen, the results are markedly different depending on the country and on whether one uses income or expenditure-based data. In general, the data show that the middle-class populations in these countries are generally skewed toward the lower end of the distribution and are potentially very vulnerable to slipping back into poverty.
D. TheRoleofPerception
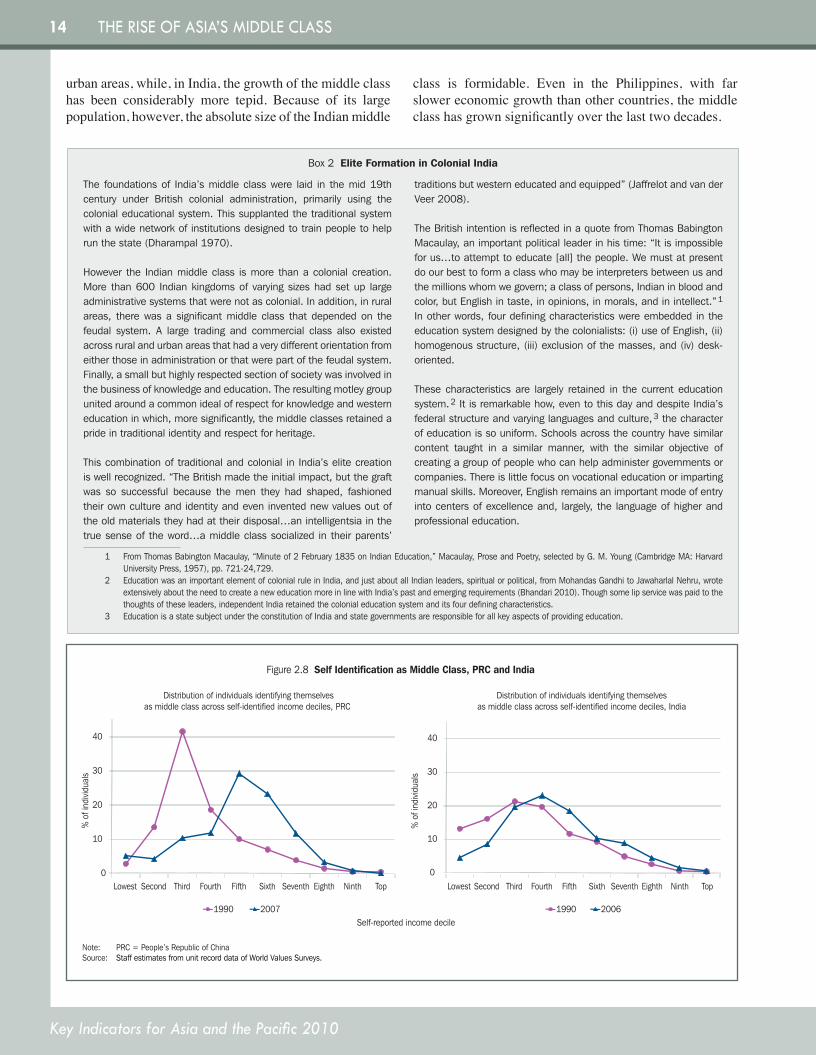
Whether one belongs to the middle class is often a question of perception. The World Values Surveys (WVS), conducted for several Asian countries over the last decade,14 have collected information on whether respondents consider themselves as belonging to one of five social classes: lower, working, lower-middle, upper-middle, or upper. The surveys also ask individuals to place themselves in their country’s relative income distribution. Figure 2.7 presents a plot of these two variables against each other for seven countries to examine where the (self-identified) middle class in a country perceives itself to be within that country’s distribution. We define the middle class to include the self-identified lower-middle class and upper-middle class.
Figure 2.7 shows wide variation across countries in individual notions of what constitutes the middle class. At one extreme is India, where 20% of the (self-identified) middle class places itself in the third income decile of the country’s income distribution and only 4% places itself in the eighth decile.15 At the other extreme is Viet Nam, where 2% of the middle class places itself in the third income decile and as much as 17% in the eighth decile. Assuming people’s perceptions of where they lie on the income continuum are broadly correct (which certainly may not be the case), the WVS data suggest that, compared to middle-class Indians, more middle class
14 Seewww.worldvaluessurvey.org.
15 Sinceveryfewofthemiddleclassidentifiedthemselvesasfallingintothebottomorthetoptwoincomedeciles,weonlyshowthedistributionofthemiddleclassacrossthemiddlesixdecilesinFigure2.7.
Source: Staff estimates based on SUSENAS 1999 and 2009 data.
Figure 2.5 Size of the Indonesian Middle Class (1999 and 2009, million)
89.1
25.5
4.0
0.2
0.1
47.1
43.3
18.3
2.0
0.3
604020020406080100120140
Rural 1999 Urban 2009Rural 2009 Urban 1999
Rural Urban
Poor (<= $2)
Lower Middle ($2–$4)
Mid-Middle ($4–$10)
Upper Middle ($10–$20)
Affluent(>=$20)
Table2.8Population Distribution (%) by Expenditure Per Person Per Day(2005$PPP), Philippines
Per capita expenditure
class
National Urban Rural
1988 2006 1988 2006 1988 2006
<$1.25 28.8 21.8 11.5 8.1 39.5 35.2$1.25–$2 27.4 23.7 20.6 16.9 31.5 30.2$2–$4 29.2 30.7 39.5 36.6 22.9 25.0$4–$6 8.5 11.8 15.6 17.9 4.2 5.8$6–$10 4.4 8.1 8.7 13.5 1.7 2.8$10–$20 1.5 3.4 3.5 5.9 0.2 0.8>$20 0.0 0.6 0.7 1.1 0.0 0.1Total 100.0 100.0 100.0 100.0 100.0 100.0$2–$20 43.8 53.9 67.9 73.8 30.0 34.5Source: Staffestimates,FIES1988and2006.
KI2010-Special-Chapter.indd 12 8/12/10 7:01 PM
13
Key Indicators for Asia and the Pacific 2010
SPECIAL CHAPTERTHE RISE OF ASIA’S MIddLE CLASS
Vietnamese consider themselves to be prosperous relative to their fellow citizens. This may reflect the fact that, due to rising prosperity, widening inequality, and increasing consumerism, middle-class Indians feel poorer than they really are or they have a more liberal definition of what constitutes the middle class than other countries, which is less associated with measures of income. (See Box 2 on the historical foundations of the Indian middle class.)
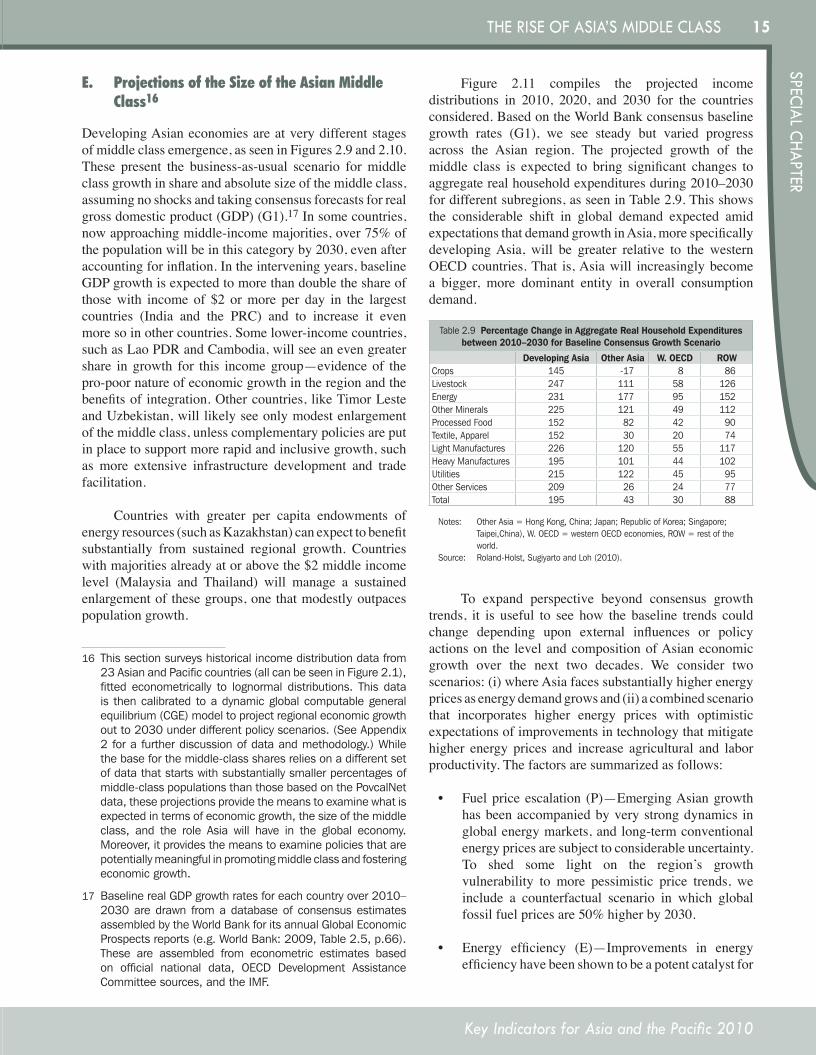
The WVS data are available over two time-periods, separated by 16–17 years, for both the PRC and India.
A plot of the income distribution of the (self-identified) middle class in each country for the two years reveals a marked distributional shift to the right over time (Figure 2.8). Significantly more of the middle class in both countries in 2006–07, but especially in the PRC, placed itself in a higher income decile than in 1990. This suggests that the middle class in both countries has become more prosperous over time—or at least feels more prosperous—due to rapid economic growth.
From the analysis we can conclude, first, that there is really no single, universally accepted definition of what constitutes a middle class. Nor is there a need for one. The definition should depend on the purpose at hand. If the objective is to determine whether the emerging Asian middle class can supplant the US and European middle classes as the next major driver of the global economy, it makes sense to use an absolute income approach. Alternatively, if the objective is to compare the characteristics of the middle class in a country to those of the poor or the rich, or to study the middle class in a particular country over time, a relative approach or an approach based on non-income characteristics might be appropriate.
Second, it is clear that no matter what definition one uses, there is a sizeable middle class in Asia—one that has grown rapidly in the last two decades. Even though this middle class has significantly lower income and spending relative to the Western middle class, the growth in expenditures by the Asian middle class has been remarkable. Naturally, there are large differences across countries. There has been a dramatic increase in the size and spending of the PRC’s middle class, especially in the
Source: Staff estimates based on 1988 and 2006 FIES.
Rural 2006 Urban 2006Rural 1988 Urban 1988
10.6
0.0
0.4
3.7
27.8
Rural
0102030
0.5
2.5
13.0
15.1
10.4
Urban
0 10 20 30
Affluent (>$20)
Upper Middle ($10–$20)
Mid Middle ($4–$10)
Lower Middle ($2–$4)
Poor (< = $2)
Figure 2.6 Size of the Philippine Middle Class (1988–2006, million)
Note: PRC = People’s Republic of ChinaSource: Staff estimates from unit record data of various World Values Surveys.
Figure 2.7 Self Identification as Middle Class (2001–07)
4 7 9 10 13209
1227
1222
23
23
2928
2729
25
18
27
1917
18 23 1510
2718 14
12 1215
917 11 10 6 3 8 4
Distribution of individuals identifying themselves asmiddle class across self-identified income deciles
0%
10%
20%
30%
40%
50%
60%
70%
80%
90%
100%
Viet Nam2006
Indonesia2006
Philippines2001
Pakistan2001
PRC2007
Bangladesh2002
India2006
3rd decile 4th decile 5th decile
6th decile 7th decile 8th decile
KI2010-Special-Chapter.indd 13 8/12/10 7:01 PM
14
Key Indicators for Asia and the Pacific 2010
THE RISE OF ASIA’S MIddLE CLASS
Note: PRC = People’s Republic of ChinaSource: Staff estimates from unit record data of World Values Surveys.
Figure 2.8 Self Identification as Middle Class, PRC and India
0
10
20
30
40
% o
f ind
ividu
als
Self-reported income decile
Distribution of individuals identifying themselvesas middle class across self-identified income deciles, PRC
Distribution of individuals identifying themselvesas middle class across self-identified income deciles, India
% o
f ind
ividu
als
0
10
20
30
40
Lowest Second Third Fourth Fifth Sixth Seventh Eighth Ninth Top Lowest Second Third Fourth Fifth Sixth Seventh Eighth Ninth Top
1990 2007 1990 2006
Box 2 Elite Formation in Colonial India
The foundations of India’s middle class were laid in the mid 19th century under British colonial administration, primarily using the colonial educational system. This supplanted the traditional system with a wide network of institutions designed to train people to help run the state (Dharampal 1970).
However the Indian middle class is more than a colonial creation. More than 600 Indian kingdoms of varying sizes had set up large administrative systems that were not as colonial. In addition, in rural areas, there was a significant middle class that depended on the feudal system. A large trading and commercial class also existed across rural and urban areas that had a very different orientation from either those in administration or that were part of the feudal system. Finally, a small but highly respected section of society was involved in the business of knowledge and education. The resulting motley group united around a common ideal of respect for knowledge and western education in which, more significantly, the middle classes retained a pride in traditional identity and respect for heritage.
This combination of traditional and colonial in India’s elite creation is well recognized. “The British made the initial impact, but the graft was so successful because the men they had shaped, fashioned their own culture and identity and even invented new values out of the old materials they had at their disposal…an intelligentsia in the true sense of the word…a middle class socialized in their parents’
traditions but western educated and equipped” (Jaffrelot and van der Veer 2008).
The British intention is reflected in a quote from Thomas Babington Macaulay, an important political leader in his time: “It is impossible for us…to attempt to educate [all] the people. We must at present do our best to form a class who may be interpreters between us and the millions whom we govern; a class of persons, Indian in blood and color, but English in taste, in opinions, in morals, and in intellect.” 1 In other words, four defining characteristics were embedded in the education system designed by the colonialists: (i) use of English, (ii) homogenous structure, (iii) exclusion of the masses, and (iv) desk-oriented.
These characteristics are largely retained in the current education system. 2 It is remarkable how, even to this day and despite India’s federal structure and varying languages and culture, 3 the character of education is so uniform. Schools across the country have similar content taught in a similar manner, with the similar objective of creating a group of people who can help administer governments or companies. There is little focus on vocational education or imparting manual skills. Moreover, English remains an important mode of entry into centers of excellence and, largely, the language of higher and professional education.
1 From Thomas Babington Macaulay, “Minute of 2 February 1835 on Indian Education,” Macaulay, Prose and Poetry, selected by G. M. Young (Cambridge MA: Harvard University Press, 1957), pp. 721-24,729.
2 Education was an important element of colonial rule in India, and just about all Indian leaders, spiritual or political, from Mohandas Gandhi to Jawaharlal Nehru, wrote extensively about the need to create a new education more in line with India’s past and emerging requirements (Bhandari 2010). Though some lip service was paid to the thoughts of these leaders, independent India retained the colonial education system and its four defining characteristics.
3 Education is a state subject under the constitution of India and state governments are responsible for all key aspects of providing education.
urban areas, while, in India, the growth of the middle class has been considerably more tepid. Because of its large population, however, the absolute size of the Indian middle
class is formidable. Even in the Philippines, with far slower economic growth than other countries, the middle class has grown significantly over the last two decades.
KI2010-Special-Chapter.indd 14 8/12/10 7:01 PM
15
Key Indicators for Asia and the Pacific 2010
SPECIAL CHAPTERTHE RISE OF ASIA’S MIddLE CLASS
E. ProjectionsoftheSizeoftheAsianMiddleClass16
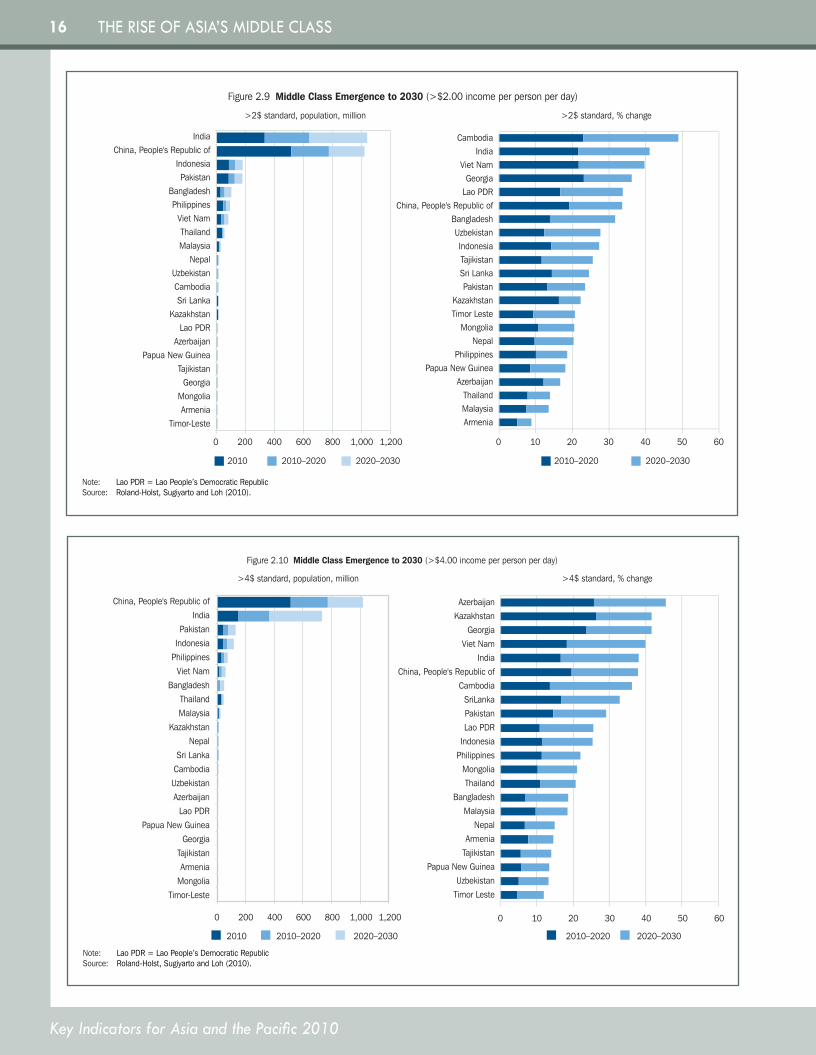
Developing Asian economies are at very different stages of middle class emergence, as seen in Figures 2.9 and 2.10. These present the business-as-usual scenario for middle class growth in share and absolute size of the middle class, assuming no shocks and taking consensus forecasts for real gross domestic product (GDP) (G1).17 In some countries, now approaching middle-income majorities, over 75% of the population will be in this category by 2030, even after accounting for inflation. In the intervening years, baseline GDP growth is expected to more than double the share of those with income of $2 or more per day in the largest countries (India and the PRC) and to increase it even more so in other countries. Some lower-income countries, such as Lao PDR and Cambodia, will see an even greater share in growth for this income group—evidence of the pro-poor nature of economic growth in the region and the benefits of integration. Other countries, like Timor Leste and Uzbekistan, will likely see only modest enlargement of the middle class, unless complementary policies are put in place to support more rapid and inclusive growth, such as more extensive infrastructure development and trade facilitation.
Countries with greater per capita endowments of energy resources (such as Kazakhstan) can expect to benefit substantially from sustained regional growth. Countries with majorities already at or above the $2 middle income level (Malaysia and Thailand) will manage a sustained enlargement of these groups, one that modestly outpaces population growth.
16 Thissectionsurveyshistoricalincomedistributiondatafrom23AsianandPacificcountries(allcanbeseeninFigure2.1),fitted econometrically to lognormal distributions. This datais thencalibrated toadynamicglobalcomputablegeneralequilibrium(CGE)modeltoprojectregionaleconomicgrowthoutto2030underdifferentpolicyscenarios.(SeeAppendix2forafurtherdiscussionofdataandmethodology.)Whilethebaseforthemiddle-classsharesreliesonadifferentsetofdatathatstartswithsubstantiallysmallerpercentagesofmiddle-classpopulationsthanthosebasedonthePovcalNetdata,theseprojectionsprovidethemeanstoexaminewhatisexpectedintermsofeconomicgrowth,thesizeofthemiddleclass, and the role Asia will have in the global economy.Moreover,itprovidesthemeanstoexaminepoliciesthatarepotentiallymeaningfulinpromotingmiddleclassandfosteringeconomicgrowth.
17 BaselinerealGDPgrowthratesforeachcountryover2010–2030aredrawn fromadatabaseof consensusestimatesassembledbytheWorldBankforitsannualGlobalEconomicProspectsreports(e.g.WorldBank:2009,Table2.5,p.66).These are assembled from econometric estimates basedon official national data, OECD Development AssistanceCommitteesources,andtheIMF.
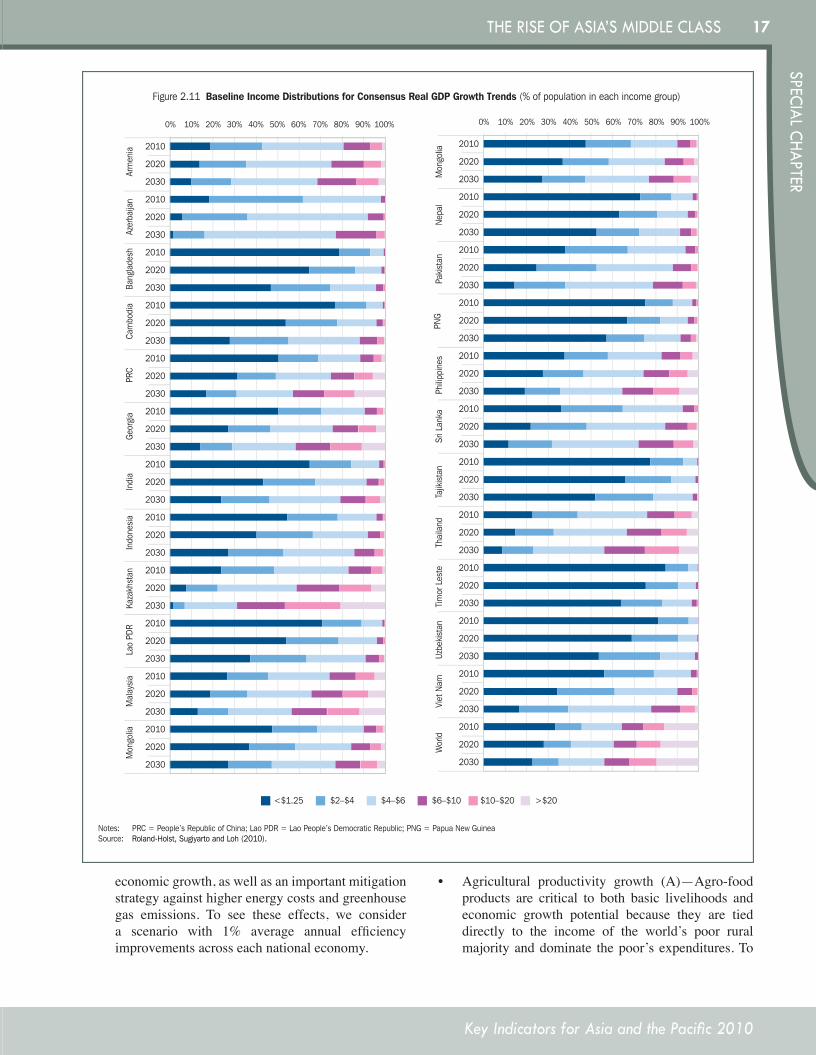
Figure 2.11 compiles the projected income distributions in 2010, 2020, and 2030 for the countries considered. Based on the World Bank consensus baseline growth rates (G1), we see steady but varied progress across the Asian region. The projected growth of the middle class is expected to bring significant changes to aggregate real household expenditures during 2010–2030 for different subregions, as seen in Table 2.9. This shows the considerable shift in global demand expected amid expectations that demand growth in Asia, more specifically developing Asia, will be greater relative to the western OECD countries. That is, Asia will increasingly become a bigger, more dominant entity in overall consumption demand.
To expand perspective beyond consensus growth trends, it is useful to see how the baseline trends could change depending upon external influences or policy actions on the level and composition of Asian economic growth over the next two decades. We consider two scenarios: (i) where Asia faces substantially higher energy prices as energy demand grows and (ii) a combined scenario that incorporates higher energy prices with optimistic expectations of improvements in technology that mitigate higher energy prices and increase agricultural and labor productivity. The factors are summarized as follows:
• Fuel price escalation (P)—Emerging Asian growth has been accompanied by very strong dynamics in global energy markets, and long-term conventional energy prices are subject to considerable uncertainty. To shed some light on the region’s growth vulnerability to more pessimistic price trends, we include a counterfactual scenario in which global fossil fuel prices are 50% higher by 2030.
• Energy efficiency (E)—Improvements in energy efficiency have been shown to be a potent catalyst for
Table2.9Percentage Change in Aggregate Real Household Expenditures between 2010–2030 for Baseline Consensus Growth Scenario
Developing Asia Other Asia W. OECD ROWCrops 145 -17 8 86Livestock 247 111 58 126Energy 231 177 95 152OtherMinerals 225 121 49 112ProcessedFood 152 82 42 90Textile,Apparel 152 30 20 74LightManufactures 226 120 55 117HeavyManufactures 195 101 44 102Utilities 215 122 45 95OtherServices 209 26 24 77Total 195 43 30 88
Notes: OtherAsia=HongKong,China;Japan;RepublicofKorea;Singapore;Taipei,China),W.OECD=westernOECDeconomies,ROW=restoftheworld.
Source: Roland-Holst,SugiyartoandLoh(2010).
KI2010-Special-Chapter.indd 15 8/12/10 7:01 PM
16
Key Indicators for Asia and the Pacific 2010
THE RISE OF ASIA’S MIddLE CLASS
Note: Lao PDR = Lao People’s Democratic RepublicSource: Roland-Holst, Sugiyarto and Loh (2010).
Figure 2.9 Middle Class Emergence to 2030 (>$2.00 income per person per day)
ArmeniaMalaysiaThailand
AzerbaijanPapua New Guinea
PhilippinesNepal
MongoliaTimor LesteKazakhstan
PakistanSri LankaTajikistanIndonesia
UzbekistanBangladesh
China, People's Republic ofLao PDRGeorgia
Viet NamIndia
Cambodia
0 10 20 30 40 50 60
>2$ standard, % change
2010 2010–2020 2020–2030 2010–2020 2020–2030
>2$ standard, population, million
Timor-LesteArmenia
MongoliaGeorgia
TajikistanPapua New Guinea
AzerbaijanLao PDR
KazakhstanSri Lanka
CambodiaUzbekistan
NepalMalaysiaThailand
Viet NamPhilippines
BangladeshPakistan
IndonesiaChina, People's Republic of
India
0 200 400 600 800 1,000 1,200
2020–20302010–20202010–2020 2020–20302010
Note: Lao PDR = Lao People’s Democratic RepublicSource: Roland-Holst, Sugiyarto and Loh (2010).
Figure 2.10 Middle Class Emergence to 2030 (>$4.00 income per person per day)
>4$ standard, population, million
0 200 400 600 800 1,000 1,200
Timor-Leste
Mongolia
Armenia
Tajikistan
Georgia
Papua New Guinea
Lao PDR
Azerbaijan
Uzbekistan
Cambodia
Sri Lanka
Nepal
Kazakhstan
Malaysia
Thailand
Bangladesh
Viet Nam
Philippines
Indonesia
Pakistan
India
China, People's Republic of
Timor LesteUzbekistan
Papua New GuineaTajikistanArmenia
NepalMalaysia
BangladeshThailand
MongoliaPhilippinesIndonesiaLao PDRPakistanSriLanka
CambodiaChina, People's Republic of
IndiaViet Nam
GeorgiaKazakhstanAzerbaijan
0 10 20 30 40 50 60
>4$ standard, % change
KI2010-Special-Chapter.indd 16 8/12/10 7:01 PM
17
Key Indicators for Asia and the Pacific 2010
SPECIAL CHAPTERTHE RISE OF ASIA’S MIddLE CLASS
Figure 2.11 Baseline Income Distributions for Consensus Real GDP Growth Trends (% of population in each income group)
Notes: PRC = People’s Republic of China; Lao PDR = Lao People’s Democratic Republic; PNG = Papua New GuineaSource: Roland-Holst, Sugiyarto and Loh (2010).
2010
2020
2030
2010
2020
2030
2010
2020
2030
2010
2020
2030
2010
2020
2030
2010
2020
2030
2010
2020
2030
2010
2020
2030
2010
2020
2030
2010
2020
2030
2010
2020
2030
2010
2020
2030
2010
2020
2030
2010
2020
2030
2010
2020
2030
2010
2020
2030
2010
2020
2030
2010
2020
2030
2010
2020
2030
2010
2020
2030
2010
2020
2030
2010
2020
2030
2010
2020
2030
2010
2020
2030
0% 10% 20% 30% 40% 50% 60% 70% 80% 90% 100% 0% 10% 20% 30% 40% 50% 60% 70% 80% 90% 100%Ar
men
iaAz
erba
ijan
Bang
lade
shIn
dia
Indo
nesi
aKa
zakh
stan
Lao
PDR
Mal
aysi
aM
ongo
liaGe
orgi
aCa
mbo
dia
PRC
Mon
golia
Nep
alPa
kist
anPN
GPh
ilippi
nes
Sri L
anka
Tajik
ista
nTh
aila
ndTi
mor
Les
teUz
beki
stan
Viet
Nam
Wor
ld
<$1.25 $2–$4 $4–$6 $6–$10 $10–$20 >$20
economic growth, as well as an important mitigation strategy against higher energy costs and greenhouse gas emissions. To see these effects, we consider a scenario with 1% average annual efficiency improvements across each national economy.
• Agricultural productivity growth (A)—Agro-food products are critical to both basic livelihoods and economic growth potential because they are tied directly to the income of the world’s poor rural majority and dominate the poor’s expenditures. To
KI2010-Special-Chapter.indd 17 8/12/10 7:01 PM
18
Key Indicators for Asia and the Pacific 2010
THE RISE OF ASIA’S MIddLE CLASS
assess the importance of this sector, we include a counterfactual with total factor productivity growth in agriculture of 1% per year from 2010 to 2030.
• Skill intensive growth (S)—Increasing labor productivity is key not only to superior aggregate growth, but also to more extensive growth benefits across the population. To assess these benefits, in this counterfactual we assume 1% annual labor productivity growth of all individuals to 2030.
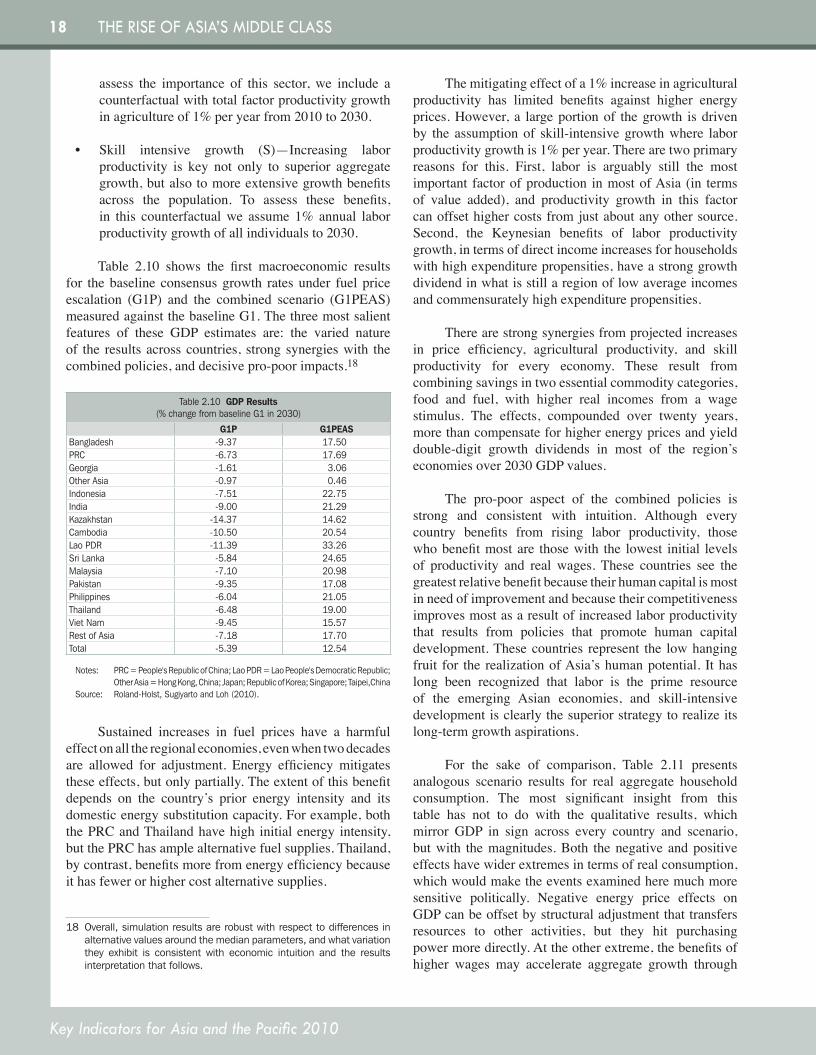
Table 2.10 shows the first macroeconomic results for the baseline consensus growth rates under fuel price escalation (G1P) and the combined scenario (G1PEAS) measured against the baseline G1. The three most salient features of these GDP estimates are: the varied nature of the results across countries, strong synergies with the combined policies, and decisive pro-poor impacts.18
Sustained increases in fuel prices have a harmful effect on all the regional economies, even when two decades are allowed for adjustment. Energy efficiency mitigates these effects, but only partially. The extent of this benefit depends on the country’s prior energy intensity and its domestic energy substitution capacity. For example, both the PRC and Thailand have high initial energy intensity, but the PRC has ample alternative fuel supplies. Thailand, by contrast, benefits more from energy efficiency because it has fewer or higher cost alternative supplies.
18 Overall,simulationresultsarerobustwithrespecttodifferencesinalternativevaluesaroundthemedianparameters,andwhatvariationthey exhibit is consistent with economic intuition and the resultsinterpretationthatfollows.
Table2.10 GDP Results(%changefrombaselineG1in2030)
G1P G1PEASBangladesh -9.37 17.50PRC -6.73 17.69Georgia -1.61 3.06OtherAsia -0.97 0.46Indonesia -7.51 22.75India -9.00 21.29Kazakhstan -14.37 14.62Cambodia -10.50 20.54LaoPDR -11.39 33.26SriLanka -5.84 24.65Malaysia -7.10 20.98Pakistan -9.35 17.08Philippines -6.04 21.05Thailand -6.48 19.00VietNam -9.45 15.57RestofAsia -7.18 17.70Total -5.39 12.54
Notes: PRC=People'sRepublicofChina;LaoPDR=LaoPeople'sDemocraticRepublic;OtherAsia=HongKong,China;Japan;RepublicofKorea;Singapore;Taipei,China
Source: Roland-Holst,SugiyartoandLoh(2010).
The mitigating effect of a 1% increase in agricultural productivity has limited benefits against higher energy prices. However, a large portion of the growth is driven by the assumption of skill-intensive growth where labor productivity growth is 1% per year. There are two primary reasons for this. First, labor is arguably still the most important factor of production in most of Asia (in terms of value added), and productivity growth in this factor can offset higher costs from just about any other source. Second, the Keynesian benefits of labor productivity growth, in terms of direct income increases for households with high expenditure propensities, have a strong growth dividend in what is still a region of low average incomes and commensurately high expenditure propensities.
There are strong synergies from projected increases in price efficiency, agricultural productivity, and skill productivity for every economy. These result from combining savings in two essential commodity categories, food and fuel, with higher real incomes from a wage stimulus. The effects, compounded over twenty years, more than compensate for higher energy prices and yield double-digit growth dividends in most of the region’s economies over 2030 GDP values.
The pro-poor aspect of the combined policies is strong and consistent with intuition. Although every country benefits from rising labor productivity, those who benefit most are those with the lowest initial levels of productivity and real wages. These countries see the greatest relative benefit because their human capital is most in need of improvement and because their competitiveness improves most as a result of increased labor productivity that results from policies that promote human capital development. These countries represent the low hanging fruit for the realization of Asia’s human potential. It has long been recognized that labor is the prime resource of the emerging Asian economies, and skill-intensive development is clearly the superior strategy to realize its long-term growth aspirations.
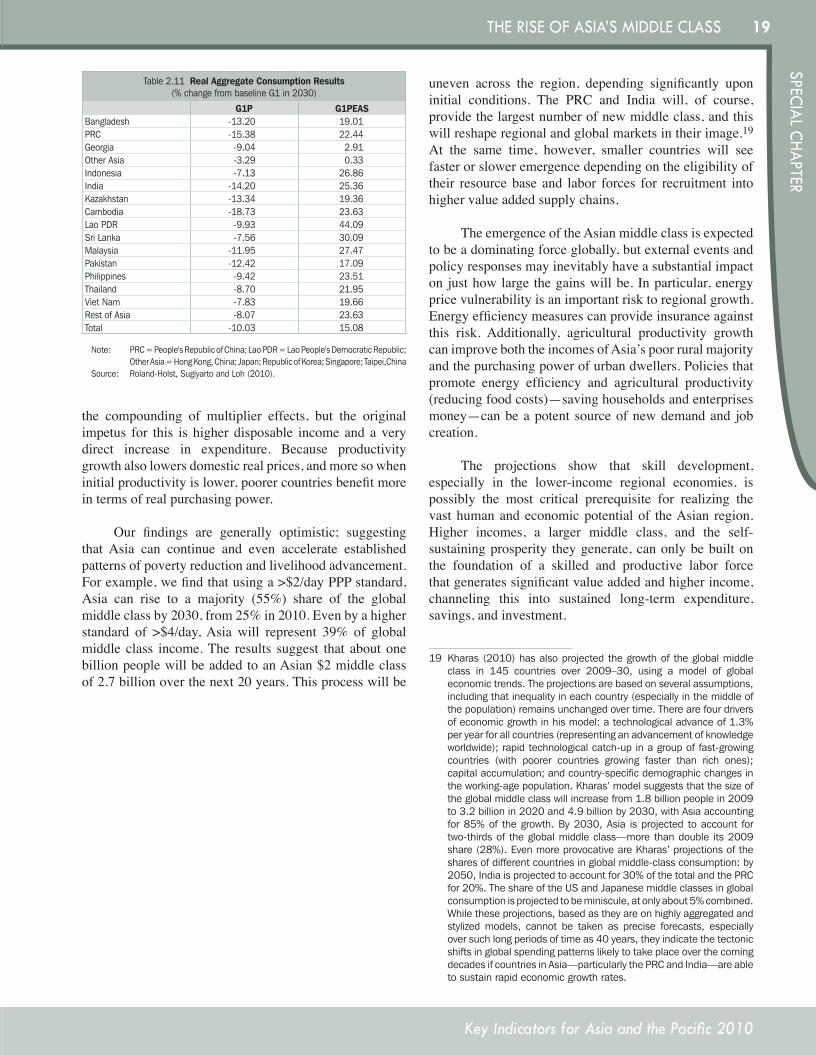
For the sake of comparison, Table 2.11 presents analogous scenario results for real aggregate household consumption. The most significant insight from this table has not to do with the qualitative results, which mirror GDP in sign across every country and scenario, but with the magnitudes. Both the negative and positive effects have wider extremes in terms of real consumption, which would make the events examined here much more sensitive politically. Negative energy price effects on GDP can be offset by structural adjustment that transfers resources to other activities, but they hit purchasing power more directly. At the other extreme, the benefits of higher wages may accelerate aggregate growth through
KI2010-Special-Chapter.indd 18 8/12/10 7:01 PM
19
Key Indicators for Asia and the Pacific 2010
SPECIAL CHAPTERTHE RISE OF ASIA’S MIddLE CLASS
the compounding of multiplier effects, but the original impetus for this is higher disposable income and a very direct increase in expenditure. Because productivity growth also lowers domestic real prices, and more so when initial productivity is lower, poorer countries benefit more in terms of real purchasing power.
Our findings are generally optimistic; suggesting that Asia can continue and even accelerate established patterns of poverty reduction and livelihood advancement. For example, we find that using a >$2/day PPP standard, Asia can rise to a majority (55%) share of the global middle class by 2030, from 25% in 2010. Even by a higher standard of >$4/day, Asia will represent 39% of global middle class income. The results suggest that about one billion people will be added to an Asian $2 middle class of 2.7 billion over the next 20 years. This process will be
uneven across the region, depending significantly upon initial conditions. The PRC and India will, of course, provide the largest number of new middle class, and this will reshape regional and global markets in their image.19 At the same time, however, smaller countries will see faster or slower emergence depending on the eligibility of their resource base and labor forces for recruitment into higher value added supply chains.
The emergence of the Asian middle class is expected to be a dominating force globally, but external events and policy responses may inevitably have a substantial impact on just how large the gains will be. In particular, energy price vulnerability is an important risk to regional growth. Energy efficiency measures can provide insurance against this risk. Additionally, agricultural productivity growth can improve both the incomes of Asia’s poor rural majority and the purchasing power of urban dwellers. Policies that promote energy efficiency and agricultural productivity (reducing food costs)—saving households and enterprises money—can be a potent source of new demand and job creation.
The projections show that skill development, especially in the lower-income regional economies, is possibly the most critical prerequisite for realizing the vast human and economic potential of the Asian region. Higher incomes, a larger middle class, and the self-sustaining prosperity they generate, can only be built on the foundation of a skilled and productive labor force that generates significant value added and higher income, channeling this into sustained long-term expenditure, savings, and investment.
19 Kharas(2010)hasalsoprojectedthegrowthoftheglobalmiddleclass in 145 countries over 2009–30, using a model of globaleconomictrends.Theprojectionsarebasedonseveralassumptions,includingthatinequalityineachcountry(especiallyinthemiddleofthepopulation)remainsunchangedovertime.Therearefourdriversofeconomicgrowthinhismodel:atechnologicaladvanceof1.3%peryearforallcountries(representinganadvancementofknowledgeworldwide);rapidtechnologicalcatch-upinagroupoffast-growingcountries (with poorer countries growing faster than rich ones);capitalaccumulation;andcountry-specificdemographicchangesintheworking-agepopulation.Kharas’modelsuggeststhatthesizeoftheglobalmiddleclasswillincreasefrom1.8billionpeoplein2009to3.2billionin2020and4.9billionby2030,withAsiaaccountingfor85%of thegrowth.By2030,Asia isprojected toaccount fortwo-thirdsof theglobalmiddleclass—morethandouble its2009share(28%).EvenmoreprovocativeareKharas’projectionsofthesharesofdifferentcountriesinglobalmiddle-classconsumption:by2050,Indiaisprojectedtoaccountfor30%ofthetotalandthePRCfor20%.TheshareoftheUSandJapanesemiddleclassesinglobalconsumptionisprojectedtobeminiscule,atonlyabout5%combined.Whiletheseprojections,basedastheyareonhighlyaggregatedandstylizedmodels, cannot be taken as precise forecasts, especiallyoversuchlongperiodsoftimeas40years,theyindicatethetectonicshiftsinglobalspendingpatternslikelytotakeplaceoverthecomingdecadesifcountriesinAsia—particularlythePRCandIndia—areabletosustainrapideconomicgrowthrates.
Table2.11 Real Aggregate Consumption Results (%changefrombaselineG1in2030)
G1P G1PEASBangladesh -13.20 19.01PRC -15.38 22.44Georgia -9.04 2.91OtherAsia -3.29 0.33Indonesia -7.13 26.86India -14.20 25.36Kazakhstan -13.34 19.36Cambodia -18.73 23.63LaoPDR -9.93 44.09SriLanka -7.56 30.09Malaysia -11.95 27.47Pakistan -12.42 17.09Philippines -9.42 23.51Thailand -8.70 21.95VietNam -7.83 19.66RestofAsia -8.07 23.63Total -10.03 15.08
Note: PRC=People'sRepublicofChina;LaoPDR=LaoPeople'sDemocraticRepublic;OtherAsia=HongKong,China;Japan;RepublicofKorea;Singapore;Taipei,China
Source: Roland-Holst,SugiyartoandLoh(2010).
KI2010-Special-Chapter.indd 19 8/12/10 7:01 PM
20
Key Indicators for Asia and the Pacific 2010
THE RISE OF ASIA’S MIddLE CLASS
3. TheMiddleClassandTheirValues:AProfile
What are the characteristics of the middle class? Do its members look very different—in their occupations and education—from the poor or the affluent? What are their values? How are these different from those held by other classes? These are some of the questions this section addresses, allowing us to examine how middle-class characteristics may contribute to the growth process.
A. ProfileoftheMiddleClass
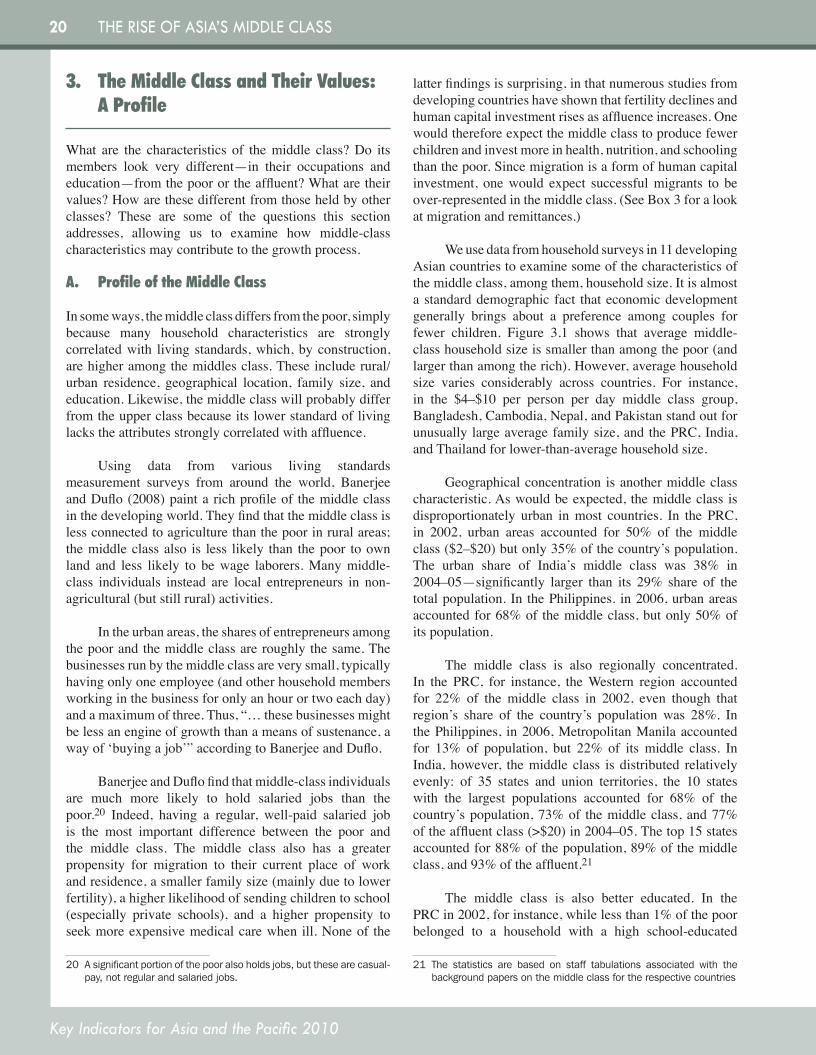
In some ways, the middle class differs from the poor, simply because many household characteristics are strongly correlated with living standards, which, by construction, are higher among the middles class. These include rural/urban residence, geographical location, family size, and education. Likewise, the middle class will probably differ from the upper class because its lower standard of living lacks the attributes strongly correlated with affluence.
Using data from various living standards measurement surveys from around the world, Banerjee and Duflo (2008) paint a rich profile of the middle class in the developing world. They find that the middle class is less connected to agriculture than the poor in rural areas; the middle class also is less likely than the poor to own land and less likely to be wage laborers. Many middle-class individuals instead are local entrepreneurs in non-agricultural (but still rural) activities.
In the urban areas, the shares of entrepreneurs among the poor and the middle class are roughly the same. The businesses run by the middle class are very small, typically having only one employee (and other household members working in the business for only an hour or two each day) and a maximum of three. Thus, “… these businesses might be less an engine of growth than a means of sustenance, a way of ‘buying a job’” according to Banerjee and Duflo.
Banerjee and Duflo find that middle-class individuals are much more likely to hold salaried jobs than the poor.20 Indeed, having a regular, well-paid salaried job is the most important difference between the poor and the middle class. The middle class also has a greater propensity for migration to their current place of work and residence, a smaller family size (mainly due to lower fertility), a higher likelihood of sending children to school (especially private schools), and a higher propensity to seek more expensive medical care when ill. None of the
20 Asignificantportionofthepooralsoholdsjobs,butthesearecasual-pay,notregularandsalariedjobs.
latter findings is surprising, in that numerous studies from developing countries have shown that fertility declines and human capital investment rises as affluence increases. One would therefore expect the middle class to produce fewer children and invest more in health, nutrition, and schooling than the poor. Since migration is a form of human capital investment, one would expect successful migrants to be over-represented in the middle class. (See Box 3 for a look at migration and remittances.)
We use data from household surveys in 11 developing Asian countries to examine some of the characteristics of the middle class, among them, household size. It is almost a standard demographic fact that economic development generally brings about a preference among couples for fewer children. Figure 3.1 shows that average middle-class household size is smaller than among the poor (and larger than among the rich). However, average household size varies considerably across countries. For instance, in the $4–$10 per person per day middle class group, Bangladesh, Cambodia, Nepal, and Pakistan stand out for unusually large average family size, and the PRC, India, and Thailand for lower-than-average household size.
Geographical concentration is another middle class characteristic. As would be expected, the middle class is disproportionately urban in most countries. In the PRC, in 2002, urban areas accounted for 50% of the middle class ($2–$20) but only 35% of the country’s population. The urban share of India’s middle class was 38% in 2004–05—significantly larger than its 29% share of the total population. In the Philippines. in 2006, urban areas accounted for 68% of the middle class, but only 50% of its population.
The middle class is also regionally concentrated. In the PRC, for instance, the Western region accounted for 22% of the middle class in 2002, even though that region’s share of the country’s population was 28%. In the Philippines, in 2006, Metropolitan Manila accounted for 13% of population, but 22% of its middle class. In India, however, the middle class is distributed relatively evenly: of 35 states and union territories, the 10 states with the largest populations accounted for 68% of the country’s population, 73% of the middle class, and 77% of the affluent class (>$20) in 2004–05. The top 15 states accounted for 88% of the population, 89% of the middle class, and 93% of the affluent.21
The middle class is also better educated. In the PRC in 2002, for instance, while less than 1% of the poor belonged to a household with a high school-educated
21 The statistics are based on staff tabulations associated with thebackgroundpapersonthemiddleclassfortherespectivecountries
KI2010-Special-Chapter.indd 20 8/12/10 7:01 PM
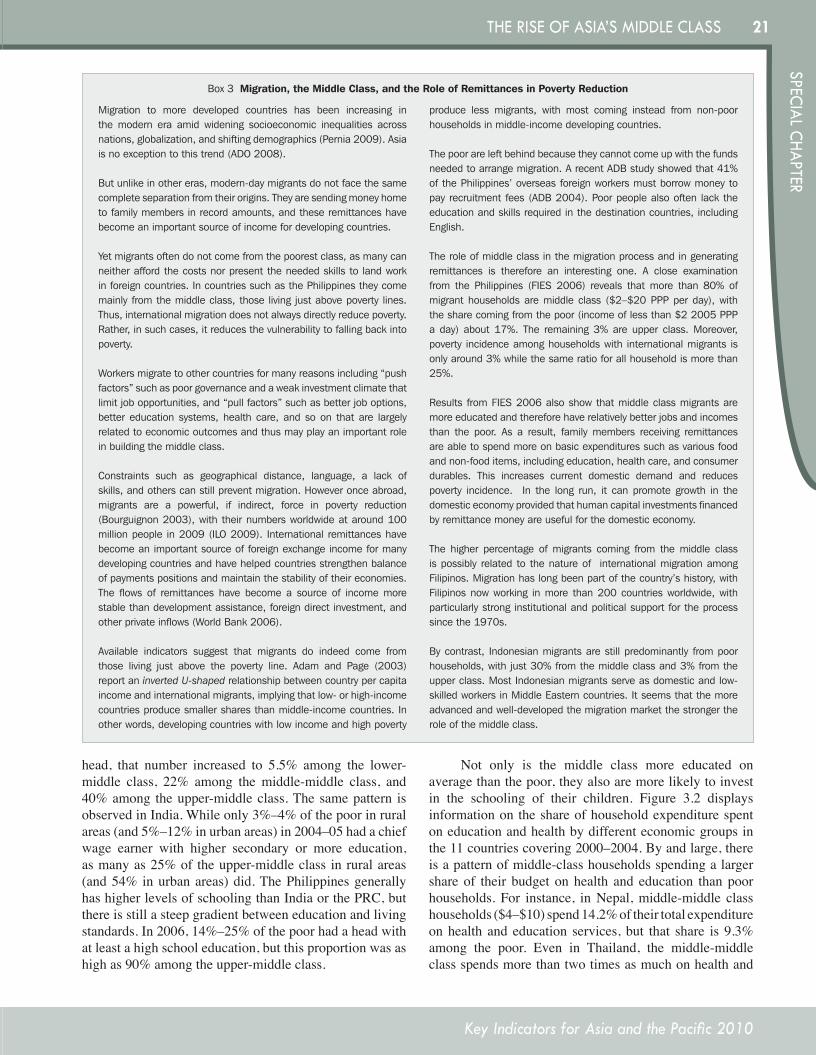
21
Key Indicators for Asia and the Pacific 2010
SPECIAL CHAPTERTHE RISE OF ASIA’S MIddLE CLASS
head, that number increased to 5.5% among the lower-middle class, 22% among the middle-middle class, and 40% among the upper-middle class. The same pattern is observed in India. While only 3%–4% of the poor in rural areas (and 5%–12% in urban areas) in 2004–05 had a chief wage earner with higher secondary or more education, as many as 25% of the upper-middle class in rural areas (and 54% in urban areas) did. The Philippines generally has higher levels of schooling than India or the PRC, but there is still a steep gradient between education and living standards. In 2006, 14%–25% of the poor had a head with at least a high school education, but this proportion was as high as 90% among the upper-middle class.
Not only is the middle class more educated on average than the poor, they also are more likely to invest in the schooling of their children. Figure 3.2 displays information on the share of household expenditure spent on education and health by different economic groups in the 11 countries covering 2000–2004. By and large, there is a pattern of middle-class households spending a larger share of their budget on health and education than poor households. For instance, in Nepal, middle-middle class households ($4–$10) spend 14.2% of their total expenditure on health and education services, but that share is 9.3% among the poor. Even in Thailand, the middle-middle class spends more than two times as much on health and
Box 3 Migration, the Middle Class, and the Role of Remittances in Poverty Reduction
Migration to more developed countries has been increasing in the modern era amid widening socioeconomic inequalities across nations, globalization, and shifting demographics (Pernia 2009). Asia is no exception to this trend (ADO 2008).
But unlike in other eras, modern-day migrants do not face the same complete separation from their origins. They are sending money home to family members in record amounts, and these remittances have become an important source of income for developing countries.
Yet migrants often do not come from the poorest class, as many can neither afford the costs nor present the needed skills to land work in foreign countries. In countries such as the Philippines they come mainly from the middle class, those living just above poverty lines. Thus, international migration does not always directly reduce poverty. Rather, in such cases, it reduces the vulnerability to falling back into poverty.
Workers migrate to other countries for many reasons including “push factors” such as poor governance and a weak investment climate that limit job opportunities, and “pull factors” such as better job options, better education systems, health care, and so on that are largely related to economic outcomes and thus may play an important role in building the middle class.
Constraints such as geographical distance, language, a lack of skills, and others can still prevent migration. However once abroad, migrants are a powerful, if indirect, force in poverty reduction (Bourguignon 2003), with their numbers worldwide at around 100 million people in 2009 (ILO 2009). International remittances have become an important source of foreign exchange income for many developing countries and have helped countries strengthen balance of payments positions and maintain the stability of their economies. The flows of remittances have become a source of income more stable than development assistance, foreign direct investment, and other private inflows (World Bank 2006).
Available indicators suggest that migrants do indeed come from those living just above the poverty line. Adam and Page (2003) report an inverted U-shaped relationship between country per capita income and international migrants, implying that low- or high-income countries produce smaller shares than middle-income countries. In other words, developing countries with low income and high poverty
produce less migrants, with most coming instead from non-poor households in middle-income developing countries.
The poor are left behind because they cannot come up with the funds needed to arrange migration. A recent ADB study showed that 41% of the Philippines’ overseas foreign workers must borrow money to pay recruitment fees (ADB 2004). Poor people also often lack the education and skills required in the destination countries, including English.
The role of middle class in the migration process and in generating remittances is therefore an interesting one. A close examination from the Philippines (FIES 2006) reveals that more than 80% of migrant households are middle class ($2–$20 PPP per day), with the share coming from the poor (income of less than $2 2005 PPP a day) about 17%. The remaining 3% are upper class. Moreover, poverty incidence among households with international migrants is only around 3% while the same ratio for all household is more than 25%.
Results from FIES 2006 also show that middle class migrants are more educated and therefore have relatively better jobs and incomes than the poor. As a result, family members receiving remittances are able to spend more on basic expenditures such as various food and non-food items, including education, health care, and consumer durables. This increases current domestic demand and reduces poverty incidence. In the long run, it can promote growth in the domestic economy provided that human capital investments financed by remittance money are useful for the domestic economy.
The higher percentage of migrants coming from the middle class is possibly related to the nature of international migration among Filipinos. Migration has long been part of the country’s history, with Filipinos now working in more than 200 countries worldwide, with particularly strong institutional and political support for the process since the 1970s.
By contrast, Indonesian migrants are still predominantly from poor households, with just 30% from the middle class and 3% from the upper class. Most Indonesian migrants serve as domestic and low-skilled workers in Middle Eastern countries. It seems that the more advanced and well-developed the migration market the stronger the role of the middle class.
KI2010-Special-Chapter.indd 21 8/12/10 7:01 PM
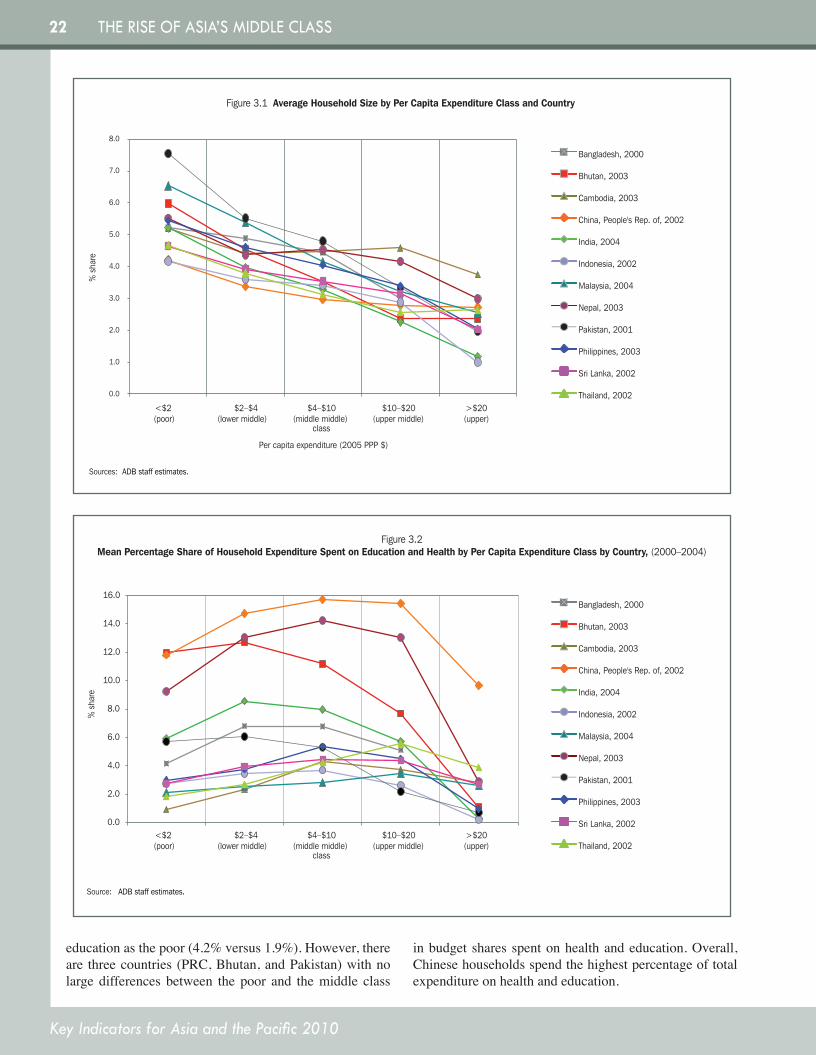
22
Key Indicators for Asia and the Pacific 2010
THE RISE OF ASIA’S MIddLE CLASS
education as the poor (4.2% versus 1.9%). However, there are three countries (PRC, Bhutan, and Pakistan) with no large differences between the poor and the middle class
in budget shares spent on health and education. Overall, Chinese households spend the highest percentage of total expenditure on health and education.
Sources: ADB staff estimates.
class
<$2 $2–$4 $4–$10 $10–$20 >$20(poor) (lower middle) (middle middle) (upper middle) (upper)
Figure 3.1 Average Household Size by Per Capita Expenditure Class and Country%
sha
re
Per capita expenditure (2005 PPP $)
Bangladesh, 2000
Bhutan, 2003
Cambodia, 2003
China, People's Rep. of, 2002
India, 2004
Indonesia, 2002
Malaysia, 2004
Nepal, 2003
Pakistan, 2001
Philippines, 2003
Sri Lanka, 2002
Thailand, 20020.0
1.0
2.0
3.0
4.0
5.0
6.0
7.0
8.0
Source: ADB staff estimates.
Figure 3.2Mean Percentage Share of Household Expenditure Spent on Education and Health by Per Capita Expenditure Class by Country, (2000–2004)
Bangladesh, 2000
Bhutan, 2003
Cambodia, 2003
China, People's Rep. of, 2002
India, 2004
Indonesia, 2002
Malaysia, 2004
Nepal, 2003
Pakistan, 2001
Philippines, 2003
Sri Lanka, 2002
Thailand, 2002
% s
hare
class
0.0<$2 $2–$4 $4–$10 $10–$20 >$20
2.0
4.0
6.0
8.0
10.0
12.0
14.0
16.0
(poor) (lower middle) (middle middle) (upper middle) (upper)
KI2010-Special-Chapter.indd 22 8/12/10 7:01 PM
23
Key Indicators for Asia and the Pacific 2010
SPECIAL CHAPTERTHE RISE OF ASIA’S MIddLE CLASS
Employment and occupation is another important attribute. Do middle class individuals engage in different professions and occupations than the poor and the rich? We base our analysis on data from the PRC, India, Indonesia, and the Philippines, as it is possible in these countries to merge information from household expenditure surveys (which enable identification of middle-class status) with information on the labor force status of household members.
Table 3.1 describes the distribution of the different types of employment activities, including unemployment, by expenditure categories. There are three observations to be made: first, own-account workers comprise the largest share of employment in the three classes of households: the $1.25 a day poor households, the near poor or vulnerable ($2 a day or less), and the lower-middle class ($2–$4). Second, individuals categorized as “employers” account for a very small share across all classes, but especially among the three lowest classes. Third, regular or permanent wage employment accounts for the largest type of employment in the top two classes. These patterns are consistent with those highlighted by Banerjee and Duflo, who argue that individuals in the middle class are not “capitalists in waiting.” To the extent that they run businesses, these are small, undercapitalized, have low resource commitments, and are often unprofitable.
What about the occupational and industry distribution of the middle class? Data from India show that, in rural areas, middle-class individuals are less likely than the poor to be farmers and fishermen, and more likely to be professional and technical workers. In urban areas, they are less likely to be production workers and laborers, and more likely to be administrative, executive, management, professional and technical workers (Table 3.2) The same is broadly true of the Philippines, where middle-class individuals are much more likely to work in government and corporations (Table 3.3). In the rural areas of the PRC, middle-class households are less likely to be involved in agriculture and more likely to be involved in production enterprises, whether privately owned or government-run units (Table 3.4). Urban middle-class and upper-class households are more likely to have office, professional, or technical occupations compared to poor households, and to have a government-
Table3.1 Population Distribution by Economic Group and Employment Type (India,2004–05;Philippines,2006;andPeople’sRepublicofChina,2002)
Per capita expenditure
/income class (2005
$ PPP) Economic group
Share to total labor force by type of employmentIndia
Self-employed Wage employment
Unem
ploy
ed
Total (labor force)
Own-account workers Employers
Casual/ temporary
Regular/ permanent
<$1.25 Poor 46.7 0.2 42.1 8.5 2.5 100.0$1.25–$2 Nearpoororvulnerable 55.3 0.8 28.7 12.2 3.0 100.0$2–$4 Lowermiddleclass 53.8 2.8 14.5 24.8 4.0 100.0$4–$10 Middlemiddleclass 37.4 8.1 4.2 45.4 5.0 100.0>$10 Uppermiddleclassandrich 29.1 11.9 2.4 53.2 3.4 100.0
All classes 51.1 1.3 29.4 15.1 3.1 100.0
Per capita expenditure
/income class (2005
$ PPP) Economic group
Share to each type of employmentIndia
Self-employed Wage employment
Unem
ploy
ed
Total (labor force)
Own-account workers Employers
Casual/ temporary
Regular/ permanent
<$1.25 Poor 32.7 6.0 51.3 20.1 28.4 35.8$1.25–$2 Nearpoororvulnerable 41.5 21.8 37.4 31.2 37.0 38.4$2–$4 Lowermiddleclass 22.7 45.1 10.7 35.5 27.8 21.5$4–$10 Middlemiddleclass 2.9 24.2 0.6 12.1 6.4 4.0>$10 Uppermiddleclassandrich 0.2 2.9 0.0 1.2 0.4 0.3
All classes 100.0 100.0 100.0 100.0 100.0 100.0
Per capita expenditure
/income class (2005
$ PPP) Economic group
Share to total labor force by type of employmentPhilippines
Self-employed Wage employment
Unem
ploy
ed
Total (labor force)
Own-account workers Employers
Casual/ temporary
Regular/ permanent
<$1.25 Poor 54.3 3.1 18.2 19.2 5.2 100.0$1.25–$2 Nearpoororvulnerable 47.1 3.7 18.4 23.7 7.0 100.0$2–$4 Lowermiddleclass 37.4 4.3 15.0 33.5 9.7 100.0$4–$10 Middlemiddleclass 27.3 5.1 10.7 48.2 8.7 100.0>$10 Uppermiddleclassandrich 15.4 7.3 7.0 65.2 5.1 100.0
All classes 39.4 4.3 15.0 33.5 7.8 100.0
Per capita expenditure
/income class (2005
$ PPP) Economic group
Share to each type of employmentPhilippines
Self-employed Wage employment
Unem
ploy
ed
Total (labor force)
Own-account workers Employers
Casual/ temporary
Regular/ permanent
<$1.25 Poor 25.2 13.3 22.1 10.5 12.2 18.3$1.25–$2 Nearpoororvulnerable 28.0 20.4 28.7 16.6 21.1 23.4$2–$4 Lowermiddleclass 29.7 31.5 31.3 31.3 38.9 31.3$4–$10 Middlemiddleclass 14.9 25.6 15.4 31.1 24.2 21.6>$10 Uppermiddleclassandrich 2.1 9.2 2.5 10.5 3.5 5.4
All classes 100.0 100.0 100.0 100.0 100.0 100.0
Per capita expenditure
/income class (2005
$ PPP) Economic group
Share to total labor force by type of employmentPeople’s Republic of China
Self-employed Wage employmentUn
empl
oyed
Total (labor force)
Own-account workers Employers
Casual/ temporary
Regular/ permanent
<$1.25 Poor 58.4 3.0 20.5 16.6 1.5 100.0$1.25–$2 Nearpoororvulnerable 52.0 4.6 20.0 21.8 1.6 100.0$2–$4 Lowermiddleclass 37.0 5.0 18.5 37.7 1.7 100.0$4–$10 Middlemiddleclass 15.9 4.1 12.1 66.9 1.1 100.0>$10 Uppermiddleclassandrich 9.3 5.3 9.2 75.7 0.5 100.0
All classes 34.8 4.4 16.7 42.7 1.4 100.0
Per capita expenditure
/income class (2005
$ PPP) Economic group
Share to each type of employmentPeople’s Republic of China
Self-employed Wage employment
Unem
ploy
ed
Total (labor force)
Own-account workers Employers
Casual/ temporary
Regular/ permanent
<$1.25 Poor 21.5 8.6 15.8 5.0 13.8 12.8$1.25–$2 Nearpoororvulnerable 26.3 18.5 21.1 9.0 19.7 17.6$2–$4 Lowermiddleclass 37.2 39.7 38.9 30.9 42.6 35.0$4–$10 Middlemiddleclass 13.7 27.6 21.7 47.0 22.3 30.0>$10 Uppermiddleclassandrich 1.2 5.5 2.5 8.1 1.6 4.6
All classes 100.0 100.0 100.0 100.0 100.0 100.0
Source: StaffestimatesbasedonIndia’sEmploymentandUnemploymentSurvey;Philippines’2006FIES;CHIPSurvey2002.
KI2010-Special-Chapter.indd 23 8/12/10 7:01 PM
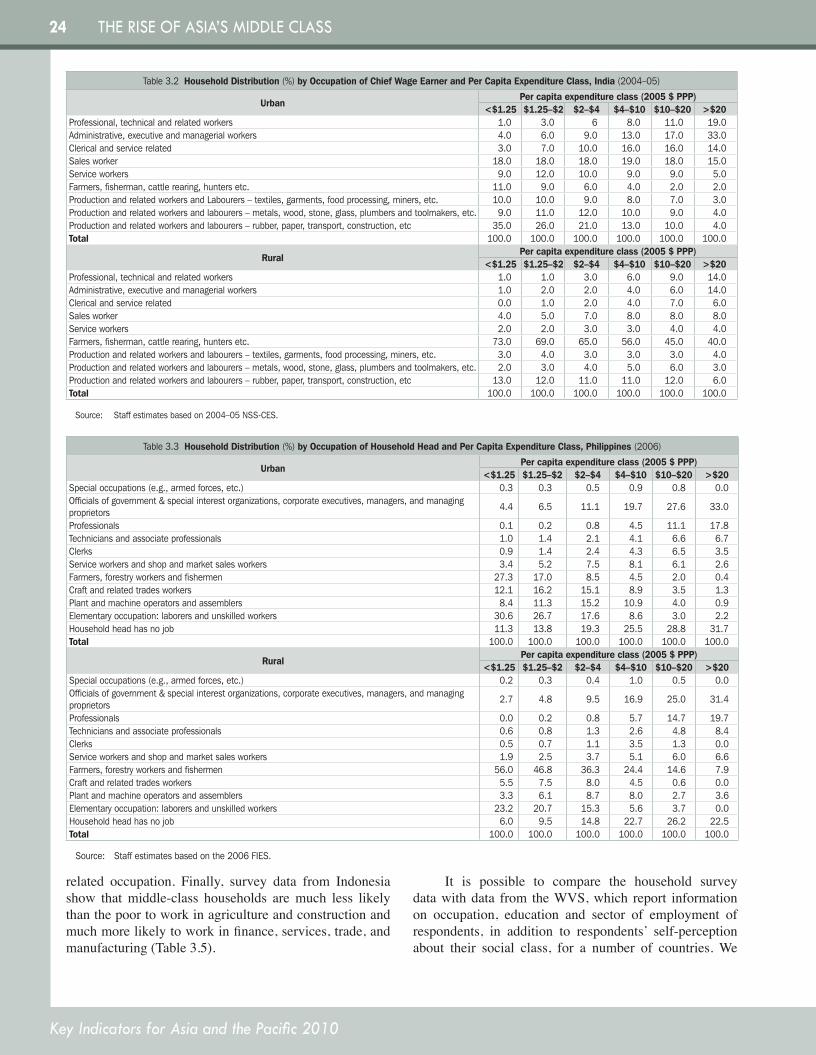
24
Key Indicators for Asia and the Pacific 2010
THE RISE OF ASIA’S MIddLE CLASS
related occupation. Finally, survey data from Indonesia show that middle-class households are much less likely than the poor to work in agriculture and construction and much more likely to work in finance, services, trade, and manufacturing (Table 3.5).
It is possible to compare the household survey data with data from the WVS, which report information on occupation, education and sector of employment of respondents, in addition to respondents’ self-perception about their social class, for a number of countries. We
Table3.2Household Distribution(%)by Occupation of Chief Wage Earner and Per Capita Expenditure Class, India(2004–05)
UrbanPer capita expenditure class (2005 $ PPP)
<$1.25 $1.25–$2 $2–$4 $4–$10 $10–$20 >$20Professional,technicalandrelatedworkers 1.0 3.0 6 8.0 11.0 19.0Administrative,executiveandmanagerialworkers 4.0 6.0 9.0 13.0 17.0 33.0Clericalandservicerelated 3.0 7.0 10.0 16.0 16.0 14.0Salesworker 18.0 18.0 18.0 19.0 18.0 15.0Serviceworkers 9.0 12.0 10.0 9.0 9.0 5.0Farmers,fisherman,cattlerearing,huntersetc. 11.0 9.0 6.0 4.0 2.0 2.0ProductionandrelatedworkersandLabourers–textiles,garments,foodprocessing,miners,etc. 10.0 10.0 9.0 8.0 7.0 3.0Productionandrelatedworkersandlabourers–metals,wood,stone,glass,plumbersandtoolmakers,etc. 9.0 11.0 12.0 10.0 9.0 4.0Productionandrelatedworkersandlabourers–rubber,paper,transport,construction,etc 35.0 26.0 21.0 13.0 10.0 4.0Total 100.0 100.0 100.0 100.0 100.0 100.0
RuralPer capita expenditure class (2005 $ PPP)
<$1.25 $1.25–$2 $2–$4 $4–$10 $10–$20 >$20Professional,technicalandrelatedworkers 1.0 1.0 3.0 6.0 9.0 14.0Administrative,executiveandmanagerialworkers 1.0 2.0 2.0 4.0 6.0 14.0Clericalandservicerelated 0.0 1.0 2.0 4.0 7.0 6.0Salesworker 4.0 5.0 7.0 8.0 8.0 8.0Serviceworkers 2.0 2.0 3.0 3.0 4.0 4.0Farmers,fisherman,cattlerearing,huntersetc. 73.0 69.0 65.0 56.0 45.0 40.0Productionandrelatedworkersandlabourers–textiles,garments,foodprocessing,miners,etc. 3.0 4.0 3.0 3.0 3.0 4.0Productionandrelatedworkersandlabourers–metals,wood,stone,glass,plumbersandtoolmakers,etc. 2.0 3.0 4.0 5.0 6.0 3.0Productionandrelatedworkersandlabourers–rubber,paper,transport,construction,etc 13.0 12.0 11.0 11.0 12.0 6.0Total 100.0 100.0 100.0 100.0 100.0 100.0
Source: Staffestimatesbasedon2004–05NSS-CES.
Table3.3 Household Distribution (%) by Occupation of Household Head and Per Capita Expenditure Class, Philippines (2006)
UrbanPer capita expenditure class (2005 $ PPP)
<$1.25 $1.25–$2 $2–$4 $4–$10 $10–$20 >$20Specialoccupations(e.g.,armedforces,etc.) 0.3 0.3 0.5 0.9 0.8 0.0Officialsofgovernment&specialinterestorganizations,corporateexecutives,managers,andmanagingproprietors 4.4 6.5 11.1 19.7 27.6 33.0
Professionals 0.1 0.2 0.8 4.5 11.1 17.8Techniciansandassociateprofessionals 1.0 1.4 2.1 4.1 6.6 6.7Clerks 0.9 1.4 2.4 4.3 6.5 3.5Serviceworkersandshopandmarketsalesworkers 3.4 5.2 7.5 8.1 6.1 2.6Farmers,forestryworkersandfishermen 27.3 17.0 8.5 4.5 2.0 0.4Craftandrelatedtradesworkers 12.1 16.2 15.1 8.9 3.5 1.3Plantandmachineoperatorsandassemblers 8.4 11.3 15.2 10.9 4.0 0.9Elementaryoccupation:laborersandunskilledworkers 30.6 26.7 17.6 8.6 3.0 2.2Householdheadhasnojob 11.3 13.8 19.3 25.5 28.8 31.7Total 100.0 100.0 100.0 100.0 100.0 100.0
RuralPer capita expenditure class (2005 $ PPP)
<$1.25 $1.25–$2 $2–$4 $4–$10 $10–$20 >$20Specialoccupations(e.g.,armedforces,etc.) 0.2 0.3 0.4 1.0 0.5 0.0Officialsofgovernment&specialinterestorganizations,corporateexecutives,managers,andmanagingproprietors 2.7 4.8 9.5 16.9 25.0 31.4
Professionals 0.0 0.2 0.8 5.7 14.7 19.7Techniciansandassociateprofessionals 0.6 0.8 1.3 2.6 4.8 8.4Clerks 0.5 0.7 1.1 3.5 1.3 0.0Serviceworkersandshopandmarketsalesworkers 1.9 2.5 3.7 5.1 6.0 6.6Farmers,forestryworkersandfishermen 56.0 46.8 36.3 24.4 14.6 7.9Craftandrelatedtradesworkers 5.5 7.5 8.0 4.5 0.6 0.0Plantandmachineoperatorsandassemblers 3.3 6.1 8.7 8.0 2.7 3.6Elementaryoccupation:laborersandunskilledworkers 23.2 20.7 15.3 5.6 3.7 0.0Householdheadhasnojob 6.0 9.5 14.8 22.7 26.2 22.5Total 100.0 100.0 100.0 100.0 100.0 100.0
Source: Staffestimatesbasedonthe2006FIES.
KI2010-Special-Chapter.indd 24 8/12/10 7:01 PM
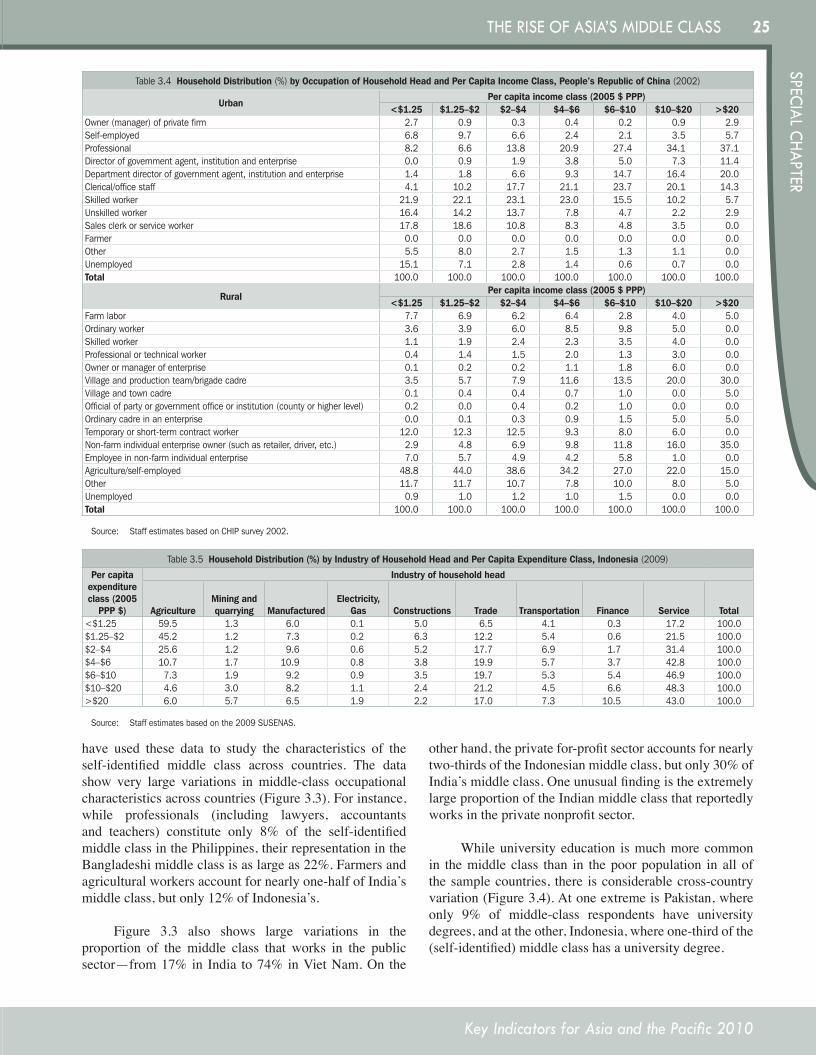
25
Key Indicators for Asia and the Pacific 2010
SPECIAL CHAPTERTHE RISE OF ASIA’S MIddLE CLASS
have used these data to study the characteristics of the self-identified middle class across countries. The data show very large variations in middle-class occupational characteristics across countries (Figure 3.3). For instance, while professionals (including lawyers, accountants and teachers) constitute only 8% of the self-identified middle class in the Philippines, their representation in the Bangladeshi middle class is as large as 22%. Farmers and agricultural workers account for nearly one-half of India’s middle class, but only 12% of Indonesia’s.
Figure 3.3 also shows large variations in the proportion of the middle class that works in the public sector—from 17% in India to 74% in Viet Nam. On the
other hand, the private for-profit sector accounts for nearly two-thirds of the Indonesian middle class, but only 30% of India’s middle class. One unusual finding is the extremely large proportion of the Indian middle class that reportedly works in the private nonprofit sector.
While university education is much more common in the middle class than in the poor population in all of the sample countries, there is considerable cross-country variation (Figure 3.4). At one extreme is Pakistan, where only 9% of middle-class respondents have university degrees, and at the other, Indonesia, where one-third of the (self-identified) middle class has a university degree.
Table3.4 Household Distribution (%) by Occupation of Household Head and Per Capita Income Class, People’s Republic of China (2002)
UrbanPer capita income class (2005 $ PPP)
<$1.25 $1.25–$2 $2–$4 $4–$6 $6–$10 $10–$20 >$20Owner(manager)ofprivatefirm 2.7 0.9 0.3 0.4 0.2 0.9 2.9Self-employed 6.8 9.7 6.6 2.4 2.1 3.5 5.7Professional 8.2 6.6 13.8 20.9 27.4 34.1 37.1Directorofgovernmentagent,institutionandenterprise 0.0 0.9 1.9 3.8 5.0 7.3 11.4Departmentdirectorofgovernmentagent,institutionandenterprise 1.4 1.8 6.6 9.3 14.7 16.4 20.0Clerical/officestaff 4.1 10.2 17.7 21.1 23.7 20.1 14.3Skilledworker 21.9 22.1 23.1 23.0 15.5 10.2 5.7Unskilledworker 16.4 14.2 13.7 7.8 4.7 2.2 2.9Salesclerkorserviceworker 17.8 18.6 10.8 8.3 4.8 3.5 0.0Farmer 0.0 0.0 0.0 0.0 0.0 0.0 0.0Other 5.5 8.0 2.7 1.5 1.3 1.1 0.0Unemployed 15.1 7.1 2.8 1.4 0.6 0.7 0.0Total 100.0 100.0 100.0 100.0 100.0 100.0 100.0
RuralPer capita income class (2005 $ PPP)
<$1.25 $1.25–$2 $2–$4 $4–$6 $6–$10 $10–$20 >$20Farmlabor 7.7 6.9 6.2 6.4 2.8 4.0 5.0Ordinaryworker 3.6 3.9 6.0 8.5 9.8 5.0 0.0Skilledworker 1.1 1.9 2.4 2.3 3.5 4.0 0.0Professionalortechnicalworker 0.4 1.4 1.5 2.0 1.3 3.0 0.0Ownerormanagerofenterprise 0.1 0.2 0.2 1.1 1.8 6.0 0.0Villageandproductionteam/brigadecadre 3.5 5.7 7.9 11.6 13.5 20.0 30.0Villageandtowncadre 0.1 0.4 0.4 0.7 1.0 0.0 5.0Officialofpartyorgovernmentofficeorinstitution(countyorhigherlevel) 0.2 0.0 0.4 0.2 1.0 0.0 0.0Ordinarycadreinanenterprise 0.0 0.1 0.3 0.9 1.5 5.0 5.0Temporaryorshort-termcontractworker 12.0 12.3 12.5 9.3 8.0 6.0 0.0Non-farmindividualenterpriseowner(suchasretailer,driver,etc.) 2.9 4.8 6.9 9.8 11.8 16.0 35.0Employeeinnon-farmindividualenterprise 7.0 5.7 4.9 4.2 5.8 1.0 0.0Agriculture/self-employed 48.8 44.0 38.6 34.2 27.0 22.0 15.0Other 11.7 11.7 10.7 7.8 10.0 8.0 5.0Unemployed 0.9 1.0 1.2 1.0 1.5 0.0 0.0Total 100.0 100.0 100.0 100.0 100.0 100.0 100.0
Source: StaffestimatesbasedonCHIPsurvey2002.
Table3.5 Household Distribution (%) by Industry of Household Head and Per Capita Expenditure Class, Indonesia (2009)
Per capita expenditure class (2005
PPP $)
Industry of household head
AgricultureMining and quarrying Manufactured
Electricity, Gas Constructions Trade Transportation Finance Service Total
<$1.25 59.5 1.3 6.0 0.1 5.0 6.5 4.1 0.3 17.2 100.0$1.25–$2 45.2 1.2 7.3 0.2 6.3 12.2 5.4 0.6 21.5 100.0$2–$4 25.6 1.2 9.6 0.6 5.2 17.7 6.9 1.7 31.4 100.0$4–$6 10.7 1.7 10.9 0.8 3.8 19.9 5.7 3.7 42.8 100.0$6–$10 7.3 1.9 9.2 0.9 3.5 19.7 5.3 5.4 46.9 100.0$10–$20 4.6 3.0 8.2 1.1 2.4 21.2 4.5 6.6 48.3 100.0>$20 6.0 5.7 6.5 1.9 2.2 17.0 7.3 10.5 43.0 100.0
Source: Staffestimatesbasedonthe2009SUSENAS.
KI2010-Special-Chapter.indd 25 8/12/10 7:01 PM
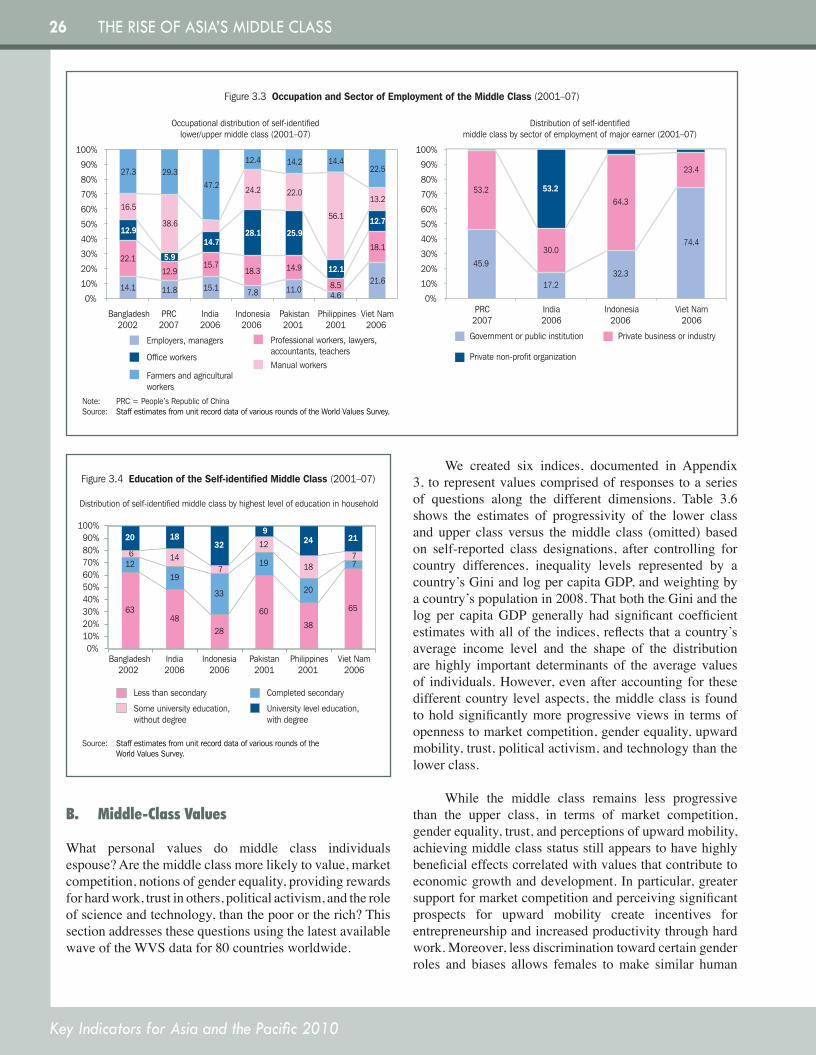
26
Key Indicators for Asia and the Pacific 2010
THE RISE OF ASIA’S MIddLE CLASS
B. Middle-ClassValues
What personal values do middle class individuals espouse? Are the middle class more likely to value, market competition, notions of gender equality, providing rewards for hard work, trust in others, political activism, and the role of science and technology, than the poor or the rich? This section addresses these questions using the latest available wave of the WVS data for 80 countries worldwide.
We created six indices, documented in Appendix 3, to represent values comprised of responses to a series of questions along the different dimensions. Table 3.6 shows the estimates of progressivity of the lower class and upper class versus the middle class (omitted) based on self-reported class designations, after controlling for country differences, inequality levels represented by a country’s Gini and log per capita GDP, and weighting by a country’s population in 2008. That both the Gini and the log per capita GDP generally had significant coefficient estimates with all of the indices, reflects that a country’s average income level and the shape of the distribution are highly important determinants of the average values of individuals. However, even after accounting for these different country level aspects, the middle class is found to hold significantly more progressive views in terms of openness to market competition, gender equality, upward mobility, trust, political activism, and technology than the lower class.
While the middle class remains less progressive than the upper class, in terms of market competition, gender equality, trust, and perceptions of upward mobility, achieving middle class status still appears to have highly beneficial effects correlated with values that contribute to economic growth and development. In particular, greater support for market competition and perceiving significant prospects for upward mobility create incentives for entrepreneurship and increased productivity through hard work. Moreover, less discrimination toward certain gender roles and biases allows females to make similar human
Note: PRC = People’s Republic of ChinaSource: Staff estimates from unit record data of various rounds of the World Values Survey.
Figure 3.3 Occupation and Sector of Employment of the Middle Class (2001–07)
14.1 11.8 15.1 7.8 11.04.6
21.6
22.112.9
15.718.3 14.9
8.5
18.1
12.9
5.9
14.728.1 25.9
12.1
12.7
16.5
38.6
24.2 22.0
56.1
13.2
27.3 29.3
47.2
12.4 14.2 14.422.5
Bangladesh2002
PRC2007
India2006
Indonesia2006
Pakistan2001
Philippines2001
Viet Nam2006
Occupational distribution of self-identifiedlower/upper middle class (2001–07)
Distribution of self-identifiedmiddle class by sector of employment of major earner (2001–07)
45.9
17.2
53.2
30.0
53.2
PRC2007
India2006
Indonesia2006
Viet Nam2006
0%
10%
20%
30%
40%
50%
60%
70%
80%
90%
100%
0%
10%
20%
30%
40%
50%
60%
70%
80%
90%
100%
Employers, managers Professional workers, lawyers,accountants, teachers
Office workersManual workers
Farmers and agriculturalworkers
Government or public institution Private business or industry
Private non-profit organization
74.4
23.4
32.3
64.3
Source: Staff estimates from unit record data of various rounds of the World Values Survey.
Figure 3.4 Education of the Self-identified Middle Class (2001–07)
6348
28
60
38
65
12
19
33
19
20
76 14
7
12
187
20 1832
924 21
Distribution of self-identified middle class by highest level of education in household
0%10%20%30%40%50%60%70%80%90%
100%
Bangladesh2002
India2006
Indonesia2006
Pakistan2001
Philippines2001
Viet Nam2006
Less than secondary Completed secondary
Some university education,without degree
University level education,with degree
KI2010-Special-Chapter.indd 26 8/12/10 7:01 PM
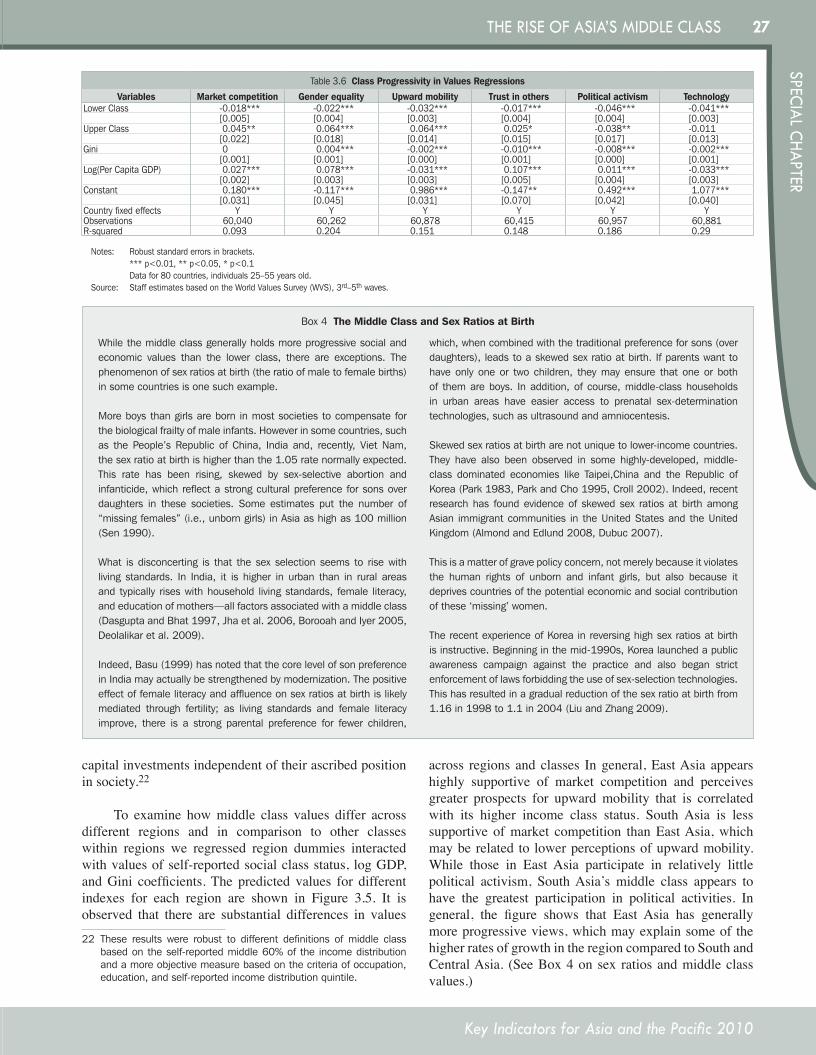
27
Key Indicators for Asia and the Pacific 2010
SPECIAL CHAPTERTHE RISE OF ASIA’S MIddLE CLASS
capital investments independent of their ascribed position in society.22
To examine how middle class values differ across different regions and in comparison to other classes within regions we regressed region dummies interacted with values of self-reported social class status, log GDP, and Gini coefficients. The predicted values for different indexes for each region are shown in Figure 3.5. It is observed that there are substantial differences in values
22 These results were robust to different definitions of middle classbasedontheself-reportedmiddle60%of the incomedistributionandamoreobjectivemeasurebasedonthecriteriaofoccupation,education,andself-reportedincomedistributionquintile.
across regions and classes In general, East Asia appears highly supportive of market competition and perceives greater prospects for upward mobility that is correlated with its higher income class status. South Asia is less supportive of market competition than East Asia, which may be related to lower perceptions of upward mobility. While those in East Asia participate in relatively little political activism, South Asia’s middle class appears to have the greatest participation in political activities. In general, the figure shows that East Asia has generally more progressive views, which may explain some of the higher rates of growth in the region compared to South and Central Asia. (See Box 4 on sex ratios and middle class values.)
Table3.6 Class Progressivity in Values Regressions
Variables Market competition Gender equality Upward mobility Trust in others Political activism TechnologyLowerClass -0.018*** -0.022*** -0.032*** -0.017*** -0.046*** -0.041***
[0.005] [0.004] [0.003] [0.004] [0.004] [0.003]UpperClass 0.045** 0.064*** 0.064*** 0.025* -0.038** -0.011
[0.022] [0.018] [0.014] [0.015] [0.017] [0.013]Gini 0 0.004*** -0.002*** -0.010*** -0.008*** -0.002***
[0.001] [0.001] [0.000] [0.001] [0.000] [0.001]Log(PerCapitaGDP) 0.027*** 0.078*** -0.031*** 0.107*** 0.011*** -0.033***
[0.002] [0.003] [0.003] [0.005] [0.004] [0.003]Constant 0.180*** -0.117*** 0.986*** -0.147** 0.492*** 1.077***
[0.031] [0.045] [0.031] [0.070] [0.042] [0.040]Countryfixedeffects Y Y Y Y Y YObservations 60,040 60,262 60,878 60,415 60,957 60,881R-squared 0.093 0.204 0.151 0.148 0.186 0.29
Notes: Robuststandarderrorsinbrackets. ***p<0.01,**p<0.05,*p<0.1 Datafor80countries,individuals25–55yearsold.Source: StaffestimatesbasedontheWorldValuesSurvey(WVS),3rd–5thwaves.
Box 4 The Middle Class and Sex Ratios at Birth
While the middle class generally holds more progressive social and economic values than the lower class, there are exceptions. The phenomenon of sex ratios at birth (the ratio of male to female births) in some countries is one such example.
More boys than girls are born in most societies to compensate for the biological frailty of male infants. However in some countries, such as the People’s Republic of China, India and, recently, Viet Nam, the sex ratio at birth is higher than the 1.05 rate normally expected. This rate has been rising, skewed by sex-selective abortion and infanticide, which reflect a strong cultural preference for sons over daughters in these societies. Some estimates put the number of “missing females” (i.e., unborn girls) in Asia as high as 100 million (Sen 1990).
What is disconcerting is that the sex selection seems to rise with living standards. In India, it is higher in urban than in rural areas and typically rises with household living standards, female literacy, and education of mothers—all factors associated with a middle class (Dasgupta and Bhat 1997, Jha et al. 2006, Borooah and Iyer 2005, Deolalikar et al. 2009).
Indeed, Basu (1999) has noted that the core level of son preference in India may actually be strengthened by modernization. The positive effect of female literacy and affluence on sex ratios at birth is likely mediated through fertility; as living standards and female literacy improve, there is a strong parental preference for fewer children,
which, when combined with the traditional preference for sons (over daughters), leads to a skewed sex ratio at birth. If parents want to have only one or two children, they may ensure that one or both of them are boys. In addition, of course, middle-class households in urban areas have easier access to prenatal sex-determination technologies, such as ultrasound and amniocentesis.
Skewed sex ratios at birth are not unique to lower-income countries. They have also been observed in some highly-developed, middle-class dominated economies like Taipei,China and the Republic of Korea (Park 1983, Park and Cho 1995, Croll 2002). Indeed, recent research has found evidence of skewed sex ratios at birth among Asian immigrant communities in the United States and the United Kingdom (Almond and Edlund 2008, Dubuc 2007).
This is a matter of grave policy concern, not merely because it violates the human rights of unborn and infant girls, but also because it deprives countries of the potential economic and social contribution of these ‘missing’ women.
The recent experience of Korea in reversing high sex ratios at birth is instructive. Beginning in the mid-1990s, Korea launched a public awareness campaign against the practice and also began strict enforcement of laws forbidding the use of sex-selection technologies. This has resulted in a gradual reduction of the sex ratio at birth from 1.16 in 1998 to 1.1 in 2004 (Liu and Zhang 2009).
KI2010-Special-Chapter.indd 27 8/12/10 7:01 PM
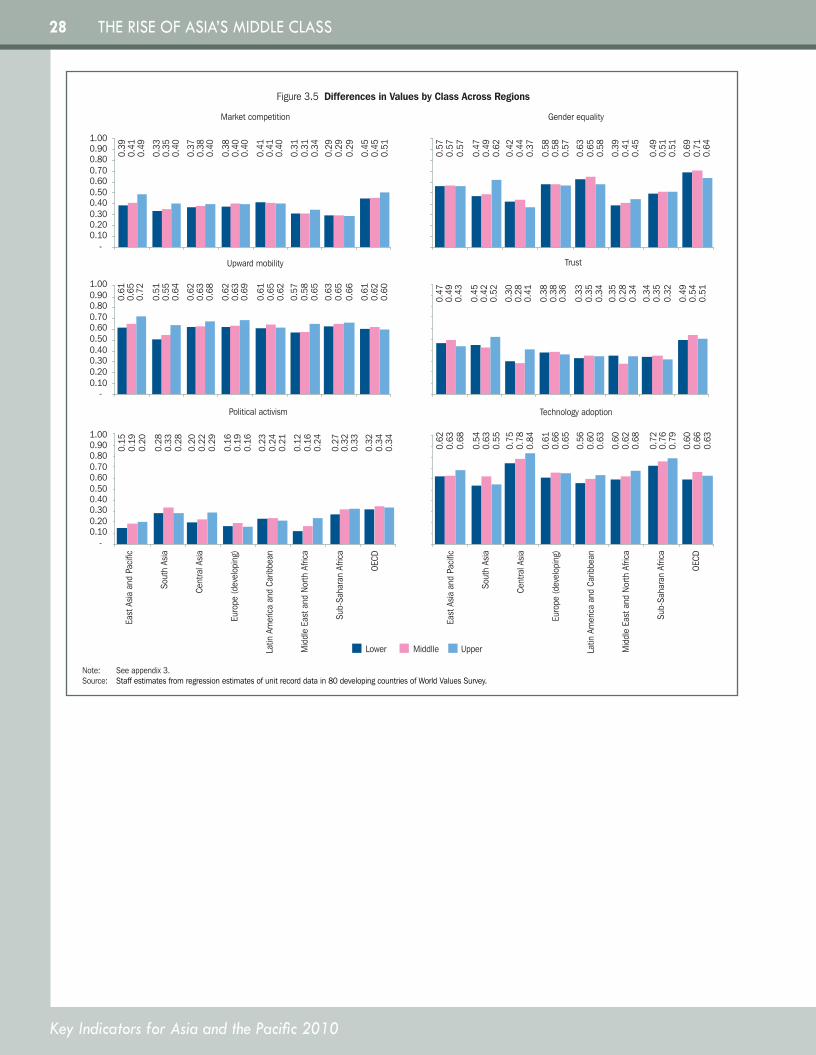
28
Key Indicators for Asia and the Pacific 2010
THE RISE OF ASIA’S MIddLE CLASS
Note: See appendix 3.Source: Staff estimates from regression estimates of unit record data in 80 developing countries of World Values Survey.
Figure 3.5 Differences in Values by Class Across Regions
East
Asi
a an
d Pa
cific
Sout
h As
ia
Cent
ral A
sia
Euro
pe (d
evel
opin
g)
Latin
Am
eric
a an
d Ca
ribbe
an
Mid
dle
East
and
Nor
th A
frica
Sub-
Saha
ran
Afric
a
OECD
East
Asi
a an
d Pa
cific
Sout
h As
ia
Cent
ral A
sia
Euro
pe (d
evel
opin
g)
Latin
Am
eric
a an
d Ca
ribbe
an
Mid
dle
East
and
Nor
th A
frica
Sub-
Saha
ran
Afric
a
OECD
Market competition Gender equality
Upward mobility Trust
Political activism Technology adoption
-0.100.200.300.400.500.600.700.800.901.00
-0.100.200.300.400.500.600.700.800.901.00
-0.100.200.300.400.500.600.700.800.901.00
0.33
0.37
0.35
0.38
0.40
0.40
0.39
0.41
0.49
0.38
0.41
0.31
0.29
0.45
0.40
0.41
0.31
0.29
0.40
0.40
0.34
0.29
0.51
0.57
0.47
0.42
0.58
0.63
0.39
0.49
0.69
0.57
0.49
0.44
0.58
0.65
0.41
0.51
0.71
0.57
0.62
0.37
0.57
0.58
0.45
0.51
0.64
0.47
0.45
0.30
0.38
0.33
0.35
0.34
0.49
0.49
0.42
0.28
0.38
0.35
0.28
0.35
0.43
0.52
0.41
0.36
0.34
0.34
0.32
0.51
0.15
0.28
0.33
0.20
0.16
0.23
0.12
0.27
0.32
0.19
0.22
0.19
0.24
0.16
0.32
0.34
0.20
0.28
0.29
0.16
0.21
0.24
0.33
0.34
0.61
0.51
0.62
0.62
0.61
0.57
0.63
0.61
0.65
0.55
0.63
0.63
0.65
0.58
0.65
0.72
0.64
0.68
0.69
0.62
0.65
0.66
0.60
0.62
0.54
0.75
0.61
0.56
0.60
0.72
0.60
0.63
0.63
0.78
0.66
0.60
0.62
0.76
0.66
0.68
0.55
0.84
0.65
0.63
0.68
0.79
0.63
0.45
0.54
0.62
Lower Middlle Upper
KI2010-Special-Chapter.indd 28 8/12/10 7:01 PM
29
Key Indicators for Asia and the Pacific 2010
SPECIAL CHAPTERTHE RISE OF ASIA’S MIddLE CLASS
4. DeterminantsofMiddleClassEmergence
What forces shape the middle class and allow it to grow? By identifying these determinants it is possible to assess what policies help the middle class grow and contribute more to the development process.
A. EconomicGrowthandIncomeDistribution
Sustained economic growth tends to lift large numbers of people out of poverty and into the middle class. As such, economic growth is critical to both poverty reduction and the rise of the middle class. Birdsall (2007) argues that “inclusive growth”—which she characterizes as growth conducive to increasing the size and economic command of the middle class—is fostered by many of the same policies that reduce poverty, namely, fiscal discipline (e.g., good debt management and a fair tax and redistribution system), lack of trade volatility, sound monetary policy (resulting in low and stable inflation), and improved infrastructure.
In addition to growth, however, reducing income inequality plays a key role in the rise of a middle class. Kharas and Gertz (2010) cite the interesting and contrasting experiences of Brazil and the Republic of Korea. From 1965 to 1980, Brazil’s economy grew an average of 5.6% per year, putting per capita GDP in 1980 at PPP $7,600. Given its high income inequality, the middle class constituted only 29% of the population by 1980. The small size of the middle class and its relatively low levels of consumption hindered the development of a knowledge-based economy, and to this day Brazil remains primarily a commodity exporter. In contrast, the Republic of Korea grew 6.5% per year during 1965–86, reaching per capita GDP in 1986 of PPP $7,700, about the same level as Brazil. However a more egalitarian income distribution meant that the Republic of Korea’s middle class made up 53% of the population. (See Box 5 for a look at the emergence of the Republic of Korea’s middle class.) This allowed the Republic of Korea to develop a service- and knowledge-based economy in a way that Brazil could not. Kharas and Gertz note that the PRC, with its high (and rapidly rising) level of income inequality, today more closely resembles Brazil in 1974 (when Brazil too had a per capita income of about PPP $6,000) than the Republic of Korea in 1983 (with per capita GDP at PPP $6,300).
As for the large and evolving disparity between the spending power of the Indian and the Chinese middle class, Kharas (2010) argues that India’s lower levels of
income inequality and a larger share of household income in GDP give it a big advantage. There is other evidence that supports this line of thinking. It is estimated that nearly three-quarters of the PRC’s capital goes to some 120,000 state-controlled entities and their many subsidiaries, with the remaining quarter shared by the 40 million or so privately owned businesses (Business Week 2010). The result is that a large portion of business profits in the PRC end up in state coffers (and reinvestment), not in the pockets of Chinese entrepreneurs. In contrast, India’s bottom-up private sector model leaves a larger share of business profits in private hands which can be spent on consumer goods.
Certainly, there is little question that aggregate demand is heavily tilted in the PRC in favor of investment, government expenditure, and net exports. This is seen in household final consumption, which accounts for only 37% of total output, significantly lower than in other Asian countries (66% in Viet Nam, 63% in Indonesia, 54% in India, and 51% in Thailand) (Kharas and Gertz 2010).
The contrast between the PRC and India is even starker in the rural areas. The PRC’s rural sector accounts for only a third of GDP and generates just 15% of growth; in India it accounts for 50% of GDP, up from 41% in 1982, and for about two-thirds of overall growth (Business Week 2010). As a result, Indian consumer product companies have recognized the need to reach rural consumers to succeed, fuelling intense innovation in the development of low-cost products and services (frugal innovation). Indeed, Indian companies are now world leaders in designing and marketing low-priced products and services geared to low-income consumers.
Analysis of household survey data by Khor and Pencavel (2006) shows that while there was considerable income mobility in the PRC in the early 1990s—more than, say, the United States—the situation had changed by the early 2000s. By that time, income inequality had increased and income mobility begun to slow. Interestingly, Khor and Pencavel find important differences across rural and urban areas. As the urban-rural gap in incomes widened, inequality among rural households decreased and income mobility increased, the opposite of urban areas, where inequality increased and income mobility decreased.
How can Asian developing economies—particularly the PRC—accelerate their transformation from export-oriented and investment-led to personal consumption-led growth? One way, of course, is to reduce high rates of household savings. This process could be aided by the
KI2010-Special-Chapter.indd 29 8/12/10 7:01 PM
30
Key Indicators for Asia and the Pacific 2010
THE RISE OF ASIA’S MIddLE CLASS
Box 5 Fostering a Middle Class—Korea’s Economic Transition
From its position in the 1960’s as a developing, low-income country, the Republic of Korea has in just 30 years transformed itself into a major global economic player with a strong, stable, and sizable middle class. It did so through a visionary and effective government that introduced policies that fostered such change.
The process of middle class development started in 1962 with the Five Year Economic Development Plans, which led to rapid industrialization and the creation of stable sources of employment. By 1966 middle class formation became a specific topic of concern when then-President Park Chung-hee gave a speech reflecting social concerns such as relative income distribution and workers’ real wages.
The emergence of the middle class was further encouraged by (i) policies that promoted wealth accumulation among the middle and lower middle classes and (ii) policies for accumulating and maintaining human capital—namely, education and health—for middle income groups. Among these, the “Workers’ Asset Building Savings” plan and the health insurance system effectively raised middle class living standards and reduced vulnerability to poverty.
Workers’ Asset Building SavingsIn 1976, the government introduced Workers’ Asset Building Savings under the Saving Promotion and Workers’ Asset Building Supporting Act. Savings provides a safety net in the face of risks and negative income shocks, but they are also a key component of the formation of a middle class. Since the poor generally do not have sufficient means to save, these savings policies are essentially directed at lower middle class groups.
When the new plan was enacted, employees whose monthly income was below 250,000 won (W)—about $1,036 2005 PPP—were entitled to an asset building account. Monthly savings put into these accounts were between W5,000 and W120,000, but were not allowed to exceed 30% of monthly income.
The accounts were exempted from taxes with government and employer added subsidies in the form of matching funds, raising the effective interest rate to roughly 60% to 180% higher than the normal interest rate, depending upon maturity and a worker’s income level. Depositors could also borrow housing funds for up to W20 million. In 1987, the upper bound of workers’ monthly income was raised to W600,000—(about $1,446 in 2005 PPP) under the Workers’ Housing Stability and Asset Building Supporting Act.
Meanwhile, similar types of tax-exempted, long-term savings for middle and low-income workers were created in the early 1990s: workers’ preferential savings deposits and long-term savings, and households’ long-term savings. These accounts gave tax incentives, but there were no direct subsidies from the government or employers and subsequently disappeared in the early 2000s, as the government tried to minimize preferential tax benefits on financial commodities.
The National Health Insurance SystemThe National Health Insurance was an important foundation for building up human capital for the middle class, as it provided
medical services at affordable prices. The Medical Insurance Act was created in 1963, with actual implementation first occurring in 1977 to companies with more than 500 employees. The program subsequently extended its coverage to public officials, and employees in educational institutions in 1979, rural residents in 1988, and urban residents in 1989; by 1990 the majority of the population was covered, with the exception of the extremely low-income population, which receive government subsidized medical care. Between 1988 and 2003 the system absorbed all other public health insurers.
Coverage through the National Health Insurance is compulsory for all. The employed make a monthly contribution through an automatic salary deduction in proportion to income of which 50% is paid by the employer, with the contribution rate determined each year (5.33% in 2010). No contribution is required for the portion of monthly income exceeding W6.579 million. Dependents of an enrollee with no income are automatically covered without any additional contributions. On the other hand, self-employed or regional insured enrollees have to contribute according to their identified income. The system has effectively redistributed income, providing the foundation for productive human capital.
Policies for middle class recovery after 1997/98Despite its successes, Korea remains focused on middle class development. The 1997/98 Asian financial crisis, for example, spurred the government to implement policies explicitly aimed at the formation and recovery of the middle class. In 1999, the government presented “measures for stabilization of [the] middle class and ordinary people’s living.” It planned to spend W1.4 trillion to reduce the tax burden of wage earning workers, and W1.1 trillion for government projects for middle class and ordinary people. 1
It effectively reduced income tax by 41.7% for workers whose annual income was W15 million, while income tax was reduced by 17.9% for annual income of W30 million. Small and medium enterprises and venture startups got more tax exemptions on initial operations.
Among measures aimed at boosting the middle class are: (i) support for small startup firms through credit guarantees, management and marketing know-how, and network infrastructure for ventures, (ii) enlarging loans to college students, subsidizing education investment, health insurance, and housing funds for low-income group, and (iii) extending low interest loans to rural populations.
In March 2009, the government made “Human New Deal for Middle Class” one of the two main agendas under President Lee Myung Bak. 2 It aimed to (i) prevent slippage into the lower class, (ii) promote entry into the middle class, and (iii) foster the future middle class.
Policies to prevent slippage included helping to maintain and create jobs, diversify household income sources, and lower household expenditures on housing, health and especially education.
Policies to promote entry included enhancing vocational education and job training, strengthening work incentives for low-income groups, fostering startup firms such as “one-person creative firm(s),” and improving the transmission of social welfare expenditures.
1 “Ordinary people” is not scientifically defined but usually refers to low- and middle-income groups. The middle-high income group may be excluded in this category. 2 The other main agenda is “Green New Deal”, focused on environmentally friendly technologies.Source: Ha (2010).
KI2010-Special-Chapter.indd 30 8/12/10 7:01 PM
31
Key Indicators for Asia and the Pacific 2010
SPECIAL CHAPTERTHE RISE OF ASIA’S MIddLE CLASS
development of broader social safety nets, including social security and universal health care, helping to stimulate personal consumption in Asia.23
The PRC could also accelerate the development of its middle class by raising the share of household income in GDP directly through macroeconomic policy changes. Kharas and Gertz (2010) suggest two: first, use the large profits of state-owned enterprises to reduce labor taxes and fees on employment, and, second, accelerate banking reforms to ease access to credit for small and medium enterprises. Both measures would increase the share of labor, and, thereby, the share of household income in GDP.
Additionally, the PRC could increase aggregate consumption by changing its exchange rate policy. The yuan is alleged to be undervalued relative to the US dollar, making Chinese goods artificially cheap to foreigners and foreign goods artificially expensive to the Chinese. The undervalued currency is equivalent to a subsidy on exports and a protective tariff on imports. If the yuan were to rise in value relative to the US dollar, Chinese consumption of goods and services produced elsewhere in the world would rise.24
B. JobsandEducation
Ultimately, two factors drive the creation and sustenance of a middle class: (i) stable, secure, well-paid jobs with good benefits, and (ii) higher education. This is clearly borne out by our examination of middle class profiles, which showed that a large portion of the middle class (in the Philippines, India, and the PRC) have jobs which provide them with stable incomes in comparison to the poor, who are primarily self-employed. The US case provides more substantial support for these claims, where the automobile industry is credited with contributing significantly to the creation of an urban middle class in the post-war economy. The industry grew rapidly in the early years of the last century, auto sales rising from 4,100 in 1900 to 895,900 in 1915, to 3.7 million in 1925, producing huge growth in automobile employment. By 1925, over 10% of US workers were working in occupations related to the production, sales, service, or fueling of automobiles (Kyvig 2004).
23 WeiandZhang(2009)proposethathighsavingsduetoaprecautionarymotivemaynotbetheonlyreason.Inparticular,Chinesehouseholdsmaysaveduetothedesireforparentsofsonstopostponeconsumptioninordertoincreasetheirson’scompetitivenessinthemarriagemarket.Theypositthatthecompetitivefactormayaccountforuptohalfoftheincreaseinthehouseholdsavingsrateduring1990–2007,andthiswillnotbeeasilyreversedaslongastheimbalanceintheratioofwomentomeninthePRCpersists.
24 “TheRenminbiRunaround,”byPaulKrugman,NewYorkTimes,25June2010,pageA31.
Despite this, industry wages were too low—and non-salary benefits almost nonexistent—to put auto workers into the middle class. It was only toward the late 1930s, when unionization became the norm, that wages began improving significantly. Workers and the auto companies struck an implicit social contract whereby the companies would get labor, loyalty, commitment and productivity in exchange for good wages and job and retirement security. This new balance of power made US auto workers the first well-paid working class, with job security and health and retirement benefits, in the world (Freeman and Medoff 1984). As the US example suggests, sometimes it takes more than the sustained growth of a new, mass-production-based industry to create middle-class jobs; other interventions, in this case unionization, may also be needed to ensure that the jobs created are well-paid, stable and secure, providing workers a middle-class lifestyle.
Banerjee and Duflo (2008) make a broadly similar point in their paper on the middle class in developing countries. According to them, “… nothing seems more middle class than the fact of having a steady well-paying job… The reason why this matters – indeed why it might matter a lot – is that it leads us to the idea of a good job. A good job is a steady, well-paid job; a job that allows one the mental space that one needs to do all those things that the middle class does well. This is an idea that economists have often resisted, on the grounds that good jobs may be expensive jobs, and expensive jobs might mean fewer jobs. But if good jobs mean that children grow up in an environment where they are able to make the most of their talents, one might start to think that it may all be worth it.”
Widespread education, especially post-secondary, is the other important element in creating a large middle class. Again, the US provides a good historical example. Its G.I. Bill of 1944—which provided college or vocational education benefits (in addition to many others, including one year of unemployment compensation and low-interest home loans) to returning World War II veterans—sparked a vast expansion and democratization of US higher education (McCarthy 1975).
Before World War II, high school graduation was rare in the US; millions of armed forces personnel had not even graduated from grammar school, and many young Americans did not go beyond the 10th grade. The impact of the G.I. Bill was profound. Two years before the war, there were 160,000 students in college; by 1950 the graduating class was nearly 500,000 (Greenberg 1997). In 1942, veterans accounted for 49% of college enrollments. Before the war, there were only 25 research universities and only 10% of young adults went on to attend college. With the G.I. bill the number of research universities grew to 125
KI2010-Special-Chapter.indd 31 8/12/10 7:01 PM
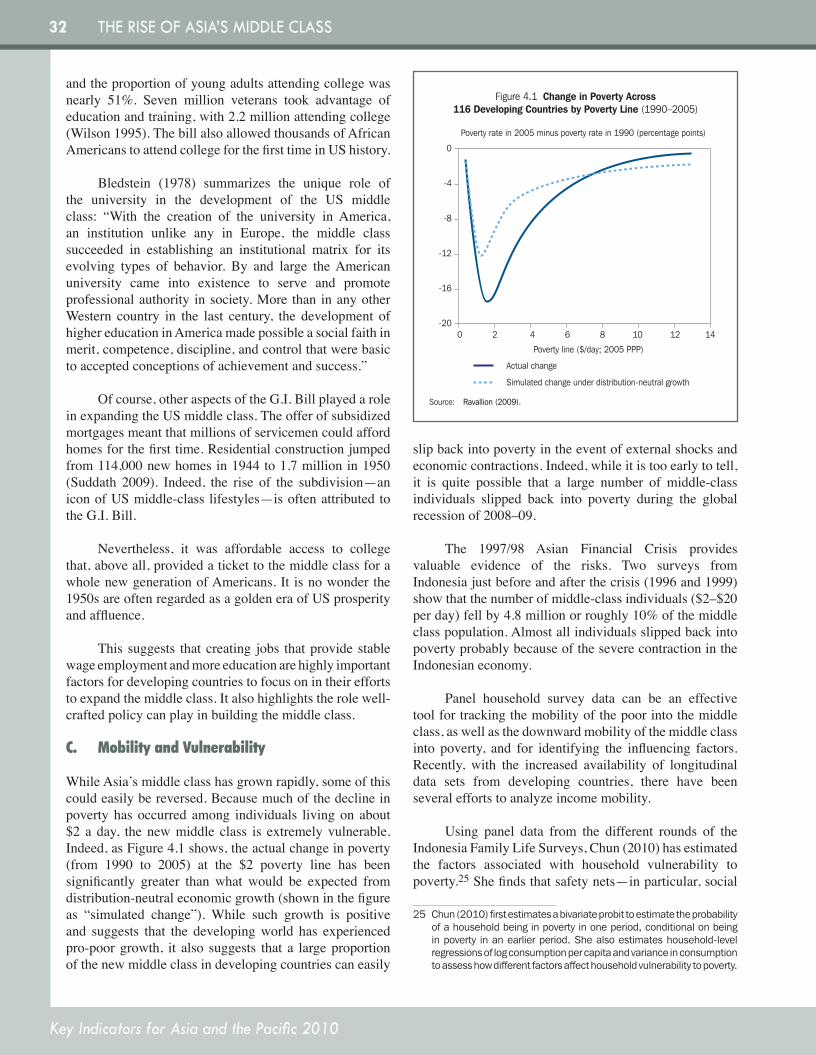
32
Key Indicators for Asia and the Pacific 2010
THE RISE OF ASIA’S MIddLE CLASS
and the proportion of young adults attending college was nearly 51%. Seven million veterans took advantage of education and training, with 2.2 million attending college (Wilson 1995). The bill also allowed thousands of African Americans to attend college for the first time in US history.
Bledstein (1978) summarizes the unique role of the university in the development of the US middle class: “With the creation of the university in America, an institution unlike any in Europe, the middle class succeeded in establishing an institutional matrix for its evolving types of behavior. By and large the American university came into existence to serve and promote professional authority in society. More than in any other Western country in the last century, the development of higher education in America made possible a social faith in merit, competence, discipline, and control that were basic to accepted conceptions of achievement and success.”
Of course, other aspects of the G.I. Bill played a role in expanding the US middle class. The offer of subsidized mortgages meant that millions of servicemen could afford homes for the first time. Residential construction jumped from 114,000 new homes in 1944 to 1.7 million in 1950 (Suddath 2009). Indeed, the rise of the subdivision—an icon of US middle-class lifestyles—is often attributed to the G.I. Bill.
Nevertheless, it was affordable access to college that, above all, provided a ticket to the middle class for a whole new generation of Americans. It is no wonder the 1950s are often regarded as a golden era of US prosperity and affluence.
This suggests that creating jobs that provide stable wage employment and more education are highly important factors for developing countries to focus on in their efforts to expand the middle class. It also highlights the role well-crafted policy can play in building the middle class.
C. MobilityandVulnerability
While Asia’s middle class has grown rapidly, some of this could easily be reversed. Because much of the decline in poverty has occurred among individuals living on about $2 a day, the new middle class is extremely vulnerable. Indeed, as Figure 4.1 shows, the actual change in poverty (from 1990 to 2005) at the $2 poverty line has been significantly greater than what would be expected from distribution-neutral economic growth (shown in the figure as “simulated change”). While such growth is positive and suggests that the developing world has experienced pro-poor growth, it also suggests that a large proportion of the new middle class in developing countries can easily
slip back into poverty in the event of external shocks and economic contractions. Indeed, while it is too early to tell, it is quite possible that a large number of middle-class individuals slipped back into poverty during the global recession of 2008–09.
The 1997/98 Asian Financial Crisis provides valuable evidence of the risks. Two surveys from Indonesia just before and after the crisis (1996 and 1999) show that the number of middle-class individuals ($2–$20 per day) fell by 4.8 million or roughly 10% of the middle class population. Almost all individuals slipped back into poverty probably because of the severe contraction in the Indonesian economy.
Panel household survey data can be an effective tool for tracking the mobility of the poor into the middle class, as well as the downward mobility of the middle class into poverty, and for identifying the influencing factors. Recently, with the increased availability of longitudinal data sets from developing countries, there have been several efforts to analyze income mobility.
Using panel data from the different rounds of the Indonesia Family Life Surveys, Chun (2010) has estimated the factors associated with household vulnerability to poverty.25 She finds that safety nets—in particular, social
25 Chun(2010)firstestimatesabivariateprobittoestimatetheprobabilityofahouseholdbeinginpovertyinoneperiod,conditionalonbeinginpovertyinanearlierperiod.Shealsoestimateshousehold-levelregressionsoflogconsumptionpercapitaandvarianceinconsumptiontoassesshowdifferentfactorsaffecthouseholdvulnerabilitytopoverty.
Source: Ravallion (2009).
0
-4
-8
-12
-16
-200 2 4 6 8 10 12 14
Poverty line ($/day; 2005 PPP)
Actual change
Simulated change under distribution-neutral growth
Figure 4.1 Change in Poverty Across 116 Developing Countries by Poverty Line (1990–2005)
Poverty rate in 2005 minus poverty rate in 1990 (percentage points)
KI2010-Special-Chapter.indd 32 8/12/10 7:01 PM
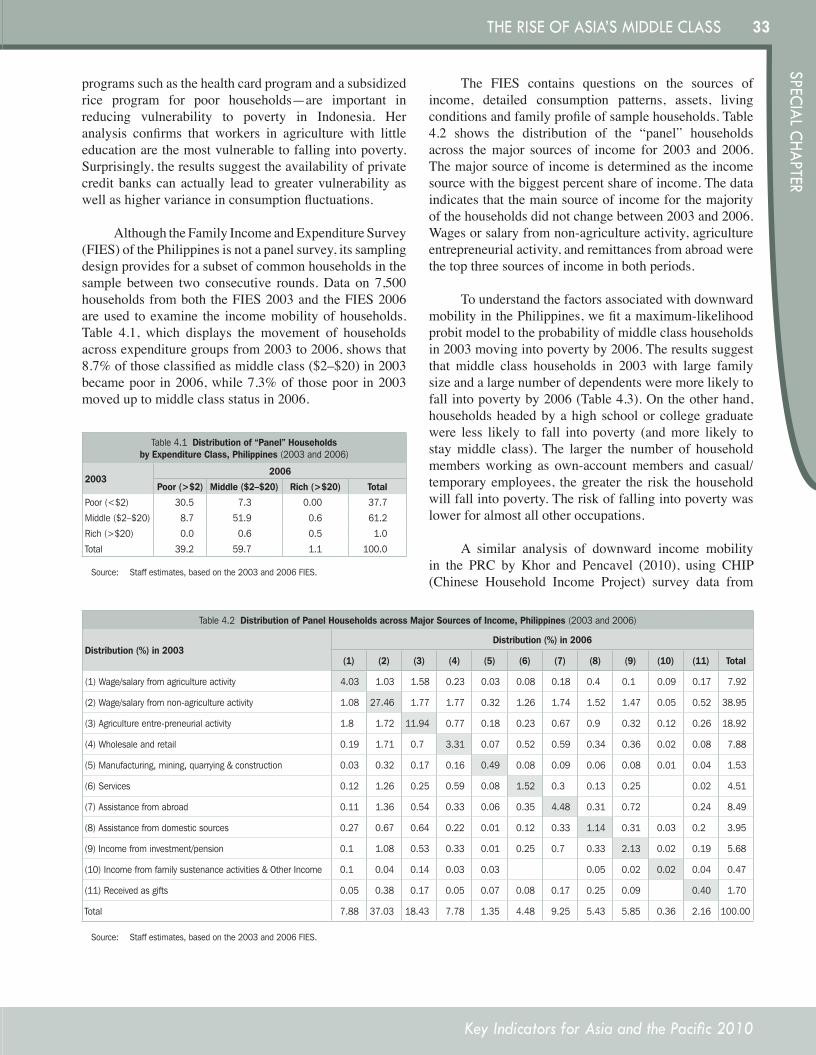
33
Key Indicators for Asia and the Pacific 2010
SPECIAL CHAPTERTHE RISE OF ASIA’S MIddLE CLASS
programs such as the health card program and a subsidized rice program for poor households—are important in reducing vulnerability to poverty in Indonesia. Her analysis confirms that workers in agriculture with little education are the most vulnerable to falling into poverty. Surprisingly, the results suggest the availability of private credit banks can actually lead to greater vulnerability as well as higher variance in consumption fluctuations.
Although the Family Income and Expenditure Survey (FIES) of the Philippines is not a panel survey, its sampling design provides for a subset of common households in the sample between two consecutive rounds. Data on 7,500 households from both the FIES 2003 and the FIES 2006 are used to examine the income mobility of households. Table 4.1, which displays the movement of households across expenditure groups from 2003 to 2006, shows that 8.7% of those classified as middle class ($2–$20) in 2003 became poor in 2006, while 7.3% of those poor in 2003 moved up to middle class status in 2006.
The FIES contains questions on the sources of income, detailed consumption patterns, assets, living conditions and family profile of sample households. Table 4.2 shows the distribution of the “panel” households across the major sources of income for 2003 and 2006. The major source of income is determined as the income source with the biggest percent share of income. The data indicates that the main source of income for the majority of the households did not change between 2003 and 2006. Wages or salary from non-agriculture activity, agriculture entrepreneurial activity, and remittances from abroad were the top three sources of income in both periods.
To understand the factors associated with downward mobility in the Philippines, we fit a maximum-likelihood probit model to the probability of middle class households in 2003 moving into poverty by 2006. The results suggest that middle class households in 2003 with large family size and a large number of dependents were more likely to fall into poverty by 2006 (Table 4.3). On the other hand, households headed by a high school or college graduate were less likely to fall into poverty (and more likely to stay middle class). The larger the number of household members working as own-account members and casual/temporary employees, the greater the risk the household will fall into poverty. The risk of falling into poverty was lower for almost all other occupations.
A similar analysis of downward income mobility in the PRC by Khor and Pencavel (2010), using CHIP (Chinese Household Income Project) survey data from
Table4.1Distribution of “Panel” Households by Expenditure Class, Philippines (2003and2006)
20032006
Poor (>$2) Middle ($2–$20) Rich (>$20) Total
Poor(<$2) 30.5 7.3 0.00 37.7
Middle($2–$20) 8.7 51.9 0.6 61.2
Rich(>$20) 0.0 0.6 0.5 1.0
Total 39.2 59.7 1.1 100.0
Source: Staffestimates,basedonthe2003and2006FIES.
Table4.2 Distribution of Panel Households across Major Sources of Income, Philippines (2003and2006)
Distribution (%) in 2003Distribution (%) in 2006
(1) (2) (3) (4) (5) (6) (7) (8) (9) (10) (11) Total
(1)Wage/salaryfromagricultureactivity 4.03 1.03 1.58 0.23 0.03 0.08 0.18 0.4 0.1 0.09 0.17 7.92
(2)Wage/salaryfromnon-agricultureactivity 1.08 27.46 1.77 1.77 0.32 1.26 1.74 1.52 1.47 0.05 0.52 38.95
(3)Agricultureentre-preneurialactivity 1.8 1.72 11.94 0.77 0.18 0.23 0.67 0.9 0.32 0.12 0.26 18.92
(4)Wholesaleandretail 0.19 1.71 0.7 3.31 0.07 0.52 0.59 0.34 0.36 0.02 0.08 7.88
(5)Manufacturing,mining,quarrying&construction 0.03 0.32 0.17 0.16 0.49 0.08 0.09 0.06 0.08 0.01 0.04 1.53
(6)Services 0.12 1.26 0.25 0.59 0.08 1.52 0.3 0.13 0.25 0.02 4.51
(7)Assistancefromabroad 0.11 1.36 0.54 0.33 0.06 0.35 4.48 0.31 0.72 0.24 8.49
(8)Assistancefromdomesticsources 0.27 0.67 0.64 0.22 0.01 0.12 0.33 1.14 0.31 0.03 0.2 3.95
(9)Incomefrominvestment/pension 0.1 1.08 0.53 0.33 0.01 0.25 0.7 0.33 2.13 0.02 0.19 5.68
(10)Incomefromfamilysustenanceactivities&OtherIncome 0.1 0.04 0.14 0.03 0.03 0.05 0.02 0.02 0.04 0.47
(11)Receivedasgifts 0.05 0.38 0.17 0.05 0.07 0.08 0.17 0.25 0.09 0.40 1.70
Total 7.88 37.03 18.43 7.78 1.35 4.48 9.25 5.43 5.85 0.36 2.16 100.00
Source: Staffestimates,basedonthe2003and2006FIES.
KI2010-Special-Chapter.indd 33 8/12/10 7:01 PM
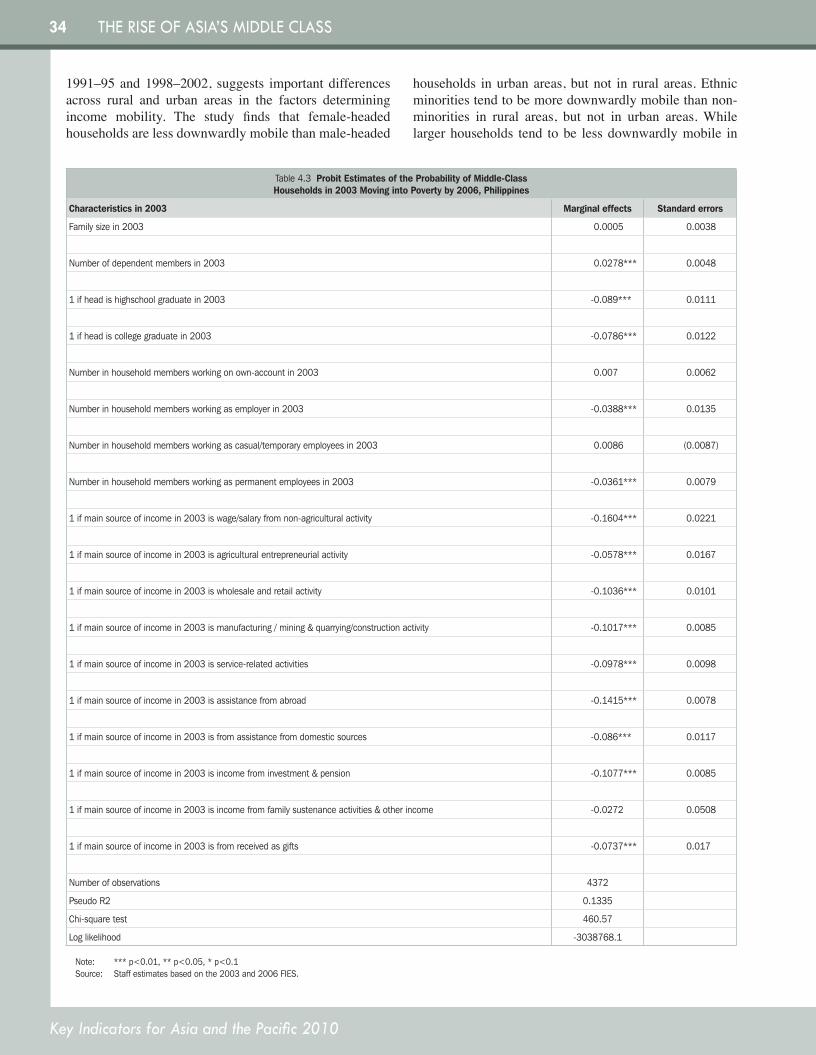
34
Key Indicators for Asia and the Pacific 2010
THE RISE OF ASIA’S MIddLE CLASS
1991–95 and 1998–2002, suggests important differences across rural and urban areas in the factors determining income mobility. The study finds that female-headed households are less downwardly mobile than male-headed
households in urban areas, but not in rural areas. Ethnic minorities tend to be more downwardly mobile than non-minorities in rural areas, but not in urban areas. While larger households tend to be less downwardly mobile in
Table4.3 Probit Estimates of the Probability of Middle-Class Households in 2003 Moving into Poverty by 2006, Philippines
Characteristics in 2003 Marginal effects Standard errors
Familysizein2003 0.0005 0.0038
Numberofdependentmembersin2003 0.0278*** 0.0048
1ifheadishighschoolgraduatein2003 -0.089*** 0.0111
1ifheadiscollegegraduatein2003 -0.0786*** 0.0122
Numberinhouseholdmembersworkingonown-accountin2003 0.007 0.0062
Numberinhouseholdmembersworkingasemployerin2003 -0.0388*** 0.0135
Numberinhouseholdmembersworkingascasual/temporaryemployeesin2003 0.0086 (0.0087)
Numberinhouseholdmembersworkingaspermanentemployeesin2003 -0.0361*** 0.0079
1ifmainsourceofincomein2003iswage/salaryfromnon-agriculturalactivity -0.1604*** 0.0221
1ifmainsourceofincomein2003isagriculturalentrepreneurialactivity -0.0578*** 0.0167
1ifmainsourceofincomein2003iswholesaleandretailactivity -0.1036*** 0.0101
1ifmainsourceofincomein2003ismanufacturing/mining&quarrying/constructionactivity -0.1017*** 0.0085
1ifmainsourceofincomein2003isservice-relatedactivities -0.0978*** 0.0098
1ifmainsourceofincomein2003isassistancefromabroad -0.1415*** 0.0078
1ifmainsourceofincomein2003isfromassistancefromdomesticsources -0.086*** 0.0117
1ifmainsourceofincomein2003isincomefrominvestment&pension -0.1077*** 0.0085
1ifmainsourceofincomein2003isincomefromfamilysustenanceactivities&otherincome -0.0272 0.0508
1ifmainsourceofincomein2003isfromreceivedasgifts -0.0737*** 0.017
Numberofobservations 4372
PseudoR2 0.1335
Chi-squaretest 460.57
Loglikelihood -3038768.1
Note: ***p<0.01,**p<0.05,*p<0.1Source: Staffestimatesbasedonthe2003and2006FIES.
KI2010-Special-Chapter.indd 34 8/12/10 7:01 PM
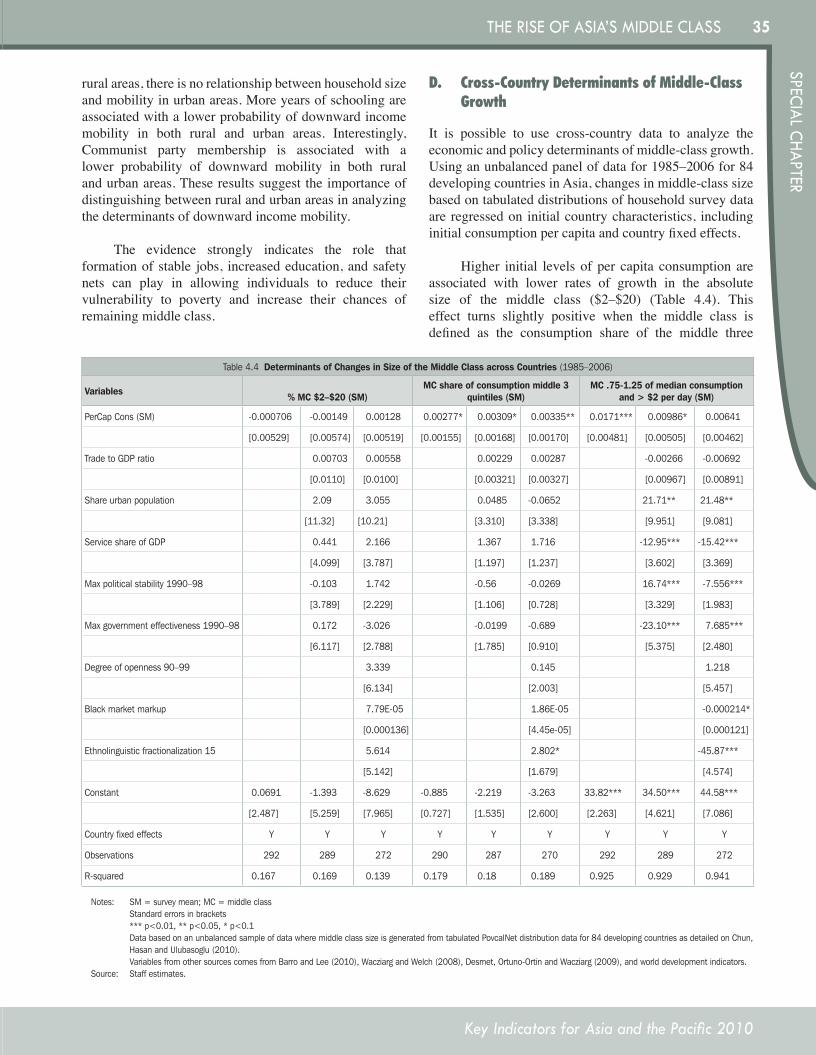
35
Key Indicators for Asia and the Pacific 2010
SPECIAL CHAPTERTHE RISE OF ASIA’S MIddLE CLASS
rural areas, there is no relationship between household size and mobility in urban areas. More years of schooling are associated with a lower probability of downward income mobility in both rural and urban areas. Interestingly, Communist party membership is associated with a lower probability of downward mobility in both rural and urban areas. These results suggest the importance of distinguishing between rural and urban areas in analyzing the determinants of downward income mobility.
The evidence strongly indicates the role that formation of stable jobs, increased education, and safety nets can play in allowing individuals to reduce their vulnerability to poverty and increase their chances of remaining middle class.
Table4.4 Determinants of Changes in Size of the Middle Class across Countries (1985–2006)
Variables % MC $2–$20 (SM)MC share of consumption middle 3
quintiles (SM)MC .75-1.25 of median consumption
and > $2 per day (SM)
PerCapCons(SM) -0.000706 -0.00149 0.00128 0.00277* 0.00309* 0.00335** 0.0171*** 0.00986* 0.00641
[0.00529] [0.00574] [0.00519] [0.00155] [0.00168] [0.00170] [0.00481] [0.00505] [0.00462]
TradetoGDPratio 0.00703 0.00558 0.00229 0.00287 -0.00266 -0.00692
[0.0110] [0.0100] [0.00321] [0.00327] [0.00967] [0.00891]
Shareurbanpopulation 2.09 3.055 0.0485 -0.0652 21.71** 21.48**
[11.32] [10.21] [3.310] [3.338] [9.951] [9.081]
ServiceshareofGDP 0.441 2.166 1.367 1.716 -12.95*** -15.42***
[4.099] [3.787] [1.197] [1.237] [3.602] [3.369]
Maxpoliticalstability1990–98 -0.103 1.742 -0.56 -0.0269 16.74*** -7.556***
[3.789] [2.229] [1.106] [0.728] [3.329] [1.983]
Maxgovernmenteffectiveness1990–98 0.172 -3.026 -0.0199 -0.689 -23.10*** 7.685***
[6.117] [2.788] [1.785] [0.910] [5.375] [2.480]
Degreeofopenness90–99 3.339 0.145 1.218
[6.134] [2.003] [5.457]
Blackmarketmarkup 7.79E-05 1.86E-05 -0.000214*
[0.000136] [4.45e-05] [0.000121]
Ethnolinguisticfractionalization15 5.614 2.802* -45.87***
[5.142] [1.679] [4.574]
Constant 0.0691 -1.393 -8.629 -0.885 -2.219 -3.263 33.82*** 34.50*** 44.58***
[2.487] [5.259] [7.965] [0.727] [1.535] [2.600] [2.263] [4.621] [7.086]
Countryfixedeffects Y Y Y Y Y Y Y Y Y
Observations 292 289 272 290 287 270 292 289 272
R-squared 0.167 0.169 0.139 0.179 0.18 0.189 0.925 0.929 0.941
Notes: SM=surveymean;MC=middleclass Standarderrorsinbrackets ***p<0.01,**p<0.05,*p<0.1 DatabasedonanunbalancedsampleofdatawheremiddleclasssizeisgeneratedfromtabulatedPovcalNetdistributiondatafor84developingcountriesasdetailedonChun,
HasanandUlubasoglu(2010). VariablesfromothersourcescomesfromBarroandLee(2010),WacziargandWelch(2008),Desmet,Ortuno-OrtinandWacziarg(2009),andworlddevelopmentindicators.Source: Staffestimates.
D. Cross-CountryDeterminantsofMiddle-ClassGrowth
It is possible to use cross-country data to analyze the economic and policy determinants of middle-class growth. Using an unbalanced panel of data for 1985–2006 for 84 developing countries in Asia, changes in middle-class size based on tabulated distributions of household survey data are regressed on initial country characteristics, including initial consumption per capita and country fixed effects.
Higher initial levels of per capita consumption are associated with lower rates of growth in the absolute size of the middle class ($2–$20) (Table 4.4). This effect turns slightly positive when the middle class is defined as the consumption share of the middle three
KI2010-Special-Chapter.indd 35 8/12/10 7:01 PM
36
Key Indicators for Asia and the Pacific 2010
THE RISE OF ASIA’S MIddLE CLASS
consumption quintiles and is only slightly positive and significantly different from zero when the 0.75–1.25 of median consumption definition is used after putting in a series of control. Few other variables appear significant in explaining changes in the absolute size of the middle class or changes in the consumption share of the middle three quintiles. If the middle class is defined as those individuals consuming 0.75–1.25 of median consumption, the urban share of the population, service share of GDP, political stability, government effectiveness, and ethnic linguistic fractionalization matter as significant determinants of middle-class growth. Overall, though, the empirical results are weak enough to suggest that the determinants
of middle-class growth may be too country-and context-specific to analyze with aggregated, cross-country data.
Still, factors commonly found to be significantly related to higher growth in the cross-country growth literature are also found to be good for the growth of the middle class when defined as those falling between 0.75 and 1.25 of median income. This suggests that many of the same policies that are good for growth, such as fiscal discipline, sound monetary policies, and reduced trade volatility, may also foster middle class growth.
KI2010-Special-Chapter.indd 36 8/12/10 7:01 PM
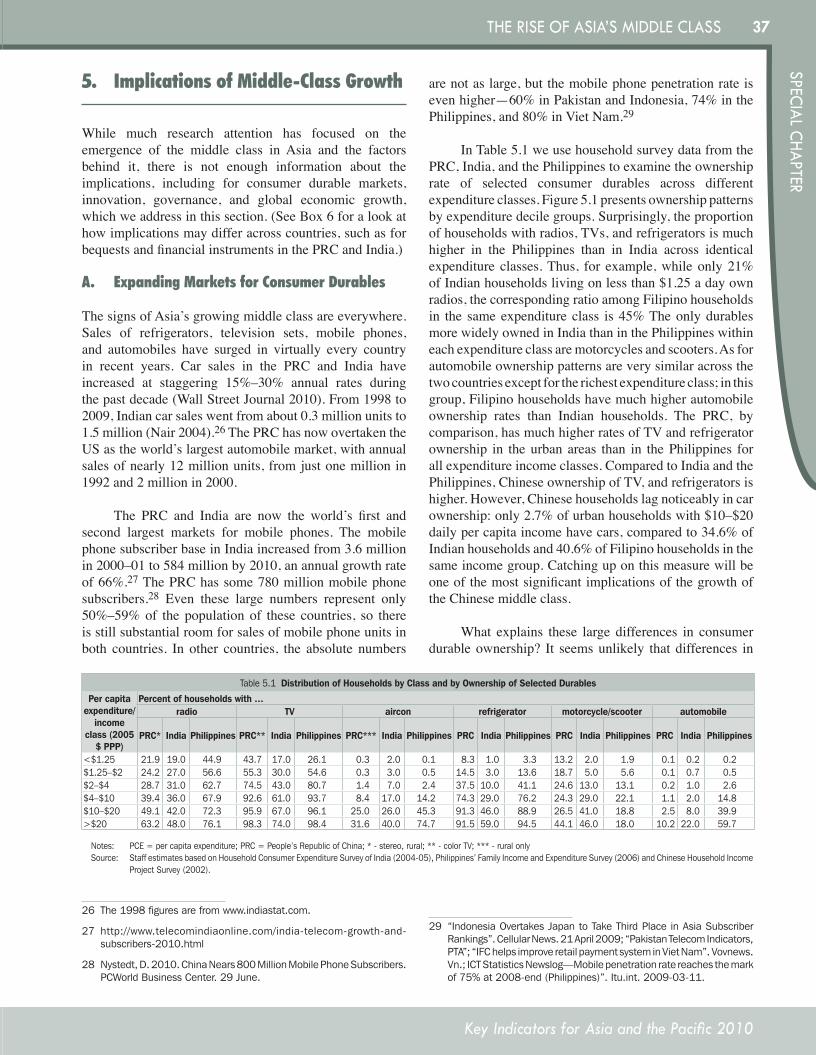
37
Key Indicators for Asia and the Pacific 2010
SPECIAL CHAPTERTHE RISE OF ASIA’S MIddLE CLASS
5. ImplicationsofMiddle-ClassGrowth
While much research attention has focused on the emergence of the middle class in Asia and the factors behind it, there is not enough information about the implications, including for consumer durable markets, innovation, governance, and global economic growth, which we address in this section. (See Box 6 for a look at how implications may differ across countries, such as for bequests and financial instruments in the PRC and India.)
A. ExpandingMarketsforConsumerDurables
The signs of Asia’s growing middle class are everywhere. Sales of refrigerators, television sets, mobile phones, and automobiles have surged in virtually every country in recent years. Car sales in the PRC and India have increased at staggering 15%–30% annual rates during the past decade (Wall Street Journal 2010). From 1998 to 2009, Indian car sales went from about 0.3 million units to 1.5 million (Nair 2004).26 The PRC has now overtaken the US as the world’s largest automobile market, with annual sales of nearly 12 million units, from just one million in 1992 and 2 million in 2000.
The PRC and India are now the world’s first and second largest markets for mobile phones. The mobile phone subscriber base in India increased from 3.6 million in 2000–01 to 584 million by 2010, an annual growth rate of 66%.27 The PRC has some 780 million mobile phone subscribers.28 Even these large numbers represent only 50%–59% of the population of these countries, so there is still substantial room for sales of mobile phone units in both countries. In other countries, the absolute numbers
26 The1998figuresarefromwww.indiastat.com.
27 http://www.telecomindiaonline.com/india-telecom-growth-and-subscribers-2010.html
28 Nystedt,D.2010.ChinaNears800MillionMobilePhoneSubscribers.PCWorldBusinessCenter.29June.
Table5.1Distribution of Households by Class and by Ownership of Selected Durables
Per capita expenditure/
income class (2005
$ PPP)
Percent of households with …radio TV aircon refrigerator motorcycle/scooter automobile
PRC* India Philippines PRC** India Philippines PRC*** India Philippines PRC India Philippines PRC India Philippines PRC India Philippines
<$1.25 21.9 19.0 44.9 43.7 17.0 26.1 0.3 2.0 0.1 8.3 1.0 3.3 13.2 2.0 1.9 0.1 0.2 0.2$1.25–$2 24.2 27.0 56.6 55.3 30.0 54.6 0.3 3.0 0.5 14.5 3.0 13.6 18.7 5.0 5.6 0.1 0.7 0.5$2–$4 28.7 31.0 62.7 74.5 43.0 80.7 1.4 7.0 2.4 37.5 10.0 41.1 24.6 13.0 13.1 0.2 1.0 2.6$4–$10 39.4 36.0 67.9 92.6 61.0 93.7 8.4 17.0 14.2 74.3 29.0 76.2 24.3 29.0 22.1 1.1 2.0 14.8$10–$20 49.1 42.0 72.3 95.9 67.0 96.1 25.0 26.0 45.3 91.3 46.0 88.9 26.5 41.0 18.8 2.5 8.0 39.9>$20 63.2 48.0 76.1 98.3 74.0 98.4 31.6 40.0 74.7 91.5 59.0 94.5 44.1 46.0 18.0 10.2 22.0 59.7
Notes: PCE=percapitaexpenditure;PRC=People’sRepublicofChina;*-stereo,rural;**-colorTV;***-ruralonlySource: StaffestimatesbasedonHouseholdConsumerExpenditureSurveyofIndia(2004-05),Philippines’FamilyIncomeandExpenditureSurvey(2006)andChineseHouseholdIncome
ProjectSurvey(2002).
are not as large, but the mobile phone penetration rate is even higher—60% in Pakistan and Indonesia, 74% in the Philippines, and 80% in Viet Nam.29
In Table 5.1 we use household survey data from the PRC, India, and the Philippines to examine the ownership rate of selected consumer durables across different expenditure classes. Figure 5.1 presents ownership patterns by expenditure decile groups. Surprisingly, the proportion of households with radios, TVs, and refrigerators is much higher in the Philippines than in India across identical expenditure classes. Thus, for example, while only 21% of Indian households living on less than $1.25 a day own radios, the corresponding ratio among Filipino households in the same expenditure class is 45% The only durables more widely owned in India than in the Philippines within each expenditure class are motorcycles and scooters. As for automobile ownership patterns are very similar across the two countries except for the richest expenditure class; in this group, Filipino households have much higher automobile ownership rates than Indian households. The PRC, by comparison, has much higher rates of TV and refrigerator ownership in the urban areas than in the Philippines for all expenditure income classes. Compared to India and the Philippines, Chinese ownership of TV, and refrigerators is higher. However, Chinese households lag noticeably in car ownership: only 2.7% of urban households with $10–$20 daily per capita income have cars, compared to 34.6% of Indian households and 40.6% of Filipino households in the same income group. Catching up on this measure will be one of the most significant implications of the growth of the Chinese middle class.
What explains these large differences in consumer durable ownership? It seems unlikely that differences in
29 “IndonesiaOvertakesJapantoTakeThirdPlaceinAsiaSubscriberRankings”.CellularNews.21April2009;“PakistanTelecomIndicators,PTA”;“IFChelpsimproveretailpaymentsysteminVietNam”.Vovnews.Vn.;ICTStatisticsNewslog—Mobilepenetrationratereachesthemarkof75%at2008-end(Philippines)”.Itu.int.2009-03-11.
KI2010-Special-Chapter.indd 37 8/12/10 7:01 PM
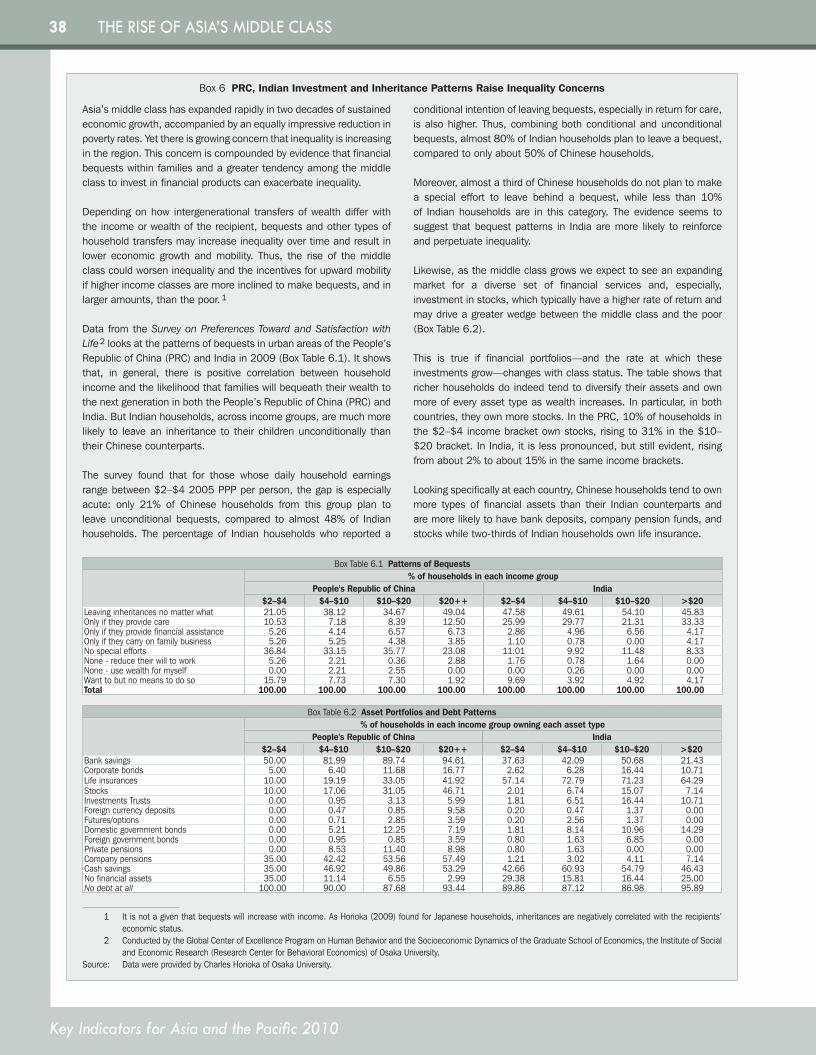
38
Key Indicators for Asia and the Pacific 2010
THE RISE OF ASIA’S MIddLE CLASS
Box 6 PRC, Indian Investment and Inheritance Patterns Raise Inequality Concerns
Asia’s middle class has expanded rapidly in two decades of sustained economic growth, accompanied by an equally impressive reduction in poverty rates. Yet there is growing concern that inequality is increasing in the region. This concern is compounded by evidence that financial bequests within families and a greater tendency among the middle class to invest in financial products can exacerbate inequality.
Depending on how intergenerational transfers of wealth differ with the income or wealth of the recipient, bequests and other types of household transfers may increase inequality over time and result in lower economic growth and mobility. Thus, the rise of the middle class could worsen inequality and the incentives for upward mobility if higher income classes are more inclined to make bequests, and in larger amounts, than the poor. 1
Data from the Survey on Preferences Toward and Satisfaction with Life 2 looks at the patterns of bequests in urban areas of the People’s Republic of China (PRC) and India in 2009 (Box Table 6.1). It shows that, in general, there is positive correlation between household income and the likelihood that families will bequeath their wealth to the next generation in both the People’s Republic of China (PRC) and India. But Indian households, across income groups, are much more likely to leave an inheritance to their children unconditionally than their Chinese counterparts.
The survey found that for those whose daily household earnings range between $2–$4 2005 PPP per person, the gap is especially acute: only 21% of Chinese households from this group plan to leave unconditional bequests, compared to almost 48% of Indian households. The percentage of Indian households who reported a
conditional intention of leaving bequests, especially in return for care, is also higher. Thus, combining both conditional and unconditional bequests, almost 80% of Indian households plan to leave a bequest, compared to only about 50% of Chinese households.
Moreover, almost a third of Chinese households do not plan to make a special effort to leave behind a bequest, while less than 10% of Indian households are in this category. The evidence seems to suggest that bequest patterns in India are more likely to reinforce and perpetuate inequality.
Likewise, as the middle class grows we expect to see an expanding market for a diverse set of financial services and, especially, investment in stocks, which typically have a higher rate of return and may drive a greater wedge between the middle class and the poor (Box Table 6.2).
This is true if financial portfolios—and the rate at which these investments grow—changes with class status. The table shows that richer households do indeed tend to diversify their assets and own more of every asset type as wealth increases. In particular, in both countries, they own more stocks. In the PRC, 10% of households in the $2–$4 income bracket own stocks, rising to 31% in the $10–$20 bracket. In India, it is less pronounced, but still evident, rising from about 2% to about 15% in the same income brackets.
Looking specifically at each country, Chinese households tend to own more types of financial assets than their Indian counterparts and are more likely to have bank deposits, company pension funds, and stocks while two-thirds of Indian households own life insurance.
1 It is not a given that bequests will increase with income. As Horioka (2009) found for Japanese households, inheritances are negatively correlated with the recipients’ economic status.
2 Conducted by the Global Center of Excellence Program on Human Behavior and the Socioeconomic Dynamics of the Graduate School of Economics, the Institute of Social and Economic Research (Research Center for Behavioral Economics) of Osaka University.
Source: Data were provided by Charles Horioka of Osaka University.
Box Table 6.1 Patterns of Bequests% of households in each income group
People's Republic of China India$2–$4 $4–$10 $10–$20 $20++ $2–$4 $4–$10 $10–$20 >$20
Leaving inheritances no matter what 21.05 38.12 34.67 49.04 47.58 49.61 54.10 45.83Only if they provide care 10.53 7.18 8.39 12.50 25.99 29.77 21.31 33.33Only if they provide financial assistance 5.26 4.14 6.57 6.73 2.86 4.96 6.56 4.17Only if they carry on family business 5.26 5.25 4.38 3.85 1.10 0.78 0.00 4.17No special efforts 36.84 33.15 35.77 23.08 11.01 9.92 11.48 8.33None - reduce their will to work 5.26 2.21 0.36 2.88 1.76 0.78 1.64 0.00None - use wealth for myself 0.00 2.21 2.55 0.00 0.00 0.26 0.00 0.00Want to but no means to do so 15.79 7.73 7.30 1.92 9.69 3.92 4.92 4.17Total 100.00 100.00 100.00 100.00 100.00 100.00 100.00 100.00
Box Table 6.2 Asset Portfolios and Debt Patterns% of households in each income group owning each asset type
People's Republic of China India$2–$4 $4–$10 $10–$20 $20++ $2–$4 $4–$10 $10–$20 >$20
Bank savings 50.00 81.99 89.74 94.61 37.63 42.09 50.68 21.43Corporate bonds 5.00 6.40 11.68 16.77 2.62 6.28 16.44 10.71Life insurances 10.00 19.19 33.05 41.92 57.14 72.79 71.23 64.29Stocks 10.00 17.06 31.05 46.71 2.01 6.74 15.07 7.14Investments Trusts 0.00 0.95 3.13 5.99 1.81 6.51 16.44 10.71Foreign currency deposits 0.00 0.47 0.85 9.58 0.20 0.47 1.37 0.00Futures/options 0.00 0.71 2.85 3.59 0.20 2.56 1.37 0.00Domestic government bonds 0.00 5.21 12.25 7.19 1.81 8.14 10.96 14.29Foreign government bonds 0.00 0.95 0.85 3.59 0.80 1.63 6.85 0.00Private pensions 0.00 8.53 11.40 8.98 0.80 1.63 0.00 0.00Company pensions 35.00 42.42 53.56 57.49 1.21 3.02 4.11 7.14Cash savings 35.00 46.92 49.86 53.29 42.66 60.93 54.79 46.43No financial assets 35.00 11.14 6.55 2.99 29.38 15.81 16.44 25.00No debt at all 100.00 90.00 87.68 93.44 89.86 87.12 86.98 95.89
KI2010-Special-Chapter.indd 38 8/12/10 7:01 PM
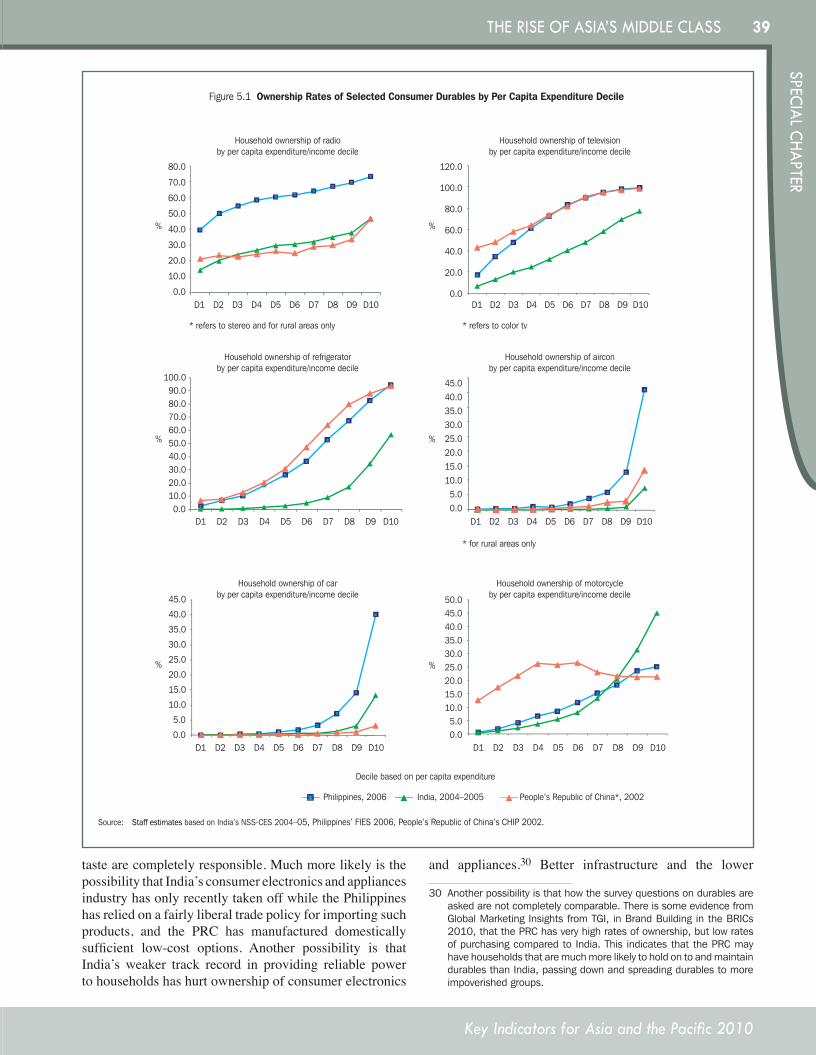
39
Key Indicators for Asia and the Pacific 2010
SPECIAL CHAPTERTHE RISE OF ASIA’S MIddLE CLASS
taste are completely responsible. Much more likely is the possibility that India’s consumer electronics and appliances industry has only recently taken off while the Philippines has relied on a fairly liberal trade policy for importing such products, and the PRC has manufactured domestically sufficient low-cost options. Another possibility is that India’s weaker track record in providing reliable power to households has hurt ownership of consumer electronics
and appliances.30 Better infrastructure and the lower
30 Anotherpossibilityisthathowthesurveyquestionsondurablesareaskedarenotcompletelycomparable.ThereissomeevidencefromGlobalMarketingInsightsfromTGI,inBrandBuildingintheBRICs2010,thatthePRChasveryhighratesofownership,butlowratesofpurchasingcomparedtoIndia.ThisindicatesthatthePRCmayhavehouseholdsthataremuchmorelikelytoholdontoandmaintaindurablesthanIndia,passingdownandspreadingdurablestomoreimpoverishedgroups.
Source: Staff estimates based on India’s NSS-CES 2004–05, Philippines’ FIES 2006, People’s Republic of China’s CHIP 2002.
Figure 5.1 Ownership Rates of Selected Consumer Durables by Per Capita Expenditure Decile
Decile based on per capita expenditure
Philippines, 2006 People’s Republic of China*, 2002 India, 2004–2005
80.0
70.0
60.0
50.0
40.0
30.0
20.0
10.0
0.0
120.0
100.0
80.0
60.0
40.0
20.0
0.0
80.090.0
100.0
70.060.050.040.030.020.010.00.0
D1 D2 D3 D4 D5 D6 D7 D8 D9 D10 D1 D2 D3 D4 D5 D6 D7 D8 D9 D10
D1 D2 D3 D4 D5 D6 D7 D8 D9 D10 D1 D2 D3 D4 D5 D6 D7 D8 D9 D10
D1 D2 D3 D4 D5 D6 D7 D8 D9 D10 D1 D2 D3 D4 D5 D6 D7 D8 D9 D10
25.030.035.040.045.0
20.015.010.05.00.0
25.030.035.040.045.050.0
20.015.010.05.00.0
25.0
30.0
35.0
40.0
45.0
20.0
15.0
10.0
5.0
0.0
%
%
% %
%
%
Household ownership of televisionby per capita expenditure/income decile
Household ownership of airconby per capita expenditure/income decile
Household ownership of motorcycleby per capita expenditure/income decile
* refers to stereo and for rural areas only * refers to color tv
* for rural areas only
Household ownership of radioby per capita expenditure/income decile
Household ownership of refrigeratorby per capita expenditure/income decile
Household ownership of carby per capita expenditure/income decile
KI2010-Special-Chapter.indd 39 8/12/10 7:01 PM
40
Key Indicators for Asia and the Pacific 2010
THE RISE OF ASIA’S MIddLE CLASS
cost of public transportation systems compared to the relative cost of cars may explain lower rates of automobile ownership in the PRC.
B. FrugalInnovation
More important than the growing consumer durable market, however, is the innovation in developing countries spurred by the rise of the middle class, one that differs significantly in income level and consumer demands from the traditional, Western middle class. Companies that have seen the potential in this lower-income, middle-class market —the “Bottom of the Pyramid,” as Prahalad (2005) calls it—have catered to this market and have profited handsomely. Prahalad cites dozens of case studies of successful companies and entrepreneurs around the world—in such diverse industries as personal care and hygiene products, banking, information technology, health care services, insurance, and retail sales—that have creatively developed affordable new products and services for low-income consumers in the developing world.
The appearance of a large Asian middle class—albeit one that is poorer and more frugal than the Western middle class—has accelerated ‘frugal innovation’ in the past decade. Illustrating this point are new products such as the $2,200 ‘Nano car’ (by Tata Motors of India), an inexpensive hand-held electrocardiogram machine that costs patients just $1 for an electrocardiogram (by General Electric’s health-care laboratory in Bangalore), a $70 battery-operated refrigerator (by India’s Godrej company), a $24 rice husk-based water filter (by Tata Chemicals), a $12 lithium-ion battery (by the PRC’s BYD Lithium Battery Co), and mobile phone rates well below a penny a minute (offered by most Indian mobile phone carriers) (Economist 2010). “Developing countries are becoming hotbeds of business innovation in much the same way as Japan did from the 1950s onwards… All the elements of modern business, from supply-chain management to recruitment and retention, are being rejigged or reinvented in one emerging market or another” (The Economist 2010). As a result, emerging market companies are fast becoming serious players on the global business stage, but also potentially adding value and growth to the middle class by creating new avenues for stable employment.
C. GreaterAccountabilityinPublicServices
In most societies, the middle class is better positioned than the poor to demand greater accountability and transparency in public-sector operations. This demand is usually self-serving, but the poor benefit as much as the middle class from better public services (see Box 7 for more on the benefits of public spending and the middle class). The reason for middle class success is that it is better educated,
more aware of its rights, and better organized than the poor. It is also the main source of the leaders and activists who create and operate many of the non-governmental organizations (NGOs) that work for greater accountability in government.
There are numerous examples of improved public services that resulted from citizen demands (World Bank 2004). An often-cited example is the Citizen’s Report Card (CRC), an initiative organized by an NGO in Bangalore in 1994, which rated municipal services such as water supply, health care, education, electricity, telecommunications and transport, finding uniformly low levels of public satisfaction with the services. The CRC was expanded to several other cities and rural areas around India, creating pressure on local government to improve the quality of public services. A second report card on Bangalore in 1999 showed somewhat higher user ratings, while a third in 2003 showed a remarkable turnaround in the city’s services. Not only did public satisfaction improve across the board, but the reported incidence of problems and corruption declined significantly. Thus, being in the public spotlight appears to have improved the quality of public services in Bangalore.
Chakrabarti (2009) discusses how India’s urban middle class, despite being the main beneficiary of economic reforms since 1991, has become more involved in activism in recent years. Some of this has manifested itself in the rise of neighborhood associations, many of which have sought a more formal role in policy making by contesting local government elections.
History also shows the potency of the Asian middle class as an agent of change in the region. Rapid economic growth in the 1970s and 1980s in the Republic of Korea and Taipei,China helped create a large middle class, laying the foundation for a transition to democracy in these economies. The same process unfolded in Thailand, Malaysia, the Philippines, and Indonesia during the 1980s and 1990s. But the process is by no means universal. Writing about the Chinese middle class, Marsden (2009) notes that “… the values that the new Chinese middle class does share are not [US] progressive middle class values of a reverence for democracy; rather, they are centered around the retention of their newfound material well-being, much of which they attribute to the economic reform policies of the Chinese Communist Party in the past thirty years.”
D. EconomicGrowth
If the middle class is associated with higher consumer spending, more innovation, and better governance, does its emergence accelerate a country’s economic growth? In the literature, several avenues—beyond innovation
KI2010-Special-Chapter.indd 40 8/12/10 7:01 PM
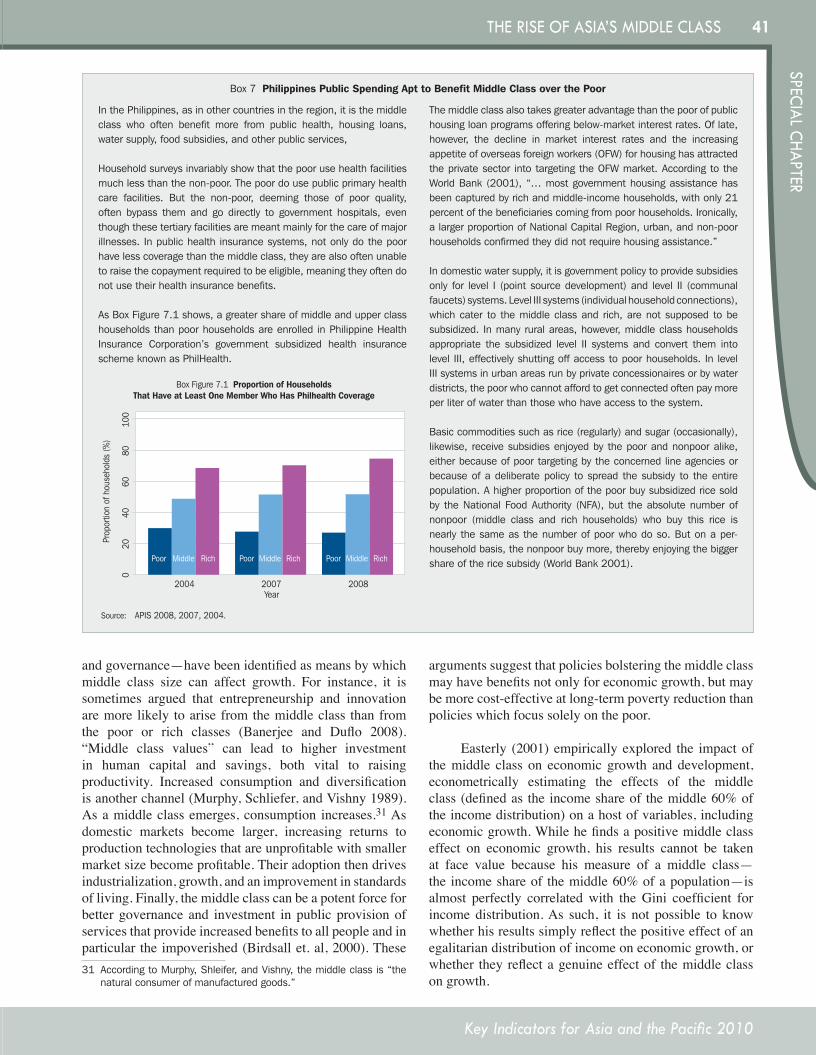
41
Key Indicators for Asia and the Pacific 2010
SPECIAL CHAPTERTHE RISE OF ASIA’S MIddLE CLASS
and governance—have been identified as means by which middle class size can affect growth. For instance, it is sometimes argued that entrepreneurship and innovation are more likely to arise from the middle class than from the poor or rich classes (Banerjee and Duflo 2008). “Middle class values” can lead to higher investment in human capital and savings, both vital to raising productivity. Increased consumption and diversification is another channel (Murphy, Schliefer, and Vishny 1989). As a middle class emerges, consumption increases.31 As domestic markets become larger, increasing returns to production technologies that are unprofitable with smaller market size become profitable. Their adoption then drives industrialization, growth, and an improvement in standards of living. Finally, the middle class can be a potent force for better governance and investment in public provision of services that provide increased benefits to all people and in particular the impoverished (Birdsall et. al, 2000). These 31 AccordingtoMurphy,Shleifer,andVishny,themiddleclassis“the
naturalconsumerofmanufacturedgoods.”
arguments suggest that policies bolstering the middle class may have benefits not only for economic growth, but may be more cost-effective at long-term poverty reduction than policies which focus solely on the poor.
Easterly (2001) empirically explored the impact of the middle class on economic growth and development, econometrically estimating the effects of the middle class (defined as the income share of the middle 60% of the income distribution) on a host of variables, including economic growth. While he finds a positive middle class effect on economic growth, his results cannot be taken at face value because his measure of a middle class—the income share of the middle 60% of a population—is almost perfectly correlated with the Gini coefficient for income distribution. As such, it is not possible to know whether his results simply reflect the positive effect of an egalitarian distribution of income on economic growth, or whether they reflect a genuine effect of the middle class on growth.
Box 7 Philippines Public Spending Apt to Benefit Middle Class over the Poor
In the Philippines, as in other countries in the region, it is the middle class who often benefit more from public health, housing loans, water supply, food subsidies, and other public services,
Household surveys invariably show that the poor use health facilities much less than the non-poor. The poor do use public primary health care facilities. But the non-poor, deeming those of poor quality, often bypass them and go directly to government hospitals, even though these tertiary facilities are meant mainly for the care of major illnesses. In public health insurance systems, not only do the poor have less coverage than the middle class, they are also often unable to raise the copayment required to be eligible, meaning they often do not use their health insurance benefits.
As Box Figure 7.1 shows, a greater share of middle and upper class households than poor households are enrolled in Philippine Health Insurance Corporation’s government subsidized health insurance scheme known as PhilHealth.
The middle class also takes greater advantage than the poor of public housing loan programs offering below-market interest rates. Of late, however, the decline in market interest rates and the increasing appetite of overseas foreign workers (OFW) for housing has attracted the private sector into targeting the OFW market. According to the World Bank (2001), “… most government housing assistance has been captured by rich and middle-income households, with only 21 percent of the beneficiaries coming from poor households. Ironically, a larger proportion of National Capital Region, urban, and non-poor households confirmed they did not require housing assistance.”
In domestic water supply, it is government policy to provide subsidies only for level I (point source development) and level II (communal faucets) systems. Level III systems (individual household connections), which cater to the middle class and rich, are not supposed to be subsidized. In many rural areas, however, middle class households appropriate the subsidized level II systems and convert them into level III, effectively shutting off access to poor households. In level III systems in urban areas run by private concessionaires or by water districts, the poor who cannot afford to get connected often pay more per liter of water than those who have access to the system.
Basic commodities such as rice (regularly) and sugar (occasionally), likewise, receive subsidies enjoyed by the poor and nonpoor alike, either because of poor targeting by the concerned line agencies or because of a deliberate policy to spread the subsidy to the entire population. A higher proportion of the poor buy subsidized rice sold by the National Food Authority (NFA), but the absolute number of nonpoor (middle class and rich households) who buy this rice is nearly the same as the number of poor who do so. But on a per-household basis, the nonpoor buy more, thereby enjoying the bigger share of the rice subsidy (World Bank 2001).
Prop
ortio
n of
hou
seho
lds
(%)
2004 2007 2008
Box Figure 7.1 Proportion of HouseholdsThat Have at Least One Member Who Has Philhealth Coverage
Year
Poor Middle Rich Poor Middle Rich Poor Middle Rich
Source: APIS 2008, 2007, 2004.
020
4060
8010
0
KI2010-Special-Chapter.indd 41 8/12/10 7:01 PM
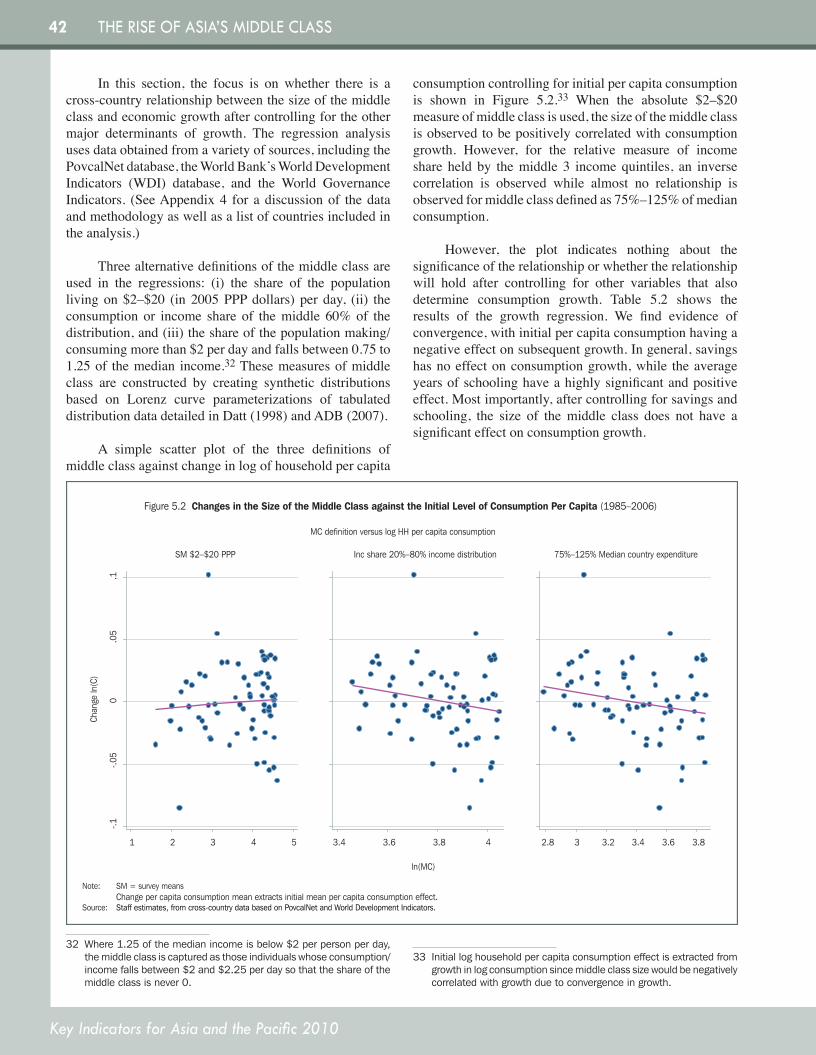
42
Key Indicators for Asia and the Pacific 2010
THE RISE OF ASIA’S MIddLE CLASS
In this section, the focus is on whether there is a cross-country relationship between the size of the middle class and economic growth after controlling for the other major determinants of growth. The regression analysis uses data obtained from a variety of sources, including the PovcalNet database, the World Bank’s World Development Indicators (WDI) database, and the World Governance Indicators. (See Appendix 4 for a discussion of the data and methodology as well as a list of countries included in the analysis.)
Three alternative definitions of the middle class are used in the regressions: (i) the share of the population living on $2–$20 (in 2005 PPP dollars) per day, (ii) the consumption or income share of the middle 60% of the distribution, and (iii) the share of the population making/consuming more than $2 per day and falls between 0.75 to 1.25 of the median income.32 These measures of middle class are constructed by creating synthetic distributions based on Lorenz curve parameterizations of tabulated distribution data detailed in Datt (1998) and ADB (2007).
A simple scatter plot of the three definitions of middle class against change in log of household per capita
32 Where1.25ofthemedianincomeisbelow$2perpersonperday,themiddleclassiscapturedasthoseindividualswhoseconsumption/incomefallsbetween$2and$2.25perdaysothattheshareofthemiddleclassisnever0.
consumption controlling for initial per capita consumption is shown in Figure 5.2.33 When the absolute $2–$20 measure of middle class is used, the size of the middle class is observed to be positively correlated with consumption growth. However, for the relative measure of income share held by the middle 3 income quintiles, an inverse correlation is observed while almost no relationship is observed for middle class defined as 75%–125% of median consumption.
However, the plot indicates nothing about the significance of the relationship or whether the relationship will hold after controlling for other variables that also determine consumption growth. Table 5.2 shows the results of the growth regression. We find evidence of convergence, with initial per capita consumption having a negative effect on subsequent growth. In general, savings has no effect on consumption growth, while the average years of schooling have a highly significant and positive effect. Most importantly, after controlling for savings and schooling, the size of the middle class does not have a significant effect on consumption growth.
33 Initialloghouseholdpercapitaconsumptioneffectisextractedfromgrowthinlogconsumptionsincemiddleclasssizewouldbenegativelycorrelatedwithgrowthduetoconvergenceingrowth.
Note: SM = survey means Change per capita consumption mean extracts initial mean per capita consumption effect.Source: Staff estimates, from cross-country data based on PovcalNet and World Development Indicators.
Figure 5.2 Changes in the Size of the Middle Class against the Initial Level of Consumption Per Capita (1985–2006)
-.1-.0
50
.05
.1
Chan
ge ln
(C)
1 2 3 4 5 3.4 3.6 3.8 4 2.8 3 3.2 3.4 3.6 3.8
MC definition versus log HH per capita consumption
SM $2–$20 PPP 75%–125% Median country expenditure
ln(MC)
Inc share 20%–80% income distribution
KI2010-Special-Chapter.indd 42 8/12/10 7:01 PM
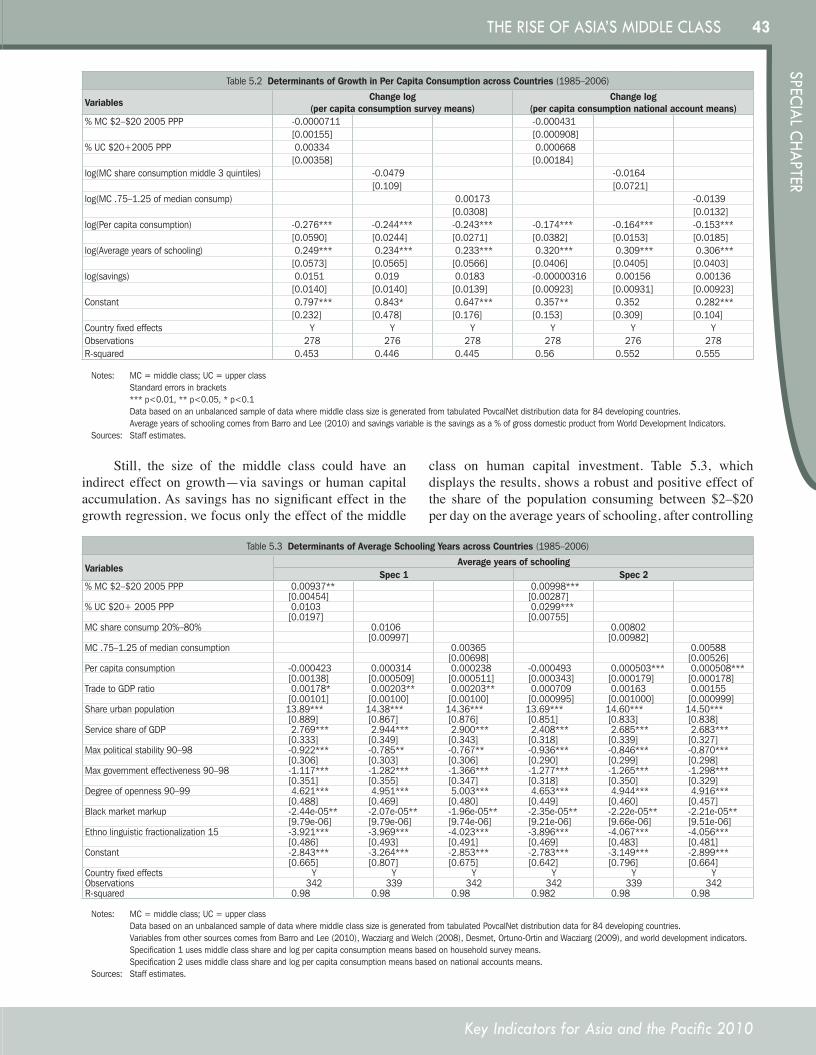
43
Key Indicators for Asia and the Pacific 2010
SPECIAL CHAPTERTHE RISE OF ASIA’S MIddLE CLASS
Still, the size of the middle class could have an indirect effect on growth—via savings or human capital accumulation. As savings has no significant effect in the growth regression, we focus only the effect of the middle
class on human capital investment. Table 5.3, which displays the results, shows a robust and positive effect of the share of the population consuming between $2–$20 per day on the average years of schooling, after controlling
Table5.2 Determinants of Growth in Per Capita Consumption across Countries (1985–2006)
Variables Change log (per capita consumption survey means)
Change log (per capita consumption national account means)
%MC$2–$202005PPP -0.0000711 -0.000431[0.00155] [0.000908]
%UC$20+2005PPP 0.00334 0.000668[0.00358] [0.00184]
log(MCshareconsumptionmiddle3quintiles) -0.0479 -0.0164[0.109] [0.0721]
log(MC.75–1.25ofmedianconsump) 0.00173 -0.0139[0.0308] [0.0132]
log(Percapitaconsumption) -0.276*** -0.244*** -0.243*** -0.174*** -0.164*** -0.153***[0.0590] [0.0244] [0.0271] [0.0382] [0.0153] [0.0185]
log(Averageyearsofschooling) 0.249*** 0.234*** 0.233*** 0.320*** 0.309*** 0.306***[0.0573] [0.0565] [0.0566] [0.0406] [0.0405] [0.0403]
log(savings) 0.0151 0.019 0.0183 -0.00000316 0.00156 0.00136[0.0140] [0.0140] [0.0139] [0.00923] [0.00931] [0.00923]
Constant 0.797*** 0.843* 0.647*** 0.357** 0.352 0.282***[0.232] [0.478] [0.176] [0.153] [0.309] [0.104]
Countryfixedeffects Y Y Y Y Y YObservations 278 276 278 278 276 278R-squared 0.453 0.446 0.445 0.56 0.552 0.555
Notes: MC=middleclass;UC=upperclass Standarderrorsinbrackets ***p<0.01,**p<0.05,*p<0.1 DatabasedonanunbalancedsampleofdatawheremiddleclasssizeisgeneratedfromtabulatedPovcalNetdistributiondatafor84developingcountries. AverageyearsofschoolingcomesfromBarroandLee(2010)andsavingsvariableisthesavingsasa%ofgrossdomesticproductfromWorldDevelopmentIndicators.Sources: Staffestimates.
Table5.3 Determinants of Average Schooling Years across Countries (1985–2006)
VariablesAverage years of schooling
Spec 1 Spec 2%MC$2–$202005PPP 0.00937** 0.00998***
[0.00454] [0.00287]%UC$20+2005PPP 0.0103 0.0299***
[0.0197] [0.00755]MCshareconsump20%–80% 0.0106 0.00802
[0.00997] [0.00982]MC.75–1.25ofmedianconsumption 0.00365 0.00588
[0.00698] [0.00526]Percapitaconsumption -0.000423 0.000314 0.000238 -0.000493 0.000503*** 0.000508***
[0.00138] [0.000509] [0.000511] [0.000343] [0.000179] [0.000178]TradetoGDPratio 0.00178* 0.00203** 0.00203** 0.000709 0.00163 0.00155
[0.00101] [0.00100] [0.00100] [0.000995] [0.001000] [0.000999]Shareurbanpopulation 13.89*** 14.38*** 14.36*** 13.69*** 14.60*** 14.50***
[0.889] [0.867] [0.876] [0.851] [0.833] [0.838]ServiceshareofGDP 2.769*** 2.944*** 2.900*** 2.408*** 2.685*** 2.683***
[0.333] [0.349] [0.343] [0.318] [0.339] [0.327]Maxpoliticalstability90–98 -0.922*** -0.785** -0.767** -0.936*** -0.846*** -0.870***
[0.306] [0.303] [0.306] [0.290] [0.299] [0.298]Maxgovernmenteffectiveness90–98 -1.117*** -1.282*** -1.366*** -1.277*** -1.265*** -1.298***
[0.351] [0.355] [0.347] [0.318] [0.350] [0.329]Degreeofopenness90–99 4.621*** 4.951*** 5.003*** 4.653*** 4.944*** 4.916***
[0.488] [0.469] [0.480] [0.449] [0.460] [0.457]Blackmarketmarkup -2.44e-05** -2.07e-05** -1.96e-05** -2.35e-05** -2.22e-05** -2.21e-05**
[9.79e-06] [9.79e-06] [9.74e-06] [9.21e-06] [9.66e-06] [9.51e-06]Ethnolinguisticfractionalization15 -3.921*** -3.969*** -4.023*** -3.896*** -4.067*** -4.056***
[0.486] [0.493] [0.491] [0.469] [0.483] [0.481]Constant -2.843*** -3.264*** -2.853*** -2.783*** -3.149*** -2.899***
[0.665] [0.807] [0.675] [0.642] [0.796] [0.664]Countryfixedeffects Y Y Y Y Y YObservations 342 339 342 342 339 342R-squared 0.98 0.98 0.98 0.982 0.98 0.98
Notes: MC=middleclass;UC=upperclass DatabasedonanunbalancedsampleofdatawheremiddleclasssizeisgeneratedfromtabulatedPovcalNetdistributiondatafor84developingcountries. VariablesfromothersourcescomesfromBarroandLee(2010),WacziargandWelch(2008),Desmet,Ortuno-OrtinandWacziarg(2009),andworlddevelopmentindicators. Specification1usesmiddleclassshareandlogpercapitaconsumptionmeansbasedonhouseholdsurveymeans. Specification2usesmiddleclassshareandlogpercapitaconsumptionmeansbasedonnationalaccountsmeans.Sources: Staffestimates.
KI2010-Special-Chapter.indd 43 8/12/10 7:01 PM
44
Key Indicators for Asia and the Pacific 2010
THE RISE OF ASIA’S MIddLE CLASS
for mean consumption levels, urbanization, trade, and political factors within a country. However, when the middle class is defined in relative terms (as the share of population living on 0.75–1.25 of median income or the income/consumption share of the middle three quintiles), there is no significant middle-class effect on schooling years.
The data strongly suggest that the processes that lead to higher economic growth also lead to a bigger middle class. Thus, it is not surprising to find that the size of the middle class fails to have any systematic and significant positive effect on growth at the aggregate country level
after controlling for measures of initial consumption per capita. While there is some evidence that middle-class size affects growth indirectly—via its positive effect on schooling attainment—that evidence is mostly inconclusive. However, this does not mean that the growth of the middle class has no effect on economic growth, only that it is not possible to discern this effect meaningfully with cross-country regressions. This may point to the limitations of the cross-country regression approach, which is based on many restrictive assumptions and highly aggregated data (often of uneven quality), more than to anything else.
KI2010-Special-Chapter.indd 44 8/12/10 7:01 PM
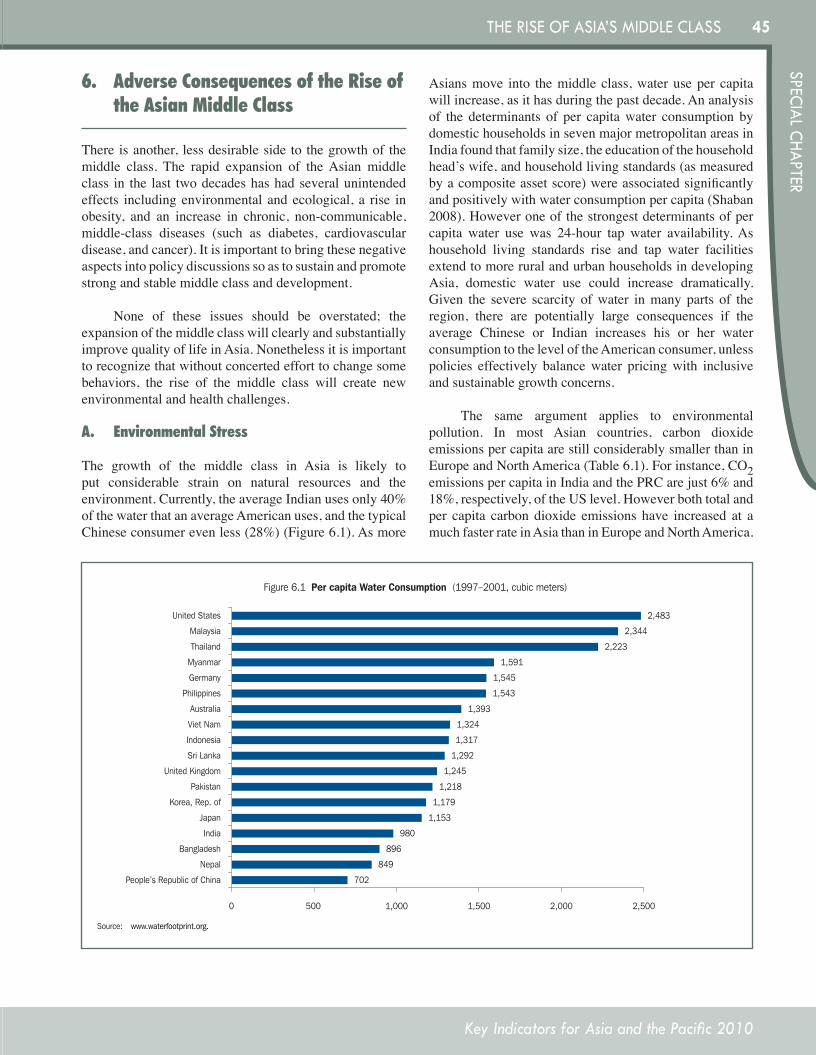
45
Key Indicators for Asia and the Pacific 2010
SPECIAL CHAPTERTHE RISE OF ASIA’S MIddLE CLASS
6. AdverseConsequencesoftheRiseoftheAsianMiddleClass
There is another, less desirable side to the growth of the middle class. The rapid expansion of the Asian middle class in the last two decades has had several unintended effects including environmental and ecological, a rise in obesity, and an increase in chronic, non-communicable, middle-class diseases (such as diabetes, cardiovascular disease, and cancer). It is important to bring these negative aspects into policy discussions so as to sustain and promote strong and stable middle class and development.
None of these issues should be overstated; the expansion of the middle class will clearly and substantially improve quality of life in Asia. Nonetheless it is important to recognize that without concerted effort to change some behaviors, the rise of the middle class will create new environmental and health challenges.
A. EnvironmentalStress
The growth of the middle class in Asia is likely to put considerable strain on natural resources and the environment. Currently, the average Indian uses only 40% of the water that an average American uses, and the typical Chinese consumer even less (28%) (Figure 6.1). As more
Asians move into the middle class, water use per capita will increase, as it has during the past decade. An analysis of the determinants of per capita water consumption by domestic households in seven major metropolitan areas in India found that family size, the education of the household head’s wife, and household living standards (as measured by a composite asset score) were associated significantly and positively with water consumption per capita (Shaban 2008). However one of the strongest determinants of per capita water use was 24-hour tap water availability. As household living standards rise and tap water facilities extend to more rural and urban households in developing Asia, domestic water use could increase dramatically. Given the severe scarcity of water in many parts of the region, there are potentially large consequences if the average Chinese or Indian increases his or her water consumption to the level of the American consumer, unless policies effectively balance water pricing with inclusive and sustainable growth concerns.
The same argument applies to environmental pollution. In most Asian countries, carbon dioxide emissions per capita are still considerably smaller than in Europe and North America (Table 6.1). For instance, CO2 emissions per capita in India and the PRC are just 6% and 18%, respectively, of the US level. However both total and per capita carbon dioxide emissions have increased at a much faster rate in Asia than in Europe and North America.
Source: www.waterfootprint.org.
Figure 6.1 Per capita Water Consumption (1997–2001, cubic meters)
702
849
896
980
1,153
1,179
1,218
1,245
1,292
1,317
1,324
1,393
1,543
1,545
1,591
2,223
2,344
2,483
0 500 1,000 1,500 2,000 2,500
People’s Republic of China
Nepal
Bangladesh
India
Japan
Korea, Rep. of
Pakistan
United Kingdom
Sri Lanka
Indonesia
Viet Nam
Australia
Philippines
Germany
Myanmar
Thailand
Malaysia
United States
KI2010-Special-Chapter.indd 45 8/12/10 7:01 PM
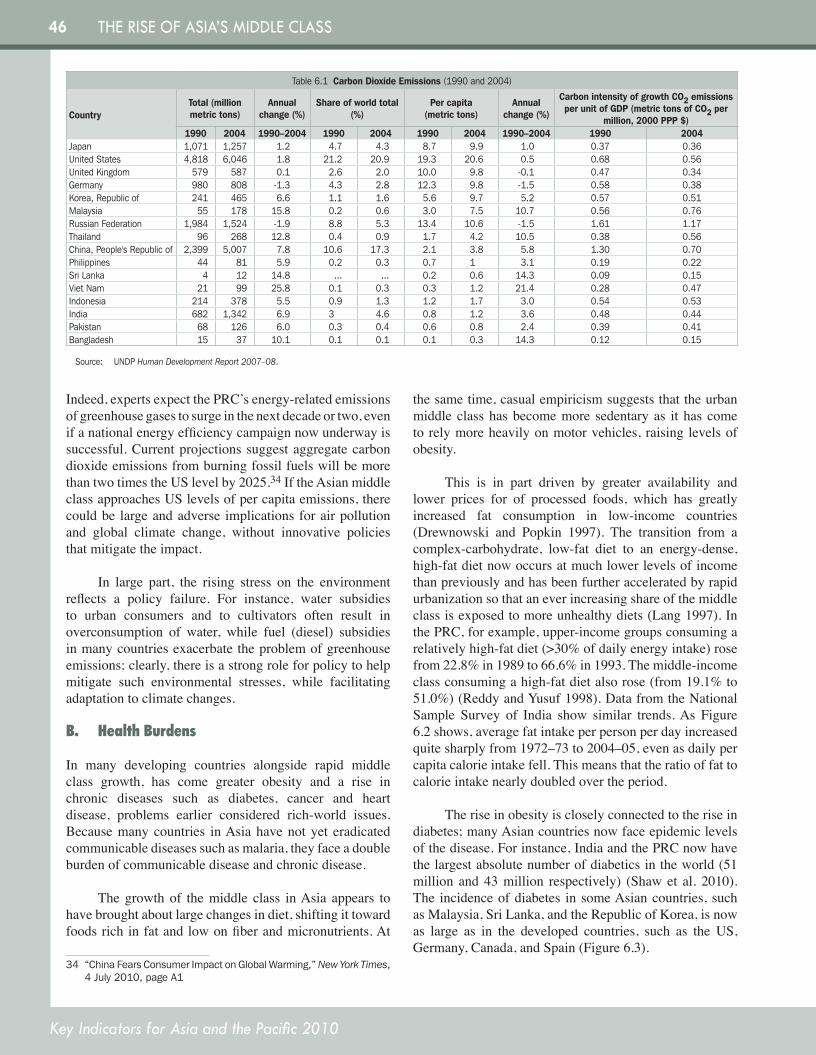
46
Key Indicators for Asia and the Pacific 2010
THE RISE OF ASIA’S MIddLE CLASS
Indeed, experts expect the PRC’s energy-related emissions of greenhouse gases to surge in the next decade or two, even if a national energy efficiency campaign now underway is successful. Current projections suggest aggregate carbon dioxide emissions from burning fossil fuels will be more than two times the US level by 2025.34 If the Asian middle class approaches US levels of per capita emissions, there could be large and adverse implications for air pollution and global climate change, without innovative policies that mitigate the impact.
In large part, the rising stress on the environment reflects a policy failure. For instance, water subsidies to urban consumers and to cultivators often result in overconsumption of water, while fuel (diesel) subsidies in many countries exacerbate the problem of greenhouse emissions; clearly, there is a strong role for policy to help mitigate such environmental stresses, while facilitating adaptation to climate changes.
B. HealthBurdens
In many developing countries alongside rapid middle class growth, has come greater obesity and a rise in chronic diseases such as diabetes, cancer and heart disease, problems earlier considered rich-world issues. Because many countries in Asia have not yet eradicated communicable diseases such as malaria, they face a double burden of communicable disease and chronic disease.
The growth of the middle class in Asia appears to have brought about large changes in diet, shifting it toward foods rich in fat and low on fiber and micronutrients. At
34 “ChinaFearsConsumerImpactonGlobalWarming,”New York Times,4July2010,pageA1
the same time, casual empiricism suggests that the urban middle class has become more sedentary as it has come to rely more heavily on motor vehicles, raising levels of obesity.
This is in part driven by greater availability and lower prices for of processed foods, which has greatly increased fat consumption in low-income countries (Drewnowski and Popkin 1997). The transition from a complex-carbohydrate, low-fat diet to an energy-dense, high-fat diet now occurs at much lower levels of income than previously and has been further accelerated by rapid urbanization so that an ever increasing share of the middle class is exposed to more unhealthy diets (Lang 1997). In the PRC, for example, upper-income groups consuming a relatively high-fat diet (>30% of daily energy intake) rose from 22.8% in 1989 to 66.6% in 1993. The middle-income class consuming a high-fat diet also rose (from 19.1% to 51.0%) (Reddy and Yusuf 1998). Data from the National Sample Survey of India show similar trends. As Figure 6.2 shows, average fat intake per person per day increased quite sharply from 1972–73 to 2004–05, even as daily per capita calorie intake fell. This means that the ratio of fat to calorie intake nearly doubled over the period.
The rise in obesity is closely connected to the rise in diabetes; many Asian countries now face epidemic levels of the disease. For instance, India and the PRC now have the largest absolute number of diabetics in the world (51 million and 43 million respectively) (Shaw et al. 2010). The incidence of diabetes in some Asian countries, such as Malaysia, Sri Lanka, and the Republic of Korea, is now as large as in the developed countries, such as the US, Germany, Canada, and Spain (Figure 6.3).
Table6.1Carbon Dioxide Emissions (1990and2004)
CountryTotal (million metric tons)
Annual change (%)
Share of world total (%)
Per capita (metric tons)
Annual change (%)
Carbon intensity of growth CO2 emissions per unit of GDP (metric tons of CO2 per
million, 2000 PPP $)1990 2004 1990–2004 1990 2004 1990 2004 1990–2004 1990 2004
Japan 1,071 1,257 1.2 4.7 4.3 8.7 9.9 1.0 0.37 0.36UnitedStates 4,818 6,046 1.8 21.2 20.9 19.3 20.6 0.5 0.68 0.56UnitedKingdom 579 587 0.1 2.6 2.0 10.0 9.8 -0.1 0.47 0.34Germany 980 808 -1.3 4.3 2.8 12.3 9.8 -1.5 0.58 0.38Korea,Republicof 241 465 6.6 1.1 1.6 5.6 9.7 5.2 0.57 0.51Malaysia 55 178 15.8 0.2 0.6 3.0 7.5 10.7 0.56 0.76RussianFederation 1,984 1,524 -1.9 8.8 5.3 13.4 10.6 -1.5 1.61 1.17Thailand 96 268 12.8 0.4 0.9 1.7 4.2 10.5 0.38 0.56China,People'sRepublicof 2,399 5,007 7.8 10.6 17.3 2.1 3.8 5.8 1.30 0.70Philippines 44 81 5.9 0.2 0.3 0.7 1 3.1 0.19 0.22SriLanka 4 12 14.8 ... ... 0.2 0.6 14.3 0.09 0.15VietNam 21 99 25.8 0.1 0.3 0.3 1.2 21.4 0.28 0.47Indonesia 214 378 5.5 0.9 1.3 1.2 1.7 3.0 0.54 0.53India 682 1,342 6.9 3 4.6 0.8 1.2 3.6 0.48 0.44Pakistan 68 126 6.0 0.3 0.4 0.6 0.8 2.4 0.39 0.41Bangladesh 15 37 10.1 0.1 0.1 0.1 0.3 14.3 0.12 0.15
Source: UNDPHuman Development Report 2007–08.
KI2010-Special-Chapter.indd 46 8/12/10 7:01 PM
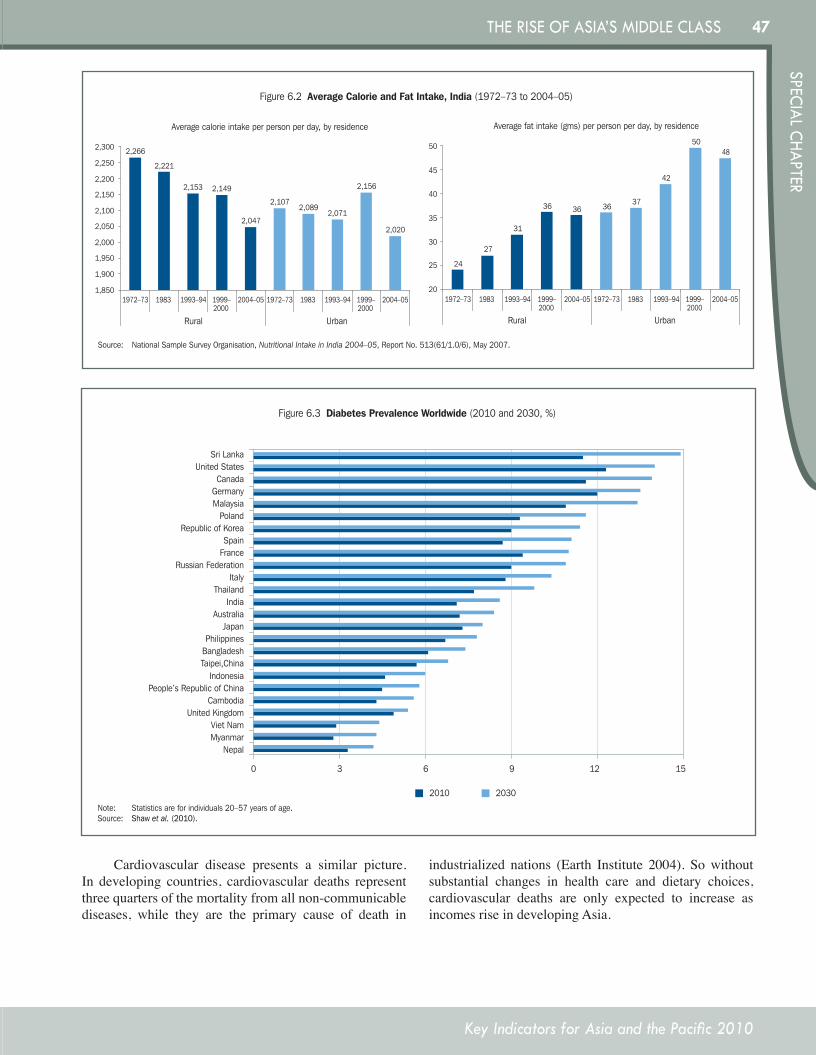
47
Key Indicators for Asia and the Pacific 2010
SPECIAL CHAPTERTHE RISE OF ASIA’S MIddLE CLASS
Cardiovascular disease presents a similar picture. In developing countries, cardiovascular deaths represent three quarters of the mortality from all non-communicable diseases, while they are the primary cause of death in
industrialized nations (Earth Institute 2004). So without substantial changes in health care and dietary choices, cardiovascular deaths are only expected to increase as incomes rise in developing Asia.
Source: National Sample Survey Organisation, Nutritional Intake in India 2004–05, Report No. 513(61/1.0/6), May 2007.
Figure 6.2 Average Calorie and Fat Intake, India (1972–73 to 2004–05)
Average calorie intake per person per day, by residence
2,266
2,221
2,153 2,149
2,047
2,1072,089
2,071
2,156
2,020
1,850
1,900
1,950
2,000
2,050
2,100
2,150
2,200
2,250
2,300
1972–73 1983 1993–94 1999–2000
2004–05 1972–73 1983 1993–94 1999–2000
2004–05
Rural Urban
Average fat intake (gms) per person per day, by residence
24
27
31
36 36 3637
42
5048
20
25
30
35
40
45
50
1972–73 1983 1993–94 1999–2000
2004–05 1972–73 1983 1993–94 1999–2000
2004–05
Rural Urban
Note: Statistics are for individuals 20–57 years of age.Source: Shaw et al. (2010).
Figure 6.3 Diabetes Prevalence Worldwide (2010 and 2030, %)
0 3 6 9 12 15
NepalMyanmarViet Nam
United KingdomCambodia
People’s Republic of ChinaIndonesia
Taipei,ChinaBangladeshPhilippines
JapanAustralia
IndiaThailand
ItalyRussian Federation
FranceSpain
Republic of KoreaPoland
MalaysiaGermanyCanada
United StatesSri Lanka
20302010
KI2010-Special-Chapter.indd 47 8/12/10 7:01 PM
48
Key Indicators for Asia and the Pacific 2010
THE RISE OF ASIA’S MIddLE CLASS
7. Conclusion
As rapid economic growth has reduced poverty across Asia, the middle class has grown rapidly in size and spending power. Depending upon the definition adopted, the middle class in Asia constitutes anywhere from 500 million to a billion or more people and accounts for more than $3 trillion in annual expenditures.
The rise of the Asian middle class has already hugely expanded markets for consumer goods in recent years. Sales of consumer durables such as refrigerators, televisions, mobile phones, and automobiles have expanded significantly in virtually all countries in the region. The PRC is now the world’s largest automobile market and India the fastest growing. The rise of the middle class has led to considerable frugal innovation among firms in Asia. Since the middle class in Asia is poorer—and so far spends much less—than the Western middle class, firms have had to develop affordable new products and services targeted to this group of consumers. This has spawned a great deal of innovation in such varied areas as consumer goods, personal care products, banking, insurance, health care products and services, and information technology among Asian firms. This innovation in turn boosted economic growth, setting off a virtuous cycle of growth, consumption, innovation, and more growth.
The bigger middle class has also generally translated into greater accountability and transparency in public services. The middle class is better educated, more aware of its rights and better organized than the poor, giving it a greater voice in demanding better government services. It is also the main source of social activists who typically found and operate non-governmental organizations that demand greater government accountability.
Yet much of the middle class remains extremely vulnerable to falling back into poverty. Thus, many of the same policies—fiscal discipline, sound monetary policies, and stable trade—that reduce poverty will also foster growth of the middle class. Reducing income inequality is potentially critical to the further development of the Asian middle class and unleashing its spending power. While there are a number of ways to reduce income inequality, such as through redistribution policies, Asia’s policymakers can focus on the expansion of economic opportunities for the vulnerable middle class. Our analysis of data from developing Asia and the historical experience of today’s developed countries has shown that one of the key factors driving the creation and sustenance of a middle class is the availability of stable, secure, well-paid jobs with good benefits.
By establishing extensive safety nets, policymakers can help to raise consumption spending of the middle-class in Asian countries, especially in countries such as the PRC, where there are historically high personal savings rates due to strong precautionary motives to save. Policies that contribute to and build upon education and entrepreneurship can leverage these characteristics of the middle class, stimulating the growth of good jobs, reinforcing the benefits of middle class expansion.
Even in the absence of specific policies to promote its growth, the Asian middle class is likely to expand significantly both in number and spending power over the next few decades just through population and economic growth. This will have profound economic and social implications—for global growth, innovation in emerging countries, accountability in public services, global climate change, and the spread of ‘diseases of affluence.’ While much of the existing literature has focused on measuring the size and characteristics of the Asian middle class, and expanding its size and spending power, it is also crucial to focus on the social and economic implications of its rise.
There are a number of unintended and potentially
adverse consequences. Carbon dioxide emissions have been increasing, reflecting the emulation of resource-intensive Western lifestyles by the Asian middle class. Likewise, with the adoption of high-fat diets and less active lifestyles, obesity levels have risen sharply. This has led to a surge in non-communicable, chronic diseases, such as diabetes, heart disease, and cancer, which previously were confined to the rich countries. Indeed, rates of cardiovascular disease are projected to increase two- to four-fold in several Asian countries over the next 2–3 decades. All indications are that in the next 20–30 years, Asia will be faced with an increasing number of chronic diseases on a scale previously unseen.
What this means is that much greater policy attention is needed on these emerging challenges. To be sure, sound policies need to be in place to ensure that the Asian middle class continues to grow, but it is even more important to have policies in place that plan for the sustainable growth of this middle class.
This much is clear—the Asian middle class will play an increasingly important role in the shift in the balance of global demand and change over the next few decades. Its rise may present many challenges, but it will also open up new and unprecedented opportunities for the region and for the world.
KI2010-Special-Chapter.indd 48 8/12/10 7:01 PM
49
Key Indicators for Asia and the Pacific 2010
SPECIAL CHAPTERTHE RISE OF ASIA’S MIddLE CLASS
References
Acemoglu, D. and F. Zilibotti. 1997. Was Prometheus Unbound by Chance? Journal of Political Economy 105(4): 709–51.
Adams, R. H. and J. Page. 2003. Poverty, Inequality and Growth in Selected Middle East and North Africa Countries, 1980–2000, World Development, vol. 31, No. 12, pp. 2027–2048.
Adelman, Irma and Cynthia Taft Morris. 1967. Society, Politics, and Economic Development: A Quantitative Approach. Baltimore: Johns Hopkins University Press, Baltimore.
Alesina, Alberto. 1994. Political Models of Macroeconomic Policy and Fiscal Reforms.
Alesina, A. and D. Rodrik. 1994. Distributive Politics and Economic Growth. Quarterly Journal of Economics 109(2): 465–490.
Almond, D. and L. Edlund. 2008. Son-Biased Sex Ratios in the 2000 United States Census. Proceedings of the National Academy of Sciences.
Asian Development Bank. 2004. Enhancing the Efficiency of Overseas Workers Remittance. Manila: ADB.
————. 2007. Key Indicators 2007: Inequality in Asia. ADB Publication. (www.adb.org/Documents/Books/Key Indicators/2007/default.asp).
————.. 2008. Asian Development Outlook. Hong Kong, China: Asian Development Bank.
————.. 2009. Asian Development Outlook. Rebalancing Asia’s Growth. Manila: ADB.
Banerjee, Abhijit 5. and Esther Duflo. 2008. What is Middle Class about the Middle Classes around the World? Journal of Economic Perspectives 22(2): 3–28.
Barro, R. J., and J-W. Lee. 2010. A New Data Set of Educational Attainment in the World, 1950–2010. NBER Working Paper No. 15902, National Bureau of Economic Research. Barro-Lee Educational Attainment Dataset. Available: www.barrolee.com/.
Basu, A. M. 1999. Fertility Decline and Increasing Gender Imbalance in India, including a Possible South Indian Turnaround. Development and Change 30(2): 237–63.
Bhandari, Laveesh. 2010. Neither Middling Nor Muddled: A Study of the Indian Middle Classes. Paper presented during the Workshop on Asia’s Middle Class held in ADB Headquarters, Manila, Philippines on 27–28 May.
Birdsall, Nancy. 2007. Reflections on the Macroeconomic Foundations of Inclusive Middle-Class Growth. Center for Global Development Working Paper 130, Washington DC, October.
————.. 2010. The (Indispensable) Middle Class in Developing Countries; or, the Rich and the Rest, Not the Poor and the Rest. Center for Global Development Working Paper 207, March.
Birdsall, Nancy, Carol Graham and Stefano Pettinato. 2000. Stuck in the Tunnel: Is Globalization Muddling the Middle Class? The Brookings Institution Center on Social and Economic Dynamics Working Paper No. 14, Washington DC.
Bledstein, Burton J. 1976. The Culture of Professionalism: The Middle Class and the Development of Higher Education in America. 1st ed. New York: Norton.
Borooah, V. K., and S. Iyer. 2005. Religion, Literacy, and the Female-to-Male Ratio in India. Economic and Political Weekly 40(5): 419–27.
Bourguignon, François. 2003. From income to endowments: The difficult task of expanding the income poverty paradigm. DELTA Working Papers 2003–03.
Business Week. 2010. Don’t Underestimate India’s Consumers. January 21.
Bussolo, M., R.D. Hoyos, D. Medvedev and D. Van der Mensbrugghe. 2007. Global Growth and Distribution: Are China and India Reshaping the World? World Bank Policy Research Working Paper 4392. Washington DC, November.
Bussolo, M.; R.D. Hoyos; and D. Medvedev. 2009. The Future of Global Income Inequality. In A. Estache and D. Leipziger, eds. Stuck in the Middle: Is Fiscal Policy Failing the Middle Class? Washington D.C.: Brookings Institution Press.
Canback-Dangel Global Income Distribution Database (GIDD). (www.cgidd.com).
Chakrabarti, Poulomi. 2009. What is driving the Indian middle class towards electoral politics? Evidence from Delhi. Working Paper Series of the Accountability Initiative. Center for Policy Research, New Delhi.
Chun, Natalie. 2010a. Middle Class Size in the Past, Present, and Future: A Descriptive Analysis of Distributional Trends and Projections. ERD Working Paper. Forthcoming. Asian Development Bank.
————.. 2010b. Evaluating Vulnerability to Poverty on Short Panel Data: An Application to Indonesia. Mimeo.
Chun, Natalie, Rana Hasan, and Mehemet Ulubulsgo. 2010. The Middle Class and Economic Development: Do Cross-Country Data Show? Paper presented during the Workshop on Asia’s Middle Class held in ADB Headquarters, Manila, Philippines on 27–28 May.
KI2010-Special-Chapter.indd 49 8/12/10 7:01 PM
50
Key Indicators for Asia and the Pacific 2010
THE RISE OF ASIA’S MIddLE CLASS
Croll, E. J. 2002. Fertility Decline, Family Size and Female Discrimination. A Study of Reproductive Management in East and South Asia. Asia-Pacific. Population Journal.
Dasgupta, M., and P. N. Mari Bhat. 1997. Fertility Decline and Increased Manifestation of Sex Bias in India. Population Studies 51(3):307–15.
Datt, G. 1998. Computational Tools for Poverty Measurement and Analysis, FCND Discussion Paper No. 50, International Food Policy Research Institute, World Bank.
Deolalikar, Anil, Rana Hasan and Rohini Somnathan. 2009. Public Goods Access and Juvenile Sex Ratios in Rural India: Evidence from the 1991 and 2001 Village Census Data. Asian Development Bank Economics Working Paper Series No. 167. Manila: Asian Development Bank.
Desmet, K., I. Ortuno-Ortin, and R. Wacziarg. 2009. The Political Economy of Ethnolinguistic Cleavages, NBER Working Paper 15360.
Doepke, M. and F. Zilibotti. 2005. Social Class and the Spirit of Capitalism. Journal of the European Economic Association 3(2–3): 516–524.
Doepke, M. and F. Zilibotti. 2008. Occupational Choice and the Spirit of Capitalism. Quarterly Journal of Economics 123(2): 747–793.
Drewnowski A. and B.M. Popkin. 1997. The Nutrition Transition: New Trends in The Global Diet. Nutrition Reviews 55(2): 31–43.
Dubuc, S. and D. Coleman. 2007. An Increase in the Sex Ratio of Births to India-Born Mothers in England and Wales: Evidence for Sex-Selective Abortion. Population and Development Review, 33(2): 383-400.
Earth Institute. 2004. A Race Against Time: The Challenge of Cardiovascular Disease in Developing Economies. Center for Global Health and Economic Development. Columbia University, New York.
Easterly, William. 2001. The Middle Class Consensus and Economic Development. Journal of Economic Growth 6(4): 317–335.
The Economist. 2010. Special Report on Innovation in Emerging Markets. The New Masters of Management. April 17–23.
Foster, A.D. and M.R. Rosenzweig. 2008. Economic Development and the Decline of Agricultural Employment. In T. P. Schultz and John Strauss, eds. Handbook of Development Economics, Vol. 4. Elsevier B.V.
Freeman, Richard B. and James L. Medoff. 1984. What Do Unions Do? New York, Basic Books.
Galor, Oded and Joseph Zeira. 1993. Income Distribution and Macroeconomics, Review of Economic Studies 60(1): 35–52.
Greenberg, Milton. 1997. The GI Bill: The Law That Changed America. Lickle Publishing. West Palm Beach, FL.
Ha, Joonkyung. 2010. Korea’s Middle Class and Its Role in the Growth Process. Paper presented during the Workshop on Asia’s Middle Class held in ADB Headquarters, Manila, Philippines on 27–28 May.
Haggard, Stephan and Steven Webb, eds. Voting for Reform: Democracy, Political Liberalization, and Economic Adjustment. New York: Oxford University Press.
Heston, Alan, Robert Summers and Bettina Aten. 2009. Penn World Table Version 6.3, Center for International Comparisons of Production, Income and Prices at the University of Pennsylvania. August 2009.
International Labour Organization. 2009. Facing the Global Crisis: Migrant Workers, a Population at Risk.
Jaffrelot, Christophe and Peter van der Veer. 2008. Patterns of Middle Class Consumption in India and China. Sage Publications. New Delhi.
Jha, P., R. Kumar, P. Vasa, N. Dhingra, D. Thiruchelvam, and R. Moineddin. 2006. Low Male-To-Female Sex Ratio of Children Born in India: National Survey of 1.1 Million Households. The Lancet 367: 211–8.
Kaufmann, D., Kraay, A. and M. Mastruzzi. 2009. Governance Matters: Aggregate and Individual Governance Indicators 1996-2008. Working Paper No. 4978. World Bank Policy Research Department.
Kharas, Homi. 2010. The Emerging Middle Class in Developing Countries, Working Paper No. 285. Paris: OECD Development Centre Paris.
Kharas, Homi and Geoffrey Gertz. 2010. The New Global Middle Class: A Cross-Over from West to East. In Cheng Li, ed. China’s Emerging Middle Class: Beyond Economic Transformation, Washington, DC: Brookings Institution Press (forthcoming).
Khor, Niny and John Pencavel. 2006. Income Mobility of Individuals in China and the United States, Economics of Transition, 14 (3): 417–458
Khor, Niny and John Pencavel. 2010. Evolution of Income Mobility in the People’s Republic of China: 1991–2002. ADB Economics Working Paper Series 204. Asian Development Bank.
Krugman, Paul. The Renminbi Runaround, New York Times, 25 June 2010, page A31
KI2010-Special-Chapter.indd 50 8/12/10 7:01 PM
51
Key Indicators for Asia and the Pacific 2010
SPECIAL CHAPTERTHE RISE OF ASIA’S MIddLE CLASS
Kyvig, David E. 2004. Daily Life in the United States, 1920-40. Ivan R. Dee: Chicago.
Landes, David. 1998. The Wealth and Poverty of Nations. Norton (New York, NY).
Lang T. 1997. The public health impact of globalisation of food trade. In Shetty PS, McPherson K, eds. Diet, Nutrition and Chronic Disease: Lessons From Contrasting Worlds. Chichester, UK: Wiley. 173–187.
Liu, Tao and Xing-yi Zhang. 2009. Ratio of males to females in China. British Medical Journal Vol. 338, 18 April: 899–900.
Marsden, Lani. 2009. Does the Middle Class Call for Government Accountability? The Progressive Era American Middle Class versus the New Chinese Middle Class. SAIS China Studies Working Paper Series. Johns Hopkins University. Baltimore, MD.
McCarthy, Patrick E. 1975. Higher Education: Expansion without Growth. Daedalus, 104 (1): 78–86.
Murphy, Kevin M., Andrei Shleifer and Robert Vishny. 1989. Income Distribution, Market Size, and Industrialization. The Quarterly Journal of Economics 104 (3): 537–564.
Nair, Vipin. 8 Jan 2010. Bloomberg News.New York Times. 2010. China Fears Consumer Impact on
Global Warming, Published on 4 July. Page A1.Nystedt, D. 2010. China Nears 800 Million Mobile Phone
Subscribers. PCWorld Business Center. 29 June.Park, C. B. 1983. Preference for Sons, Family Size, and
Sex Ratio: An Empirical Study for Korea. Demography 20(3): 333–52.
Park, C. B. and N-H Cho. 1995. Consequences of Son Preference in a Low-Fertility Society: Imbalance of the Sex Ratio at Birth in Korea. Population and Development Review 21(1): 59–84.
Pernia, E. 2008. Migration, Remittances, Poverty and Inequality in the Philippines. UP School of Economics Discussion Paper No. 2008–01, University of the Philippines, Quezon City.
Prahalad, C.K. 2005. The Fortune at the Bottom of the Pyramid: Eradicating Poverty Through Profits. Upper Saddle River, NJ: Wharton School Publishing.
Ravallion, Martin. 2003. Measuring Aggregate Economic Welfare in Developing Countries: How Well do National Accounts and Surveys Agree? Review of Economics and Statistics, 85: 645–652
Ravallion, Martin. 2009. The Developing World’s Bulging (but Vulnerable) Middle Class. World Development 38(4): 445–454.
Ravallion, Martin, Shaohua Chen and Prem Sangraula, 2008, Dollar a Day Revisited, Policy Research Working Paper 4620. Washington DC, World Bank.
Reddy, K. Srinath and Salim Yusuf. 1998. Emerging Epidemic of Cardiovascular Disease in Developing Countries, Circulation, vol. 97: 596–601.
Reddy, Srinath K. 2002. Cardiovascular diseases in the developing countries: dimensions, determinants, dynamics and directions for public health action. Public Health Nutrition 5(1A): 231-237.Riskin, Carl, Zhao Renwei, and Li Shi. Chinese Household Income Project, 1995 [Computer file]. ICPSR03012-v1. Ann Arbor, MI: Inter-university Consortium for Political and Social Research [distributor], 2009-02-25. doi:10.3886/ICPSR03012
Roland-Holst, David, Guntur Surigayato. 2010. Asian Regional Income Growth and Distribution to 2030. Paper presented during the Workshop on Asia’s Middle Class held in ADB Headquarters, Manila, Philippines on 27-28 May.
Sachs, Jeffrey D., and Andrew Warner. 1995. Economic Reform and the Process of Global Integration. Brookings Papers on Economic Activity 1:1–118.
Sen, A.K. 1990. More Than 100 Million Women are Missing. The New York Review of Books 37(20), December.
Shaban. 2008. Water Poverty in Urban India: A Study of Major Cities. Seminar Paper UGC-Summer Programme. 30 June – 19 July.
Shaw, J.E. R.A. Sicree, P.Z. Zimmet. 2010. Global estimates of the prevalence of diabetes for 2010 and 2030. Diabetes Research and Clinical Practice 87: 4–14.
Shi, Li. Chinese Household Income Project, 2002 [Computer file]. ICPSR21741-v1. Ann Arbor, MI: Inter-university Consortium for Political and Social Research [distributor], 2009-08-14. doi:10.3886/ICPSR21741
Shorrocks, A. and G. Wan. 2004. A Simple Method for Generating Income Data from Lorenz Coordinates. Mimeo. World Institute for Development Economics Research, United Nations University: Helsinki, Finland.
Sridharan, E. 2004. The Growth and Sectoral Composition of India’s Middle Class: Its Impact on the Politics of Economic Liberalization. India Review 3(4): 405–428.
Suddath, Claire. 2009. A Brief History of the Middle Class. Time. Feb. 27.
Time Asia. 2004. Asia’s War with Heart Disease. 3 May.United Nations University World Institute for Development
Economics Research (UNU-WIDER). World Income Inequality Database v2.0c May 2008. (http://www.wider.unu.edu/research/Database/en_GB/database/)
KI2010-Special-Chapter.indd 51 8/12/10 7:01 PM
52
Key Indicators for Asia and the Pacific 2010
THE RISE OF ASIA’S MIddLE CLASS
Wacziarg, Romain, and Karen Horn Welch. 2003. Trade Liberalization and Growth: New Evidence. NBER Working Paper 10152. Cambridge, Mass.: National Bureau of Economic Research
Wall Street Journal. 2010. India Car Sales Rise 39%. Nikhil Gulati and Santanu Choudhury. Published 10 May.
Wei, S. and X Zhang. 2009. The competitive saving motive: evidence from rising sex ratios and saving rates in China, NBER Working Paper, No 15093, Cambridge.
Wilson, Reginald. 1995. The G.I. Bill and the transformation of America. National Forum, Fall 1995.
World Bank. 2001. Philippines: Filipino Report Card on Pro-Poor Services. Report No. 22181-PH. Washington, DC.
World Bank. 2004. World Development Report 2004: Making Services Work for the Poor. New York: Oxford University Press.
World Bank. 2006. Global Economic Prospects 2006: Economic Implications of Remittances and Migration. The International Bank for Reconstruction and Development / The World Bank, Washington, DC.
World Bank. World Governance Indicators Online Database. (http://info.worldbank.org/governance/wgi/sc_country.asp).
World Bank. World Development Indicators Online Database. (http://databank.worldbank.org/ddp/home.do?Step=12&id=4&CNO=2).
World Bank. PovcalNet Online Poverty Analysis Tool. (http://web.worldbank.org/WBSITE/EXTERNAL/EXTDEC/EXTRESEARCH/EXTPROGRAMS/EXTPOVRES/EXTPOVCALNET/0,,contentMDK:21867101~pagePK:64168427~piPK:64168435~print:Y~theSitePK:5280443,00.html).
WORLD VALUES SURVEY 1981–2008 OFFICIAL AGGREGATE v.20090901, 2009. World Values Survey Association (www.worldvaluessurvey.org). Aggregate File Producer: ASEP/JDS, Madrid.
Zhang, Yuan, Guanghua Wan, and Niny Khor. 2010. Poverty Reduction and the Rise of Middle Class in China. Paper presented during the Workshop on Asia’s Middle Class held in ADB Headquarters, Manila, Philippines on 27–28 May.
KI2010-Special-Chapter.indd 52 8/12/10 7:01 PM
53
Key Indicators for Asia and the Pacific 2010
SPECIAL CHAPTERTHE RISE OF ASIA’S MIddLE CLASS
Appendix1:DataSourcesforEstimatingtheSizeoftheAsianMiddleClass,1990–2008
A variety of data sources were used to create the distributions and determine the size of the middle class. For developing countries, the primary source for the distribution data was obtained from the World Bank's PovcalNet database, which provides detailed distributions of either income or household consumption expenditures by different percentiles based on actual household survey data. In addition, it provides the survey means for household per capita income or consumption in 2005 PPP dollars. The database primarily provides distributions based on consumption except in the instances in which only income measures exist. At lower income levels, the difference between consumption and income is small. But these tend to grow with wealth and thus should be considered a potential measurement error in the analysis. Still we expect that these differences are relatively minor as there is a high correlation between income and consumption especially at lower levels and thus should have little effect on overall computations. We also focus on consumption as it better captures individual welfare and is less prone to fluctuations caused by negative and positive shocks.
The tabulated distributions and means allow us to back out the entire (smoothed) income distribution based on the methodology outlined in ADB Inequality in Asia (2007) and Datt (1998), drawing upon parameterizations of Lorenz curves based on tabulated distribution data. While a method discussed in Shorrocks and Wan (2004) may better approximate the true distribution, it is shown to only marginally underestimate the effect, such that altering the methodology is likely to leave the percentage sizes in different income/expenditures brackets relatively unchanged.
For OECD and high-income countries in Asia, we use decile and quantile distributions compiled by the United Nations University – World Institute for Development Economics Research (UNU-WIDER) World Income Inequality Database (WIID), Version 2.0c, May 2008. As the quality of the data was suspect and more difficult to compare across time, attention was limited to the distributional data designated as top quality (quality = 1) and that represented gross income or expenditures. However, the data quality restriction was relaxed for the Republic of Korea, Singapore, Japan, and Taipei,China. In general, most of the data for the OECD countries was income-based rather than expenditure-based. In all cases, if the median household per capita income or expenditures of the survey was reported, this value was used; otherwise, the mean of the survey was used in deriving the distribution. In cases where neither the median of the survey nor the
mean of the survey were reported in the database, the ratio of survey mean to national account mean was taken and then interpolated or extrapolated based on years in which both existed. This interpolated or extrapolated ratio was then used to back out the survey mean for the missing year based on the reported national account means. These survey means were then converted into 2005 PPP's using reported PPP values obtained from the Penn World Tables database 6.3 developed by the International Comparison of Prices Program (ICP).
The use of national accounts household per capita consumption means was also employed as these means tend to differ substantially from the survey means, particularly in Asia. These national accounts means were obtained from the World Development Indicators database (WDI) using the national account means with the survey distributions to derive alternative measures of middle class size. For Taipei,China we used the distribution data provided by WDI where the WIID data did not at least report quantile distributions.
The regional comparisons and direct country comparisons reported in this chapter were created by developing common reference years at three year intervals from 1990 to 2008 that coincide with those reported by the World Bank's PovcalNet database. These common reference years were assigned the closest available survey for each country within a region to the common reference year, limiting inclusion of countries into the regional aggregates based on whether there were are at least two distinct years of survey data within the time frame 1985–2008. The assumption is that the closest available survey year was a fairly close approximate of the distribution of the common reference year. Thus, all regional aggregates have the same set of countries for each common reference year from 1990 to 2008. The additional requirement was that all countries included in this set had at least two years of valid national accounts data for the common reference years and the survey years. This allowed us to transform the survey mean to the common reference year by assuming that the survey mean increased or decreased in the same proportion as the change in the national accounts mean. That is, we assumed that there was no differential change in the relationship between the survey mean and the common reference years between these two years. In cases where the survey mean or national accounts mean was missing for a particular year we backed out the survey mean or national accounts means by interpolating or extrapolating the data. The survey means were then adjusted to the common reference year using 2005 PPPs and deflated or inflated using consumer price indices (CPI) from WDI using 2005 CPIs as the base reference year. In instances where urban and rural measures were reported separately,
KI2010-Special-Chapter.indd 53 8/12/10 7:01 PM
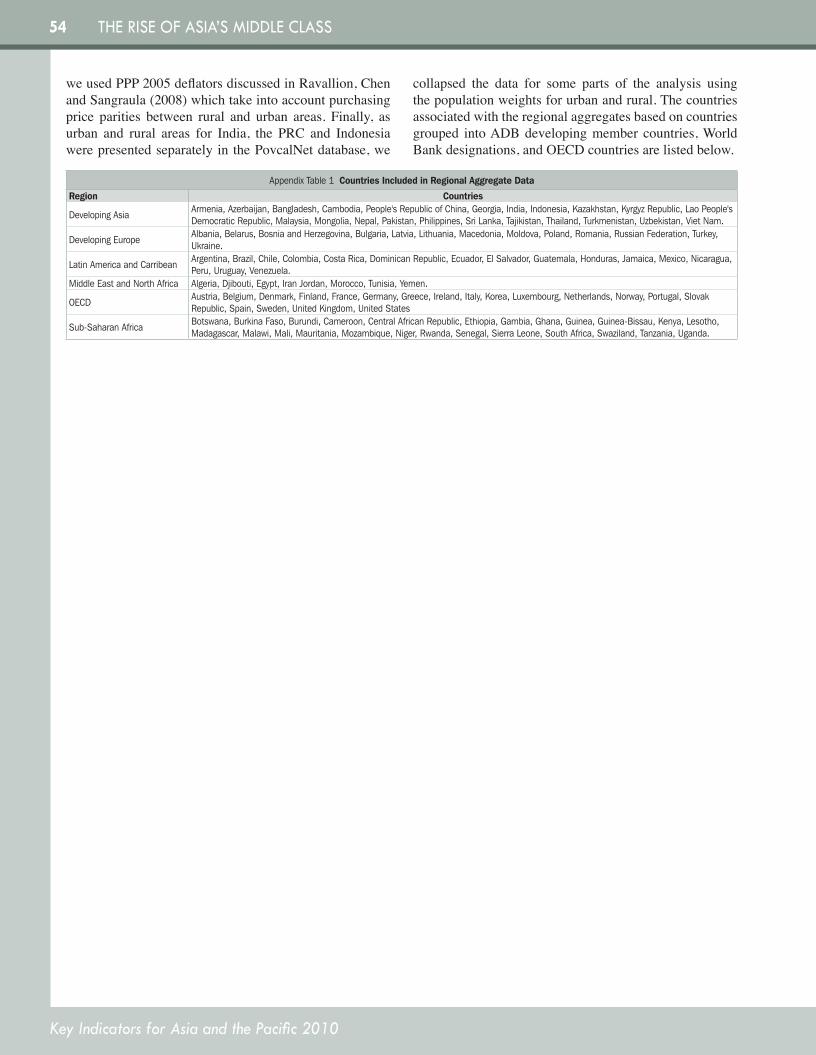
54
Key Indicators for Asia and the Pacific 2010
THE RISE OF ASIA’S MIddLE CLASS
we used PPP 2005 deflators discussed in Ravallion, Chen and Sangraula (2008) which take into account purchasing price parities between rural and urban areas. Finally, as urban and rural areas for India, the PRC and Indonesia were presented separately in the PovcalNet database, we
collapsed the data for some parts of the analysis using the population weights for urban and rural. The countries associated with the regional aggregates based on countries grouped into ADB developing member countries, World Bank designations, and OECD countries are listed below.
AppendixTable1Countries Included in Regional Aggregate Data
Region Countries
DevelopingAsia Armenia,Azerbaijan,Bangladesh,Cambodia,People'sRepublicofChina,Georgia,India,Indonesia,Kazakhstan,KyrgyzRepublic,LaoPeople'sDemocraticRepublic,Malaysia,Mongolia,Nepal,Pakistan,Philippines,SriLanka,Tajikistan,Thailand,Turkmenistan,Uzbekistan,VietNam.
DevelopingEurope Albania,Belarus,BosniaandHerzegovina,Bulgaria,Latvia,Lithuania,Macedonia,Moldova,Poland,Romania,RussianFederation,Turkey,Ukraine.
LatinAmericaandCarribean Argentina,Brazil,Chile,Colombia,CostaRica,DominicanRepublic,Ecuador,ElSalvador,Guatemala,Honduras,Jamaica,Mexico,Nicaragua,Peru,Uruguay,Venezuela.
MiddleEastandNorthAfrica Algeria,Djibouti,Egypt,IranJordan,Morocco,Tunisia,Yemen.
OECD Austria,Belgium,Denmark,Finland,France,Germany,Greece,Ireland,Italy,Korea,Luxembourg,Netherlands,Norway,Portugal,SlovakRepublic,Spain,Sweden,UnitedKingdom,UnitedStates
Sub-SaharanAfrica Botswana,BurkinaFaso,Burundi,Cameroon,CentralAfricanRepublic,Ethiopia,Gambia,Ghana,Guinea,Guinea-Bissau,Kenya,Lesotho,Madagascar,Malawi,Mali,Mauritania,Mozambique,Niger,Rwanda,Senegal,SierraLeone,SouthAfrica,Swaziland,Tanzania,Uganda.
KI2010-Special-Chapter.indd 54 8/12/10 7:01 PM
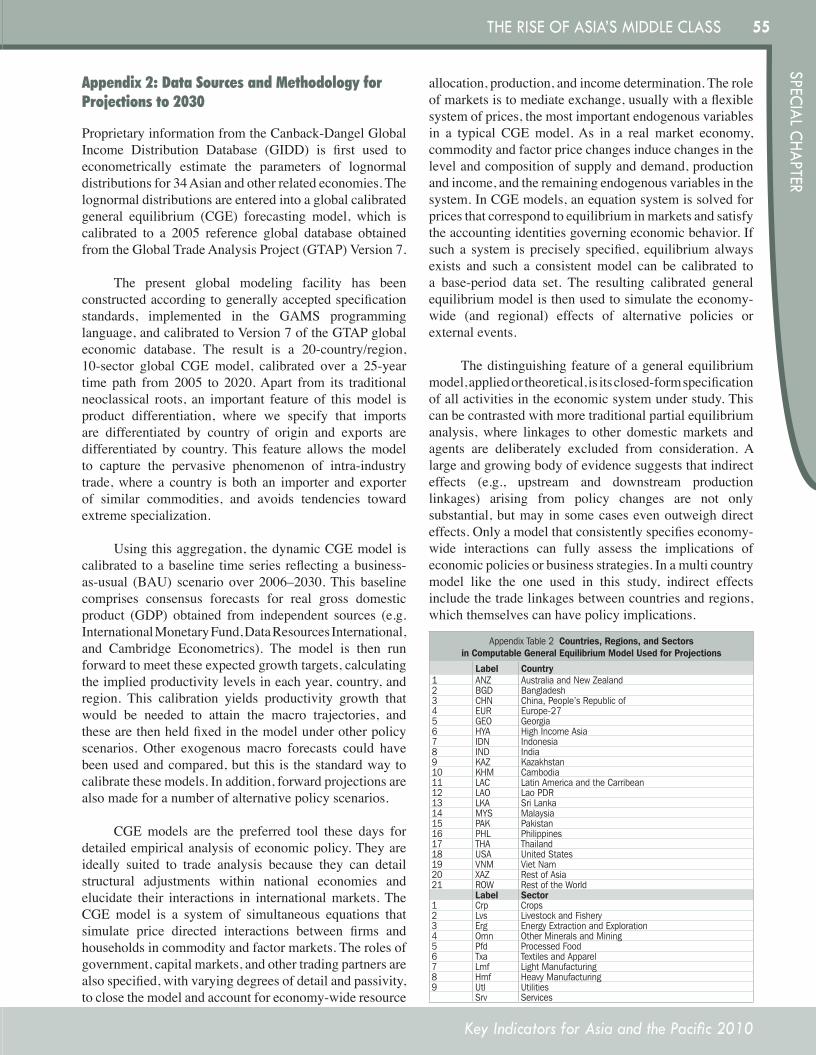
55
Key Indicators for Asia and the Pacific 2010
SPECIAL CHAPTERTHE RISE OF ASIA’S MIddLE CLASS
Appendix2:DataSourcesandMethodologyforProjectionsto2030
Proprietary information from the Canback-Dangel Global Income Distribution Database (GIDD) is first used to econometrically estimate the parameters of lognormal distributions for 34 Asian and other related economies. The lognormal distributions are entered into a global calibrated general equilibrium (CGE) forecasting model, which is calibrated to a 2005 reference global database obtained from the Global Trade Analysis Project (GTAP) Version 7.
The present global modeling facility has been constructed according to generally accepted specification standards, implemented in the GAMS programming language, and calibrated to Version 7 of the GTAP global economic database. The result is a 20-country/region, 10-sector global CGE model, calibrated over a 25-year time path from 2005 to 2020. Apart from its traditional neoclassical roots, an important feature of this model is product differentiation, where we specify that imports are differentiated by country of origin and exports are differentiated by country. This feature allows the model to capture the pervasive phenomenon of intra-industry trade, where a country is both an importer and exporter of similar commodities, and avoids tendencies toward extreme specialization.
Using this aggregation, the dynamic CGE model is calibrated to a baseline time series reflecting a business-as-usual (BAU) scenario over 2006–2030. This baseline comprises consensus forecasts for real gross domestic product (GDP) obtained from independent sources (e.g. International Monetary Fund, Data Resources International, and Cambridge Econometrics). The model is then run forward to meet these expected growth targets, calculating the implied productivity levels in each year, country, and region. This calibration yields productivity growth that would be needed to attain the macro trajectories, and these are then held fixed in the model under other policy scenarios. Other exogenous macro forecasts could have been used and compared, but this is the standard way to calibrate these models. In addition, forward projections are also made for a number of alternative policy scenarios.
CGE models are the preferred tool these days for detailed empirical analysis of economic policy. They are ideally suited to trade analysis because they can detail structural adjustments within national economies and elucidate their interactions in international markets. The CGE model is a system of simultaneous equations that simulate price directed interactions between firms and households in commodity and factor markets. The roles of government, capital markets, and other trading partners are also specified, with varying degrees of detail and passivity, to close the model and account for economy-wide resource
allocation, production, and income determination. The role of markets is to mediate exchange, usually with a flexible system of prices, the most important endogenous variables in a typical CGE model. As in a real market economy, commodity and factor price changes induce changes in the level and composition of supply and demand, production and income, and the remaining endogenous variables in the system. In CGE models, an equation system is solved for prices that correspond to equilibrium in markets and satisfy the accounting identities governing economic behavior. If such a system is precisely specified, equilibrium always exists and such a consistent model can be calibrated to a base-period data set. The resulting calibrated general equilibrium model is then used to simulate the economy-wide (and regional) effects of alternative policies or external events.
The distinguishing feature of a general equilibrium
model, applied or theoretical, is its closed-form specification of all activities in the economic system under study. This can be contrasted with more traditional partial equilibrium analysis, where linkages to other domestic markets and agents are deliberately excluded from consideration. A large and growing body of evidence suggests that indirect effects (e.g., upstream and downstream production linkages) arising from policy changes are not only substantial, but may in some cases even outweigh direct effects. Only a model that consistently specifies economy-wide interactions can fully assess the implications of economic policies or business strategies. In a multi country model like the one used in this study, indirect effects include the trade linkages between countries and regions, which themselves can have policy implications.
AppendixTable2Countries, Regions, and Sectorsin Computable General Equilibrium Model Used for Projections
Label Country1 ANZ AustraliaandNewZealand2 BGD Bangladesh3 CHN China,People’sRepublicof4 EUR Europe-275 GEO Georgia6 HYA HighIncomeAsia7 IDN Indonesia8 IND India9 KAZ Kazakhstan10 KHM Cambodia11 LAC LatinAmericaandtheCarribean12 LAO LaoPDR13 LKA SriLanka14 MYS Malaysia15 PAK Pakistan16 PHL Philippines17 THA Thailand18 USA UnitedStates19 VNM VietNam20 XAZ RestofAsia21 ROW RestoftheWorld
Label Sector1 Crp Crops2 Lvs LivestockandFishery3 Erg EnergyExtractionandExploration4 Omn OtherMineralsandMining5 Pfd ProcessedFood6 Txa TextilesandApparel7 Lmf LightManufacturing8 Hmf HeavyManufacturing9 Utl Utilities
Srv Services
KI2010-Special-Chapter.indd 55 8/12/10 7:01 PM
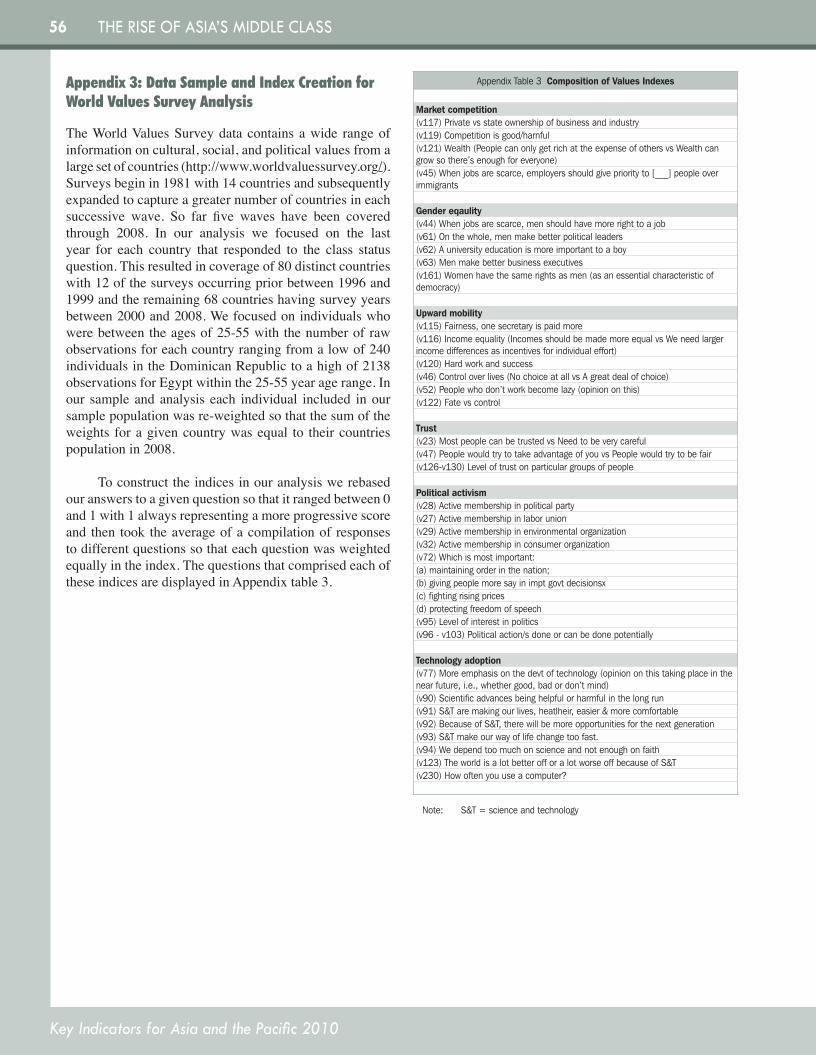
56
Key Indicators for Asia and the Pacific 2010
THE RISE OF ASIA’S MIddLE CLASS
Appendix3:DataSampleandIndexCreationforWorldValuesSurveyAnalysis
The World Values Survey data contains a wide range of information on cultural, social, and political values from a large set of countries (http://www.worldvaluessurvey.org/). Surveys begin in 1981 with 14 countries and subsequently expanded to capture a greater number of countries in each successive wave. So far five waves have been covered through 2008. In our analysis we focused on the last year for each country that responded to the class status question. This resulted in coverage of 80 distinct countries with 12 of the surveys occurring prior between 1996 and 1999 and the remaining 68 countries having survey years between 2000 and 2008. We focused on individuals who were between the ages of 25-55 with the number of raw observations for each country ranging from a low of 240 individuals in the Dominican Republic to a high of 2138 observations for Egypt within the 25-55 year age range. In our sample and analysis each individual included in our sample population was re-weighted so that the sum of the weights for a given country was equal to their countries population in 2008.
To construct the indices in our analysis we rebased our answers to a given question so that it ranged between 0 and 1 with 1 always representing a more progressive score and then took the average of a compilation of responses to different questions so that each question was weighted equally in the index. The questions that comprised each of these indices are displayed in Appendix table 3.
AppendixTable3Composition of Values Indexes
Market competition(v117)Privatevsstateownershipofbusinessandindustry(v119)Competitionisgood/harnful(v121)Wealth(PeoplecanonlygetrichattheexpenseofothersvsWealthcangrowsothere’senoughforeveryone)(v45)Whenjobsarescarce,employersshouldgivepriorityto[___]peopleoverimmigrants
Gender eqaulity(v44)Whenjobsarescarce,menshouldhavemorerighttoajob(v61)Onthewhole,menmakebetterpoliticalleaders(v62)Auniversityeducationismoreimportanttoaboy(v63)Menmakebetterbusinessexecutives(v161)Womenhavethesamerightsasmen(asanessentialcharacteristicofdemocracy)
Upward mobility(v115)Fairness,onesecretaryispaidmore(v116)Incomeequality(IncomesshouldbemademoreequalvsWeneedlargerincomedifferencesasincentivesforindividualeffort)(v120)Hardworkandsuccess(v46)Controloverlives(NochoiceatallvsAgreatdealofchoice)(v52)Peoplewhodon’tworkbecomelazy(opiniononthis)(v122)Fatevscontrol
Trust(v23)MostpeoplecanbetrustedvsNeedtobeverycareful(v47)PeoplewouldtrytotakeadvantageofyouvsPeoplewouldtrytobefair(v126-v130)Leveloftrustonparticulargroupsofpeople
Political activism(v28)Activemembershipinpoliticalparty(v27)Activemembershipinlaborunion(v29)Activemembershipinenvironmentalorganization(v32)Activemembershipinconsumerorganization(v72)Whichismostimportant:(a)maintainingorderinthenation;(b)givingpeoplemoresayinimptgovtdecisionsx(c)fightingrisingprices(d)protectingfreedomofspeech(v95)Levelofinterestinpolitics(v96-v103)Politicalaction/sdoneorcanbedonepotentially
Technology adoption(v77)Moreemphasisonthedevtoftechnology(opiniononthistakingplaceinthenearfuture,i.e.,whethergood,badordon’tmind)(v90)Scientificadvancesbeinghelpfulorharmfulinthelongrun(v91)S&Taremakingourlives,heatlheir,easier&morecomfortable(v92)BecauseofS&T,therewillbemoreopportunitiesforthenextgeneration(v93)S&Tmakeourwayoflifechangetoofast.(v94)Wedependtoomuchonscienceandnotenoughonfaith(v123)TheworldisalotbetterofforalotworseoffbecauseofS&T(v230)Howoftenyouuseacomputer?
Note: S&T=scienceandtechnology
KI2010-Special-Chapter.indd 56 8/12/10 7:01 PM
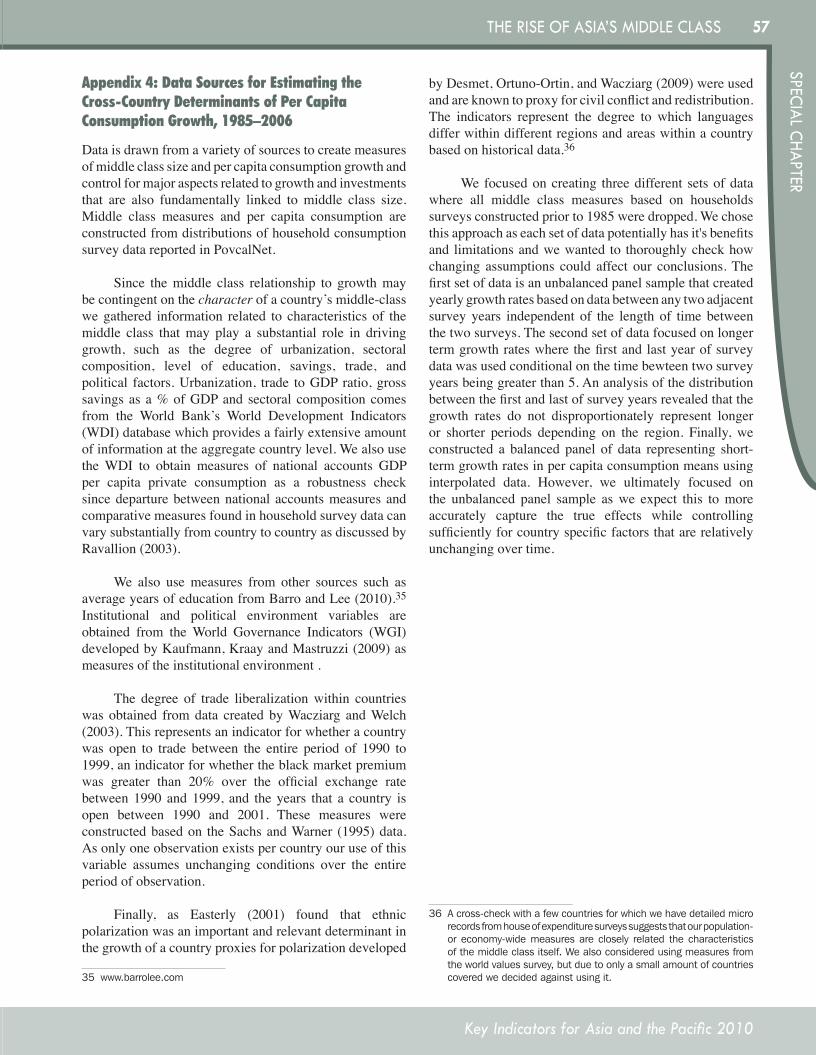
57
Key Indicators for Asia and the Pacific 2010
SPECIAL CHAPTERTHE RISE OF ASIA’S MIddLE CLASS
Appendix4:DataSourcesforEstimatingtheCross-CountryDeterminantsofPerCapitaConsumptionGrowth,1985–2006
Data is drawn from a variety of sources to create measures of middle class size and per capita consumption growth and control for major aspects related to growth and investments that are also fundamentally linked to middle class size. Middle class measures and per capita consumption are constructed from distributions of household consumption survey data reported in PovcalNet.
Since the middle class relationship to growth may be contingent on the character of a country’s middle-class we gathered information related to characteristics of the middle class that may play a substantial role in driving growth, such as the degree of urbanization, sectoral composition, level of education, savings, trade, and political factors. Urbanization, trade to GDP ratio, gross savings as a % of GDP and sectoral composition comes from the World Bank’s World Development Indicators (WDI) database which provides a fairly extensive amount of information at the aggregate country level. We also use the WDI to obtain measures of national accounts GDP per capita private consumption as a robustness check since departure between national accounts measures and comparative measures found in household survey data can vary substantially from country to country as discussed by Ravallion (2003).
We also use measures from other sources such as average years of education from Barro and Lee (2010).35 Institutional and political environment variables are obtained from the World Governance Indicators (WGI) developed by Kaufmann, Kraay and Mastruzzi (2009) as measures of the institutional environment .
The degree of trade liberalization within countries
was obtained from data created by Wacziarg and Welch (2003). This represents an indicator for whether a country was open to trade between the entire period of 1990 to 1999, an indicator for whether the black market premium was greater than 20% over the official exchange rate between 1990 and 1999, and the years that a country is open between 1990 and 2001. These measures were constructed based on the Sachs and Warner (1995) data. As only one observation exists per country our use of this variable assumes unchanging conditions over the entire period of observation.
Finally, as Easterly (2001) found that ethnic polarization was an important and relevant determinant in the growth of a country proxies for polarization developed
35 www.barrolee.com
by Desmet, Ortuno-Ortin, and Wacziarg (2009) were used and are known to proxy for civil conflict and redistribution. The indicators represent the degree to which languages differ within different regions and areas within a country based on historical data.36
We focused on creating three different sets of data where all middle class measures based on households surveys constructed prior to 1985 were dropped. We chose this approach as each set of data potentially has it's benefits and limitations and we wanted to thoroughly check how changing assumptions could affect our conclusions. The first set of data is an unbalanced panel sample that created yearly growth rates based on data between any two adjacent survey years independent of the length of time between the two surveys. The second set of data focused on longer term growth rates where the first and last year of survey data was used conditional on the time bewteen two survey years being greater than 5. An analysis of the distribution between the first and last of survey years revealed that the growth rates do not disproportionately represent longer or shorter periods depending on the region. Finally, we constructed a balanced panel of data representing short-term growth rates in per capita consumption means using interpolated data. However, we ultimately focused on the unbalanced panel sample as we expect this to more accurately capture the true effects while controlling sufficiently for country specific factors that are relatively unchanging over time.
36 Across-checkwithafewcountriesforwhichwehavedetailedmicrorecordsfromhouseofexpendituresurveyssuggeststhatourpopulation-or economy-widemeasuresare closely related the characteristicsofthemiddleclassitself.Wealsoconsideredusingmeasuresfromtheworldvaluessurvey,butduetoonlyasmallamountofcountriescoveredwedecidedagainstusingit.
KI2010-Special-Chapter.indd 57 8/12/10 7:01 PM