Embed Size (px)
Citation preview
1
Office of Tax Analysis
Working Paper 114
January 2017
The Rise of Alternative Work Arrangements: Evidence and
Implications for Tax Filing and Benefit Coverage
Emilie Jackson, Adam Looney, and Shanthi Ramnath
The OTA Working Papers Series presents original research by the staff of the Office of Tax Analysis.
These papers are intended to generate discussion and critical comment while informing and improving
the quality of the analysis conducted by the Office. The papers are works in progress and subject to
revision. Views and opinions expressed are those of the authors and do not necessarily represent official
Treasury positions or policy. Comments are welcome, as are suggestions for improvements, and should
be directed to the authors. OTA Working Papers may be quoted without additional permission.
2
THE RISE OF ALTERNATIVE WORK ARRANGEMENTS: EVIDENCE AND
IMPLICATIONS FOR TAX FILING AND BENEFIT COVERAGE
January 2017
Emilie Jackson1, Adam Looney
2, and Shanthi Ramnath
3
Keywords: Alternative work arrangements, employee benefits
JEL Codes: H2, J2, J3, C8
1 Emilie Jackson: U.S. Department of the Treasury and Stanford University, [email protected].
2 Adam Looney: Office of Tax Analysis, U.S. Department of the Treasury, [email protected].
3 Shanthi Ramnath: Office of Tax Analysis, U.S. Department of the Treasury, [email protected].
3
Executive Summary
A growing number of American workers earn income outside of traditional employee-employer
relationships through self-employment and business ownership. In 2014, 24.9 million individuals filed
returns reporting the operation of a nonfarm sole proprietorship and 16.8 million earned a profit (and
paid self-employment tax) from those activities, representing a 34 percent and 32 percent increase,
respectively, from their levels in 2001.4 The almost 17 million self-employed workers represented
12 percent of all tax filers with earnings.5 While self-employment offers certain advantages, as workers
shift away from traditional work arrangements many will no longer receive important employee
benefits, labor protections, and tax benefits that operate through the employee-employer relationship.6
Hence, understanding the implications of the changing U.S. workforce is an important step towards
improving labor and tax policies.
This paper draws on administrative tax records to provide a more complete picture of the self-employed,
including how they differ from employees (which we define as workers receiving wages reported on
Form W2) and how their numbers have increased over time. Administrative data provides new
information that can help address certain shortcomings of survey-based measures, which appear to
underestimate self-employment activity (Katz and Krueger 2016; Abraham et al. 2016). In particular, the
large samples and ability to link multiple pieces of information in administrative records allow for a
detailed examination of demographic and economic characteristics of self-employed individuals, how
their share of the workforce has changed over time, and the implications of that change for tax filing
behavior and benefit coverage.
Self-employed individuals engage in a wide variety of economic activities ranging from operating
businesses like restaurants, law offices, or partnerships; providing contract or consulting labor; earning
platform-based or “gig economy” income; to house cleaning and babysitting services. Many earn
income from both wages and self-employment. To understand how the characteristics and activities of
the self-employed have changed over time, we provide a simplified categorization of individuals with
self-employment earnings based on the source of those earnings, whether the self-employment earnings
is a primary or secondary source of earnings, and whether the individual engages in a substantial amount
4 We exclude dependent filers from these counts.
5 Also, 11.8 percent of individuals with SSA earnings reported at least some SE earnings.
6 These benefits include, though are not limited to, health insurance and retirement coverage, tax compliance and
administration, and protections under labor, occupational safety, and discrimination laws.
4
of business-related activities.7 Using these criteria, we identify selected groups of filers with similar
characteristics, such as “small business owner” (individuals with more than a de minimus level of
business-related expenses and business income but less than $10 million of either), “contractor,”
“household worker”, or even “misclassified employee” (for individuals with few business-related
activities whose earnings is largely from labor income), or “gig economy worker” (individuals whose
income is associated with online platforms or service providers).
Looking at trends over time, we find that essentially all of the increase in self-employment is due to
increases in sole proprietors who have little or no business-related deductions, and who therefore appear
to almost exclusively provide labor services (i.e. the contractors or misclassified workers). In contrast,
the share of filers that were small business owners was essentially unchanged.
These trends have important implications for the income, health insurance coverage, and retirement
security of self-employed workers. In 2014, individuals who earned a significant share of their earnings
from self-employment, which we will refer to as “primarily self-employed”, were less likely to be
covered by health insurance or to participate in or make contributions to a retirement account. For
instance, while more than 87 percent of individuals with only wages were covered by health insurance in
2014,8 only about 75 percent of individuals who were primarily self-employed were covered. Similarly,
only about 8 percent of primarily self-employed individuals made any retirement contribution to an IRA
or to an employer plan if applicable in 2014 compared to the 42 percent of wage earners. Among
workers whose income was not primarily from wages, almost 10 percent purchased insurance through
the Affordable Care Act’s Heath Insurance Marketplaces; such workers represented about 28 percent of
all workers (excluding dependents or non-working spouses) with Marketplace coverage.
Some of the differences found in benefit coverage across groups could be an artifact of differences in
economic circumstances of these individuals, but even for individuals within similar AGI classes,
substantial differences persist. For instance, among individuals with AGI between $25,000 and $75,000,
about 87 percent of wage earners had health insurance, compared to about 78 percent of self-employed
individuals. Moreover, the source of that coverage varied significantly. About 13 percent of small-
7 This distinction, also used in Knittel et al. 2011 as one part of a test to differentiate small business owners from other tax
filers, acts to differentiate Schedule C filers between those that predominately use Schedule C to report labor earnings (e.g.
from contracting work or as a misclassified employee) from those whose income arises, at least in part, from organizing a
host of other business inputs to production.
8 Health coverage is defined as not paying the individual responsibility payment for having no health coverage as required by
the ACA, nor claiming an exemption for themselves or anyone in their family from the health coverage requirement.

5
business owners and primarily self-employed individuals in that income range purchased health
insurance through a Health Insurance Marketplace, compared to about 3.5 percent of wage earners.
6
1. Background: Measuring Self-Employment
Information on the self-employed is poorly or incompletely captured by standard survey data. For
instance, the Current Population Survey (CPS) has shown declining rates of self-employment as a share
of the labor force almost continuously since the early 1980s, whereas self-employment indicated in
administrative data, such as Schedule C filings, has increased. Abraham et al. (2016), using matched
administrative and survey data, show that a large share of individuals who report being an employee in
response to surveys also file a tax return that reports self-employment earnings rather than wages. In
addition, some workers earn income from both wages and self-employment, but do not report their self-
employment status in surveys. Much of the gap between people with self-employment income reported
in administrative data versus the self-identified self-employed from survey data can be accounted for by
these two types of respondents. The interpretation of this pattern is less clear. For instance, these
differences may simply reflect differences in the definition of “self-employed” used in the survey versus
in the tax system. Individuals who work at one firm might describe themselves as employees of the firm,
regardless of how they were paid or what forms they filed. Alternatively, this pattern in which
individuals report being employees but are not paid with wages could also reflect the misclassification
of employees as contractors. Differentiating these alternative interpretations is challenging without a
more detailed understanding of the relationship between the firm and the worker than what is available
in current data sources.
Beyond differences in the aggregate trends in self-employment, data on the detailed activities of the self-
employed is collected infrequently and often incomplete as the questions tend to focus on workers who
describe their jobs as being temporary. For instance, the CPS contained a Contingent Worker
Supplement (CWS) in 1995, 2001 and 2005, which collected comprehensive information on contingent
workers defined as those “who do not expect their jobs to last or who reported that their jobs are
temporary.” These surveys found that contingent workers comprised a relatively small and stable share
of the labor market between 1995 and 2005. Although the CWS was discontinued in 2005, the Bureau of
Labor Statistics (BLS) will rerun it beginning in May 2017.
A handful of recent work has tried to characterize the activities and work experiences of the self-
employed and of workers engaged in contingent or temporary work arrangements in the U.S. labor
market. To fill the gap left by the discontinuation of the CWS, Katz and Krueger (2016) conduct their
own version of the CWS in the RAND American Life Panel. They include temporary agency workers,
7
on-call workers, contract company workers, and independent contractors/freelancers in their definition
of those with alternative work arrangements.9 They find a substantial increase in alternative work
arrangements between 2005 and 2015.
In a 2015 study, the U.S. General Accountability Office (GAO) uses various nationally-representative
survey data to assess the size of the contingent workforce. GAO finds an increase in alternative work
arrangements, which includes a large swath of job types in their definition, from 35.3 to 40.4 percent of
employment between 2006 and 2010. In addition, they find that contingent employment tends to
correspond with lower wages and benefits, acknowledging however that different definitions of the
contingent work leads to different conclusions.
A subset of the contingent workforce that is facilitated through online intermediaries comprise the so-
called “gig economy,” “platform economy,” or the “on-demand economy.” Some media suggest that the
gig economy is a large and growing segment of the U.S. labor market, revealing a marked shift in the
nature of work relationships. However, there is little empirical evidence that this is the case. The few
studies that have tried to infer the size of gig economy consistently find this segment of the workforce is
quite small. The gig economy comprises only 0.5 percent of workers according to Katz and Krueger
(2016). Similar estimates are found in, Farrell and Grieg (2016), where only 0.6 percent of the working-
age population are gig workers, and in Harris and Krueger (2015) who find 0.4 percent of workers are
gig workers
Farrell and Grieg (2016) use a random, anonymized sample of approximately 1 million Chase Bank
customers between October 2012 and September 2015 to examine the gig economy. They define the gig
economy as 30 companies (which are unnamed) whose work is characterized by discrete tasks and who
directly connect buyers and sellers through an online intermediary. Over this period, the percentage of
adults working in the gig economy within a month increased from less than 0.1 percent to 1 percent, and
by the end of the period, approximately 4.2 percent of adults had taken part in some sort of gig work.
However, the reliance on income from platform firms remained fairly stable, and was often used to
offset reductions in their regular earnings.
Hall and Krueger (2015) analyze a specific gig economy company, Uber, using administrative data from
on their drivers coupled with survey data from a subset of these drivers. They find that Uber drivers
9 According to the Bureau of Labor Statistics “Contract company workers" are employed by a company that provides their
services to others under contract; they are usually assigned to only one customer and work at the customer's worksite.
8
rarely turn to this form of gig work because they are unable to find other employment opportunities, but
rather prefer the flexibility of this type of work. In addition, they report that Uber drivers appear to earn
at least as much as taxi drivers and chauffeurs, even though they appear to be more similar to the general
workforce than these other drivers.
Understanding changes in alternative work arrangements is likely to be relevant for designing and
improving economic policies. For instance, whether workers are classified as employees versus
independent contractors for tax purposes can have important implications for how individuals are treated
under various law and regulations. Many benefits and worker protections are available only for workers
who are classified as employees. The classification of an employee as an independent contractor could
lead to a worker not receiving benefits for unemployment insurance, workers’ compensation (insurance
against on-the-job injuries), not being subject to minimum wage laws, or not being protected by various
other labor, discrimination, or health and safety requirements.
The different treatment of employees and independent contractors can create incentives for employers to
misclassify workers as contractors to avoid costs associated with providing those benefits or complying
with the regulations. For instance, misclassification could lower an employer’s costs for paying
employment taxes. In addition, misclassification is also likely to provide increased opportunities for
noncompliance by the employee. The IRS has not been permitted to issue general guidance addressing
worker classification since 1978, and has limited ability to directly address or correct instances of
misclassification. Changes in the share and characteristics of individuals working as independent
contractors are also likely to have implications for understanding the importance and extent of worker
misclassification.
The self-employed include a broad set of worker-types, engaged in a variety of economic activities. In
order to make meaningful comparisons to past work and alternative data sources, we describe and
categorize those who report having some form of self-employment income. Below we develop a
grouping system for the self-employed based on information we can observe in tax data.
9
2. Data and Methods
3.1 Administrative Tax Data on Self-Employment
This paper draws on detailed administrative data from a variety of tax forms and information returns.
The primary focus of our analysis is on individuals who earn income outside of the employee-employer
relationship (e.g. not from wages). In particular, we focus on employees who file Schedule SE and
Schedule C because these forms are used to report labor income earned outside of a formal employee-
employer relationship (Schedule SE) and the income-generating activities of sole proprietorships
(Schedule C).10
Our analysis starts with a sample of workers in 2014. We sample individuals who had positive earnings,
defined as total wages and self-employment income (reported on Schedule SE) and individuals who had
no earnings but report operation of a sole proprietorship on Schedule C. We select 2014 both because it
is the most recent year in which we have relatively complete return information available and because it
is the first year in which information is available regarding health-insurance coverage. This sample is
constructed from the combination of a 10 percent sample of individuals with either Schedule SE or
Schedule C (without SE income or wages) plus a 1 percent sample of wage earners (receive a W2) but
without SE income. By design, the wage earner sample includes some individuals that file Schedule C
but do not have Schedule SE income because their profits were below the Schedule SE $400 filing
threshold. We exclude dependent filers. Using the appropriate weights, this sample provides complete
coverage of non-dependent individuals (versus tax units) who file a return and either earn income from
wages or self-employment or who operate a sole proprietorship.
In addition, to observe trends in self-employment over time, we pull a 1 percent sample of individuals
who reported earnings on Schedule SE from 1999 to 2014. Because of data limitations, this sample
includes only individuals with positive self-employment income (and thus excludes two groups in the
main 2014 file: individuals with wages, Schedule C activities, but no SE income and individuals filing
Schedule C but without wages or SE income).11
To these samples, we merge information on age, gender, household income, wages, and access to and
coverage under retirement and health benefits. Specifically, we draw data from forms W2 (wages,
10
The appendix describes these data sources and the individual forms in greater detail. 11
Prior to 2008, the Schedule C data used retain only identifiers for the tax unit rather than individual, so it is not possible to
link the Schedule C to an individual taxpayer in units filing joint returns. Schedule SE is always reported at the individual
level. Thus, we focus on individuals with Schedule SE income.
10
retirement coverage, health insurance coverage), 1099MISC (box 7, non-employee compensation),
1099K (third-party payments), Schedule C (including receipts, business expenses, profit or loss, industry
code, and description of the activity), Schedule SE (self-employment earnings), 1040 (demographic,
income, IRA contributions, self-employment health deductions, and health insurance status), 8965
(Health Coverage Exemptions) and 5498 (IRA contributions, IRA Fair Market Value).12
In general, tax forms are meant to help administer the tax code and are issued for the purposes of
reporting income. Unlike survey data, which has the advantage of asking respondents whether they are
employees or contractors, this means that examining the type and nature of work using tax data can be
particularly challenging as this type of information is limited. Nonetheless, the presence of various
forms can be informative for determining the types of work in which people engage.
Table 1 provides aggregate counts of individuals according to the forms they filed (e.g. Schedule C, SE,
Form 1040) and the forms they received (e.g. W-2, 1099K, 1099MISC).13
The first column indicates
that in 2014, about 190 million individuals filed a tax return and roughly 146 million individuals had
positive earnings, where earnings is defined as total wages and self-employment income. Looking at the
bottom panel of Table 1, of those with non-zero earnings, the vast majority (86.7 percent) earned their
income solely from an employer through an employee-employer relationship (as indicated by having
received wage income reported on a W2) and had no self-employment income reported on Schedule SE.
An additional 7.2 percent earned income solely from self-employment and the remaining 6.1 percent
earned from a mix of both.
Focusing on those who file a Schedule SE, the vast majority also file Schedule C. In particular, Column
1 of Table 1 shows that of the roughly 19.4 million individuals who filed a Schedule SE, about
16.9 million (87 percent) also filed a Schedule C reporting a profit. In other words, the individual earned
income from operating a sole proprietorship and used Schedule SE to pay employment taxes on their
earnings. Individuals who file a Schedule SE but who do not file a Schedule C include mostly partners
in partnerships (whose distributive share of the partnership income is reported as earnings subject to
payroll tax) or farmers (farm proprietorships). About 6.4 percent of SE filers (1.2 million) filed Schedule
E but not Schedule C, which implies that their self-employment income is likely to have derived from
12
These samples are drawn from unedited administrative data and hence sometimes values or identifiers are missing or
erroneous (e.g. a dollar value missing a decimal place) or include duplicate forms (e.g. in the case of reissued information
returns). 13
Total individuals include all primary filers and if filing jointly, their spouses. Also, we exclude any primary filers who are
also reported as a dependent on another return.

11
their ownership and active participation in a partnership. An additional 1.3 million SE filers (6.8
percent) appear to file neither C nor E. These filers may include Schedule F (farm proprietors), but also
could include individuals where a form is missing or was not matched (e.g. because of a missing or
erroneous identifier). Table 1 also indicates that two-thirds of the 24.9 million individuals who filed a
Schedule C reported both a profit and the resulting self-employment income on Schedule SE. A
substantial number of Schedule C filers report a loss (or have net income less than the $400 Schedule SE
filing threshold) therefore are not required to pay self-employment tax using Schedule SE.
The remaining columns in Table 1 provide tabulations for each subgroup indicating other forms that the
filer reported or received. Administratively, the distinction between receiving a 1099 as opposed to a W-
2 is crucial for determining whether an individual must file Schedule C as a sole proprietor and/or
Schedule SE to report earnings not subject to employer withholding for payroll tax. Column 3 shows
that of the 135.4 million filers who received any W-2 wage income, about 8.8 million also reported
earning income on Schedule SE, and about 13 million individuals both filed a Schedule C and received
wage income. Column 5 indicates that about 54.8 percent of individuals filing Schedule SE received a
1099-MISC, while Column 7 shows that relatively few individuals, about 6.1 percent of individuals
filing Schedule SE, received a 1099-K. (In addition to differences in the actual number of people
participating in activities that would result in a 1099 MISC versus a K, the relative infrequency of
reported 1099Ks could stem from differences in the reporting threshold. As described in the appendix,
the filing threshold for 1099 MISC is generally $600 but is $20,000 (or 200 transactions) for certain
types of income reported on 1099 K.)
Whether individuals receive or file certain forms is a helpful proxy for employment status; however, this
information is less informative for identifying the nature of the work. For those who file Schedule C,
additional detail is provided on the types of activities that people take on in self-employment. Table 2
lists the top ten self-reported descriptions Schedule C filers use for their business (column 1) and shows
that the types of activities that people engage in are quite diverse.14
Specifically, the list includes consultants—a catch all for a wide range of activities—real estate activities
(mostly real estate agents), construction workers, housekeeping or janitorial services, child care, and
landscaping. Aside from the description provided by the taxpayer and other information on Schedule C,
we have little information on the self-employed individual’s activities. One piece of information we do
14
More information could be available on the business returns they file, including Forms 1120 or 1065; however, those
returns are difficult to tie back to the owners’ individual returns.
12
observe is whether the individual has received a 1099-K or 1099-MISC form. However, by themselves,
the receipt of forms by itself tends not to provide much independent information because they are
received by many individuals for many purposes. As a result, the listings of business descriptions in
columns 2 and 3 are very similar to the descriptions of the population of Schedule C filers as a whole.15
Tables 1 and 2 highlight some of the difficulties in attempting to classify the employment status of
individuals using tax and administrative data and, reconciling that classification with other data sources.
For instance, in survey data, an individual who operates their own business may respond that they are
“self-employed.” That individual would file Schedule C if their business was a sole proprietorship, but
not if she filed a partnership return because her business was incorporated as an LLC or partnership.
Moreover, even if she filed a Schedule C, she may not file a Schedule SE if she had no earnings. That
means that Schedule SE—which is used by the Social Security Administration and Census in certain
cases to measure the size of the workforce or estimate the reliability of survey data—may also not
provide a definitive answer of respondents’ employment status. A related issue further complicating
comparisons of a tax data to survey data that we will return to later in the paper, is that many sole-
proprietors who work exclusively for one or several employers may in fact self-report as employees in
survey data despite not receiving a W-2 and having to file a Schedule SE. Finally, the business activities
reported in tax data are diverse and potentially difficult to distinguish from one another without
additional information. As seen from the self-reports on Schedule C, activities grouped by tax form can
range from relatively large businesses, such as construction firms, law offices, restaurants, and grocery
stores to individual occupations like babysitting and housecleaning. Moreover, income from platform or
“gig economy” work and reporting of sporadic or supplemental income like honoraria or consulting
payments are also subject to the same type of reporting on Schedule C and in some cases, Schedule SE.
Taking these issues into account and, building on the work of Knittel et al 2011, we create a taxonomy
that provides a complete accounting of all filers who report self-employment income.16
3.2 Classifying Self-Employed Individuals
Business activity reported on Schedules C and SE can vary dramatically in both size and scope. In
particular, these filers tend to differ in whether their self-employment activity represents a primary or
15
Information on the 1099 payer could provide more information and we provide a case study of that below. 16
Matthew Knittel, Susan Nelson, Jason DeBacker, John Kitchen, James Pearce, and Richard Prisinzano, “Methodology to
Identify Small Businesses and Their Owners,” OTA Technical Paper 4, August 2011.
13
secondary source of income, and thus, in whether they are likely to have employer-provided benefits or
more stable employment relationships. In addition, self-employed filers differ in whether their self-
employment activity represents the return from labor (e.g. contract work) or a combination of returns
from labor and capital (e.g. operating a restaurant or owning ones’ own taxi or ride-sharing vehicle).
These differences, which are likely to manifest as large differences in total business expenses, help to
distinguish individuals who look more like employees as opposed to business owners.
A major distinguishing factor among the self-employed is whether and to what extent their primary
source of income is from wages paid by an employer. Figure 1 shows the distribution of individuals with
any earnings by the share of earnings from self-employment. The figure shows that the distribution is
polarized, with the majority of self-employed individuals receiving essentially all their earnings from
self-employment, but a substantial minority receiving mostly wages with only small amounts of self-
employment income. For these latter groups of employees, because their primary source of income is
from wages, they are much more similar to other wage earners than to more traditional self-employed
individuals, both in their economic characteristics, their propensity to receive employer-provided
benefits, and also based on a qualitative analysis of why they report Schedule C income—often these
individuals file Schedule C to report non-wage or unusual compensation like honoraria or small contract
payments for incidental activities.
A second clear differentiator is the size of business-related deductions claimed by the taxpayer on
Schedule C. The amount of business expenses provides an indication of the size of the enterprise and
whether the proprietor’s income arises from organizing multiple factors of production to produce
income (e.g. owning, operating, repairing equipment like trucks, restaurant equipment, or furniture;
paying utilities for a building; employee wages or benefits) or whether the individual had few business
expenses and earned income primarily from their own labor. For example, a contract worker (or
misclassified employee or a household worker) who works at the contracting firm’s establishment and
uses the firm’s equipment or supplies would likely have few business-related expenses. Indeed, the data
illustrate a clear relationship between the level of business expenses and the type of business activity the
proprietor reports. Figure 2 shows several large self-reported business activities ranked by the average
share of those businesses reporting expenses over $5,000. About 92 percent of restaurants and 83
percent of law offices report business expenses in excess of $5,000, but among babysitters and
housekeepers, the share is 7 percent and 18 percent, respectively.
14
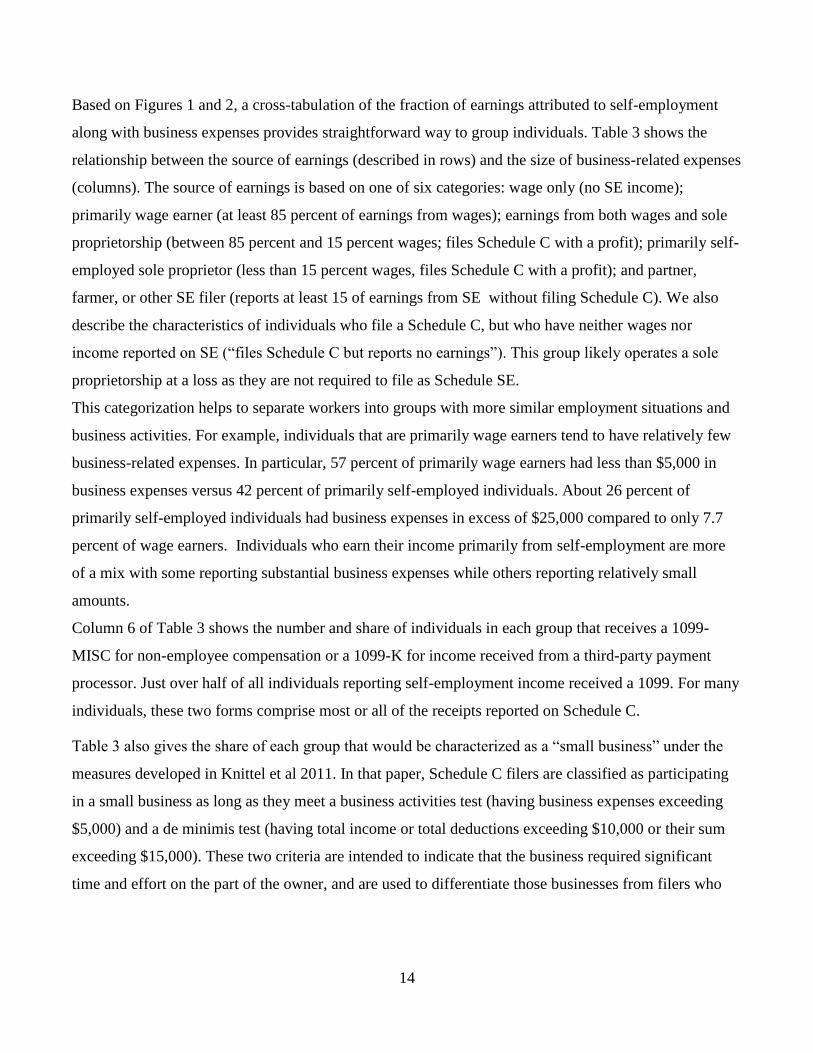
Based on Figures 1 and 2, a cross-tabulation of the fraction of earnings attributed to self-employment
along with business expenses provides straightforward way to group individuals. Table 3 shows the
relationship between the source of earnings (described in rows) and the size of business-related expenses
(columns). The source of earnings is based on one of six categories: wage only (no SE income);
primarily wage earner (at least 85 percent of earnings from wages); earnings from both wages and sole
proprietorship (between 85 percent and 15 percent wages; files Schedule C with a profit); primarily self-
employed sole proprietor (less than 15 percent wages, files Schedule C with a profit); and partner,
farmer, or other SE filer (reports at least 15 of earnings from SE without filing Schedule C). We also
describe the characteristics of individuals who file a Schedule C, but who have neither wages nor
income reported on SE (“files Schedule C but reports no earnings”). This group likely operates a sole
proprietorship at a loss as they are not required to file as Schedule SE.
This categorization helps to separate workers into groups with more similar employment situations and
business activities. For example, individuals that are primarily wage earners tend to have relatively few
business-related expenses. In particular, 57 percent of primarily wage earners had less than $5,000 in
business expenses versus 42 percent of primarily self-employed individuals. About 26 percent of
primarily self-employed individuals had business expenses in excess of $25,000 compared to only 7.7
percent of wage earners. Individuals who earn their income primarily from self-employment are more
of a mix with some reporting substantial business expenses while others reporting relatively small
amounts.
Column 6 of Table 3 shows the number and share of individuals in each group that receives a 1099-
MISC for non-employee compensation or a 1099-K for income received from a third-party payment
processor. Just over half of all individuals reporting self-employment income received a 1099. For many
individuals, these two forms comprise most or all of the receipts reported on Schedule C.
Table 3 also gives the share of each group that would be characterized as a “small business” under the
measures developed in Knittel et al 2011. In that paper, Schedule C filers are classified as participating
in a small business as long as they meet a business activities test (having business expenses exceeding
$5,000) and a de minimis test (having total income or total deductions exceeding $10,000 or their sum
exceeding $15,000). These two criteria are intended to indicate that the business required significant
time and effort on the part of the owner, and are used to differentiate those businesses from filers who
15
may be engaged in hobby activities.17
Column 7 of Table 3 indicates that about 9.8 million individuals
(of the 24.9 million Schedule C filers) meet these small businesses tests, and for just over half of them
(about 5.5 million), their business is their primary source of earnings, while 1.1 million individuals
earned a mix of wages and self-employment income. Of those who operated a small business, about 1
million individuals did so at a loss and reported no earnings.18
Finally, 2.1 million small business owners
were primarily wage earners whose small business income made up only a small share of their earnings.
In addition to small business owners, another interesting subgroup of the self-employed includes
individuals engaged in the “Gig economy”. Table 3 uses information in the descriptions provided by
individuals on their Schedule C and the 1099 information returns to identify workers in the “Gig
economy” or platform-coordinated employment. Specifically, we identify all individuals who report that
their “principle business or profession” included specific phrases like “ride sharing” or a company-
specific name corresponding to the roughly 25 prominent online or platform-based services identified in
Harris and Krueger (2016) (or any payment processing firm associated with those platform firms). We
identify the issuers of the 1099-Miscs and 1099-Ks to individuals who self-identified as working for a
platform firm and then use that information to identify any other Schedule C or SE filers who received
payments from those same employers. This method produces what is likely to be an undercount of the
true number of individuals that participated in the “gig economy” because some participants may not
have filed a return or not filed a Schedule C reporting that income; because some platform firms do not
provide 1099s to all of their participants; and also because not all prominent service providers could not
be found in the data (perhaps as a result of the prior two causes). Nevertheless, we are confident that the
data include the vast majority of filers who received a 1099 from the largest platform providers in
sectors like ride sharing, courier or delivery services, local labor services (handyman, errand runner),
and online computing, programming, or consulting services. Hence, we believe the sample reflects the
characteristics of individuals who participate in those activities and who file a Schedule C to report those
activities. However, the statistics pertaining to “gig economy” workers are given with the caveat that
they do not necessarily reflect the income narrowly generated by their gig economy work, but may also
include income from other sources (e.g. a taxi driver who owns his own cab and also participates in
ridesharing would have both sources of income mixed on Schedule C).
17
The test also imposes a maximum of $10 million in either gross income or expenses; essentially all Schedule C filers fall
below that threshold and are thus “small” by this definition. 18
While a substantial number of Schedule Cs report a loss, the “hobby loss” rules attempt to prevent businesses from
continually being in a loss position.
16
In 2014, only a small group—about 109,700 individuals—file a return reporting income from
participating in a “gig economy” or online platform based business (about 0.7 percent of all workers). A
large share (39 percent) of gig economy participants were primarily wage earners and an additional
19.5 percent reported a mix of earnings from wages and self-employment. For roughly 33 percent, gig
economy work was their primary source of earnings. The remaining 8 percent did not report any
earnings from either self-employment or wages (filed Schedule C to report a loss). On the one hand, the
estimated 0.7 percent of all workers who appeared to have worked for some part of the year through an
online platform is quite close to estimates derived by Katz and Kruger (2016) of 0.5 percent. On the
other hand, the total count of workers filing a return appears low relative to the number of participants in
online platforms reported in Hall and Krueger (2015).19
This is consistent with our estimates providing a
lower bound for the gig workforce.
3. Changes in the Fraction of Employees, the Self-Employed, and Sole Proprietors over Time
For each of the six groups described above, we examine trends in the number of individuals and the
share of the total labor force (measured as a proportion of all individuals reporting either wages or self-
employment income that is subject to employment taxes). These trends are based on a 1 percent sample
of individuals who file both the Schedule C and Schedule SE between 1999 and 2014.
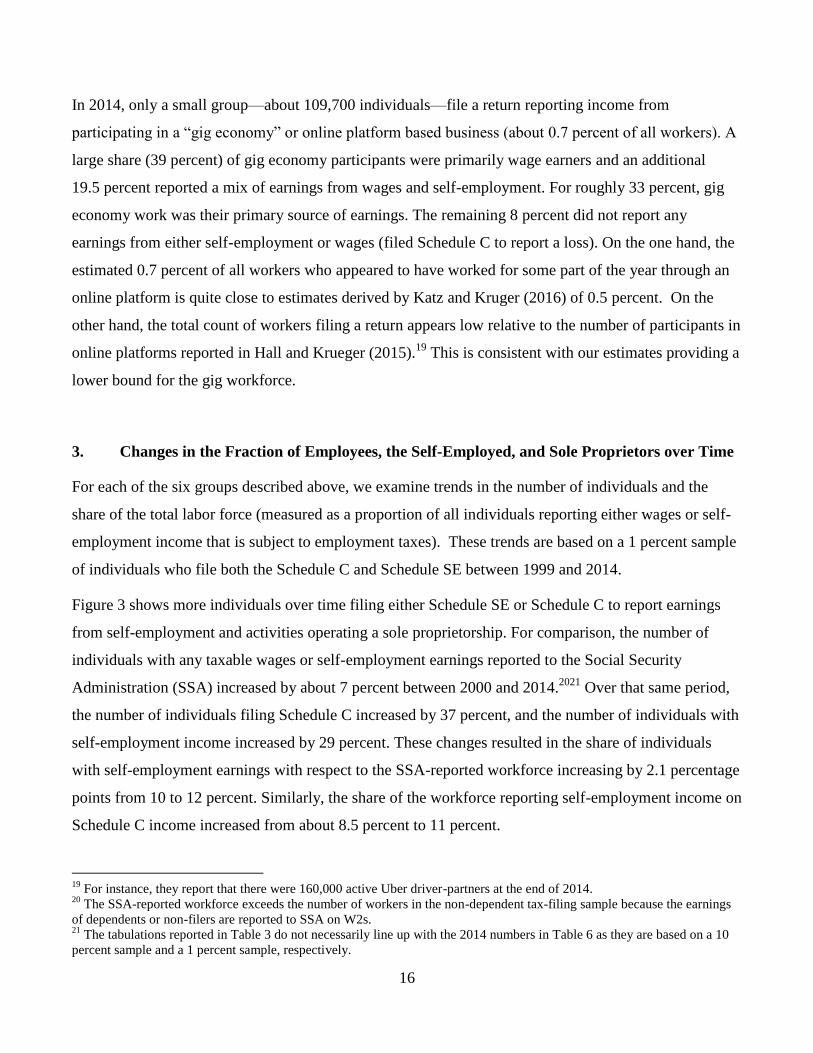
Figure 3 shows more individuals over time filing either Schedule SE or Schedule C to report earnings
from self-employment and activities operating a sole proprietorship. For comparison, the number of
individuals with any taxable wages or self-employment earnings reported to the Social Security
Administration (SSA) increased by about 7 percent between 2000 and 2014.2021
Over that same period,
the number of individuals filing Schedule C increased by 37 percent, and the number of individuals with
self-employment income increased by 29 percent. These changes resulted in the share of individuals
with self-employment earnings with respect to the SSA-reported workforce increasing by 2.1 percentage
points from 10 to 12 percent. Similarly, the share of the workforce reporting self-employment income on
Schedule C income increased from about 8.5 percent to 11 percent.
19
For instance, they report that there were 160,000 active Uber driver-partners at the end of 2014. 20
The SSA-reported workforce exceeds the number of workers in the non-dependent tax-filing sample because the earnings
of dependents or non-filers are reported to SSA on W2s. 21
The tabulations reported in Table 3 do not necessarily line up with the 2014 numbers in Table 6 as they are based on a 10
percent sample and a 1 percent sample, respectively.
17
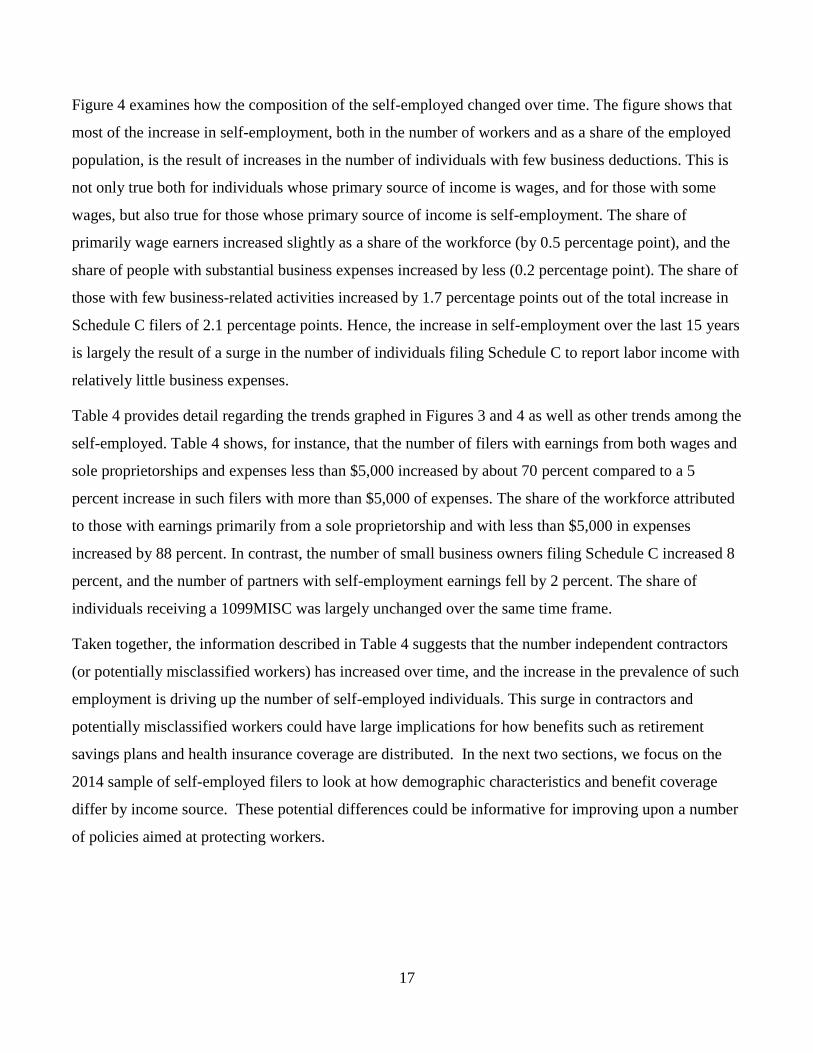
Figure 4 examines how the composition of the self-employed changed over time. The figure shows that
most of the increase in self-employment, both in the number of workers and as a share of the employed
population, is the result of increases in the number of individuals with few business deductions. This is
not only true both for individuals whose primary source of income is wages, and for those with some
wages, but also true for those whose primary source of income is self-employment. The share of
primarily wage earners increased slightly as a share of the workforce (by 0.5 percentage point), and the
share of people with substantial business expenses increased by less (0.2 percentage point). The share of
those with few business-related activities increased by 1.7 percentage points out of the total increase in
Schedule C filers of 2.1 percentage points. Hence, the increase in self-employment over the last 15 years
is largely the result of a surge in the number of individuals filing Schedule C to report labor income with
relatively little business expenses.
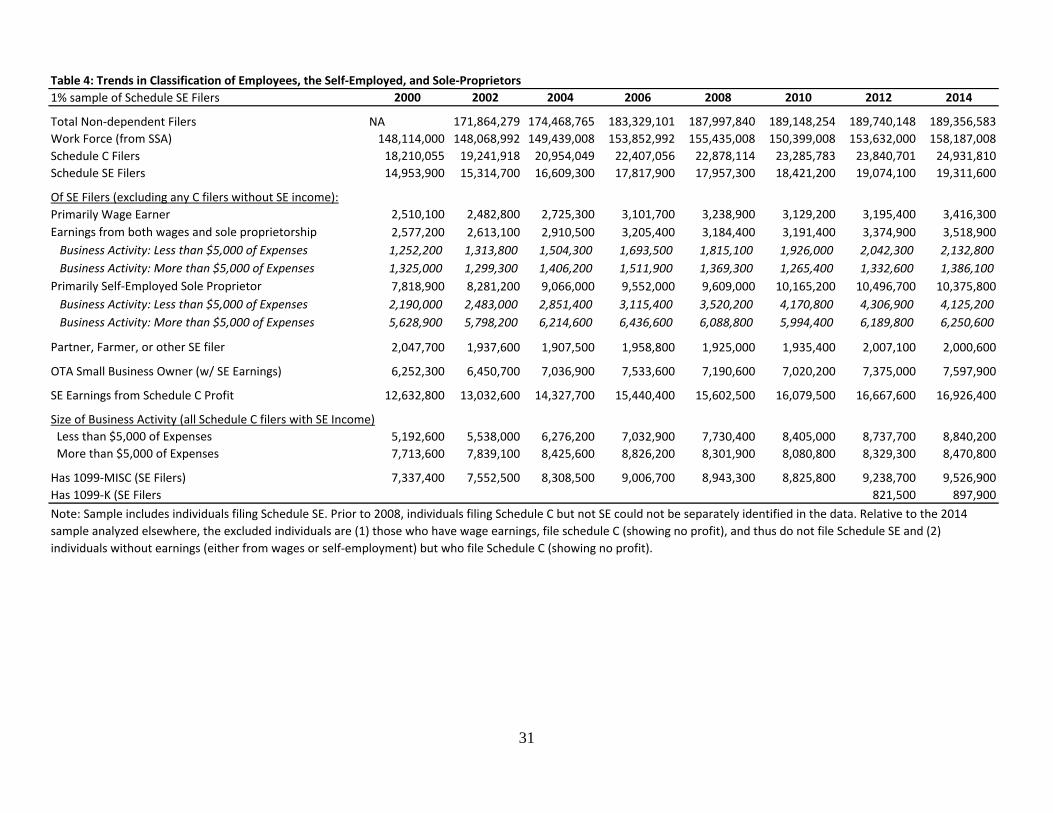
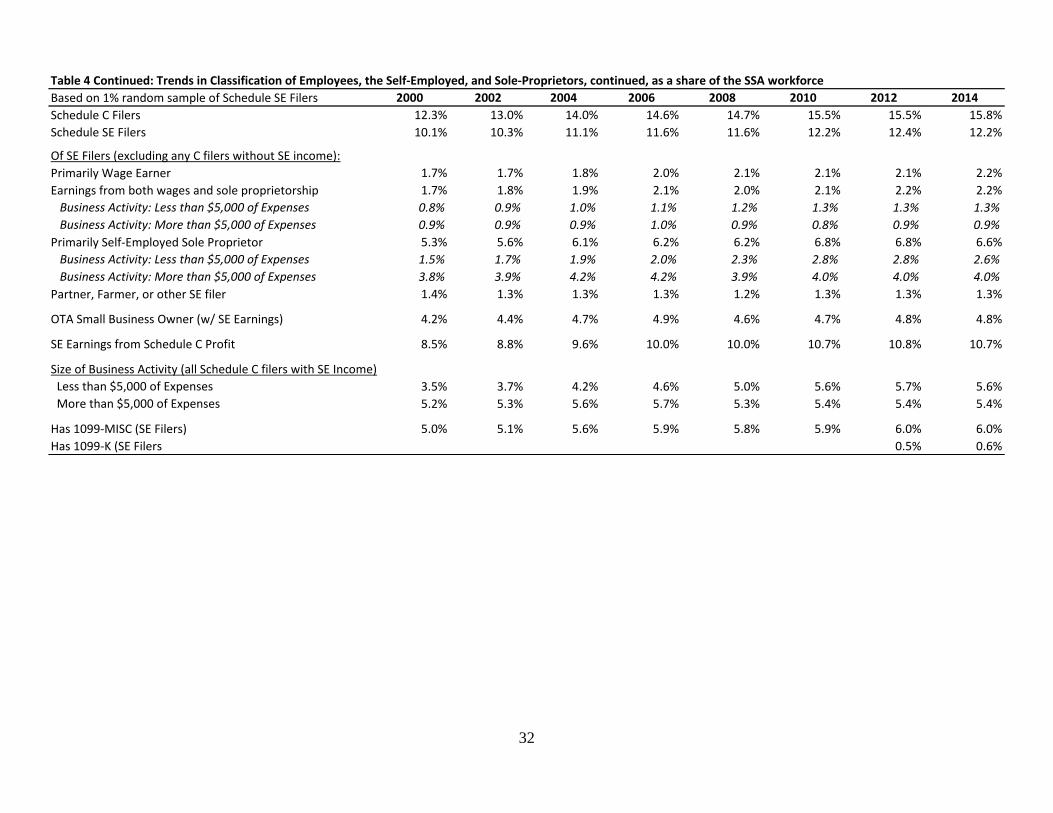
Table 4 provides detail regarding the trends graphed in Figures 3 and 4 as well as other trends among the
self-employed. Table 4 shows, for instance, that the number of filers with earnings from both wages and
sole proprietorships and expenses less than $5,000 increased by about 70 percent compared to a 5
percent increase in such filers with more than $5,000 of expenses. The share of the workforce attributed
to those with earnings primarily from a sole proprietorship and with less than $5,000 in expenses
increased by 88 percent. In contrast, the number of small business owners filing Schedule C increased 8
percent, and the number of partners with self-employment earnings fell by 2 percent. The share of
individuals receiving a 1099MISC was largely unchanged over the same time frame.
Taken together, the information described in Table 4 suggests that the number independent contractors
(or potentially misclassified workers) has increased over time, and the increase in the prevalence of such
employment is driving up the number of self-employed individuals. This surge in contractors and
potentially misclassified workers could have large implications for how benefits such as retirement
savings plans and health insurance coverage are distributed. In the next two sections, we focus on the
2014 sample of self-employed filers to look at how demographic characteristics and benefit coverage
differ by income source. These potential differences could be informative for improving upon a number
of policies aimed at protecting workers.
18
4. Demographic and Economic Characteristics of Employees, the Self-Employed, and Sole
Proprietors
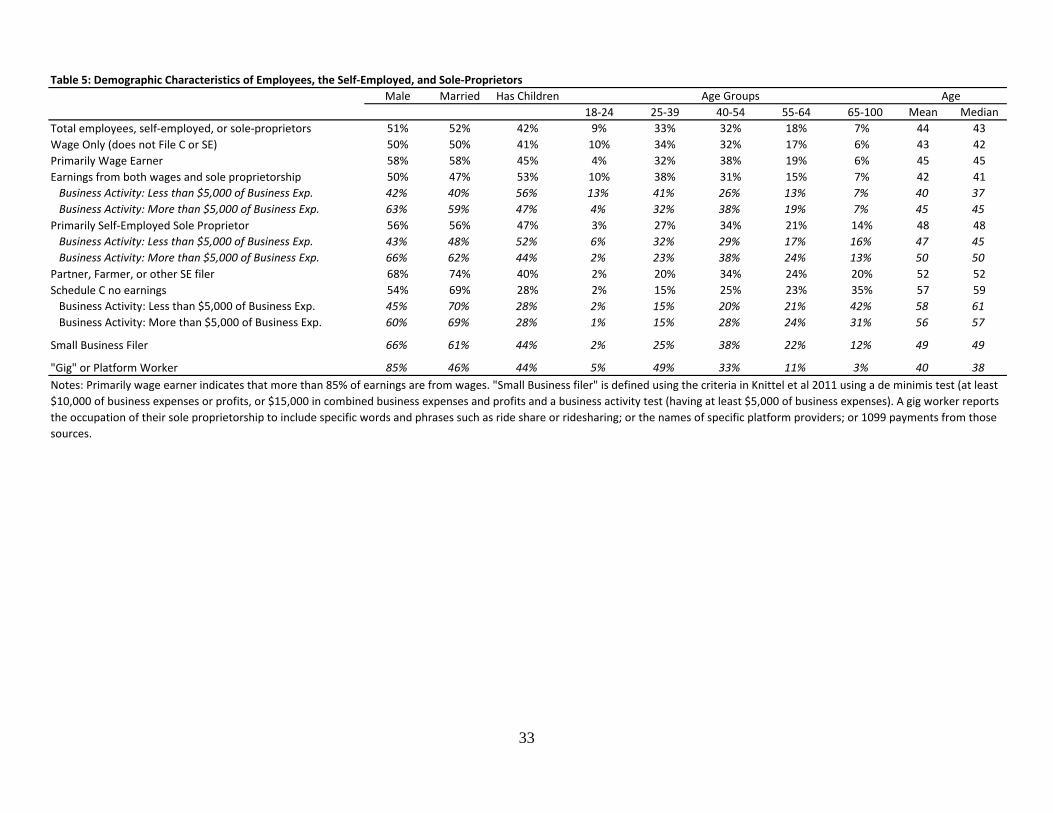
Using the classifications based on business income and activities described in Section 3, Table 5 shows
the demographic characteristics of individuals within each group.
Compared to wage-only workers—which are 50 percent male, 50 percent married, 41 percent parents,
and have a median age of 42—the self-employed group are slightly more likely to be male, somewhat
older, and more likely to be married and to have children. However, that rough characterization masks
considerable heterogeneity across the different groups of self-employed individuals. Perhaps the most
different group includes those who are likely to be partners, since they filed a Schedule SE but no
Schedule C, where two thirds are male and three quarters are married. Self-employed individuals with
relatively few business expenses, which include some mix of contract workers, misclassified workers,
household employees, and others, are also substantially different than workers who earned primarily
wages in that the self-employed group are predominately female, less likely to be married, and
somewhat more likely to have children. Small business filers are two thirds male, have a median age of
49, and 61 percent are married. The vast majority of gig economy workers are male (85 percent), but
otherwise look relatively similar to the overall workforce in terms of their marriage rate (46 percent vs
52 percent) and likelihood of having children (44 percent vs 42 percent). The median age of a gig
economy worker is 38.
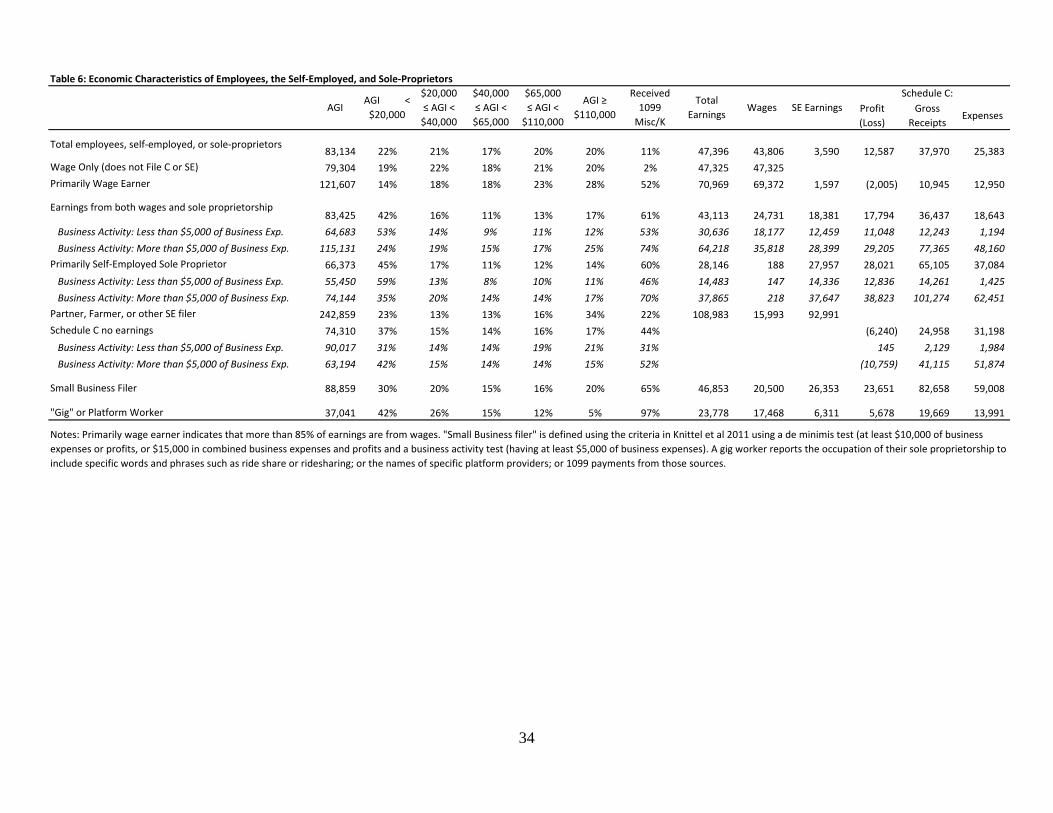
Table 6 provides information on the economic characteristics of the self-employed, including mean
adjusted gross income (AGI), where AGI is reported at the tax unit level, and the distribution of AGI
within each group. We also show whether the individual received a 1099 as well as individuals’ total
earnings, wage earnings, and self-employment earnings. For sole proprietorships, we show the net
profits, gross income, and expenses.
The average earnings among all workers and workers with only wage earnings, who comprise the vast
majority of all workers, was about $47,000. Individuals whose income came primarily from wages but
who also reported some self-employment earnings earned on average about $71,000, of which about
$69,000 was wages. Individuals who relied to a larger extent on self-employment earnings tended to
earn relatively less than those whose earnings was entirely or largely from wages. For instance, those
who had a mix of wage and self-employment earnings earned about $43,000 per year, of which about
$25,000 was wages. Those who were primarily self-employed earned about $28,000 per year with the
19
majority of their earnings coming from self-employment. One caveat for all of these figures regarding
the self-employed is that they exclude those who file a Schedule C, but who have no earnings. Hence,
the actual earnings of all Schedule C filers, which would include those with losses or zero income,
would be lower. Individuals whose self-employment income comes from sources other than Schedule
C—largely partners—are substantially higher earners. The average AGI for that group is $243,000 with
average earnings of about $109,000.
In general, the relative earnings and income within each group differs considerably by the size of the
corresponding business activity. Individuals who report more than $5,000 of business related expenses
tend to have relatively higher earnings than those with smaller levels of expenses. Looking specifically
at small business filers, the average AGI and total earnings of Schedule C small business filers is
roughly $89,000 and $47,000, respectively.
Gig economy or platform workers earned on average about $24,000, most of which came from wages
($17,500). The actual profit (or loss) reported on Schedule C among gig workers was about $5,700 per
year. While these workers report gross income of close to $20,000 per year, they also report about
$14,000 of expenses. Moreover, the income reported on Schedule C generally reflects a combination of
income from platform and other sources, so the income from the platform work is lower. Essentially all
gig economy workers that file a Schedule C also receive a 1099.22
Overall the gig economy workers
have lower AGI’s and lower total earnings compared the workforce as a whole.
5. Benefit coverage of Employees, the Self-Employed, and Sole Proprietors
This section examines how benefit coverage differs across groups based on their predominant economic
activities.
Table 7 summarizes the information on health insurance coverage available that pertains to the
individuals in the sample. Information on health insurance coverage comes from three primary sources:
Forms 1040, 8965, and 1095-A.23
Under the Affordable Care Act, those who do not have health
coverage must pay a penalty, which is reported on the 1040. Under certain circumstances taxpayers are
22
To some extent, this is an artifact of how they are identified. However, the rate of 1099 receipt among self-identified gig
economy workers is very high. 23
Form W2 now includes in Box 12 (code DD) the amount of the workers compensation that was paid for employer-
provided health insurance, but such reporting is incomplete because it is was required only of larger employers (with at least
250 employees).
20
exempt from the coverage requirement, in which case the filer must submit a Form 8965. Form 1095-A
is used to report Marketplace coverage. We create a proxy for health coverage that is defined as
someone who does not claim an exemption on Form 8965 or pay a penalty (either for themselves or for
any dependent household member) on Form 1040. The first column of Table 7 shows shares of people
with health insurance based on this definition by the source of income. The second column indicates
whether the individual purchased coverage through a Marketplace and column 3 indicates whether the
taxpayer or the taxpayer’s spouse if married filing jointly claimed the self-employed health insurance
deduction on Form 1040.
Table 7 underlines the variation in access to health insurance coverage across the different groups.
Individuals who are primarily wage earners have the highest coverage rate of 89.7 percent. More
generally, individuals with most or all of their earnings from wages have higher rates of coverage than
those with a substantial portion of their income coming from Schedule C income. This is evident as
those with a mix of wages and self-employment earnings as well as those with primarily self-
employment income are more likely to claim an exemption, 13.8 percent and 17.3 percent respectively.
Both of these groups were also somewhat more likely to pay a penalty for a lack of coverage than
employees.
Marketplace coverage is an important source of health insurance coverage for small business owners and
the self-employed. Almost one in ten small business owners relies on marketplace coverage as their
source of health insurance, and that coverage is even more important for business owners with relatively
larger business-related expenses and who rely on their self-employment earnings as their principal
livelihood. In addition, 9.3 percent of gig economy workers are covered by Marketplace coverage. In
contrast, wage-only workers are less likely to rely on Marketplace coverage (2.9 percent) compared to
those with any self-employment income. (Of course, because the number of wage-only workers is much
larger, the number of wage-only workers purchasing Marketplace coverage is also large.) Gig workers
have lower rates of employer-sponsored health insurance than those who earn most or all of their
earnings from wages. Partners, farmers and other self-employed filers have high rates of health
insurance coverage, 89.3 percent, which is comparable to wage earners. These individuals are also the
most likely to claim a self-employment health deduction, 33.4 percent.
21
Table 8 focuses on two important measures from Table 7 to examine how coverage in each group differs
across the income distribution. The five classes of AGI were selected to be roughly quintiles of the
income distribution among wage-only earners.
First, the most striking pattern to emerge from Table 8 is that health insurance coverage substantially
increases with income irrespective of classification. In the highest income class where AGI is greater
than or equal to $110,000, essentially all households are covered. For the highest income class, there is
little difference in coverage by income source with the difference between the most insured group and
least insured group around 1.3 percentage points.
In contrast, among lower-income groups, not only is coverage less likely generally, but it varies more
substantially based on income source where the gap in coverage is as a large 19 percentage points
among the bottom income class.
Individuals in the second lowest AGI class are the most likely to have insurance coverage from
Marketplaces. Given that an AGI between $20,000 and $40,000 roughly corresponds to 138 percent-250
percent of the federal poverty line for a household size of two in 2014, these are individuals who would
benefit from the premium tax credit available when purchasing insurance through Marketplaces.
In addition to health insurance coverage, employees with more formal employee-employer relationships
are often provided access to retirement savings plans. Table 9 shows how retirement savings rates differ
across the different groups defined by sources of income. Column 1 of Table 9 identifies an individual
as having made any contribution to a retirement savings plan if they contributed to either an employer-
sponsored plan or an IRA. The second column indicates if an individual was offered an employer-
sponsored plan, which includes both defined contribution (401k-type) plans and defined benefit
(pension) plans as indicated on Form W-2, box 13. A little more than half of wage only and primarily
wage earners were offered employer plans and about 40 percent contributed to these plans.24
Again, gig
workers are offered retirement plans at higher rates compared to those who are primarily self-employed
or small business owners, but this again likely stems from the fact that about 40 percent of gig workers
are also primarily wage earners.
Partners, farmers and other self-employed individuals are the most likely to contribute to an IRA and
have a positive IRA balance. Those with no earnings but who file a Schedule C are less likely to
24
Note that only 401K-type plans allow for elective employee contributions. Also, this measure does not include any
contributions made by employers to the 401K-type plan.
22
contribute to an IRA relative to the overall workforce, but are more likely to have a positive IRA
balance. Small business owners are more likely than wage earners to contribute to an IRA.
Table 10 demonstrates how retirement contributions vary across the income distribution for each group.
The rates of coverage are increasing in income for all groups. Interestingly, unlike health insurance
coverage, the differences across groups is starkest in the top income class rather than at the bottom. For
those in the highest income class, the largest gap in having any plan of 58.6 percentage points exists
between the Schedule C group with no earnings and the wage-only group. Wage earners more generally
are twice as likely as business owners to have a plan, where the difference is driven by access to an
employer plan.
For those in the lowest income category, the share of those with a plan is relatively low with the highest
percentage of those with a plan coming from primarily wage earners at 17.9 percent. Roughly half of gig
workers at the high end of the AGI distribution have access to a plan compared to the 5 percent at the
bottom end of the distribution.
Overall, it appears that access to retirement plans comes primarily from employer-sponsored plans
despite the availability of IRAs. This suggests that as people move away from traditional employee-
employer relationships ownership of any retirement plan may decline.
6. Summary and Conclusion
This paper shows that a rising share of American workers are earning income outside of traditional
employee-employer relationships. Many of these new workers appear primarily to be providing labor
services as contractors or freelancers or, perhaps, as employees misclassified as contractors. These data
make it clear that workers who earn their living outside of the formal employee-employer relationship
earn less, are less likely to have health insurance coverage, or to participate in or contribute to a
retirement account. The Affordable Care Act—specifically the availability of marketplace coverage—
appears to have provided insurance for a large share of self-employed individuals, particularly for
middle-income workers. Nevertheless, while health insurance coverage is improving for these groups,
gaps in coverage for health and, especially, retirement benefits remain for this growing group of
workers.
23
References
Abraham, Katherine, John Haltiwanger, Kristin Sandusky, and James Speltzer, “Measuring the Gig
Economy,” Presentation for the Society of Labor Economists, May 2016.
Bernhardt, Annette, “Labor Standards and the Reorganization of Work: Gaps in Data and Research,”
IRLE Working Paper #100-14, January 2014.
Farrell, Diana and Fiona Greig, “Paychecks, Paydays and the Online Platform Economy,” JPMorgan
Chase & Co. Institute, February 2016.
U.S. General Accountability Office, “Contingent Workforce: Size, Characteristics, Earnings, and
Benefits,” GAO-15-168R, April 2015.
Hall, Jonathan and Alan Krueger, “An Analysis of the Labor Market for Uber’s Driver-Partners in the
United States,” Working Paper, January 2015.
Harris, Seth and Alan Krueger, “A Proposal for Modernizing Labor Laws for Twenty-First-Century
Work: The ‘Independent Worker’,” The Hamilton Project, Discussion Paper 2015-10, December 2015.
Katz, Lawrence and Alan Krueger, “The Rise and Nature of Alternative Work Arrangements in the
United States, 1995-2015,” Working Paper, March 2016.
Pew Research Center, “Shared, Collaborative and On Demand: The New Digital Economy,” May 2016.
24
Figure 1. Distribution of Self-Employment Earnings as a Fraction of Total Earnings, 2014
Notes: Sample restricted to self-employed individuals and excludes those with only wages. “Total
Earnings” is defined as the sum of self-employment earnings and wages.
25
Figure 2. Fraction of Self-Reported Business Activity with Expenses Greater Than $5,000, 2014
Notes: “Schedule C Descriptions” indicate several large self-reported business activities on Schedule C.
Business activities are ranked by the percentage with at least $5,000 in business expenses. The bar for
each business activity indicates the percentage of forms filed as that activity that report total business
expenses of at least $5,000.
26
Figure 3. Trends in the Self-Employed
Notes: Trends are presented as a fraction of SSA-reported workforce. Figure presents the trends of
individuals who file Schedule SE (with or without Schedule C) and those who file both Schedule SE and
Schedule C.
27
Figure 4. Composition Changes in the Self-Employed
Notes: Trends are presented as the fraction of SSA-reported workforce. “Primarily Wage Earner”
indicates that more than 85% of earnings are from wages. “Sole Proprietor (Primarily or with Wages)”
indicates that an individual files schedule C and has less than 85% of earnings from wages. Sole
proprietors with small business activity have less than $5,000 in business expenses and those with at
least $5,000 in business expenses are considered to have large business activity.
28
2014 Total
Filed Schedule
C
Received
Any W2
Received
Multiple
W2s
Received
Any
1099Misc
Received
Multiple
1099Miscs
Received
Any 1099K
Received
Multiple
1099Ks
Total non-dependent Filers 190,166,666 24,931,810 135,376,670 38,592,610 15,525,350 4,372,540 1,826,530 412,070
Has Earnings 145,941,290 22,491,370 135,376,670 38,592,610 14,590,320 4,092,990 1,635,850 366,600
Wages Only 126,540,900 5,514,700 126,540,900 35,860,500 3,957,200 651,300 453,000 53,000
Self-employment Income Only 10,564,620 9,348,660 5,368,060 1,985,190 845,180 231,580
With Wages and SE 8,835,770 7,628,010 8,835,770 2,732,110 5,265,060 1,456,500 337,670 82,020
Filed Schedule SE 19,400,390 16,917,080 8,835,770 2,732,110 10,633,120 3,441,690 1,182,850 313,600
With Schedule C Profit 16,834,250 16,834,250 7,558,690 2,431,360 9,927,960 3,310,400 1,142,780 308,340
With Schedule E Income (but no Schedule C profit) 1,242,550 82,830 572,300 111,410 279,750 66,740 21,850 2,830
With neither Schedule C Profit nor Schedule E 1,323,590 59,590 704,780 189,340 425,410 64,550 18,220 2,430
Filed Schedule C 24,931,810 24,931,810 13,142,710 4,150,030 10,929,550 3,615,540 1,342,710 356,160
Files Schedule SE for C Profit 16,834,250 16,834,250 7,558,690 2,431,360 9,927,960 3,310,400 1,142,780 308,340
Does not file SE 8,097,560 8,097,560 5,584,020 1,718,670 1,001,590 305,140 199,930 47,820
Of those with Earnings, Fraction with: 100.0% 15.4% 92.8% 26.4% 10.0% 2.8% 1.1% 0.3%
Wages Only 86.7% 3.8% 86.7% 24.6% 2.7% 0.4% 0.3% 0.0%
Self-employment Income Only 7.2% 6.4% 0.0% 0.0% 3.7% 1.4% 0.6% 0.2%
With Wages and SE 6.1% 5.2% 6.1% 1.9% 3.6% 1.0% 0.2% 0.1%
Of those who Filed Schedule SE, fraction with: 100.0% 87.2% 45.5% 14.1% 54.8% 17.7% 6.1% 1.6%
With Schedule C Profit 86.8% 86.8% 39.0% 12.5% 51.2% 17.1% 5.9% 1.6%
With Schedule E Income (but no Schedule C profit) 6.4% 0.4% 2.9% 0.6% 1.4% 0.3% 0.1% 0.0%
With neither Schedule C Profit nor Schedule E 6.8% 0.3% 3.6% 1.0% 2.2% 0.3% 0.1% 0.0%
Of those who Filed Schedule C, fraction with: 100.0% 100.0% 52.7% 16.6% 43.8% 14.5% 5.4% 1.4%
Files Schedule SE 67.5% 67.5% 30.3% 9.8% 39.8% 13.3% 4.6% 1.2%
Does not file SE 32.5% 32.5% 22.4% 6.9% 4.0% 1.2% 0.8% 0.2%
Table 1: Filing Characteristics and Information Returns of Employees, the Self-Employed, and Sole Proprietors (2014)
Notes: Sample is restricted to non-dependent filers.
Filers with either Schedule C or Schedule SEAll individuals filing a non-dependent return

29
Rank All Schedule C Filers Received 1099K Received 1099MISC
1 CONSULTING CONSULTING CONSULTING
2 REAL ESTATE SALES CONSTRUCTION
3 CONSTRUCTION HAIR SALON REAL ESTATE
4 CLEANING/JANITORIAL SERVICE SALES
5 SALES TAXI DRIVER TRUCKING/TRANSPORTATION
6 TRUCKING/TRANSPORTATION PHYSICIAN/DENTIST/CHIRO. SERVICE
7 SERVICE ATTORNEY CLEANING/JANITORIAL
8 HAIR STYLIST RETAIL INSURANCE
9 CHILD CARE TRUCKING/TRANSPORTATION CHILD CARE
10 LANDSCAPING RESTAURANT LANDSCAPING
Table 2: Top 10 Schedule C Descriptions and by Receipt of Third Party Form
30
Table 3: Classification of workers by source of earnings, size of business expenses, and type of activity
Based on 10% random sample of Schedule SE or Schedule C
(No earnings)Total
Less than
$5,000
$5,000 to
$10,000
$10,000 to
$25,000$25,000+
Receives
1099Misc/K
OTA Small
Business
Platform or
"Gig" Worker
Total employees, self-employed, or sole-proprietors 148,381,730 12,830,630 3,448,800 4,346,850 4,305,530 16,707,710 9,798,230 109,700
Wage Only (does not File C or SE) 121,026,200 2,115,500
Primarily Wage Earner 9,456,410 5,415,960 1,363,050 1,349,330 726,220 4,933,060 2,131,020 42,960
Earnings from both wages and sole proprietorship 3,452,910 2,170,070 424,380 469,440 389,020 2,107,420 1,108,040 21,440
Primarily Self-Employed Sole Proprietor 10,183,900 4,233,190 1,266,360 2,014,970 2,669,380 6,088,730 5,516,430 36,050
Primarily Partner, Farmer, or other SE filer 1,821,870 398,870 700
Files Schedule C but reports no earnings 2,440,440 1,011,410 395,010 513,110 520,910 1,064,130 1,042,740 8,550
As a share of each type of worker (denominator is column 1):
Total employees, self-employed, or sole-proprietors 100.0% 8.6% 2.3% 2.9% 2.9% 11.26% 6.6% 0.07%
Wage Only (does not File C or SE) 81.6% 1.43%
Primarily Wage Earner 6.4% 57.3% 14.4% 14.3% 7.7% 52.17% 22.5% 0.45%
Earnings from both wages and sole proprietorship 2.3% 62.8% 12.3% 13.6% 11.3% 61.03% 32.1% 0.62%
Primarily Self-Employed Sole Proprietor 6.9% 41.6% 12.4% 19.8% 26.2% 59.79% 54.2% 0.35%
Primarily Partner, Farmer, or other SE filer 1.2% 21.89%
Files Schedule C but reports no earnings 1.6% 41.4% 16.2% 21.0% 21.3% 43.60% 42.7% 0.35%
As a share of each expense or activity category (denominator is row 1):
Wage Only (does not File C or SE) 81.6% 12.7%
Primarily Wage Earner 6.4% 42.2% 39.5% 31.0% 16.9% 29.5% 21.7% 39.2%
Earnings from both wages and sole proprietorship 2.3% 16.9% 12.3% 10.8% 9.0% 12.6% 11.3% 19.5%
Primarily Self-Employed Sole Proprietor 6.9% 33.0% 36.7% 46.4% 62.0% 36.4% 56.3% 32.9%
Primarily Partner, Farmer, or other SE filer 1.2% 2.4%
Files Schedule C but reports no earnings 1.6% 7.9% 11.5% 11.8% 12.1% 6.4% 10.6% 7.8%
Schedule C Filers with Business Expenses of:
Note: “Wage only” indicates that an individual receives wages and did not file Schedule C nor SE. “Primarily wage earner” indicates an individual receives wages, filed Schedule C, and at
least 85 percent of earnings were from wages. “Earnings from both wages and sole proprietorship” indicates that between 15 and 85 percent of their earnings were from wages and files
both Schedule C and SE were filed. “Primarily self-employed sole proprietor” indicates that less than 15 percent of earnings were from wages and both Schedule C and SE were filed.
“Partner, Farmer, or other SE filer” indicates an individual filed Schedule SE without filing Schedule C and at least 15 percent of earnings were from self-employment income. “Files
Schedule C but reports no earnings” indicates that an individual filed Schedule C but reported no earnings from either wages or self-employment income reported on Schedule SE.
31
Table 4: Trends in Classification of Employees, the Self-Employed, and Sole-Proprietors
1% sample of Schedule SE Filers 2000 2002 2004 2006 2008 2010 2012 2014
Total Non-dependent Filers NA 171,864,279 174,468,765 183,329,101 187,997,840 189,148,254 189,740,148 189,356,583
Work Force (from SSA) 148,114,000 148,068,992 149,439,008 153,852,992 155,435,008 150,399,008 153,632,000 158,187,008
Schedule C Filers 18,210,055 19,241,918 20,954,049 22,407,056 22,878,114 23,285,783 23,840,701 24,931,810
Schedule SE Filers 14,953,900 15,314,700 16,609,300 17,817,900 17,957,300 18,421,200 19,074,100 19,311,600
Of SE Filers (excluding any C filers without SE income):
Primarily Wage Earner 2,510,100 2,482,800 2,725,300 3,101,700 3,238,900 3,129,200 3,195,400 3,416,300
Earnings from both wages and sole proprietorship 2,577,200 2,613,100 2,910,500 3,205,400 3,184,400 3,191,400 3,374,900 3,518,900
Business Activity: Less than $5,000 of Expenses 1,252,200 1,313,800 1,504,300 1,693,500 1,815,100 1,926,000 2,042,300 2,132,800
Business Activity: More than $5,000 of Expenses 1,325,000 1,299,300 1,406,200 1,511,900 1,369,300 1,265,400 1,332,600 1,386,100
Primarily Self-Employed Sole Proprietor 7,818,900 8,281,200 9,066,000 9,552,000 9,609,000 10,165,200 10,496,700 10,375,800
Business Activity: Less than $5,000 of Expenses 2,190,000 2,483,000 2,851,400 3,115,400 3,520,200 4,170,800 4,306,900 4,125,200
Business Activity: More than $5,000 of Expenses 5,628,900 5,798,200 6,214,600 6,436,600 6,088,800 5,994,400 6,189,800 6,250,600
Partner, Farmer, or other SE filer 2,047,700 1,937,600 1,907,500 1,958,800 1,925,000 1,935,400 2,007,100 2,000,600
OTA Small Business Owner (w/ SE Earnings) 6,252,300 6,450,700 7,036,900 7,533,600 7,190,600 7,020,200 7,375,000 7,597,900
SE Earnings from Schedule C Profit 12,632,800 13,032,600 14,327,700 15,440,400 15,602,500 16,079,500 16,667,600 16,926,400
Size of Business Activity (all Schedule C filers with SE Income)
Less than $5,000 of Expenses 5,192,600 5,538,000 6,276,200 7,032,900 7,730,400 8,405,000 8,737,700 8,840,200
More than $5,000 of Expenses 7,713,600 7,839,100 8,425,600 8,826,200 8,301,900 8,080,800 8,329,300 8,470,800
Has 1099-MISC (SE Filers) 7,337,400 7,552,500 8,308,500 9,006,700 8,943,300 8,825,800 9,238,700 9,526,900
Has 1099-K (SE Filers 821,500 897,900
Note: Sample includes individuals filing Schedule SE. Prior to 2008, individuals filing Schedule C but not SE could not be separately identified in the data. Relative to the 2014
sample analyzed elsewhere, the excluded individuals are (1) those who have wage earnings, file schedule C (showing no profit), and thus do not file Schedule SE and (2)
individuals without earnings (either from wages or self-employment) but who file Schedule C (showing no profit).
32
Table 4 Continued: Trends in Classification of Employees, the Self-Employed, and Sole-Proprietors, continued, as a share of the SSA workforce
Based on 1% random sample of Schedule SE Filers 2000 2002 2004 2006 2008 2010 2012 2014
Schedule C Filers 12.3% 13.0% 14.0% 14.6% 14.7% 15.5% 15.5% 15.8%
Schedule SE Filers 10.1% 10.3% 11.1% 11.6% 11.6% 12.2% 12.4% 12.2%
Of SE Filers (excluding any C filers without SE income):
Primarily Wage Earner 1.7% 1.7% 1.8% 2.0% 2.1% 2.1% 2.1% 2.2%
Earnings from both wages and sole proprietorship 1.7% 1.8% 1.9% 2.1% 2.0% 2.1% 2.2% 2.2%
Business Activity: Less than $5,000 of Expenses 0.8% 0.9% 1.0% 1.1% 1.2% 1.3% 1.3% 1.3%
Business Activity: More than $5,000 of Expenses 0.9% 0.9% 0.9% 1.0% 0.9% 0.8% 0.9% 0.9%
Primarily Self-Employed Sole Proprietor 5.3% 5.6% 6.1% 6.2% 6.2% 6.8% 6.8% 6.6%
Business Activity: Less than $5,000 of Expenses 1.5% 1.7% 1.9% 2.0% 2.3% 2.8% 2.8% 2.6%
Business Activity: More than $5,000 of Expenses 3.8% 3.9% 4.2% 4.2% 3.9% 4.0% 4.0% 4.0%
Partner, Farmer, or other SE filer 1.4% 1.3% 1.3% 1.3% 1.2% 1.3% 1.3% 1.3%
OTA Small Business Owner (w/ SE Earnings) 4.2% 4.4% 4.7% 4.9% 4.6% 4.7% 4.8% 4.8%
SE Earnings from Schedule C Profit 8.5% 8.8% 9.6% 10.0% 10.0% 10.7% 10.8% 10.7%
Size of Business Activity (all Schedule C filers with SE Income)
Less than $5,000 of Expenses 3.5% 3.7% 4.2% 4.6% 5.0% 5.6% 5.7% 5.6%
More than $5,000 of Expenses 5.2% 5.3% 5.6% 5.7% 5.3% 5.4% 5.4% 5.4%
Has 1099-MISC (SE Filers) 5.0% 5.1% 5.6% 5.9% 5.8% 5.9% 6.0% 6.0%
Has 1099-K (SE Filers 0.5% 0.6%
33
Table 5: Demographic Characteristics of Employees, the Self-Employed, and Sole-Proprietors
Male Married Has Children
18-24 25-39 40-54 55-64 65-100 Mean Median
Total employees, self-employed, or sole-proprietors 51% 52% 42% 9% 33% 32% 18% 7% 44 43
Wage Only (does not File C or SE) 50% 50% 41% 10% 34% 32% 17% 6% 43 42
Primarily Wage Earner 58% 58% 45% 4% 32% 38% 19% 6% 45 45
Earnings from both wages and sole proprietorship 50% 47% 53% 10% 38% 31% 15% 7% 42 41
Business Activity: Less than $5,000 of Business Exp. 42% 40% 56% 13% 41% 26% 13% 7% 40 37
Business Activity: More than $5,000 of Business Exp. 63% 59% 47% 4% 32% 38% 19% 7% 45 45
Primarily Self-Employed Sole Proprietor 56% 56% 47% 3% 27% 34% 21% 14% 48 48
Business Activity: Less than $5,000 of Business Exp. 43% 48% 52% 6% 32% 29% 17% 16% 47 45
Business Activity: More than $5,000 of Business Exp. 66% 62% 44% 2% 23% 38% 24% 13% 50 50
Partner, Farmer, or other SE filer 68% 74% 40% 2% 20% 34% 24% 20% 52 52
Schedule C no earnings 54% 69% 28% 2% 15% 25% 23% 35% 57 59
Business Activity: Less than $5,000 of Business Exp. 45% 70% 28% 2% 15% 20% 21% 42% 58 61
Business Activity: More than $5,000 of Business Exp. 60% 69% 28% 1% 15% 28% 24% 31% 56 57
Small Business Filer 66% 61% 44% 2% 25% 38% 22% 12% 49 49
"Gig" or Platform Worker 85% 46% 44% 5% 49% 33% 11% 3% 40 38
Notes: Primarily wage earner indicates that more than 85% of earnings are from wages. "Small Business filer" is defined using the criteria in Knittel et al 2011 using a de minimis test (at least
$10,000 of business expenses or profits, or $15,000 in combined business expenses and profits and a business activity test (having at least $5,000 of business expenses). A gig worker reports
the occupation of their sole proprietorship to include specific words and phrases such as ride share or ridesharing; or the names of specific platform providers; or 1099 payments from those
sources.
Age Groups Age
34
Table 6: Economic Characteristics of Employees, the Self-Employed, and Sole-Proprietors
Profit
(Loss)
Gross
ReceiptsExpenses
Total employees, self-employed, or sole-proprietors83,134 22% 21% 17% 20% 20% 11% 47,396 43,806 3,590 12,587 37,970 25,383
Wage Only (does not File C or SE) 79,304 19% 22% 18% 21% 20% 2% 47,325 47,325
Primarily Wage Earner 121,607 14% 18% 18% 23% 28% 52% 70,969 69,372 1,597 (2,005) 10,945 12,950
Earnings from both wages and sole proprietorship83,425 42% 16% 11% 13% 17% 61% 43,113 24,731 18,381 17,794 36,437 18,643
Business Activity: Less than $5,000 of Business Exp. 64,683 53% 14% 9% 11% 12% 53% 30,636 18,177 12,459 11,048 12,243 1,194
Business Activity: More than $5,000 of Business Exp. 115,131 24% 19% 15% 17% 25% 74% 64,218 35,818 28,399 29,205 77,365 48,160
Primarily Self-Employed Sole Proprietor 66,373 45% 17% 11% 12% 14% 60% 28,146 188 27,957 28,021 65,105 37,084
Business Activity: Less than $5,000 of Business Exp. 55,450 59% 13% 8% 10% 11% 46% 14,483 147 14,336 12,836 14,261 1,425
Business Activity: More than $5,000 of Business Exp. 74,144 35% 20% 14% 14% 17% 70% 37,865 218 37,647 38,823 101,274 62,451
Partner, Farmer, or other SE filer 242,859 23% 13% 13% 16% 34% 22% 108,983 15,993 92,991
Schedule C no earnings 74,310 37% 15% 14% 16% 17% 44% (6,240) 24,958 31,198
Business Activity: Less than $5,000 of Business Exp. 90,017 31% 14% 14% 19% 21% 31% 145 2,129 1,984
Business Activity: More than $5,000 of Business Exp. 63,194 42% 15% 14% 14% 15% 52% (10,759) 41,115 51,874
Small Business Filer 88,859 30% 20% 15% 16% 20% 65% 46,853 20,500 26,353 23,651 82,658 59,008
"Gig" or Platform Worker 37,041 42% 26% 15% 12% 5% 97% 23,778 17,468 6,311 5,678 19,669 13,991
Notes: Primarily wage earner indicates that more than 85% of earnings are from wages. "Small Business filer" is defined using the criteria in Knittel et al 2011 using a de minimis test (at least $10,000 of business
expenses or profits, or $15,000 in combined business expenses and profits and a business activity test (having at least $5,000 of business expenses). A gig worker reports the occupation of their sole proprietorship to
include specific words and phrases such as ride share or ridesharing; or the names of specific platform providers; or 1099 payments from those sources.
Schedule C:
SE EarningsWagesTotal
Earnings
Received
1099
Misc/K
AGI ≥
$110,000
$65,000
≤ AGI <
$110,000
$40,000
≤ AGI <
$65,000
$20,000
≤ AGI <
$40,000
AGI <
$20,000AGI
35
Table 7: Health Insurance Coverage of Employees, the Self-Employed, and Sole-Proprietors
Covered by
Health
Insurance
Marketplace
Coverage
SE Health
Deduction
Claimed
ExemptionPaid Penalty
Total employees, self-employed, or sole-proprietors 86.2% 3.6% 3.9% 8.4% 6.0%
Wage Only (does not File C or SE) 87.1% 2.9% 1.5% 7.7% 5.8%
Primarily Wage Earner 89.7% 4.2% 5.0% 5.8% 5.0%
Earnings from both wages and sole proprietorship 78.4% 7.3% 12.6% 13.8% 8.8%
Business Activity: Less than $5,000 of Business Exp. 77.4% 6.1% 7.5% 15.5% 8.0%
Business Activity: More than $5,000 of Business Exp. 80.1% 9.5% 21.3% 10.9% 10.1%
Primarily Self-Employed Sole Proprietor 74.7% 9.5% 22.3% 17.3% 9.0%
Business Activity: Less than $5,000 of Business Exp. 74.1% 6.7% 11.8% 19.8% 7.0%
Business Activity: More than $5,000 of Business Exp. 75.2% 11.4% 29.8% 15.5% 10.5%
Partner, Farmer, or other SE filer 89.3% 6.3% 33.4% 6.4% 4.8%
Schedule C no earnings 85.5% 5.5% 6.1% 11.7% 3.1%
Business Activity: Less than $5,000 of Business Exp. 88.1% 4.3% 6.5% 9.6% 2.6%
Business Activity: More than $5,000 of Business Exp. 83.6% 6.4% 5.8% 13.2% 3.5%
Small Business Filer 79.8% 9.3% 21.8% 12.4% 8.8%
"Gig" or Platform Worker 75.5% 11.0% 4.5% 15.8% 9.6%
Note: "Covered by health insurance" indicates that the taxpayer did not either pay any penalty nor claim any exemption for anyone in their tax unit.
"Marketplace Coverage" indicates that the individual was covered by an healthcare marketplace exchange plan, according to Form 1095-A. "SE
Health Deduction" indicates that the individual claimed an above-the-line deduction for self-employed health insurance outlays on their 1040.
"Claimed Exemption" indicates that the individual claimed an exemption, according to form 8965 . "Paid Penalty" indicates that a household made a
healthcare individual responsibility payment on line 61 of form 1040.
36
Table 8: Health Insurance Coverage by Income Class of Employees, the Self-Employed, and Sole-Proprietors
Covered by
Health
Insurance
Marketplace
Coverage
Covered by
Health
Insurance
Marketplace
Coverage
Covered by
Health
Insurance
Marketplace
Coverage
Covered by
Health
Insurance
Marketplace
Coverage
Covered by
Health
Insurance
Marketplace
Coverage
Total employees, self-employed, or sole-proprietors 69.5% 5.4% 79.8% 6.2% 89.1% 3.7% 95.8% 1.6% 98.7% 0.7%
Wage Only (does not File C or SE) 70.3% 4.3% 80.6% 5.1% 89.5% 3.0% 96.0% 1.2% 98.8% 0.5%
Primarily Wage Earner 72.8% 8.8% 81.7% 7.9% 89.1% 4.6% 95.5% 2.0% 98.7% 1.0%
Earnings from both wages and sole proprietorship 68.8% 6.5% 69.4% 14.6% 81.4% 10.5% 92.5% 5.3% 97.7% 2.2%
Business Activity: Less than $5,000 of Business Exp. 70.4% 4.8% 70.2% 13.2% 82.6% 9.5% 93.4% 4.7% 97.9% 2.0%
Business Activity: More than $5,000 of Business Exp. 63.0% 12.7% 68.5% 16.3% 80.2% 11.5% 91.6% 6.0% 97.5% 2.3%
Primarily Self-Employed Sole Proprietor 63.3% 9.2% 67.7% 17.4% 82.0% 12.0% 92.6% 5.1% 97.5% 2.4%
Business Activity: Less than $5,000 of Business Exp. 65.8% 5.9% 69.9% 14.9% 84.2% 9.5% 94.3% 3.9% 98.1% 1.8%
Business Activity: More than $5,000 of Business Exp. 60.3% 13.1% 66.7% 18.5% 81.0% 13.1% 91.7% 5.7% 97.2% 2.7%
Partner, Farmer, or other SE filer 79.2% 7.1% 79.2% 15.3% 87.9% 10.3% 94.1% 4.6% 98.3% 1.5%
Schedule C no earnings 73.3% 8.0% 84.6% 8.1% 91.3% 5.0% 96.1% 2.2% 97.7% 1.5%
Business Activity: Less than $5,000 of Business Exp. 76.5% 6.0% 84.7% 7.5% 91.3% 4.6% 96.3% 2.0% 98.1% 1.3%
Business Activity: More than $5,000 of Business Exp. 71.6% 9.1% 84.5% 8.4% 91.2% 5.3% 95.8% 2.5% 97.3% 1.7%
Small Business Filer 64.3% 12.2% 72.4% 14.9% 83.6% 10.3% 92.8% 4.8% 97.5% 2.2%
"Gig" or Platform Worker 65.9% 12.9% 75.2% 14.4% 83.9% 8.0% 92.7% 3.6% 95.0% 2.1%
Adjusted Gross Income Class (AGI)
Note: "Covered by health insurance" indicates that the taxpayer did not either pay any penalty nor claim any exemption for anyone in their tax unit. "Marketplace Coverage" indicates that the individual was
covered by an healthcare marketplace exchange plan, according to Form 1095-A.
$65,000 ≤ AGI < $110,000 AGI > $110,000AGI < $20,000 $20,000 ≤ AGI < $40,000 $40,000 ≤ AGI < $65,000
37
Table 9: Retirement Coverage of Employees, the Self-Employed, and Sole-Proprietors
Made Any
Contribution
Offered
Employer Plan
Contributed to
Employer Plan
Contributed to
IRA
Contributed to
Traditional IRA
Contributed to
Roth IRA
Had a Positive
IRA Balance
Total employees, self-employed, or sole-proprietors 38.3% 47.9% 34.8% 6.2% 2.5% 3.8% 27.4%
Wage Only (does not File C or SE) 41.9% 53.4% 38.9% 5.8% 2.2% 3.8% 25.8%
Primarily Wage Earner 44.9% 56.0% 39.9% 8.7% 3.7% 5.3% 36.5%
Earnings from both wages and sole proprietorship 21.3% 24.6% 15.3% 7.6% 3.8% 4.1% 28.8%
Business Activity: Less than $5,000 of Business Exp. 17.3% 21.0% 12.6% 6.1% 2.8% 3.4% 23.2%
Business Activity: More than $5,000 of Business Exp. 27.9% 30.6% 20.0% 10.2% 5.4% 5.1% 38.2%
Primarily Self-Employed Sole Proprietor 7.8% 0.8% 0.3% 7.6% 4.2% 3.5% 31.1%
Business Activity: Less than $5,000 of Business Exp. 5.0% 0.7% 0.2% 4.8% 2.5% 2.4% 23.8%
Business Activity: More than $5,000 of Business Exp. 9.8% 0.8% 0.3% 9.5% 5.5% 4.3% 36.3%
Partner, Farmer, or other SE filer 17.0% 11.0% 7.2% 10.7% 6.4% 4.5% 47.6%
Schedule C no earnings 4.4% 0.0% 0.0% 4.4% 2.2% 2.2% 38.8%
Business Activity: Less than $5,000 of Business Exp. 4.3% 0.0% 0.0% 4.3% 2.2% 2.2% 43.8%
Business Activity: More than $5,000 of Business Exp. 4.4% 0.0% 0.0% 4.4% 2.3% 2.2% 35.2%
Small Business Filer 18.8% 15.6% 10.9% 8.8% 4.8% 4.2% 35.8%
"Gig" or Platform Worker 18.8% 22.3% 15.9% 4.1% 1.3% 2.9% 14.8%
Note: "Made Any Contribution" indicates individual contributed to an Employer Plan or made a contribution to a traditional or roth IRA. "Offered Employer Plan" indicates that the
retirement plan indicator is checked on Form W-2, Box 13. "Contributed to Employer Plan" indicates that the individual had a positive amount of elective deferrals on Form W-2, Box
12. "Contributed to IRA" indicates an individual either contributed to a Traditional IRA and/or a Roth IRA. "Contributed to Traditional IRA" indicates a positive amount of contribution
to a traditional IRA on Form 5498, Box 1. "Contributed to Roth IRA" indicates a positive amount of contribution to a Roth IRA on Form 5498, box 10. "Had a Positive IRA Balance"
indicates a positive amount of Fair Market Value of all accounts at the end of year on Form 5498, Box 5.
38
Table 10: Retirement Coverage by Income Class of Employees, the Self-Employed, and Sole-Proprietors
Employer
PlanAny Plan
Employer
PlanAny Plan
Employer
PlanAny Plan
Employer
PlanAny Plan
Employer
PlanAny Plan
All workers 8.5% 9.8% 27.1% 29.5% 38.6% 42.3% 46.6% 51.5% 55.8% 61.7%
Wage Only (does not File C or SE) 10.4% 11.4% 29.7% 31.5% 42.0% 45.0% 50.6% 54.6% 61.9% 66.8%
Primarily Wage Earner 15.5% 17.9% 29.3% 32.6% 37.7% 42.7% 45.1% 51.3% 55.9% 62.3%
Earnings from both wages and sole proprietorship 4.9% 6.7% 12.3% 18.1% 18.8% 27.1% 24.3% 35.1% 35.0% 45.7%
Business Activity: Less than $5,000 of Business Exp. 4.7% 6.0% 12.5% 17.9% 18.8% 26.8% 23.0% 33.4% 32.8% 44.2%
Business Activity: More than $5,000 of Business Exp. 5.7% 9.6% 12.1% 18.3% 18.7% 27.6% 25.6% 36.9% 36.9% 47.0%
Primarily Self-Employed Sole Proprietor 0.1% 2.7% 0.2% 7.0% 0.3% 11.1% 0.4% 14.9% 0.9% 15.9%
Business Activity: Less than $5,000 of Business Exp. 0.2% 1.5% 0.2% 5.1% 0.3% 8.5% 0.3% 12.0% 0.7% 14.8%
Business Activity: More than $5,000 of Business Exp. 0.1% 4.1% 0.2% 7.9% 0.3% 12.2% 0.4% 16.3% 1.0% 16.5%
Partner, Farmer, or other SE filer 1.5% 4.7% 5.3% 13.9% 7.8% 19.5% 9.2% 22.8% 10.6% 22.8%
Schedule C no earnings 0.0% 2.1% 0.0% 3.3% 0.0% 4.6% 0.0% 6.0% 0.0% 8.4%
Business Activity: Less than $5,000 of Business Exp. 0.0% 1.4% 0.0% 2.8% 0.0% 3.9% 0.0% 5.8% 0.0% 8.5%
Business Activity: More than $5,000 of Business Exp. 0.0% 2.4% 0.0% 3.7% 0.0% 5.1% 0.0% 6.3% 0.0% 8.2%
Small Business Filer 3.6% 7.3% 9.1% 15.3% 11.7% 21.0% 14.6% 26.6% 20.4% 32.0%
"Gig" or Platform Worker 3.9% 5.9% 14.9% 17.1% 30.2% 34.8% 33.4% 37.7% 38.6% 45.7%
Contributions to Retirement Plans by Adjusted Gross Income Class (AGI)
Note: "Made Any Contribution" indicates individual contributed to an Employer Plan or made a contribution to a traditional or roth IRA. "Contributed to Employer Plan"
indicates that the individual had a positive amount of elective deferrals on Form W-2, Box 12.
$65,000 ≤ AGI <
$110,000AGI > $110,000AGI < $20,000
$20,000 ≤ AGI
< $40,000
$40,000 ≤ AGI <
$65,000
39
Appendix I: Sources of Data
The primary source for this analysis are administrative tax records including information from
individual returns (e.g. form 1040, 1040A, and 1040EZ); Schedule C Profit or loss from business;
Schedule SE Self-Employment Tax; and information returns including Form W-2 Wage and Tax
Statement, 1099-MISC Miscellaneous Income, 1099-K Payment Card and Third Party Network
Transactions; and 1095-A Health Insurance Marketplace Statement.
These forms are designed to facilitate tax administration and compliance for income and payroll taxes,
and hence have both advantages and disadvantages for understanding the characteristics of the self-
employed population.
The primary focus of this analysis are individuals who file both Schedule C, the form for reporting a
profit or loss from operation of a sole-proprietorship, and Schedule SE, which is used to report earned
income subject to Self-Employment Tax. Individuals that report a profit from a sole proprietorship are
generally required to pay self-employment tax, and thus meet one potential definition of ‘self-
employed.’
Some individuals who file Schedule C incur a business loss and hence produce no self-employment
income. These filers are not required to file Schedule SE. (In fact, the filing threshold for Schedule SE is
$400, so filers with Schedule C profit less than $400 generally do not file a SE.) About 12.5 percent of
Schedule C filers do not file a corresponding SE. These individuals may consider themselves self-
employed, but will not appear as Schedule SE filers in administrative records (including, for instance,
Social Security Administration employment records).
Schedule SE is used to assess self-employment tax for not just sole proprietors, but also income of
partners in partnerships (e.g. from Schedule K-1 (Form 1065), box 14), farm income (from Schedule F,
farm profit or loss), and income of ministers and members of religious orders. Roughly 12 percent of
individuals filing schedule SE appear to use the form to report income from sources other than Schedule
C. These individuals may identify as self-employed business owners, partners, or employees or
executives of partnerships.
40
To provide more detail on their sources of income and benefits, we match information returns received
to individuals with earnings or filing Schedule C. Paid work can be reported on any of three types of
information returns summarizing the amounts of payments they received in the previous year:
W-2s report payments to workers considered employees of the business for whom they provided
services. This form reports, among other items, their wages and withholding of income taxes and
employment taxes. Every employer engaged in a trade or business who pays remuneration, including
noncash payments, of $600 or more for the year for services performed by an employee must provide
their workers with a W-2.
1099-MISC – Miscellaneous Income with “nonemployee compensation” (NEC).25
Companies send
these to workers if the company considers the individual an independent contractor who does not meet
the tests for classification as an employee. This form reports the gross payments from the firm to the
worker, with no withholding of income or employment taxes, except as backup withholding if a valid
social security number or other taxpayer identification number (TIN) is missing or erroneous.
The main determinant of whether someone is an independent contractor or employee is whether the
service recipient (the employer) has the right to control not only the result of the worker’s services but
also the means by which the worker accomplishes that result. The issue of worker classification is often
complex and contentious and has been the subject of an Administration Budget proposal for several
years.
Reporting is required if nonemployee compensation equals $600 or more. Nonemployee compensation
includes many disparate types of payments including: payments for professional services (e.g., legal
fees); golden parachute payments; payments for working interests in gas and oil; directors’ fees; certain
travel reimbursements; and fish purchased for cash.
1099-MISC can be issued to individuals or businesses but generally not to corporations except for
attorneys’ fees. A contract worker can receive Form 1099-MISCs based on either an individual SSN or
an EIN. It is difficult to know whether increases in Form 1099-MISCs to EINs reflect an increase in
business-to-business payments (like increases in reporting of legal fees made to law firms) or increases
in self-employment and contracting (where the individual recipient has obtained an EIN). 1099-MISC –
25
In discussing the 1099-MISC, we sometimes refer to the 1099-MISC and sometimes a 1099-MISC – NEC.
41
NEC are issued for payments made in the course of a trade or business (broadly defined). Payments for
merchandise and personal payments are not reportable.
The dollar values are gross payments to nonemployees and thus not necessarily labor or wage income.
For instance, if a company paid a caterer $10,000 for catering an event and issued a Form 1099-MISC
for $10,000, that payment might reflect $9,000 of food and employee wages but only $1,000 in
compensation to the caterer. In this regard, reporting of Form 1099-MISCs is required only of payments
made in the course of a trade or business. While a contract worker could receive a Form 1099-MISC
from a business, a self-employed handyman will not receive a Form 1099-MISC from a homeowner. In
addition, only payments that total $600 or more to an individual payee need be reported, further limiting
the coverage of Form 1099-MISC reporting.
In 2000, 15.5 million individuals were issued Form 1099-MISC with nonemployee compensation, and
this figure grew to 17.8 million in 2012, an increase of about 15 percent, most of which occurred by
2005, before the advent of many well-known on-demand economy companies. Over the same time
period (2000 – 2012), the number of individual income tax returns increased by about 12 percent, an
increase similar to the growth in individuals issued Forms 1099-MISC with nonemployee compensation.
1099-K – Payment Card and Third Party Network Transactions reports information on payments
made by debit and credit card companies and third-party settlement organizations (TPSO) to providers
of services or goods. TPSOs are central organizations that make payments to payees of third-party
network transactions. The TPSO typically provides a framework of some sort (e.g., a web site) through
which customers and service providers make transactions. The TPSO collects the payments made by
customers and then sends the proceeds to the service suppliers. Well-known examples include PayPal
and Amazon. Form 1099-K was introduced in 2011 as a result of legislation enacted earlier by Congress.
Reporting by TPSOs is required only if payments exceed $20,000 and 200 transactions per payee.
(Workers are still required to include payments under $20,000 in their self-employment earnings.) There
is no de minimis threshold for payment card transactions. The form reports all credit, debit, and third-
party network transactions in the economy. Hence, form 1099-Ks report not just most forms of e-
commerce but all types of payment card transactions, such as using a credit or debit card at a brick-and-
mortar grocery store, restaurant, or other retailer.
42
If a payment settlement entity (PSE) has contracted with an electronic payment facilitator (EPF) to make
the payments to the merchant on its behalf, the EPF needs to file the 1099-K.
Note that while these information returns generally provide the bulk of reported earnings, payments
below $600 need not be reported on W-2s or 1099-MISCs, and 1099-Ks need not be filed for recipients
of less than $20,000 in payment and few than 200 transactions. Payments below these thresholds will be
missed. These payments should still be reported on the worker’s 1040 tax return as would be cash
payments but compliance is likely lower on payments not subject to information return reporting.
However, these different reporting levels may make it difficult to get a complete estimate of third-party
reported receipts among some taxpayers.
By their nature, W-2 payments will generally appear on line 7 of the 1040 tax return. 1099-MISC and
1099-K payments to individuals generally are treated as Schedule C or C-EZ sole proprietorship
business income and would be reported on 1040 line 12, after deducting any expenses connected to the
earning of those payments. That amount of net income would also generally be subject to self-
employment taxes and reported on Schedule SE line 2.
These information returns generally show an EIN for the payer and an SSN for the recipient. While
some issuers may have SSNs (some sole proprietors) and some recipients may have EINS (partnerships
or sole proprietorships and lawyers organized as corporations), we focus on the standard situation where
information returns are issued by a business EIN to an individual’s SSN. One of our goals is to trace
back to the business and collect information on characteristics (such as size, industry, and type of entity)
of the businesses issuing the different types of information returns.
In 2013, 5.5 million individuals and businesses were issued Form 1099-Ks, less than a 2-percent
increase over the 5.4 million sent in 2011. In 2013, $5.4 trillion in payment card or third-party network
transactions were reported on Form 1099-Ks. This was an increase in volume of 15 percent over 2011,
the first year that the form was used.
43
Appendix II: Tax Filing and Compliance
Forms 1099-MISC and 1099-K are intended to promote tax compliance and ease administration by
providing third-party reporting on payments to business owners. Form 1099MISC, Box 7 Nonemployee
compensation is intended to provide information on payments to non-employees, and business filers are
required to issue 1099-MISC to individuals to whom they pay at least $600 of payments. The 1099-K is
intended to show payment card and providers and third party network transactions. Payment card
settlement reporting is required for all payments; a de minimus test requires only that third party
payment processers to issue Ks to individuals that received at least $20,000 or payments and had at least
200 transactions. In practice, many third party payment processers issue Ks to all their participants.
Appendix Figures A1 and A2 show the distribution of dollar amounts on the largest 1099-MISC and
1099-Ks received by individual taxpayers filing schedule C. Appendix Figure A1, which shows the
distribution of dollar amounts of 1099-MISC, shows that relatively few payers issue MISCs for amounts
less than $600; the spike at $600 shows about 6 percent of all recipients of MISCs receive a MISC for
between $600 and $899. More generally, MISCs are often issued in round numbers—as might be natural
for agreement between an employer and a contractor over the cost of a project—which explains the
‘spikes’ at those round dollar amounts (e.g. $5,000, $10,000, $15,000).
In contrast, Appendix Figure A2 shows that 1099-Ks tend to be issued for relatively small dollar
amounts, with almost 9 percent issued for less than $1,000. Moreover, while there is a clear increase in
the number of 1099-Ks at $20,000 the discontinuity is modest, with about 0.9 percent of all Ks issued
for between $19,000 and $19,999 and 1.3 percent issued for between $20,000 and $20,999. In addition,
Ks tend not to show bunching at round numbers, which is intuitive as the K amounts generally reflect
the sum of payments for individual transactions (e.g. the sum of payments for a driver’s ride sharing
services, or total credit card payments at a nail salon).
Indeed, taxpayers receive Ks for diverse reasons. While the K was originally conceived for monitoring
payments from banks or credit card companies to monitor receipts at businesses, the K is also used to
report payments through online platforms or online third-party payment networks. As a result, recipients
of Ks include retailers, restaurants, dentists, doctors, chiropractors, online merchants or retailers, and gig
economy workers.
44
The purpose of the 1099 reporting is to reinforce tax compliance by providing third-party reporting on
payments to individuals that would otherwise not be subject to wage reporting or other tax withholding.
While the data we use in this paper is conditional on having filed Schedule C, and thus is not designed to
measure the effect of 1099 reporting on whether a person files a return, it provides some indication of
how the dollar amounts reported on 1099s affect the amounts reported on Schedule C, including
receipts, deductions, profit or loss, and thus income subject to income and payroll taxes.
Appendix Table A3 below shows basic regression coefficients of payments reported on the relevant
1099 to receipts and profits reported by business owners in different activities. In practice, the 1099-K
and 1099-MISC have different implications for sole proprietors depending on how their businesses are
structured and the types of services they provide.
For instance, among small business owners filing Schedule C, each dollar of 1099-K payments is
associated with $1.06 dollars of additional receipts, which would be consistent with 1099-Ks increasing
reporting and providing a proxy for the scale of the business (e.g. businesses with a lot of receipts from
credit card transactions are also likely to have a lot of cash transactions). However, each $1 of K
payments is associated with only $0.13 of additional profit (suggesting, for instance, that a sizable share
of gross receipts covers costs of goods sold or other business expenses).
Among Schedule C filers with fewer than $5,000 of business expenses—payments reported on Ks and
MISCs also translate almost one-for-one with higher receipts. For 1099-MISC recipients, essentially all
of these receipts represent profit (or compensation for labor services). For 1099-K payments, each $1 of
K payments is associated with $0.26 of higher profits. Among “gig economy workers,” there is a
similarly tight relationship between payments from 1099s and receipts, and a similar pattern of higher
reported receipts translating into higher reported taxable profits. These estimates are consistent with the
more general experience with third-party reporting, which suggests that they encourage voluntary tax
compliance.
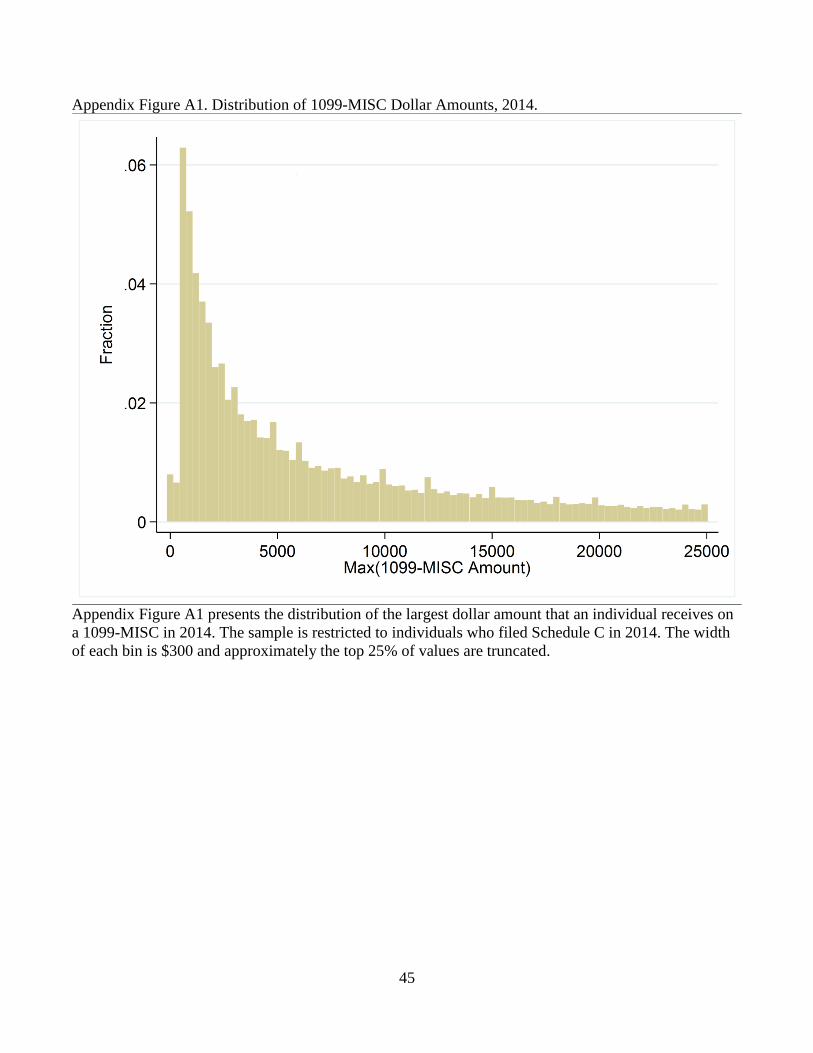
45
Appendix Figure A1. Distribution of 1099-MISC Dollar Amounts, 2014.
Appendix Figure A1 presents the distribution of the largest dollar amount that an individual receives on
a 1099-MISC in 2014. The sample is restricted to individuals who filed Schedule C in 2014. The width
of each bin is $300 and approximately the top 25% of values are truncated.
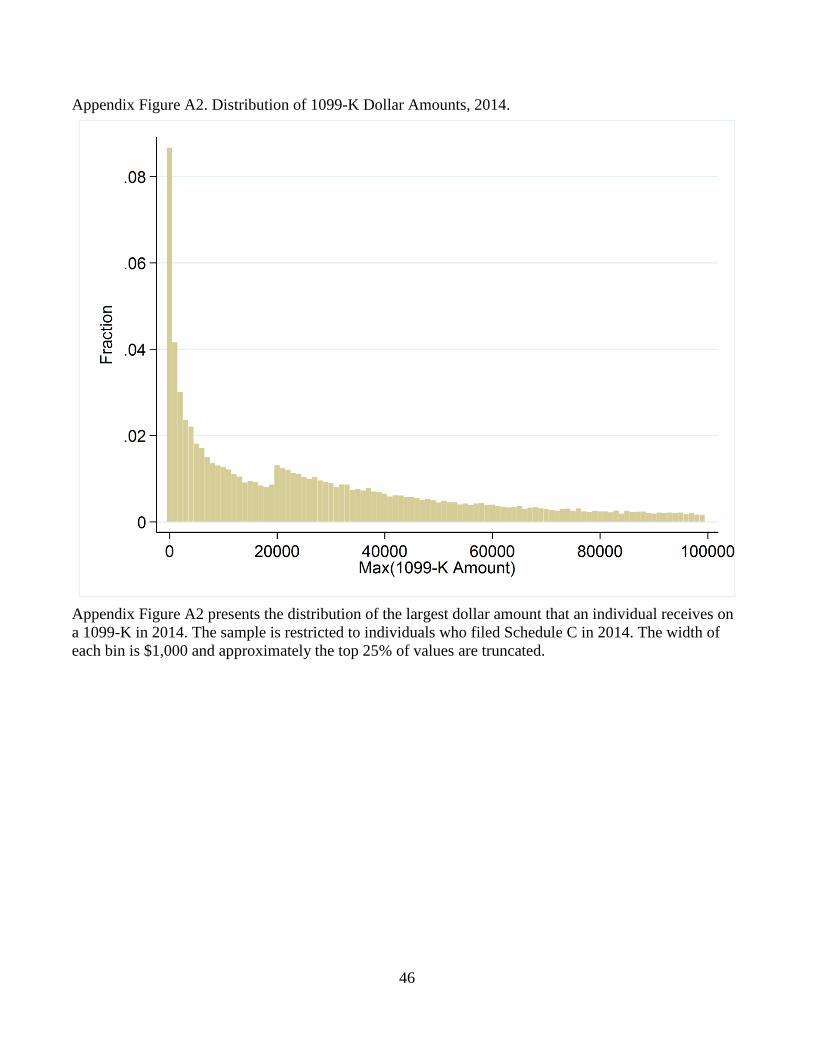
46
Appendix Figure A2. Distribution of 1099-K Dollar Amounts, 2014.
Appendix Figure A2 presents the distribution of the largest dollar amount that an individual receives on
a 1099-K in 2014. The sample is restricted to individuals who filed Schedule C in 2014. The width of
each bin is $1,000 and approximately the top 25% of values are truncated.
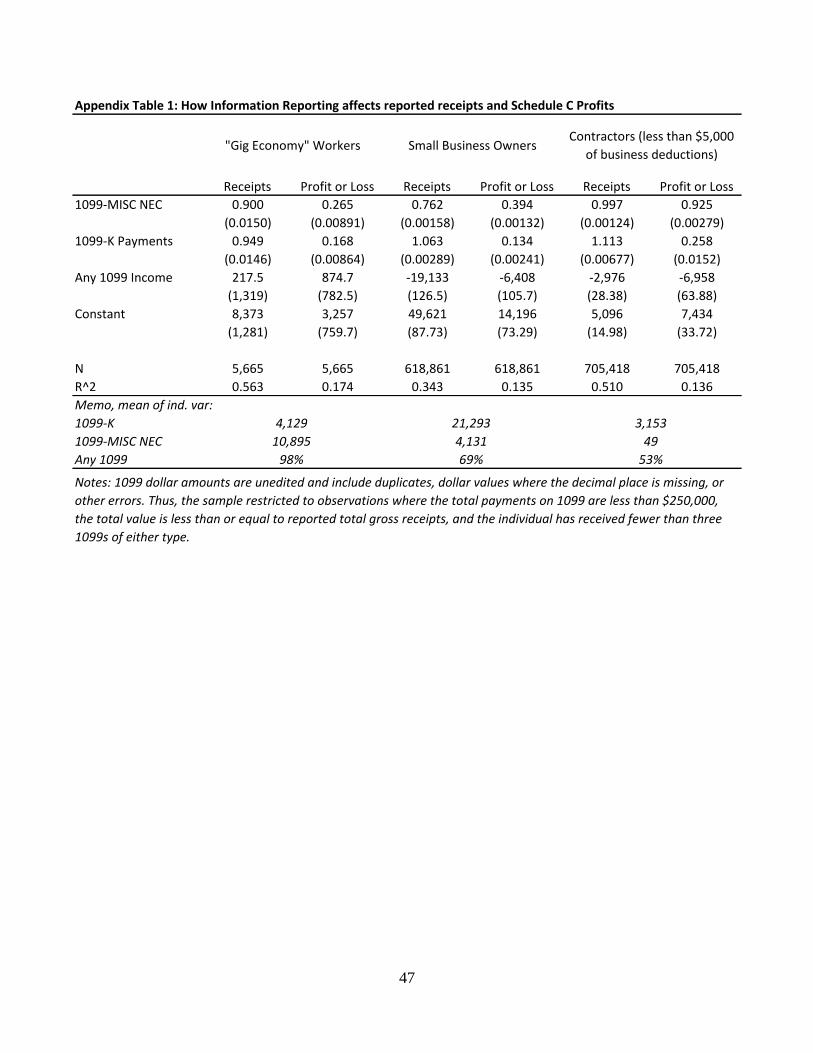
47
Receipts Profit or Loss Receipts Profit or Loss Receipts Profit or Loss
1099-MISC NEC 0.900 0.265 0.762 0.394 0.997 0.925
(0.0150) (0.00891) (0.00158) (0.00132) (0.00124) (0.00279)
1099-K Payments 0.949 0.168 1.063 0.134 1.113 0.258
(0.0146) (0.00864) (0.00289) (0.00241) (0.00677) (0.0152)
Any 1099 Income 217.5 874.7 -19,133 -6,408 -2,976 -6,958
(1,319) (782.5) (126.5) (105.7) (28.38) (63.88)
Constant 8,373 3,257 49,621 14,196 5,096 7,434
(1,281) (759.7) (87.73) (73.29) (14.98) (33.72)
N 5,665 5,665 618,861 618,861 705,418 705,418
R^2 0.563 0.174 0.343 0.135 0.510 0.136
Memo, mean of ind. var:
1099-K
1099-MISC NEC
Any 1099
Notes: 1099 dollar amounts are unedited and include duplicates, dollar values where the decimal place is missing, or
other errors. Thus, the sample restricted to observations where the total payments on 1099 are less than $250,000,
the total value is less than or equal to reported total gross receipts, and the individual has received fewer than three
1099s of either type.
53%69%98%
Appendix Table 1: How Information Reporting affects reported receipts and Schedule C Profits
"Gig Economy" Workers Small Business OwnersContractors (less than $5,000
of business deductions)
4,129
10,895
21,293
4,131 49
3,153
48
Appendix III: Detail Health Coverage by State and Employment Status
Because marketplace coverage appears to be an important source of health insurance coverage for self-
employed individuals and small business owners, appendix Table 2 provides additional estimates of
enrollment in marketplace coverage by state. For each category of worker, the first column provides an
estimate of the number of individual workers relying on marketplace coverage for health insurance in
each state. The second column shows the share of each category of worker with marketplace coverage.
And the third column shows the share of insured workers in that category whose insurance is provided
by the marketplace.
For example, in Florida, about 178,000 self-employed sole-proprietors have coverage from the
marketplace for themselves (these estimates do not include the marketplace coverage for their spouses or
children). Those 178,000 individuals represented about 15 percent of all self-employed individuals in
the state. About 20 percent of all Florida’s self-employed workers with health insurance received that
coverage from the marketplace.
Appendix Table 3 tabulates the number of individual workers with marketplace coverage by
employment status and income class for the nation as a whole. The top panel shows that about 1.3
million self-employed, sole-proprietors purchased Marketplace coverage for themselves (that figure
does not include their spouses or children). Nationwide, those 1.3 million individuals represented about
8 percent of the total self-employed population and was the source of insurance for 11 percent of those
with health insurance. However, the rates of coverage vary considerably by income class. For instance,
about 21 percent of self-employed individuals with health insurance whose income was between
$20,000 and $40,000 had purchased their insurance from a Marketplace.
Appendix Table 4 (online) provides tabulations of the total number of workers, the number of workers
with health insurance coverage, and number with marketplace coverage by income (AGI) and type of
worker.
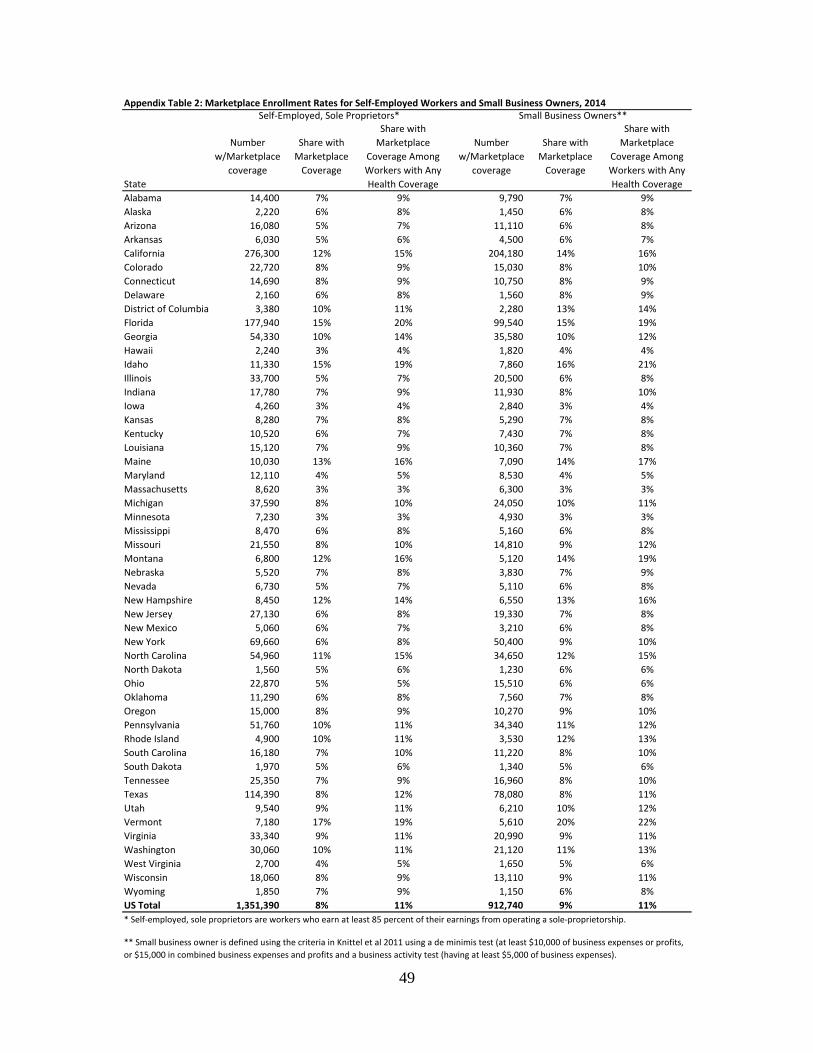
49
State
Number
w/Marketplace
coverage
Share with
Marketplace
Coverage
Share with
Marketplace
Coverage Among
Workers with Any
Health Coverage
Number
w/Marketplace
coverage
Share with
Marketplace
Coverage
Share with
Marketplace
Coverage Among
Workers with Any
Health Coverage
Alabama 14,400 7% 9% 9,790 7% 9%
Alaska 2,220 6% 8% 1,450 6% 8%
Arizona 16,080 5% 7% 11,110 6% 8%
Arkansas 6,030 5% 6% 4,500 6% 7%
California 276,300 12% 15% 204,180 14% 16%
Colorado 22,720 8% 9% 15,030 8% 10%
Connecticut 14,690 8% 9% 10,750 8% 9%
Delaware 2,160 6% 8% 1,560 8% 9%
District of Columbia 3,380 10% 11% 2,280 13% 14%
Florida 177,940 15% 20% 99,540 15% 19%
Georgia 54,330 10% 14% 35,580 10% 12%
Hawaii 2,240 3% 4% 1,820 4% 4%
Idaho 11,330 15% 19% 7,860 16% 21%
Illinois 33,700 5% 7% 20,500 6% 8%
Indiana 17,780 7% 9% 11,930 8% 10%
Iowa 4,260 3% 4% 2,840 3% 4%
Kansas 8,280 7% 8% 5,290 7% 8%
Kentucky 10,520 6% 7% 7,430 7% 8%
Louisiana 15,120 7% 9% 10,360 7% 8%
Maine 10,030 13% 16% 7,090 14% 17%
Maryland 12,110 4% 5% 8,530 4% 5%
Massachusetts 8,620 3% 3% 6,300 3% 3%
Michigan 37,590 8% 10% 24,050 10% 11%
Minnesota 7,230 3% 3% 4,930 3% 3%
Mississippi 8,470 6% 8% 5,160 6% 8%
Missouri 21,550 8% 10% 14,810 9% 12%
Montana 6,800 12% 16% 5,120 14% 19%
Nebraska 5,520 7% 8% 3,830 7% 9%
Nevada 6,730 5% 7% 5,110 6% 8%
New Hampshire 8,450 12% 14% 6,550 13% 16%
New Jersey 27,130 6% 8% 19,330 7% 8%
New Mexico 5,060 6% 7% 3,210 6% 8%
New York 69,660 6% 8% 50,400 9% 10%
North Carolina 54,960 11% 15% 34,650 12% 15%
North Dakota 1,560 5% 6% 1,230 6% 6%
Ohio 22,870 5% 5% 15,510 6% 6%
Oklahoma 11,290 6% 8% 7,560 7% 8%
Oregon 15,000 8% 9% 10,270 9% 10%
Pennsylvania 51,760 10% 11% 34,340 11% 12%
Rhode Island 4,900 10% 11% 3,530 12% 13%
South Carolina 16,180 7% 10% 11,220 8% 10%
South Dakota 1,970 5% 6% 1,340 5% 6%
Tennessee 25,350 7% 9% 16,960 8% 10%
Texas 114,390 8% 12% 78,080 8% 11%
Utah 9,540 9% 11% 6,210 10% 12%
Vermont 7,180 17% 19% 5,610 20% 22%
Virginia 33,340 9% 11% 20,990 9% 11%
Washington 30,060 10% 11% 21,120 11% 13%
West Virginia 2,700 4% 5% 1,650 5% 6%
Wisconsin 18,060 8% 9% 13,110 9% 11%
Wyoming 1,850 7% 9% 1,150 6% 8%
US Total 1,351,390 8% 11% 912,740 9% 11%
Self-Employed, Sole Proprietors* Small Business Owners**
* Self-employed, sole proprietors are workers who earn at least 85 percent of their earnings from operating a sole-proprietorship.
** Small business owner is defined using the criteria in Knittel et al 2011 using a de minimis test (at least $10,000 of business expenses or profits,
or $15,000 in combined business expenses and profits and a business activity test (having at least $5,000 of business expenses).
Appendix Table 2: Marketplace Enrollment Rates for Self-Employed Workers and Small Business Owners, 2014
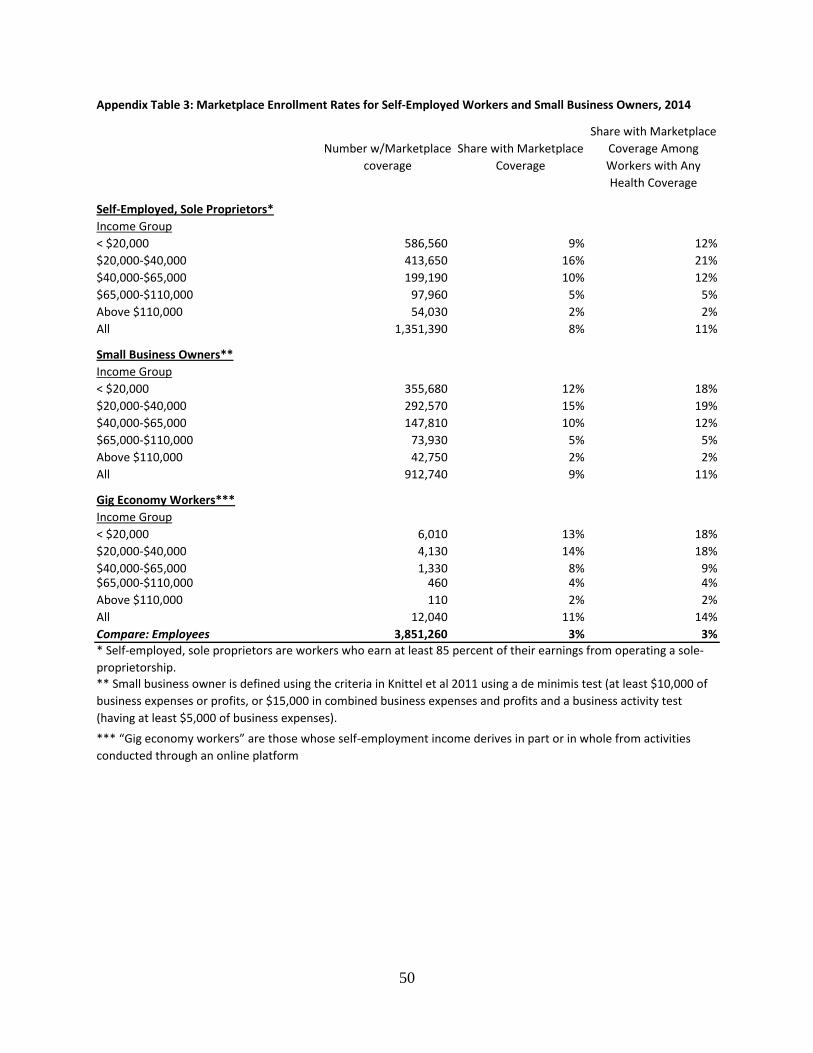
50
Number w/Marketplace
coverage
Share with Marketplace
Coverage
Share with Marketplace
Coverage Among
Workers with Any
Health Coverage
Self-Employed, Sole Proprietors*
Income Group
< $20,000 586,560 9% 12%
$20,000-$40,000 413,650 16% 21%
$40,000-$65,000 199,190 10% 12%
$65,000-$110,000 97,960 5% 5%
Above $110,000 54,030 2% 2%
All 1,351,390 8% 11%
Small Business Owners**
Income Group
< $20,000 355,680 12% 18%
$20,000-$40,000 292,570 15% 19%
$40,000-$65,000 147,810 10% 12%
$65,000-$110,000 73,930 5% 5%
Above $110,000 42,750 2% 2%
All 912,740 9% 11%
Gig Economy Workers***
Income Group
< $20,000 6,010 13% 18%
$20,000-$40,000 4,130 14% 18%
$40,000-$65,000 1,330 8% 9%$65,000-$110,000 460 4% 4%
Above $110,000 110 2% 2%
All 12,040 11% 14%
Compare: Employees 3,851,260 3% 3%
Appendix Table 3: Marketplace Enrollment Rates for Self-Employed Workers and Small Business Owners, 2014
* Self-employed, sole proprietors are workers who earn at least 85 percent of their earnings from operating a sole-
proprietorship.** Small business owner is defined using the criteria in Knittel et al 2011 using a de minimis test (at least $10,000 of
business expenses or profits, or $15,000 in combined business expenses and profits and a business activity test
(having at least $5,000 of business expenses).
*** “Gig economy workers” are those whose self-employment income derives in part or in whole from activities
conducted through an online platform