Embed Size (px)
Citation preview
The rheology and microstructure of concentrated,aggregated colloids
L. E. Silberta) and J. R. Melrose
Polymers & Colloids Group, Cavendish Laboratory, University of Cambridge,Madingley Road, Cambridge, CB3 0HE, United Kingdom
R. C. Ball
Department of Physics, University of Warwick, Coventry, CV4 7AL,United Kingdom
(Received 9 September 1998; final revision received 21 January 1999)
Synopsis
The rheology of concentrated, aggregated colloidal suspensions is determined through particulatesimulations. Aggregating systems experience a large viscous enhancement over nonaggregatingsystems, this being due to the increase in the component of the viscosity arising from the repulsivecolloid ~thermodynamic! forces when attractive forces are present. The shear behavior ofaggregating systems, for colloid volume fraction 0.47< fc < 0.57, is characterized in the steadystate regime over a wide range in shear rate, and is found to be power law, shear thinningh; f (fc)g2a, where the shear thinning indexa 5 0.8460.01. The effect of volume fraction
enters asf (fc) 5 (12fc /fmax)21, with fmax 5 0.64, the value of random close packing;
similarly, the viscosity also scales with the potential well depth as a power law, of indexa.Consequently, we are able to deduce the full constitutive relation for this power law behavior. Theassociated structural features which emerge as a result of the imposed shear are identified with therheology. The shear thinning regime crosses over into a state of ordered phase flow at high shearrates likewise simulations of hard sphere fluids. We also show that the high-shear orderedconfigurations appear to be a function of colloid concentration, with a transition from string phaseorder through to layered phases asfc increases. ©1999 The Society of Rheology.@S0148-6055~99!00603-3#
I. INTRODUCTION
Flowing colloids exhibit a wide range of phenomena that are of scientific and techno-logical importance. Recent theoretical treatments, focusing on model hard sphere systemsexperiencing weak shear flows@Lionberger~1998!#, have made progress at reproducingexperimental and simulation data. For the case of concentrated systems, such issuesbecome increasingly difficult to study analytically due to the intrinsic many-body natureof the system. Computer simulations allow us to study these systems, albeit a reducedversion thereof, and hence help to shed light on the details concerned with the flowproperties of concentrated suspensions. The most beneficial aspects come from the elu-cidation of the micro-rheological and microstructural behavior of the constituent macro
a!Author to whom all correspondence should be addressed. Electronic mail: [email protected]. Present ad-dress: Sandia National Laboratories, MS 1349, Albuquerque, New Mexico 87185.
© 1999 by The Society of Rheology, Inc.J. Rheol. 43~3!, May/June 1999 6730148-6055/99/43~3!/673/28/$20.00
particles making up the suspension under flow. A knowledge of this behavior is still verymuch unknown in detail especially at high working concentrations, as is the case in thisstudy.
There has been an extensive effort in the study of model hard sphere systems over a
range of volume fractionsfc , from the dilute to the concentrated (fc > 0.40) regimes.From a simulation point of view, many definitive works exist, including@Phunget al.~1996!#, for example, among others. However, although the shear behavior of aggregatedsystems also continues to be studied through both experimental techniques@Patel andRussel ~1987!, de Rooij et al. ~1993!# and computer modeling@Melrose and Heyes~1993!, Wessel and Ball~1992!, Potanin and Russel~1996!, Potaninet al. ~1995!, Chenand Doi ~1989!#, most of these simulations have been performed at low-moderate con-centrations, lower than of interest here, and largely neglect the effects of hydrodynamicinteractions between the colloidal particles. We have previously reported three-dimensional~3D! simulations of concentrated systems that include hydrodynamics andaggregating forces@Silbert et al. ~1997!#. Likewise, simulations in two dimensions~2D!have been performed@Bilodeau and Bousfield~1998!#. Buscallet al. ~1993! carried outexperimental investigations on the rheology of depletion-flocculated suspensions atfc5 0.40, whereas Verduinet al. ~1996! and Rueb and Zukoski~1997! probed the struc-
ture of ‘‘colloidal-gel’’ systems, volume fraction circa 25%, using light-scattering tech-niques.
In our earlier study@Silbert et al. ~1997!# we tested our simulation model over varia-tions in a parameter space of particle motions for an idealized, concentrated, aggregatedsuspension composed of monodisperse, spherical particles. The model included hydrody-namic interactions between the colloidal spheres in an approximation appropriate at highconcentrations: the hydrodynamic interactions are dominated by lubrication modes be-tween close approaching spheres. We compared results with varying approximations tothe hydrodynamic model: simulations just with squeeze interactions and free particlerotations, and simulations with shear lubrication and coupled particle rotations. In addi-tion, we switched Brownian forces on or off. Results for viscosity with shear terms were10%–20% higher than those with just squeeze terms, while at intermediate shear ratesBrownian forces lowered the results by some 20%. We validated our results againstexisting experimental data on the shear flow of depletion-flocculated suspensions atfc5 0.40.
Here we restrict much of the following study to a model with squeeze hydrodynamicsonly, neglecting the additional shear terms and Brownian forces. This restriction plays noqualitative role on the final results@Silbert et al. ~1997!#. We introduce the simulationmodel in the next section. Here we summarize the simulation technique, together with abrief introduction to the colloid forces~aggregating and repulsive terms!. However, amore thorough discussion of the technique can be found elsewhere@Ball and Melrose~1997!, Silbertet al. ~1997!#.
In the Results section we expound those points left open in the previous paper with anin-depth discussion on the steady state behavior of the normal stresses and the structuralimplications of these results, including simulation-generated intensity dataI (k) that pro-vide us with a time-averaged determination of structural effects in the shear thinningregime as well as at high shear rates. We cover a wider range infc , finding universalrheology persists to very high concentrations and over many decades in shear rate. Pres-ently we are unable to simulate at very low shear rates and the first Newtonian plateaudue to computational restrictions, and therefore report findings for intermediate to highshear rates.
674 SILBERT, MELROSE, AND BALL
We determine the functional dependence of the viscosity on the colloid volume frac-tion, and we also explore the effect of the aggregating potential, which enables us toprovide a full constitutive relation that characterizes the rheology of our model system inthe shear thinning regime. A brief look at the transient behavior of the flow is also given.A ~cautious! comparison is made with experimental scattering data, showing that oursimulations share some qualitative features with experiment. We end with a discussion ofour findings.
II. SIMULATION METHOD
A. Equations of motion
The simulation modeling essentially comprises a version@Ball and Melrose~1997!# ofStokesian dynamics@Bossis and Brady~1984!, Durlofskyet al. ~1987!# which enables thestudy of concentrated colloidal systems by incorporating Lees–Edwards boundary con-ditions @Lees and Edwards~1972!# on arbitrarily large, defined by the computational boxvolume V, periodic cells. We define the hard core colloid volume fraction,fc5 (p/6)rd3 of N particles of diameterd, with particle number densityr 5 N/V. In
considering time scales long with respect to the viscous momentum relaxation time of thesuspension, we treat the particles at the Langevin/Smoluchowski level and the fluid bythe creeping flow equations. Stick boundary conditions are imposed on the fluid at theparticle surfaces.
The equations of motion forN such particles immersed in a Newtonian fluid withviscositym thus express a quasistatic force balance
FH1FP1FB 5 0. ~1!
The 6N force/torque vectors are:~i! hydrodynamic forcesFH, exerted on the particlesdue to their relative motions in the presence of the solvent,~ii ! colloidal forcesFP ~thesum of repulsive and attractive terms!, and~iii ! Brownian forcesFB.
The termsFH andFB have approximate representations and their detailed expressionsare available elsewhere@Ball and Melrose~1997!, Silbertet al. ~1997!#. In the version ofStokesian dynamics of@Bossis and Brady~1984!, Durlofsky et al. ~1987!# a low momentmobility tensor is combined with lubrication terms in the resistance tensor. In a concen-trated system, however, we argue thatFH is dominated by lubrication hydrodynamicterms between the close approaching surfaces of the colloidal spheres. This leads to amore approximate form for the hydrodynamic interactions in which the resistance matrixis two body and short ranged. Note that the inversion of this resistance matrix does givea long ranged, many-body mobility matrix. We suggest that at high concentrations (fc. 0.40) the additional long ranged parts lead only to small improvements. The trun-
cated algorithm used here involves only the inversion of sparse matrices and is faster,O(N1.5) rather thanO(N3), although we note that efforts continue to developO(N)versions of the algorithm of Bossis and Brady~1984!, Durlofsky et al. ~1987! @Brady~1998!#.
Others are using this truncated scheme@Bilodeau and Bousfield~1998!, Doi et al.~1987!, and Toivakkaet al. ~1995!#. We discuss elsewhere the accuracy and point out thelikely sources of errors in shear terms@Ball and Melrose~1997!, Silbert et al. ~1997!#.The calculation ofFB is also discussed elsewhere@Ball and Melrose~1997!, Bossis andBrady ~1989!#
In this work, the colloid force term,FP, contains both attractive—hence the term‘‘aggregated’’ colloids—and repulsive terms. We choose to model depletion aggregatedcolloids, that is, colloids in a mixture with nonadsorbing polymers of sizeRg at volume
675CONCENTRATED, AGGREGATED COLLOIDS
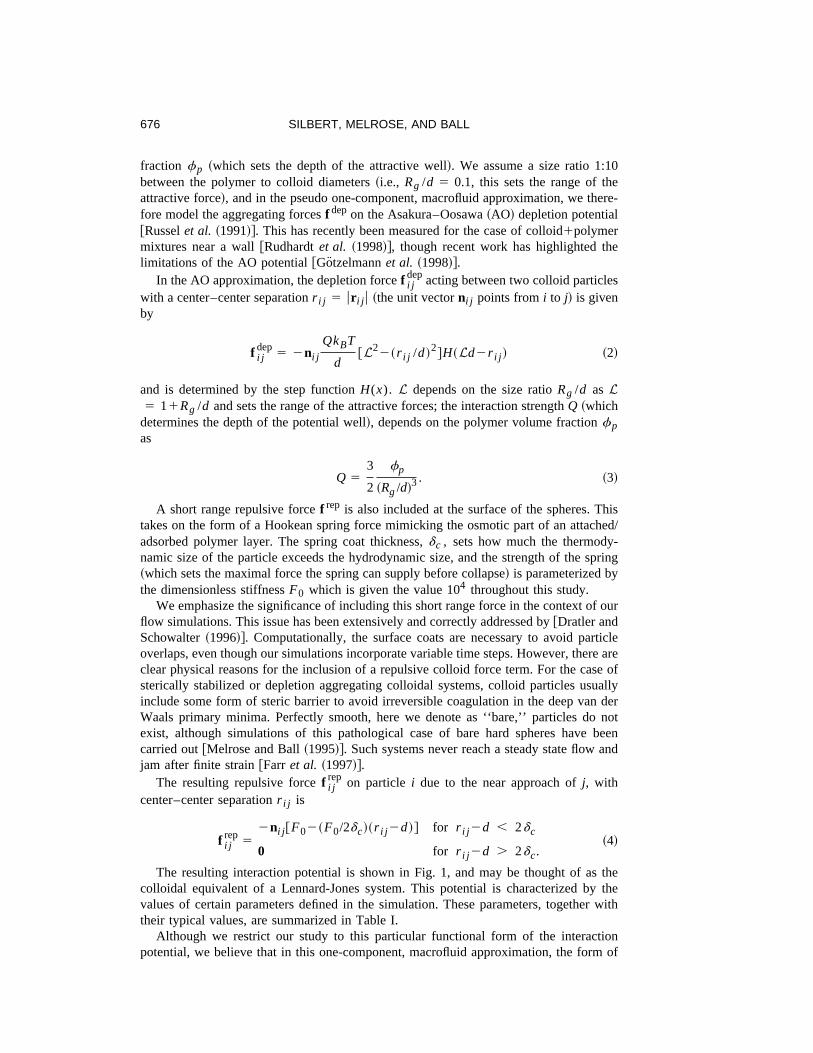
fraction fp ~which sets the depth of the attractive well!. We assume a size ratio 1:10between the polymer to colloid diameters~i.e., Rg /d 5 0.1, this sets the range of theattractive force!, and in the pseudo one-component, macrofluid approximation, we there-fore model the aggregating forcesf depon the Asakura–Oosawa~AO! depletion potential@Russelet al. ~1991!#. This has recently been measured for the case of colloid1polymermixtures near a wall@Rudhardtet al. ~1998!#, though recent work has highlighted thelimitations of the AO potential@Gotzelmannet al. ~1998!#.
In the AO approximation, the depletion forcef i jdepacting between two colloid particles
with a center–center separationr i j 5 ur i j u ~the unit vectorni j points fromi to j! is givenby
f i jdep 5 2ni j
QkBT
d@L22~r i j /d!2#H~Ld2r i j ! ~2!
and is determined by the step functionH(x). L depends on the size ratioRg /d asL5 11Rg /d and sets the range of the attractive forces; the interaction strengthQ ~which
determines the depth of the potential well!, depends on the polymer volume fractionfpas
Q 53
2
fp
~Rg /d!3. ~3!
A short range repulsive forcef rep is also included at the surface of the spheres. Thistakes on the form of a Hookean spring force mimicking the osmotic part of an attached/adsorbed polymer layer. The spring coat thickness,dc , sets how much the thermody-namic size of the particle exceeds the hydrodynamic size, and the strength of the spring~which sets the maximal force the spring can supply before collapse! is parameterized bythe dimensionless stiffnessF0 which is given the value 104 throughout this study.
We emphasize the significance of including this short range force in the context of ourflow simulations. This issue has been extensively and correctly addressed by@Dratler andSchowalter~1996!#. Computationally, the surface coats are necessary to avoid particleoverlaps, even though our simulations incorporate variable time steps. However, there areclear physical reasons for the inclusion of a repulsive colloid force term. For the case ofsterically stabilized or depletion aggregating colloidal systems, colloid particles usuallyinclude some form of steric barrier to avoid irreversible coagulation in the deep van derWaals primary minima. Perfectly smooth, here we denote as ‘‘bare,’’ particles do notexist, although simulations of this pathological case of bare hard spheres have beencarried out@Melrose and Ball~1995!#. Such systems never reach a steady state flow andjam after finite strain@Farr et al. ~1997!#.
The resulting repulsive forcef i jrep on particle i due to the near approach ofj, with
center–center separationr i j is
f i jrep
52ni j @F02~F0/2dc!~r i j 2d!# for r i j 2d , 2dc
0 for r i j 2d . 2dc.~4!
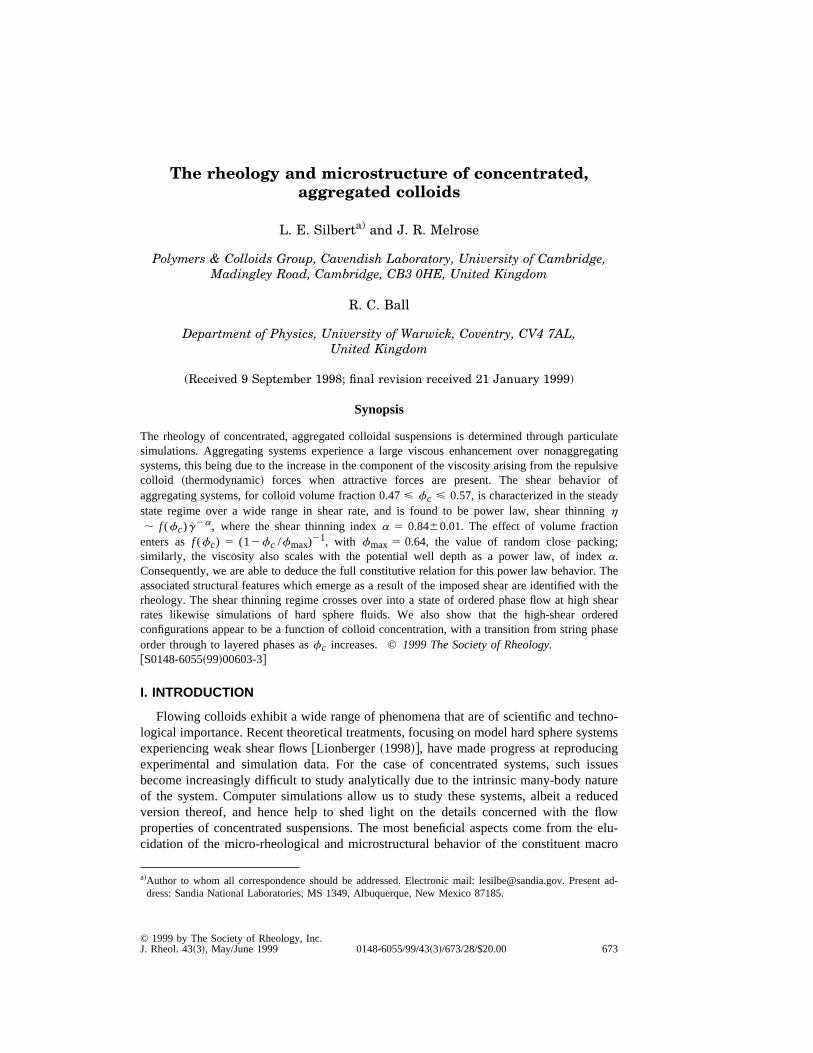
The resulting interaction potential is shown in Fig. 1, and may be thought of as thecolloidal equivalent of a Lennard-Jones system. This potential is characterized by thevalues of certain parameters defined in the simulation. These parameters, together withtheir typical values, are summarized in Table I.
Although we restrict our study to this particular functional form of the interactionpotential, we believe that in this one-component, macrofluid approximation, the form of
676 SILBERT, MELROSE, AND BALL

the interaction potential, so long as it resembles Lennard-Jones-type potentials, will notgive rise to qualitative differences. Though we suspect that differences might be observedin the rheology if the attractive forces~and the repulsive terms for that matter! act overdistances of order the colloid size. We have performed simulations with different repul-sive terms~based on a more realistic model for a surface polymer layer! @Silbert ~1998!#from which the rheology data were seen to qualitatively match our previous studies usingHookean springs, and have concluded that the Hookean spring force we use here, al-though crude, captures the essential physics of the surface steric interactions.
The size of the cubic simulation box has side lengthL 5 V1/3. To provide a reason-able study of rheology and structure we study systems withN 5 200, and 700 corre-sponding toL . 6, and 9, respectively. We have also performed simulations over awider range of system sizes, showing that even in the limit of very large systems (N5 4000), in rectangular boxes, the results are quantitatively identical. It is only in small
systems, sayN < 50, L < 4, that system size effects show up in the rheology. Wereason that the smallness of the box in small-N simulations interferes with the micro-structural mechanisms that give rise to the observed rheology@Silbert ~1998!#.
FIG. 1. Interparticle colloid pair-potentialU(r ), and force law2dU(r )/dr, with the following set of param-eters; polymer concentration parameterfp 5 0.7, size ratio Rg /d 5 0.1, polymer coat thicknessdc5 0.005d.
TABLE I. Typical simulation parameters which characterize the modelsystem and the values they are given in many of the following studies.
Parameter Value
Colloid volume fractionfc 0.50Number of particlesN 200Surface layer thicknessdc /d 0.005Size ratioRg /d 0.10Polymer volume fractionfp 0.70Potential well-depthUmin /kBT 9.0
677CONCENTRATED, AGGREGATED COLLOIDS
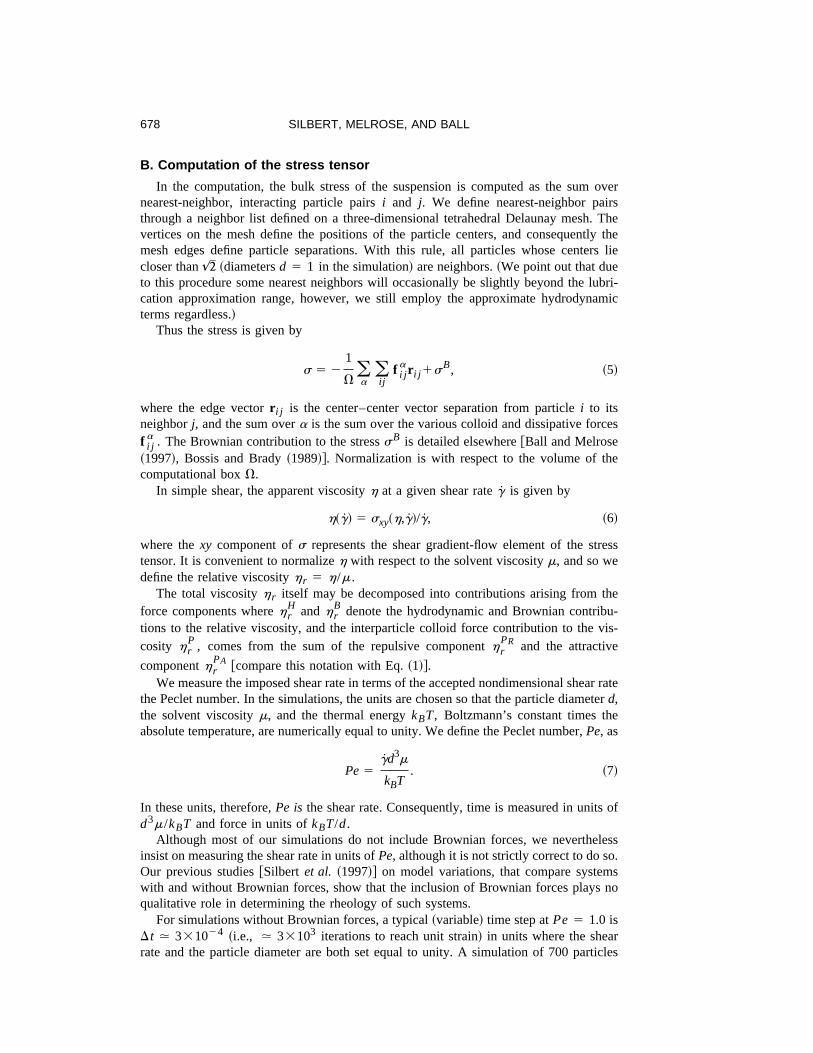
B. Computation of the stress tensor
In the computation, the bulk stress of the suspension is computed as the sum overnearest-neighbor, interacting particle pairsi and j. We define nearest-neighbor pairsthrough a neighbor list defined on a three-dimensional tetrahedral Delaunay mesh. Thevertices on the mesh define the positions of the particle centers, and consequently themesh edges define particle separations. With this rule, all particles whose centers liecloser than& ~diametersd 5 1 in the simulation! are neighbors.~We point out that dueto this procedure some nearest neighbors will occasionally be slightly beyond the lubri-cation approximation range, however, we still employ the approximate hydrodynamicterms regardless.!
Thus the stress is given by
s 5 21
V(a
(ij
f i ja r i j 1sB, ~5!
where the edge vectorr i j is the center–center vector separation from particlei to itsneighborj, and the sum overa is the sum over the various colloid and dissipative forcesf i j
a . The Brownian contribution to the stresssB is detailed elsewhere@Ball and Melrose~1997!, Bossis and Brady~1989!#. Normalization is with respect to the volume of thecomputational boxV.
In simple shear, the apparent viscosityh at a given shear rateg is given by
h~g! 5 sxy~h,g!/g, ~6!
where thexy component ofs represents the shear gradient-flow element of the stresstensor. It is convenient to normalizeh with respect to the solvent viscositym, and so wedefine the relative viscosityh r 5 h/m.
The total viscosityh r itself may be decomposed into contributions arising from theforce components whereh r
H andh rB denote the hydrodynamic and Brownian contribu-
tions to the relative viscosity, and the interparticle colloid force contribution to the vis-cosity h r
P , comes from the sum of the repulsive componenth rPR and the attractive
componenth rPA @compare this notation with Eq.~1!#.
We measure the imposed shear rate in terms of the accepted nondimensional shear ratethe Peclet number. In the simulations, the units are chosen so that the particle diameterd,the solvent viscositym, and the thermal energykBT, Boltzmann’s constant times theabsolute temperature, are numerically equal to unity. We define the Peclet number,Pe, as
Pe5gd3m
kBT. ~7!
In these units, therefore,Pe is the shear rate. Consequently, time is measured in units ofd3m/kBT and force in units ofkBT/d.
Although most of our simulations do not include Brownian forces, we neverthelessinsist on measuring the shear rate in units ofPe, although it is not strictly correct to do so.Our previous studies@Silbert et al. ~1997!# on model variations, that compare systemswith and without Brownian forces, show that the inclusion of Brownian forces plays noqualitative role in determining the rheology of such systems.
For simulations without Brownian forces, a typical~variable! time step atPe 5 1.0 isDt . 331024 ~i.e., . 33103 iterations to reach unit strain! in units where the shearrate and the particle diameter are both set equal to unity. A simulation of 700 particles
678 SILBERT, MELROSE, AND BALL
running for 23105 iterations takes just a few hours on a standard workstation. Forsimulations that do include Brownian motion, the time step is generally reduced, and atPe 5 1.0, Dt . 231025. Time steps vary approximately linearly with shear rate.
III. RESULTS
A. Steady state rheology
Concentrated aggregated suspensions form gel- or glassy-like structures when allowedto equilibrate without shear. Brownian dynamics simulations have been used to study thestress–strain transient regime of model particle gels, see Westet al. ~1994! and morerecently Whittle and Dickinson~1997!. Such systems are strictly metastable, and canremain in an aggregated state for time scales which far exceed the times of the simulationstudies. Therefore, with regards to our simulations, crystallization or irreversible coagu-lation is not observed when at rest. However, the effects of the imposed shear will changethe nature of these colloidal systems as will be shown throughout this work. One canimagine that the states which are not observed when no shear is applied are frustrated, butcan either be enhanced or conversely suppressed when the shear is switched on.
The following studies are solely concerned with the steady state behavior of flowingcolloids. It is thus necessary to ensure that the collected data are taken beyond thetransient regime so that any memory/start-up effects are erased. The notion of the steadystate regime with respect to the simulations can be realized after a time, measured in unitsof straing, at which the bulk system has reached a state of dynamic equilibrium. Loosely,we can define this state as the point in the simulation at which the fluctuations in thesampled viscosity diminish~and hence the associated errors are minimized!, and a con-stant viscosity with time is attained.
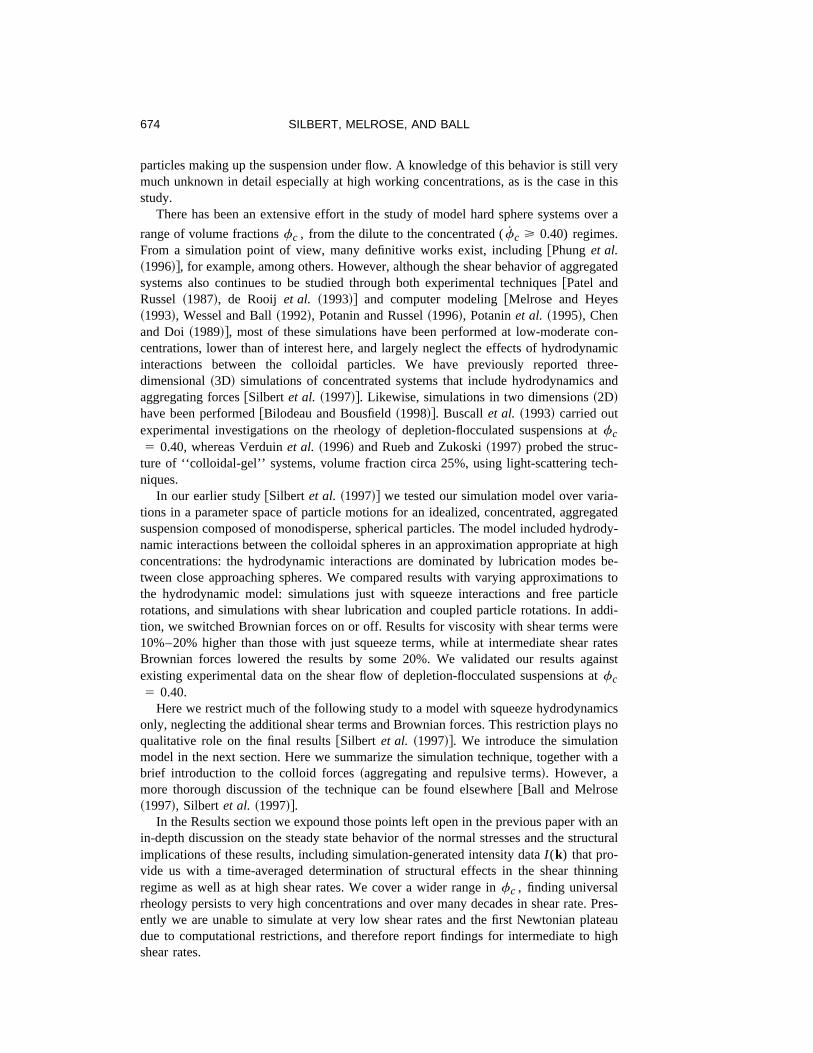
Figure 2 compares the temporal behavior of the viscosity atPe 5 1.0 for two differ-ent starting configurations. The first start-up sequence uses a Monte Carlo~MC! gener-ated hard sphere configuration~denoted by the solid diamonds in Fig. 2! where the shearand the aggregating forces are switched on at the same time. This sequence is character-ized by an initial rise in the computed viscosity. The preaggregated start-up configuration,in which the aggregating forces and Brownian forces are switched on prior to shearing toallow the system to reach an aggregated state, is characterized by an initial fall in theviscosity ~see inset to Fig. 2!.
In general, Fig. 2 shows that each system undergoes a transient regime for the first partof the flow, up tog . 10 for the MC curve, andg . 40 for the preaggregated curve,during which the viscosity increases for the MC configuration and decreases for theaggregated configuration. However, after this transient regime, the computed viscosityreaches its steady state value. A small drift is sometimes evident, as in the data of Fig. 2,but we consider that beyondg . 10 ~or 40! the system has reached the steady stateregime. We note that the MC configuration provides a shorter route to the steady state—almost three times quicker than for the preaggregated configuration—thus proving moreconvenient in reducing the computer time required to reach the steady state.
By comparing the response of the two systems, the shape of MC curve can be ex-plained thus; when the simulation isfirst started for an initially MC hard-sphere configu-ration, the aggregating forces and shear are turned on together. Initially the colloids‘‘feel’’ the attractive forces between them, suggesting that the initial reaction is for theparticles to fall into the attractive wells provided by their neighbors. During this stage, theimposed flow, together with the attractive forces, initially gives way to large scale net-work formation and particle—particle bonds are being formed at a greater rate than theyare broken: a transient gel-like network forms. These transient configurations are widely
679CONCENTRATED, AGGREGATED COLLOIDS
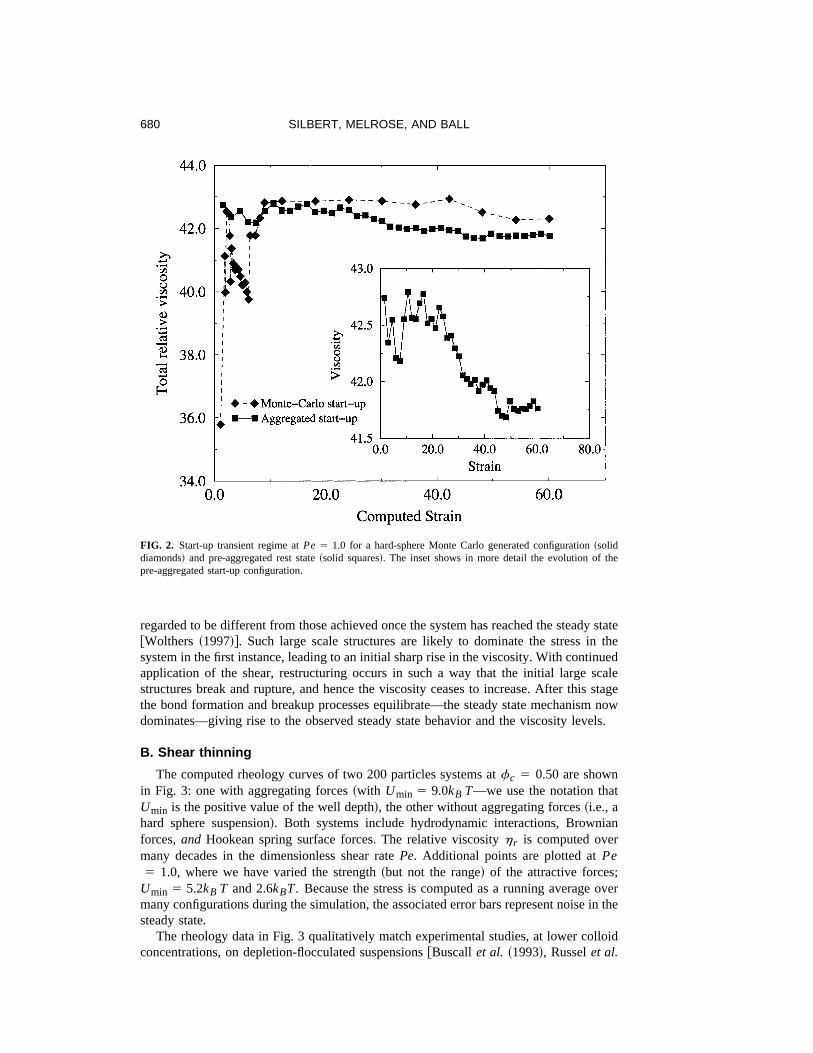
regarded to be different from those achieved once the system has reached the steady state@Wolthers ~1997!#. Such large scale structures are likely to dominate the stress in thesystem in the first instance, leading to an initial sharp rise in the viscosity. With continuedapplication of the shear, restructuring occurs in such a way that the initial large scalestructures break and rupture, and hence the viscosity ceases to increase. After this stagethe bond formation and breakup processes equilibrate—the steady state mechanism nowdominates—giving rise to the observed steady state behavior and the viscosity levels.
B. Shear thinning
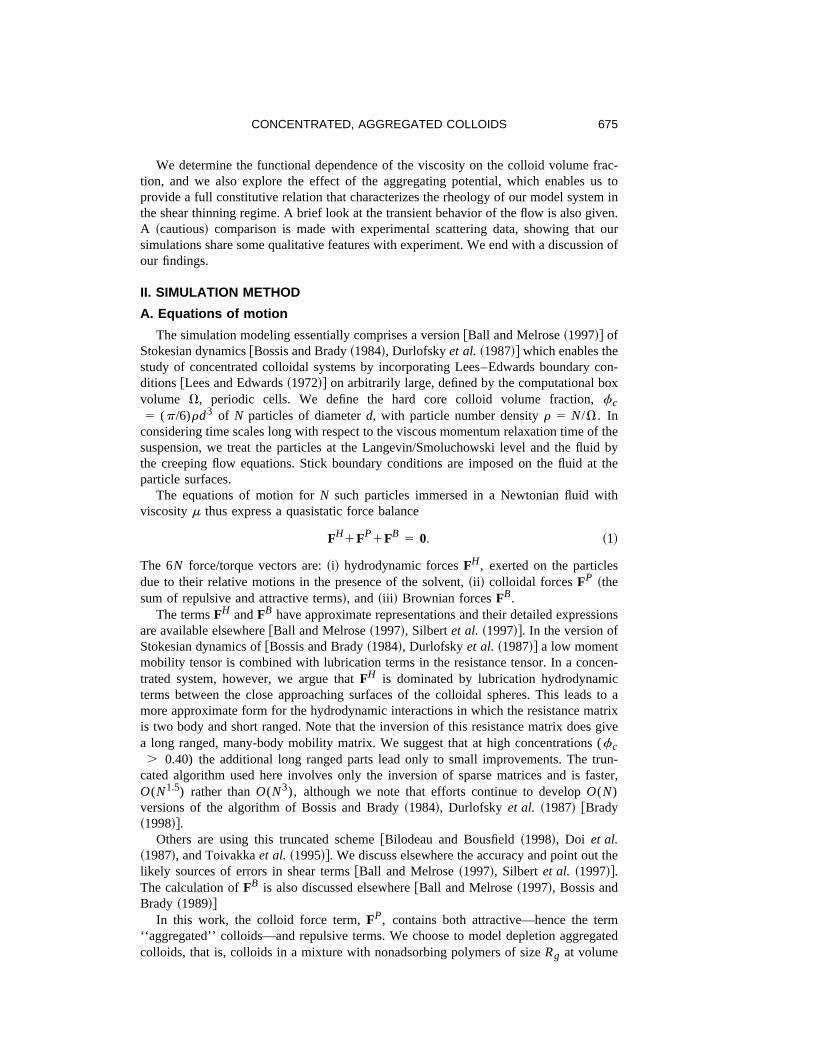
The computed rheology curves of two 200 particles systems atfc 5 0.50 are shownin Fig. 3: one with aggregating forces~with Umin 5 9.0kB T—we use the notation thatUmin is the positive value of the well depth!, the other without aggregating forces~i.e., ahard sphere suspension!. Both systems include hydrodynamic interactions, Brownianforces,and Hookean spring surface forces. The relative viscosityh r is computed overmany decades in the dimensionless shear ratePe. Additional points are plotted atPe5 1.0, where we have varied the strength~but not the range! of the attractive forces;
Umin 5 5.2kB T and 2.6kBT. Because the stress is computed as a running average overmany configurations during the simulation, the associated error bars represent noise in thesteady state.
The rheology data in Fig. 3 qualitatively match experimental studies, at lower colloidconcentrations, on depletion-flocculated suspensions@Buscallet al. ~1993!, Russelet al.
FIG. 2. Start-up transient regime atPe 5 1.0 for a hard-sphere Monte Carlo generated configuration~soliddiamonds! and pre-aggregated rest state~solid squares!. The inset shows in more detail the evolution of thepre-aggregated start-up configuration.
680 SILBERT, MELROSE, AND BALL
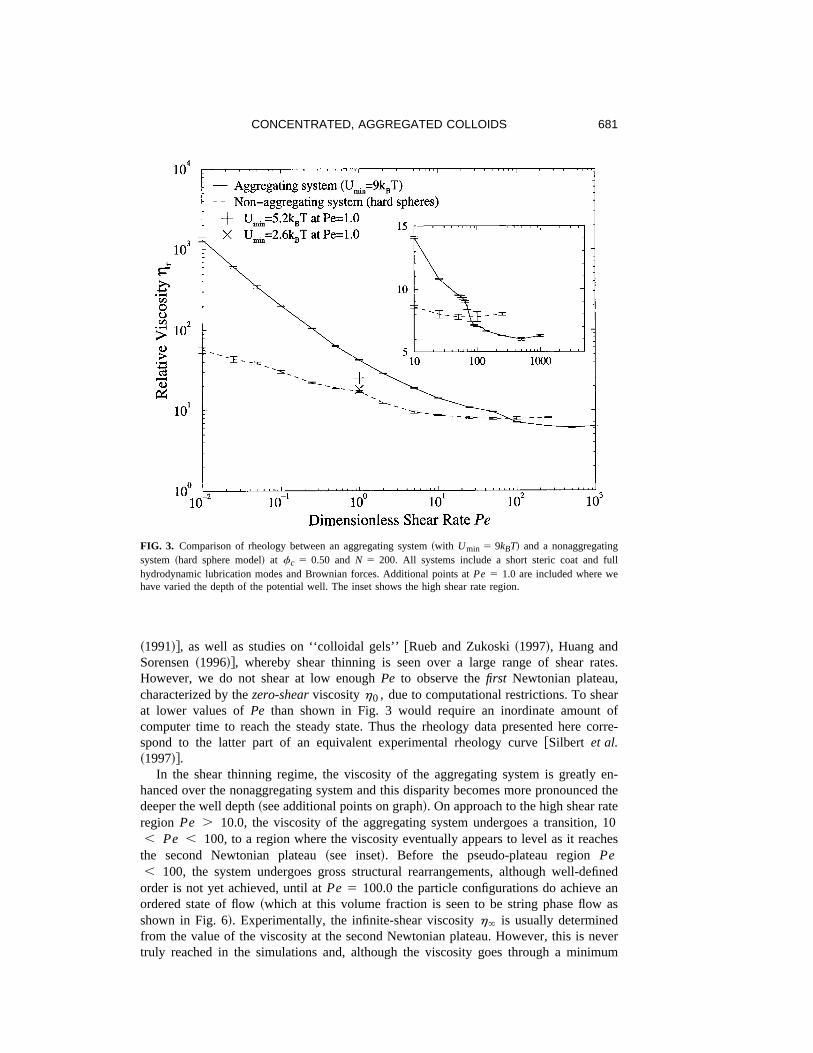
~1991!#, as well as studies on ‘‘colloidal gels’’@Rueb and Zukoski~1997!, Huang andSorensen~1996!#, whereby shear thinning is seen over a large range of shear rates.However, we do not shear at low enoughPe to observe thefirst Newtonian plateau,characterized by thezero-shearviscosityh0 , due to computational restrictions. To shearat lower values ofPe than shown in Fig. 3 would require an inordinate amount ofcomputer time to reach the steady state. Thus the rheology data presented here corre-spond to the latter part of an equivalent experimental rheology curve@Silbert et al.~1997!#.
In the shear thinning regime, the viscosity of the aggregating system is greatly en-hanced over the nonaggregating system and this disparity becomes more pronounced thedeeper the well depth~see additional points on graph!. On approach to the high shear rateregion Pe . 10.0, the viscosity of the aggregating system undergoes a transition, 10, Pe , 100, to a region where the viscosity eventually appears to level as it reaches
the second Newtonian plateau~see inset!. Before the pseudo-plateau regionPe, 100, the system undergoes gross structural rearrangements, although well-defined
order is not yet achieved, until atPe 5 100.0 the particle configurations do achieve anordered state of flow~which at this volume fraction is seen to be string phase flow asshown in Fig. 6!. Experimentally, the infinite-shear viscosityh` is usually determinedfrom the value of the viscosity at the second Newtonian plateau. However, this is nevertruly reached in the simulations and, although the viscosity goes through a minimum
FIG. 3. Comparison of rheology between an aggregating system~with Umin 5 9kBT! and a nonaggregatingsystem~hard sphere model! at fc 5 0.50 andN 5 200. All systems include a short steric coat and fullhydrodynamic lubrication modes and Brownian forces. Additional points atPe 5 1.0 are included where wehave varied the depth of the potential well. The inset shows the high shear rate region.
681CONCENTRATED, AGGREGATED COLLOIDS
~from which we initially determineh`!, the aggregating system eventually shear thickensat very high shear rates.
In comparison, the hard sphere system shear thins to a much milder degree than theaggregating system, and then thickens at lower shear rates. In the hard sphere case,ordering under shear occurs at much lower shear rates~before the onset of shear thick-ening!. The presence of the attractive forces effectively inhibits the disorder–order~shearthinning–shear ordering! transition. Although we restrict our study to shear thinning andshear ordering, others have investigated the role of colloid forces on shear thickening@Boersmaet al. ~1995!#.
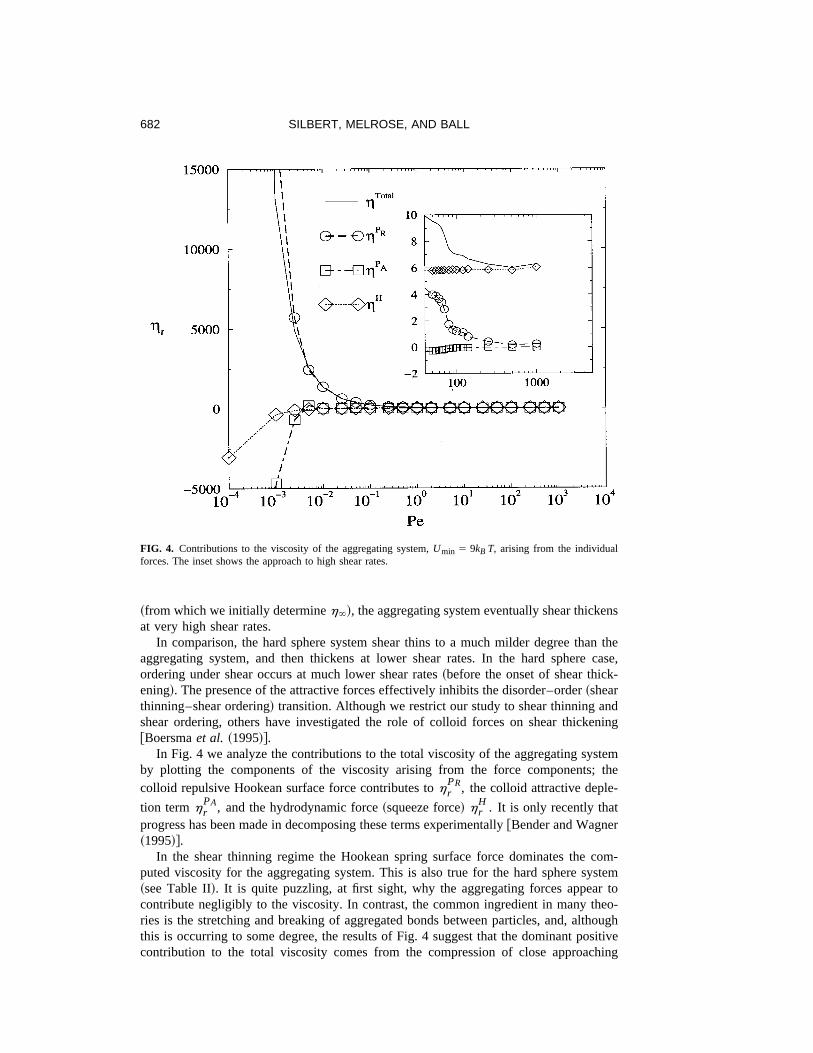
In Fig. 4 we analyze the contributions to the total viscosity of the aggregating systemby plotting the components of the viscosity arising from the force components; thecolloid repulsive Hookean surface force contributes toh r
PR, the colloid attractive deple-
tion termh rPA, and the hydrodynamic force~squeeze force! h r
H . It is only recently thatprogress has been made in decomposing these terms experimentally@Bender and Wagner~1995!#.
In the shear thinning regime the Hookean spring surface force dominates the com-puted viscosity for the aggregating system. This is also true for the hard sphere system~see Table II!. It is quite puzzling, at first sight, why the aggregating forces appear tocontribute negligibly to the viscosity. In contrast, the common ingredient in many theo-ries is the stretching and breaking of aggregated bonds between particles, and, althoughthis is occurring to some degree, the results of Fig. 4 suggest that the dominant positivecontribution to the total viscosity comes from the compression of close approaching
FIG. 4. Contributions to the viscosity of the aggregating system,Umin 5 9kB T, arising from the individualforces. The inset shows the approach to high shear rates.
682 SILBERT, MELROSE, AND BALL
particle surfaces~though not so close that the hydrodynamic lubrication forces diverge!.Bender and Wagner~1995! were able to show that the viscous response in a flowingcolloidal system is due to the repulsive colloid forces. Dratler and Schowalter~1996!have also performed simulations, albeit in 2D monolayers, that predict the viscous re-sponse of a concentrated system is greatly modified when repulsive colloid forces arepresent.
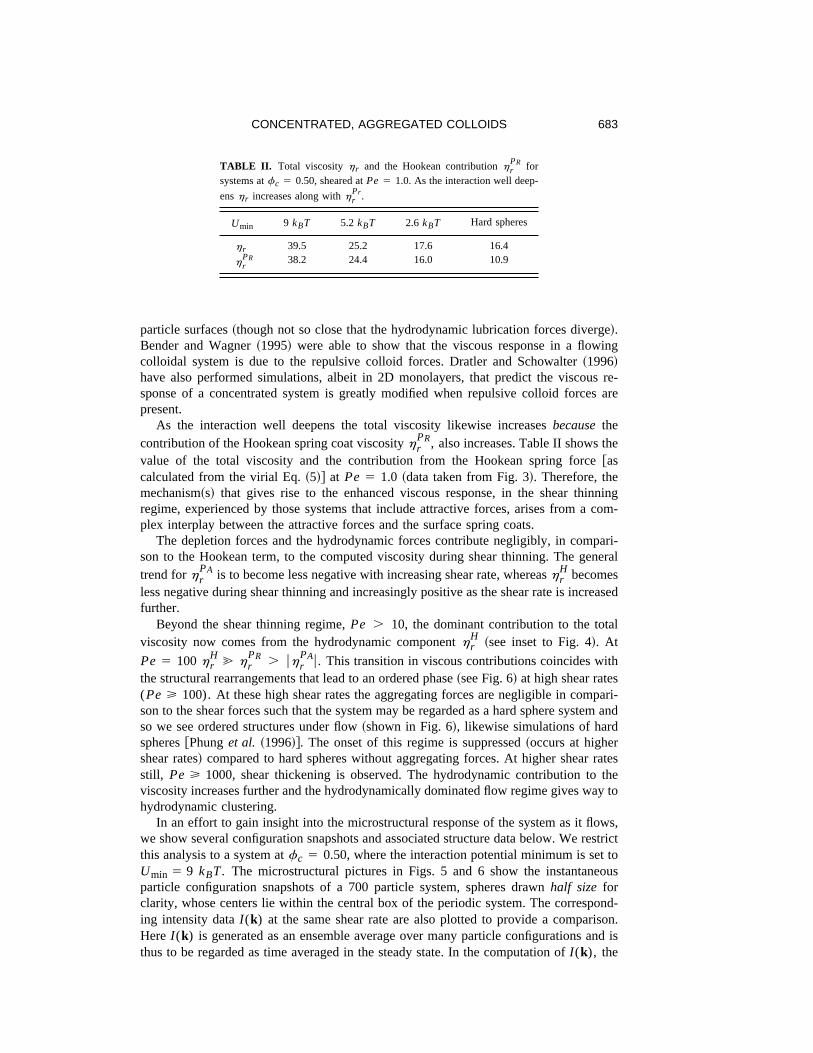
As the interaction well deepens the total viscosity likewise increasesbecausethecontribution of the Hookean spring coat viscosityh r
PR, also increases. Table II shows thevalue of the total viscosity and the contribution from the Hookean spring force@ascalculated from the virial Eq.~5!# at Pe 5 1.0 ~data taken from Fig. 3!. Therefore, themechanism~s! that gives rise to the enhanced viscous response, in the shear thinningregime, experienced by those systems that include attractive forces, arises from a com-plex interplay between the attractive forces and the surface spring coats.
The depletion forces and the hydrodynamic forces contribute negligibly, in compari-son to the Hookean term, to the computed viscosity during shear thinning. The generaltrend forh r
PA is to become less negative with increasing shear rate, whereash rH becomes
less negative during shear thinning and increasingly positive as the shear rate is increasedfurther.
Beyond the shear thinning regime,Pe . 10, the dominant contribution to the totalviscosity now comes from the hydrodynamic componenth r
H ~see inset to Fig. 4!. At
Pe 5 100h rH
@ h rPR . uh r
PAu. This transition in viscous contributions coincides withthe structural rearrangements that lead to an ordered phase~see Fig. 6! at high shear rates(Pe > 100). At these high shear rates the aggregating forces are negligible in compari-son to the shear forces such that the system may be regarded as a hard sphere system andso we see ordered structures under flow~shown in Fig. 6!, likewise simulations of hardspheres@Phunget al. ~1996!#. The onset of this regime is suppressed~occurs at highershear rates! compared to hard spheres without aggregating forces. At higher shear ratesstill, Pe > 1000, shear thickening is observed. The hydrodynamic contribution to theviscosity increases further and the hydrodynamically dominated flow regime gives way tohydrodynamic clustering.
In an effort to gain insight into the microstructural response of the system as it flows,we show several configuration snapshots and associated structure data below. We restrictthis analysis to a system atfc 5 0.50, where the interaction potential minimum is set toUmin 5 9 kBT. The microstructural pictures in Figs. 5 and 6 show the instantaneousparticle configuration snapshots of a 700 particle system, spheres drawnhalf size forclarity, whose centers lie within the central box of the periodic system. The correspond-ing intensity dataI (k) at the same shear rate are also plotted to provide a comparison.Here I (k) is generated as an ensemble average over many particle configurations and isthus to be regarded as time averaged in the steady state. In the computation ofI (k), the
TABLE II. Total viscosityhr and the Hookean contributionhrPR for
systems atfc 5 0.50, sheared atPe 5 1.0. As the interaction well deep-
enshr increases along withhrPr .
Umin 9 kBT 5.2 kBT 2.6 kBT Hard spheres
hr 39.5 25.2 17.6 16.4
hrPR 38.2 24.4 16.0 10.9
683CONCENTRATED, AGGREGATED COLLOIDS
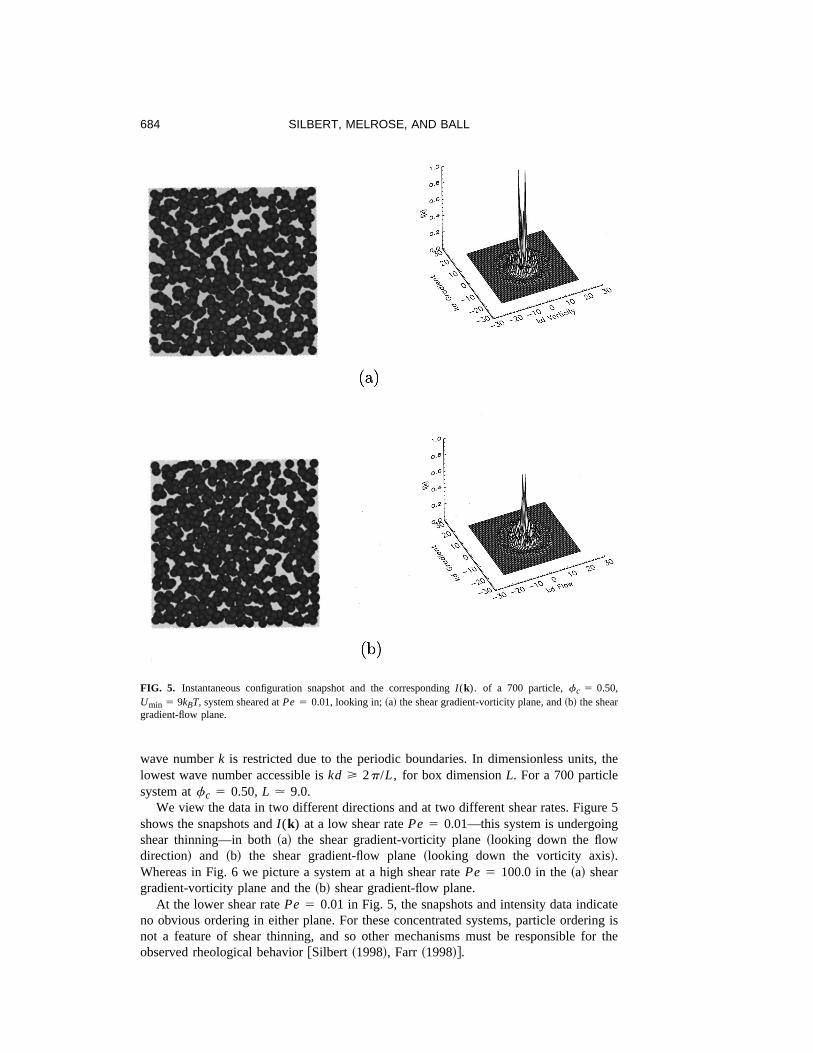
wave numberk is restricted due to the periodic boundaries. In dimensionless units, thelowest wave number accessible iskd > 2p/L, for box dimensionL. For a 700 particlesystem atfc 5 0.50,L . 9.0.
We view the data in two different directions and at two different shear rates. Figure 5shows the snapshots andI (k) at a low shear ratePe 5 0.01—this system is undergoingshear thinning—in both~a! the shear gradient-vorticity plane~looking down the flowdirection! and ~b! the shear gradient-flow plane~looking down the vorticity axis!.Whereas in Fig. 6 we picture a system at a high shear ratePe 5 100.0 in the~a! sheargradient-vorticity plane and the~b! shear gradient-flow plane.
At the lower shear ratePe 5 0.01 in Fig. 5, the snapshots and intensity data indicateno obvious ordering in either plane. For these concentrated systems, particle ordering isnot a feature of shear thinning, and so other mechanisms must be responsible for theobserved rheological behavior@Silbert ~1998!, Farr ~1998!#.
FIG. 5. Instantaneous configuration snapshot and the correspondingI (k). of a 700 particle,fc 5 0.50,Umin 5 9kBT, system sheared atPe 5 0.01, looking in;~a! the shear gradient-vorticity plane, and~b! the sheargradient-flow plane.
684 SILBERT, MELROSE, AND BALL
The noticeable feature is a dominant intensity peak seen in Figs. 5~a! and 5~b!. Thesepeaks suggest correlations between particles or clusters of particles. The position of thepeak lies at a lower value ofk than the expected nearest neighbor, first coordination shell~usually aroundkd 5 2p!, and is commonly known aspre peak. However, a study ofthe corresponding structure factorS(k) ~not shown here! @Silbert ~1998!#, shows that thebulk structure takes on a form of liquid-like, short range orderplus this pre peak.
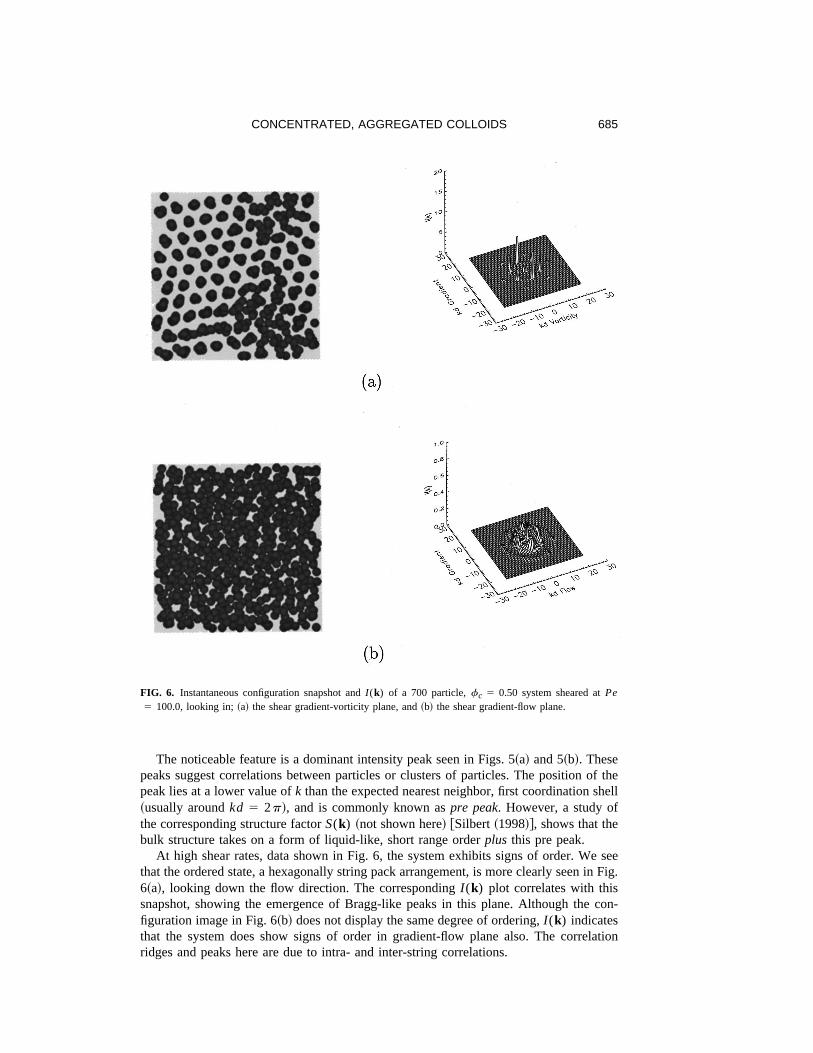
At high shear rates, data shown in Fig. 6, the system exhibits signs of order. We seethat the ordered state, a hexagonally string pack arrangement, is more clearly seen in Fig.6~a!, looking down the flow direction. The correspondingI (k) plot correlates with thissnapshot, showing the emergence of Bragg-like peaks in this plane. Although the con-figuration image in Fig. 6~b! does not display the same degree of ordering,I (k) indicatesthat the system does show signs of order in gradient-flow plane also. The correlationridges and peaks here are due to intra- and inter-string correlations.
FIG. 6. Instantaneous configuration snapshot andI (k) of a 700 particle,fc 5 0.50 system sheared atPe5 100.0, looking in;~a! the shear gradient-vorticity plane, and~b! the shear gradient-flow plane.
685CONCENTRATED, AGGREGATED COLLOIDS
Ordering under shear is known in hard sphere systems where there is some experi-mental evidence suggesting a regime of ordered flow@Ackerson~1990!, Clarke et al.~1998!#, and also in oscillatory shear experiments@Haw et al. ~1998!#. Shear flow simu-lations of hard sphere colloidal systems@Phunget al. ~1996!# and atomic systems@Heyesand Mitchell~1995!# report ordering at moderate to high shear rates. At high shear ratesthe aggregating system behaves as a hard sphere system: shear induced ordering is afeature of concentrated systems. However, we make the following qualification: shearordering for aggregating systems appears at much higher shear rates than for equivalenthard sphere systems. Although shear ordering is a feature of concentrated colloids, thesuspicion remains that theenhancedordering seen in simulations in general is, in part,due to system size effects. Simulations of the high-shear behavior of electrostaticallystabilized systems@Catherall~1998!# show that as the box size varies~from a simplecubic volume to a larger rectangular system!, regions exhibiting different types of orderdevelop, and the percolating string clusters, as observed in Fig. 6, actually break intoseparate strings for the case of longer boxes.
Nevertheless, the calculations here provide indications of a shear induced disorder–order phase transition in concentrated,aggregatedcolloidal suspensions. From a theoret-ical point of view, the ‘‘field’’ is the imposed shear rate and, hence, the ‘‘order param-eter’’ will have some dependence on this quantity. Theoretical attempts exist that modelphase transitions in colloids under shear@Morin and Ronis~1996!#. These use field-theoretic techniques at a more coarse-grained level than, say, a particulate description, tocharacterize the order parameter and its dependence on the shear rate. However, a generalunderstanding of these nonequilibrium transitions to order is still lacking at a morediscrete level.
C. Normal stresses
If the stress tensors is related to an equivalent pressure tensor through,s 5 2P, thediagonal components ofs are only defined up to an arbitrary constant. The more usefulparameters determined from experiment are linear combinations of these diagonalcomponents—the normal stress differences. The first and the second normal stress dif-ferences, denoted byN1 andN2 , respectively, are defined in Eq.~8!, following the usualconvention~see@Barneset al. ~1989!#, for example!
N1 5 sxx2syy
N2 5 syy2szz.~8!
The benefit of the simulation procedure allows the exact determination of the diagonalcomponents of the stress. Thus it is possible to understand the behavior of thes i i withoutresorting to inferring their behavior from related results.
N1 andN2 are plotted in Fig. 7, covering the full rheological range~as in Fig. 3!. Thevalues ofN1 and N2 in the shear thinning regime fluctuate erratically close to zero,similar to the behavior in hard sphere systems@Phunget al. ~1996!#. The inset empha-sises this region. The behavior during shear thinning is rather perplexing as we havealready seen that the viscosity of the aggregating system is greatly enhanced over a hardsphere system. However, the fact thatN1 remains close to zero in this regime indicatesthat the structures forming in the bulk are either homogeneous throughout, or, possibly,elongated rod-like structures form along the flow-compression direction.
Beyond the shear thinning regime,Pe > 10, bothN1 andN2 go negative, indicatinga transition away from pure shear thinning behavior. However, upon the onset of order at
686 SILBERT, MELROSE, AND BALL
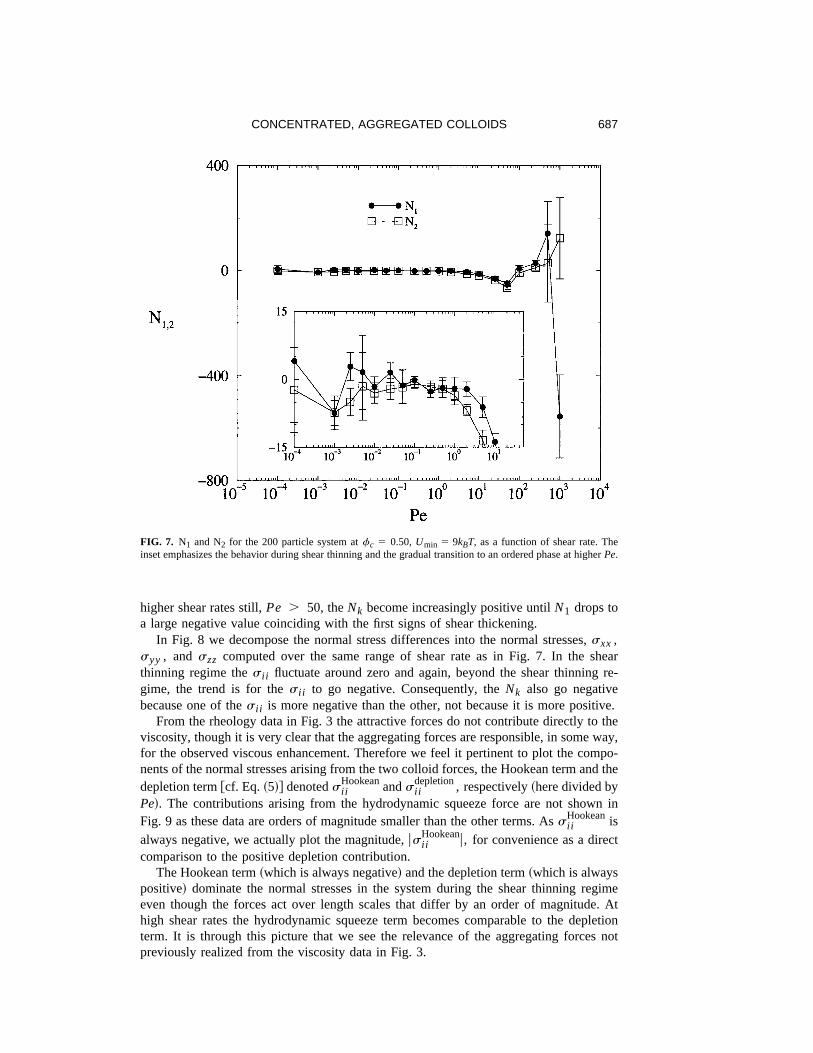
higher shear rates still,Pe . 50, theNk become increasingly positive untilN1 drops toa large negative value coinciding with the first signs of shear thickening.
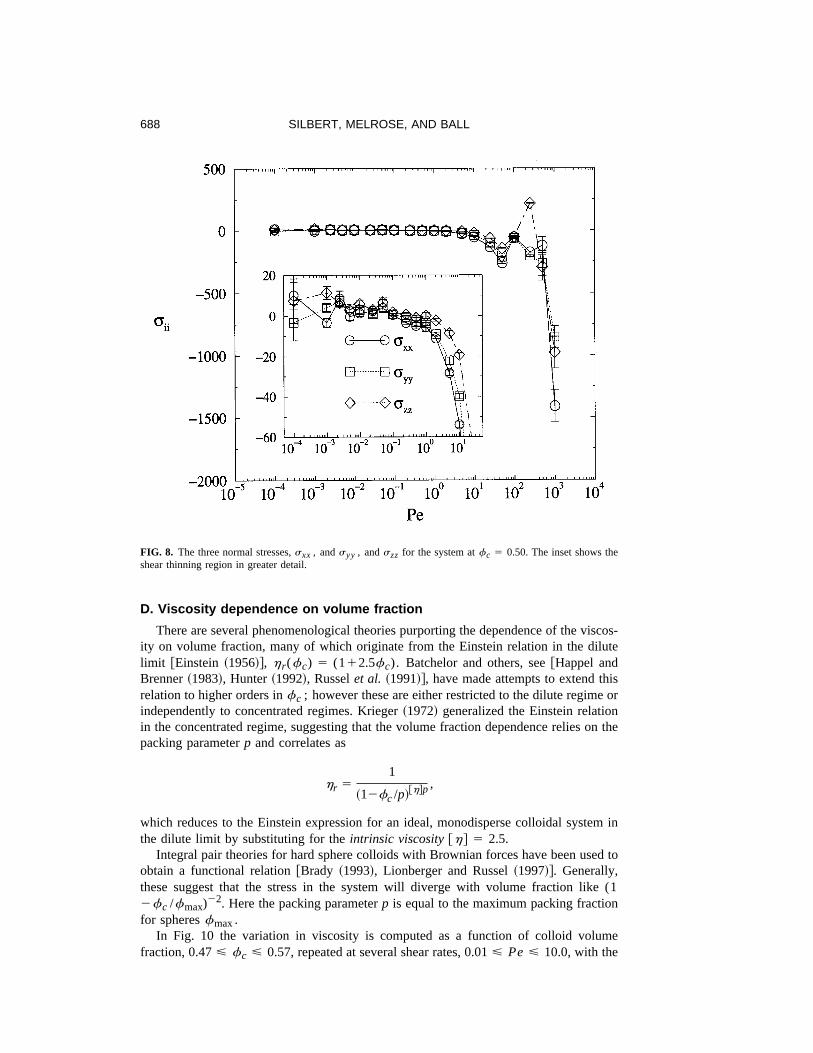
In Fig. 8 we decompose the normal stress differences into the normal stresses,sxx ,syy , and szz computed over the same range of shear rate as in Fig. 7. In the shearthinning regime thes i i fluctuate around zero and again, beyond the shear thinning re-gime, the trend is for thes i i to go negative. Consequently, theNk also go negativebecause one of thes i i is more negative than the other, not because it is more positive.
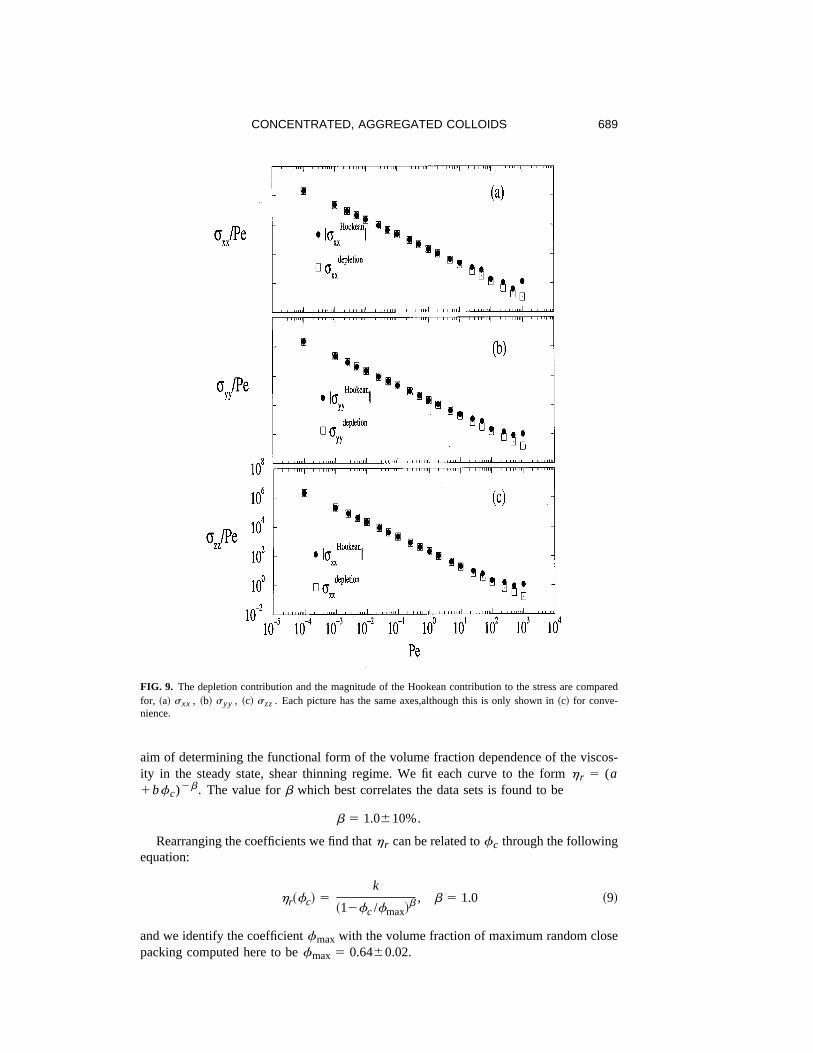
From the rheology data in Fig. 3 the attractive forces do not contribute directly to theviscosity, though it is very clear that the aggregating forces are responsible, in some way,for the observed viscous enhancement. Therefore we feel it pertinent to plot the compo-nents of the normal stresses arising from the two colloid forces, the Hookean term and thedepletion term@cf. Eq.~5!# denoteds i i
Hookeanands i idepletion, respectively~here divided by
Pe!. The contributions arising from the hydrodynamic squeeze force are not shown inFig. 9 as these data are orders of magnitude smaller than the other terms. Ass i i
Hookeanis
always negative, we actually plot the magnitude,us i iHookeanu, for convenience as a direct
comparison to the positive depletion contribution.The Hookean term~which is always negative! and the depletion term~which is always
positive! dominate the normal stresses in the system during the shear thinning regimeeven though the forces act over length scales that differ by an order of magnitude. Athigh shear rates the hydrodynamic squeeze term becomes comparable to the depletionterm. It is through this picture that we see the relevance of the aggregating forces notpreviously realized from the viscosity data in Fig. 3.
FIG. 7. N1 and N2 for the 200 particle system atfc 5 0.50,Umin 5 9kBT, as a function of shear rate. Theinset emphasizes the behavior during shear thinning and the gradual transition to an ordered phase at higherPe.
687CONCENTRATED, AGGREGATED COLLOIDS
D. Viscosity dependence on volume fraction
There are several phenomenological theories purporting the dependence of the viscos-ity on volume fraction, many of which originate from the Einstein relation in the dilutelimit @Einstein ~1956!#, h r (fc) 5 (112.5fc). Batchelor and others, see@Happel andBrenner~1983!, Hunter~1992!, Russelet al. ~1991!#, have made attempts to extend thisrelation to higher orders infc ; however these are either restricted to the dilute regime orindependently to concentrated regimes. Krieger~1972! generalized the Einstein relationin the concentrated regime, suggesting that the volume fraction dependence relies on thepacking parameterp and correlates as
hr 51
~12fc /p!@h#p ,
which reduces to the Einstein expression for an ideal, monodisperse colloidal system inthe dilute limit by substituting for theintrinsic viscosity@h# 5 2.5.
Integral pair theories for hard sphere colloids with Brownian forces have been used toobtain a functional relation@Brady ~1993!, Lionberger and Russel~1997!#. Generally,these suggest that the stress in the system will diverge with volume fraction like (12fc /fmax)
22. Here the packing parameterp is equal to the maximum packing fractionfor spheresfmax.
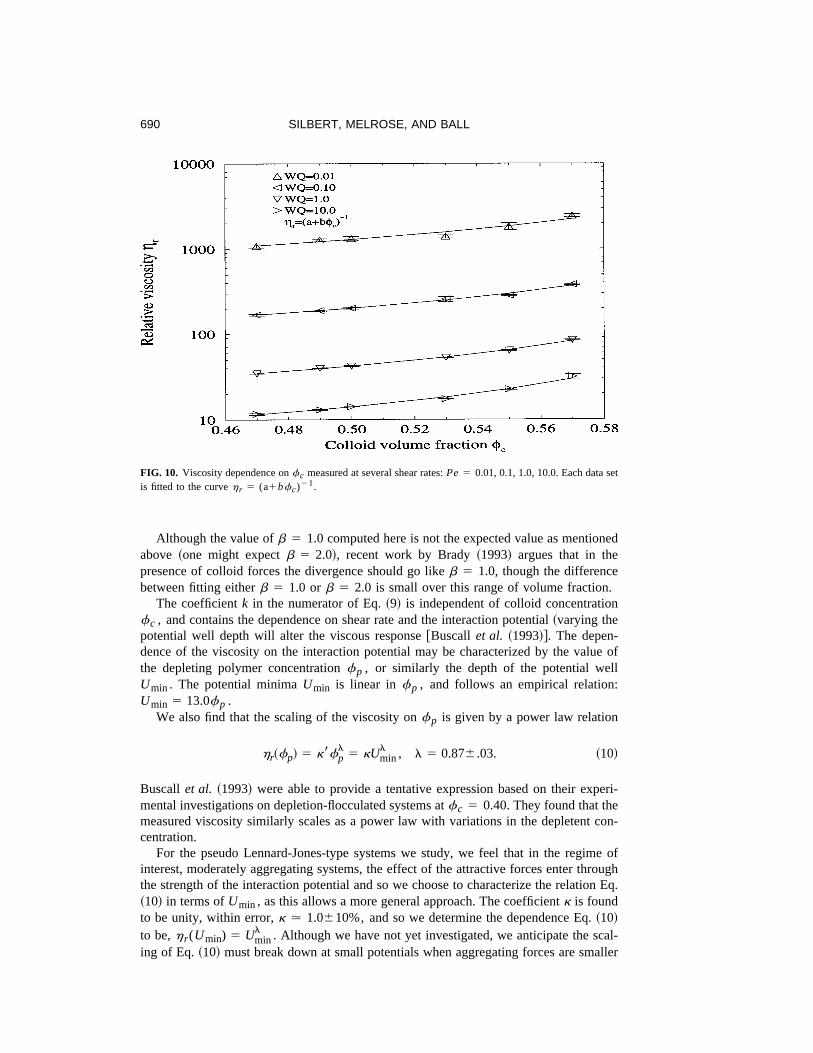
In Fig. 10 the variation in viscosity is computed as a function of colloid volumefraction, 0.47< fc < 0.57, repeated at several shear rates, 0.01< Pe < 10.0, with the
FIG. 8. The three normal stresses,sxx , andsyy , andszz for the system atfc 5 0.50. The inset shows theshear thinning region in greater detail.
688 SILBERT, MELROSE, AND BALL
aim of determining the functional form of the volume fraction dependence of the viscos-ity in the steady state, shear thinning regime. We fit each curve to the formh r 5 (a1bfc)2b. The value forb which best correlates the data sets is found to be
b 5 1.0610%.
Rearranging the coefficients we find thath r can be related tofc through the followingequation:
hr~fc! 5k
~12fc /fmax!b , b 5 1.0 ~9!
and we identify the coefficientfmax with the volume fraction of maximum random closepacking computed here to befmax 5 0.6460.02.
FIG. 9. The depletion contribution and the magnitude of the Hookean contribution to the stress are comparedfor, ~a! sxx , ~b! syy , ~c! szz. Each picture has the same axes,although this is only shown in~c! for conve-nience.
689CONCENTRATED, AGGREGATED COLLOIDS
Although the value ofb 5 1.0 computed here is not the expected value as mentionedabove ~one might expectb 5 2.0!, recent work by Brady~1993! argues that in thepresence of colloid forces the divergence should go likeb 5 1.0, though the differencebetween fitting eitherb 5 1.0 orb 5 2.0 is small over this range of volume fraction.
The coefficientk in the numerator of Eq.~9! is independent of colloid concentrationfc , and contains the dependence on shear rate and the interaction potential~varying thepotential well depth will alter the viscous response@Buscall et al. ~1993!#. The depen-dence of the viscosity on the interaction potential may be characterized by the value ofthe depleting polymer concentrationfp , or similarly the depth of the potential wellUmin. The potential minimaUmin is linear in fp , and follows an empirical relation:Umin 5 13.0fp .
We also find that the scaling of the viscosity onfp is given by a power law relation
hr~fp! 5 k8fpl
5 kUminl , l 5 0.876.03. ~10!
Buscall et al. ~1993! were able to provide a tentative expression based on their experi-mental investigations on depletion-flocculated systems atfc 5 0.40. They found that themeasured viscosity similarly scales as a power law with variations in the depletent con-centration.
For the pseudo Lennard-Jones-type systems we study, we feel that in the regime ofinterest, moderately aggregating systems, the effect of the attractive forces enter throughthe strength of the interaction potential and so we choose to characterize the relation Eq.~10! in terms ofUmin, as this allows a more general approach. The coefficientk is foundto be unity, within error,k . 1.0610%, and so we determine the dependence Eq.~10!
to be,h r (Umin) 5 Uminl . Although we have not yet investigated, we anticipate the scal-
ing of Eq. ~10! must break down at small potentials when aggregating forces are smaller
FIG. 10. Viscosity dependence onfc measured at several shear rates:Pe 5 0.01, 0.1, 1.0, 10.0. Each data setis fitted to the curvehr 5 (a1bfc)21.
690 SILBERT, MELROSE, AND BALL
thankBT, and the system and its rheology will reduce to that of hard spheres, and also atvery large potentials, where the systems may effectively become glassy.
E. Power law, shear thinning colloids
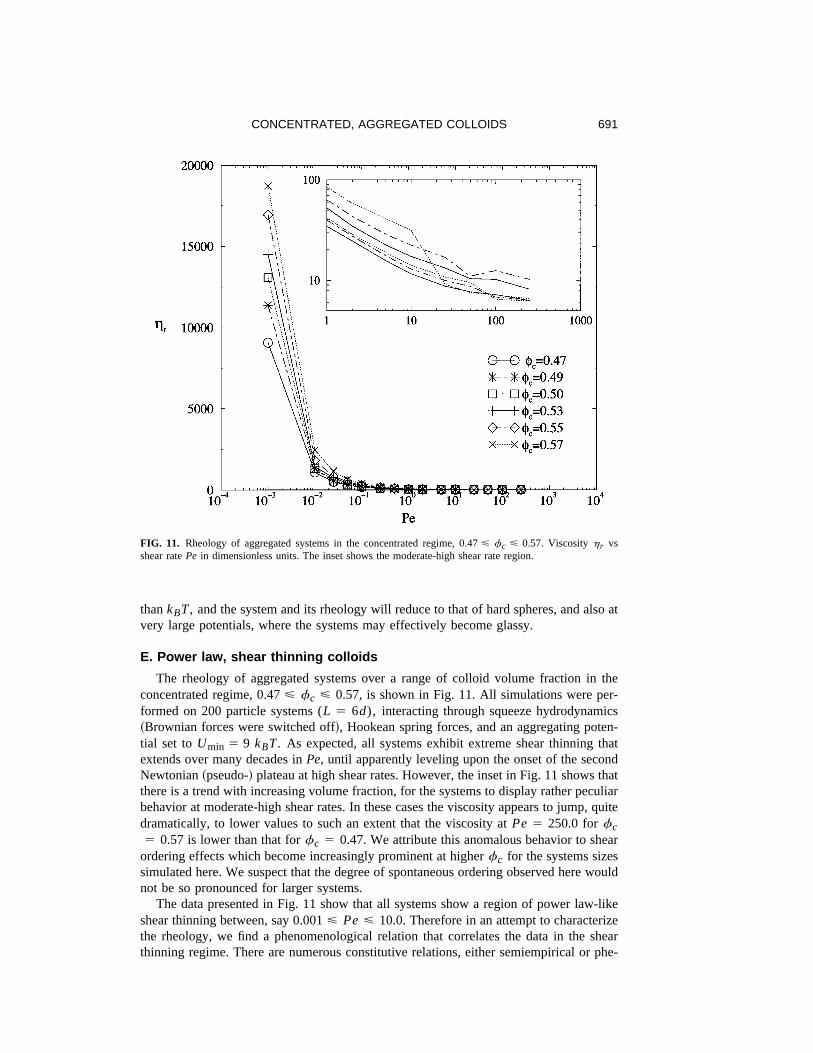
The rheology of aggregated systems over a range of colloid volume fraction in theconcentrated regime, 0.47< fc < 0.57, is shown in Fig. 11. All simulations were per-formed on 200 particle systems (L 5 6d), interacting through squeeze hydrodynamics~Brownian forces were switched off!, Hookean spring forces, and an aggregating poten-tial set toUmin 5 9 kBT. As expected, all systems exhibit extreme shear thinning thatextends over many decades inPe, until apparently leveling upon the onset of the secondNewtonian~pseudo-! plateau at high shear rates. However, the inset in Fig. 11 shows thatthere is a trend with increasing volume fraction, for the systems to display rather peculiarbehavior at moderate-high shear rates. In these cases the viscosity appears to jump, quitedramatically, to lower values to such an extent that the viscosity atPe 5 250.0 forfc5 0.57 is lower than that forfc 5 0.47. We attribute this anomalous behavior to shear
ordering effects which become increasingly prominent at higherfc for the systems sizessimulated here. We suspect that the degree of spontaneous ordering observed here wouldnot be so pronounced for larger systems.
The data presented in Fig. 11 show that all systems show a region of power law-likeshear thinning between, say 0.001< Pe < 10.0. Therefore in an attempt to characterizethe rheology, we find a phenomenological relation that correlates the data in the shearthinning regime. There are numerous constitutive relations, either semiempirical or phe-
FIG. 11. Rheology of aggregated systems in the concentrated regime, 0.47< fc < 0.57. Viscosityhr vsshear ratePe in dimensionless units. The inset shows the moderate-high shear rate region.
691CONCENTRATED, AGGREGATED COLLOIDS
nomenological, relating the dependence of the viscosity on the shear rate@Barneset al.~1989!, Hunter~1992!, Russelet al. ~1991!#. As an initial guess to describe the constitu-tive relation, one might expect that the rheology would obey the well-known Hershel–Bulkley relation or the Cross model@Barneset al. ~1989!, Hunter ~1992!#. However,because we do not shear at low enough shear rates we are unable to determineh0 . Analternative relation proposed by Sisko@Barneset al. ~1989!#, relates the measured vis-cosity to the shear rate and the infinite-shear plateau value
h2h` 5 Kg2a, ~11!
in which the shear thinning exponenta is defined. In this relation, however, the constantK is undetermined and is usually fitted empirically to the data. In this first instance we donot try to provide any theoretical or semiempirical justification for the fit, as used byBaxter-Drayton and Brady~1997!, for example, as we are merely concerned with apurely phenomenological relation, though we do not discount the fact that other relationsmay be used to correlate the data.
In referring to Eq.~11!, h` is considered to be a well-defined value, and reflects thefact that, say, the system has reached a well-defined state of flow. However, we have seenthat the simulations do not necessarily provide a reliable estimate ofh` . Also, from theanalysis of the normal stress differences atfc 5 0.50 ~see Fig. 7!, it is apparent thatthere exists a crossover region between the power law-like, shear thinning regime and theonset of the ordered phases at high shear rates.
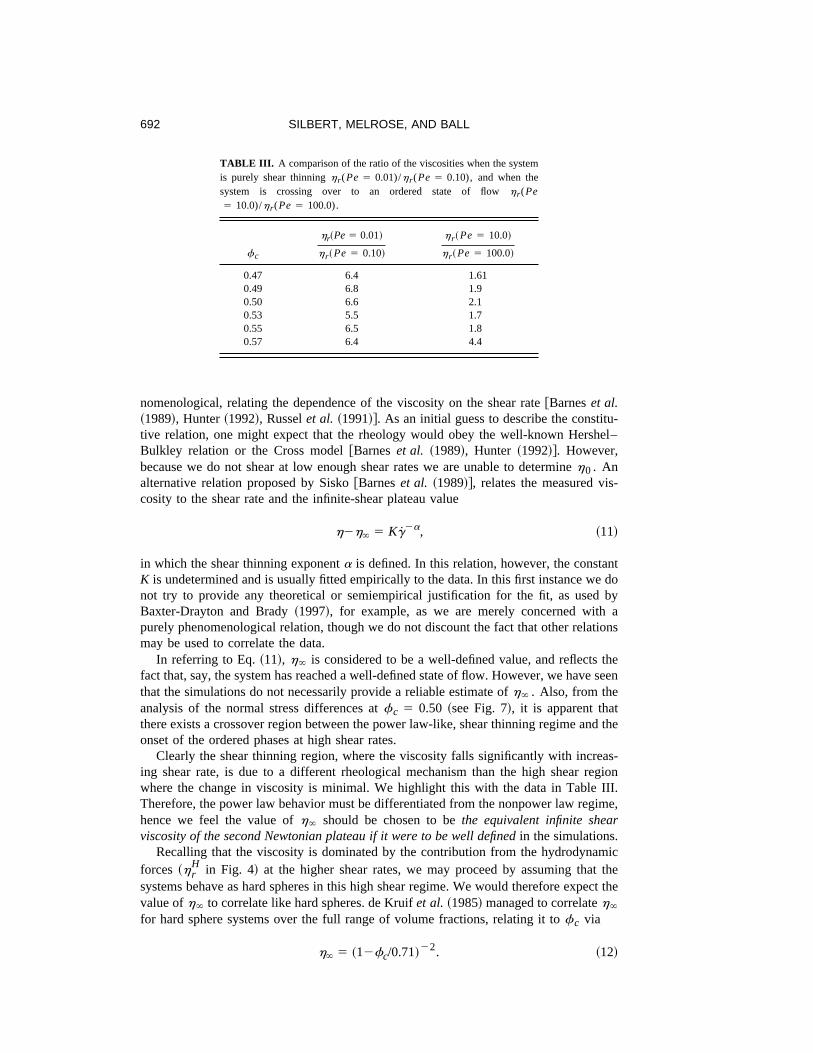
Clearly the shear thinning region, where the viscosity falls significantly with increas-ing shear rate, is due to a different rheological mechanism than the high shear regionwhere the change in viscosity is minimal. We highlight this with the data in Table III.Therefore, the power law behavior must be differentiated from the nonpower law regime,hence we feel the value ofh` should be chosen to bethe equivalent infinite shearviscosity of the second Newtonian plateau if it were to be well definedin the simulations.
Recalling that the viscosity is dominated by the contribution from the hydrodynamicforces ~h r
H in Fig. 4! at the higher shear rates, we may proceed by assuming that thesystems behave as hard spheres in this high shear regime. We would therefore expect thevalue ofh` to correlate like hard spheres. de Kruifet al. ~1985! managed to correlateh`for hard sphere systems over the full range of volume fractions, relating it tofc via
h` 5 ~12fc/0.71!22. ~12!
TABLE III. A comparison of the ratio of the viscosities when the systemis purely shear thinninghr (Pe 5 0.01)/hr (Pe 5 0.10), and when thesystem is crossing over to an ordered state of flowhr (Pe5 10.0)/hr (Pe 5 100.0).
fc
hr~Pe5 0.01!
hr ~Pe 5 0.10!
hr ~Pe 5 10.0!
hr ~Pe 5 100.0!
0.47 6.4 1.610.49 6.8 1.90.50 6.6 2.10.53 5.5 1.70.55 6.5 1.80.57 6.4 4.4
692 SILBERT, MELROSE, AND BALL
The value 0.71, assumes that the value ofh` derives from the well-defined flow of thesystems in an ordered face-centered-cubic structure.
Using the dimensionless parameters in the simulation, the Sisko relation may be re-written as
hr2h` 5 KPe2a, ~13!
such that the value ofh` ~which is nondimensionalized! is now given by Eq.~12!. TheconstantK, in Eq. ~13!, can only account for those parameters other than the shear rate:these can only befc and the value of the interaction potential in the current study. Wetherefore write K 5 K1K2 , and set K1 5 K(fc) 5 (12fc /fmax)21, and K2
5 K(Umin) 5 Uminl from our previously determined quantities in Eqs.~9! and ~10!,
respectively.We define the power law shear thinning region to be the subset of data of the rheology
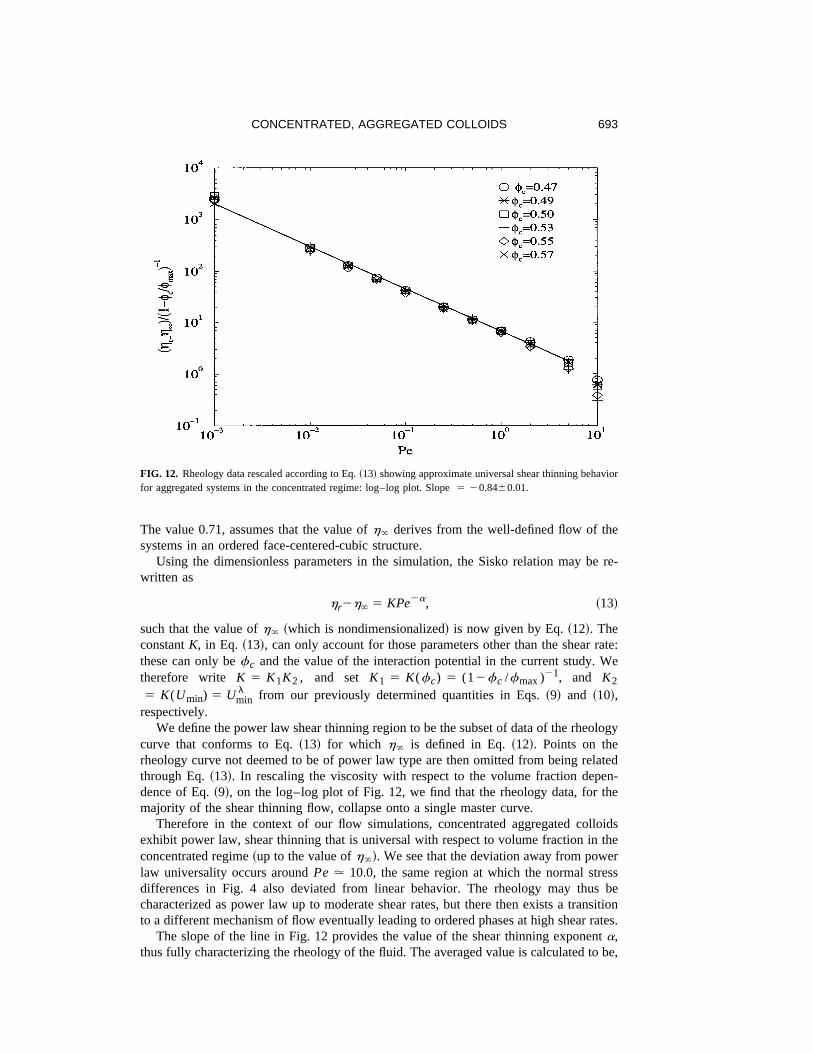
curve that conforms to Eq.~13! for which h` is defined in Eq.~12!. Points on therheology curve not deemed to be of power law type are then omitted from being relatedthrough Eq.~13!. In rescaling the viscosity with respect to the volume fraction depen-dence of Eq.~9!, on the log–log plot of Fig. 12, we find that the rheology data, for themajority of the shear thinning flow, collapse onto a single master curve.
Therefore in the context of our flow simulations, concentrated aggregated colloidsexhibit power law, shear thinning that is universal with respect to volume fraction in theconcentrated regime~up to the value ofh`!. We see that the deviation away from powerlaw universality occurs aroundPe . 10.0, the same region at which the normal stressdifferences in Fig. 4 also deviated from linear behavior. The rheology may thus becharacterized as power law up to moderate shear rates, but there then exists a transitionto a different mechanism of flow eventually leading to ordered phases at high shear rates.
The slope of the line in Fig. 12 provides the value of the shear thinning exponenta,thus fully characterizing the rheology of the fluid. The averaged value is calculated to be,
FIG. 12. Rheology data rescaled according to Eq.~13! showing approximate universal shear thinning behaviorfor aggregated systems in the concentrated regime: log–log plot. Slope5 20.8460.01.
693CONCENTRATED, AGGREGATED COLLOIDS
a 5 0.8460.01. The value of this exponent is very close to the value estimated fromexperimental data on depletion-flocculated suspensions atfc 5 0.40 @Buscall et al.~1993!#, where the exponent is calculated to bea@Buscallet al.(1993)# 5 0.83. Thevalue ofa is also in the region of that obtained from shear experiments of colloidal gels,albeit at lower colloid volume fractions circa 25%, by Verduinet al. ~1996! and similarlyRueb and Zukoski~1997!, and also on the shear studies of polymer gels~aqueous gelatin!@Huang and Sorensen~1996!# (a@Huang and Sorensen~1996!# 5 0.860.05). Verduinet al. ~1996! report the shear thinning exponent as,a 5 0.77, at weaker potentials, butdropping to 0.43 at stronger potentials. From the work by Rueb and Zukoski~1997!, theshear thinning exponent can be crudely estimated to be,a . 0.7.
We highlight the fact that the value ofl is equal toa within error, and so we suggestthat in this approximationl 5 a 5 0.84. A recent kinetic model of the rheology@Farr~1998!# shows that through simple scaling arguments the viscosity should scale with theinteraction potential as a power law, with the same shear thinning exponent.
We may thus write out the full~nondimensionalized! constitutive relation obeyed byour aggregated colloidal systems that is valid in the shear thinning regime
hr~Pe,fc ,Umin! 5Umin
a
~12fc/0.64!Pe2a1
1
~12fc/0.71!2 , a 5 0.8460.01, ~14!
N1 5 0.0
N2 5 0.0.~15!
The behavior at very low shear rates remains to be studied. However, we note that ageneralization of the Eyring theory has been proposed for this regime@Baxter-Draytonand Brady~1997!#.
F. Ordered states at high shear rates
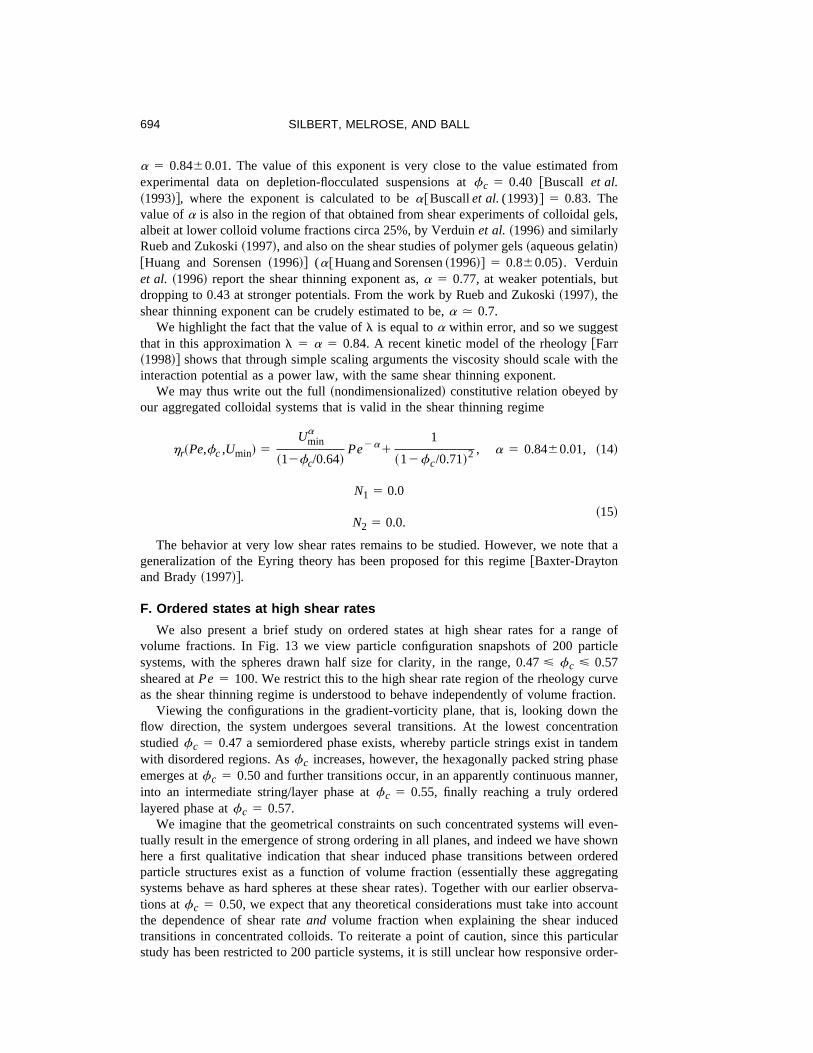
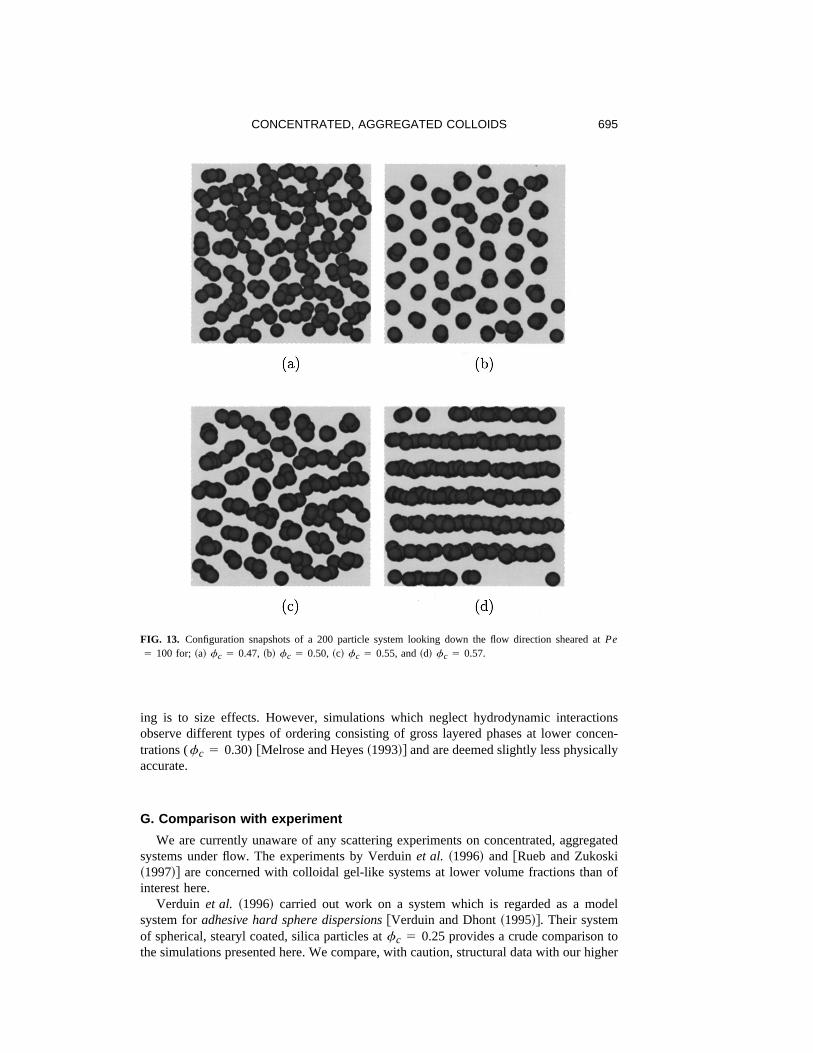
We also present a brief study on ordered states at high shear rates for a range ofvolume fractions. In Fig. 13 we view particle configuration snapshots of 200 particlesystems, with the spheres drawn half size for clarity, in the range, 0.47< fc < 0.57sheared atPe 5 100. We restrict this to the high shear rate region of the rheology curveas the shear thinning regime is understood to behave independently of volume fraction.
Viewing the configurations in the gradient-vorticity plane, that is, looking down theflow direction, the system undergoes several transitions. At the lowest concentrationstudiedfc 5 0.47 a semiordered phase exists, whereby particle strings exist in tandemwith disordered regions. Asfc increases, however, the hexagonally packed string phaseemerges atfc 5 0.50 and further transitions occur, in an apparently continuous manner,into an intermediate string/layer phase atfc 5 0.55, finally reaching a truly orderedlayered phase atfc 5 0.57.
We imagine that the geometrical constraints on such concentrated systems will even-tually result in the emergence of strong ordering in all planes, and indeed we have shownhere a first qualitative indication that shear induced phase transitions between orderedparticle structures exist as a function of volume fraction~essentially these aggregatingsystems behave as hard spheres at these shear rates!. Together with our earlier observa-tions atfc 5 0.50, we expect that any theoretical considerations must take into accountthe dependence of shear rateand volume fraction when explaining the shear inducedtransitions in concentrated colloids. To reiterate a point of caution, since this particularstudy has been restricted to 200 particle systems, it is still unclear how responsive order-
694 SILBERT, MELROSE, AND BALL
ing is to size effects. However, simulations which neglect hydrodynamic interactionsobserve different types of ordering consisting of gross layered phases at lower concen-trations (fc 5 0.30) @Melrose and Heyes~1993!# and are deemed slightly less physicallyaccurate.
G. Comparison with experiment
We are currently unaware of any scattering experiments on concentrated, aggregatedsystems under flow. The experiments by Verduinet al. ~1996! and @Rueb and Zukoski~1997!# are concerned with colloidal gel-like systems at lower volume fractions than ofinterest here.
Verduin et al. ~1996! carried out work on a system which is regarded as a modelsystem foradhesive hard sphere dispersions@Verduin and Dhont~1995!#. Their systemof spherical, stearyl coated, silica particles atfc 5 0.25 provides a crude comparison tothe simulations presented here. We compare, with caution, structural data with our higher
FIG. 13. Configuration snapshots of a 200 particle system looking down the flow direction sheared atPe5 100 for; ~a! fc 5 0.47, ~b! fc 5 0.50, ~c! fc 5 0.55, and~d! fc 5 0.57.
695CONCENTRATED, AGGREGATED COLLOIDS
volume fraction data. We have previously compared our rheology data@Silbert et al.~1997!# with experimental results for depletion-flocculated systems at 40% volume frac-tion @Buscallet al. ~1993!#.
It is still unclear how one should regard microstructures at moderate concentrations.At lower volume fractions, the system can be described in terms of open, fractal-likenetworks@Potanin and Russel~1996!, Potaninet al. ~1995!#. However, as the concentra-tion increases the system becomes increasingly packed and so the notion of ‘‘open’’becomes less meaningful. Atfc 5 0.25 it may be more appropriate to make compari-sons with the concentrated regime.
In Fig. 14 we compare the scattering data of the simulation model of an aggregatingsystem atfc 5 0.50 (Umin 5 9kBT) and the experimentally observed scattering patternfor a gel-forming system atfc 5 0.25. The data are viewed in the flow-vorticity plane~i.e., looking down the gradient direction!. The top three fully shaded plots ofI (k) are thesimulation data atPe 5 0.05, 5.0, and 10.0. Theexperimentaldata @reproduced fromVerduin et al. ~1996!# is shown as the~lower four! mesh plots. The shear rates may benondimensionalized and converted into simulation units using the details of the systemfrom Verduinet al. ~1996!: Pe . 0.0, 0.07, 5.9, and 11.1. An approximate scale alongthe k axes, in units of 106 m21, is shown.
Large scattering peaks, with the peak points lying roughly parallel to the flow direc-tion, are a feature of both the simulation and the experimental systems. However, thepeaks are fairly broad, and thus orientation of the peaks themselves cannot be uniquelyidentified. The amplitudes of the peaks decrease, moderately, with increasing shear rateas we move from the purely shear thinning regime into the transitional region of therheology curve~cf. Fig. 3!.
We have not attempted to compare data at zero-shear rate in Fig. 14 as the zero-shearsystem, in particular, is largely dependent on preparation~history!. For the gel-formingsystem of Verduinet al. ~1996!, the zero-shear system is prepared at high temperaturesand then cooled to the experimental temperaturewithout shearing@Dhont ~1998!#. How-ever, the zero-shear system in Verduinet al. ~1996! exhibits isotropic scattering peakswhich suggest long range structure in the quiescent gel.
Therefore we find that without any detailed knowledge of the functional form of theinteraction potential of the experimental system~other than the fact they represent gel-forming systems!, our simulation data capture some of the qualitative features of theexperimental system; the maximum pre-peak heights inI (k) decrease with increasingshear rate, over the range of shear rates studied, from left to right in the figure.
IV. CONCLUSIONS
The rheology of aggregating and nonaggregating systems has been compared over awide range in shear rate in the concentrated regime. The aggregating system is seen toexperience a large viscous enhancement over the equivalent hard sphere system duringthe shear thinning regime. Although the attractive forces are not explicitly responsible forthis modified rheological behavior, we find that the reason for this enhancement is mani-fested in the increased viscous contribution from the repulsive colloid forces when at-tractive forces are present. The microstructural mechanisms responsible for shear thin-ning rheology must be dominated by the close approach of particle surfaces throughwhich the surface coat interactions contribute significantly to the shear stress. We alsofind that the transition to order at high shear rates is inhibited due to the aggregatingforces, though the particular type of order achieved appears to be dependent on volumefraction in this concentrated regime.
696 SILBERT, MELROSE, AND BALL
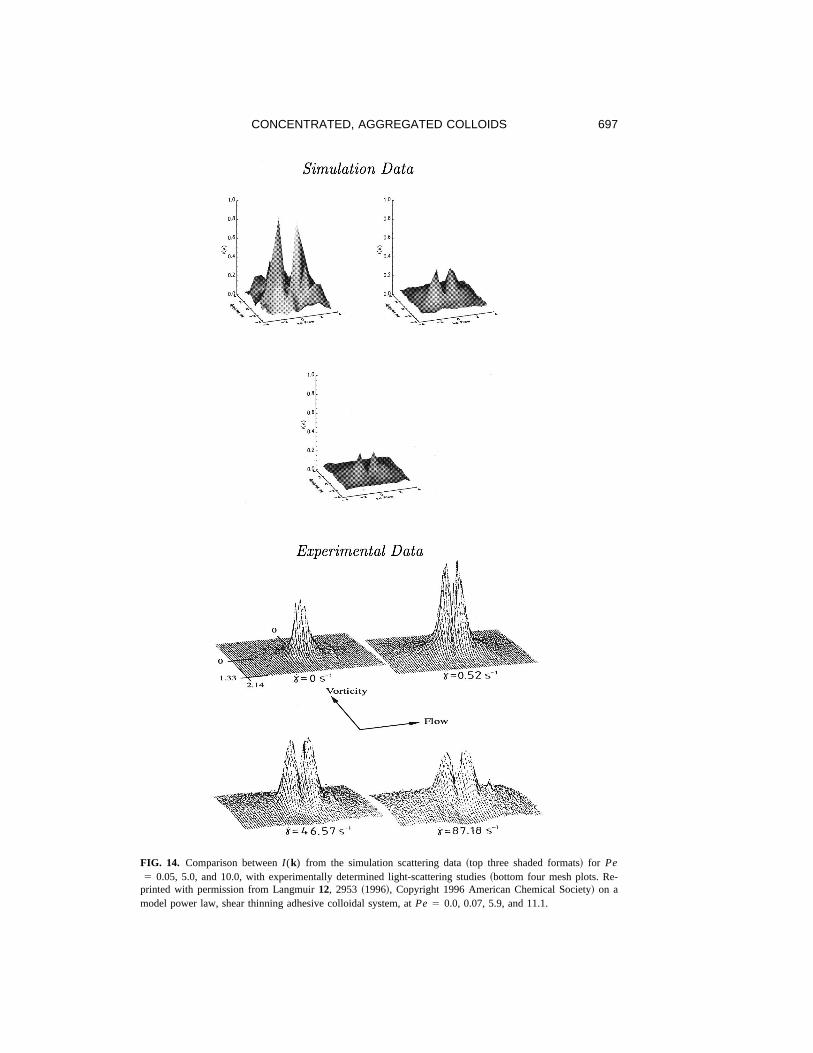
FIG. 14. Comparison betweenI (k) from the simulation scattering data~top three shaded formats! for Pe5 0.05, 5.0, and 10.0, with experimentally determined light-scattering studies~bottom four mesh plots. Re-
printed with permission from Langmuir12, 2953 ~1996!, Copyright 1996 American Chemical Society! on amodel power law, shear thinning adhesive colloidal system, atPe 5 0.0, 0.07, 5.9, and 11.1.
697CONCENTRATED, AGGREGATED COLLOIDS
The aggregating system exhibits power law shear thinning behavior over a wide rangeof shear rates. The normal stress differences vary very little~and remain close to zero!during the shear thinning regime. This power law behavior is found to be universal in thecontext of the simulations at high colloid concentrations, and the value of the power lawindex computed here is comparable to values from similar experimental systems at com-parable volume fractions. In this regime, the approximate functional dependencies of theviscosity on both the colloid volume fractions and the strength of the interaction potentialwere determined. Consequently, a full constitutive equation is given for the system in theshear thinning regime. AsN1 andN2 are hard to measure in experiment, we hope thatEq. ~15! may provide a useful constitutive relation for continuum models.
Configuration snapshots and computed scattering data of the system suggest that dur-ing the shear thinning regime, the system microstructure exhibits liquid-like short rangeorder. However, the presence of pre peaks at small values of wave number,kd . 1.0,which are only seen during shear thinning systems, indicates the presence of intermediaterange order due to longer ranged correlations. These are so far undetermined@Silbert~1998!#, but such features are not observed in shear thinning hard spheres@Heyes andMitchell ~1995!#. However, a cautious comparison with recent experimental work showsthat the simulation data do capture some of the qualitative features observed in experi-mental scattering data on systems which may crudely be considered a close comparison.
ACKNOWLEDGMENTS
This research was supported by the external Unilever colloid physics program and theBBSRC food directorate, together with Dalgety plc., and the EPSRC under Grant No.GR/L21747. The authors would like to thank R. S. Farr, K. G. Soga, and, in particular, R.Buscall for many useful discussions.
References
Ackerson, B. J., ‘‘Shear induced order and shear processing of model hardsphere suspensions,’’ J. Rheol.34,553–590~1990!.
Ball, R. C. and J. R. Melrose, ‘‘A simulation technique for many spheres in quasi-static motion under frame-invariant pair drag and Brownian forces,’’ Physica A247, 444–472~1997!.
Barnes, H. A., J. F. Hutton, and K. Walters,An Introduction to Rheology. Number 3 in Rheology Series~Elsevier, New York, 1989!.
Baxter-Drayton, Y. and J. F. Brady, ‘‘Brownian electrorheological fluids as a model for flocculated disper-sions,’’ J. Rheol.40, 1027–1056~1997!.
Bender, J. W. and N. J. Wagner, ‘‘Optical measurements of the contributions of colloidal forces to the rheologyof concentrated suspensions,’’ J. Colloid Interface Sci.172, 171–184~1995!.
Bilodeau, R. R. and D. W. Bousfield, ‘‘Shear-thinning predictions from particle motion modeling,’’ J. Rheol.42, 743–764~1998!.
Boersma, W. H., J. Laven, and H. N. Stein, ‘‘Computer-simulations of shear thickening of concentrateddispersions,’’ J. Rheol.39, 841–860~1995!.
Bossis, G. and J. F. Brady, ‘‘Dynamic simulation of sheared suspensions. 1. General-method,’’ J. Chem. Phys.80, 5141–5154~1984!.
Bossis, G. and J. F. Brady, ‘‘The rheology of Brownian suspensions,’’ J. Chem. Phys.91, 1866–1874~1989!.Brady, J. F., ‘‘The rheological behaviour of concentrated colloidal dispersions,’’ J. Chem. Phys.99, 567–581
~1993!.Brady, J. F.~personal communications, 1998!.Buscall, R., J. I. McGowan, and A. J. Morton-Jones, ‘‘The rheology of concentrated dispersions of weakly
attracting colloidal particles with and without wall slip,’’ J. Rheol.37, 621–641~1993!.Catherall, A. A.~Private communications, 1998!.Chen, D. and M. Doi, ‘‘Simulation of aggregating colloids in shear flow. II.’’ J. Chem. Phys.91, 2656–2663
~1989!.
698 SILBERT, MELROSE, AND BALL
Clarke, S. M., A. R. Rennie, and R. H. Ottewill, ‘‘Structure of dispersions under shear,’’ inModern Aspects ofColloidal Dispersions, edited by R. H. Ottewill and A. R. Rennie~Kluwer, Dordrecht, 1998!, p. 113.
de Kruif, C. G., E. M. F. van Lersel, A. Vrij, and W. B. Russel, ‘‘Hard sphere colloidal dispersions: Viscosityas a function of shear rate and volume fraction,’’ J. Chem. Phys.83, 4717–4725~1985!.
de Rooij, R., A. A. Potanin, D. van den Ende, and J. Mellema, ‘‘Steady shear viscosity of weakly aggregatingpolystyrene latex dispersions,’’ J. Chem. Phys.99, 9213–9223~1993!.
Dhont, J. K. G.~personal communications, 1998!.Doi, M., D. Chen, and K. Saco,Ordering and Organising in Ionic Solutions~World Scientific, Singapore,
1987!, p. 482.Dratler, D. I. and W. R. Schowalter, ‘‘Dynamic simulations of suspensions of non-Brownian hard spheres,’’ J.
Fluid Mech.325, 53–77~1996!.Durlofsky, L., J. F. Brady, and G. Bossis, ‘‘Dynamic simulation of hydrodynamically interacting particles,’’ J.
Fluid Mech.180, 21–49~1982!.Einstein, A.,Investigations on the Theory of Brownian Movement~Dover, New York, 1956!.Farr, R. S., Ph.D. thesis, University of Cambridge, Cambridge, U. K..Farr, R. S., J. R. Melrose, and R. C. Ball, ‘‘Kinetic theory of jamming in hard-sphere startup flows,’’ Phys. Rev.
E 55, 7203–7211~1997!.Gotzelmann, B., R. Evans, and S. Dietrich, ‘‘Depletion forces in fluids,’’ Phys. Rev. E57, 6785–6800~1998!.Happel, J. and H. Brenner,Low Reynolds Number Hydrodynamics~Martinus Nijhoff, The Hague, 1983!.Haw, M. D., W. C. K. Poon, and P. N. Pusey, ‘‘Direct observation of oscillatory-shear-induced order in
colloidal suspensions,’’ Phys. Rev. E57, 6859–6864~1998!.Heyes, D. M. and P. J. Mitchell, ‘‘Non-equilibrium molecular and Brownian dynamics simulations of shear
thinning of inverse power fluids,’’ Mol. Phys.84, 261–280~1995!.Huang, H. and C. M. Sorensen, ‘‘Shear effects during the gelation of aqueous gelatin,’’ Phys. Rev. E53,
5075–5078~1996!.Hunter, R. J.,Foundations of Colloid Science II~Cambridge University Press, Cambridge, England 1992!.Krieger, I. M., ‘‘Rheology of monodisperse lattices,’’ Adv. Colloid Interface Sci.3, 111 ~1972!.Lees, A. W. and S. F. Edwards, ‘‘The computer study of transport processes under extreme conditions,’’ J.
Phys. C5, 1921–1929~1972!.Lionberger, R. A., ‘‘Shear thinning of colloidal dispersions,’’ J. Rheol.42, 843–863~1998!.Lionberger, R. A. and W. B. Russel, ‘‘A Smoluchowski theory with simple approximations for hydrodynamic
interactions in concentrated dispersions,’’ J. Rheol.41, 399–425~1992!.Melrose, J. R. and R. C. Ball, ‘‘The pathological behaviour of sheared hard-spheres with hydrodynamic inter-
actions,’’ Europhys. Lett.32, 535–540~1995!.Melrose, J. R. and D. M. Heyes, ‘‘Simulations of electrorheological and particle mixture suspensions—
agglomerate and layer structure,’’ J. Chem. Phys.98, 5873–5886~1993!.Morin, B. and D. Ronis, ‘‘Disorder and order in sheared colloidal suspensions,’’ Phys. Rev. E54, 576–587
~1996!.Patel, P. D. and W. B. Russel, ‘‘The rheology of polystyrene lattices phase separated by dextran,’’ J. Rheol.31,
599–618~1987!.Phung, T. N., J. F. Brady, and G. Bossis, ‘‘Stokesian dynamics simulations of Brownian suspensions,’’ J. Fluid
Mech.313, 181–207~1996!.Potanin, A. A., R. de Rooij, D. van den Ende, and J. Mellema, ‘‘Microrheological modeling weakly aggregated
dispersions,’’ J. Chem. Phys.14, 5845–5853~1995!.Potanin, A. A. and W. B. Russel, ‘‘Fractal model of consolidation of weakly aggregated colloidal dispersions,’’
Phys. Rev. E53, 3702–3709~1996!.Rudhardt, D., C. Bechinger, and P. Leiderer, ‘‘Direct measurement of depletion potentials in mixtures of
colloids and nonionic polymers,’’ Phys. Rev. Lett.81, 1330–1333~1998!.Rueb, C. J. and C. F. Zukoski, ‘‘Viscoelastic properties of colloidal gels,’’ J. Rheol.41, 197–218~1997!.Russel, W. B., D. A. Saville, and W. R. Schowalter,Colloidal Dispersions~Cambridge University Press,
Cambridge, England 1991!.Silbert, L. E., Ph.D. thesis, University of Cambridge, Cambridge, U.K.Silbert, L. E., J. R. Melrose, and R. C. Ball, ‘‘Colloidal microdynamics: Pair-drag simulations of concentrated,
aggregated systems,’’ Phys. Rev. E56, 7067–7077~1997!.Toivakka, M., D. Eklund, and D. W. Bousfield, ‘‘Prediction of suspension viscoelasticity through particle
motion modeling,’’ J. Non-Newtonian Fluid Mech.56, 49–64~1995!.Verduin, H., B. J. de Gans, and J. K. G. Dhont, ‘‘Shear induced structural changes in a gel-forming suspension
studied by light scattering and rheology,’’ Langmuir12, 2947–2955~1996!.Verduin, H. and J. K. G. Dhont, ‘‘Phase diagram of a model adhesive hard-sphere dispersion,’’ J. Colloid
Interface Sci.172, 425–437~1995!.Wessel, R. and R. C. Ball, ‘‘Fractal aggregates and gels in shear flow,’’ Phys. Rev. A46, R3008–R3011~1992!.
699CONCENTRATED, AGGREGATED COLLOIDS
West, A. H. L., J. R. Melrose, and R. C. Ball, ‘‘Computer simulations of the breakup of colloid aggregates,’’Phys. Rev. E49, 4237–4249~1994!.
Whittle, M. and E. Dickinson, ‘‘Stress overshoot in a model particle gel,’’ J. Chem. Phys.107, 10191–10200~1997!.
Wolthers, W., Ph.D. thesis, University of Twente, The Netherlands.
700 SILBERT, MELROSE, AND BALL