Embed Size (px)
Citation preview
485 Massachusetts Avenue, Suite 2
Cambridge, Massachusetts 02139
617.661.3248 | www.synapse-energy.com
The RGGI Opportunity
RGGI as the Electric Sector
Compliance Tool to Achieve
2030 State Climate Targets
Sierra Club, Pace Energy and Climate Center, and Chesapeake Climate Action Network
Revised February 5, 2016
AUTHORS
Elizabeth A. Stanton, PhD
Pat Knight
Avi Allison
Tyler Comings
Ariel Horowitz, PhD
Wendy Ong
Nidhi R. Santen, PhD
Kenji Takahashi

Synapse Energy Economics, Inc. The RGGI Opportunity i
EDITOR’S NOTE
In the January 20, 2016 release of this report, there was a typographical error on page ii, paragraph 1
and on page 1, footnote 1. These errors have been corrected in this release.
Synapse Energy Economics, Inc. The RGGI Opportunity ii
EXECUTIVE SUMMARY
For the past seven years, nine northeastern states have led the country in addressing greenhouse gas
emissions from the electric sector. Working together under the Regional Greenhouse Gas Initiative
(RGGI), Connecticut, Delaware, Maine, Maryland, Massachusetts, New Hampshire, New York, Rhode
Island, and Vermont have already cut electric-sector carbon dioxide (CO2) emissions by 45 percent
compared to their 1990 levels and have created a framework to drive deeper electric sector reductions
in the future. RGGI’s electric sector carbon cap is complemented by individual state renewable portfolio
standards (RPS) and energy efficiency resource standards (EERS) that are further helping to transform
power generation in the region. The nine RGGI states have also led the country in establishing longer-
term economy-wide climate goals, clustering around a 40 percent reduction from 1990 levels by 2030
and an 80 percent reduction by 2050.
Synapse evaluated the most cost-effective approaches for states to meet their 2030 climate goals, while
avoiding investments during this time frame that would hinder compliance with states’ longer-term
2050 goals. This least-cost strategy achieves a 40 percent CO2 emission reduction in the nine states by
2030 by lowering the RGGI cap on electric sector emissions from 78 million short tons in 2020 to 19
million short tons in 2030, and adding a new emission reduction measure in the transportation sector.
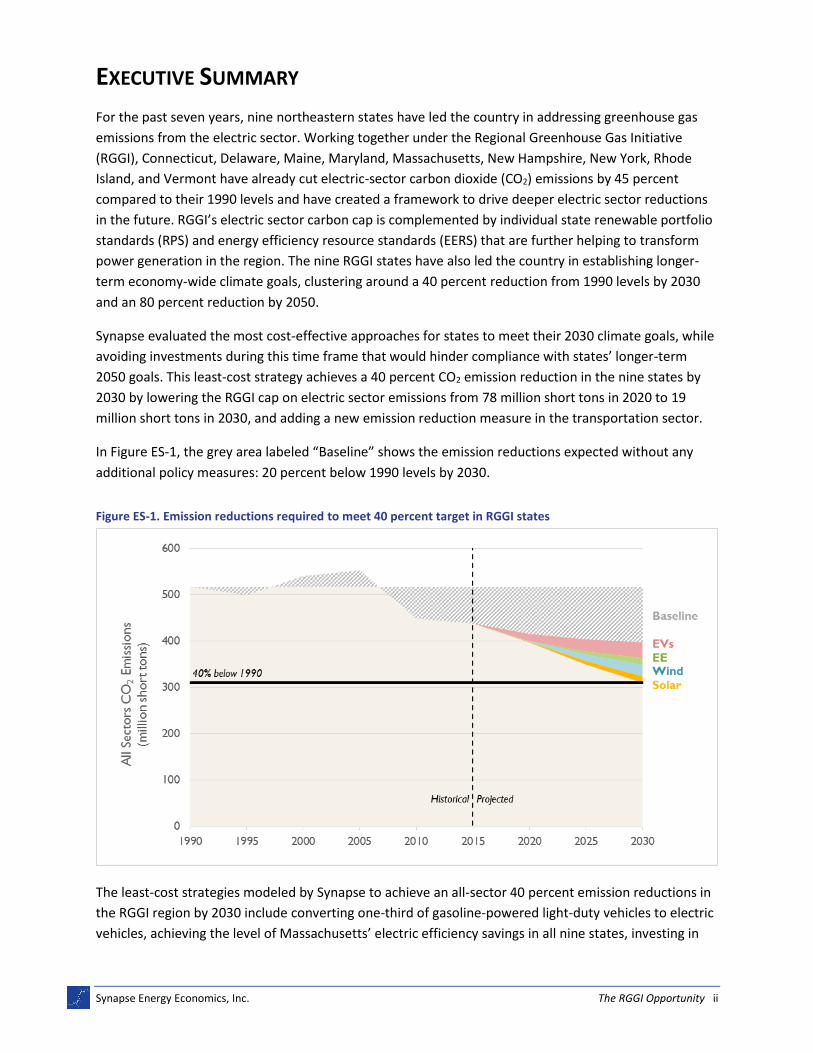
In Figure ES-1, the grey area labeled “Baseline” shows the emission reductions expected without any
additional policy measures: 20 percent below 1990 levels by 2030.
Figure ES-1. Emission reductions required to meet 40 percent target in RGGI states
The least-cost strategies modeled by Synapse to achieve an all-sector 40 percent emission reductions in
the RGGI region by 2030 include converting one-third of gasoline-powered light-duty vehicles to electric
vehicles, achieving the level of Massachusetts’ electric efficiency savings in all nine states, investing in
Synapse Energy Economics, Inc. The RGGI Opportunity iii
new wind generation up to its economic potential, and investing in smaller additions of new solar
generation. Achieving a 40 percent reduction using these strategies yields $5.2 billion in total savings
from 2016 through 2030 and 50,000 new jobs each year in the RGGI region. Asking more from RGGI than
its original targets is a win-win for consumers, workers, and the environment.
Achieving a 40 percent CO2 emission reduction will be driven by reductions in multiple sectors.
While the electric sector will continue to carry nearly 70 percent of the emission reductions through
2030, reductions from the transportation sector are also critical to achieving RGGI states’ 2030 climate
goals. Synapse’s analysis examined both the electric and transportation sectors for the least-cost
emission reduction combination, and left today’s natural gas generating capacity in operation during the
transition to renewables. With the 40 percent emission reduction, natural gas generation only runs
when it is economic and necessary. In this way it continues to support electric service reliability and
plays a role in smoothing out any mismatches between renewable generation and predominantly night-
time charging of electric vehicles.
Increased adoption of electric vehicles saves money for consumers.
The cost savings of switching from gasoline to electricity to power a car more than make up for electric
vehicles’ higher purchase price. Our assessment of which emission reduction measures have lower and
higher costs includes a value for the climate impacts avoided by lowering CO2 emissions. But even
ignoring the benefits of avoiding damage from climate change, electric vehicles save households money.
Robust investment in energy efficiency lowers overall electric sales despite the significant increase in
electric vehicles.
In 2030, efficiency measures save 81,000 gigawatt-hours of electricity in the 40 percent emission
reduction scenario. Converting one-third of all light-duty vehicles to run on electricity only adds 16,000
gigawatt-hours.
Efficiency measures will continue to lower consumers’ bills.
Applying Massachusetts’ expected electric energy efficiency savings in terms of percent of sales—based
on their current three-year plan—to all RGGI states lowers electric sales by 11 percent by 2030. These
efficiency savings have been determined to be cost effective in Massachusetts.
A more stringent RGGI cap works together with state RPS and EERS.
The RGGI allowance auction sets a price signal that is responded to, in part, by state RPS and EERS
programs. Together, RGGI and state portfolios are what make emission reductions possible, both today
and in the future. Without RPS and EERS programs the RGGI cap could be achieved by importing an
increasing share of the Northeast’s electricity from fossil-fuel generators outside of the region.
New RGGI policy generates nearly 50,000 jobs per year.
On average from 2016 through 2030, achieving a 40 percent emission reduction creates nearly 50,000
jobs per year. The new policy generates 27,600 jobs in 2020, 72,500 jobs in 2025, and 70,500 jobs in
2030.

CONTENTS
EDITOR’S NOTE ........................................................................................................ I
EXECUTIVE SUMMARY ............................................................................................... II
1. THE RGGI PROGRAM ........................................................................................ 1
2. GETTING TO 40 PERCENT EMISSION REDUCTIONS IN 2030 ......................................... 3
2.1. 2030 Baseline Emissions are 23 Percent Lower than 1990 Levels .......................................3
2.2. Big Ticket Measures to Reduce Transportation and Electric Emissions ...............................4
2.3. Emissions Do Not Leak from the RGGI Region ...................................................................7
2.4. Two-Thirds of Emission Reductions Come from the Electric Sector ....................................7
2.5. Efficiency, Wind, and Solar Drive Down Electric-Sector Emissions ......................................8
2.6. Electric Efficiency Savings Are One-Fifth of Total Emission Reductions ...............................9
2.7. Ten Million Electric Vehicles Offset 28 Million Short Tons of CO2 ..................................... 10
2.8. Forty Percent Emission Reduction Policy Saves Customers $5.2 billion ............................ 11
2.9. Emission Reductions Generate Nearly 50,000 Jobs per Year ............................................ 13
3. KEY POLICY TAKE-AWAYS ................................................................................. 14
APPENDIX A: ENERGY SECTOR MODELS ....................................................................... 16
Purpose-built Excel-based energy sector model ....................................................................... 16
Electric sector ReEDs model .................................................................................................... 16
Temporal scope ...................................................................................................................... 16
Geographic scope.................................................................................................................... 17
APPENDIX B: BASELINE SCENARIO .............................................................................. 18
Baseline state-specific emissions data ..................................................................................... 18
Historical years, 1990 to 2013 ................................................................................................. 18
Future years, 2015-2030 ......................................................................................................... 18
Sales and energy efficiency...................................................................................................... 18
Renewable energy .................................................................................................................. 20
Synapse Energy Economics, Inc. The RGGI Opportunity 1
Natural gas prices ................................................................................................................... 21
Unit additions ......................................................................................................................... 22
Unit retirements and environmental retrofits .......................................................................... 27
APPENDIX C: THE RGGI 40 PERCENT EMISSION REDUCTION POLICY SCENARIO ..................... 35
Shift measures ........................................................................................................................ 35
Changes to ReEDS assumptions ............................................................................................... 39
APPENDIX D: ECONOMIC AND EMPLOYMENT MODEL ..................................................... 41
APPENDIX E: STATE EMISSION REDUCTION TARGETS ....................................................... 42
APPENDIX F: DETAILED RESULT TABLES ....................................................................... 43

Synapse Energy Economics, Inc. The RGGI Opportunity 1
1. THE RGGI PROGRAM
For the past seven years, Connecticut, Delaware, Maine, Maryland, Massachusetts, New Hampshire,
New York, Rhode Island, and Vermont have worked together to limit the emission of carbon dioxide
(CO2) from their electric sector. The Northeast’s Regional Greenhouse Gas Initiative (RGGI) auctions
certificates representing states’ allowable CO2 emissions to power generators: For each ton of CO2
emitted, fossil fuel generators must purchase an allowance. The revenue from these auctions is
returned to states and is typically spent on renewable energy and efficiency programs.
RGGI—working in concert with a changing market for fossil fuels, state renewable portfolio standards
(RPS) and energy efficiency resource standards (EERS), and other state and federal environmental
policies—has lowered total energy-related CO2 emissions from the nine states 20 percent below 1990
levels (see Figure 1).1 The RGGI electric-sector emissions cap shrinks from 91 million short tons in 2014
down to 78 million short tons in 2020, and stays constant thereafter. With this lower cap in place—and
business-as-usual assumptions that include all current state and federal environment regulations—
Synapse estimates that the nine states will achieve an additional 3 percentage point reduction in all
sector emissions by 2030.
Figure 1. All-sector CO2 emission reductions in the RGGI baseline scenario
Source: Synapse Energy Economics based on RGGI data.
1 By 2013, emissions from all sectors had decreased by 20 percent compared to 1990 levels. In the electric sector, emissions
decreased by 45 percent.

Synapse Energy Economics, Inc. The RGGI Opportunity 2
The U.S. Environmental Protection Agency’s (EPA) recently released Clean Power Plan limits CO2
emissions from electric generators nationwide. However, the combined Clean Power Plan target for
Northeast states for 2030 is less stringent (allows higher levels of emissions) than the RGGI cap for 2020:
80 million short tons compared to 78 million short tons of CO2.2 With no further electric sector emission
reductions between 2020 and 2030, the Northeast states’ RGGI agreement already achieves Clean
Power Plan compliance for the nine states.
Individual RGGI states have set greenhouse gas emission reduction targets for 2030 that range from 35
to 45 percent, centered around a 40 percent reduction from 1990 levels (see Table 1).
Table 1. State greenhouse gas emission reduction targets, 2030 and 2050
State 2030 Target 2050 Target
Connecticut 35-45% below 1990 80% below 2001
Delaware 36% below 1990* No target
Maine 35-45% below 1990 75-80% below 2003
Maryland 35% below 1990** Up to 90% below 2006
Massachusetts 35-45% below 1990 80% below 1990
New Hampshire 35-45% below 1990 80% below 1990
New York 40% below 1990 80% below 1990
Rhode Island 35-45% below 1990 80% below 1990
Vermont 35-45% below 1990 75% below 1990
Note: See Appendix E for citations to state climate statutes.
* Delaware’s 2030 target is a non-binding goal recommended in the state’s Climate Framework of 30 percent below
2008.
** Maryland’s 2030 target is framed as 40 percent below 2006.
To achieve these targets, deeper emission reductions will be needed both within the electric sector,
which continues to offer cost-effective emission reductions, and in the rest of the economy. This report
compares a “baseline” business-as-usual RGGI scenario to a future in which RGGI states’ all-sector
energy-related CO2 emissions are 40 percent lower than their 1990 levels by 2030. The examples of
additional emission reductions shown here take place in the electric and transportation sectors,
although the buildings and industrial sectors also have the potential to lower emissions.
2 All RGGI states’ individual Clean Power Plan mass-based targets with new source complement are higher than their RGGI
allocation in 2030 with the exception of Maine and Maryland.

Synapse Energy Economics, Inc. The RGGI Opportunity 3
2. GETTING TO 40 PERCENT EMISSION REDUCTIONS IN 2030
Deeper emission reductions will require efforts in multiple sectors. While there are many potentially
successful policies to reduce emissions in all sectors, this analysis focuses on four well-researched, cost-
effective emission reduction measures: energy efficiency, wind and solar generation in the electric
sector, and conversion from gas to electric light-duty vehicles in the transportation sector.
Synapse’s analysis applies the least-cost combination of these measures to detailed energy sector
models, taking into consideration dynamic interrelations between electric supply and demand, new
electric demand for transportation, and each state’s power generation and transmission resources.3 The
result is a scenario of the Northeast’s future use of energy resources that not only lowers region-wide
CO2 emissions by 40 percent in all sectors by 2030 but also reduces costs to consumers by $5.2 billion
over the 2016 to 2030 period.
2.1. 2030 Baseline Emissions are 23 Percent Lower than 1990 Levels
In 2030, all-sector CO2 emissions in the baseline RGGI scenario are 23 percent lower than 1990
emissions (see Figure 2).
Figure 2. Additional emission reductions required to meet 40 percent target in RGGI states
3 See the appendices to this report for a detailed description of models and assumptions.
Synapse Energy Economics, Inc. The RGGI Opportunity 4
Source: Synapse Energy Economics.
This baseline emission reduction is due not only to RGGI, but also to lower natural gas fuel prices,
efficiency gains in the transportation and building sectors, and state and federal environmental policies.
In the RGGI baseline, all-sector emissions are 397 million short tons of CO2 in 2030 (120 million short
tons lower than 1990 levels). A further 87 million short ton reduction is needed to bring all-sector
emissions 40 percent below 1990 levels. The RGGI baseline includes the nine states’ compliance with the
RGGI caps as well as all U.S. states’ compliance with state RPS, EERS, and federal Clean Power Plan mass-
based CO2 emission caps (including the new source complement).
2.2. Big Ticket Measures to Reduce Transportation and Electric Emissions
Synapse applied four selected “big ticket” emission reduction measures to the RGGI baseline scenario by
modeling impacts on the electric and other energy sectors (see Table 2).4 Three of the four selected
measures have net negative costs (that is, benefits) for each ton of emission reductions. These net cost
estimates include both economic costs and benefits that impact household budgets as well as the
benefit of avoiding climate damages estimated as the U.S. federal government’s social cost of carbon.5
Note that this cost-benefit analysis does not include other non-energy benefits, such as improved air
and health associated with reducing CO2 co-pollutants.
4 See Appendix C for a more detailed account of emission-reduction measure assumptions and the marginal abatement cost
curve methodology used to select these measures. Note that because only part of the solar measure is applied in the 40 percent emission reduction policy scenario, the 2030 emissions reduction potential for solar exceeds the emissions reduction used in this analysis.
5 U.S. EPA. 2015. “Technical Support Documents: Technical Update of the Social Cost of Carbon for Regulatory Impact Analysis
Under Executive Order 12866.” Revised July 2015 by the Interagency Working Group on Social Cost of Carbon. Available at: https://www.whitehouse.gov/sites/default/files/omb/inforeg/scc-tsd-final-july-2015.pdf. Summary also available at: http://www3.epa.gov/climatechange/EPAactivities/economics/scc.html.

Synapse Energy Economics, Inc. The RGGI Opportunity 5
Table 2. Selected emission reduction measures
Net cost per ton (2014 $ / short ton)
2030 emissions reduction potential (million short tons)
2030 actual emissions reduction used in this analysis (million short tons)
Electric vehicles: Convert one-third of all light-duty vehicles from gas to
electric6
-$300 28 28
Energy efficiency: Achieve Massachusetts’ level of efficiency savings in all RGGI states
-$202 17 17
Wind: Invest in onshore wind generation up to the economically achievable potential
-$23 27 27
Solar: Limited investments in utility-scale solar installations
$10 616 15
Source: Synapse Energy Economics analysis.
Performing detailed electric-sector modeling allows this analysis to take into consideration time of day,
time of year, changes in generation by resource type over time, changes in generation technologies
themselves over time, federal environmental requirements, and complex interactions of electric supply
and demand across state lines.
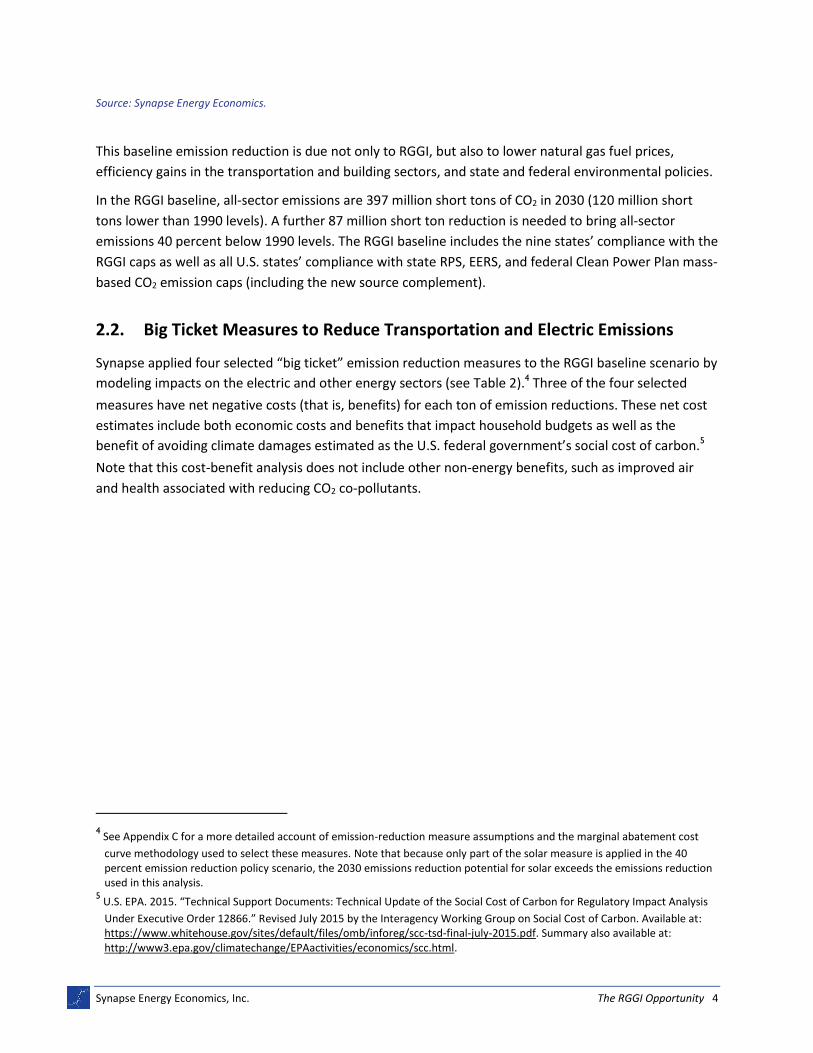
Figure 3 compares emissions in the RGGI baseline and 40 percent emission reduction policy scenarios.
While emissions in buildings and industrial sectors are the same in the two scenarios, electric sector and
light-duty vehicle emissions fall as a result of the additional emission reduction measures.
6 This measure does not include potential emission reductions as a result of plug-in hybrid vehicles or other types of plug-in
vehicles.
Synapse Energy Economics, Inc. The RGGI Opportunity 6
Figure 3. RGGI states’ all-sector emissions in the baseline (“Baseline”) and 40 percent emission reduction policy (“Policy”) scenarios
Source: Synapse Energy Economics.
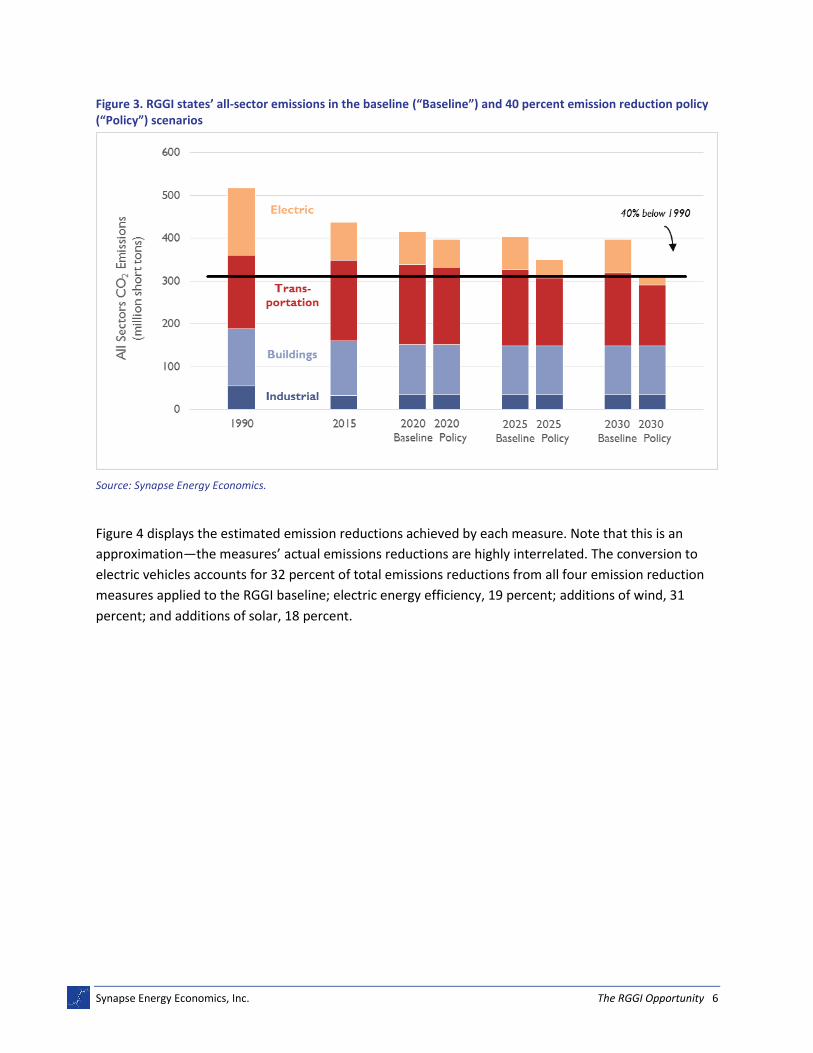
Figure 4 displays the estimated emission reductions achieved by each measure. Note that this is an
approximation—the measures’ actual emissions reductions are highly interrelated. The conversion to
electric vehicles accounts for 32 percent of total emissions reductions from all four emission reduction
measures applied to the RGGI baseline; electric energy efficiency, 19 percent; additions of wind, 31
percent; and additions of solar, 18 percent.
Synapse Energy Economics, Inc. The RGGI Opportunity 7
Figure 4. Additional emission reductions required to meet 40 percent target in RGGI states, by measure
Source: Synapse Energy Economics.
2.3. Emissions Do Not Leak from the RGGI Region
If RGGI states reduced emissions by importing fossil-fuel-fired generation, the result would be
“emissions leakage”: The Northeast’s emissions would fall, but emissions in other states would rise. Our
modeling demonstrates that this does not occur; emissions leakage is avoided under the scenario
examined in this analysis. Our modeling assumptions restrict RGGI states’ trading of Clean Power Plan
allowances to remain within the RGGI group. This avoids leakage of emission allowances (and emissions)
out of the region by (1) restricting RGGI states allowance trading to be within the RGGI region only, and
(2) insuring that most new renewable resources are built within the region (instead of importing
renewable energy credits and electricity from outside of the region).7 As a result, RGGI states’ electric-
sector emissions are lower in the 40 percent emission reduction scenario than in the RGGI baseline.
Emissions in the rest of the United States, however, meet Clean Power Plan mass-based targets exactly
under both scenarios.
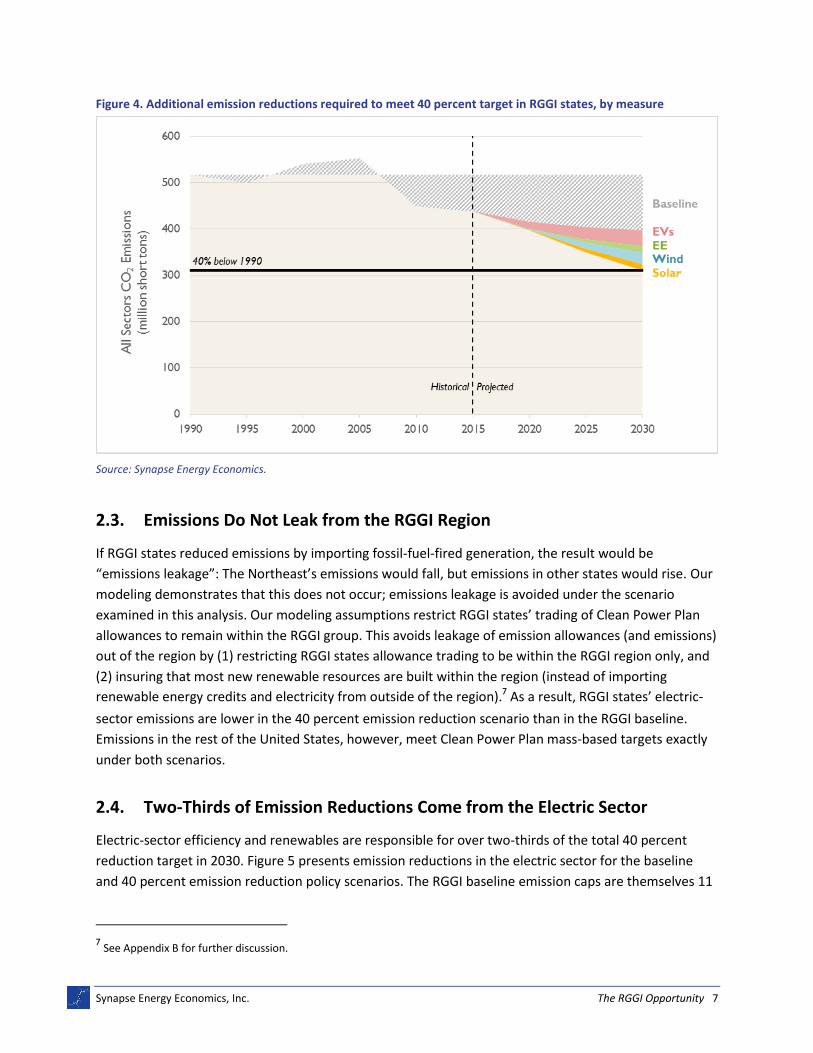
2.4. Two-Thirds of Emission Reductions Come from the Electric Sector
Electric-sector efficiency and renewables are responsible for over two-thirds of the total 40 percent
reduction target in 2030. Figure 5 presents emission reductions in the electric sector for the baseline
and 40 percent emission reduction policy scenarios. The RGGI baseline emission caps are themselves 11
7 See Appendix B for further discussion.
Synapse Energy Economics, Inc. The RGGI Opportunity 8
percent lower than Clean Power Plan mass-based targets (with the new source complement) for the
RGGI states in 2030.
Figure 5. RGGI states’ electric-sector emission caps in the baseline and 40 percent emission reduction policy scenarios, relative to historical emissions and requirements in the Clean Power Plan
Source: Synapse Energy Economics.
2.5. Efficiency, Wind, and Solar Drive Down Electric-Sector Emissions
Under the 40 percent emission reduction scenario new, lower RGGI caps drive deeper, more wide-
spread changes in the RGGI states’ electric system. Figure 6 reports the impact of these measures in
terms of generation by resource. Coal, oil, and some natural gas-fired generation are replaced by
efficiency and renewables. Note that electric sector generation is lower in the 40 percent emission
reduction scenario than in the RGGI baseline even though substantial generation is needed to power
electric vehicles: savings from energy efficiency outweigh additional electricity sold to owners of electric
vehicles.
Synapse Energy Economics, Inc. The RGGI Opportunity 9
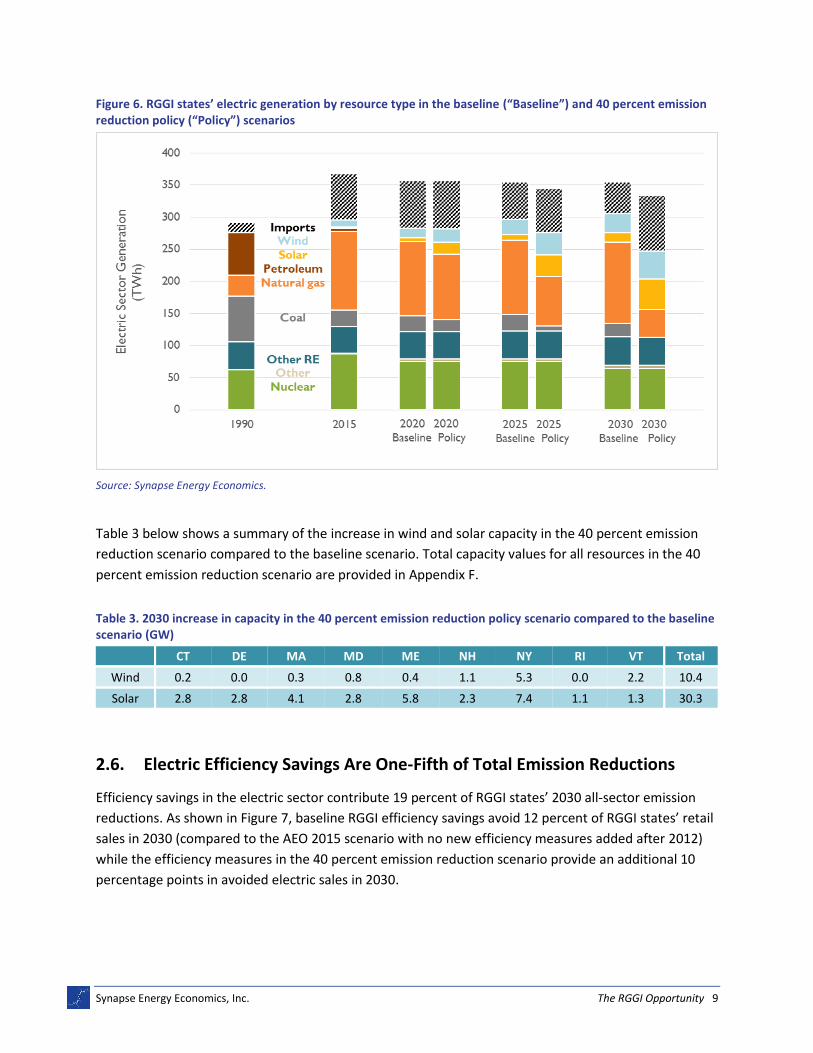
Figure 6. RGGI states’ electric generation by resource type in the baseline (“Baseline”) and 40 percent emission reduction policy (“Policy”) scenarios
Source: Synapse Energy Economics.
Table 3 below shows a summary of the increase in wind and solar capacity in the 40 percent emission
reduction scenario compared to the baseline scenario. Total capacity values for all resources in the 40
percent emission reduction scenario are provided in Appendix F.
Table 3. 2030 increase in capacity in the 40 percent emission reduction policy scenario compared to the baseline scenario (GW)
CT DE MA MD ME NH NY RI VT Total
Wind 0.2 0.0 0.3 0.8 0.4 1.1 5.3 0.0 2.2 10.4
Solar 2.8 2.8 4.1 2.8 5.8 2.3 7.4 1.1 1.3 30.3
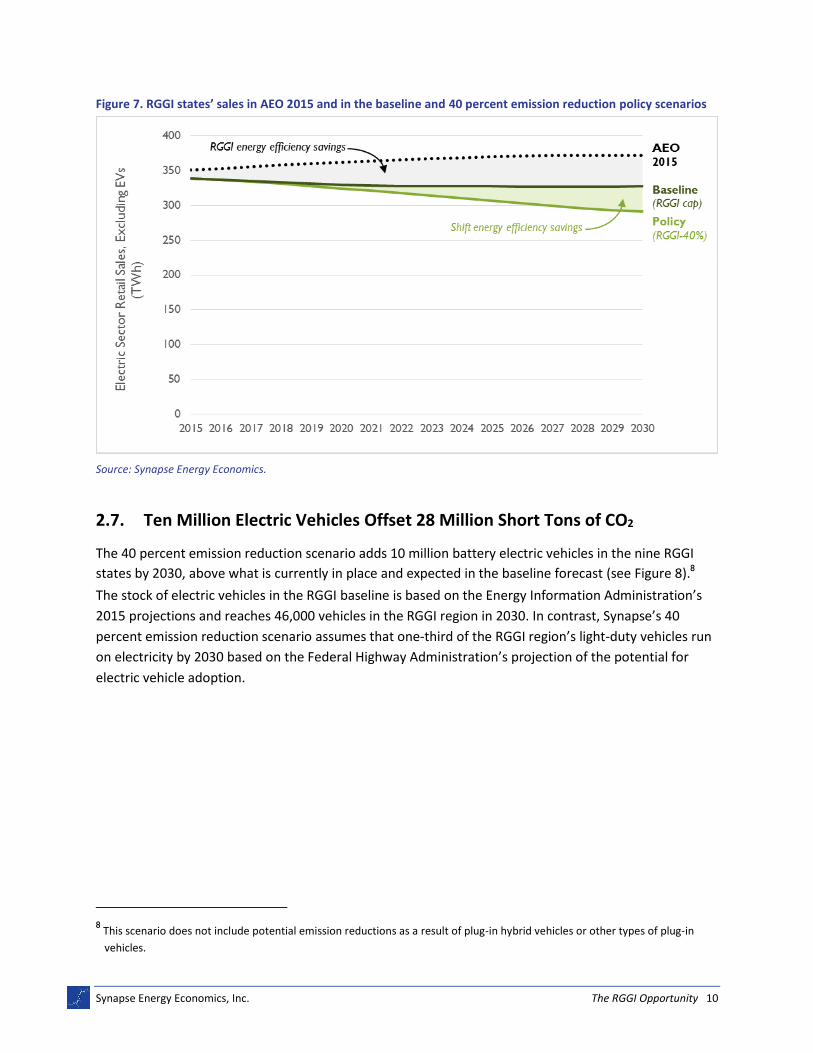
2.6. Electric Efficiency Savings Are One-Fifth of Total Emission Reductions
Efficiency savings in the electric sector contribute 19 percent of RGGI states’ 2030 all-sector emission
reductions. As shown in Figure 7, baseline RGGI efficiency savings avoid 12 percent of RGGI states’ retail
sales in 2030 (compared to the AEO 2015 scenario with no new efficiency measures added after 2012)
while the efficiency measures in the 40 percent emission reduction scenario provide an additional 10
percentage points in avoided electric sales in 2030.
Synapse Energy Economics, Inc. The RGGI Opportunity 10
Figure 7. RGGI states’ sales in AEO 2015 and in the baseline and 40 percent emission reduction policy scenarios
Source: Synapse Energy Economics.
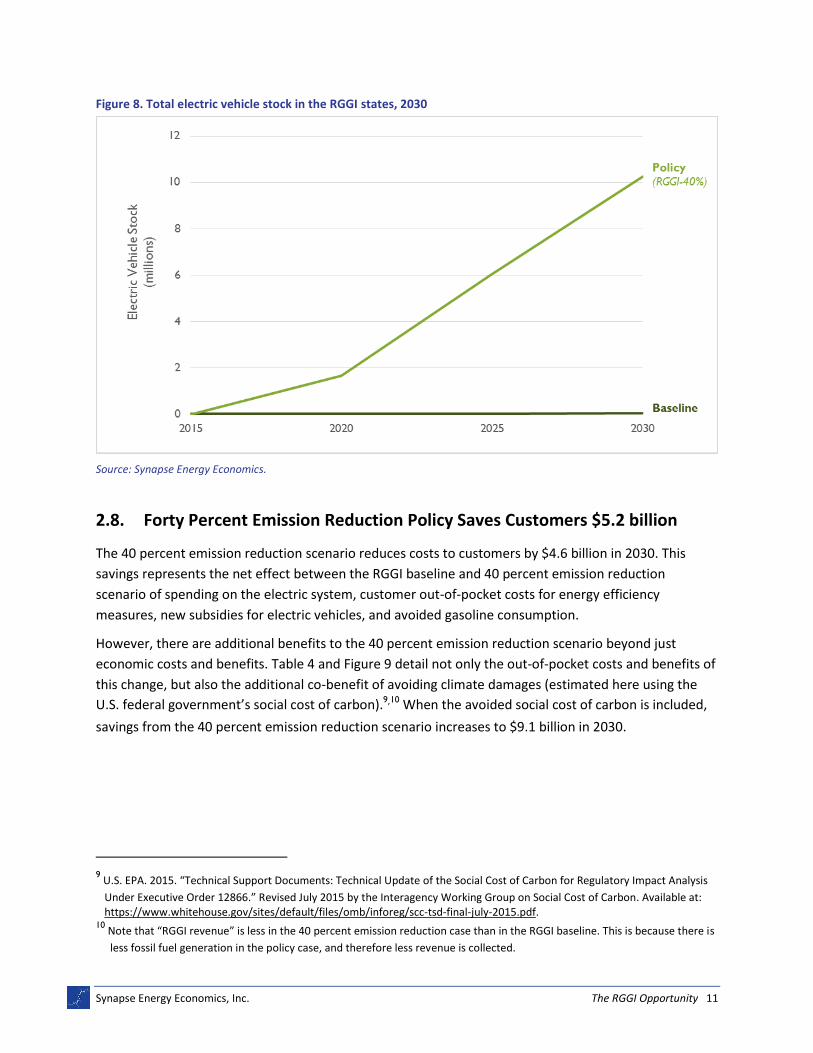
2.7. Ten Million Electric Vehicles Offset 28 Million Short Tons of CO2
The 40 percent emission reduction scenario adds 10 million battery electric vehicles in the nine RGGI
states by 2030, above what is currently in place and expected in the baseline forecast (see Figure 8).8
The stock of electric vehicles in the RGGI baseline is based on the Energy Information Administration’s
2015 projections and reaches 46,000 vehicles in the RGGI region in 2030. In contrast, Synapse’s 40
percent emission reduction scenario assumes that one-third of the RGGI region’s light-duty vehicles run
on electricity by 2030 based on the Federal Highway Administration’s projection of the potential for
electric vehicle adoption.
8 This scenario does not include potential emission reductions as a result of plug-in hybrid vehicles or other types of plug-in
vehicles.
Synapse Energy Economics, Inc. The RGGI Opportunity 11
Figure 8. Total electric vehicle stock in the RGGI states, 2030
Source: Synapse Energy Economics.
2.8. Forty Percent Emission Reduction Policy Saves Customers $5.2 billion
The 40 percent emission reduction scenario reduces costs to customers by $4.6 billion in 2030. This
savings represents the net effect between the RGGI baseline and 40 percent emission reduction
scenario of spending on the electric system, customer out-of-pocket costs for energy efficiency
measures, new subsidies for electric vehicles, and avoided gasoline consumption.
However, there are additional benefits to the 40 percent emission reduction scenario beyond just
economic costs and benefits. Table 4 and Figure 9 detail not only the out-of-pocket costs and benefits of
this change, but also the additional co-benefit of avoiding climate damages (estimated here using the
U.S. federal government’s social cost of carbon).9,10 When the avoided social cost of carbon is included,
savings from the 40 percent emission reduction scenario increases to $9.1 billion in 2030.
9 U.S. EPA. 2015. “Technical Support Documents: Technical Update of the Social Cost of Carbon for Regulatory Impact Analysis
Under Executive Order 12866.” Revised July 2015 by the Interagency Working Group on Social Cost of Carbon. Available at: https://www.whitehouse.gov/sites/default/files/omb/inforeg/scc-tsd-final-july-2015.pdf.
10 Note that “RGGI revenue” is less in the 40 percent emission reduction case than in the RGGI baseline. This is because there is
less fossil fuel generation in the policy case, and therefore less revenue is collected.

Synapse Energy Economics, Inc. The RGGI Opportunity 12
Table 4. Cost and benefits by cost type in the 40 percent emission reduction scenario (billions)
2020 2025 2030
Electric system net costs $1.0 -$1.6 -$4.6
Social cost of carbon -$0.8 -$2.5 -$4.4
Total $0.2 -$4.2 -$9.1
Note: Positive numbers represent increased costs in the 40 percent emission reduction scenario. Negative numbers represent savings in
the 40 percent reduction scenario. Source: Synapse Energy Economics.
In the early years of the new 40 percent emission reduction policy, additional costs to the electric
system and electric vehicle subsidies lead to net costs (see 2020 in Figure 9). However, as more electric
vehicles are introduced over time, the savings from avoided gasoline overwhelms the incremental costs
experienced in other sectors. Altogether, the discounted change in costs for 2016 through 2030 results
in a net present value of $5.2 billion in savings to electric customers before the inclusion of the social
cost of carbon, and a net present value of $20 billion in savings to all customers once the social cost of
carbon is included.11
Figure 9: Annual changes in net costs in the 40 percent emission reduction scenario (billions)
Note: Positive numbers represent increased costs in the 40 percent emission reduction scenario compared to the RGGI baseline. Negative numbers represent savings in the 40 percent reduction scenario. Source: Synapse Energy Economics.
11
Net present value calculated using a discount rate of 3 percent and are reported in 2014 dollars.

Synapse Energy Economics, Inc. The RGGI Opportunity 13
2.9. Emission Reductions Generate Nearly 50,000 Jobs per Year
On average from 2016 through 2030, the 40 percent emission reduction scenario creates nearly 50,000
“job-years”, or jobs per year (see Figure 10). The new policy generates 27,600 jobs in 2020, 72,500 jobs
in 2025, and 70,500 jobs in 2030.
Figure 10: Annual job impacts in the 40 percent emission reduction scenario
Source: Synapse Energy Economics.
The employment impacts show the “net” economic effect from the 40 percent emission reduction
scenario; that is, the jobs created by the policy less the jobs created in the RGGI baseline scenario. For
the electric sector, the net jobs depend on the differences in capital and operating costs between
scenarios. Additional jobs are created when new resources are installed under the 40 percent emission
reduction policy, and fewer jobs are identified when the resources only exist in the RGGI baseline.
Similarly, electric vehicles generate job impacts resulting from new electric service and charging
infrastructure but also include losses from reduced gasoline usage.
Table 5 shows the breakdown of jobs by the source of impact through 2030. The largest gain in jobs
comes from renewable energy resources (almost 25,000 average jobs per year) and energy efficiency
(nearly 20,000 jobs per year). The only sectors that would have fewer jobs under the baseline than in
the 40 percent emission reduction scenario are coal, natural gas, and biomass. “Re-spending” impacts
refer to households and businesses spending savings from the new 40 percent emission reduction policy
relative to the RGGI baseline. For instance, if households are financially better off from purchasing the
combination of an electric vehicle and more electricity for battery charging (as opposed to a

Synapse Energy Economics, Inc. The RGGI Opportunity 14
conventional gas-powered car and gasoline) then they can spend that savings elsewhere in the regional
economy.
Table 5: Annual and cumulative job-year impacts by resource in the 40 percent emission reduction scenario
Resource 2020 2025 2030 Average
Annual Jobs
Cumulative Jobs through
2030
Coal -500 -1,600 -2,300 -1,200 -17,700
Biomass 0 -100 -400 -100 -1,700
Natural Gas -2,400 -6,900 -21,300 -6,800 -101,300
Energy Efficiency 13,500 26,900 28,900 19,400 291,100
Renewable 21,100 32,500 9,700 24,600 369,600
Nuclear 0 0 0 0 0
Hydro 0 0 100 0 0
Transmission 900 1,300 10,400 2,400 35,700
Transportation -100 200 -200 100 1,800
Re-spending -5,000 20,200 45,600 10,400 156,300
Total 27,600 72,500 70,500 48,900 733,800
Note: Columns may not sum to total due to rounding. Values represent differences between single-year “job-years” in different
hypothetical futures and do not necessarily show gains or losses from existing jobs. Source: Synapse Energy Economics.
The result that the 40 percent emission reduction scenario creates new jobs is not surprising. Renewable
energy and energy efficiency typically create more jobs for the same amount of capacity provided by
coal and natural gas generation. More of the cost of clean energy sources is spent on labor than on
capital and fuel. The electrification of transportation also displaces fossil fuels. Compounding this effect,
fossil fuels consumed by the RGGI states come almost entirely from outside the region. Thus the 40
percent emission reduction scenario leads to a shift from spending on extractive industries outside the
region to more labor-intensive industries inside the region.
3. KEY POLICY TAKE-AWAYS
Both lowering the RGGI cap in the electric sector and expanding electric vehicle policies are critical to
Northeast states achieving their state greenhouse gas emission reduction targets. To achieve 40 percent
CO2 emission reductions in RGGI states by 2030, Synapse made a few critical modeling assumptions that
point to important policy considerations for a new, expanded RGGI policy.
Synapse Energy Economics, Inc. The RGGI Opportunity 15
Achieving a 40 percent CO2 emission reduction will be driven by reductions in multiple sectors.
While the electric sector will continue to carry nearly 70 percent of the emission reductions through
2030, reductions from the transportation sector are also critical to achieving RGGI states’ 2030 climate
goals. Synapse’s analysis examined both the electric and transportation sectors for the least-cost
emission reduction combination, and left today’s natural gas generating capacity in operation during the
transition to renewables. With the 40 percent emission reduction, natural gas generation only runs
when it is economic and necessary. In this way it continues to support electric service reliability and
plays a role in smoothing out any mismatches between renewable generation and predominantly night-
time charging of electric vehicles.
Increased adoption of electric vehicles saves money for consumers.
The cost savings of switching from gasoline to electricity to power a car more than make up for electric
vehicles’ higher purchase price. Our assessment of which emission reduction measures have lower and
higher costs includes a value for the climate impacts avoided by lowering CO2 emissions. But even
ignoring the benefits of avoiding damage from climate change, electric vehicles save households money.
Robust investment in energy efficiency lowers overall electric sales despite the significant increase in
electric vehicles.
In 2030, efficiency measures save 81,000 gigawatt-hours of electricity in the 40 percent emission
reduction scenario. Converting one-third of all light-duty vehicles to run on electricity only adds 16,000
gigawatt-hours.
Efficiency measures will continue to lower consumers’ bills.
Applying Massachusetts’ expected electric energy efficiency savings in terms of percent of sales—based
on their current three-year plan—to all RGGI states lowers electric sales by 11 percent by 2030. These
efficiency savings have been determined to be cost effective in Massachusetts.
A more stringent RGGI cap works together with state RPS and EERS.
The RGGI allowance auction sets a price signal that is responded to, in part, by state RPS and EERS
programs. Together, RGGI and state portfolios are what make emission reductions possible, both today
and in the future. Without RPS and EERS programs the RGGI cap could be achieved by importing an
increasing share of the Northeast’s electricity from fossil-fuel generators outside of the region.
New RGGI policy generates nearly 50,000 jobs per year.
On average from 2016 through 2030, achieving a 40 percent emission reduction creates nearly 50,000
jobs per year. The new policy generates 27,600 jobs in 2020, 72,500 jobs in 2025, and 70,500 jobs in
2030.
Synapse Energy Economics, Inc. The RGGI Opportunity 16
APPENDIX A: ENERGY SECTOR MODELS
Synapse’s purpose-built Excel-based model of the nine RGGI states’ electric, transportation, buildings,
and industrial sectors estimates emission and cost differences between the RGGI baseline and the 40
percent reduction policy scenarios. The baseline and the 40 percent emission reduction policy scenario
capacity, generation, emissions and costs for the electric sector are modeled in Synapse’s adapted
version of the National Renewable Energy Laboratory’s (NREL) Regional Energy Deployment System
(ReEDS) model. The results are then imported into the Excel-based model.12
Purpose-built Excel-based energy sector model
Synapse’s customized, dynamic, spreadsheet-based model of emissions in the RGGI states includes the
electric, transportation, building, and industrial sectors. For the electric and transportation sectors,
energy use and its associate emissions differ between the RGGI baseline and 40 percent reduction policy
scenarios. The buildings and industrial sectors are identical in the two scenarios.
Electric sector ReEDs model
ReEDS is a long‐term capacity expansion and dispatch model of the electric power system in the lower
48 states. Synapse has adapted its in-house version of the ReEDS model to allow for more detailed
outputs by state and sector, and to permit differentiation of energy efficiency expectations by state.
Compliance with the Clean Power Plan is modeled as achieving the state-level mass-based targets that
include estimated emissions from new sources (the “new source complement”) on a biennial basis. We
assume that emission allowances are traded both within and across state borders among two separate
groups of states: the nine RGGI states, and all other states modeled. The price of allowances is set
endogenously within the model as a shadow price. For the RGGI states, Clean Power Plan emission caps
are replaced with more stringent (lower) RGGI caps in both scenarios.
Temporal scope
The time period of this analysis is 2015-2030. ReEDS modeling is performed at two-year intervals
starting in 2014. Historical data through 1990 has been included in the spreadsheet model to serve as a
point of comparison for future emissions. The Excel-based model projects emissions and costs at five-
year intervals for the years 2015, 2020, 2025 and 2030.
12 ReEDS version used is ReEDS_v2015.2(r25). More information is available at: http://www.nrel.gov/analysis/reeds.

Synapse Energy Economics, Inc. The RGGI Opportunity 17
Geographic scope
The nine RGGI states are modeled both independently and as a group. In the ReEDS model, all states in
the continental United States are represented. ReEDS divides the United States into 134 power control
areas that are consistent with state boundaries and can be aggregated to model state impacts. Each
power control area is modeled as having a single aggregated “unit” of each resource type, the size of
which is equal to the sum of the capacities of the actual units in that territory. For this analysis, Synapse
modeled the country as a whole to capture interactions between states.
Synapse Energy Economics, Inc. The RGGI Opportunity 18
APPENDIX B: BASELINE SCENARIO
The RGGI baseline scenario is a business-as-usual case in which (a) the currently mandated RGGI caps for
each year are in place (staying constant at the 2020 level in years thereafter), (b) state’s comply with
their RPS and EERS requirements, and (c) states outside of RGGI comply with their mass-based Clean
Power Plan targets, including the new source complement. States’ RGGI emission caps are more
stringent (lower) than their Clean Power Plan mass-based targets. For this reason, only the RGGI caps
(and not the Clean Power Plan targets) apply to RGGI states and—to avoid emission leakage out of the
RGGI region—we have restricted RGGI states to only trade allowances among themselves while
remaining states may trade throughout the non-RGGI region.
Baseline state-specific emissions data
Historical years, 1990 to 2013
State-specific baseline energy consumption is based on the U.S. Energy Information Administration’s
(EIA) State Energy Data System (SEDS). SEDS contains historical time series of state-level estimates of
energy production, consumption, prices, and expenditures by source and sector.13 State-specific
emissions are based on EIA’s State Carbon Dioxide Emissions database.14 These energy-related data does
not include agriculture, land-use change, or upstream (life-cycle) emissions.
Future years, 2015-2030
Synapse based projections for the transportation, buildings, and industrial sectors on regional sector-
specific growth rates derived from the EIA’s Annual Energy Outlook (AEO) 2015 Reference case.15
Electric-sector projections were based on detailed ReEDS modeling runs. ReEDS modeling assumptions
specific to the RGGI baseline scenario are discussed in more detail in the subsequent sub-sections.
Sales and energy efficiency
Annual retail electric sales for the nine RGGI states are projected by applying regional growth rates from
the AEO 2015 Reference case to state-specific EIA historical data. On average, the AEO 2015 Reference
case assumes an annual growth rate of about 0.5 percent per year for the nine RGGI states. From this
we “back out” the AEO representation of ongoing savings—estimated at 0.29 percent of 2012 sales—
13
U.S. Energy Information Administration (EIA). 2015. “About SEDS.” Available at: http://www.eia.gov/state/seds/. 14
EIA. 2015. "State Carbon Dioxide Emissions." Available at: http://www.eia.gov/environment/emissions/state/. 15
EIA. 2015. “Annual Energy Outlook 2015.” Available at: http://www.eia.gov/forecasts/aeo/index.cfm.

Synapse Energy Economics, Inc. The RGGI Opportunity 19
from new energy efficiency measures and replace it with more detailed forecasts.16 Overall, energy
efficiency in the RGGI baseline replaces 10.5 percent of regional sales in 2030.
Four of the nine RGGI states (Massachusetts, Maryland, Maine, and Rhode Island) have energy efficiency
resource standards (EERS) that require utilities to meet a state-specific share of retail sales through
energy efficiency measures. The RGGI states’ EERS requirements are summarized in Figure 11.
Figure 11. RGGI states’ EERS requirements
Note: EERS levels are modeled based on state and utility filings of projected energy efficiency, rather than on percentage-based state statutes.
For states without EERS policies, Synapse estimates future baseline energy efficiency savings according
to state-specific program plans and utility- or state-specific integrated resource planning documents
(see Figure 12). Where data is otherwise unavailable, we assume that the savings level in the last year of
each individual forecast continues through 2030.
16
White, D., et al. “State Energy Efficiency Embedded in Annual Energy Outlook Forecasts.” 2013 Update. Available at
http://synapse-energy.com/sites/default/files/SynapseReport.2013-11.0.EE-in-AEO-2013.12-094-Update_0.pdf.

Synapse Energy Economics, Inc. The RGGI Opportunity 20
Figure 12. Efficiency savings assumptions for RGGI states’ without EERS requirements
Sources: Connecticut Department of Energy and Environmental Protection’s 2014 Integrated Resource Plan; Delmarva Power & Light Company’s 2014 Integrated Resource Plan; 2016 New Hampshire Statewide Core Energy Efficiency Plan from NH Public Utilities Commission Docket DE14-216; 2014 NY incremental savings from EIA Form 861; Vermont Energy Investment Corporation’s 2015-2017 Triennial Plan, prepared for the Vermont Public Service Board.
Renewable energy
All nine RGGI states have RPS policies that require utilities to procure a percentage of their electric retail
sales in qualified forms of renewable generation. The share of renewables required and types of
resources acceptable for classification as renewable varies from state to state. The RGGI states’ total
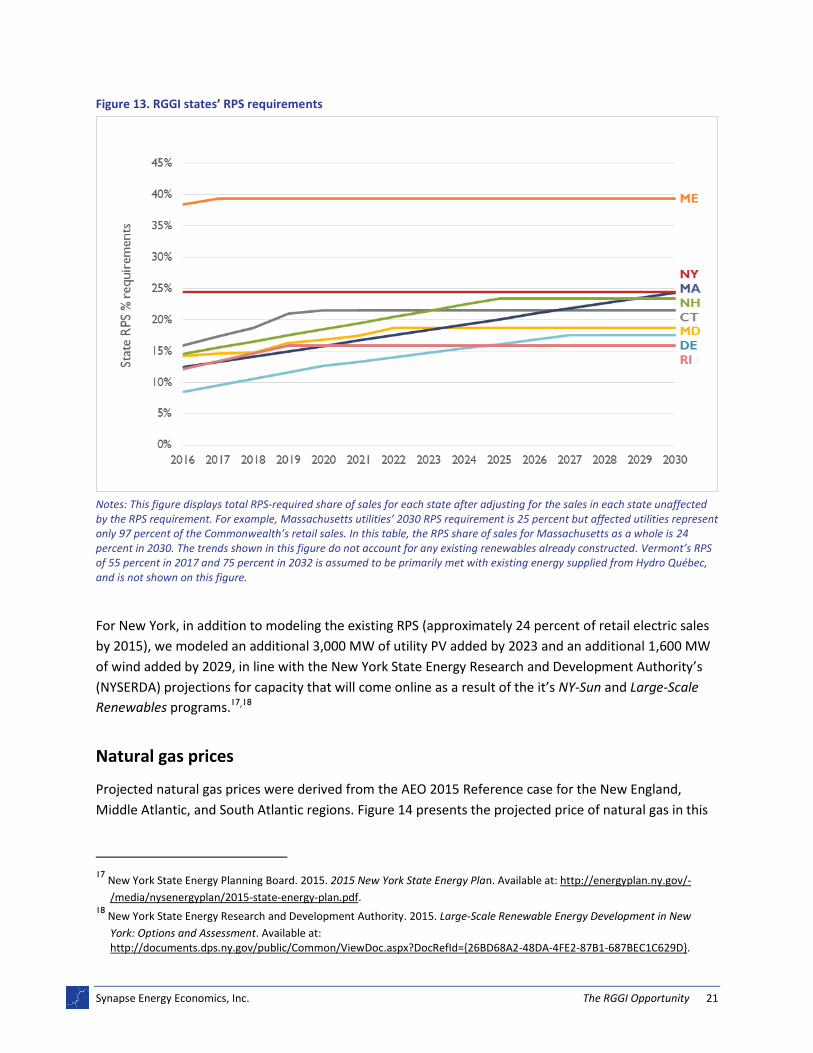
RPS requirements for all renewable resource types are summarized in Figure 13. Overall, renewable
energy (including from existing generators) will account for 24 percent of baseline sales from the RGGI
region by 2030.
Synapse Energy Economics, Inc. The RGGI Opportunity 21
Figure 13. RGGI states’ RPS requirements
Notes: This figure displays total RPS-required share of sales for each state after adjusting for the sales in each state unaffected by the RPS requirement. For example, Massachusetts utilities’ 2030 RPS requirement is 25 percent but affected utilities represent only 97 percent of the Commonwealth’s retail sales. In this table, the RPS share of sales for Massachusetts as a whole is 24 percent in 2030. The trends shown in this figure do not account for any existing renewables already constructed. Vermont’s RPS of 55 percent in 2017 and 75 percent in 2032 is assumed to be primarily met with existing energy supplied from Hydro Québec, and is not shown on this figure.
For New York, in addition to modeling the existing RPS (approximately 24 percent of retail electric sales
by 2015), we modeled an additional 3,000 MW of utility PV added by 2023 and an additional 1,600 MW
of wind added by 2029, in line with the New York State Energy Research and Development Authority’s
(NYSERDA) projections for capacity that will come online as a result of the it’s NY-Sun and Large-Scale
Renewables programs.17,18
Natural gas prices
Projected natural gas prices were derived from the AEO 2015 Reference case for the New England,
Middle Atlantic, and South Atlantic regions. Figure 14 presents the projected price of natural gas in this
17
New York State Energy Planning Board. 2015. 2015 New York State Energy Plan. Available at: http://energyplan.ny.gov/-
/media/nysenergyplan/2015-state-energy-plan.pdf. 18
New York State Energy Research and Development Authority. 2015. Large-Scale Renewable Energy Development in New
York: Options and Assessment. Available at: http://documents.dps.ny.gov/public/Common/ViewDoc.aspx?DocRefId={26BD68A2-48DA-4FE2-87B1-687BEC1C629D}.

Synapse Energy Economics, Inc. The RGGI Opportunity 22
region out to 2030 and, for comparison, the projected Henry Hub spot-price from the same source. Note
that ReEDS uses natural gas prices based on an endogenous supply-curve formulation, in which cost is a
function of the quantity demanded with underlying supply curves calibrated to AEO Reference case
forecasts.
Figure 14. Natural gas prices for the RGGI state regions
Source: Synapse Energy Economics, based on AEO 2015, Tables 3.1, 3.2, and 3.5.
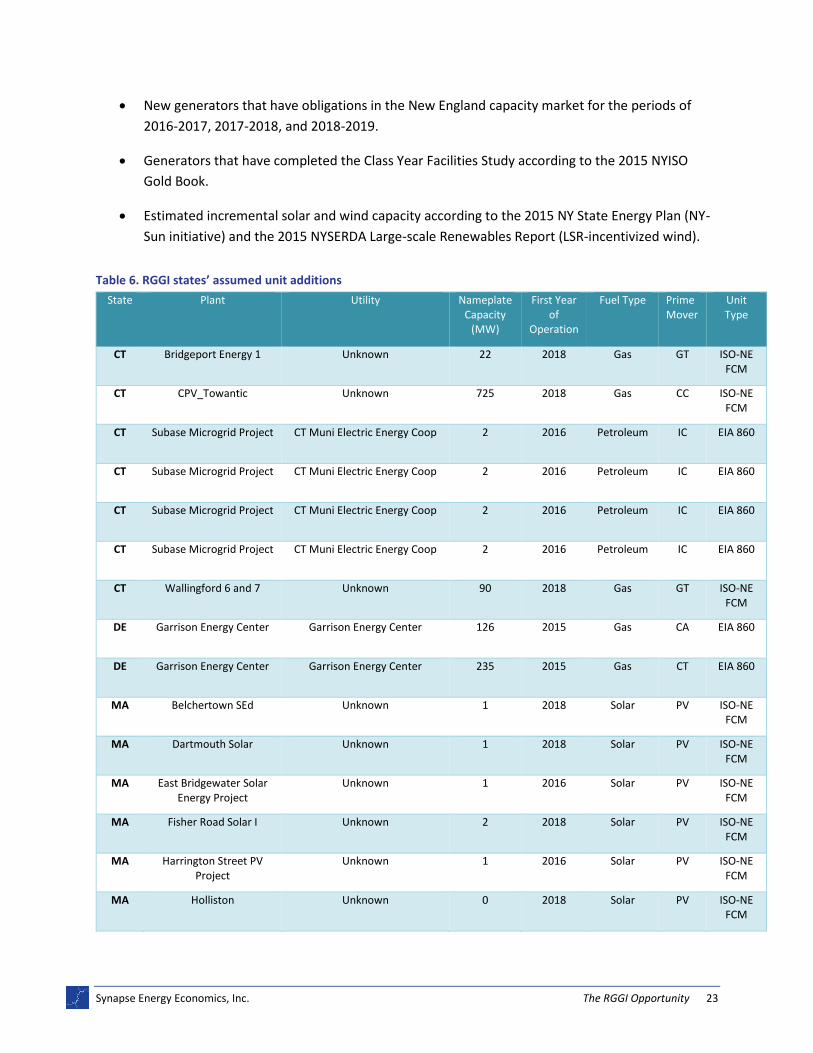
Unit additions
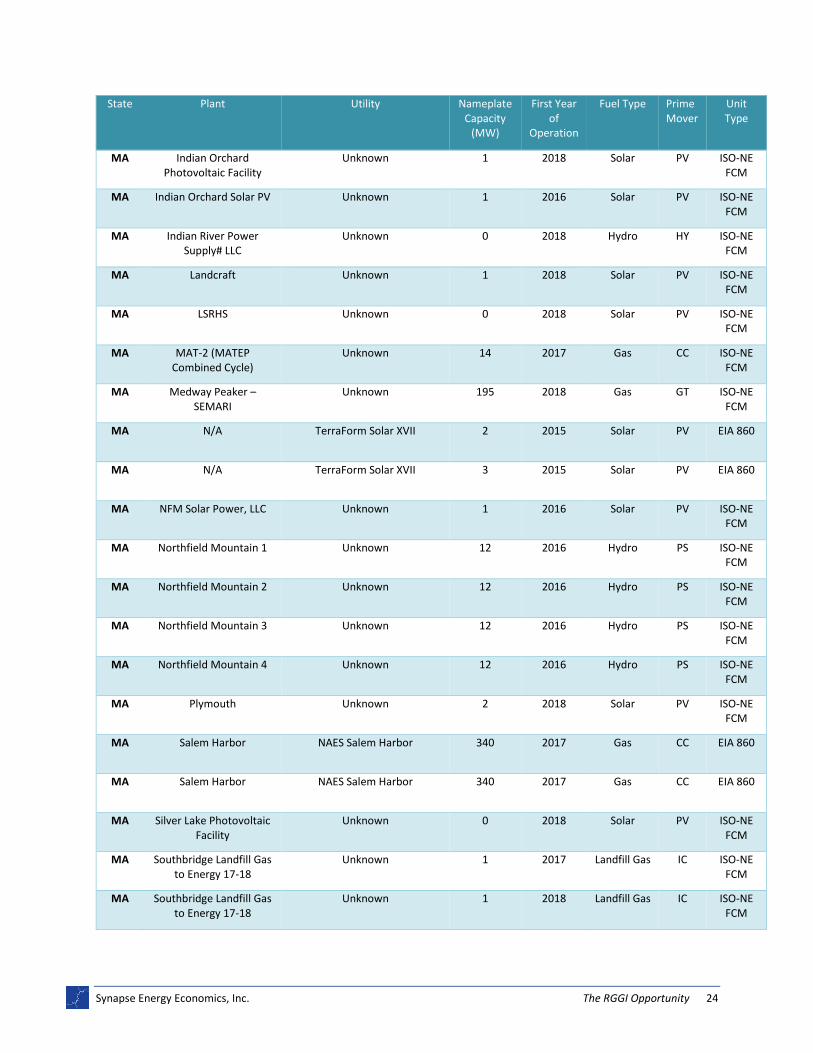
A number of new natural gas units have been announced for the nine RGGI states. Table 6 presents a
summary that includes: the state in which the units are coming online; the associated plant and utility;
and each unit’s capacity, anticipated in-service year, and generation technology. This list was developed
by Sierra Club, Pace Energy and Climate Center, and Chesapeake Climate Action Network using sources
that included the following:
Unit additions reported in the 2014 edition of the EIA 860 database of generators currently
under construction.
Natural gas generators listed as currently under construction in the PJM Interconnection Queue.
Where possible, data for these units was cross-checked with the EIA 860 2014 (even in cases
where those generators have not yet begun construction, according to that dataset).
Synapse Energy Economics, Inc. The RGGI Opportunity 23
New generators that have obligations in the New England capacity market for the periods of
2016-2017, 2017-2018, and 2018-2019.
Generators that have completed the Class Year Facilities Study according to the 2015 NYISO
Gold Book.
Estimated incremental solar and wind capacity according to the 2015 NY State Energy Plan (NY-
Sun initiative) and the 2015 NYSERDA Large-scale Renewables Report (LSR-incentivized wind).
Table 6. RGGI states’ assumed unit additions
State Plant Utility Nameplate Capacity
(MW)
First Year of
Operation
Fuel Type Prime Mover
Unit Type
CT Bridgeport Energy 1 Unknown 22 2018 Gas GT ISO-NE FCM
CT CPV_Towantic Unknown 725 2018 Gas CC ISO-NE FCM
CT Subase Microgrid Project CT Muni Electric Energy Coop 2 2016 Petroleum IC EIA 860
CT Subase Microgrid Project CT Muni Electric Energy Coop 2 2016 Petroleum IC EIA 860
CT Subase Microgrid Project CT Muni Electric Energy Coop 2 2016 Petroleum IC EIA 860
CT Subase Microgrid Project CT Muni Electric Energy Coop 2 2016 Petroleum IC EIA 860
CT Wallingford 6 and 7 Unknown 90 2018 Gas GT ISO-NE FCM
DE Garrison Energy Center Garrison Energy Center 126 2015 Gas CA EIA 860
DE Garrison Energy Center Garrison Energy Center 235 2015 Gas CT EIA 860
MA Belchertown SEd Unknown 1 2018 Solar PV ISO-NE FCM
MA Dartmouth Solar Unknown 1 2018 Solar PV ISO-NE FCM
MA East Bridgewater Solar Energy Project
Unknown 1 2016 Solar PV ISO-NE FCM
MA Fisher Road Solar I Unknown 2 2018 Solar PV ISO-NE FCM
MA Harrington Street PV Project
Unknown 1 2016 Solar PV ISO-NE FCM
MA Holliston Unknown 0 2018 Solar PV ISO-NE FCM
Synapse Energy Economics, Inc. The RGGI Opportunity 24
State Plant Utility Nameplate Capacity
(MW)
First Year of
Operation
Fuel Type Prime Mover
Unit Type
MA Indian Orchard Photovoltaic Facility
Unknown 1 2018 Solar PV ISO-NE FCM
MA Indian Orchard Solar PV Unknown 1 2016 Solar PV ISO-NE FCM
MA Indian River Power Supply# LLC
Unknown 0 2018 Hydro HY ISO-NE FCM
MA Landcraft Unknown 1 2018 Solar PV ISO-NE FCM
MA LSRHS Unknown 0 2018 Solar PV ISO-NE FCM
MA MAT-2 (MATEP Combined Cycle)
Unknown 14 2017 Gas CC ISO-NE FCM
MA Medway Peaker – SEMARI
Unknown 195 2018 Gas GT ISO-NE FCM
MA N/A TerraForm Solar XVII 2 2015 Solar PV EIA 860
MA N/A TerraForm Solar XVII 3 2015 Solar PV EIA 860
MA NFM Solar Power, LLC Unknown 1 2016 Solar PV ISO-NE FCM
MA Northfield Mountain 1 Unknown 12 2016 Hydro PS ISO-NE FCM
MA Northfield Mountain 2 Unknown 12 2016 Hydro PS ISO-NE FCM
MA Northfield Mountain 3 Unknown 12 2016 Hydro PS ISO-NE FCM
MA Northfield Mountain 4 Unknown 12 2016 Hydro PS ISO-NE FCM
MA Plymouth Unknown 2 2018 Solar PV ISO-NE FCM
MA Salem Harbor NAES Salem Harbor 340 2017 Gas CC EIA 860
MA Salem Harbor NAES Salem Harbor 340 2017 Gas CC EIA 860
MA Silver Lake Photovoltaic Facility
Unknown 0 2018 Solar PV ISO-NE FCM
MA Southbridge Landfill Gas to Energy 17-18
Unknown 1 2017 Landfill Gas IC ISO-NE FCM
MA Southbridge Landfill Gas to Energy 17-18
Unknown 1 2018 Landfill Gas IC ISO-NE FCM

Synapse Energy Economics, Inc. The RGGI Opportunity 25
State Plant Utility Nameplate Capacity
(MW)
First Year of
Operation
Fuel Type Prime Mover
Unit Type
MA Treasure Valley- SE Unknown 2 2018 Solar PV ISO-NE FCM
MA Uxbridge Unknown 1 2018 Solar PV ISO-NE FCM
MA West Brookfield Solar Unknown 0 2016 Solar PV ISO-NE FCM
MA Westford Solar Unknown 2 2018 Solar PV ISO-NE FCM
MA WMA Chester Solar 1 Unknown 2 2018 Solar PV ISO-NE FCM
MD Baltimore Ravens Facility Baltimore Ravens 1 2015 Gas IC PJM Queue
MD CNE at Cambridge MD Constellation Solar Maryland 3 2015 Solar PV EIA 860
MD CPV St Charles Energy Center
CPV Maryland LLC 215 2017 Gas CT PJM, EIA 860
MD CPV St Charles Energy Center
CPV Maryland LLC 215 2017 Gas CT PJM, EIA 860
MD CPV St Charles Energy Center
CPV Maryland LLC 316 2017 Gas CA PJM, EIA 860
MD Keys Energy System Genesis Power 736 2018 Gas CC PJM Queue
MD Keys Energy System Genesis Power 65 2018 Gas GT PJM Queue
MD Mattawoman Energy Center
Mattawoman Energy, LLC 286 2018 Gas CC PJM, EIA 860
MD Mattawoman Energy Center
Mattawoman Energy, LLC 286 2018 Gas CC PJM, EIA 860
MD Mattawoman Energy Center
Mattawoman Energy, LLC 436 2018 Gas CC PJM, EIA 860
MD Perryman Constellation Power Source Generation
141 2015 Gas GT EIA 860
MD Rockfish Solar Rockfish Solar 10 2016 Solar PV EIA 860
MD Wildcat Point Generation Facility
Old Dominion Electric Coop 310 2017 Gas CT PJM, EIA 860
MD Wildcat Point Generation Facility
Old Dominion Electric Coop 310 2017 Gas CT PJM, EIA 860
MD Wildcat Point Generation Facility
Old Dominion Electric Coop 493 2017 Gas CA PJM, EIA 860

Synapse Energy Economics, Inc. The RGGI Opportunity 26
State Plant Utility Nameplate Capacity
(MW)
First Year of
Operation
Fuel Type Prime Mover
Unit Type
ME Saddleback Ridge Wind Unknown 6 2017 Wind WT ISO-NE FCM
NH Berlin Biopower Unknown 7 2017 Biomass ST ISO-NE FCM
NH Jericho Power Jericho Power 14 2015 Wind WT EIA 860
NY Berrians GT NRG Energy 200 2017 Gas CC NY Gold Book
NY Berrians GT II NRG Energy, Inc. 79 2017 Gas CC NY Gold Book
NY Berrians GT III NRG Energy, Inc. 279 2019 Gas CC NY Gold Book
NY CPV Valley Energy Center CPV Valley, LLC 820 2016 Gas CC NY Gold Book
NY Millbrook School SolarCity Corporation 1 2015 Solar PV EIA 860
NY Roaring Brook Wind PPM Roaring Brook, LLC / PPM 78 2015 Wind WT NY Gold Book
NY Taylor Biomass Taylor Biomass Energy Mont., LLC
21 2017 MSW Unk NY Gold Book
NY NY-Sun Initiative I None 1,500 2020 Solar PV NY SEP
NY NY-Sun Initiative I None 1,500 2023 Solar PV NY SEP
NY Wind-LSR I None 800 2024 Wind WT NYSERDA
NY Wind-LSR II None 800 2029 Wind WT NYSERDA
RI Central Power Plant State of Rhode Island 2 2015 Gas IC EIA 860
RI Johnston Solar Half Moon Ventures 1 2015 Solar PV EIA 860
RI Tiverton Power Unknown 11 2018 Gas GT ISO-NE FCM
Sources: 2014 Form EIA-860 data, schedule 3, 'Generator Data' (Proposed, under construction units); PJM Interconnection Queue, accessed November 2015; ISO-NE Forward Capacity Market obligations 2016-2019; 2015 NYISO Gold Book; NY 2015 State Energy Plan; 2015 NYSERDA Large-scale Renewables Report.
Synapse Energy Economics, Inc. The RGGI Opportunity 27
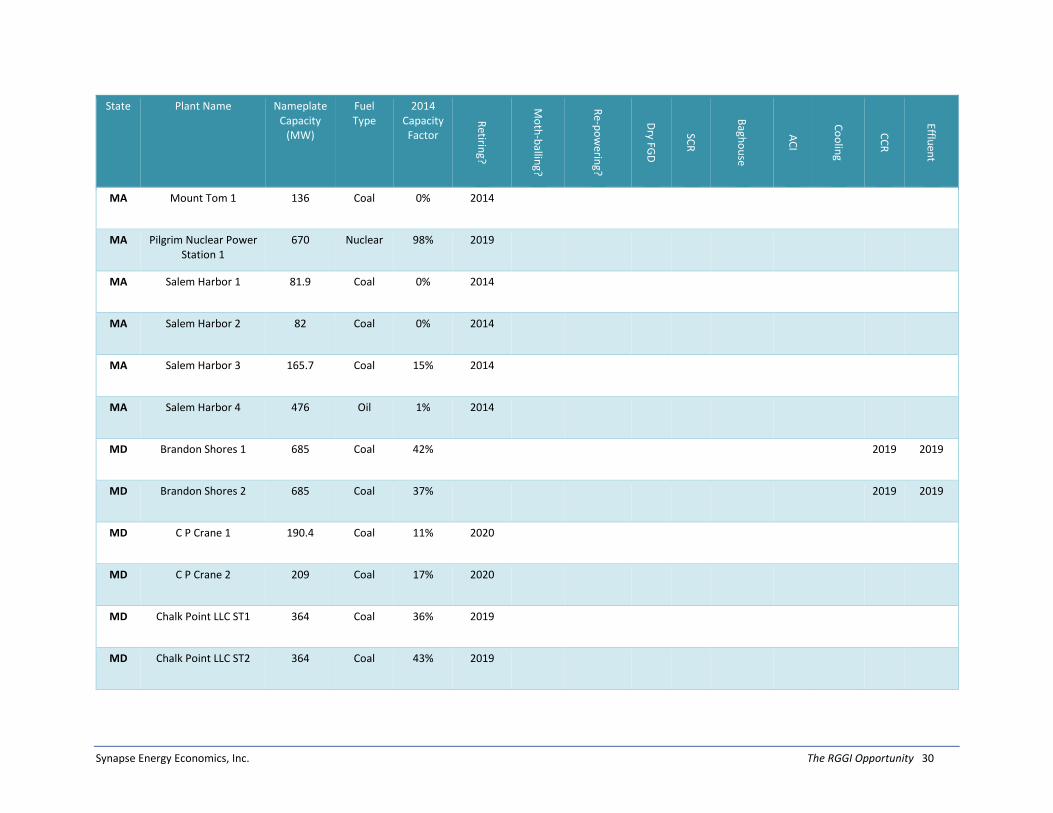
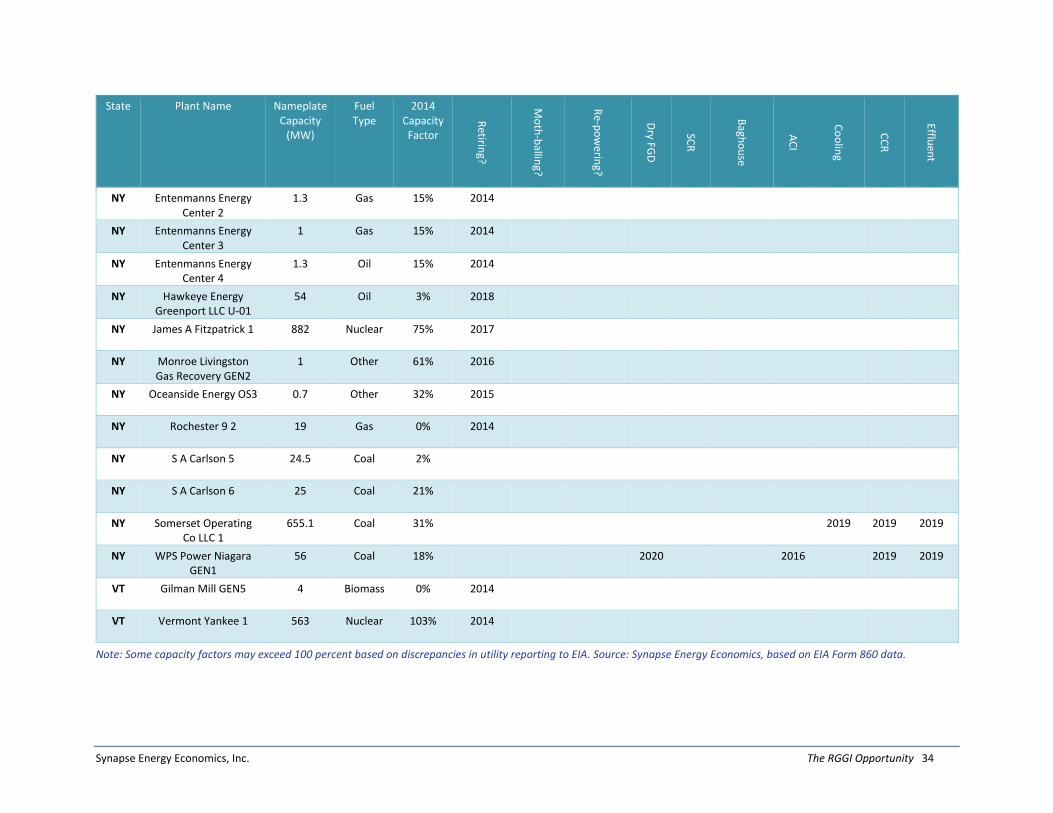
Unit retirements and environmental retrofits
Table 7 on the following pages lists all announced unit retirements for the nine RGGI states. Retirement
data is based on the 2014 edition of EIA’s Form 860, supplemented by ongoing Synapse research. This
table also indicates control technologies projected to be required at coal generators that will continue to
operate through the study period. The cost of control technologies that will be installed at coal plants
under existing federal environmental regulations other than the Clean Power Plan were estimated using
the Synapse Coal Asset Valuation Tool (CAVT) (see Table 8 on the following page).19 These expected new
retrofits are only added in years in which specific units have not yet been retired. Note that all
retirements and retrofits are assumed as inputs to both the baseline and the 40 percent reduction policy
scenario scenarios.
19
For more information, see also: Knight, P. and J. Daniel. 2015. “Forecasting Coal Unit Competitiveness – 2015 Update.”
Synapse Energy Economics. Available at: http://www.synapse-energy.com/sites/default/files/Forecasting-Coal-Unit-Competitiveness-14-021.pdf. CAVT is available at http://synapse-energy.com/tools/coal-asset-valuation-tool-cavt.

Synapse Energy Economics, Inc. The RGGI Opportunity 28
Table 7. RGGI states’ anticipated unit retirements.
State Plant Name Nameplate Capacity
(MW)
Fuel Type
2014 Capacity Factor
Retirin
g?
Mo
th-b
alling?
Re-p
ow
ering?
Dry FG
D
SCR
Bagh
ou
se
AC
I
Co
olin
g
CC
R
Effluen
t
CT Bridgeport Station 2 163 Coal 0% 2014
CT Bridgeport Station 3 400 Coal 24% 2019
CT Bridgeport Station 4 19 Oil 1% 2017
CT CJTS Energy Center UNIT1
0.2 Gas 23% 2014
CT CJTS Energy Center UNIT2
0 Gas 23% 2014
CT CJTS Energy Center UNIT3
0.2 Gas 23% 2014
CT CJTS Energy Center UNIT5
0 Gas 23% 2014
CT Covanta Wallingford Energy GEN1
11 Other 41% 2015
CT New Milford Gas Recovery GEN4
1 Other 50% 2015
CT South Norwalk Electric 6
1 Oil 0% 2014
CT Versailles Mill NO1 20 Gas 0% 2014

Synapse Energy Economics, Inc. The RGGI Opportunity 29
State Plant Name Nameplate Capacity
(MW)
Fuel Type
2014 Capacity Factor
Retirin
g?
Mo
th-b
alling?
Re-p
ow
ering?
Dry FG
D
SCR
Bagh
ou
se
AC
I
Co
olin
g
CC
R
Effluen
t
DE Indian River Generating Station 3
176.8 Coal 0% 2014
DE Indian River Generating Station 4
446 Coal 22% 2015 2019 2019
DE McKee Run 1 18.8 Gas 0% 2017
DE McKee Run 2 19 Gas 0% 2017
MA Brayton Point 1 241 Coal 30% 2017
MA Brayton Point 2 241 Coal 35% 2017
MA Brayton Point 3 642.6 Coal 22% 2017
MA Brayton Point 4 476 Gas 2% 2017
MA Harris Energy Realty ALBA
0.3 Hydro 0% 2015
MA Harris Energy Realty ALBD
1 Hydro 0% 2015
MA Harris Energy Realty NONO
0.5 Hydro 0% 2015
MA Mass Inst Tech Cntrl Utilities/Cogen Plt
CTG1
21 Gas 71% 2019
Synapse Energy Economics, Inc. The RGGI Opportunity 30
State Plant Name Nameplate Capacity
(MW)
Fuel Type
2014 Capacity Factor
Retirin
g?
Mo
th-b
alling?
Re-p
ow
ering?
Dry FG
D
SCR
Bagh
ou
se
AC
I
Co
olin
g
CC
R
Effluen
t
MA Mount Tom 1 136 Coal 0% 2014
MA Pilgrim Nuclear Power Station 1
670 Nuclear 98% 2019
MA Salem Harbor 1 81.9 Coal 0% 2014
MA Salem Harbor 2 82 Coal 0% 2014
MA Salem Harbor 3 165.7 Coal 15% 2014
MA Salem Harbor 4 476 Oil 1% 2014
MD Brandon Shores 1 685 Coal 42% 2019 2019
MD Brandon Shores 2 685 Coal 37% 2019 2019
MD C P Crane 1 190.4 Coal 11% 2020
MD C P Crane 2 209 Coal 17% 2020
MD Chalk Point LLC ST1 364 Coal 36% 2019
MD Chalk Point LLC ST2 364 Coal 43% 2019

Synapse Energy Economics, Inc. The RGGI Opportunity 31
State Plant Name Nameplate Capacity
(MW)
Fuel Type
2014 Capacity Factor
Retirin
g?
Mo
th-b
alling?
Re-p
ow
ering?
Dry FG
D
SCR
Bagh
ou
se
AC
I
Co
olin
g
CC
R
Effluen
t
MD Dickerson 2 196 Coal 23% 2019
MD Dickerson 3 196 Coal 23% 2019
MD Dickerson ST1 196 Coal 23% 2019
MD Goddard Steam Plant 1
6 Coal 19% 2014
MD Goddard Steam Plant 2
6.2 Coal 26% 2014
MD Herbert A Wagner 2 136 Coal 19% 2020
MD Herbert A Wagner 3 359 Coal 33% 2019 2019 2019
MD Morgantown Generating Plant ST1
626 Coal 55% 2019 2019 2019
MD Morgantown Generating Plant ST2
626 Coal 57% 2019 2019 2019
MD Riverside 4 72 Gas 0% 2016
MD Riverside GT6 135 Gas 0% 2014
ME Bar Harbor 2 2 Oil 0% 2014

Synapse Energy Economics, Inc. The RGGI Opportunity 32
State Plant Name Nameplate Capacity
(MW)
Fuel Type
2014 Capacity Factor
Retirin
g?
Mo
th-b
alling?
Re-p
ow
ering?
Dry FG
D
SCR
Bagh
ou
se
AC
I
Co
olin
g
CC
R
Effluen
t
ME Bar Harbor 4 2 Oil 0% 2014
ME Medway IC1 2 Oil 0% 2015
ME Medway IC2 2 Oil 0% 2015
ME Medway IC3 2 Oil 0% 2015
ME Medway IC4 2 Oil 0% 2015
NH Merrimack 1 114 Coal 34% 2019
NH Merrimack 2 345.6 Coal 27% 2019
NH Nashua Plant UNT1 2 Other 20% 2014
NH Schiller 4 50 Coal 22% 2019 2019
NH Schiller 5 50 Coal 71% 2019 2019
NH Schiller 6 50 Coal 21% 2019 2019
NY Al Turi 3010 1 Other 47% 2017

Synapse Energy Economics, Inc. The RGGI Opportunity 33
State Plant Name Nameplate Capacity
(MW)
Fuel Type
2014 Capacity Factor
Retirin
g?
Mo
th-b
alling?
Re-p
ow
ering?
Dry FG
D
SCR
Bagh
ou
se
AC
I
Co
olin
g
CC
R
Effluen
t
NY Auburn LFG Energy Facility 2
1.1 Other 35% 2014
NY C R Huntley Generating Station 67
200 Coal 29% 2016
NY C R Huntley Generating Station
S68
200 Coal 40% 2016
NY Cayuga Operating Company 1
155 Coal 30% 2019 2019 2019
NY Cayuga Operating Company 2
167.2 Coal 35% 2018 2018
NY Danskammer Generating Station 3
147 Coal 0% 2014
NY Danskammer Generating Station 4
239.4 Coal 0% 2014
NY Dunkirk Generating Plant 1
96 Coal 0% 2020 2016 2019 2019 2019
NY Dunkirk Generating Plant 2
96 Coal 44% 2015
NY Dunkirk Generating Plant 3
218 Coal 0% 2015
NY Dunkirk Generating Plant ST4
217.6 Coal 0% 2015
NY Entenmanns Energy Center 1
1 Gas 15% 2014
Synapse Energy Economics, Inc. The RGGI Opportunity 34
State Plant Name Nameplate Capacity
(MW)
Fuel Type
2014 Capacity Factor
Retirin
g?
Mo
th-b
alling?
Re-p
ow
ering?
Dry FG
D
SCR
Bagh
ou
se
AC
I
Co
olin
g
CC
R
Effluen
t
NY Entenmanns Energy Center 2
1.3 Gas 15% 2014
NY Entenmanns Energy Center 3
1 Gas 15% 2014
NY Entenmanns Energy Center 4
1.3 Oil 15% 2014
NY Hawkeye Energy Greenport LLC U-01
54 Oil 3% 2018
NY James A Fitzpatrick 1 882 Nuclear 75% 2017
NY Monroe Livingston Gas Recovery GEN2
1 Other 61% 2016
NY Oceanside Energy OS3 0.7 Other 32% 2015
NY Rochester 9 2 19 Gas 0% 2014
NY S A Carlson 5 24.5 Coal 2%
NY S A Carlson 6 25 Coal 21%
NY Somerset Operating Co LLC 1
655.1 Coal 31% 2019 2019 2019
NY WPS Power Niagara GEN1
56 Coal 18% 2020 2016 2019 2019
VT Gilman Mill GEN5 4 Biomass 0% 2014
VT Vermont Yankee 1 563 Nuclear 103% 2014
Note: Some capacity factors may exceed 100 percent based on discrepancies in utility reporting to EIA. Source: Synapse Energy Economics, based on EIA Form 860 data.

Synapse Energy Economics, Inc. The RGGI Opportunity 35
APPENDIX C: THE RGGI 40 PERCENT EMISSION REDUCTION POLICY
SCENARIO
To design a policy scenario that would achieve 2030 all-sector energy-related CO2 emissions that are 40
percent lower than 1990 levels, Synapse examined a discrete set of emission reduction measures for
which previous research has demonstrated a potential for significant emission reduction and are known
to be among the most cost-effective strategies for achieving remission reductions . For each measure,
Synapse estimated its net costs per ton of CO2 reduction in 2030 and its potential for emission
reductions in tons in 2030. From these measures were chosen—in order of cost—just enough to achieve
the target emission reductions.
After accounting for expected emission reductions in the transportation sector, ReEDS was programmed
to achieve the remaining reductions in the electric sector by (1) setting new, more stringent (lower)
RGGI caps, and (2) setting minimum additions (with respect to 2015) of onshore wind and utility PV that
ReEDS must build within the RGGI states. This second constraint—together with the limitation in both
scenarios that RGGI states may only trade emissions allowances within their group—avoids leakage of
emissions out of RGGI region. Note that these two constraints, taken together, interact in the same way
that current day RGGI caps work together with state RPS and EERS policies to achieve emission
reductions.
Building and industrial sector emissions, and all assumptions not mentioned here, are the same in both
scenarios.
Shift measures
To determine the lowest-cost emission reduction to achieve the incremental 87 million short tons of
reductions needed beyond the RGGI baseline, Synapse used a supply—or “marginal abatement”—curve
methodology. A supply curve analysis sets out potential emission reduction measures—or “shifts”—in
order according to each measure’s cost-per-ton of avoided CO2. Shift measures are then selected for
inclusion in the 40 percent reduction policy scenario in order of their costs, from least to most
expensive, until their potential emission reductions are sufficient to meet the target. The per-ton cost of
each shift measure includes both the costs of achieving the new measure and the costs avoided by not
taking the same actions as in the RGGI baseline. (For example, the cost of a shift to electric vehicles is
offset by savings from gasoline not purchased.) The per-ton costs of each shift also include a value of
avoided climate damages equal to the federal social cost of carbon: $51 per short ton in 2030.20
20
U.S. EPA. 2015. “Technical Support Documents: Technical Update of the Social Cost of Carbon for Regulatory Impact Analysis
Under Executive Order 12866.” Revised July 2015 by the Interagency Working Group on Social Cost of Carbon. Available at https://www.whitehouse.gov/sites/default/files/omb/inforeg/scc-tsd-final-july-2015.pdf.

Synapse Energy Economics, Inc. The RGGI Opportunity 36
Synapse researched five potential shift measures for use in this analysis, and ultimately brought four of
these measures into our supply curve:
Electric vehicles: By 2030, 35 percent of existing light-duty vehicle trips under 100 miles are assumed to be replaced with trips taken in plug-in battery electric vehicles.21
Emissions are reduced by avoiding gasoline consumption. Electric vehicles are assumed to be powered by additions of new utility photovoltaic (PV) generation; for each new kWh shifted from the transportation sector to the electric sector, an incremental kWh of utility PV generation is also added. One-hundred percent of this shift’s emission reduction potential was applied to the 40 percent emissions reduction policy scenario, providing 28 million short tons of emission reductions. This shift follows Scenario 8 from the Federal Highway Administration’s EV project and includes an assumed 80 percent of charging occurring at home and gas tax revenues remaining unaffected.22 For
comparison, a recent Georgetown University study of potential electric vehicle adoption in 12 Northeast states found transportation emission reductions of 29-40 percent by 2030 and consumer savings of $3.6-18 billion over 15 years.23
Costs: Incremental electricity consumption at the AEO 2015 wholesale price of energy,24 state-level subsidies associated with direct incentives for electric
vehicles at the level of current RGGI states are phased out by 2020, state-level subsidies associated with spurring public charging stations at the level of current RGGI states are continued through 2030 25
Avoided Costs: Gasoline purchases,26 social cost of carbon27
Energy efficiency: Electric savings in MWh from energy efficiency programs and measures reduce emissions by making the same amount of MWh of fossil fuel-fired generation unnecessary. Energy efficiency savings in the 40 percent emission reduction policy scenario are assumed to be equal to each RGGI state achieving the savings
21
This shift measure does not include potential emission reductions as a result of plug-in hybrid vehicles or other
types of plug-in vehicles. 22
U.S. Federal Highway Administration. 2015. “Feasibility and Implications of Electric Vehicle (EV) Deployment and
Infrastructure Development.” Available at: http://www.fhwa.dot.gov/environment/climate_change/mitigation/publications_and_tools/ev_deployment/es.cfm.
23 Pacyniak, G., K. Zyla, V. Arroyo, M. Goetz, C. Porter, and D. Jackson. 2015. “Reducing Greenhouse Gas Emissions from
Transportation: Opportunities in the Northeast and Mid-Atlantic.” Georgetown Climate Center with Cambridge Systematics. Available at: http://www.georgetownclimate.org/five-northeast-states-and-dc-announce-they-will-work-together-to-develop-potential-market-based-poli.
24 AEO 2015. Tables 3.1, 3.2, and 3.5. Available at: http://www.eia.gov/forecasts/aeo/.
25 Additional information on current EV subsidies is available from the International Council on Clean Transporation at
http://www.theicct.org/sites/default/files/publications/SupportEVsUScities_201510.pdf. 26
AEO 2015. Tables 3.1, 3.2, and 3.5. Available at: http://www.eia.gov/forecasts/aeo/. 27
“Technical Support Documents: Technical Update of the Social Cost of Carbon for Regulatory Impact Analysis Under
Executive Order 12866.” Revised July 2015. Interagency Working Group on Social Cost of Carbon, United States Government. Available at https://www.whitehouse.gov/sites/default/files/omb/inforeg/scc-tsd-final-july-2015.pdf.

Synapse Energy Economics, Inc. The RGGI Opportunity 37
assumed for Massachusetts in the RGGI baseline,28 or a region-wide average of 3
percent annual incremental savings by 2030. Emissions are assumed to be avoided at the emission rate of the marginal generator. One-hundred percent of this shift’s emission reduction potential (or 36 TWh by 2030) was applied to the 40 percent emission reduction policy scenario, providing an estimated 17 million short tons of emission reductions.
Costs: Utility-side energy efficiency program costs (including costs covering administration, marketing, incentives, and other utility-side costs)29
Avoided Costs: Social cost of carbon, avoided capacity, transmission, and distribution per AESC 201530
Onshore wind: Electric generation from economically achievable onshore wind displaces generation from existing fossil resources. Emissions are assumed to be avoided at the emission rate of the marginal generator. One-hundred percent of this shift’s emission reduction potential (or 60 TWh) was applied to the 40 percent emission reduction policy scenario, providing an estimated 27 million short tons of emission reductions. This shift is based on costs and generation potential included in NREL’s July 2015 study “Estimating Renewable Energy Economic Potential in the United States: Methodology and Initial Results.”31
Costs: Levelized production cost of onshore wind generation
Avoided Costs: Social cost of carbon; avoided energy, capacity, transmission, and distribution per AESC 2015
Utility-scale PV: Electric generation from economically achievable utility-scale PV units displaces generation from existing fossil resources. Emissions are assumed to be avoided at the emission rate of the marginal generator. Less than 3 percent of this shift’s emission reduction potential (or 34 TWh) was applied to the 40 percent emission reduction policy scenario, providing an estimated 15 million short tons of emission reductions. An additional 1.3 percent (or 18 TWh) of utility-scale PV potential was included in the 40 percent emission reduction policy scenario to support new demand for electricity to power electric vehicles. This shift is based on costs and generation potential included in NREL’s July 2015 study “Estimating Renewable Energy Economic Potential in the United States: Methodology and Initial Results.”
28
MassSave. 2015. “2016-2020 Massachusetts Joint Statewide Three-Year Electric and Gas Energy Efficiency Plan.”
Massachusetts Energy Efficiency Advisory Council. Available at http://ma-eeac.org/wordpress/wp-content/uploads/Exhibit-1-Gas-and-Electric-PAs-Plan-2016-2018-with-App-except-App-U.pdf.
29 Program costs are $0.40 per kilowatt-hour based on the average program cost for RGGI states historically.
30 Hornby, R. et al. 2015. “Avoided Energy Supply Costs in New England: 2015 Report - Revised.” Avoided Energy Supply
Component Study Group. Available at: http://www.ct.gov/deep/lib/deep/energy/aescinnewengland2015.pdf. 31
Brown A. et al. 2015. “Estimating Renewable Energy Economic Potential in the United States: Methodology and Initial
Results.” National Renewable Energy Laboratory (NREL). Available at: http://www.nrel.gov/docs/fy15osti/64503.pdf.
Synapse Energy Economics, Inc. The RGGI Opportunity 38
Costs: Levelized production cost of utility-scale solar generation
Avoided Costs: Social cost of carbon; avoided energy, capacity, transmission, and distribution per AESC 2015
Increased long-distance rail usage: By 2030, 14.4 million miles of long-distance light-duty vehicle trips have the potential to be replaced by trips taken on Amtrak’s Northeast Corridor. This shift’s cost was several orders of magnitude higher than the other potential shifts and was not included in the supply curve analysis. This shift is based on Alternative I in the November 2015 “NEC Futures” report.32
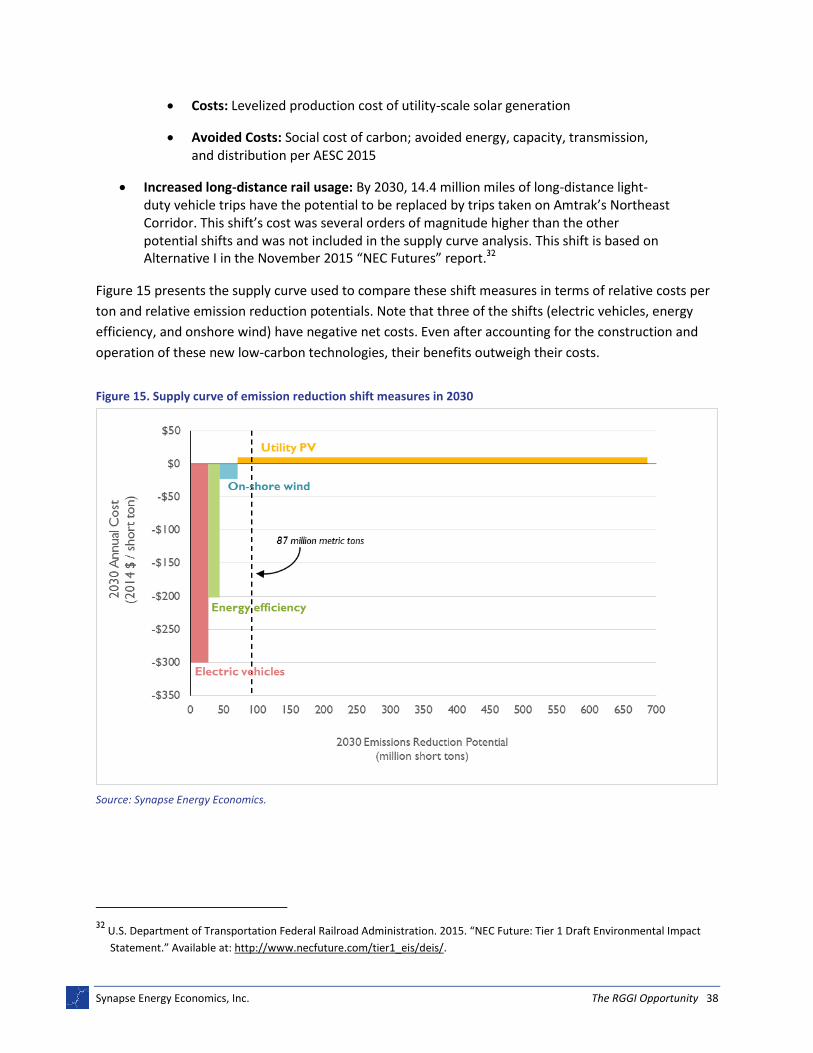
Figure 15 presents the supply curve used to compare these shift measures in terms of relative costs per
ton and relative emission reduction potentials. Note that three of the shifts (electric vehicles, energy
efficiency, and onshore wind) have negative net costs. Even after accounting for the construction and
operation of these new low-carbon technologies, their benefits outweigh their costs.
Figure 15. Supply curve of emission reduction shift measures in 2030
Source: Synapse Energy Economics.
32
U.S. Department of Transportation Federal Railroad Administration. 2015. “NEC Future: Tier 1 Draft Environmental Impact
Statement.” Available at: http://www.necfuture.com/tier1_eis/deis/.
Synapse Energy Economics, Inc. The RGGI Opportunity 39
Changes to ReEDS assumptions
ReEDS modeling of the 40 percent emission reduction policy scenario begins with the RGGI baseline
scenario in ReEDS and makes just a few changes to it in order to achieve the emission reduction goal.
Note that ReEDS’ build out of new renewables and emission impacts differs from that presented in the
supply curve analysis. The supply curve analysis is a rough approximation. The ReEDS analysis is more
complex and detailed, considering economic dispatch of electric generators and interaction among state
both within and outside of the RGGI region.
ReEDS modeling inputs to the 40 percent emission reduction policy scenario are identical to the RGGI
baseline scenario with three exceptions:
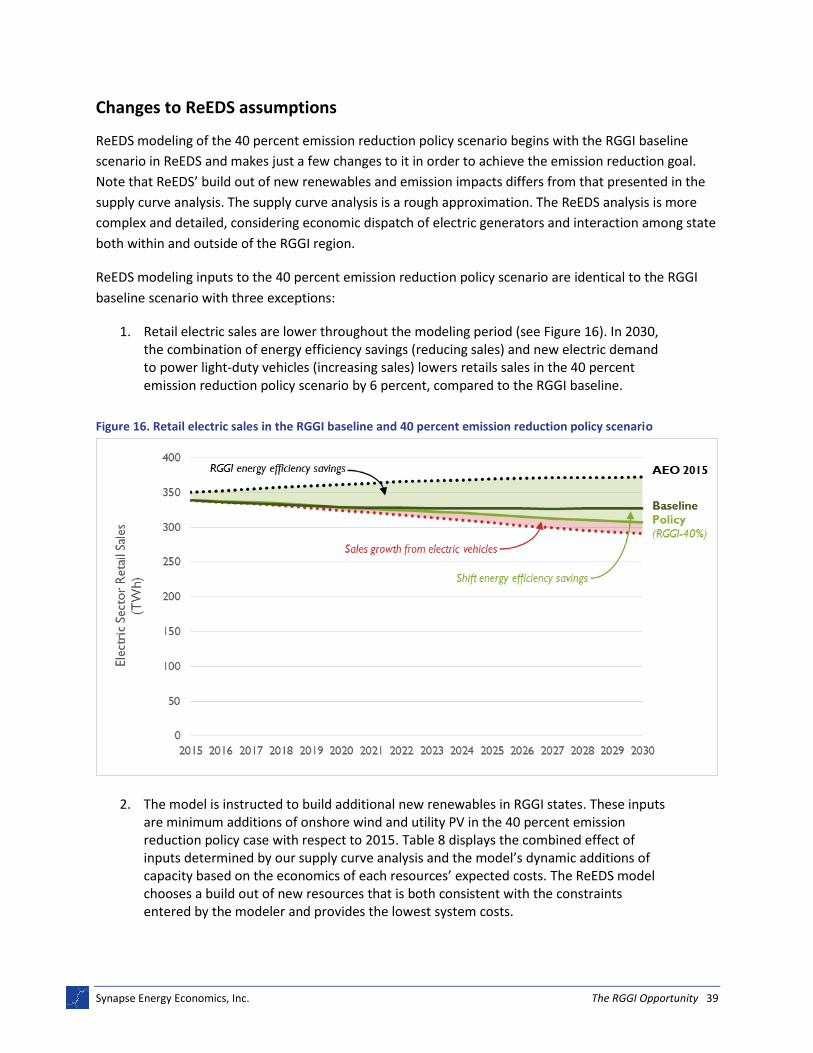
1. Retail electric sales are lower throughout the modeling period (see Figure 16). In 2030, the combination of energy efficiency savings (reducing sales) and new electric demand to power light-duty vehicles (increasing sales) lowers retails sales in the 40 percent emission reduction policy scenario by 6 percent, compared to the RGGI baseline.
Figure 16. Retail electric sales in the RGGI baseline and 40 percent emission reduction policy scenario
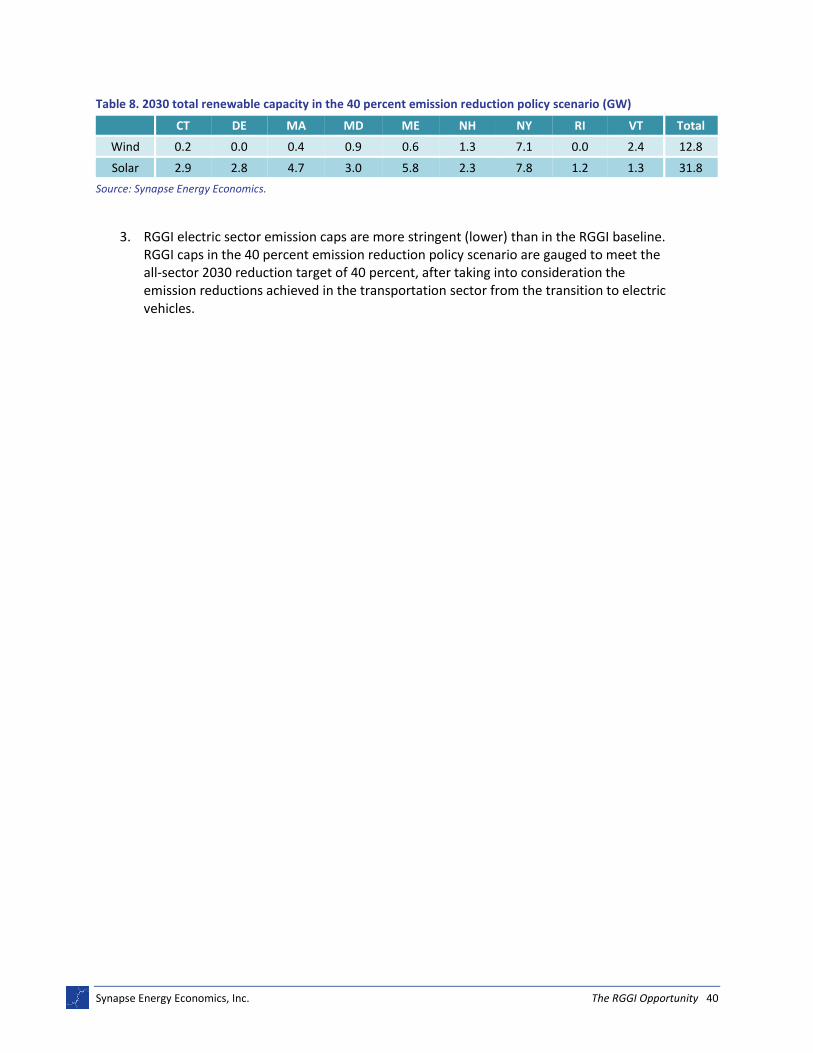
2. The model is instructed to build additional new renewables in RGGI states. These inputs are minimum additions of onshore wind and utility PV in the 40 percent emission reduction policy case with respect to 2015. Table 8 displays the combined effect of inputs determined by our supply curve analysis and the model’s dynamic additions of capacity based on the economics of each resources’ expected costs. The ReEDS model chooses a build out of new resources that is both consistent with the constraints entered by the modeler and provides the lowest system costs.
Synapse Energy Economics, Inc. The RGGI Opportunity 40
Table 8. 2030 total renewable capacity in the 40 percent emission reduction policy scenario (GW)
CT DE MA MD ME NH NY RI VT Total
Wind 0.2 0.0 0.4 0.9 0.6 1.3 7.1 0.0 2.4 12.8
Solar 2.9 2.8 4.7 3.0 5.8 2.3 7.8 1.2 1.3 31.8
Source: Synapse Energy Economics.
3. RGGI electric sector emission caps are more stringent (lower) than in the RGGI baseline. RGGI caps in the 40 percent emission reduction policy scenario are gauged to meet the all-sector 2030 reduction target of 40 percent, after taking into consideration the emission reductions achieved in the transportation sector from the transition to electric vehicles.
Synapse Energy Economics, Inc. The RGGI Opportunity 41
APPENDIX D: ECONOMIC AND EMPLOYMENT MODEL
We estimated the job impacts using IMPLAN for each RGGI state and the region as a whole.33 For each
state, this modeling captures the impacts from spending in state and on the rest of the region. The
assumed spending in each RGGI state comes from following activities:
Construction of generating resources, transmission, energy efficiency installations, and new
electric vehicle charging infrastructure
Operations of energy resources
Avoided gas station activity displaced by electric vehicles
Consumer and business re-spending of electricity and transportation cost savings
For the electric sector, we developed customized inputs for the IMPLAN model relying in part on NREL’s
JEDI model.34 For each resource, we estimated the portion of the investment spent on materials versus
labor. Impacts from household spending and gas stations were more straightforward since these
industries directly correspond to IMPLAN sectors. The analysis results in impacts of the following types:
Direct impacts include jobs for contractors, construction workers, plant operators and
automobile manufacturers. We developed these estimates using the amount of investment, the
share of that investment spent on labor for each resource, and industry‐specific wages.
Indirect impacts include jobs that support the direct activities. For instance, an investment in a
new wind farm not only creates jobs at the wind farm, but also down the supply chain,
increasing jobs for turbine and other component manufacturers. We adjusted the IMPLAN
model’s base resource spending allocation assumptions for the entire electric industry based on
NREL data on requirements for each individual resource.
Induced impacts result from employees in newly created direct and indirect jobs spending their
paychecks locally on restaurants, car repairs, and countless other consumer goods and services.
Induced impacts also come from customer savings on energy spending, which are spent on the
same broad range of goods and services.
33
IMPLAN is a commercial model developed by IMPLAN Group PLC. Information on IMPLAN is available at: http://implan.com/ 34
NREL. Jobs and Economic Development Impact (JEDI) Models. Last accessed December 16, 2015. Available at:
http://www.nrel.gov/analysis/jedi/about_jedi.html.

Synapse Energy Economics, Inc. The RGGI Opportunity 42
APPENDIX E: STATE EMISSION REDUCTION TARGETS
Table 9. State greenhouse gas emission reduction targets with citations, 2030 and 2050
State 2030 Target
2050 Target
Sources
Connecticut 35-45% below 1990
80% below 2001
2030: Conf. of New England Govs. Resolution 39-1
2050: C.G.S. 22a-200a (enacted by H.B. 5600) (https://www.cga.ct.gov/2008/ACT/PA/2008PA-00098-R00HB-05600-PA.htm)
Delaware 30% below 2008*
No target *Recommended target. See Climate Framework for Delaware (Dec. 31, 2014) (http://www.dnrec.delaware.gov/energy/Documents/The%20Climate%20Framework%20for%20Delaware.pdf)
Maine 35-45% below 1990
75-80% below 2003
2030: Conf. of New England Govs. Resolution 39-1
“Long-term” target; date not specified: Maine Rev. Stat. ch. 3-A § 576(3) (enacted by PC 2003, C. 237) (http://legislature.maine.gov/statutes/38/title38sec576.html).
Maryland 40% below 2006
Up to 90% below 2006
2030: Recommendation of the Maryland Commission on Climate Change (Oct. 29, 2015)
2050: Md. Env. Code § 2-1201 (2009) (http://law.justia.com/codes/maryland/2013/article-gen/section-2-1201/)
Massachusetts 35-45% below 1990
80% below 1990
2030: Conf. of New England Govs. Resolution 39-1
2050: Mass.Gen.L. ch. 21N § 3(b) (https://malegislature.gov/Laws/GeneralLaws/PartI/TitleII/Chapter21N/Section3)
New Hampshire 35-45% below 1990
80% below 1990
2030: Conf. of New England Govs. Resolution 39-1
2050: 2009 New Hampshire Climate Action Plan (http://des.nh.gov/organization/divisions/air/tsb/tps/climate/action_plan/documents/nhcap_final.pdf)
New York 40% below 1990b
80% below 1990
2030: 2015 New York State Energy Plan (http://energyplan.ny.gov/Plans/2015). “Energy Sector” only—excludes agriculture
2050: Executive Order No. 24 (2009) (http://www.dec.ny.gov/energy/71394.html)
Rhode Island 35-45% below 1990
80% below 1990
2030: Conf. of New England Govs. Resolution 39-1
2050: Resilient Rhode Island Act of 2014, Sec. 42-6.2-2 (http://webserver.rilin.state.ri.us/Statutes/TITLE42/42-6.2/42-6.2-2.HTM)
Vermont
35-45% below 1990
75% below 1990
2030: Conf. of New England Govs. Resolution 39-1
2050: 10 V.S.A. § 578 (enacted by S. 259) (http://www.leg.state.vt.us/docs/legdoc.cfm?URL=/docs/2006/acts/ACT168.HTM)
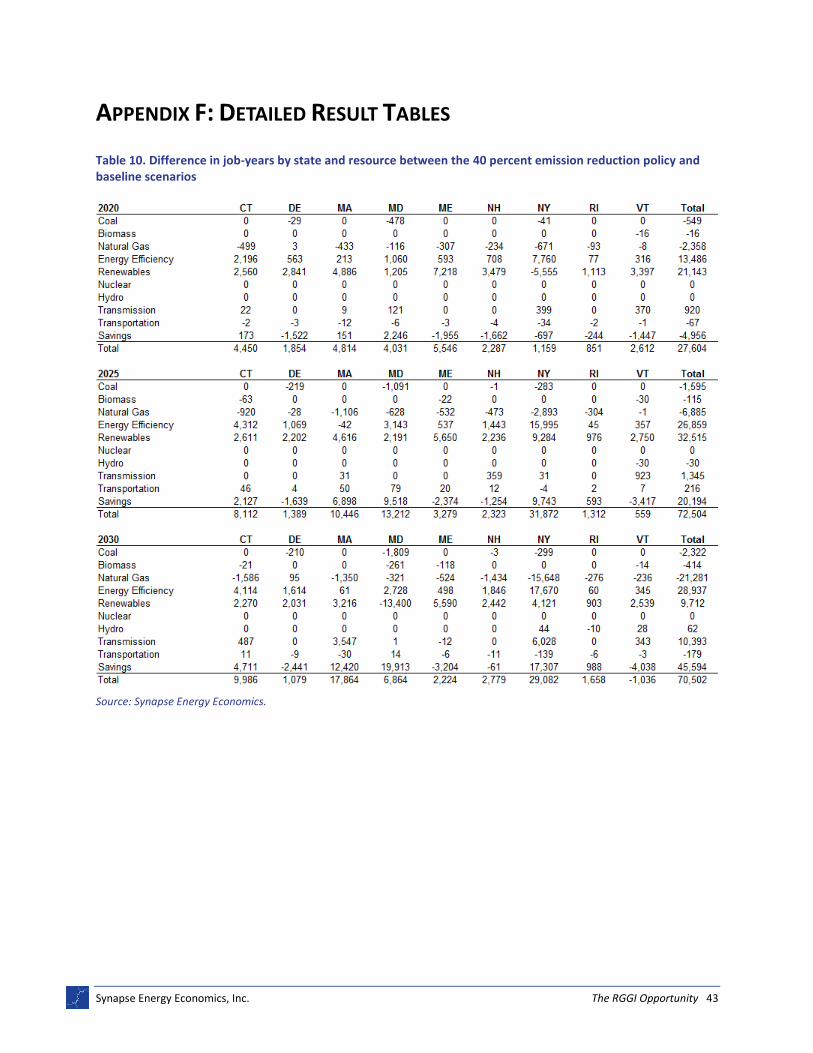
Synapse Energy Economics, Inc. The RGGI Opportunity 43
APPENDIX F: DETAILED RESULT TABLES
Table 10. Difference in job-years by state and resource between the 40 percent emission reduction policy and baseline scenarios
Source: Synapse Energy Economics.
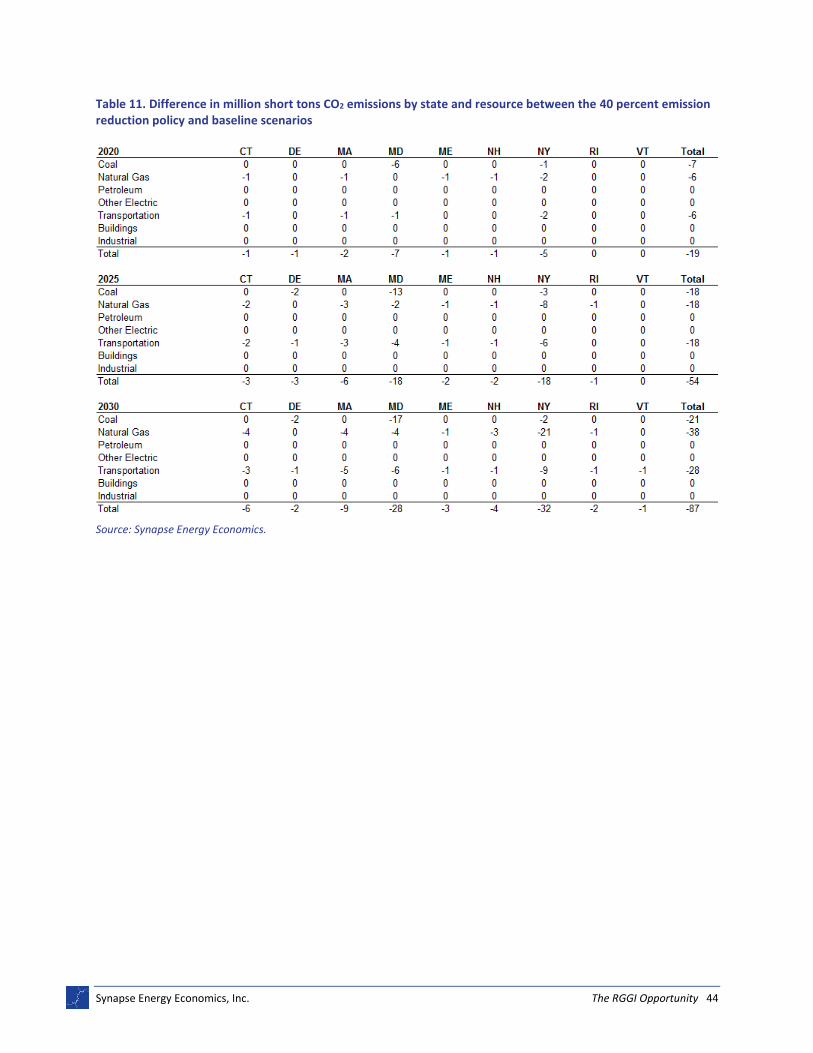
Synapse Energy Economics, Inc. The RGGI Opportunity 44
Table 11. Difference in million short tons CO2 emissions by state and resource between the 40 percent emission reduction policy and baseline scenarios
Source: Synapse Energy Economics.
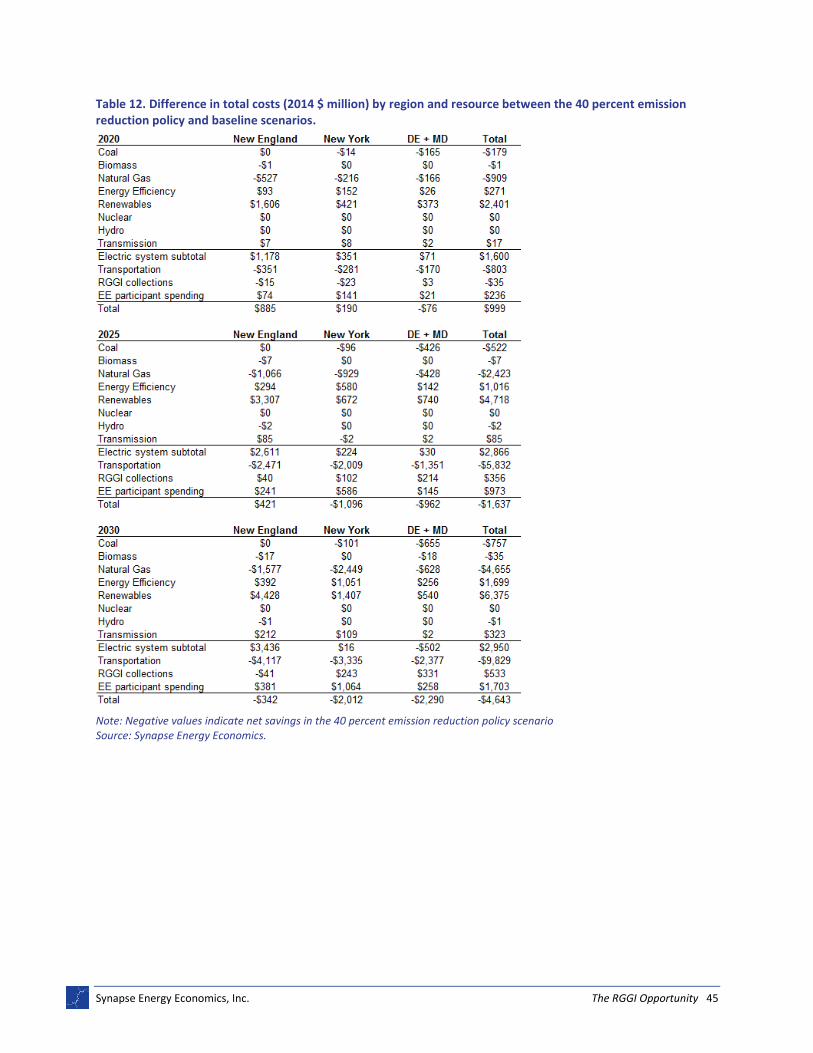
Synapse Energy Economics, Inc. The RGGI Opportunity 45
Table 12. Difference in total costs (2014 $ million) by region and resource between the 40 percent emission reduction policy and baseline scenarios.
Note: Negative values indicate net savings in the 40 percent emission reduction policy scenario Source: Synapse Energy Economics.

Synapse Energy Economics, Inc. The RGGI Opportunity 46
Table 13. Total electric generating capacity in gigawatts by state and resource in the 40 percent emission reduction policy scenario
Source: Synapse Energy Economics.