Embed Size (px)
Citation preview

1
Reform of Product Market
Regulation in OECD
Countries, 1998-2008
Anita Wölfl
OECD-Economics Department
OECD-BRE Workshop on Indicators of Regulatory
Management Systems,
London, 3 April 2009

2
A reminder: PMR - What is it all about?
Basic idea
– Turn qualitative data on laws and regulations that inhibit competition into
quantitative indicators.
Bottom-up approach based on regulatory data
– Data derived from a survey of member countries (and external data sets)
– Policy focused – i.e., not based on opinion surveys or market outcomes
Main uses
– Benchmarking to allow comparison across countries
– Diagnostic tool for specific policy advice
– Empirical analysis of the competition-performance link Used in Going for Growth context, country surveys and specific OECD projects, as well as in the PMR project of the World Bank Indicators available on line for government agencies and academics at www.oecd.org/eco/pmr

3
The PMR indicator system
The indicators of Product Market Regulation (PMR):
– Economy wide
– Rich coverage of regulatory data, limited time dimension
The indicators of Non-Manufacturing Regulation (NMR):
– Cover several non-manufacturing sectors:
• ETCR: several network industries (Energy, Transport,
Communication),
• Retail Trade, Professional Services
– More limited regulatory coverage, but long time series (ETCR)
The indicators of Regulation Impact (RI)
– Derived from NMR indicators and Input-Output-Analysis
– Time series driven by ETCR
– Used for impact analysis

4
The “integrated” PMR indicator on which the presented analysis is based
Scope of public
enterprise
(0.33)
Direct control
over business
enterprises
(0.33)
Licenses and
permits system
(0.50)
Communication
and
simplification
of rules and
procedures
(0.50)
Sector-specific
administrative
burdens
(0.33)
Legal barriers
(0.25)
Antitrust
exemptions
(0.25)
Discriminatory
procedures
(0.33)
Regulatory
barriers
(1.0)
Gov’t involvement
in network sectors
(0.33)
Barriers in
network sectors
(0.25)
Barriers in
services
(0.25)
Barriers to FDI
(0.33)
Product market regulation
Tariffs
(0.33)
Admin. burdens
for corporations
(0.33)
Admin. burdens
for sole
proprietor firms
(0.33)
Price
controls
(0.50)
Use of
command
and control
regulation
(0.50)
State control
(0.33)
Other
barriers
(0.50)
Explicit barriers
to trade and
investment
(0.50)
Barriers to
competition
(0.33)
Regulatory and
administrative
opacity
(0.33)
Involvement
in business
operations
(0.50)
Public
ownership
(0.50)
Barriers to trade and
investment (0.33)
Barriers to entrepreneurship
(0.33)
Administrative
burdens on
start-ups
(0.33)

5
Product market regulation beginning of 2008 … Index scale of 0-6 from least to most restrictive

6
... the result of substantial reforms since 1998 Index scale of 0-6 from least to most restrictive
0.0
0.5
1.0
1.5
2.0
2.5
3.0
3.5
4.0
4.5U
nited
Sta
tes
Un
ited
Kin
gdom
Can
ad
a
Neth
erl
ands
Icela
nd
Den
mark
Sp
ain
Jap
an
No
rway
Fin
land
Austr
alia
New
Zeala
nd
Sw
itzerl
an
d
Hun
gary
Sw
ed
en
Germ
an
y
Austr
ia
Italy
Belg
ium
Po
rtug
al
Fra
nce
Ko
rea
Luxem
bo
urg
Czech
Rep
ublic
Mexic
o
Turk
ey
Po
lan
d
1998 2003 2008

7
But: slowing pace of reform and convergence Level and change in index points, with 0=least and 6=most restrictive
Panel A. 1998-2003 Panel B. 2003-2008
AUS
AUTBEL
CAN
CZE
DNK
FIN FRA
GER
HUN
ICE
ITAJAP
KOR
MEX
NLDNZL
NOR
PRT
ESP
SWE
CHE TUR
GBRUSA
-1.20
-1.00
-0.80
-0.60
-0.40
-0.20
0.00
0.20
0.40
0.60
0.00 0.50 1.00 1.50 2.00 2.50 3.00 3.50
2003-1998 …
1998 values
Correlation coefficient: -0.84
AUS
AUT
BEL
CAN
CZE
DNKFIN
FRAGER
HUN
ICE
ITA
JAP KOR
MEX
NLD
NZL
NOR
POL
PRT
ESP
SWE
CHE
TUR
GBR
USA
-1.20
-1.00
-0.80
-0.60
-0.40
-0.20
0.00
0.20
0.40
0.60
0.00 0.50 1.00 1.50 2.00 2.50 3.00 3.50
2008-2003 …
2003 values
Correlation coefficient: -0.62

8
Strong reform in certain regulatory areas Average change in index points, 0=least and 6=most restrictive
-1.4
-1.2
-1.0
-0.8
-0.6
-0.4
-0.2
0.0
0.2
Average change 98-03 Average change 03-08
Barriers to entrepreneurship
Barriers to trade and
investmentState control

9
… driven by reform in different sectors Average change in index points, 0=least and 6=most restrictive
-1.8
-1.6
-1.4
-1.2
-1.0
-0.8
-0.6
-0.4
-0.2
0.0
0.2
Ele
ctri
city
Gas
Po
st
Tele
com
Rai
l
Ro
ad
Air
line
s
Pro
f. s
erv
ice
s
Re
tail
trad
e
Average change 98-03 Average change 03-08

10
Some signs of reform complementarities Index scale of 0-6 from least to most restrictive
Aus
AutBel
Can
Cze
Dnk
Fin
Fra
Ger
Hun
Isl
Ita
Jpn
Kor
MexNld
Nzl
Nor
Pol
Prt
Esp
Swe
Che
Tur
Gbr
Usa
-0.1
-0.1
-0.1
-0.1
0.0
0.0
0.0
6 8 10 12 14 16C
han
ge in
PM
R '9
8-'08, r
ela
tive
to n
um
ber o
f re
form
s
Number of regulatory areas with reforms
Correlation coefficient: -0.59***

11
Scope for future reform in state control … Distance from best practice,
Index scale of 0-6 from least to most restrictive
0.0
0.5
1.0
1.5
2.0
2.5
3.0
3.5
4.0
4.5
Mean across countries
Variance across
countries
State control Barrier to entrepreneurship Barrier to trade and investment

12
… and barriers to retail trade and prof. services
Distance from best practice,
Index scale of 0-6 from least to most restrictive
0.0
0.5
1.0
1.5
2.0
2.5
3.0
3.5
4.0
4.5
Mean across countries
Variance across
countries

13
The 2008 round of PMR indicator revision
A. Revised questionnaire
– to better reflect ongoing competition issues.
B. Improved data collection and processing
– to facilitate future updates,
– to reduce uncertainty in the data,
– to facilitate extension to new member countries later on.
C. Integration of existing indicators
– PMR, NMR, FDI-regulatory restrictiveness index (OECD-DAF)),
– to make existing indicator more policy-relevant.
D. Revise underlying methodology (in particular weights)
– Maintaining & enhancing comparability over time & across countries,
– ensuring robustness of indicator results.

14
Integrating information on sectoral regulation Average change in index points, 0=least and 6=most restrictive
-1.0
-0.8
-0.6
-0.4
-0.2
0.0
0.2
0.4
0.6
0.8
1.0
1998 2003 2008 1998 2003 2008 1998 2003 2008 1998 2003 2008
State control
Barriers to enterpreneurship
Barriers to trade & investment Overall PMR
Average changeacross countries
Cross-country
dispersion

15
Reconsidering the weights
Reasons:
– Currently based on old data and old indicator structure
=> no longer viable
– Caveats of PCA: Problematic updating, sensitive to new data (countries &
years), sensitive to tree structure.
Analysis (JRC):
– Sensitivity analysis of the indicator values and related inferences to
changes in :
• weights (move from PCA to Equal Weights), linked with …
• … indicator and country coverage,
• normalization
• aggregation methods (e.g. compensatory vs. non-compensatory).
– Contribution analysis
• contribution of individual indicators to the overall country ranking,
• to identify policy priorities and potential areas for more frequent
updates.

16
Moving from PCA to Equal weights Average change in index points, 0=least and 6=most restrictive
-1.0
-0.8
-0.6
-0.4
-0.2
0.0
0.2
0.4
0.6
0.8
1.0
1998 2003 2008 1998 2003 2008 1998 2003 2008 1998 2003 2008
State control
Barriers to enterpreneurship
Barriers to trade & investment Overall PMR
Average change
across countries
Cross-country
dispersion

17
Outlook – further improvements
Extension of the indicator – new generation PMR
– To cover evolving regulatory issues:
• Regulatory quality – sector regulators
• Governance of state-owned enterprises
• More elaborate treatment of non-tariff barriers to trade
Extension of analysis to other countries
– OECD accession countries
– Enhanced engagement and other non-member countries.
Analysis of the regulation-performance link
– Cross-section and time series
– Impact of regulation on outcome variables.

18
Thank you !
For further information:
www.oecd.org/eco/pmr

19
System of data collection and processing
Sectoral
Indicators
ETCR:
‟75-‟07
Retail,
Prof.Serv:
„98, „03, „07
Overall PMR
‟98, ‟03, ‟07
Revised
Questionnaire
Existing 2003
database
Core
Database
of replies
External
data sources
Electronic
questionnaire
Database
Public
Use

20
The 2003 PMR tree structure
Barriers to entrepreneurship
(0.30)
State control
(0.29)
Public
ownership
(0.56)
Involvement
in business
operations
(0.44)
Other
barriers
(0.30)
Explicit
barriers to trade
and investment
(0.70)
Administrative
burdens on
start-ups
(0.30)
Scope of public
enterprise
(0.30)
Size of public
enterprise
(0.30)
Direct control
over business
enterprises
(0.40)
Price
controls
(0.45)
Use of
command
and control
regulation
(0.55)
Licenses and
permits system
(0.55)
Communication
and
simplification of
rules and
procedures
(0.45)
Administrative
burdens for
corporations
(0.36)
Administrative
burdens for sole
proprietor firms
(0.30)
Sector-specific
administrative
burdens
(0.34)
Legal
barriers
(0.30)
Antitrust
exemptions
(0.70)
Ownership
barriers
(0.45)
Tariffs
(0.31)
Discriminatory
procedures
(0.24)
Regulatory
barriers
(1.0)
Product market regulation
Barriers to trade and
investment (0.41)
Regulatory and
administrative
opacity
(0.48)
Barriers to
competition
(0.22)

21
The current tree structure of NMR [1]
ETCR
Gas Road Airlines
Public
ownership
Entry Entry Entry Entry Entry Entry
Telecoms Electricity Post Rail
Public
ownership
Market
structure
Public
ownership
Vertical
integration
Public
ownership
Market
structure
Entry
Public
ownership
Public
ownership
Market
structure
Vertical
integration
Prices
Vertical
integration
Energy Transport Communication
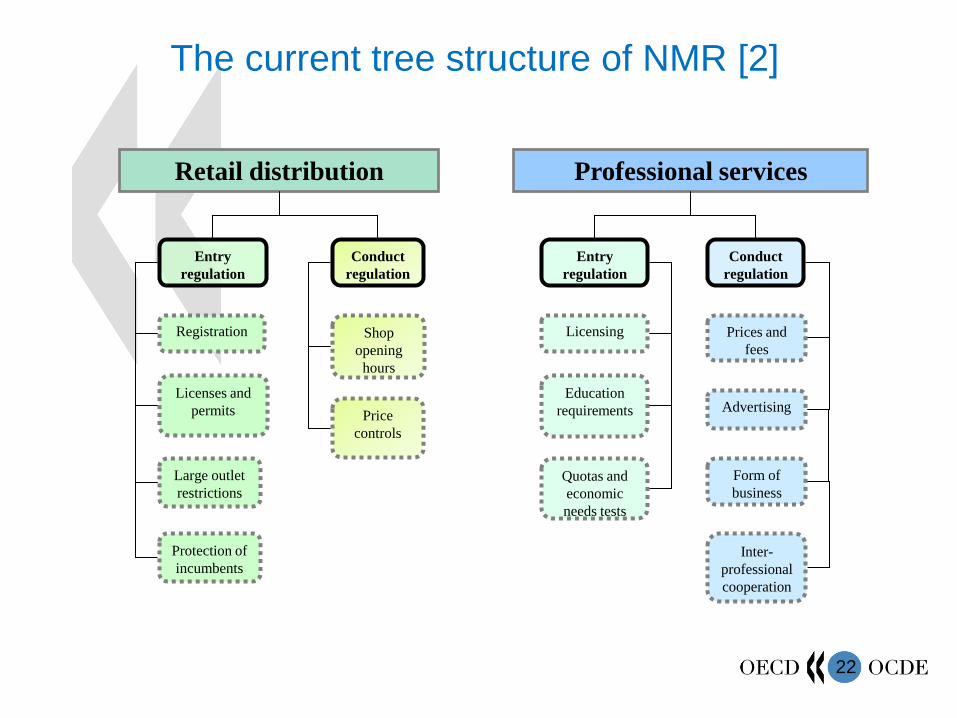
22
Conduct
regulation
Prices and
fees
Registration Shop
opening
hours
Conduct
regulation
Entry
regulation
Entry
regulation
Advertising
Form of
business
Licenses and
permits
Large outlet
restrictions
Price
controls
Licensing
Education
requirements
Retail distribution Professional services
Protection of
incumbents
Quotas and
economic
needs tests
Inter-
professional
cooperation
The current tree structure of NMR [2]

23
Reconsidering the weights (JRC) PMR 2008, computed with PCA based on data for different years

24
Reconsidering the weights (JRC) PMR 2003, PCA based on different number of low-level indicators
AUS
AUT
BEL
CAN
CZE
DNK
FIN
FRA
DEU
HUN
ISL
ITA
JPN
KOR
LUX
MEX
NLD
NZL
NOR
POL
PRT
ESP
SWE
CHE
TUR
UKMUSA
0
3
6
9
12
15
18
21
24
27
30
0 3 6 9 12 15 18 21 24 27 30
PC
A 1
8 i
nd
icato
rs
PCA 15 indicators
PCA weights computed from 15 or 18 indicators

25
A multi-modelling approach (JRC) Times (in %) in which each country ranks 1st, 2nd, 3rd, ….. , 27th
PMR Median 1 2 3 4 5 6 7 8 9 10 11 12 13 14 15 16 17 18 19 20 21 22 23 24 25 26 27
2 1 GBR 84 7 8 1 0 0 0 0 0 0 0 0 0 0 0 0 0 0 0 0 0 0 0 0 0 0 0
1 2 USA 6 63 22 2 1 1 2 0 0 0 0 0 0 0 0 0 0 0 0 0 0 0 0 0 0 0 0
4 5 ISL 8 15 17 12 13 7 7 4 4 3 2 1 1 1 0 0 0 0 1 1 0 1 0 0 1 0 0
7 5 ESP 0 3 17 24 16 12 12 9 3 0 1 0 0 0 0 0 0 0 0 0 0 0 0 0 0 0 0
5 6 NLD 0 2 14 13 14 14 23 12 4 3 1 0 0 0 0 0 0 0 0 0 0 0 0 0 0 0 0
6 7 DNK 0 4 4 6 12 14 10 10 6 4 11 3 1 0 10 1 0 0 0 1 0 0 0 0 0 0 0
3 8 CAN 0 0 9 17 11 7 5 10 12 13 3 3 4 2 1 1 1 0 0 0 0 0 0 0 0 0 0
12 8 NZL 0 2 3 12 6 7 9 14 21 9 5 5 1 1 3 0 2 1 0 0 0 0 0 0 0 0 0
11 10 AUS 0 0 1 2 8 5 8 10 9 8 11 11 11 8 6 0 0 0 0 0 0 0 0 0 0 0 0
9 10 NOR 0 0 3 3 4 6 7 10 14 9 8 6 4 2 3 7 6 6 0 1 1 0 0 0 1 0 0
10 11 FIN 0 0 0 0 0 0 3 3 11 19 24 27 9 3 1 0 0 0 0 0 0 0 0 0 0 0 0
8 11 JPN 1 0 1 6 2 3 2 10 7 16 7 4 3 12 10 5 6 1 2 1 0 0 0 0 0 0 0
14 13 SWE 0 3 1 1 1 3 3 3 3 6 7 13 11 9 4 10 9 10 1 1 2 0 0 0 0 0 0
13 15 CHE 0 0 0 0 0 0 2 2 2 2 5 6 19 14 14 13 11 8 1 1 0 0 0 0 0 0 0
19 16 BEL 0 0 0 1 0 10 6 1 3 3 2 4 5 4 9 18 10 9 7 4 1 1 1 0 0 0 0
20 16 FRA 0 0 0 0 0 1 0 0 2 2 6 6 11 9 11 6 10 11 6 9 7 2 0 0 0 0 0
17 16 HUN 0 0 1 0 11 7 1 0 0 1 3 3 2 8 6 7 15 12 12 4 4 2 1 0 0 0 0
16 18 DEU 0 0 0 0 0 0 0 0 0 2 2 3 7 7 11 7 7 8 15 11 11 4 3 0 0 0 0
15 18 ITA 0 0 0 0 0 0 0 0 0 1 1 1 2 3 6 14 7 18 14 8 13 11 1 0 0 0 0
18 20 AUT 0 0 0 0 0 0 0 0 0 0 0 0 1 1 2 6 6 6 9 21 17 11 16 1 0 0 0
23 20 LUX 0 0 0 0 0 0 0 0 0 0 0 0 7 12 1 1 2 4 10 20 12 17 9 5 0 0 0
22 22 PRT 0 0 0 0 0 0 0 0 0 0 0 0 0 0 0 0 0 2 9 12 15 24 31 5 0 0 0
24 23 CZE 0 0 0 0 0 0 0 0 0 0 0 0 0 0 0 0 1 0 4 4 9 10 24 39 7 0 0
21 24 KOR 0 0 0 0 0 0 0 0 0 0 0 2 1 3 2 1 4 3 3 3 5 9 11 30 22 1 0
25 25 MEX 0 0 0 0 0 0 0 0 0 0 0 0 0 0 0 0 0 0 0 0 0 0 0 10 55 25 9
26 26 TUR 0 0 0 0 0 0 0 0 0 0 0 0 0 0 0 0 0 0 5 0 0 6 1 8 13 50 15
27 27 POL 0 0 0 0 0 0 0 0 0 0 0 0 0 0 0 0 0 0 0 0 0 0 0 0 1 23 75

26
A new generation PMR from ‟08 onwards
Barriers to
entrepreneurship
Public
ownership Involvement in
business
operations
Other
barriers
Explicit
barriers to
trade & inv.
Regulatory
effectiveness
Administrative
burdens on
start-ups
Barriers to
competition
Scope of public
enterprise
Direct control
over business
enterprises
Price
controls
Use of
command
and control
regulation
Licenses and
permits system
Communication
and
simplification
of rules and
procedures
Sector-specific
administrative
burdens
Antitrust
exemptions
Regulatory
barriers
Gov’t involvement
in network sectors
Barriers in
network sectors
Barriers in
services
State control Barriers to trade and
investment
Barriers
to FDI
Product market regulation
Tariffs
Administrative
burdens for
corporations
Administrative
burdens for sole
proprietor firms
Legal barriers
Sector
Regulators Governance
of SoE’s
Differential
treatment of
foreign
suppliers
Barriers to
trade
facilitation
Barriers to
market access of
foreign suppliers