Embed Size (px)
Citation preview
Result and Discussion
Page 93
The results obtained during the determination of stability constant using
potentiometer are analyzed by the computer programme and the stability constant
values are calculated. Graph of An vs. pH for proton ligand system was plotted and in
most of the cases found to extend between 0-2 indicates that ligand has two
replaceable protons. Ligand titration curve had a lower pH value than acid titration
curve. Displacement of ligand titration curve along volume axis with respect to acid
titration curve is indication of proton dissociation. Values of An obtained are within
range 0.2- 0.8 and 1.2-1.8 indicating formation of 1:1 and 1:2 complexes. Deviation
of A+L curves from A+L+M curves indicates formation of complex.
The Metal-ligand stability constants of binary complexes are evaluated
assuming that the formation of hydrolyzed products, polynuclear complexes,
hydrogen and hydrogen bearing complexes are absent. An examination of titration
curves indicates that complex formation has taken place in the solution on the
following grounds.
1) Maximum value of An is 2 indicating the formation of 1:1 and 1:2 complexes only.
2) The metal ion solution used in the study are very dilute, hence there is no
possibility of formation of polynuclear complexes.
3) The hydrolysis of the metal ions was suppressed due to complex formation,
precipitation did not appear during the titration.
4) The metal titration curves are displaced to the right hand side of the ligand titration
curves along the volume axis, indicating proton release upon complex formation of
the metal ion with the ligand.
5) The large decrease in pH for the metal titration curves relative to the ligand
titration curves points to the formation metal complexes.
Result and Discussion
Page 94
6) In most cases, the colour of the solution after complex formation observed to be
different from the colour of the ligand at the same pH.
Higher is the pKa value, lesser is the tendency to ionize or in other words lesser
acidic character. Some variations may be due to different experimental condition.The
addition of metal ions to free ligand solutions lowered pH value .This shows that the
complexation reactions proceed through release of protons.
Farooqui et al [1] reported that a low value of stability constant suggests that ligand is
suitable for formation of complex at optimum physiological condition. This may
favour the binding of ligand with nucleic acid of cell through transition metal and
helps in transportation of drugs to the site of its physiological action.
In the present investigation values of logK1 found to be more than logK2 which
is in agreement with literature. [2-7]. The results shows that the ratio of logK1/logK2 is
positive in most of the cases which indicate that there is a little or no steric hinderance
to the addition of secondary ligands molecules which in agreement work reported by
Deosarkar and Narwade.[8]. Higher logK1 may be due to weaker interaction of second
ligand than first one. In few cases reported the logK2 values are higher than logK1,
this is in agreement with some earlier researchers. [9-11]. LogK1 for some ligands are
higher than logK2, this is due to fact that the interaction of second bulky ligand is
weaker than the first ligand i.e.1:2 species is not formed until complete formation of
1:1 species. This can be ascribed to i) increase in the Lewis acidity of free metal ion
as compared to 1:1 chelated ion ii) the steric hinderance caused by second bulky
ligand molecule. Higher value of logK2 than logK1 indicates trans effect for second
coordination.
Dissociation process is nonspontaneous process, endothermic and entropically
unfavourable. The formation of metal complexes has been found to be spontaneous,
Result and Discussion
Page 95
endothermic and entropically favoured. In the following section, a detail discussion
regarding potentiometric evaluation of stability constant is given. These values are
represented in the table 4.1(a) & b for 1:1 and 1:2 complexes.
4.1 Complexes of Nicotinic Acid
The complexation of Nicotinic acid with transition metal ions has been studied under
the experimental condition as described in Chapter II. These are presented in tabular
form (table 4.1a & b) for 1:1 complexes & 1:2 complexes. The titration curves were
plotted for ligand, and ligand + metal system. The values were analysed to get
protonation constant and metal –ligand stability constant.
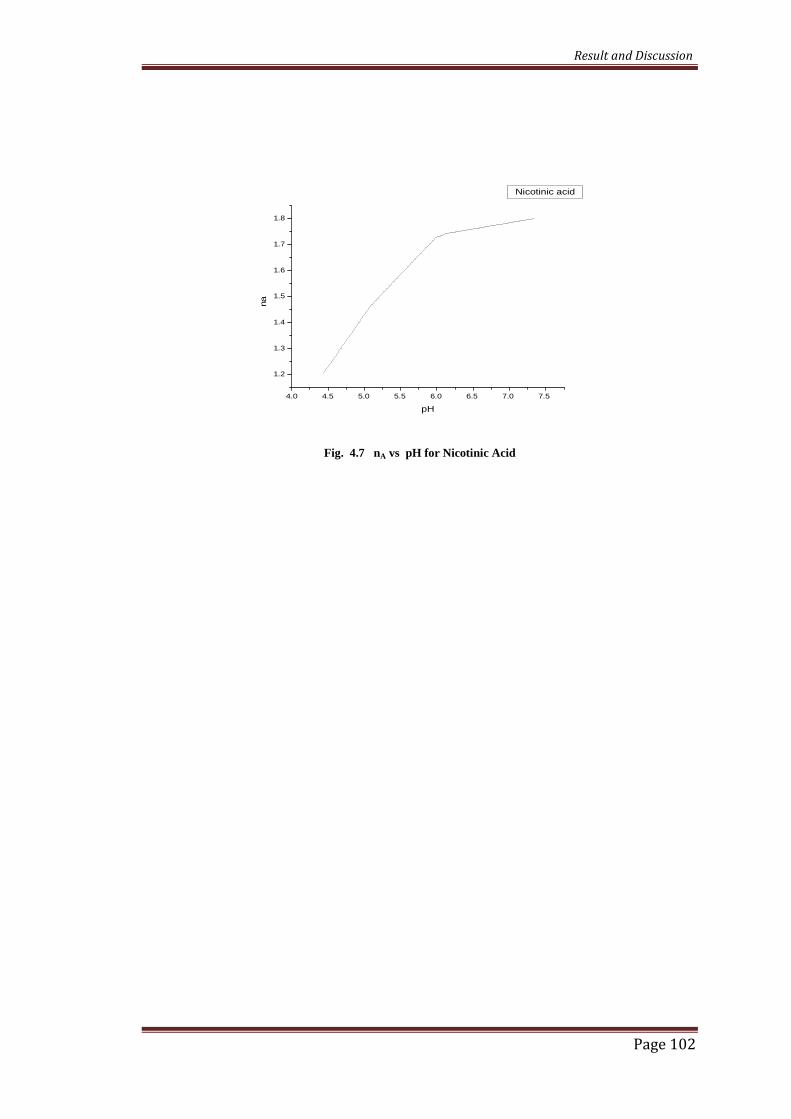
The value of An lies in the range of 0-1 indicating that ligand has only one replaceable
proton. The pKH value obtained are 5.425 and 5.200 considering the pointwise and
half integral method. In case of 1:2 ratio of metal and ligand, Co(II) complexes are
exceptionally more stable than Cu(II) complexes. Iztok Turel et al [12] have studied
complexation of Ciprofloxacin in aqueous solution at 250 C; They reported two pKa
values, 6.17 for 3-carboxylic group and 8.54 for nitrogen of piperazine group. They
also reported formation of 1:1 complexes. The complexation of Nicotinic acid with
metal ions under study gives metal ligand stability constants which are shown in the
table 4.1 a and 4.1 b
Table 4.1a Proton Ligand Constant and Stability constants of Nicotinic acid (1:1 ratio)
Proton-Ligandstability constant
Metal- ligand stability constant
Metal Log K1
Half integralpK1 = 5.200
Point wisepK1 = 5.4254
Cu (II) 3.72205
Zn (II) 3.65391
Ni (II) 3.61710
Co(II) 3.6623
Cd (II) 3.5100
Result and Discussion
Page 96
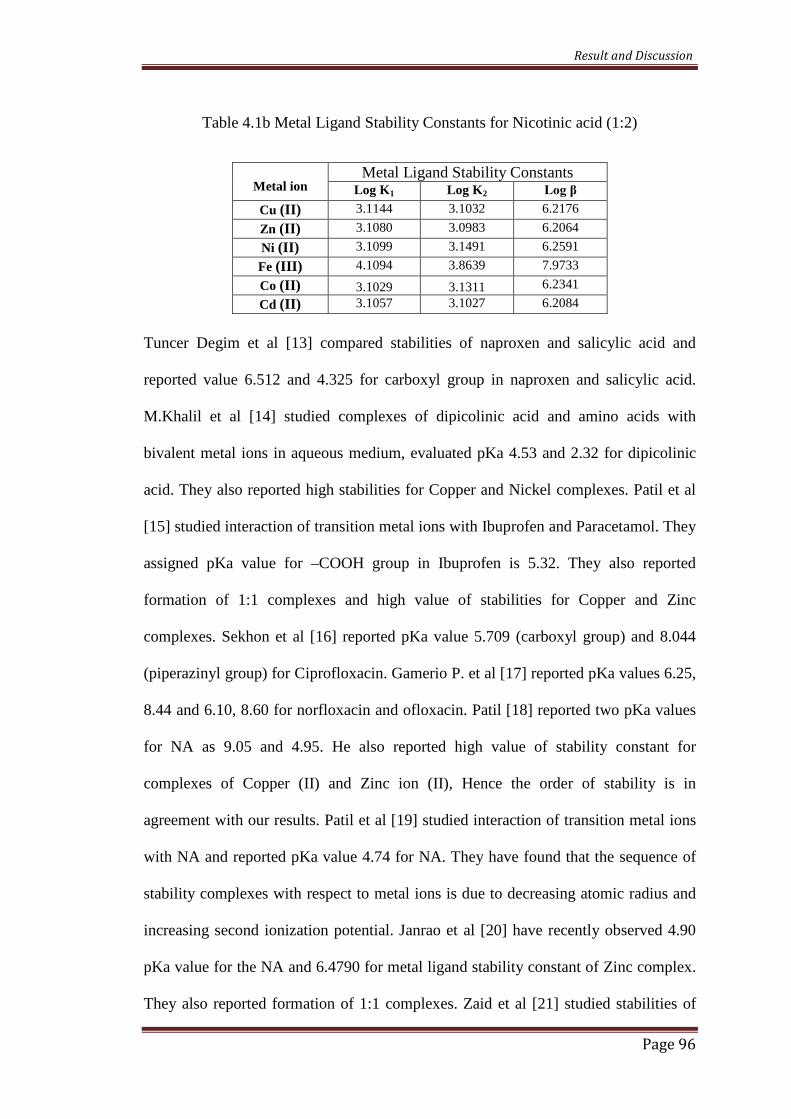
Table 4.1b Metal Ligand Stability Constants for Nicotinic acid (1:2)
Tuncer Degim et al [13] compared stabilities of naproxen and salicylic acid and
reported value 6.512 and 4.325 for carboxyl group in naproxen and salicylic acid.
M.Khalil et al [14] studied complexes of dipicolinic acid and amino acids with
bivalent metal ions in aqueous medium, evaluated pKa 4.53 and 2.32 for dipicolinic
acid. They also reported high stabilities for Copper and Nickel complexes. Patil et al
[15] studied interaction of transition metal ions with Ibuprofen and Paracetamol. They
assigned pKa value for –COOH group in Ibuprofen is 5.32. They also reported
formation of 1:1 complexes and high value of stabilities for Copper and Zinc
complexes. Sekhon et al [16] reported pKa value 5.709 (carboxyl group) and 8.044
(piperazinyl group) for Ciprofloxacin. Gamerio P. et al [17] reported pKa values 6.25,
8.44 and 6.10, 8.60 for norfloxacin and ofloxacin. Patil [18] reported two pKa values
for NA as 9.05 and 4.95. He also reported high value of stability constant for
complexes of Copper (II) and Zinc ion (II), Hence the order of stability is in
agreement with our results. Patil et al [19] studied interaction of transition metal ions
with NA and reported pKa value 4.74 for NA. They have found that the sequence of
stability complexes with respect to metal ions is due to decreasing atomic radius and
increasing second ionization potential. Janrao et al [20] have recently observed 4.90
pKa value for the NA and 6.4790 for metal ligand stability constant of Zinc complex.
They also reported formation of 1:1 complexes. Zaid et al [21] studied stabilities of
Metal ionMetal Ligand Stability Constants
Log K1 Log K2 Log β
Cu (II) 3.1144 3.1032 6.2176
Zn (II) 3.1080 3.0983 6.2064
Ni (II) 3.1099 3.1491 6.2591
Fe (III) 4.1094 3.8639 7.9733
Co (II) 3.1029 3.1311 6.2341
Cd (II) 3.1057 3.1027 6.2084
Result and Discussion
Page 97
ciprofloxacin moiety and observed high values of stability for Copper complexes.
Farooqui et al [22] evaluated two pKa values for picolinic acid as 10.95 and 8.83 in
aqueous medium using potentiometry. They also reported high values of stability
constants for Cobalt than Nickel complex. Nair et al [23] observed two stability
constants for NA as 4.69 and 7.02 at 370 C. They reported formation of 1:1 and 1:2
complexes. They also reported NA as a bidentate ligand and binding of ligand to
metal ion through N-pyridine and O of carboxalato atoms like that of pyridine-2-
carboxylic acid.
Anita Gupta [24] studied stability of ampicillin trihydrate in water ethanol
medium 50% V/V maintaining ionic strength at 0.1M KNO3 with bivalent metal ions.
She reported pKa value of 6.98 and formation of 1:1 complexes. For drugs to remain
in biologically active form, the stability constants should be in the range of 3-5. The
stability values are found to be in biologically active range and highest value was
found for Copper (II) metal ion. These stability values may be informative for
biochemist during drug design or drug discovery.
Erzalina Hernowo [25] reported two values of pKa as 2.22 and 4.59 for carboxylic
acid group and pyridine nitrogen, also compared stability constant of NA with GA
and proved that NA is weaker ligand.
For the present investigation, the order of stability may be assigned as follows
Cu(II) > Zn(II) > Ni(II) > Co(II) > Cd(II) for 1:1 complexes and
Fe(III) > Zn(II) > Co(II) > Cu(II) > Cd(II) > Zn (II) for 1:2 complexes.
Rasheed H. A. and Maqsood Z.T. [26] studied solid state complexes of NA with Cu
(II), reported that NA complexes are water insoluble, octahedral in nature and
formation of 1:1 and 1:2 complexes is detected. Cu (II) nicotinate complexes reported
to exert diverse bioactivities. Monodentate nature of NA and possibility of bonding
Result and Discussion
Page 98
through Nitrogen was observed. Low values of stability of NA-Cu (II) complexes are
due to weak nature of NA ligand. Kayande et al [27] also studied the complexation of
NA with Cu (II), observed pKa 3.48. Interactions of insulin –mimetic zinc complexes
of 2-picolinic acid was studied by E. Anna Ebedy et al [28], they also reported
complexation through pyridine nitrogen and carboxylate oxygen for pKa 1.00 and
5.19. Solution behaviour of enrofloxacin (erf) complexes with transition metal ions in
the presence of 1, 10 phenanthroline was investigated by R. Saraiva et al [29]. The
results obtained show that at physiological condition only Copper form stable
complexes, they reported pKa values 6.17 and 9.34 for -COOH group and piperazine
in erf respectively.
Result and Discussion
Page 99
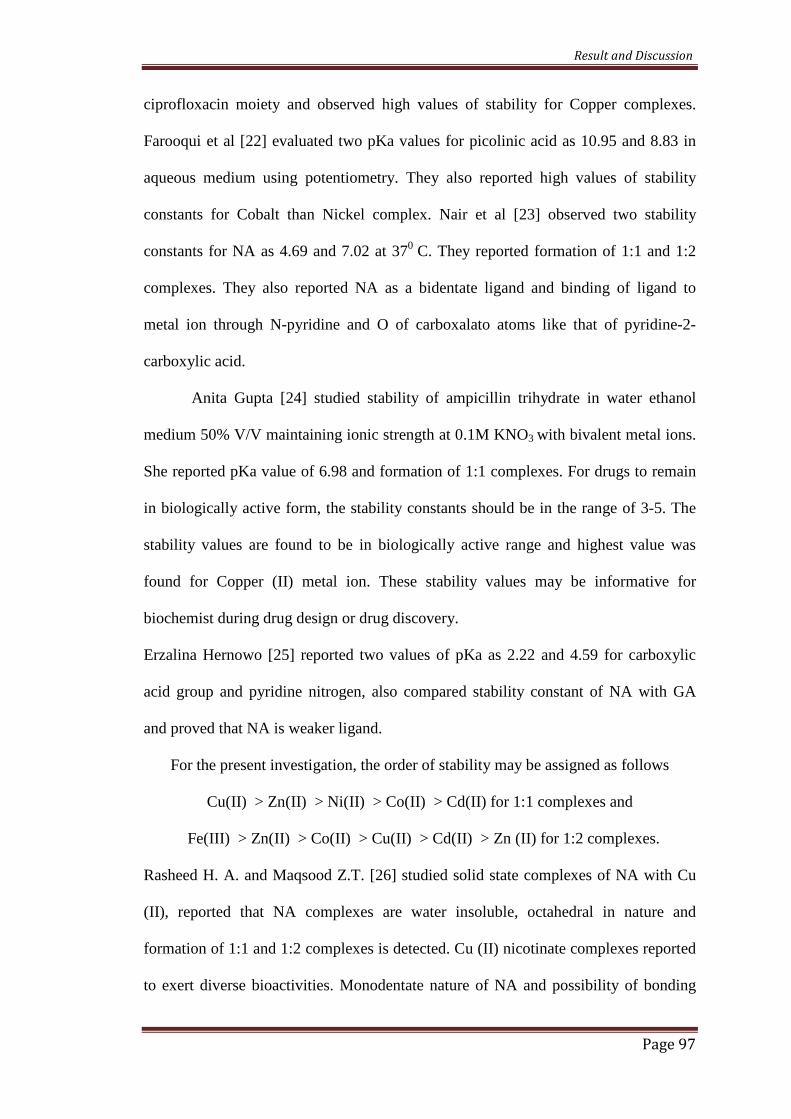
Fig. 4.1 pH metric titration curve for Cu( II) + Nicotinic Acid (1:1 ratio)
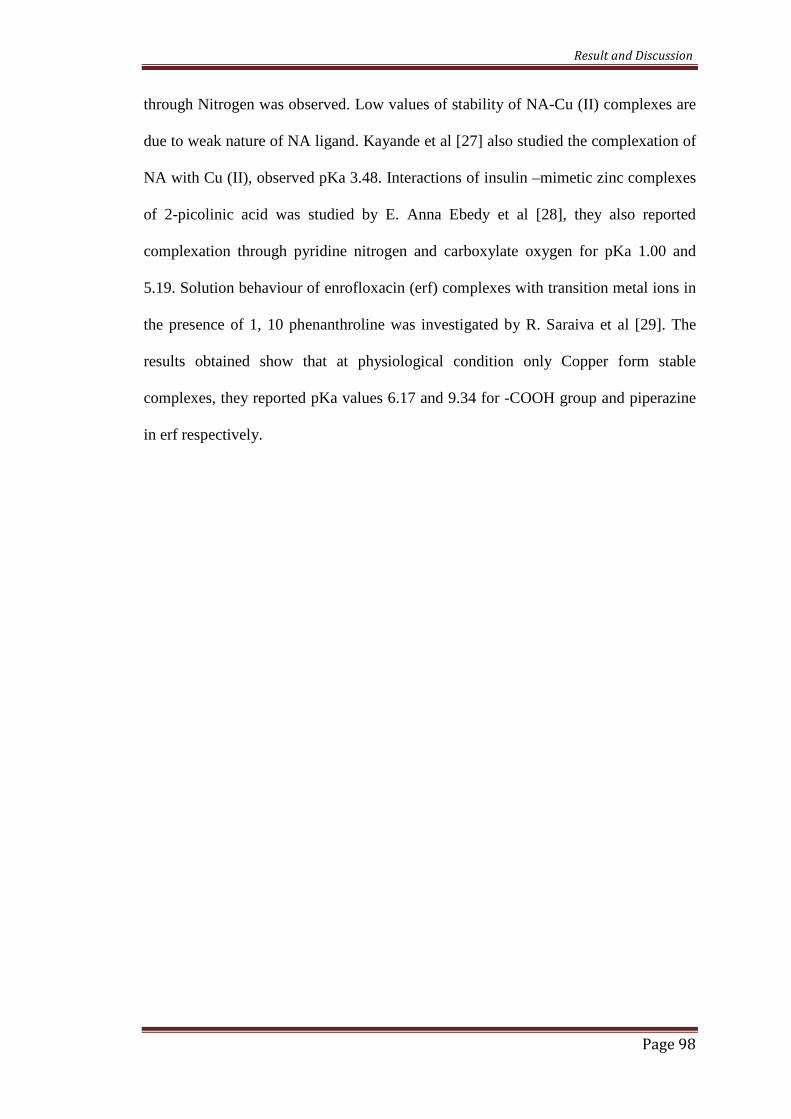
Fig. 4.2 pH metric titration curve for Ni (II) + Nicotinic Acid (1:1 ratio)
-0.5 0.0 0.5 1.0 1.5 2.0 2.5 3.0 3.5
2
4
6
8
10
12
pH
Vol.of NaOH
Nicotinic Acid
-0.5 0.0 0.5 1.0 1.5 2.0 2.5 3.0 3.5
2
4
6
8
10
12
pH
Vol.of NaOH
Result and Discussion
Page 100
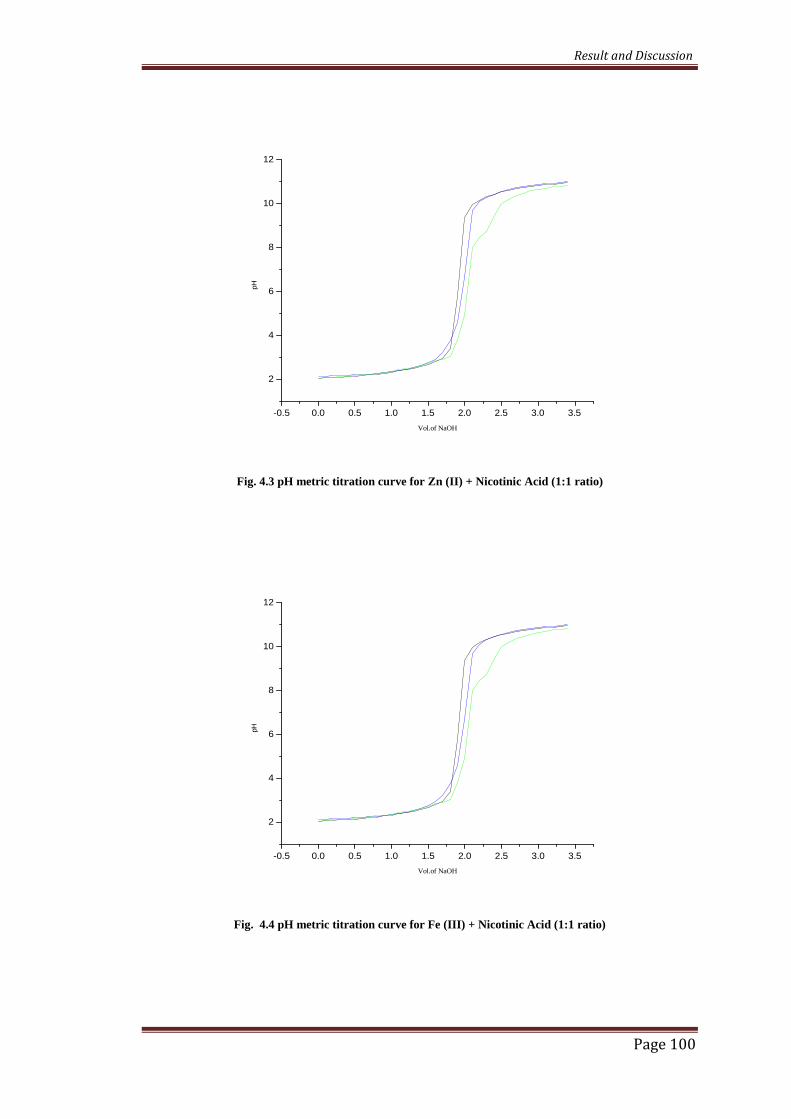
Fig. 4.3 pH metric titration curve for Zn (II) + Nicotinic Acid (1:1 ratio)
Fig. 4.4 pH metric titration curve for Fe (III) + Nicotinic Acid (1:1 ratio)
-0.5 0.0 0.5 1.0 1.5 2.0 2.5 3.0 3.5
2
4
6
8
10
12
pH
Vol.of NaOH
-0.5 0.0 0.5 1.0 1.5 2.0 2.5 3.0 3.5
2
4
6
8
10
12
pH
Vol.of NaOH
Result and Discussion
Page 101
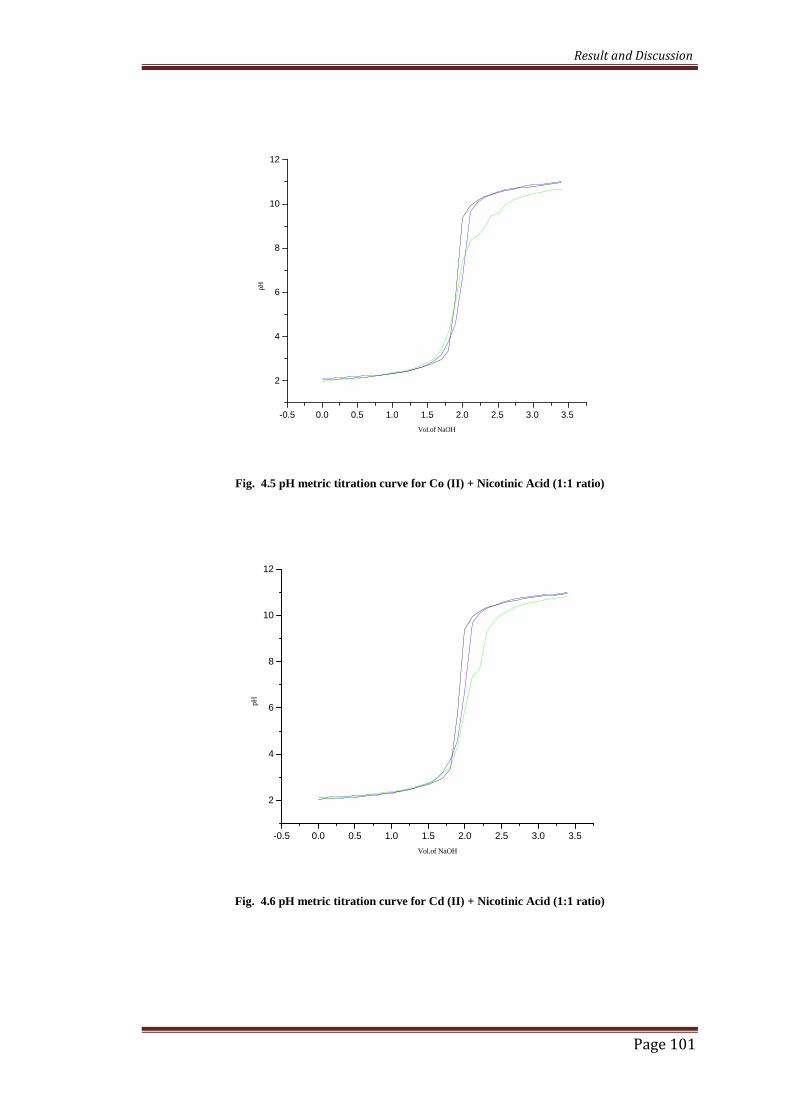
Fig. 4.5 pH metric titration curve for Co (II) + Nicotinic Acid (1:1 ratio)
Fig. 4.6 pH metric titration curve for Cd (II) + Nicotinic Acid (1:1 ratio)
-0.5 0.0 0.5 1.0 1.5 2.0 2.5 3.0 3.5
2
4
6
8
10
12
pH
Vol.of NaOH
-0.5 0.0 0.5 1.0 1.5 2.0 2.5 3.0 3.5
2
4
6
8
10
12
pH
Vol.of NaOH
Result and Discussion
Page 102
Fig. 4.7 nA vs pH for Nicotinic Acid
4.0 4.5 5.0 5.5 6.0 6.5 7.0 7.5
1.2
1.3
1.4
1.5
1.6
1.7
1.8
na
pH
Nicotinic acid
Result and Discussion
Page 103
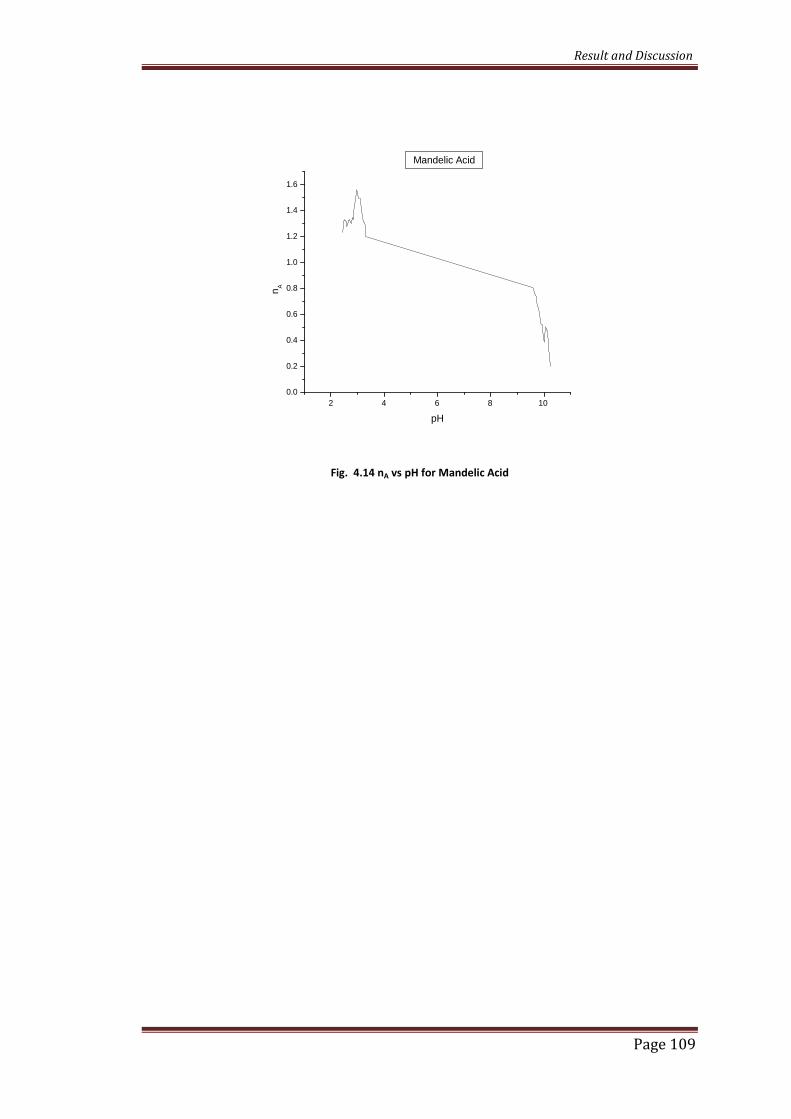
4.2 Complexes of Mandelic Acid
The Mandelic acid has two ionizable groups –OH and –COOH. The ionization of
strong carboxylic group occur at lower pH, due to the high stability of the carboxylate
ion by resonance and hydroxylic group occur at higher pH. For the present work the
protonation constant obtained are 2.944 and 9.425. These value are in agreement with
pKa values with earlier work in which ligand possess carboxylic and hydroxyl group.
[30-32]. Jain et al [33] studied complexation of Eu(III) with humic acid and its model
compounds. They reported formation of 1:1 and 1:2 complexes and pKa value 3.19
for Mandelic Acid. Calderia et al [34] has reported high stability values for tungeston
complexes of the MA. The complexation of Mandelic Acid with metal ions under
study gives metal ligand stability constants which are shown in the table 4.2 a and
4.2b.
Table 4.2a Proton ligand and metal ligand stability constants of Mandelic acid (1:1)
Table 4.2b Metal Ligand Stability Constants for Mandelic Acid (1:2)
Metal ionMetal Ligand stability constants
Log K1 Log K2 Log β
Cu(II) 7.5067 7.1232 14.6300
Zn(II) 6.3857 6.0603 12.4461
Ni(II) 7.1127 5.5842 12.6969
Fe(III) - - -
Co(II) 5.8731 5.3747 11.2478
Cd(II) 5.5844 - 5.5844
Proton LigandStability constant
Metal ligand stability constantMetal ion Log K1 Log K2 Log β
Half integralpK1 = 2.9444pK2 = 9.9425
Point wisepK1 = 2.6200pK2 = 9.9852
Fe (III) 10.9051
3.8164 14.7215
Cu (II) 6.4714 5.9449 12.4163
Zn (II) - 5.7148 5.7148
Co (II) - 4.8507 4.8507
Ni (II) - 4.8751 4.8751
Cd (II) - 5.5833 5.5833
Result and Discussion
Page 104
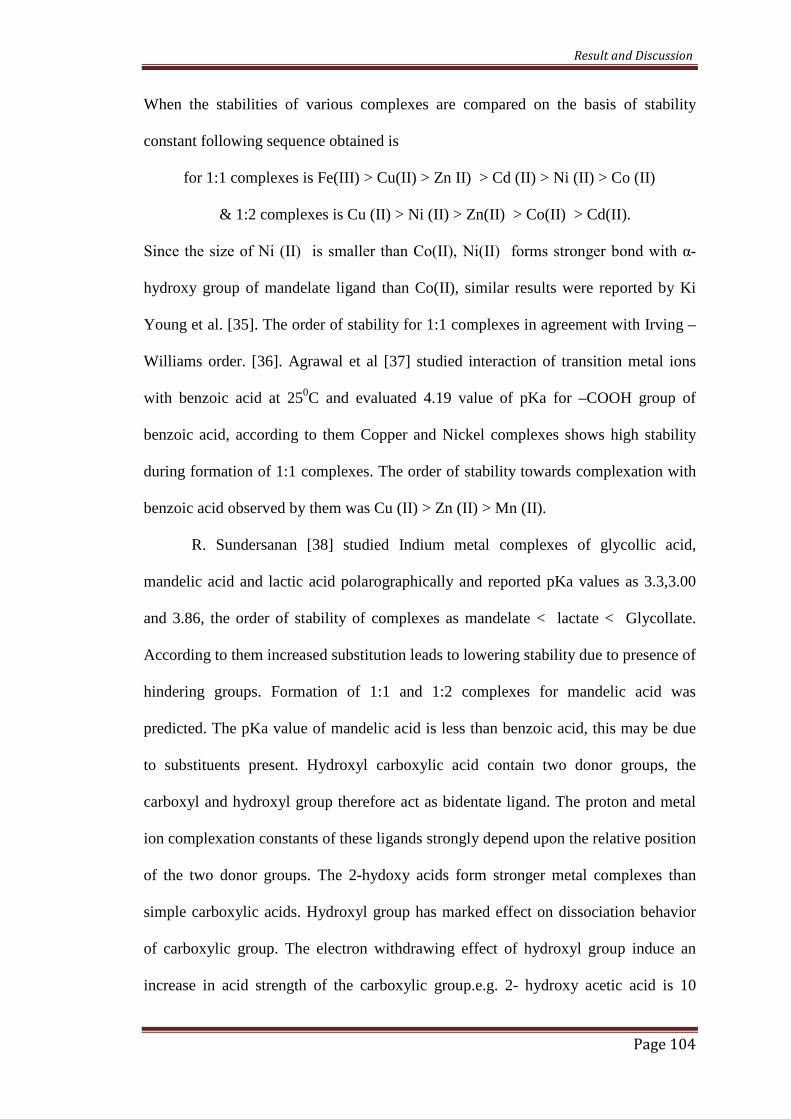
When the stabilities of various complexes are compared on the basis of stability
constant following sequence obtained is
for 1:1 complexes is Fe(III) > Cu(II) > Zn II) > Cd (II) > Ni (II) > Co (II)
& 1:2 complexes is Cu (II) > Ni (II) > Zn(II) > Co(II) > Cd(II).
Since the size of Ni (II) is smaller than Co(II), Ni(II) forms stronger bond with α-
hydroxy group of mandelate ligand than Co(II), similar results were reported by Ki
Young et al. [35]. The order of stability for 1:1 complexes in agreement with Irving –
Williams order. [36]. Agrawal et al [37] studied interaction of transition metal ions
with benzoic acid at 250C and evaluated 4.19 value of pKa for –COOH group of
benzoic acid, according to them Copper and Nickel complexes shows high stability
during formation of 1:1 complexes. The order of stability towards complexation with
benzoic acid observed by them was Cu (II) > Zn (II) > Mn (II).
R. Sundersanan [38] studied Indium metal complexes of glycollic acid,
mandelic acid and lactic acid polarographically and reported pKa values as 3.3,3.00
and 3.86, the order of stability of complexes as mandelate < lactate < Glycollate.
According to them increased substitution leads to lowering stability due to presence of
hindering groups. Formation of 1:1 and 1:2 complexes for mandelic acid was
predicted. The pKa value of mandelic acid is less than benzoic acid, this may be due
to substituents present. Hydroxyl carboxylic acid contain two donor groups, the
carboxyl and hydroxyl group therefore act as bidentate ligand. The proton and metal
ion complexation constants of these ligands strongly depend upon the relative position
of the two donor groups. The 2-hydoxy acids form stronger metal complexes than
simple carboxylic acids. Hydroxyl group has marked effect on dissociation behavior
of carboxylic group. The electron withdrawing effect of hydroxyl group induce an
increase in acid strength of the carboxylic group.e.g. 2- hydroxy acetic acid is 10
Result and Discussion
Page 105
times stronger than acetic acid .[39]. Similar effect is observed in case MA ligand, it
has pKa value as 2.9444 which correspond to –COOH group (our results) and phenyl
acetic acid has value of 4.28
Mehta B.H. [40] studied the complexes of various carboxylic acids with
transition metals and reported values of pKa for malic acid as 8.8828, 11.873,
assigned higher pKa for –OH group. Order of stability as Mn(II) > Fe(III) < Ni(II) <
Cu(II) < UO2(II). Basavraj et al [41] studied complexation of Schiffs bases (SB) with
transition metal ions in water ethanol medium, reported pKa for SB as 12.85 and 4.05
corresponding to –OH and –COOH group respectively. They have reported
coordination of metal ions through oxygen of –OH group and carboxylate of –COOH
group. Order of stability shown by them was
Zn (II) < Cu(II) > Ni (II) > Co(II) = Cd(II) > Mg(II)
Result and Discussion
Page 106
Figure 4.8 pH metric titration curve for Cu (II) + Mandelic Acid (1:1 ratio)
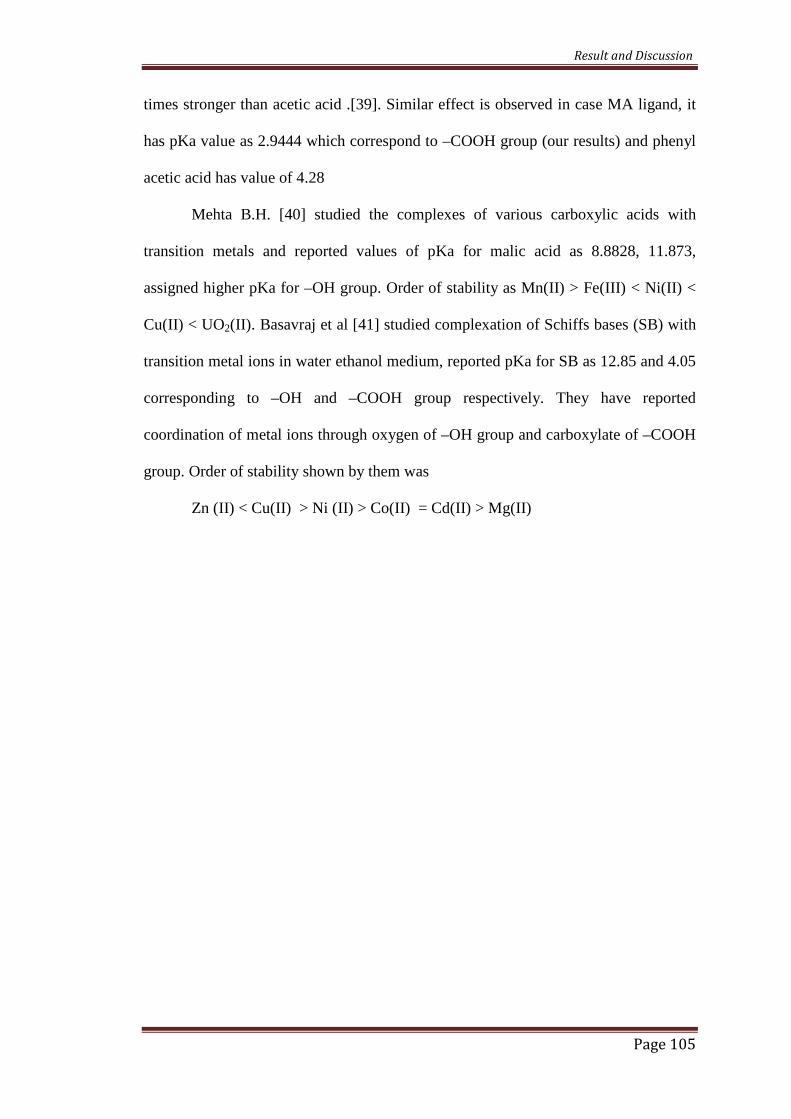
Fig. 4.9 pH metric titration curve for Zn (II) + Mandelic Acid in (1:1 ratio)
-0.5 0.0 0.5 1.0 1.5 2.0 2.5 3.0 3.5 4.0
2
4
6
8
10
12
pH
Vol.of NaOH
-0.5 0.0 0.5 1.0 1.5 2.0 2.5 3.0 3.5 4.0
2
4
6
8
10
12
pH
Vol.of NaOH
Result and Discussion
Page 107
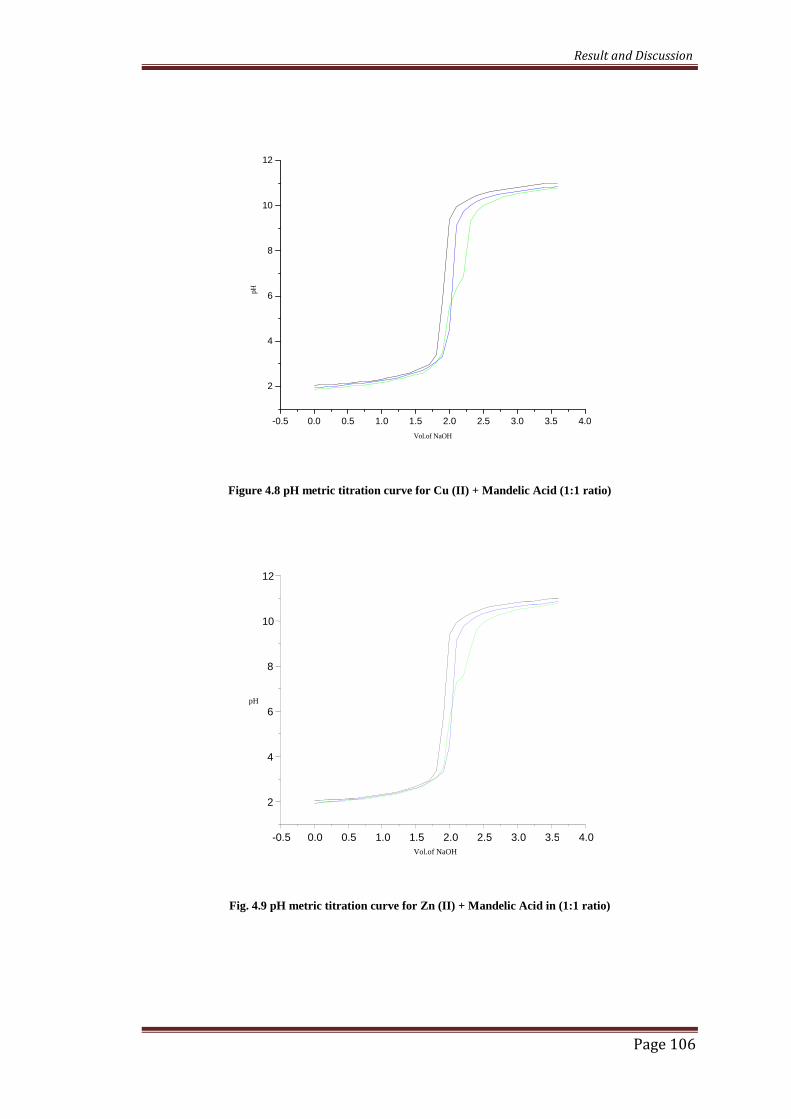
Graph 4.10 pH metric titration curve for Co ( II) + Mandelic Acid in 1:1 ratio
Graph 4.11 pH metric titration curve for Fe (III) + Mandelic Acid (1:1 ratio)
-0.5 0.0 0.5 1.0 1.5 2.0 2.5 3.0 3.5 4.0
2
4
6
8
10
12
pH
Vol.of NaOH
-0.5 0.0 0.5 1.0 1.5 2.0 2.5 3.0 3.5 4.0
2
4
6
8
10
12
pH
Vol.of NaOH
Result and Discussion
Page 108
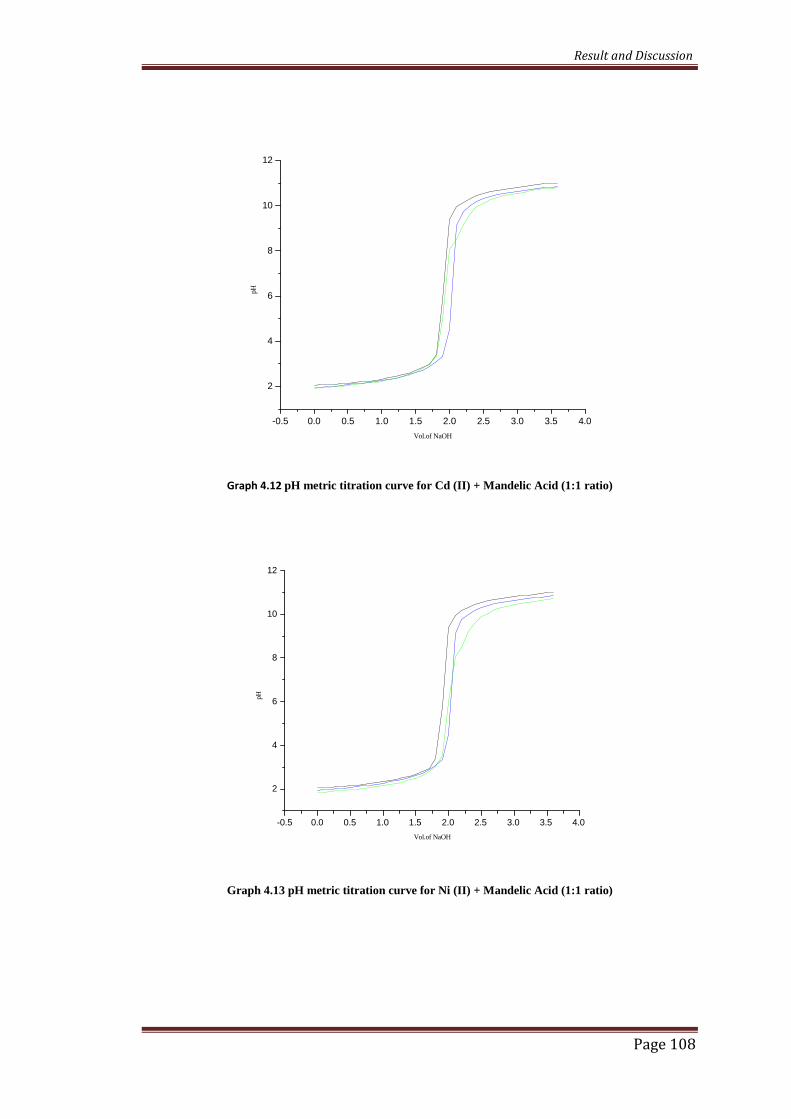
Graph 4.12 pH metric titration curve for Cd (II) + Mandelic Acid (1:1 ratio)
Graph 4.13 pH metric titration curve for Ni (II) + Mandelic Acid (1:1 ratio)
-0.5 0.0 0.5 1.0 1.5 2.0 2.5 3.0 3.5 4.0
2
4
6
8
10
12
pH
Vol.of NaOH
-0.5 0.0 0.5 1.0 1.5 2.0 2.5 3.0 3.5 4.0
2
4
6
8
10
12
pH
Vol.of NaOH
Result and Discussion
Page 109
Fig. 4.14 nA vs pH for Mandelic Acid
2 4 6 8 10
0.0
0.2
0.4
0.6
0.8
1.0
1.2
1.4
1.6
nA
pH
Mandelic Acid
Result and Discussion
Page 110
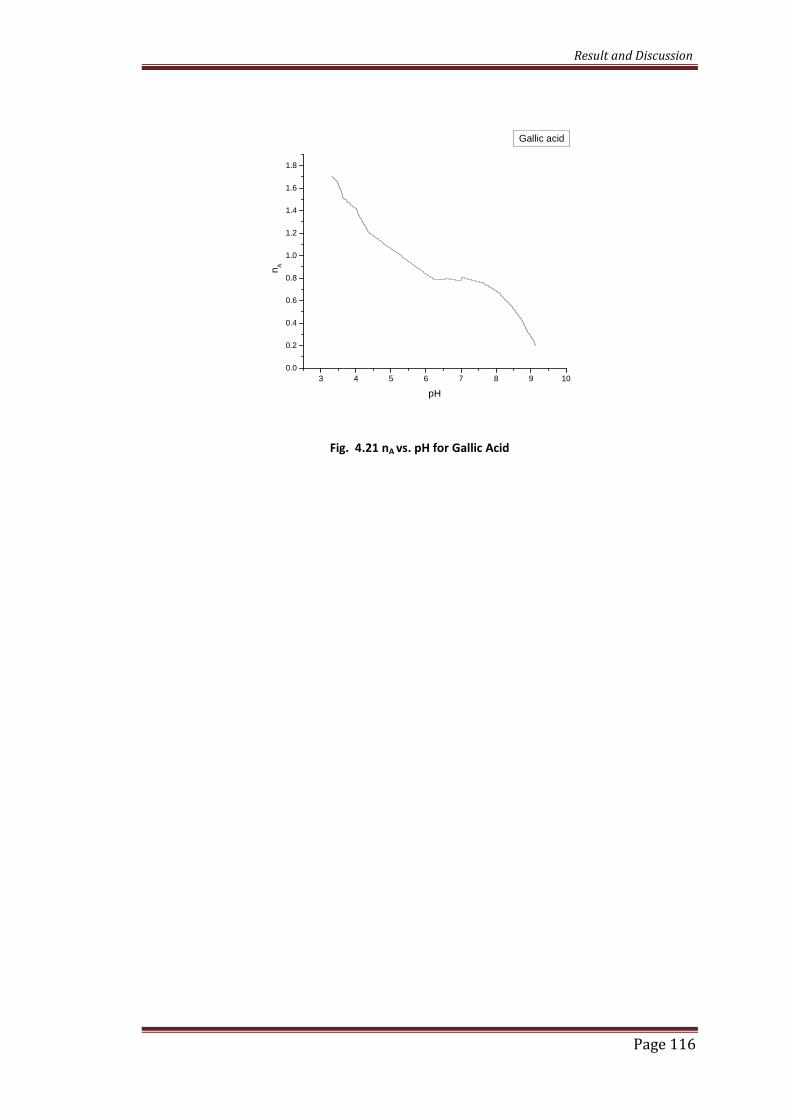
4.3 Complexes of Gallic Acid
When the potentiometric study of bivalent complexes with GA is carried out ,two
protonation constant were obtained 5.30 and 9.2949. These are assigned to carboxylic
acid and acidic –OH group respectively. The metal ligand stability constants of GA
are given in the table 4.3a & 4.3b.
Table 4.3a Proton Ligand Constant and Metal ligand Stability Constants For Gallic
acid (1:1)
Table 4.3b Metal Ligand Stability Constants for Gallic Acid (1:2)
Metal ionMetal Ligand Stability Constants
Log K1 Log K2 Log β
Cu (II) 9.7236 9.1933 18.9169
Zn (II) 8.0345 7.2774 15.3119
Ni (II) 7.0369 6.7424 13.7793
Fe (III) - 10.979 10.9790
Co (II) 7.5724 7.1308 14.7033
Cd (II) 7.1482 6.6143 13.7625
Ahmed Fizary et al [42] studied Iron(III) complexes of GA by potentiometry reported
pKa for gallic acid as 4.10 and 8.38 ,14.73(logK1) 11.93(logK2) , formation of 1:1 and
1:2 complexes. The complexes formation was also confirmed by UV-visible
spectroscopy. Fattahpour Sedeh et al [43] studied complexation of silicic acid and
phenolic acids in aqueous medium, pKa values reported are 4.141 and 8.41.
M. Saqib and Arif Kazmi [44] have reported strong chelating capacity for the GA and
formation of highly colored complexes with metals which are in agreement with our
Proton-Ligandstability Constant
Metal ligand Stability Constants
Metal ion Log K1 Log K2 Log β
Half integralpK1 = 5.3002pK2 = 9.2949
Fe(III) 11.6545 10.8250 22.4795
Cu(II) 7.9150 7.0946 15.0096
Zn (II) 6.2561 6.0034 12.2595
Point wisepK1 = 5.2723pK2 = 9.2915
Ni (II) 5.6428 5.2030 10.8458
Co (II) 5.8957 5.3244 11.2201
Cd (II) 6.2115 4.7593 10.9770
Result and Discussion
Page 111
studies. Gallic acid has three –OH groups and one -COOH group, out of which two –
OH groups may be engaged in complexation. The remaining –OH group may be
engaged in hydrogen bonding with –COO- of the other ligand present on the same
molecule forming cage like structure. Such intramolecular hydrogen bonding may be
responsible for the high stability constants. In our case formation of 1:1 and 1:2 has
been reported. It is found that binary complexes of M: L ratio 1:2 are more stable than
1:1, these results are in agreement with the earlier researcher. Higher value of stability
constant indicates the possibility of covalent interaction and the low value gives idea
about ionic interaction. [45]
The order of stability for this investigation may be presented as
Fe (III) > Cu(II) > Zn(II) > Co(II) > Ni(II) > Cd(II) for 1:1 complexes
and for 1:2 complexes is Cu(II) > Zn(II) > Co (II) > Ni (II) > Cd (II) > Fe(III).
The order is in agreement with the Irving Williams order and reported by many
workers [46, 47]. The stability constant value varies with the ionic size of metal ion.
The smaller the ionic radius of the central atom, more stable is the complex formed. It
also depends upon experimental conditions used.
Nasreen Fatima and Zahida Maqsood [48] studied vanadium complexes of
catecholates, they also reported high values of stability for gallic acid with vanadium
(II) and reported formation of 1:1 and 1:2 complexes. Strong chelating capacity for
the ligand is reported. It forms highly colored complexes with metals. The pKa values
reported by them are 4.341, 9.0892 and 11.9210. The complexes of GA are more
stable than other phenolic acids. There is formation of 1:1,1:2 and 1:3 complexes.
Mahmoud Hasan M.[49] investigated interaction of Mercury (II) ions with GA
potentiometric and by optical means, they reported two pKa values as 8.51 and 10.70.
B. J. Sandmann et al [50] studied stability of divalent metal ions with GA and
Result and Discussion
Page 112
observed four pKa values as 4.4,8.6,11.2,11.38, also reported metal –ligand stability
constant for Zn as 11.38 which is in agreement with our results.
Beltran et al [51] studied pKa values of polyphenolic acids by potentiometry in water
and MeCN-water media, The pKa values obtained are 5.18, 9.31 and 11.04.
Erzalina Hernowo studied interaction of transition metal ions with GA in aqueous
medium, reported four protonation sites for GA having pKa as 4.25 (-COOH) group
and the other hydroxyl groups as 8.61, 11.03 and 12.71. He compared stability of GA
with NA and norleucine and proved that GA a strong ligand than others. The high
value of stability towards Iron is observed. The values obtained for stabilities are in
agreement with our results eg. 22.97 for Fe(III) (22.47),19.01(15.00) for Cu(II)
,10.31(10.84) for Ni(II) and for Co(II) 9.18(11.22), sequence of stability observed is
Fe (III) > Cu(II) > Ni (II) > Co (II).
Result and Discussion
Page 113
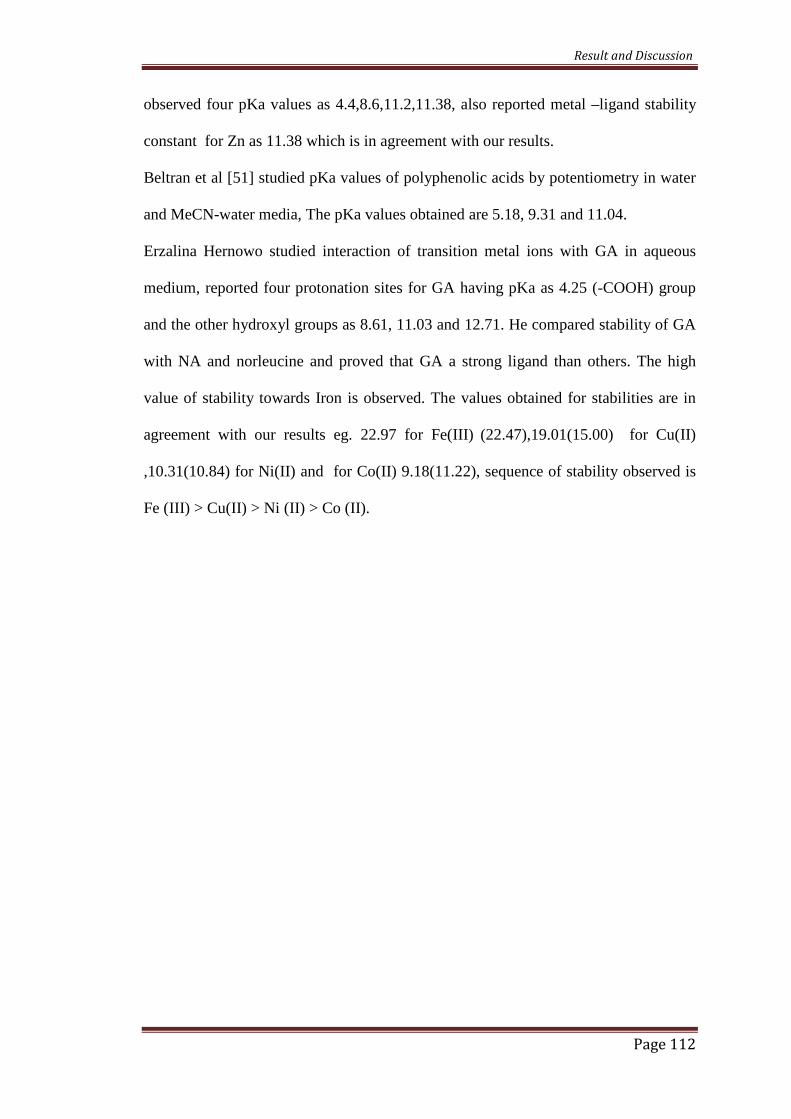
Fig. 4.15 pH metric titration curve for Cu (II) + Gallic Acid ( 1:1 ratio)
Fig. 4.16 pH metric titration curve for Co (II) + Gallic Acid (1:1 ratio)
0.0 0.5 1.0 1.5 2.0 2.5
0
2
4
6
8
10
12
pH
Vol.of NaOH
0.0 0.5 1.0 1.5 2.0 2.5
0
2
4
6
8
10
12
pH
Vol.of NaOH
Result and Discussion
Page 114
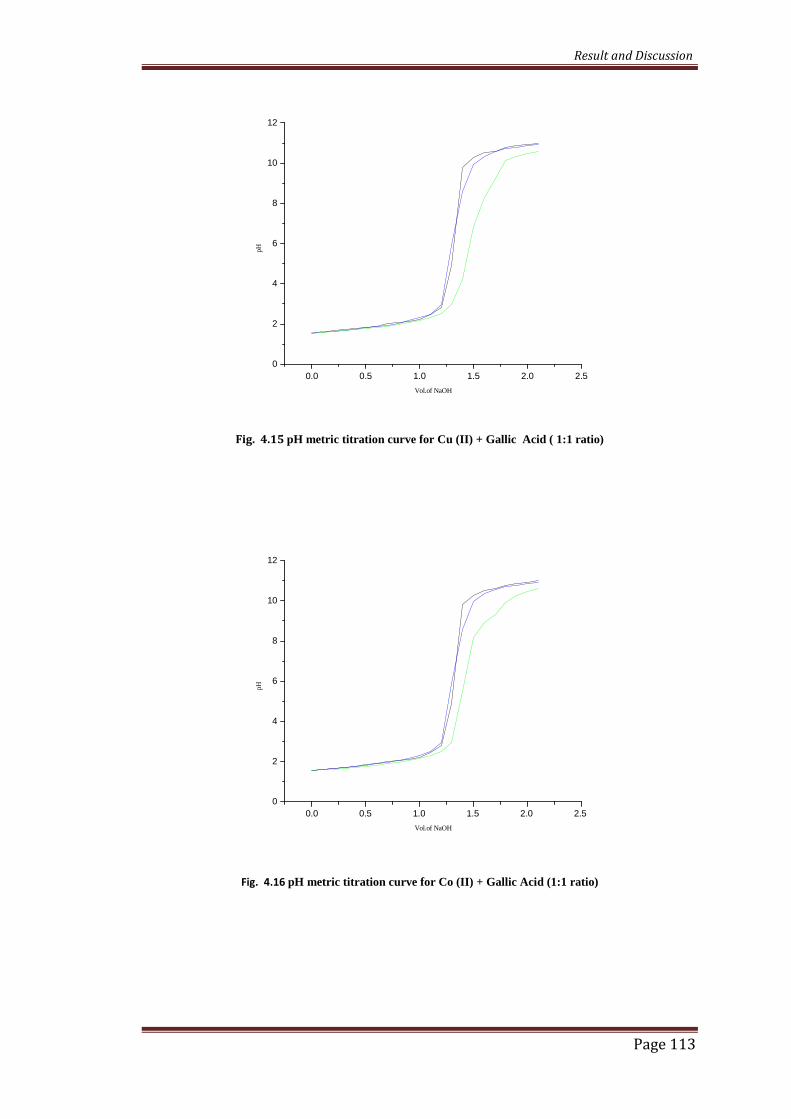
Fig. 4.17 pH metric titration curve for Zn (II) + Gallic Acid (1:1 ratio)
Fig. 4.18 pH metric titration curve for Cd(II) + Gallic Acid (1:1 ratio)
0.0 0.5 1.0 1.5 2.0 2.5
0
2
4
6
8
10
12
pH
Vol.of NaOH
0.0 0.5 1.0 1.5 2.0 2.5
0
2
4
6
8
10
12
pH
Vol.of NaOH
Result and Discussion
Page 115
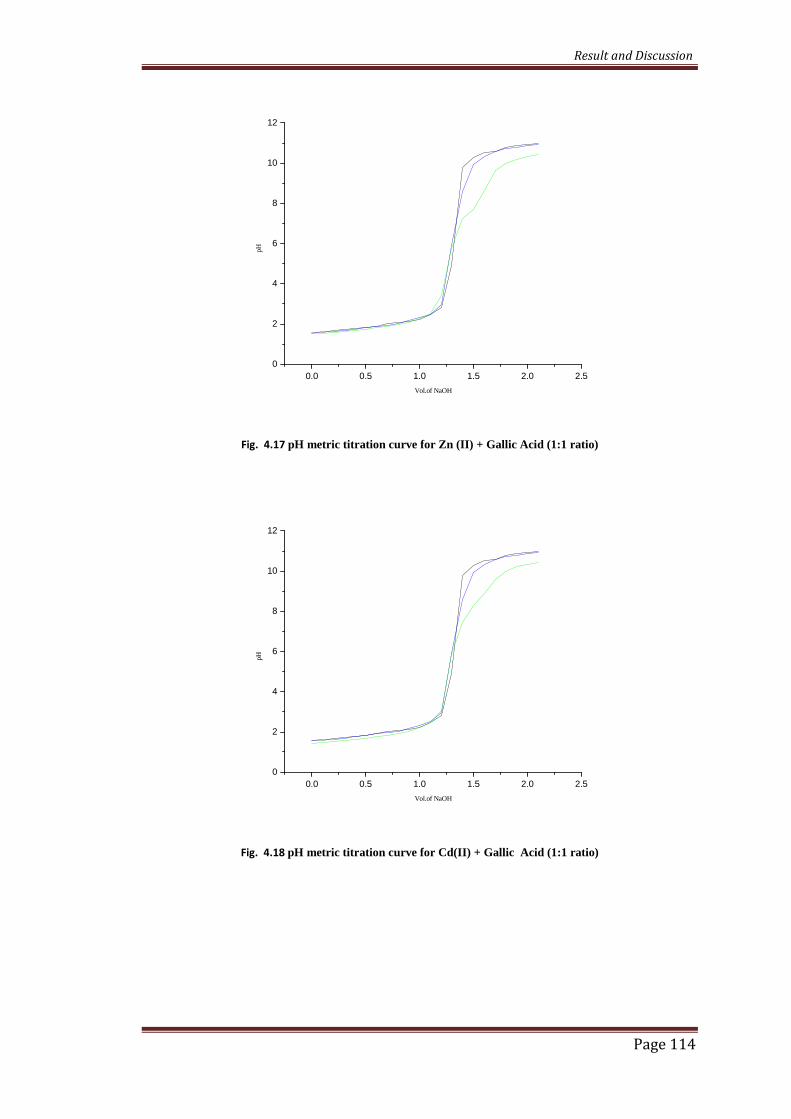
Fig. 4.19 pH metric titration curve for Fe (III) + Gallic Acid (1:1 ratio)
Fig. 4.20 pH metric titration curve for Ni (II) + Gallic Acid (1:1 ratio)
0.0 0.5 1.0 1.5 2.0 2.5
0
2
4
6
8
10
12
pH
Vol.of NaOH
0.0 0.5 1.0 1.5 2.0 2.5
0
2
4
6
8
10
12
pH
Vol.of NaOH
Result and Discussion
Page 116
Fig. 4.21 nA vs. pH for Gallic Acid
3 4 5 6 7 8 9 10
0.0
0.2
0.4
0.6
0.8
1.0
1.2
1.4
1.6
1.8
nA
pH
Gallic acid
Result and Discussion
Page 117
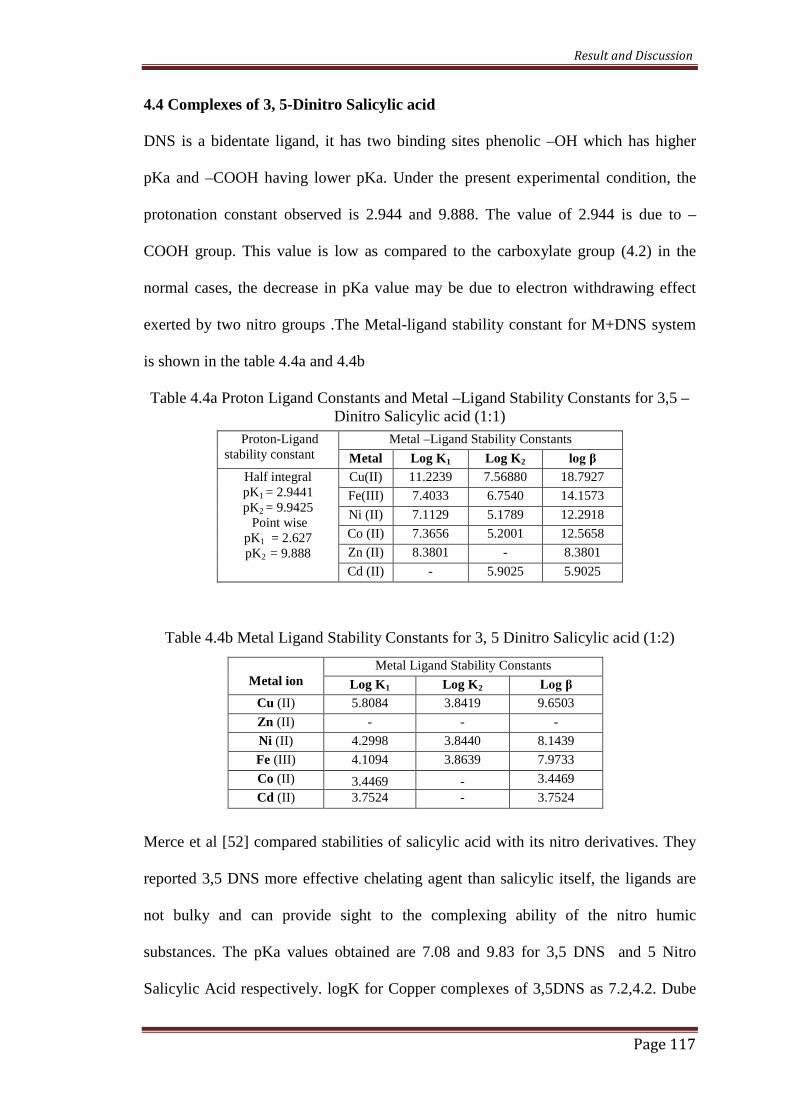
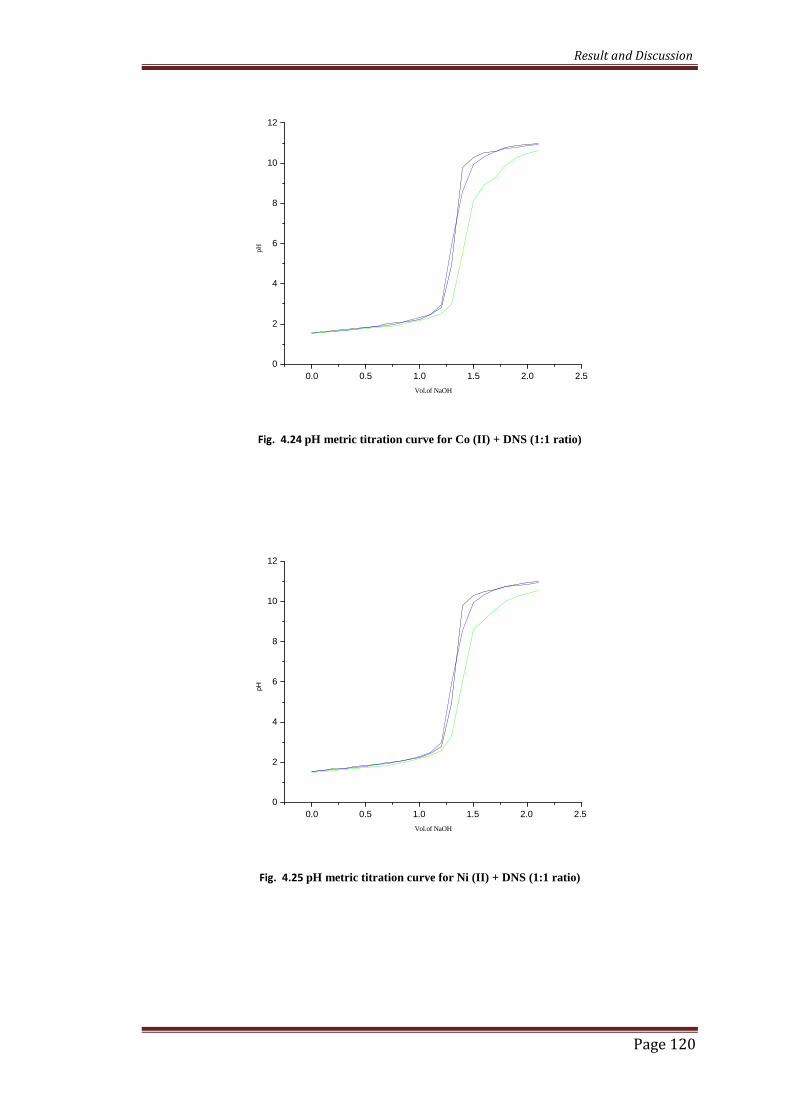
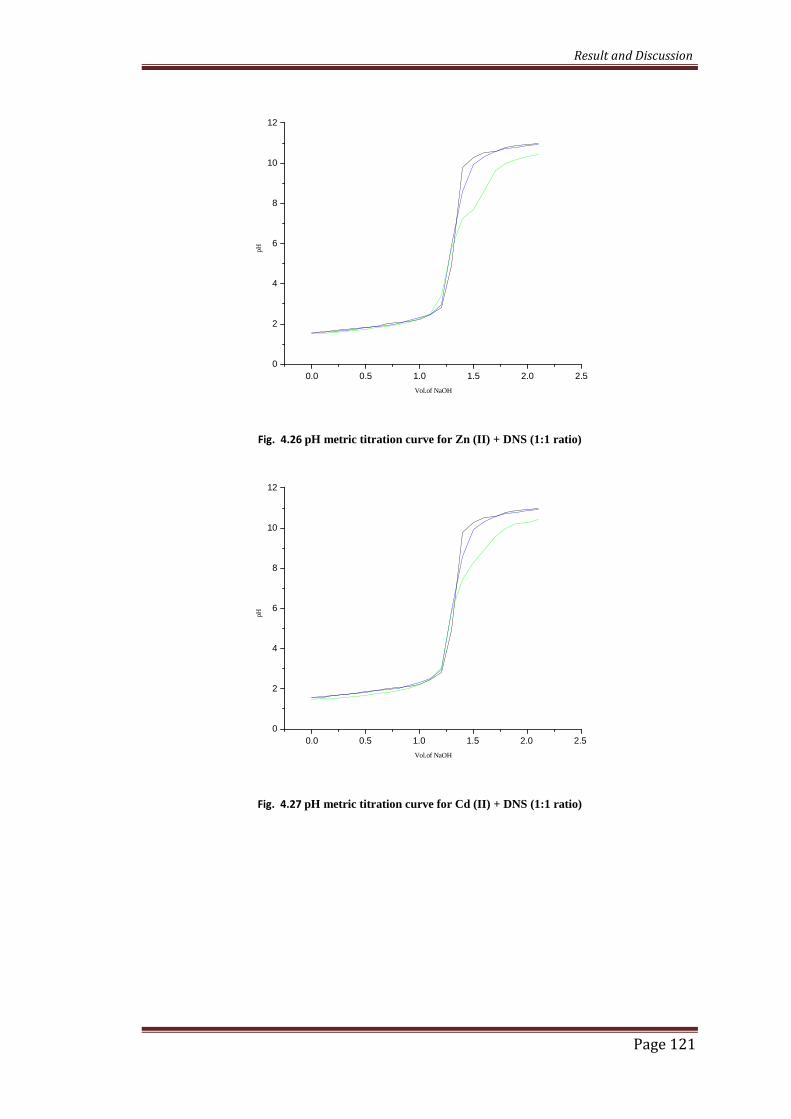
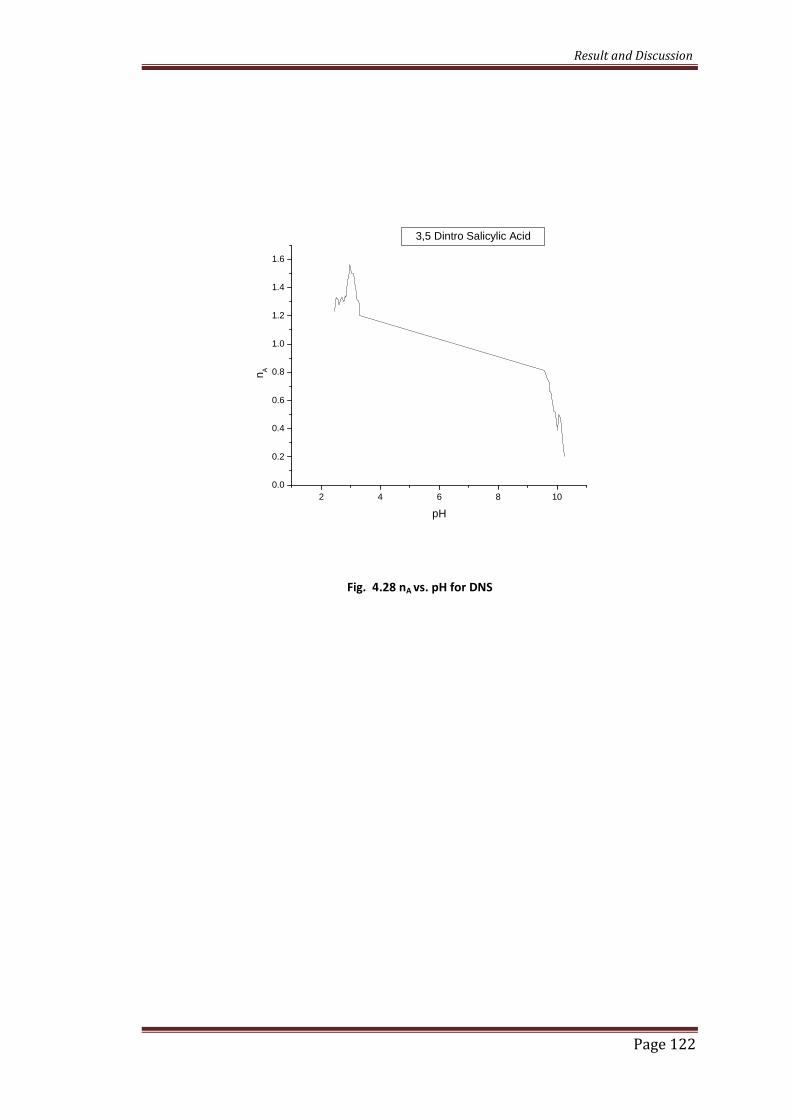
4.4 Complexes of 3, 5-Dinitro Salicylic acid
DNS is a bidentate ligand, it has two binding sites phenolic –OH which has higher
pKa and –COOH having lower pKa. Under the present experimental condition, the
protonation constant observed is 2.944 and 9.888. The value of 2.944 is due to –
COOH group. This value is low as compared to the carboxylate group (4.2) in the
normal cases, the decrease in pKa value may be due to electron withdrawing effect
exerted by two nitro groups .The Metal-ligand stability constant for M+DNS system
is shown in the table 4.4a and 4.4b
Table 4.4a Proton Ligand Constants and Metal –Ligand Stability Constants for 3,5 –Dinitro Salicylic acid (1:1)
Table 4.4b Metal Ligand Stability Constants for 3, 5 Dinitro Salicylic acid (1:2)
Merce et al [52] compared stabilities of salicylic acid with its nitro derivatives. They
reported 3,5 DNS more effective chelating agent than salicylic itself, the ligands are
not bulky and can provide sight to the complexing ability of the nitro humic
substances. The pKa values obtained are 7.08 and 9.83 for 3,5 DNS and 5 Nitro
Salicylic Acid respectively. logK for Copper complexes of 3,5DNS as 7.2,4.2. Dube
Proton-Ligandstability constant
Metal –Ligand Stability Constants
Metalion
Log K1 Log K2 log β
Half integralpK1 = 2.9441pK2 = 9.9425
Point wisepK1 = 2.627pK2 = 9.888
Cu(II) 11.2239 7.56880 18.7927
Fe(III) 7.4033 6.7540 14.1573
Ni (II) 7.1129 5.1789 12.2918
Co (II) 7.3656 5.2001 12.5658
Zn (II) 8.3801 - 8.3801
Cd (II) - 5.9025 5.9025
Metal ionMetal Ligand Stability Constants
Log K1 Log K2 Log β
Cu (II) 5.8084 3.8419 9.6503
Zn (II) - - -
Ni (II) 4.2998 3.8440 8.1439
Fe (III) 4.1094 3.8639 7.9733
Co (II) 3.4469 - 3.4469
Cd (II) 3.7524 - 3.7524
Result and Discussion
Page 118
and Dhindsa [53] worked on complexes of 3,5 DNS with different metal ions and
reported formation of 1:1 complexes, the order of stability reported by them is Cu(II)
> Ni(II) > Co(II) > Zn(II) > Mn(II). Salicylic acid (SA) has pKa values as 2.84 and
13.66. Abd Gaber et al [54] studied the complexes of SA with nontransition metal
ions in aqueous medium. The pKa values found are 1.31,7.00 and 2.49 , 12.00 for 3,5
DNS and 5-sulpho salicylic acid respectively. Decrease in pKa may be due to
attachment of two electron withdrawing nitro groups in case of 3,5 DNS. The
complexes of salicylic acid derivatives are studied the high stabilities for Copper and
Nickel complexes are observed. pKa value for benzoic acid 4.20 and phenol 10.00
are reported in literature. The values of Proton ligand constant (pKa) obtained are in
agreement with literature values. [55]. Some variations may be due to different
experimental condition. Stability values reported are in agreement with the literature
reported values. Among ligands high values of stability for the ligand 3,5 DNS with
lanthanides has been found. Shelke and Jahagirdar [56] worked on Neodymium
complexes with stability constant 3.33, 14.20 for 4-hydroxy salicylic acid and
formation of 1:1 complexes was observed. Faraji et al [57] determined pKa values of
salicylic acid and 5-nitro salicylic acid in ethanolic medium as 2.916 and 2.017
respectively. For the present investigation the order of stability found to be
Cu(II) > Zn(II) > Ni(II) > Cd(II) > Co(II) > Fe(III) for 1:1 complexes
and Cu(II) > Ni(II) > Fe(III) > Cd(II) > Co (II) for 1:2 complexes.
Result and Discussion
Page 119
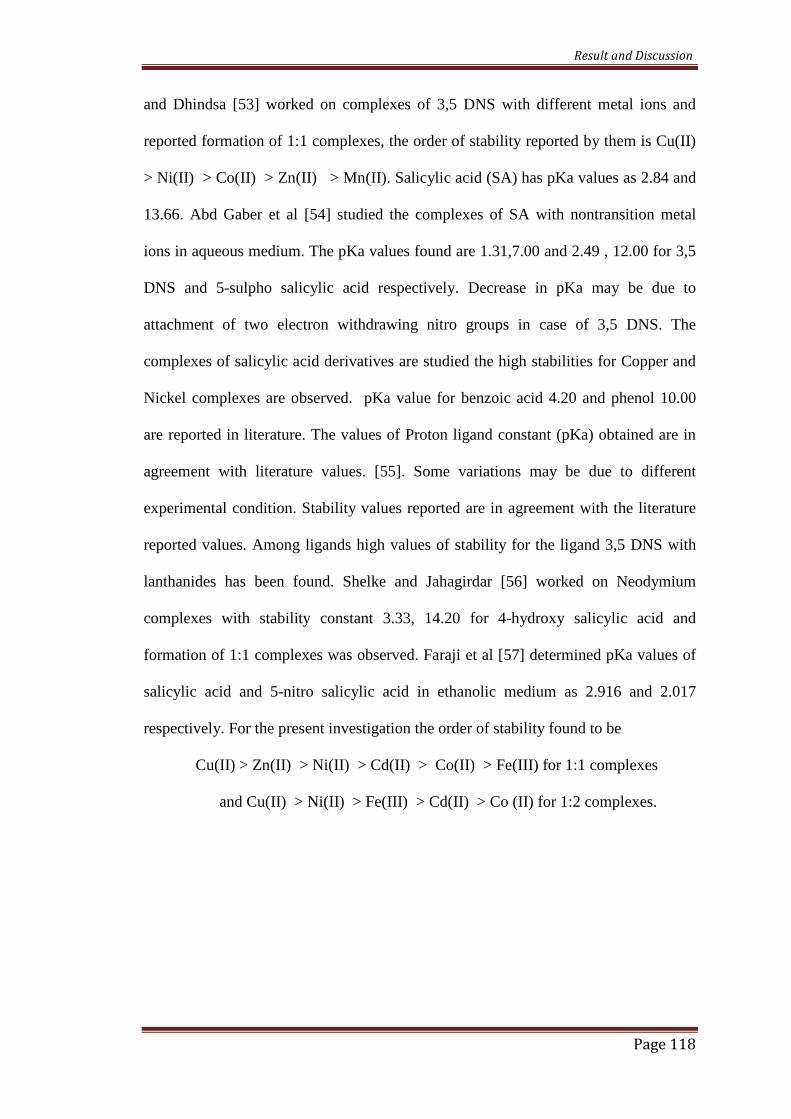
Fig. 4.22 pH metric titration curve for Cu (II) + DNS (1:1 ratio)
Fig. 4.23 pH metric titration curve for Fe (III) + DNS (1:1 ratio)
0.0 0.5 1.0 1.5 2.0 2.5
0
2
4
6
8
10
12
pH
Vol.of NaOH
0.0 0.5 1.0 1.5 2.0 2.5
0
2
4
6
8
10
12
pH
Vol.of NaOH
Result and Discussion
Page 120
Fig. 4.24 pH metric titration curve for Co (II) + DNS (1:1 ratio)
Fig. 4.25 pH metric titration curve for Ni (II) + DNS (1:1 ratio)
0.0 0.5 1.0 1.5 2.0 2.5
0
2
4
6
8
10
12
pH
Vol.of NaOH
0.0 0.5 1.0 1.5 2.0 2.5
0
2
4
6
8
10
12
pH
Vol.of NaOH
Result and Discussion
Page 121
Fig. 4.26 pH metric titration curve for Zn (II) + DNS (1:1 ratio)
Fig. 4.27 pH metric titration curve for Cd (II) + DNS (1:1 ratio)
0.0 0.5 1.0 1.5 2.0 2.5
0
2
4
6
8
10
12
pH
Vol.of NaOH
0.0 0.5 1.0 1.5 2.0 2.5
0
2
4
6
8
10
12
pH
Vol.of NaOH
Result and Discussion
Page 122
Fig. 4.28 nA vs. pH for DNS
2 4 6 8 10
0.0
0.2
0.4
0.6
0.8
1.0
1.2
1.4
1.6n
A
pH
3,5 Dintro Salicylic Acid
Result and Discussion
Page 123
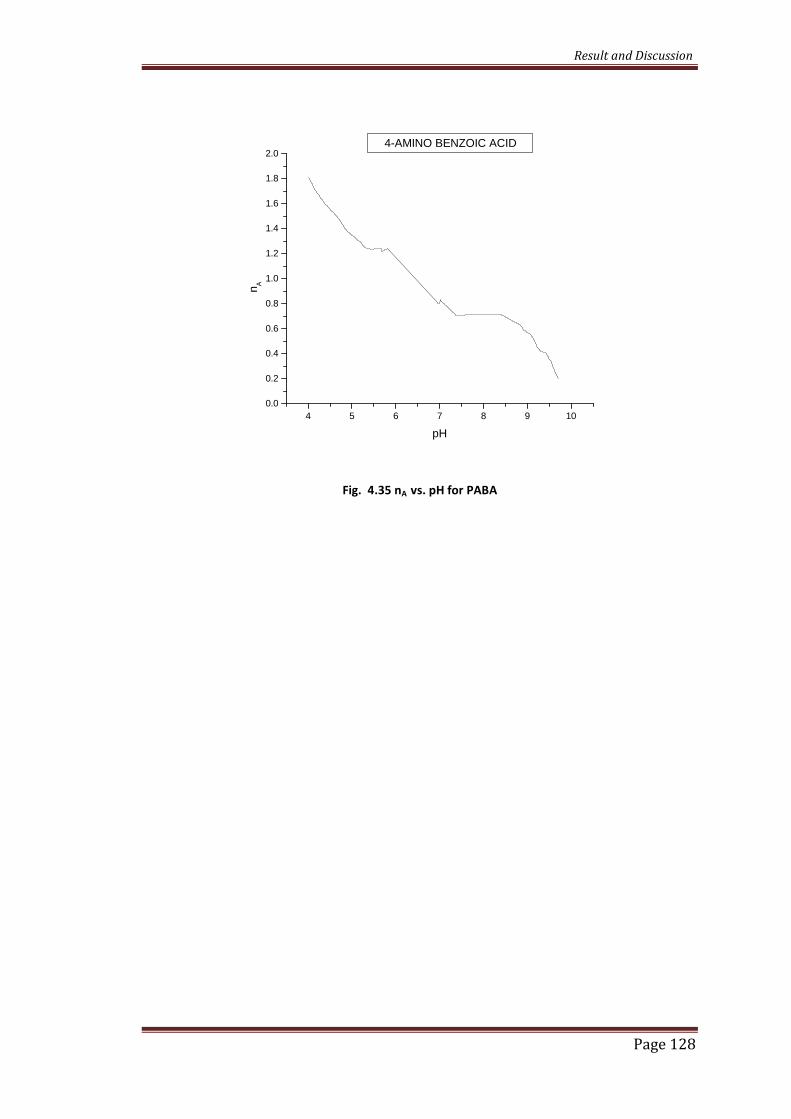
4.5 Complexes of 4-Amino-Benzoic Acid
The ligand 4-Amino Benzoic acid has two ionisable groups –COOH and –NH2. In the
present investigation the observed value of pKH for PABA are 9.1654 & 4.6449. The
value of protonation constant 4.6449 may be due to ionization of –COOH group
observed in many acids benzoic acid salicylic acid and the protonation constant
9.1614 may be due to ionisation of –NH2 group observed in case of amines. The
observed value of pKa for PABA are in agreement with literature [58].
The order of stability towards complexation with PABA is
Fe(III) > Ni(II) > Cu(II) > Cd(II) > Zn(II) > Co(II) for 1:1 complexes and
Co(II) > Cu(II) > Fe(III) > Ni(II) > Zn(II) > Cd (II) for 1:2 complexes.
The order is in agreement with Irving Williams natural order. The metal ligand
stability constants of PABA with metal ions are given in the table 4.5a & 4.5b.
Table 4.5a Proton Ligand Constant and Metal Ligand Stability Constants for 4-AminoBenzoic Acid (1:1)
Table 4.5b Metal-ligand Stability constants of 4-aminobenzoic acid (1:2)
Proton LigandConstant
Metal Ligand Stability Constants
Metal ion Log K1 Log K2 Log β
Half integralpK1 = 4.6485pK2 = 9.1620Point wise
pK1 = 4.776pK2 = 8.880
Cu (II) 6.7243 6.4397 13.2129
Zn (II) 5.9446 5.5661 11.5107
Ni (II) 13.0085 4.3775 17.3166
Fe (III) 11.4881 10.5396 22.0277
Co (II) 4.5264 4.3369 8.8634
Cd (II) 6.8998 4.9594 11.8811
Metal ionsMetal-ligand Stability constants
Log K1 Log K2 Log β
Cu (II) 3.7159 3.2199 6.9359
Zn (II) 3.1246 3.1213 6.2460
Ni (II) 3.0666 3.1184 6.2690
Fe (III) 3.1574 3.1443 6.3017
Co (II) 3.2331 3.8327 7.0658
Cd (II) 3.1201 3.1121 6.2323
Result and Discussion
Page 124
F.B.Ansari et al [59] studied stability complexes of PABA with transition metals and
reported only one value of pKa 5.913 and they observed high value of stability for
Cobalt complexes than Nickel complexes, more stability for 1:2 complexes of Nickel
was observed. Abd-El Wahed et al [60] studied thermodynamic and electrical
properties of aminophenol and anthranillic acid (ANA), the complexes of ANA more
stable than aminophenol. The order of stability towards
ANA is Mn(II) < Fe(II) < Ni(II) < Cu(II).
The two pKa values for ANA as 8.37 and 4.45. Erzalina Hernowo reported two values
of pKa for norleucine having two protonation sites i.e.-COOH and –NH2 as 2.35 and
9.35. H. N. Aliyu and J. Naaliya [61] studied stability constants of eleven amino acids
with manganese ions. The high values of stability constants indicating formation of
stable complexes. The values of stepwise stability constants decrease in the order as
log K1 > log K2 > log K3.
Thakur S.V. et al [62] worked on complexes of adenosine (AD), determined
protonation constant as 3.292 for –OH group and 11.659 for –NH2 group. They found
the formation of 1:1 and 1:2 complexes. Shashi Agrawal and Satyendra singh [63]
studied metal complexes of glycil glycine, reported pKa as 3.1 and 8.1. Kayande et al
[64] studied complexation of amino acids and reported two pKa for glycine (2.34,
9.60) and penicillamine (1.8, 10.7) and valine (2.32, 9.62), lower value may be due
to dissociation of –COOH group and higher due to –NH2 group. Vighe et al [65]
studied effect of ionic strength on stability constant of Co (II) prolyl alanine
complexes, pKa found to be 6.80 and 10.67. They observed formation of 1:1, 1:2
complexes with high value of stabilities. Fatma Hassan [66] studied mixed ligand
complexes of metals with Schiffs bases and cysteine and determined the two pKa
values for cysteine as 7.7 (-COOH) and 8.8 (-NH2 group). Highest value of stability
Result and Discussion
Page 125
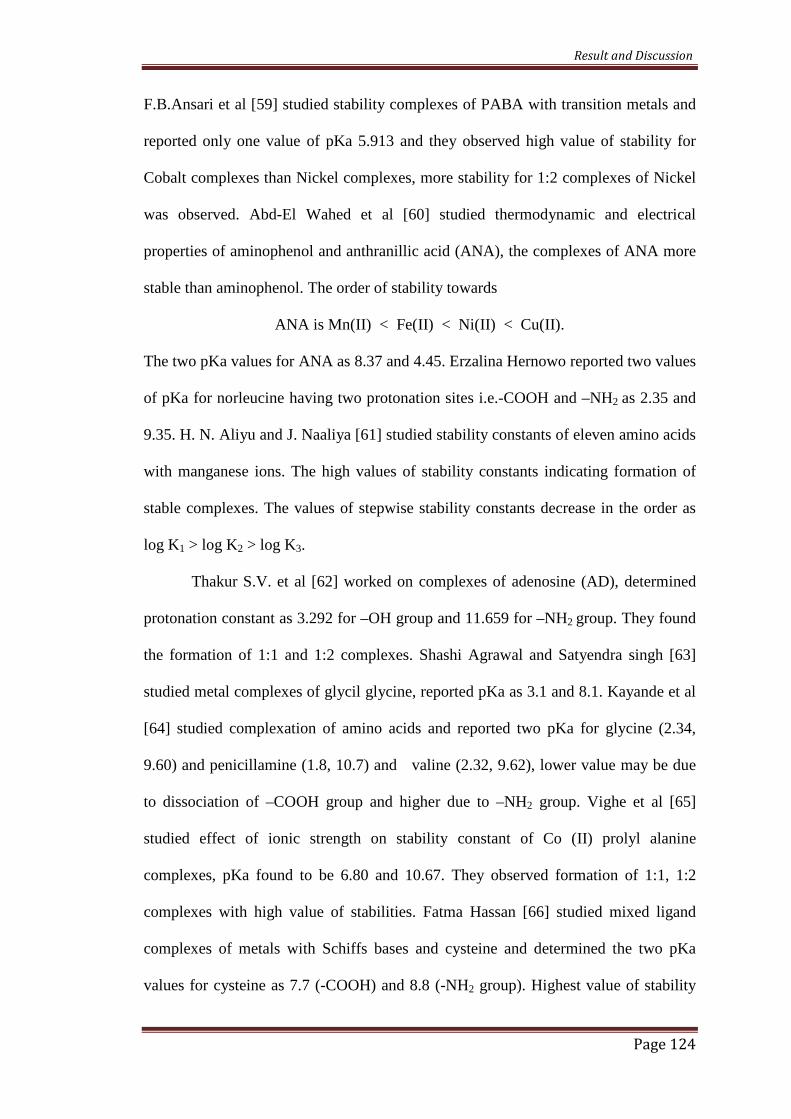
observed for iron (III) complexes which in agreement with literature. [67].The
transition metal ions because of availability of d-orbital give rise to a large number of
stable complexes.
Fig. 4.29 Potentiometric titration curve for Zn (II) + PABA (1:1 ratio)
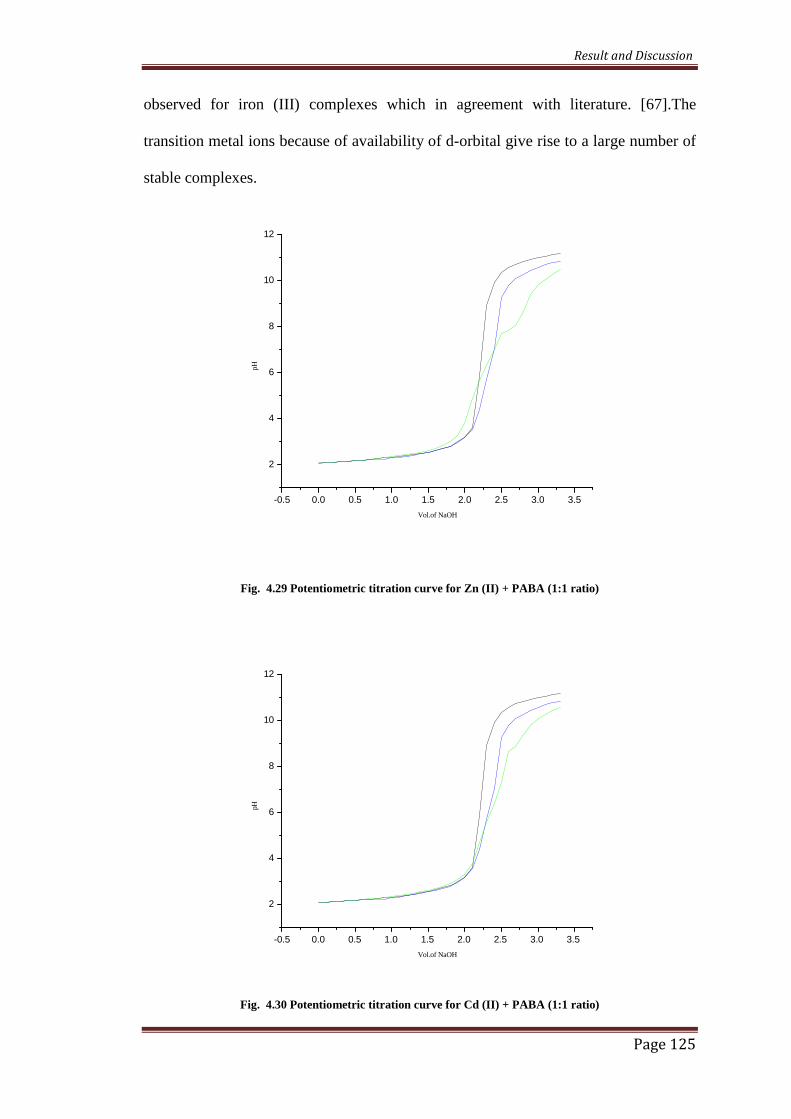
Fig. 4.30 Potentiometric titration curve for Cd (II) + PABA (1:1 ratio)
-0.5 0.0 0.5 1.0 1.5 2.0 2.5 3.0 3.5
2
4
6
8
10
12
pH
Vol.of NaOH
-0.5 0.0 0.5 1.0 1.5 2.0 2.5 3.0 3.5
2
4
6
8
10
12
pH
Vol.of NaOH
Result and Discussion
Page 126
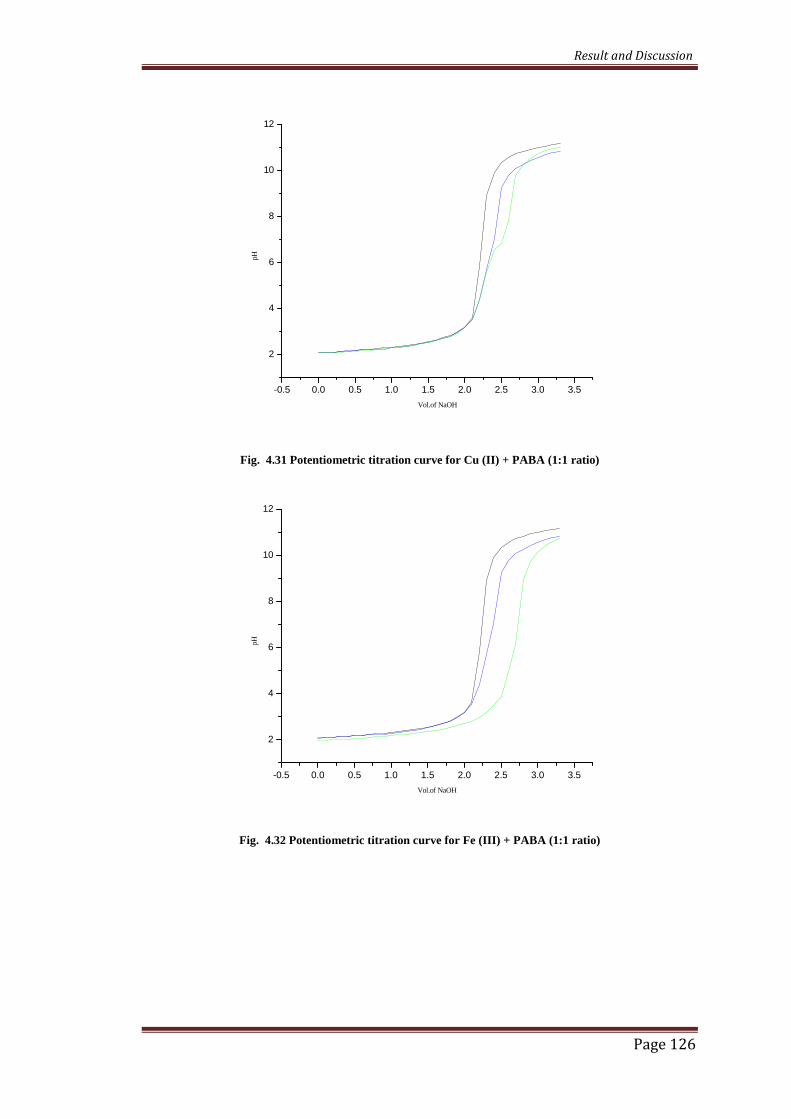
Fig. 4.31 Potentiometric titration curve for Cu (II) + PABA (1:1 ratio)
Fig. 4.32 Potentiometric titration curve for Fe (III) + PABA (1:1 ratio)
-0.5 0.0 0.5 1.0 1.5 2.0 2.5 3.0 3.5
2
4
6
8
10
12
pH
Vol.of NaOH
-0.5 0.0 0.5 1.0 1.5 2.0 2.5 3.0 3.5
2
4
6
8
10
12
pH
Vol.of NaOH
Result and Discussion
Page 127
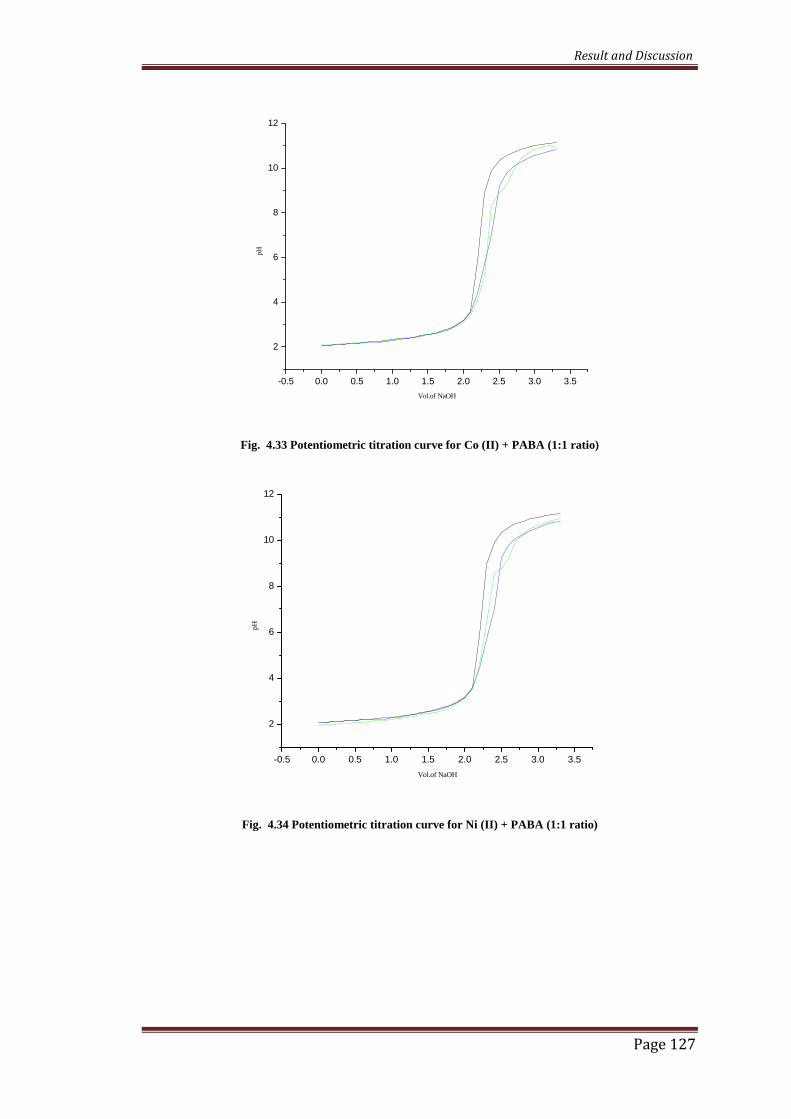
Fig. 4.33 Potentiometric titration curve for Co (II) + PABA (1:1 ratio)
Fig. 4.34 Potentiometric titration curve for Ni (II) + PABA (1:1 ratio)
-0.5 0.0 0.5 1.0 1.5 2.0 2.5 3.0 3.5
2
4
6
8
10
12
pH
Vol.of NaOH
-0.5 0.0 0.5 1.0 1.5 2.0 2.5 3.0 3.5
2
4
6
8
10
12
pH
Vol.of NaOH
Result and Discussion
Page 128
Fig. 4.35 nA vs. pH for PABA
4 5 6 7 8 9 10
0.0
0.2
0.4
0.6
0.8
1.0
1.2
1.4
1.6
1.8
2.0
nA
pH
4-AMINO BENZOIC ACID
Result and Discussion
Page 129
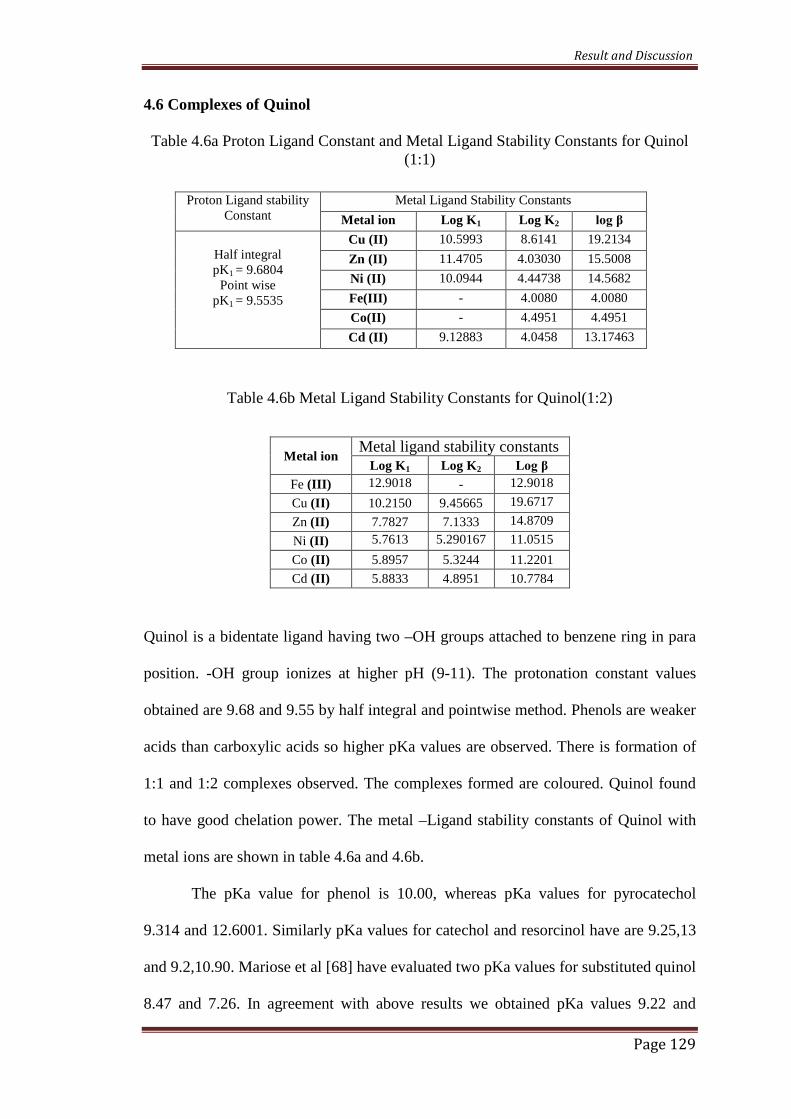
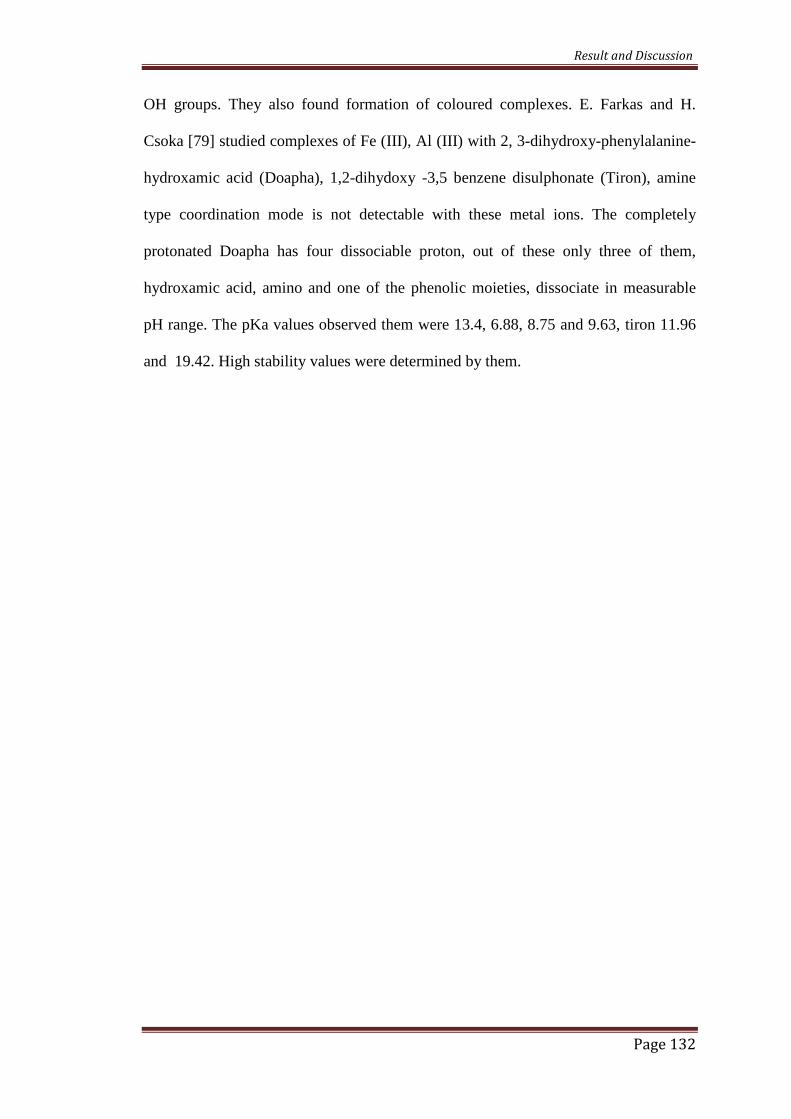
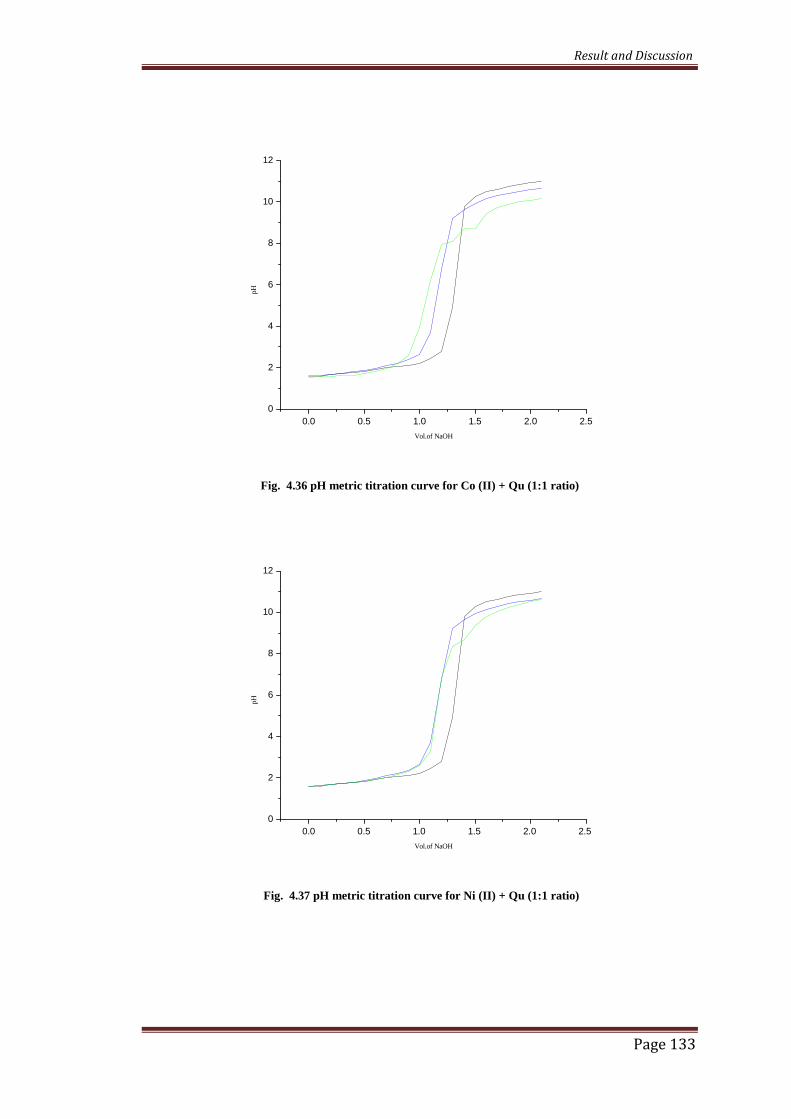
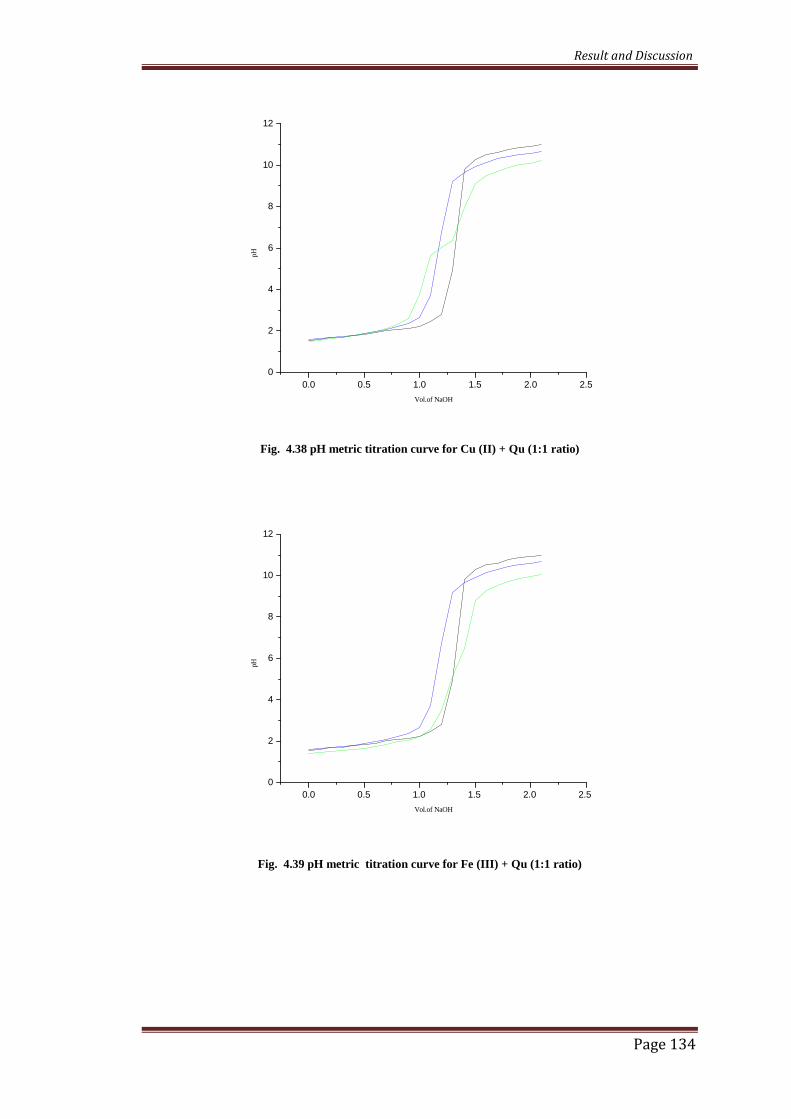
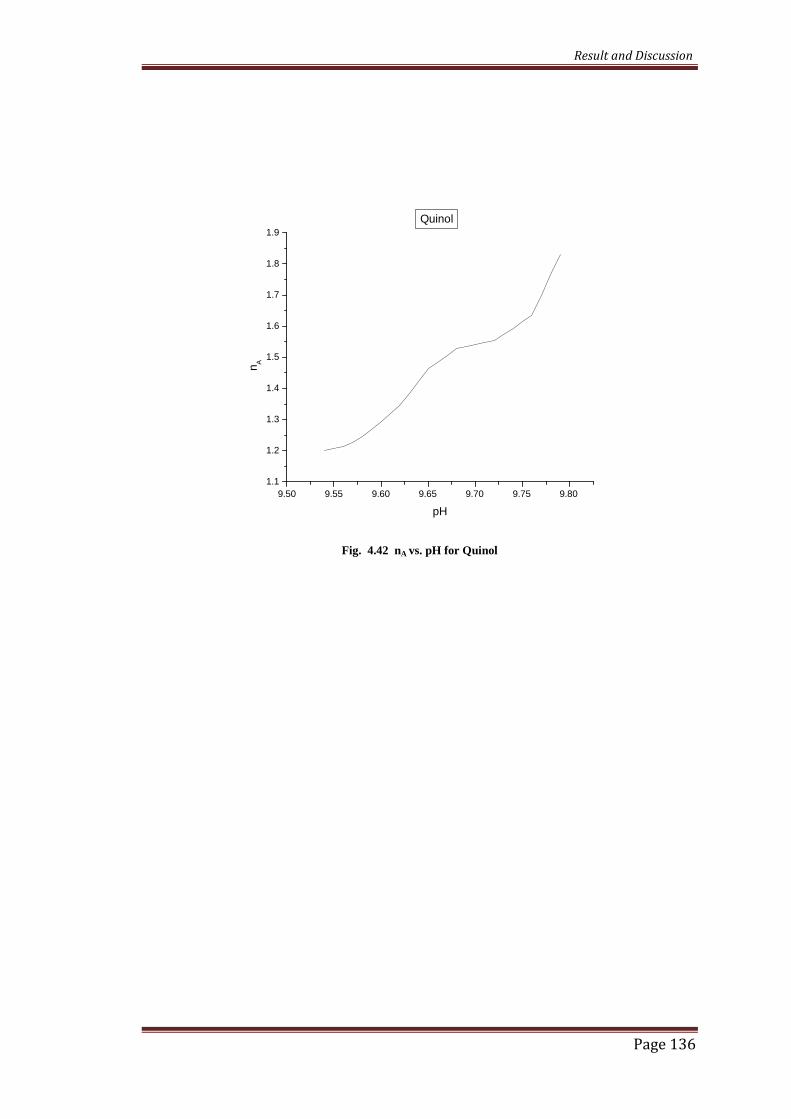
4.6 Complexes of Quinol
Table 4.6a Proton Ligand Constant and Metal Ligand Stability Constants for Quinol(1:1)
Table 4.6b Metal Ligand Stability Constants for Quinol(1:2)
Quinol is a bidentate ligand having two –OH groups attached to benzene ring in para
position. -OH group ionizes at higher pH (9-11). The protonation constant values
obtained are 9.68 and 9.55 by half integral and pointwise method. Phenols are weaker
acids than carboxylic acids so higher pKa values are observed. There is formation of
1:1 and 1:2 complexes observed. The complexes formed are coloured. Quinol found
to have good chelation power. The metal –Ligand stability constants of Quinol with
metal ions are shown in table 4.6a and 4.6b.
The pKa value for phenol is 10.00, whereas pKa values for pyrocatechol
9.314 and 12.6001. Similarly pKa values for catechol and resorcinol have are 9.25,13
and 9.2,10.90. Mariose et al [68] have evaluated two pKa values for substituted quinol
8.47 and 7.26. In agreement with above results we obtained pKa values 9.22 and
Proton Ligand stabilityConstant
Metal Ligand Stability Constants
Metal ion Log K1 Log K2 log β
Half integralpK1 = 9.6804
Point wisepK1 = 9.5535
Cu (II) 10.5993 8.6141 19.2134
Zn (II) 11.4705 4.03030 15.5008
Ni (II) 10.0944 4.44738 14.5682
Fe(III) - 4.0080 4.0080
Co(II) - 4.4951 4.4951
Cd (II) 9.12883 4.0458 13.17463
Metal ionMetal ligand stability constants
Log K1 Log K2 Log β
Fe (III) 12.9018 - 12.9018
Cu (II) 10.2150 9.45665 19.6717
Zn (II) 7.7827 7.1333 14.8709
Ni (II) 5.7613 5.290167 11.0515
Co (II) 5.8957 5.3244 11.2201
Cd (II) 5.8833 4.8951 10.7784
Result and Discussion
Page 130
9.680 for quinol molecule. Nasreen Fatima and Zahida T.Maqsood have reported high
stability values for colored complexes of catechol, gallic acid and gallic ester with
vanadium. High value of stabilities indicates strong chelation power of the ligand.
These High value of stability for Cu(II) may be due Jahn-Teller effect.
The order of stability observed is
Cu(II) > Zn(II) > Fe(III) > Co(II) > Ni(II) > Cd(II) for 1:1 complexes
and 1:2 complexes to be in Fe(III) > Cu(II) > Zn(II) > Co(II) > Ni(II) > Cd(II).
The order is in agreement with the Irving Williams order and reported by many
workers [69, 70]. The stability constant value varies with the ionic size of metal ion.
The smaller the ionic radius of the central atom, more stable is the complex formed. It
also depends upon experimental conditions used.
Nina S. et al [71] studied chemical properties of catechol, reported formation
of stable complexes of catechol with divalent and trivalent ions. They observed more
stabilty of Fe (III) complexes than Cu(II). The Log K1 > log K2 indicates a decrease in
bond strength with successive attachment of ligand molecules, and the observed small
differences between two values suggest the trans configuration of the chelates, such
effect is in agreement with studies of P. Venugopal and Krishnamurty K.[72]
Catechol having nearly identical pK1 and pK2 and involve complexation through –OH
group and formation of coloured complexes. The pKa values of catechol are 9.334
and 12.60. Formation of stable complexes with transition metals specially with Fe
(III) has been reported. Balraj Reddy et al [73] studied complexation of quinolinol and
various ligands with Nickel (II) in dioxane water medium at 300C, reported two pKa
values for catechol 9.43, 11.54. The Potentiometric, thermodynamic studies of
vanillin and transition metal complexes were carried out in 10% ethanol-water
mixture at three temperatures by Mubarak et al [74]. They reported pKa value 8.75
Result and Discussion
Page 131
(250C), 8.59 (350C), 8.42 (450C) due to ionization of –OH group, the stability constant
found to increase in the order Mn (II) < Co (II) < Ni (II) < Zn (II) < Cu (II). This
order largely reflects that the stability of Cu2+ complexes is larger than those of other
metals of the 3d series. Under the influence of the both the polarizing power of the
metal ion and the ligand field copper receive some extra stabilization due to tetragonal
distortion of octahedral symmetry in its complexes.
Potentiometric study of Desferrioxamine B (DFO) derivatives and their iron
complexes, carried by Houn et al [75], reported formation of 1:1 complexes. These
derivatives found to be powerful chelators at pH 7.4, the relative acidity of the ligand
functional groups; hydroxypyridinoate > hydroxamate > Catecholate, pKa values
reported are 9.70, 9.03 ,8.39, high stability values were reported by them. Beda and
Helmut [76] studied ternary complexes of pyrocatechol and BPD like ligands with
transition metal ions, determined two pKa for pyr 9.32, 11.32. The order of stability
reported by them was Cu (II) > Zn (II) > Co (II) > Ni (II).
Rahmiye Aydin and Duygu Inc [77] carried out potentiometric studies of
complexation of Lantanum (III) with catecholamines adrenaline, noradernaline,
dopamine in an aqueous media, reported formation of 1:1 and 1:2 complexes. High
stability of the complexes reported coordination through phenolates sites, pKa values
as 12.93, 9.53 and 8.58.They found that in case of adrenaline, noradernaline,
dopamine the first proton is released from phenolic hydroxyl followed by the
ammonium proton,-NH3+. The catecholamines are tridentate ligands. The protonation
of catecholamine involve the first protonation of the phenolic –OH group followed by
the second and third protonation of amino and second phenolate of caecholate ring.
Potentiometric studies of 3-hydoxy flavones in water-dioxane are investigated by
Montana et al [78], reported two pKa values 8.882 and 11.10 due to dissociation of –
Result and Discussion
Page 132
OH groups. They also found formation of coloured complexes. E. Farkas and H.
Csoka [79] studied complexes of Fe (III), Al (III) with 2, 3-dihydroxy-phenylalanine-
hydroxamic acid (Doapha), 1,2-dihydoxy -3,5 benzene disulphonate (Tiron), amine
type coordination mode is not detectable with these metal ions. The completely
protonated Doapha has four dissociable proton, out of these only three of them,
hydroxamic acid, amino and one of the phenolic moieties, dissociate in measurable
pH range. The pKa values observed them were 13.4, 6.88, 8.75 and 9.63, tiron 11.96
and 19.42. High stability values were determined by them.
Result and Discussion
Page 133
Fig. 4.36 pH metric titration curve for Co (II) + Qu (1:1 ratio)
Fig. 4.37 pH metric titration curve for Ni (II) + Qu (1:1 ratio)
0.0 0.5 1.0 1.5 2.0 2.5
0
2
4
6
8
10
12
pH
Vol.of NaOH
0.0 0.5 1.0 1.5 2.0 2.5
0
2
4
6
8
10
12
pH
Vol.of NaOH
Result and Discussion
Page 134
Fig. 4.38 pH metric titration curve for Cu (II) + Qu (1:1 ratio)
Fig. 4.39 pH metric titration curve for Fe (III) + Qu (1:1 ratio)
0.0 0.5 1.0 1.5 2.0 2.5
0
2
4
6
8
10
12
pH
Vol.of NaOH
0.0 0.5 1.0 1.5 2.0 2.5
0
2
4
6
8
10
12
pH
Vol.of NaOH
Result and Discussion
Page 135
Fig. 4.40 pH metric titration curve for Zn (II) + Qu (1:1 ratio)
Fig. 4.41 pH metric titration curve for Cd (II) + Qu (1:1 ratio)
0.0 0.5 1.0 1.5 2.0 2.5
0
2
4
6
8
10
12
pH
Vol.of NaOH
0.0 0.5 1.0 1.5 2.0 2.5
0
2
4
6
8
10
12
pH
Vol.of NaOH
Result and Discussion
Page 136
Fig. 4.42 nA vs. pH for Quinol
9.50 9.55 9.60 9.65 9.70 9.75 9.80
1.1
1.2
1.3
1.4
1.5
1.6
1.7
1.8
1.9
nA
pH
Quinol
Result and Discussion
Page 137
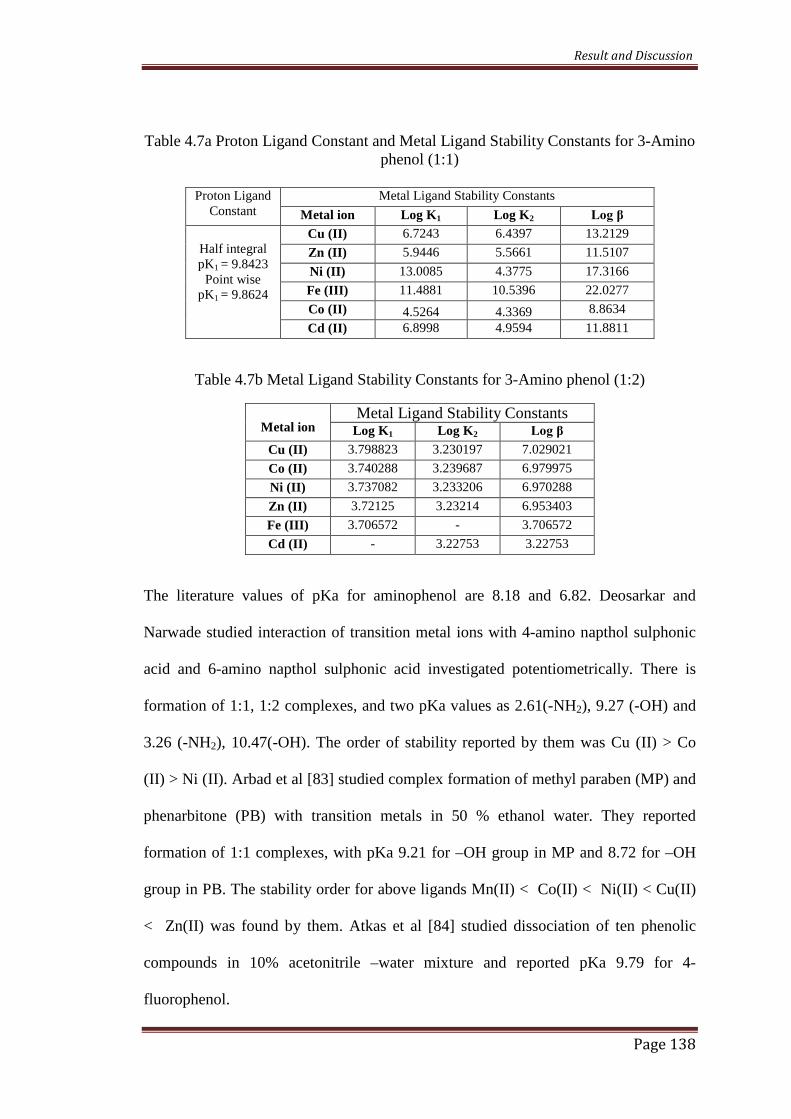
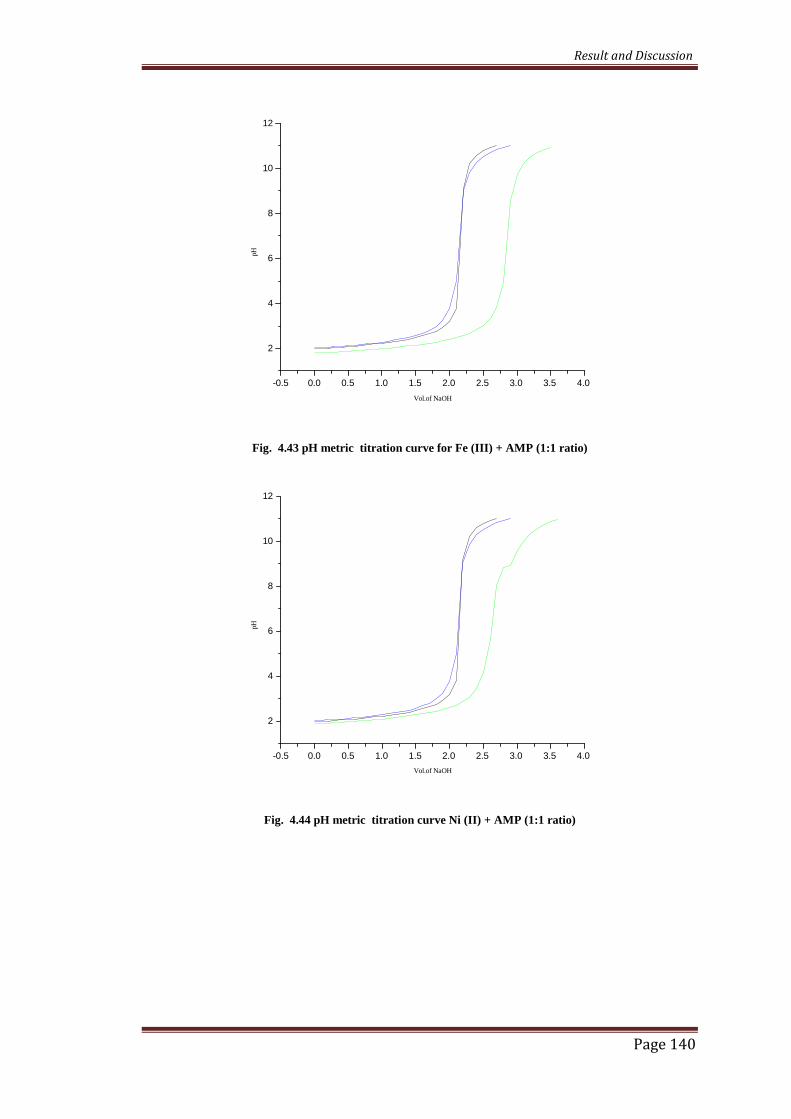
4.7 Complexes of 3-Amino Phenol
The values of An suggests that ligand behaves as monoprotic acid due to
deprotonation of –OH group. The higher pKa value indicate weak deprotonation of
the ligand same as in the case of 2-hydroxy acetophenone and phenol. [80]. From
protonation constant values it appears that AMP dissociates at higher pH in the range
of 9.00. Higher pKa value may be due to presence of aromatic ring. In our studies
pKa value for –NH2 group in AMP is undetectable this is in agreement with earlier
studies. [81]. The basicities of the –NH2 groups in amino pyridines are too weak to be
detected and certainly had no effect on the hydrogen ion concentration in a
moderately acidic range. They observed no pKa value for –NH2 group in 2-amino
pyridine, it has shown only one pKa 6.14 due to protonation of the N of pyridine ring.
The proton ligand stability constant calculated are in agreement with the reported
value. [82]. The pKa value for phenol is 10.00 and that of 3-aminophenol is 9.87. The
decrease in pKa may be due to electron release by amino group. The –NH2 group is an
electron releasing group it weakens the phenol when present in the para position but
strengthens it when in meta position. Binary complexes formed by M : L ratio 1:1 are
more stable than 1:2 ratio.
The order of stability
for 1:1 complexes is Fe(III) > Ni(II) > Cu(II) > Cd(II) > Zn(II) > Co(II) and
for 1:2 complexes is Cu(II) > Co(II) > Ni(II) > Zn(II) > Fe(III) > Cd(II).
The metal–Ligand stability constants of 3-Amino Phenol with metal ions are shown in
table 4.7a and 4.7b.
Result and Discussion
Page 138
Table 4.7a Proton Ligand Constant and Metal Ligand Stability Constants for 3-Aminophenol (1:1)
Table 4.7b Metal Ligand Stability Constants for 3-Amino phenol (1:2)
The literature values of pKa for aminophenol are 8.18 and 6.82. Deosarkar and
Narwade studied interaction of transition metal ions with 4-amino napthol sulphonic
acid and 6-amino napthol sulphonic acid investigated potentiometrically. There is
formation of 1:1, 1:2 complexes, and two pKa values as 2.61(-NH2), 9.27 (-OH) and
3.26 (-NH2), 10.47(-OH). The order of stability reported by them was Cu (II) > Co
(II) > Ni (II). Arbad et al [83] studied complex formation of methyl paraben (MP) and
phenarbitone (PB) with transition metals in 50 % ethanol water. They reported
formation of 1:1 complexes, with pKa 9.21 for –OH group in MP and 8.72 for –OH
group in PB. The stability order for above ligands Mn(II) < Co(II) < Ni(II) < Cu(II)
< Zn(II) was found by them. Atkas et al [84] studied dissociation of ten phenolic
compounds in 10% acetonitrile –water mixture and reported pKa 9.79 for 4-
fluorophenol.
Proton LigandConstant
Metal Ligand Stability Constants
Metal ion Log K1 Log K2 Log β
Half integralpK1 = 9.8423
Point wisepK1 = 9.8624
Cu (II) 6.7243 6.4397 13.2129
Zn (II) 5.9446 5.5661 11.5107
Ni (II) 13.0085 4.3775 17.3166
Fe (III) 11.4881 10.5396 22.0277
Co (II) 4.5264 4.3369 8.8634
Cd (II) 6.8998 4.9594 11.8811
Metal ionMetal Ligand Stability Constants
Log K1 Log K2 Log β
Cu (II) 3.798823 3.230197 7.029021
Co (II) 3.740288 3.239687 6.979975
Ni (II) 3.737082 3.233206 6.970288
Zn (II) 3.72125 3.23214 6.953403
Fe (III) 3.706572 - 3.706572
Cd (II) - 3.22753 3.22753
Result and Discussion
Page 139
Wankhede et al [85] studied chelation tendancy of flavones in 70% acetone :water
media and observed formation of 1:1 and 1:2 complexes. They reported higher pKa
10.60-11.00 for –OH group. The more stability of copper complexes than Nickel
complexes is observed.
Mhaske and Patil studied complexes of Paracetamol and determined pKa
value 9.67 for –OH group in paracetamol. The formation of 1:1 and 1:2 complexes
reported and observed the order of stability for metal chelate as Mn (II) < Co (II) < Ni
(II) < Zn (II). Shaleva et al [86] carried out measurement of pKa values of 105
organic compounds by multiplexed capillary electrophoresis technique, found 9.41
and 9.62 value for paracetamol, alprenol. P. J. Parmar [87] studied pKa values of
pyrazoline (PYZ) and found that mono basic nature of PYZ due to presence of –OH
group. He reported pKa values in the range of 8.00- 9.00.
Rathod S.P. et al [88] synthesized substituted thiazine and studied their
interaction with transition metal ions. These ligands are monobasic have –OH group
and reported pKa value as 9.9 and 11.7. They also found that Cu (II) complexes are
more stable than Co (II) complexes. Naik A.B. et al [89] studied stability of trivalent
metal ions with substituted pyrazolines, reported pKa value as 11.80, 11.58 due to
dissociation of –OH group. J.P.Nehte et al [90] studied interaction of Ribavirin with
metal ions, reported pKa as 9.70 due to dissociation of –OH group. Mittal et al [91]
studied complexation of Schiffs bases of o-amino phenol in ethanolic medium with
transition metal ions; pKa reported were in the range 7.40-7.72 due to ionization of –
OH group.
Result and Discussion
Page 140
Fig. 4.43 pH metric titration curve for Fe (III) + AMP (1:1 ratio)
Fig. 4.44 pH metric titration curve Ni (II) + AMP (1:1 ratio)
-0.5 0.0 0.5 1.0 1.5 2.0 2.5 3.0 3.5 4.0
2
4
6
8
10
12
pH
Vol.of NaOH
-0.5 0.0 0.5 1.0 1.5 2.0 2.5 3.0 3.5 4.0
2
4
6
8
10
12
pH
Vol.of NaOH
Result and Discussion
Page 141
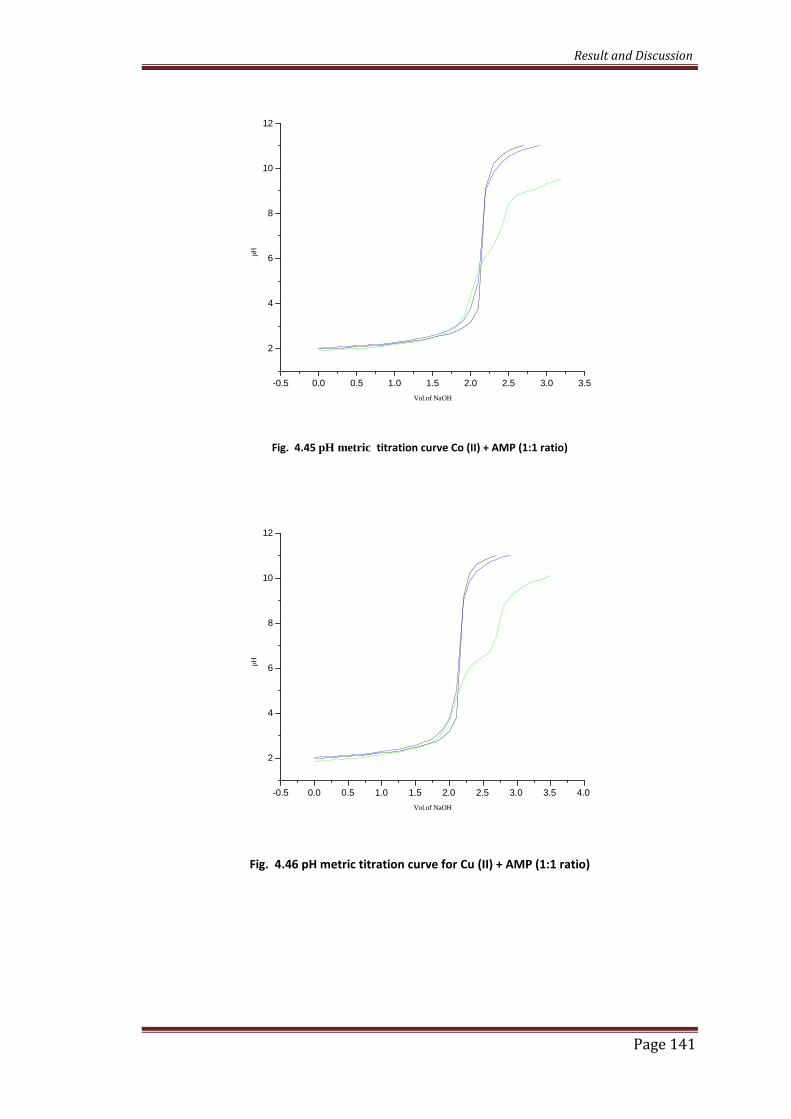
Fig. 4.45 pH metric titration curve Co (II) + AMP (1:1 ratio)
Fig. 4.46 pH metric titration curve for Cu (II) + AMP (1:1 ratio)
-0.5 0.0 0.5 1.0 1.5 2.0 2.5 3.0 3.5
2
4
6
8
10
12
pH
Vol.of NaOH
-0.5 0.0 0.5 1.0 1.5 2.0 2.5 3.0 3.5 4.0
2
4
6
8
10
12
pH
Vol.of NaOH
Result and Discussion
Page 142
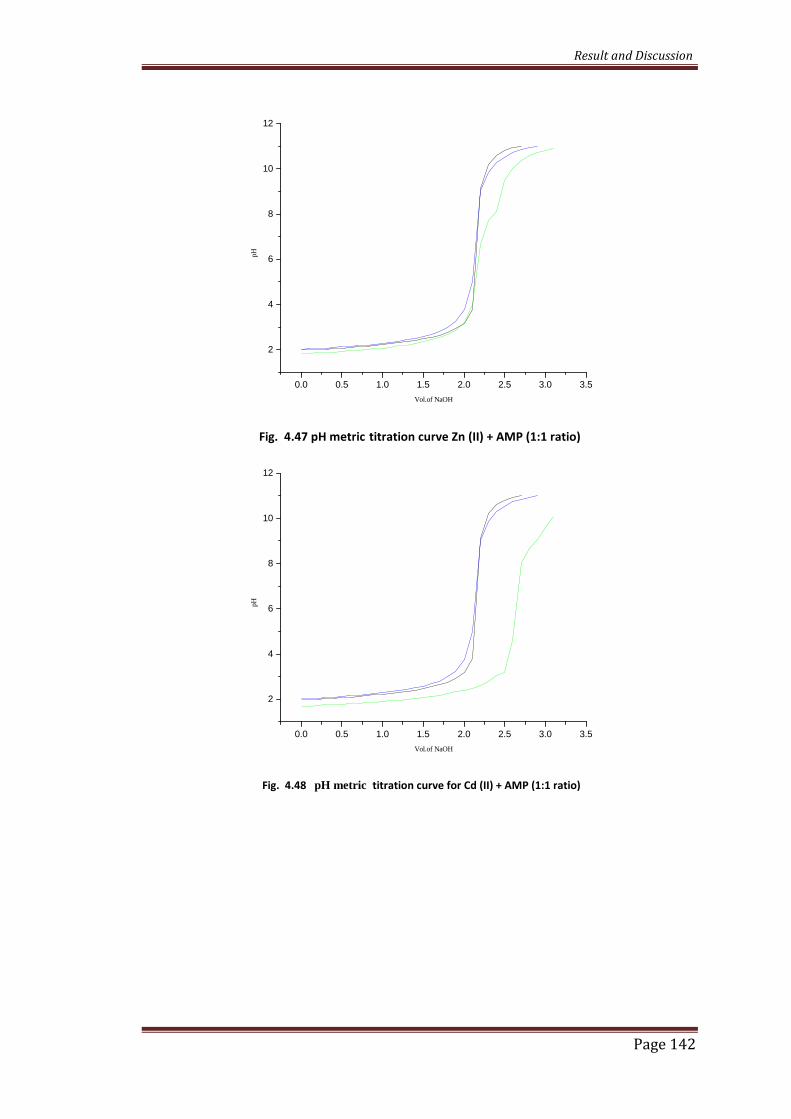
Fig. 4.47 pH metric titration curve Zn (II) + AMP (1:1 ratio)
Fig. 4.48 pH metric titration curve for Cd (II) + AMP (1:1 ratio)
0.0 0.5 1.0 1.5 2.0 2.5 3.0 3.5
2
4
6
8
10
12
pH
Vol.of NaOH
0.0 0.5 1.0 1.5 2.0 2.5 3.0 3.5
2
4
6
8
10
12
pH
Vol.of NaOH
Result and Discussion
Page 143
Fig. 4.49 nA vs. pH for AMP
9.4 9.6 9.8 10.0 10.2 10.4
1.2
1.3
1.4
1.5
1.6
1.7
1.8
1.9
nA
pH
3-Aminophenol
Result and Discussion
Page 144
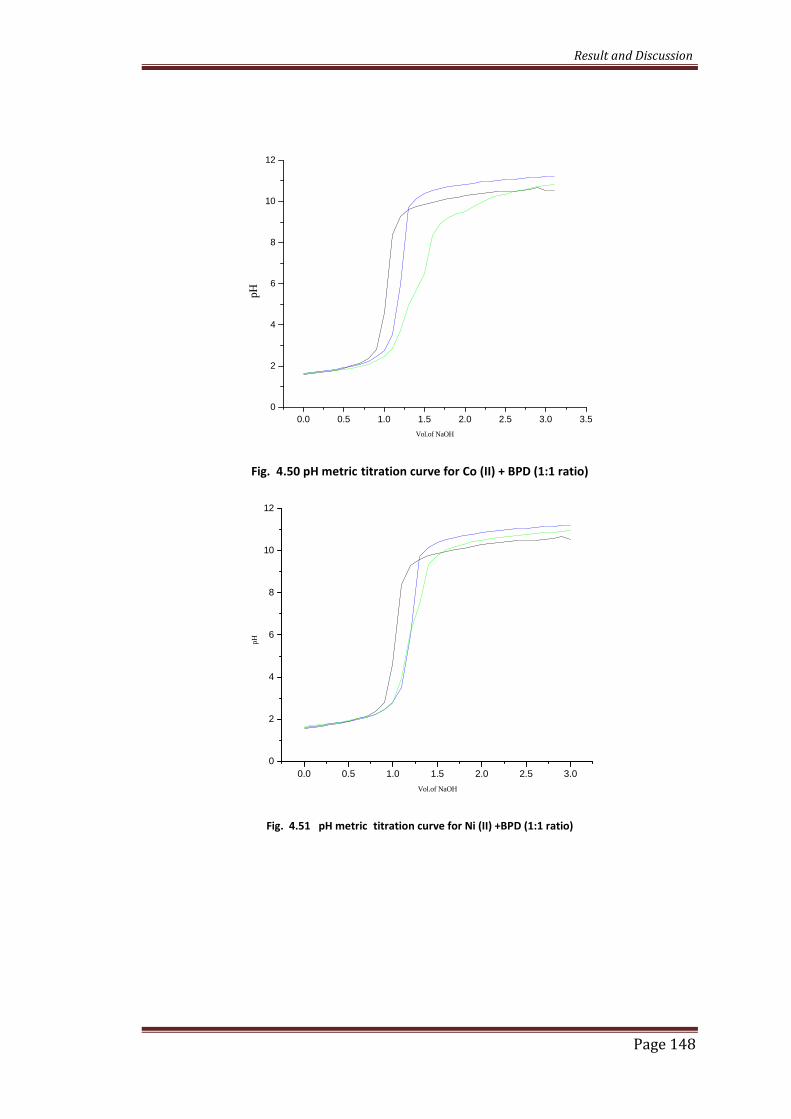
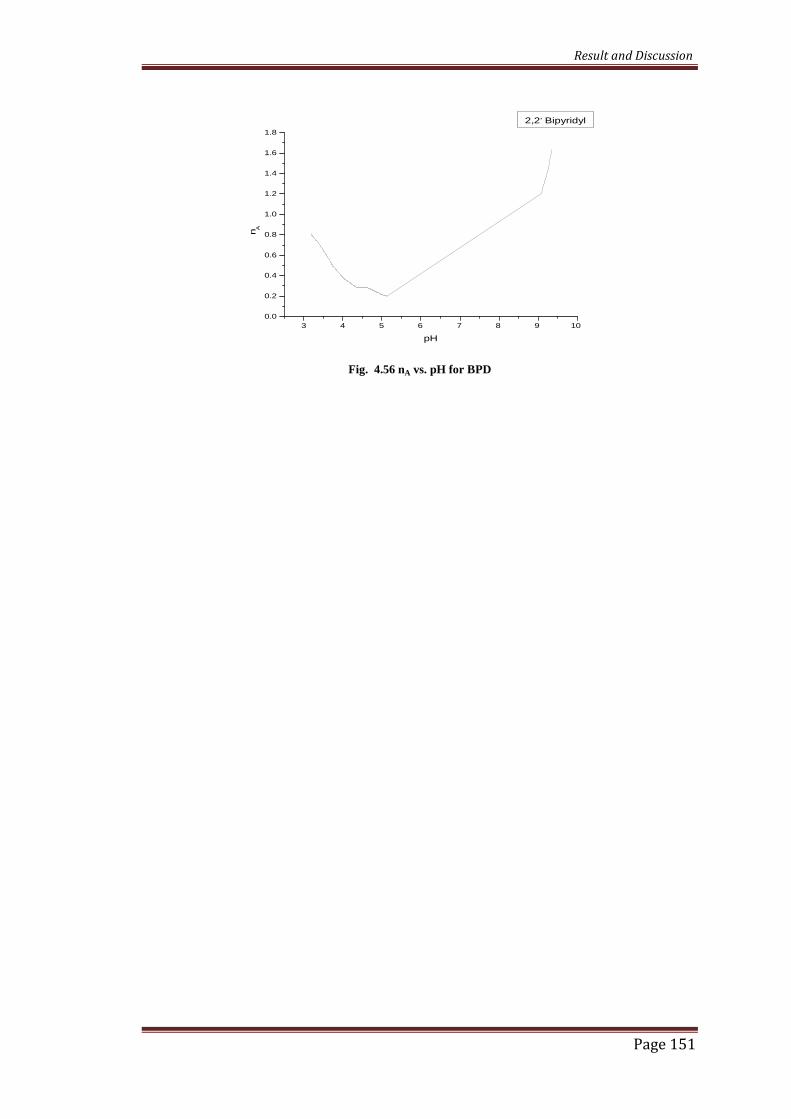
4.8 Complexes of 2, 2 Bipyridyl
2,2 Bipyridyl is used as ligand for the present study. The protonation constant for bpd
observed are 4.300 and 9.264. The ligand used is a bidentate. It provides two aromatic
nitrogen whose unshared electron pairs are properly placed to act cooperatively in
binding metal ions. This ligand is electron defficient they are excellent electron
acceptors. Order of stability constant for present study is
Co (II) > Fe (III) > Cu(II) > Ni(II) > Zn(II) > Cd(II) for 1:1 complexes and
Ni(II) > Cu(II) > Zn(II) > Co(II) > Cd(II) > Fe(III) for 1:2 complexes.
The complexation of 2,2 Bipyridyl with metal under study gives metal ligand stability
constants which are shown in table 4.8a and 4.8b. Kapinos and Sigel [92] studied
properties of substituted pyridine molecules with metal ions in aqueous solution
potentiometrically, they have got high stabilities for Copper and Zinc complexes, they
have reported pKa value 3.91 for 4-Bromo pyridine and 6.24 for 2, 3-dimethyl
pyridine. The pKa values obtained in agreement with reported values. Pyridine and 2-
methyl pyridine has pKa values of 5.17 and 5.97 due to presence of basic nitrogen.
High stabilities have been reported for binary complexes of 2, 2 bipyridyl which is in
agreement with literature. [93]. High values of stability for Iron (III) and Cu (II)
complexes reported in our results in agreement with Guillermo et al.[94]. The stability
values for binary complex of iron are in agreement with the value determined by
Mukherjee and Das. [95]. They have reported two pKa values for bipyridyl and 1, 10
phenanthroline as 4.23, 1.32 and 4.86, 1.90. The reported value for stability constant
of Iron complex as 9.13 which in agreement with our results.
Usha Nakara and Gupta O.D. [96] have studied polarographically complexes
of Cadmium (II) and Lead (II) with BPD in aqueous medium and reported high
stability for Cadmium (II) complexes. Ranjana et al [97] studied complexation of
Result and Discussion
Page 145
Copper (II) with purines in the aqueous system, observed formation of coloured
complexes, reported pKa values for adenine as 4.45 , 9.4 and 6.77 (logK1) and 5.022
(logK2) for Copper complexes .
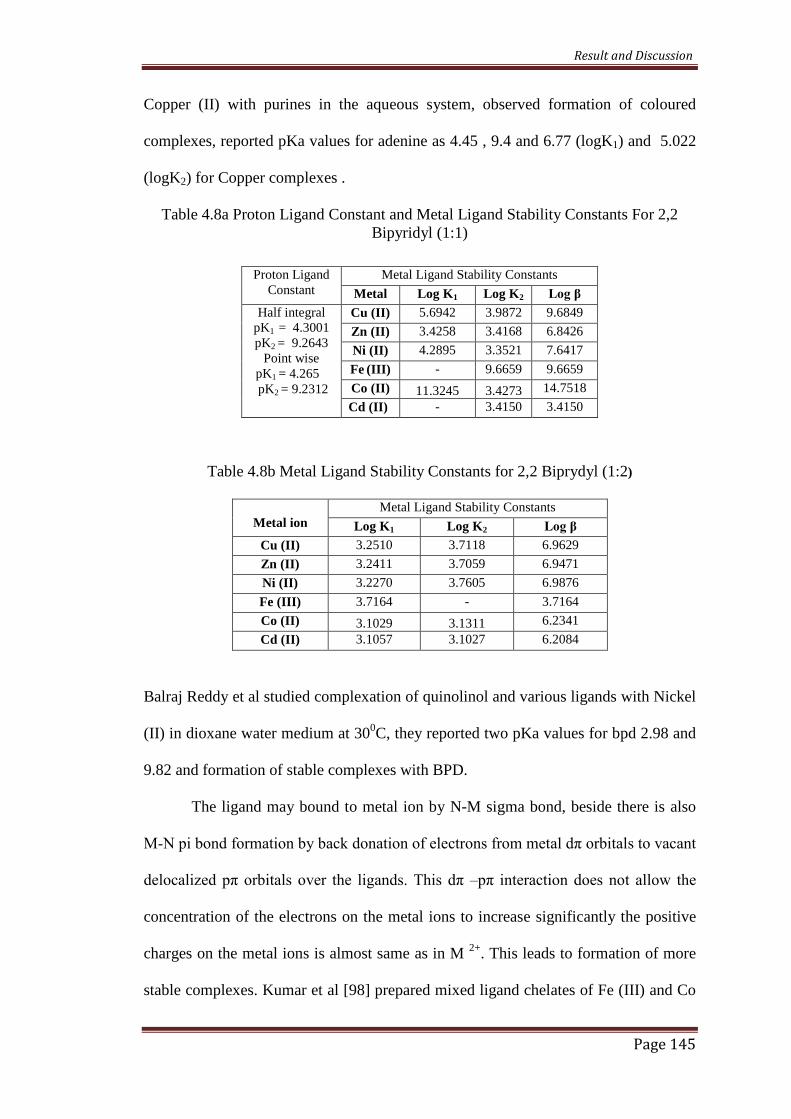
Table 4.8a Proton Ligand Constant and Metal Ligand Stability Constants For 2,2Bipyridyl (1:1)
Table 4.8b Metal Ligand Stability Constants for 2,2 Biprydyl (1:2)
Metal ionMetal Ligand Stability Constants
Log K1 Log K2 Log β
Cu (II) 3.2510 3.7118 6.9629
Zn (II) 3.2411 3.7059 6.9471
Ni (II) 3.2270 3.7605 6.9876
Fe (III) 3.7164 - 3.7164
Co (II) 3.1029 3.1311 6.2341
Cd (II) 3.1057 3.1027 6.2084
Balraj Reddy et al studied complexation of quinolinol and various ligands with Nickel
(II) in dioxane water medium at 300C, they reported two pKa values for bpd 2.98 and
9.82 and formation of stable complexes with BPD.
The ligand may bound to metal ion by N-M sigma bond, beside there is also
M-N pi bond formation by back donation of electrons from metal dπ orbitals to vacant
delocalized pπ orbitals over the ligands. This dπ –pπ interaction does not allow the
concentration of the electrons on the metal ions to increase significantly the positive
charges on the metal ions is almost same as in M 2+. This leads to formation of more
stable complexes. Kumar et al [98] prepared mixed ligand chelates of Fe (III) and Co
Proton LigandConstant
Metal Ligand Stability Constants
Metalion
Log K1 Log K2 Log β
Half integralpK1 = 4.3001pK2 = 9.2643
Point wisepK1 = 4.265pK2 = 9.2312
Cu (II) 5.6942 3.9872 9.6849
Zn (II) 3.4258 3.4168 6.8426
Ni (II) 4.2895 3.3521 7.6417
Fe (III) - 9.6659 9.6659
Co (II) 11.3245 3.4273 14.7518
Cd (II) - 3.4150 3.4150
Result and Discussion
Page 146
(III) diphenates with 5-methyl -1, 10-phenanthroline (Ph) and 4-methyl -2,21-Dipridyl
(4BDP), reported octahedral geometry. They also reported neutral nature of Ph, 4BDP
and the co-ordination through tertiary nitrogen. Better chelation tendancy of the
ligand was mentioned. Thakur et al [99] studied interaction of the isoniazid with
alkaline earth metals, reported two pKa values as 3.192 due to dissociation of nitrogen
of pyridine ring and 10.66 due to dissociation of primary amino group and reported
formation of 1:1 and 1:2 complexes.
Shrama et al [100] studied interaction of lanthanones with 2-amino pyridine
and 4-amino pyridine. They reported two protonation constant as 6.91, 11.32 and
9.25, 11.47 respectively. Mohan et al [101] studied binary and mixed ligand
complexes of various ligands with phosphonoformic acid, observed two pKa values
for bpd and one for phen as 1.52, 5.88 and 4.87, they also reported formation of 1:1
and 1:2 complexes. Beda and Helmut studied ternary complexes of pyr and bpd like
ligands with transition metal ions, in aqueous solution, high stability values were
found. They reported that the stability of the ternary complexes depends on the π –
accepting qualities of the heteroaromatic N base, enhanced stability is lost if
heteroaromatic N base replaced by an aliphatic amine. The pKa values determined by
them are 7.14(2,2 bipyridyl amine), 2.69,5.18 (2,2’dipyridyl methane), 3.06 (2,2’
dipyridyl ketone). They observed high stability for Copper complexes. The Order
stability found by them was Cu (II) > Ni (II) > Co (II) > Zn (II).
M.M.Khalil et al [102] studied complexation of divalent metal ions with some
Zwitter ionic buffers and triazoles at room temperature in aqueous medium, they
reported complex formation occurred in stepwise manner and formation of 1:1 and
1:2 complexes. They observed two pKa values for 3-amino-1,2,4 triazole ( TRZAM )
4.17 and 10.82 and observed that the stability constants of different 1:2 metal ligand
Result and Discussion
Page 147
complexes are lower than corresponding 1:1 system. The sequence of stability for bdp
complexes with respect metal ions follows the order Zn (II) > Cu (II) < Ni (II) < Co
(II) which in agreement with Irving William order.
Result and Discussion
Page 148
Fig. 4.50 pH metric titration curve for Co (II) + BPD (1:1 ratio)
Fig. 4.51 pH metric titration curve for Ni (II) +BPD (1:1 ratio)
0.0 0.5 1.0 1.5 2.0 2.5 3.0 3.5
0
2
4
6
8
10
12
pH
Vol.of NaOH
0.0 0.5 1.0 1.5 2.0 2.5 3.0
0
2
4
6
8
10
12
pH
Vol.of NaOH
Result and Discussion
Page 149
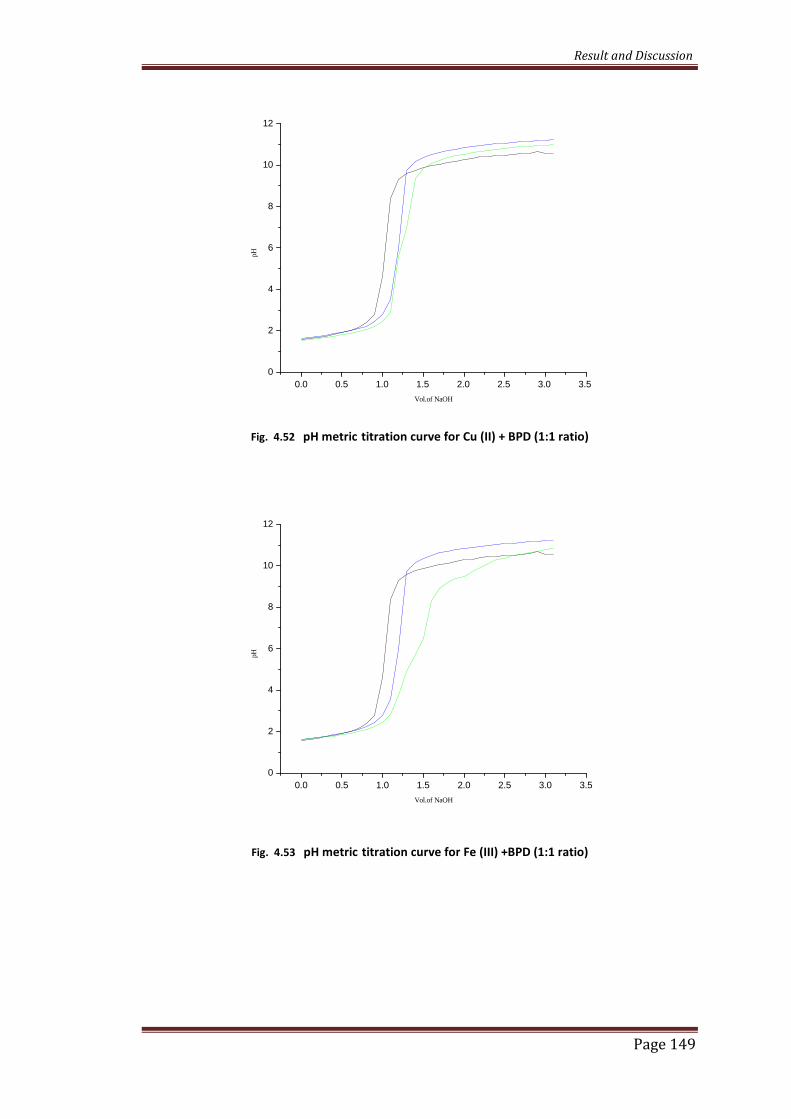
Fig. 4.52 pH metric titration curve for Cu (II) + BPD (1:1 ratio)
Fig. 4.53 pH metric titration curve for Fe (III) +BPD (1:1 ratio)
0.0 0.5 1.0 1.5 2.0 2.5 3.0 3.5
0
2
4
6
8
10
12
pH
Vol.of NaOH
0.0 0.5 1.0 1.5 2.0 2.5 3.0 3.5
0
2
4
6
8
10
12
pH
Vol.of NaOH
Result and Discussion
Page 150
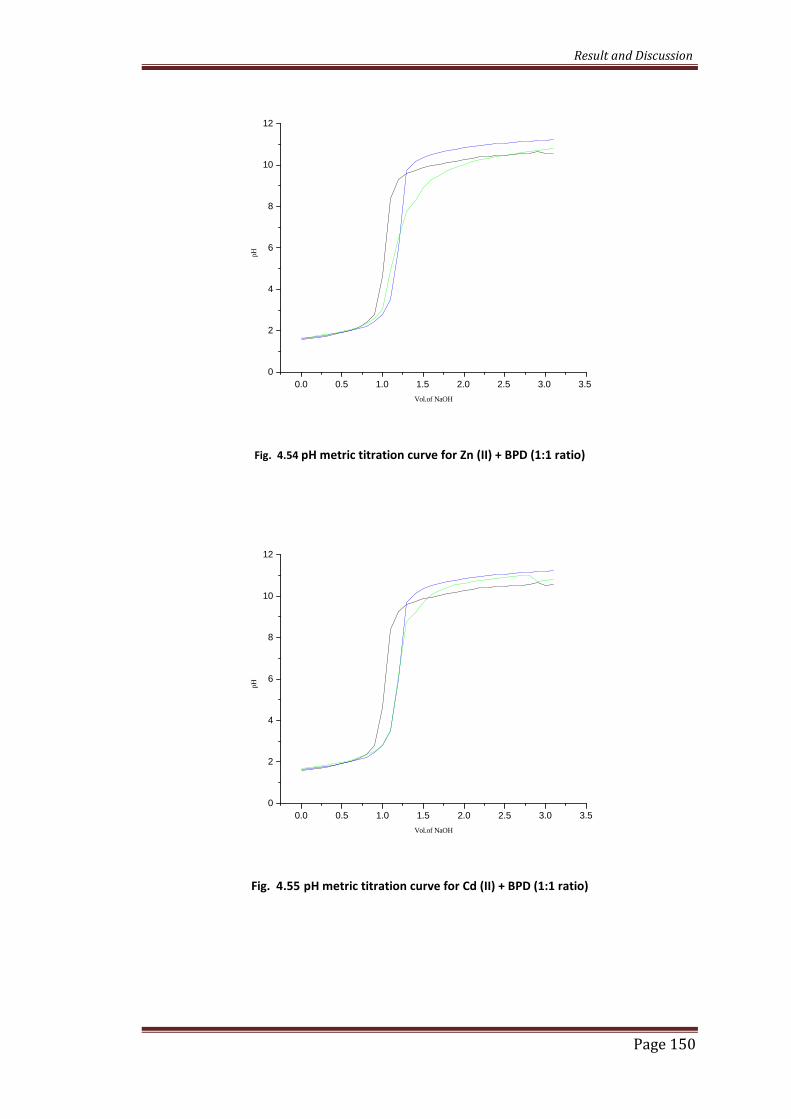
Fig. 4.54 pH metric titration curve for Zn (II) + BPD (1:1 ratio)
Fig. 4.55 pH metric titration curve for Cd (II) + BPD (1:1 ratio)
0.0 0.5 1.0 1.5 2.0 2.5 3.0 3.5
0
2
4
6
8
10
12
pH
Vol.of NaOH
0.0 0.5 1.0 1.5 2.0 2.5 3.0 3.5
0
2
4
6
8
10
12
pH
Vol.of NaOH
Result and Discussion
Page 151
Fig. 4.56 nA vs. pH for BPD
3 4 5 6 7 8 9 10
0.0
0.2
0.4
0.6
0.8
1.0
1.2
1.4
1.6
1.8
nA
pH
2,2,Bipyridyl
Result and Discussion
Page 152
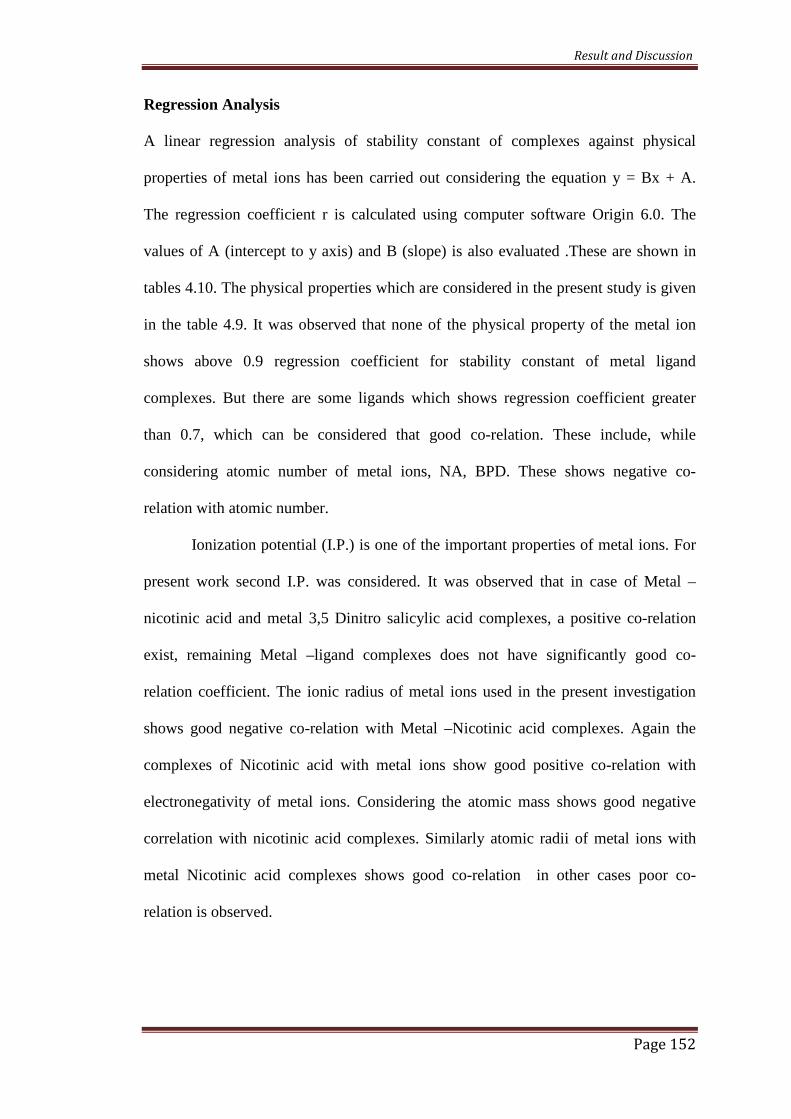
Regression Analysis
A linear regression analysis of stability constant of complexes against physical
properties of metal ions has been carried out considering the equation y = Bx + A.
The regression coefficient r is calculated using computer software Origin 6.0. The
values of A (intercept to y axis) and B (slope) is also evaluated .These are shown in
tables 4.10. The physical properties which are considered in the present study is given
in the table 4.9. It was observed that none of the physical property of the metal ion
shows above 0.9 regression coefficient for stability constant of metal ligand
complexes. But there are some ligands which shows regression coefficient greater
than 0.7, which can be considered that good co-relation. These include, while
considering atomic number of metal ions, NA, BPD. These shows negative co-
relation with atomic number.
Ionization potential (I.P.) is one of the important properties of metal ions. For
present work second I.P. was considered. It was observed that in case of Metal –
nicotinic acid and metal 3,5 Dinitro salicylic acid complexes, a positive co-relation
exist, remaining Metal –ligand complexes does not have significantly good co-
relation coefficient. The ionic radius of metal ions used in the present investigation
shows good negative co-relation with Metal –Nicotinic acid complexes. Again the
complexes of Nicotinic acid with metal ions show good positive co-relation with
electronegativity of metal ions. Considering the atomic mass shows good negative
correlation with nicotinic acid complexes. Similarly atomic radii of metal ions with
metal Nicotinic acid complexes shows good co-relation in other cases poor co-
relation is observed.
Result and Discussion
Page 153
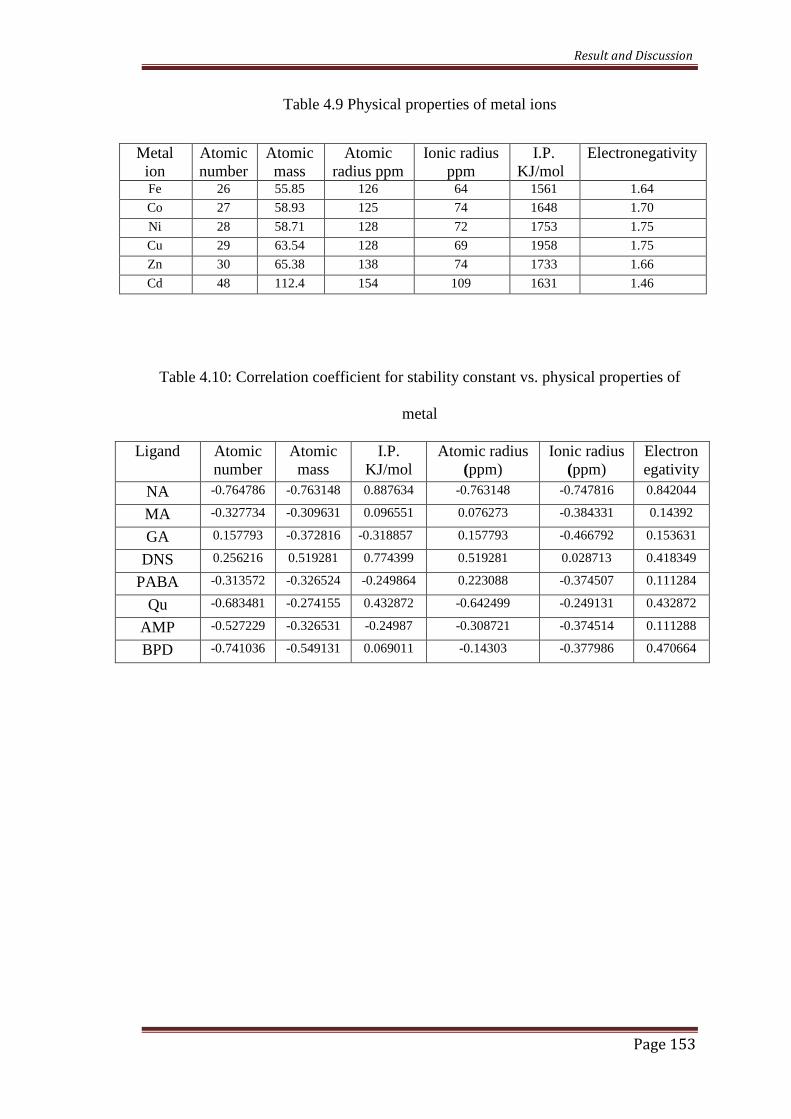
Table 4.9 Physical properties of metal ions
Table 4.10: Correlation coefficient for stability constant vs. physical properties of
metal
Ligand Atomicnumber
Atomicmass
I.P.KJ/mol
Atomic radius(ppm)
Ionic radius(ppm)
Electronegativity
NA -0.764786 -0.763148 0.887634 -0.763148 -0.747816 0.842044
MA -0.327734 -0.309631 0.096551 0.076273 -0.384331 0.14392
GA 0.157793 -0.372816 -0.318857 0.157793 -0.466792 0.153631
DNS 0.256216 0.519281 0.774399 0.519281 0.028713 0.418349
PABA -0.313572 -0.326524 -0.249864 0.223088 -0.374507 0.111284
Qu -0.683481 -0.274155 0.432872 -0.642499 -0.249131 0.432872
AMP -0.527229 -0.326531 -0.24987 -0.308721 -0.374514 0.111288
BPD -0.741036 -0.549131 0.069011 -0.14303 -0.377986 0.470664
Metalion
Atomicnumber
Atomicmass
Atomicradius ppm
Ionic radiusppm
I.P.KJ/mol
Electronegativity
Fe 26 55.85 126 64 1561 1.64
Co 27 58.93 125 74 1648 1.70
Ni 28 58.71 128 72 1753 1.75
Cu 29 63.54 128 69 1958 1.75
Zn 30 65.38 138 74 1733 1.66
Cd 48 112.4 154 109 1631 1.46


![Determination of polyphenolic components by high ......Crataegus monogyna superior to those which we obtained”. However, “Barros [8] obtained lower results than we obtained for](https://img.pdfslide.us/doc/110x75/610d1ca761a840042468ad97/determination-of-polyphenolic-components-by-high-crataegus-monogyna-superior.jpg)