1
The response of surface energy balance components and precipitation to climate forcings Nathalie Schaller, Jan Cermak and Reto Knutti Institute for Atmospheric and Climate Science, ETH Zurich Contact: [email protected] 3. Theoretical concepts Global mean precipitation constrained by energy availability at surface (Allen & Ingram, 2002). Gregory et al., 2004 developed a method to separate the net flux imbalance of the climate system ( N) into a radiative forcing term ( F) and climate feedback term ( -αΔT s ): N = F – αΔT s (eq. 1) Forster & Taylor (2006) extended the methodology for transient simulations. Andrews (2009) (A09 hereafter) applied the methodology to the surface energy budget components (NET, LW, SW, LH, SH) and to precipitation (P). 4. Results a) Surface energy fluxes b) Precipitation References Allen, M.R. & W.J. Ingram, 2002: Constraints on future changes in climate and the hydrologic cycle, Nature, 419, 224-232. Andrews, T., 2009: Forcing and response in simulated 20th and 21st century surface energy and precipitation trends, JGR, 114, D17110. Forster, P.M. & K.E. Taylor, 2006: Climate forcings and climate sensitivities diagnosed from coupled model integrations, J.Clim, 19, 6181-6194. Gregory, J.M. et al., 2004: A new method for diagnosing radiative forcing and climate sensitivity. GRL, 31. Meehl, G.A. et al., 2007: Climate Change 2007: The Physical Science Basis. Fourth Assessment of the Intergovernmental Panel on Climate Change. Cambridge University Press, 747-845. 1. Motivation Changes in the hydrological cycle caused by global warming are expected to have severe consequences for societies, agriculture and ecosystems ( Meehl et al., 2007). Response of precipitation to the all-forcing scenarios from different models is ambiguous, hence a large uncertainty in the projections. One forcing at a time to understand physical mechanisms leading to the intensification of the hydrological cycle. Test additive linearity assumption of the forcing's response. 2. Simulations NCAR CCSM3.5, transient simulations with fully coupled ocean Resolution: 1.9°x2.5° (finite volume dynamical core) 2x: 1%/yr to 2xCO 2 4x: 2%/yr to 4xCO 2 37: 3.7 W/m 2 increase in solar forcing 74: 7.4 W/m 2 increase in solar forcing 372x: 1%/yr to 2xCO 2 + 3.7 W/m 2 increase in solar forcing 5 runs x 100 yrs for each simulation to quantify internal variability. Table 1: Components of the global mean surface feedback parameter diagnosed from each simulation. Results published in A09 are also shown. Units: W/m 2 , uncertainty range is standard deviations of 5 runs. Fig. 2: Summary of the imbalance, forcing and feedback terms from eq. 1 for all five simulations. Values are averaged over the 5 runs and the years 81-100 of the simulation. Results are given for the net surface energy, longwave, shortwave, latent heat and sensible heat fluxes. Fig. 1: Regression of change in global mean net surface energy flux against change in global mean surface air temperature after the 70 th year of the simulation. Fig. 3: Time series of net change in precipitation and its separation into forcing and feedback response averaged over the 5 runs of each simulation. -α = Y NET F 5. Summary and outlook Changes in surface energy budget components and precipitation calculated for different idealized simulations. Feedback parameters well constrained for NET, LW, LH and P but uncertain for SW and SH. Results might be model dependent as suggested by comparison with Andrews (2009). Test assumption of linear additivity of response to a given forcing: - Imbalance: seem to add linearly but not for LH and P - Forcing: not lin. add. for CO 2 , less clear for solar simulations - Feedback: the same since α acts to counterbalance forcing For precipitation, forcing term <0 in simulations with CO 2 (2x, 4x, 372x) while it is =0 for the solar-only simulations ( 37, 74). Perform same analysis for TOA fluxes (Forster & Taylor, 2006). Test if assumption that feedback parameter α is not forcing dependent is justified. Investigate linear additivity of spatial patterns of precipitation, evaporation and cloud cover.

The response of surface energy balance components and

  • Upload
    others

  • View
    1

  • Download
    0

Embed Size (px)

Citation preview

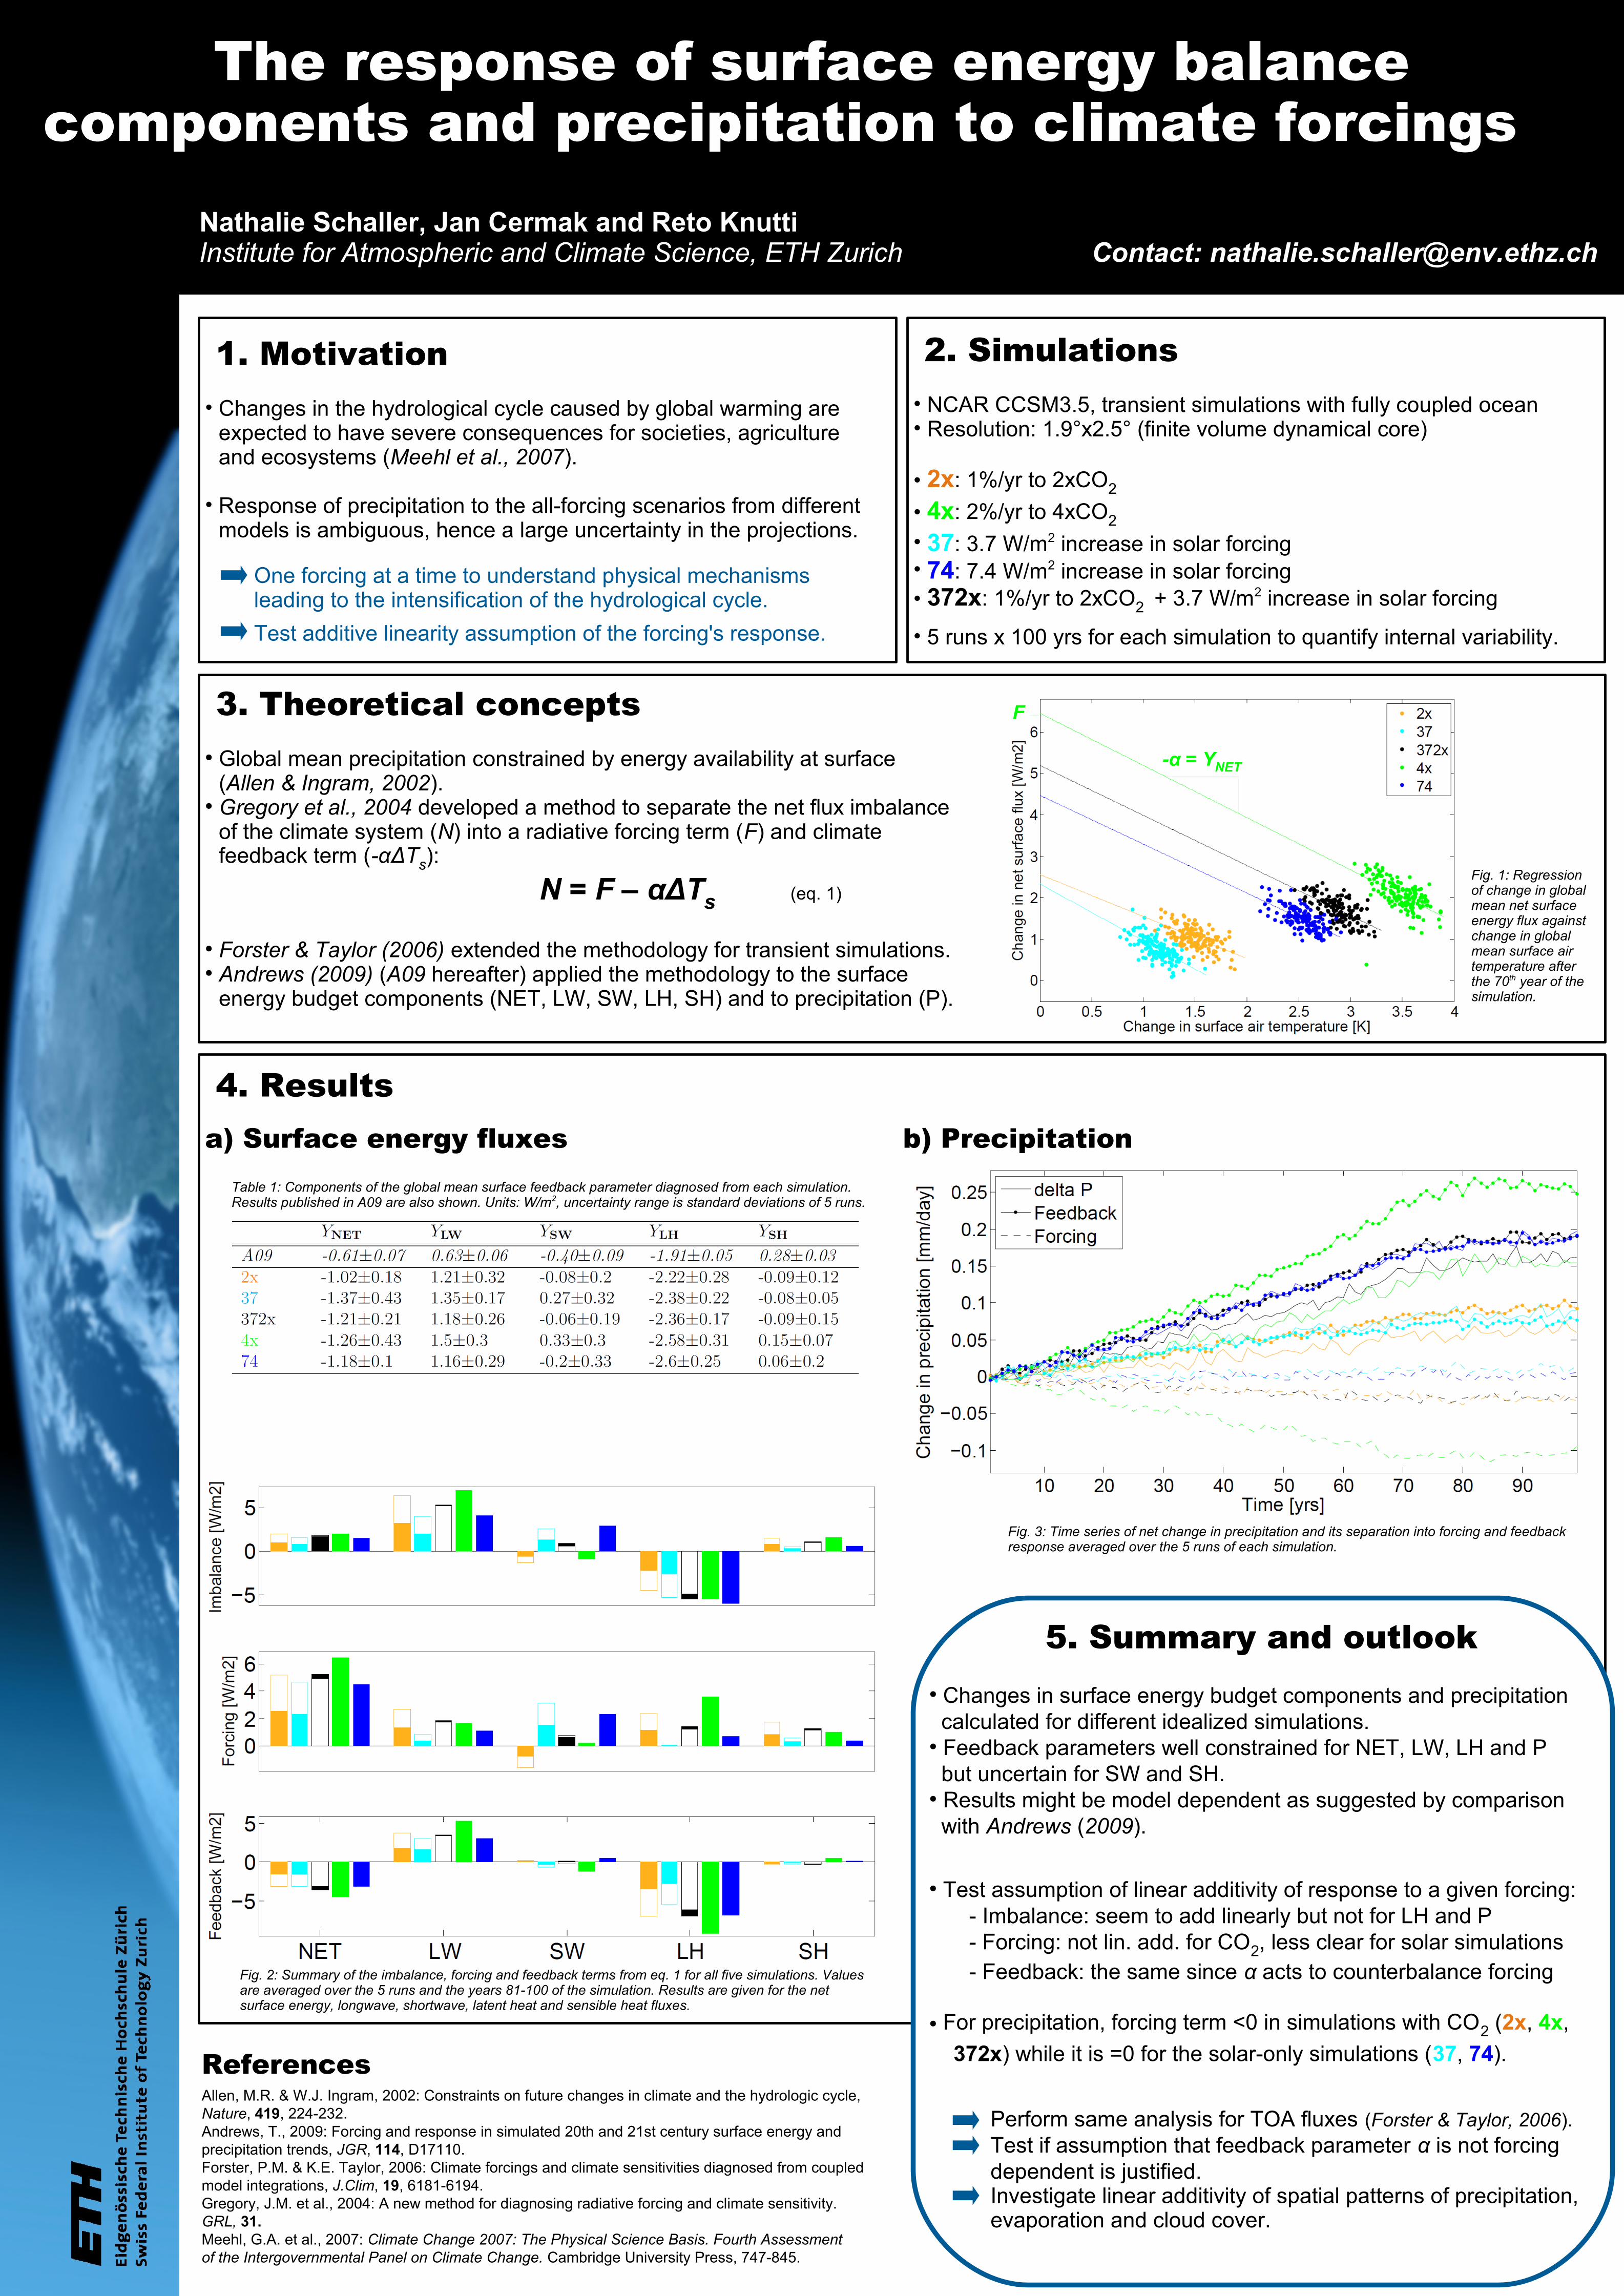
The response of surface energy balancecomponents and precipitation to climate forcings

Nathalie Schaller, Jan Cermak and Reto Knutti Institute for Atmospheric and Climate Science, ETH Zurich Contact: [email protected]

3. Theoretical concepts● Global mean precipitation constrained by energy availability at surface (Allen & Ingram, 2002).

● Gregory et al., 2004 developed a method to separate the net flux imbalance of the climate system (N) into a radiative forcing term (F) and climate feedback term (-αΔTs):

N = F – αΔTs (eq. 1)

● Forster & Taylor (2006) extended the methodology for transient simulations.● Andrews (2009) (A09 hereafter) applied the methodology to the surface energy budget components (NET, LW, SW, LH, SH) and to precipitation (P).

4. Resultsa) Surface energy fluxes b) Precipitation

ReferencesAllen, M.R. & W.J. Ingram, 2002: Constraints on future changes in climate and the hydrologic cycle,Nature, 419, 224-232.Andrews, T., 2009: Forcing and response in simulated 20th and 21st century surface energy and precipitation trends, JGR, 114, D17110.Forster, P.M. & K.E. Taylor, 2006: Climate forcings and climate sensitivities diagnosed from coupledmodel integrations, J.Clim, 19, 6181-6194.Gregory, J.M. et al., 2004: A new method for diagnosing radiative forcing and climate sensitivity.GRL, 31.Meehl, G.A. et al., 2007: Climate Change 2007: The Physical Science Basis. Fourth Assessmentof the Intergovernmental Panel on Climate Change. Cambridge University Press, 747-845.

1. Motivation• Changes in the hydrological cycle caused by global warming are expected to have severe consequences for societies, agriculture and ecosystems (Meehl et al., 2007).

• Response of precipitation to the all-forcing scenarios from different models is ambiguous, hence a large uncertainty in the projections.

One forcing at a time to understand physical mechanisms leading to the intensification of the hydrological cycle.

Test additive linearity assumption of the forcing's response.

2. Simulations• NCAR CCSM3.5, transient simulations with fully coupled ocean• Resolution: 1.9°x2.5° (finite volume dynamical core)

• 2x: 1%/yr to 2xCO2

• 4x: 2%/yr to 4xCO2

• 37: 3.7 W/m2 increase in solar forcing• 74: 7.4 W/m2 increase in solar forcing• 372x: 1%/yr to 2xCO2 + 3.7 W/m2 increase in solar forcing

• 5 runs x 100 yrs for each simulation to quantify internal variability.

Table 1: Components of the global mean surface feedback parameter diagnosed from each simulation.Results published in A09 are also shown. Units: W/m2, uncertainty range is standard deviations of 5 runs.

Fig. 2: Summary of the imbalance, forcing and feedback terms from eq. 1 for all five simulations. Values are averaged over the 5 runs and the years 81-100 of the simulation. Results are given for the net surface energy, longwave, shortwave, latent heat and sensible heat fluxes.

Fig. 1: Regression of change in global mean net surface energy flux against change in global mean surface air temperature after the 70th year of the simulation.

Fig. 3: Time series of net change in precipitation and its separation into forcing and feedback response averaged over the 5 runs of each simulation.

-α = YNET

F

5. Summary and outlook● Changes in surface energy budget components and precipitation calculated for different idealized simulations.● Feedback parameters well constrained for NET, LW, LH and P but uncertain for SW and SH.● Results might be model dependent as suggested by comparison with Andrews (2009).

● Test assumption of linear additivity of response to a given forcing:- Imbalance: seem to add linearly but not for LH and P- Forcing: not lin. add. for CO2, less clear for solar simulations- Feedback: the same since α acts to counterbalance forcing

● For precipitation, forcing term <0 in simulations with CO2 (2x, 4x,

372x) while it is =0 for the solar-only simulations (37, 74).

Perform same analysis for TOA fluxes (Forster & Taylor, 2006).Test if assumption that feedback parameter α is not forcing dependent is justified.Investigate linear additivity of spatial patterns of precipitation, evaporation and cloud cover.