Embed Size (px)
Citation preview
Louisiana State UniversityLSU Digital Commons
LSU Doctoral Dissertations Graduate School
2015
The Response of Gossypium spp. to Biotic andAbiotic Stresses in Louisiana and the Modeling ofYarn PerformanceBikash BhandariLouisiana State University and Agricultural and Mechanical College
Follow this and additional works at: https://digitalcommons.lsu.edu/gradschool_dissertations
This Dissertation is brought to you for free and open access by the Graduate School at LSU Digital Commons. It has been accepted for inclusion inLSU Doctoral Dissertations by an authorized graduate school editor of LSU Digital Commons. For more information, please [email protected].
Recommended CitationBhandari, Bikash, "The Response of Gossypium spp. to Biotic and Abiotic Stresses in Louisiana and the Modeling of YarnPerformance" (2015). LSU Doctoral Dissertations. 1674.https://digitalcommons.lsu.edu/gradschool_dissertations/1674
THE RESPONSE OF GOSSYPIUM SPP. TO BIOTIC AND ABIOTIC STRESSES IN
LOUISIANA AND THE MODELING OF YARN PERFORMANCE
A Dissertation
Submitted to the Graduate Faculty of the
Louisiana State University and
Agriculture and Mechanical College
in partial fulfillment of the
requirements for the degree of
Doctor of Philosophy
in
The School of Plant, Environmental, and Soil Sciences
by
Bikash Bhandari
B. S., IAAS, Tribhuvan University, 2006
M. S., University of Arkansas at Monticello, 2009
M. S., Louisiana State University, 2015
August 2015
ii
This dissertation is dedicated to the memory of my late grandmother, Maya Bhandari, and to my
beloved family.
iii
ACKNOWLEDGEMENTS
Foremost, I wish to express my sincere gratitude to Dr. Gerald O. Myers, my major
advisor for his guidelines, patience, encouragements, support, and useful thoughts during the
course of my study. Besides my major advisor, I wish to thank the rest of my committee
members: Dr. Charles Overstreet, Dr. Collins Kimbeng, and Dr. Stephen Harrison for their kind
support and guidance throughout the period of this research. I wish to express my gratitude to
late Dr. Jack Jones for his generous help, useful thoughts, and support during the period of my
research. I would like to thank my fellow labmate, Mr. Matthew O. Indest for his generous help
and support throughout my study period. I would like to thank the LSU Fiber Testing Lab
members, Ivan Dickson and Gladys Carmona for their support during my study period. I am also
thankful to all the members of the School of Plant, Environmental, and Soil Sciences for making
it possible to do my research and complete my study. I wish to sincerely express my gratitude to
my parents and younger brother for their love, support, and best wishes. Finally, I would like to
thank my dear wife Susanna Thapa for her generous help, support, and encouragement
throughout my life. Thank you.
iv
TABLE OF CONTENTS
ACKNOWLEDGEMENTS ........................................................................................................... iii
ABSTRACT ................................................................................................................................... vi
CHAPTER 1: GENERAL INTRODUCTION ................................................................................1
1.1 INTRODUCTION ................................................................................................................. 1 1.2 REFERENCES .................................................................................................................... 10
CHAPTER 2: RESPONSE OF FIVE RESISTANT/TOLERANT COTTON CULTIVARS
TO ISOLATES OF ROTYLENCHULUS RENIFORMIS COLLECTED FROM
RENIFORM INFESTED FIELDS OF LOUISIANA....................................................................15
2.1 INTRODUCTION ............................................................................................................... 15 2.2 MATERIALS AND METHODS ........................................................................................ 20
2.2.1 Reniform isolates and cotton cultivars ......................................................................... 20
2.2.2 General information...................................................................................................... 21 2.2.3 Statistical analysis ........................................................................................................ 22
2.3 RESULTS ............................................................................................................................ 23
2.3.1 Reproduction of reniform isolates on cotton genotypes ............................................... 23 2.3.2 Effect of reniform isolates on plant height ................................................................... 27
2.3.3 Effect of reniform isolates on dry shoot weight ........................................................... 29 2.3.4 Effect of reniform isolates on dry root weight ............................................................. 30
2.4 DISCUSSION ..................................................................................................................... 31
2.5 REFERENCES .................................................................................................................... 34
CHAPTER 3: IDENTIFICATION OF DAY NEUTRAL PRIMITIVE COTTON
ACCESSIONS TOLERANT TO ELEVATED LEVELS OF SALT CONCENTRATIONS.......39 3.1 INTRODUCTION ............................................................................................................... 39
3.2 MATERIALS AND METHODS ........................................................................................ 44 3.2.1 Plant materials .............................................................................................................. 44
3.2.2 Hydroponic technique .................................................................................................. 44 3.2.3 Advanced salt screening ............................................................................................... 45
3.2.4 Physiological measurement .......................................................................................... 46 3.2.5 Statistical analysis ........................................................................................................ 46
3.3 RESULTS ............................................................................................................................ 47 3.3.1 ANOVA for hydroponics technique ............................................................................. 47
3.3.2 Correlation of plant parameters .................................................................................... 49 3.3.3 Plant height ................................................................................................................... 50 3.3.4 Fresh and dry shoot weight........................................................................................... 53
3.3.5 Fresh and dry root weight ............................................................................................. 57 3.3.6 Sodium and potassium concentrations ......................................................................... 62
3.4 DISCUSSION ..................................................................................................................... 67 3.5 REFERENCES .................................................................................................................... 72
v
CHAPTER 4: PREDICTION OF SPINNING VALUES OF COTTON FIBERS ........................77 4.1 INTRODUCTION ............................................................................................................... 77 4.2 METHODS AND MATERIALS ........................................................................................ 82
4.2.1 Data collection .............................................................................................................. 82
4.2.2 Model development ...................................................................................................... 84 4.3 RESULTS ............................................................................................................................ 84
4.3.1 Multiple linear regression ............................................................................................. 84 4.3.2 Path analysis ................................................................................................................. 86 4.3.3 Regression/decision trees ............................................................................................. 87
4.3.4 Random forest and boosting ......................................................................................... 89 4.3.5 Artificial neural network .............................................................................................. 91 4.3.6 Correlation between SCI and yarn strength.................................................................. 94
4.3.7 Comparisons of statistical models ................................................................................ 94 4.4 DISCUSSION ..................................................................................................................... 95 4.5 REFERENCES .................................................................................................................... 99
CHAPTER 5: CONCLUSIONS ..................................................................................................104
APPENDIX ..................................................................................................................................108
TABLE A.1: LIST OF DAY NEUTRAL PRIMITIVE COTTON ACCESSIONS
USED IN HYDROPONICS TECHNIQUE. ........................................................................... 108
VITA ............................................................................................................................................109
vi
ABSTRACT
Developing improved cotton cultivars depends on how cotton cultivars perform the best
when under stresses. Reniform nematode is a major plant pathogen, causing 4-6% yield loss in
southern United States. A variation in reproduction and pathogenicity across reniform isolates
collected from Louisiana on susceptible cotton was reported. This study was conducted to
determine the response of resistant/tolerant cotton genotypes to multiple reniform isolates by
inoculating 10,000 juveniles into seven days old seedlings. Across genotypes, the Evan and
Avoyelles isolates had significantly higher vermiform nematodes (33,793 and 27,800/250 g soil,
respectively) than other isolates. Across isolates, the number of juveniles on A2-190 and Lonren-
2 (5,573 and 6,013, respectively) were significantly lower than that on other genotypes. There
was a significant interaction between the genotypes and isolates suggesting that the response of
genotypes to reniform isolates was different.
Salt stress is a major abiotic stress, affecting cotton production in the Macon Ridge and
Red River regions in Louisiana. In a preliminary study, 150 day neutral primitive cotton
accessions were screened at 0, 125, 250 mM NaCl under hydroponics. A promising subset was
rescreened for salt tolerance in pot culture. MT11 had the lowest reduction in plant height and
dry shoot weight (32% and 47%), significantly less than FM958 (43% and 66%) across salt
concentrations. MT1219 had the lowest accumulation of Na+ (1,026.37 mM) at 250 mM NaCl,
and significantly lower than FM958 (2,135.39 mM). Based on reduction in plant parameters,
MT11, MT1219, MT45, and MT245 performed better than other genotypes. This study also
showed that both hydroponics and pot culture are effective in the screening of a large number of
cotton genotypes against elevated salt concentrations.

vii
In addition to stresses, cotton breeders are interested to develop a selection index, which
aids in an efficient selection of multiple fibers traits. Using the data mining techniques, all
developed models agreed that fiber length and strength are the most important fiber properties in
determining the spinning consistency index (SCI). This study showed that SCI can be used as
alternative selection index for combining the multiple fiber traits to enhance yarn spinning.
1
CHAPTER 1: GENERAL INTRODUCTION
1.1 INTRODUCTION
Cotton (primarily Gossypium hirsutum L. and to a lesser extent G. barbadense, G.
arboreum, and G. herbaceum) is the leading natural textile fiber as well as one of the most
important oilseed crops in the world. In terms of total area harvested, cotton ranks fourth after
corn, soybean and wheat in the United States. Globally, US cotton production is ranked third
after China and India. In the US, it is estimated that 16.08 million bales were produced in
2014/2015, which is 25% higher than in 2013/2014. The production increase in 2014 vs 2013 is
largely a result in an increase in production area from 3.05 to 3.93 million hectares (USDA,
2014). As an oilseed, cotton is also ranked in the third position, worldwide, in terms of volume
behind soybean and corn. The oil produced from cotton is largely used for human consumption.
The cake left after oil extraction is a high protein animal feed principally used in the beef and
dairy industries (National Cottonseed Products Association, 2014). Collectively, these uses
contribute to cotton’s prominence as one of the most important agricultural row crops in the US.
Reniform nematode (Rotylenchulus reniformis) is a significant pathogen in upland cotton
production and causes an estimated 1.48% yield loss in the United States. In the southern United
States, i.e., Louisiana, Arkansas, Georgia, Texas, and Tennessee, more severe losses (>4%) were
observed in 2013 (Lawrence et al., 2014). The loss caused by reniform nematode may be
exaggerated under water-stressed conditions, while foliar symptoms may not appear in well-
managed cotton fields (Robinson, 2007). Symptomatically, reniform nematode infection reduces
seedling growth at early stages (2-3 leaf stages), which results in severe stunting (pathogenicity).
In addition, it causes a yellowing of lower leaves, a 1-2 node delay in fruit set a browning of the
2
lower leaf margins and tips that result in a delay in maturity, and yield reduction (pathogenicity)
(Birchfield and Jones, 1961; Jones et al., 1959).
The reniform nematode is a sedentary semi-endoparasite, which feeds on more than 350
plant species across 77 families in warm temperate, sub-tropical, and tropical regions of world
(Dasgupta and Seshadri, 1971; Gaur and Perry, 1991). Unlike the root-knot nematode
(Meloidgyne incognita), the infective stage is the immature female, which penetrates and disrupts
the cortex cells as it moves into a root and establishes a feeding site on the stele (Bird, 1984).
While feeding on the endodermis, it produces a multinucleated cell resulting from cell wall
dissolution and hypertrophy without hyperplasia of pericycle cells, which is known as a syncytia
(Cohn, 1973; Heald, 1975). Due to disruption of the cortex and dissolution of pericycle cells,
reniform nematode infestation hinders the movement of water and nutrient throughout the root
system. After establishing a feeding site, the reniform nematode develops further and forms the
typical kidney shape. Reproduction is by amphimixis resulting in a lay of 60-200 eggs in a
gelatinous matrix outside of the root. Male reniform nematodes have a less developed stylet and
oesophageal glands than females and can’t feed and produce syncytial cells (Bird, 1984; Gaur
and Perry, 1991; Leach et al., 2009).
The geographical infestation and intensity of reniform nematodes in the Cotton Belt has
been rapidly increasing over years. In Louisiana, reniform nematode is well established in most
of the cotton producing parishes. Over a period from 1961-2010, reniform infestation has
increased from three to twenty four parishes (McGawley et al., 2010). Since an active horizontal
movement of reniform nematode is minimal (2 meters per year), it is believed that the rapid
infestation is due to cotton monoculture and movement of equipment from infested fields to
other fields (Moore et al., 2010a; Robinson, 2007). Once it is established, the reniform nematode
3
can spread horizontally and vertically throughout a cotton field by tillage and water flow (Moore
et al., 2010a). To manage the reniform infestation in cotton fields, cotton growers have
implemented various management practices, such as crop rotation with non-host species, use of
nematicides, planting of tolerant or resistant cotton varieties, sometimes combined with site
specific management (Burris et al., 2010; Davis et al., 2003; Lawrence and McLean, 2000;
Lawrence et al., 1990; Rich and Kinloch, 2000; Robinson, 2007; Starr et al., 2007; Wolcott et al.,
2005). Until recently, aldicarb (Temik) was a cheap, effective, and widely used nematicide to
suppress the reniform nematode population in the reniform infested fields, but its usage was
restricted after 2014 due to concerns about its acute toxicity. At present, there are no commercial
reniform resistant/tolerant cotton varieties available for cotton growers. The use of a reniform
resistant/tolerant cotton genotype would be an alternative and economically viable management
option to manage reniform nematodes in the infested areas.
With the increasing prevalence of field infestation with reniform nematodes and its
elevation to being a primary pest for cotton in recent years, cotton breeders initiated the
evaluation of cotton germplasm accessions to identify a source of reniform resistance. Yik and
Birchfield (1984) evaluated four different cultivated and wild species of the genus Gossypium
and found that G. longicalyx, collected from Africa, has an immune response to reniform
nematode. They also reported that G. barbendense ‘Texas 110’ demonstrated a high degree of
resistance. Bell et al. (2014) developed two highly reniform resistant lines: Lonren-1 and
Lonren-2 using a hexaploid bridging strategy to incorporate the diploid G. longicalyx source of
resistance into a tetraploid upland cotton background. Robinson et al. (2004) evaluated the entire
collection of Pima (G. barbadense) and upland primitive cotton accessions and found that GB-
713 was highly tolerant to infestation by the reniform nematode. The study also found that most
4
upland cotton accessions were moderately to highly susceptible to the reniform nematode.
Stewart and Robbins (1994) reported that the Old World cultivated diploid cotton G. arboreum
(A2-190) was highly tolerant to the reniform nematode. As a result of the long standing interest
in reniform nematode resistance, most of the wild and cultivated diploid and tetraploid cotton
species, such as G. hirsutum, G. longicalyx, G. barbadense. G. herbaceum, G. somalense, G.
aridum, and G. african have been evaluated for their reaction. Currently, the Lonren-1, Lonren-
2, GB-713, and TX-110 sources of resistance are the most commonly used sources in cotton
breeding programs.
Historically, research on the reniform nematode has been conducted using only a single
isolate collected from a specific geographical region of US, typically a locally infested field.
However, variations in both morphological and genetic, as well in reproduction and
pathogenicity, of the isolates have been observed (Agudelo et al., 2005; Arias et al., 2009;
Dasgupta and Seshadri, 1971; McGawley et al., 2010; Tilahun et al., 2008). Based on
reproduction on host species, Dasgupta and Seshadri (1971) designated race A and race B of the
reniform nematode in India. More recently, four races of reniform nematode were reported in
India (Singh and Azam, 2011). Agudelo et al. (2005) reported a variation in morphology and
reproduction among reniform populations and found that a population collected from Texas had
the highest reproduction. McGawley et al. (2010) reported that reniform nematode populations
collected from Mississippi and Louisiana had a higher level of reproduction than other
populations. It is now well established there is a variation in reniform nematode populations
collected from different states. However, there is still a lack of information about variation in
reproduction and pathogenicity among reniform isolates collected within Louisiana. Common to
all these prior studies as well is that when cotton was used as a host species that only a single or
5
a very few genotypes were used and that variation in species source of resistance (e.g.
longicalyx, barbadense, hirsutum) was not incorporated. This study seeks to investigate how the
source of reniform nematode resistance/tolerance in cotton genotypes interacts across different
reniform isolates collected from different cotton production regions in Louisiana. Results may
enable the identification of cotton genotypes (sources of resistance), which display a favorable
reaction across reniform isolates that could be used to develop reniform resistant cultivars in a
cotton breeding program.
In addition to biotic factors, abiotic stresses, such as drought and salinity are major
environmental limiting factors, which affect the growth and productivity of crop species. Soil
salinity is one of agriculture’s major abiotic stress factors, affecting 23% and 20% of the total
irrigated land in the US and the world, respectively (Ghassemi et al., 1995; Wang et al., 2003).
Salinity is a severe problem in areas of high evaporation and low rainfall, i.e. arid and semi-arid
regions (e.g. Southwest and West regions in US). In these regions, rainfall is not enough to leach
accumulated salts out from soil surface, which results in rapid accumulations (Bernstein, 1975;
Brady and Weil, 2009). In Louisiana, salinity is a problem in the Upper Red River and Macon
Ridge regions where cotton is one of the major crops grown. In these regions, water quality is
one of the major issues with irrigation water from Red River, which contains nearly 2600 ppm
salt (Morgan, 2010).
Although cotton is moderately tolerant to salinity with a threshold of 7.7 dSM-1 (4,928
ppm) (Maas and Hoffman, 1977), the effect of salt concentrations on the growth and
development of cotton during different growth stages may be observed in these regions. Due to a
long spell of dry weather during the growing season in recent years, cotton growers are irrigating
fields through surface or sprinkler irrigation to supplement the water requirements at critical
6
stages of cotton growth. In these regions, 40% of cotton fields are irrigated and the percentage is
likely to increase to maximize production and reduce a risk of crop failure. It is likely that
irrigating cotton fields with elevated saline water from Red River will increase the accumulation
of salt residues on the soil surface over time, exacerbated because of a shallow hard pan and poor
drainage in these areas. The increased use of the Red River as a source of irrigation water is due
to high salt concentrations in the ground water and high cost of well pumping, and salt levels in
the irrigating water have been increasing over the last 20 years in this regions (Morgan, 2010).
As irrigation becomes more prevalent in cotton production, salinity might become a significant
issue in the near future, which will need to be managed either through the soil reclamation
/management practices or through the development of salt tolerant genotypes. Though soil
salinity can be temporarily reclaimed by crop management practices to some extent, use of
improved salt tolerant cotton genotypes would be an alternative and economically viable
management option to manage cotton production in the salt affected regions.
Salt concentrations in the soil surface impair the absorption of macro- and micro-
nutrients required for plant growth and development. The increased concentration of Na+ and Cl-
within the plant system may partially or fully inhibit the metabolic, physiological, and
biochemical processes, and all these effects together reduce plant growth and development at
different developmental stages (Hasegawa et al., 2000; Munns and Tester, 2008). It has been
well documented that salinity reduces seed germination and emergence, primary and secondary
root growth, plant height, fresh and dry shoot weight, shoot/root ratio, and stem thickness, and all
these effects together cause in dwarf plants with necrosis and chlorosis of old leaves in many
crop species (Chen et al., 2010; Hamdy et al., 1993; Khan et al., 1995; Latif and Khan, 1976;
Reinhardt and Rost, 1995; Wang et al., 2011; Ye et al., 1997; Younis et al., 1987). Munns and
7
Tester (2008) reported two distinct growth responses resulting from elevated salt concentrations:
a rapid decrease in growth due to sudden exposure to high salt concentrations (external osmotic
pressure) followed by a slow response as the Na+ accumulates in the leaves. A reduction in leaf
expansion is a direct result of salt stress because increased external osmotic pressure causes a
rapid loss in cell turgidity, which results in a rapid reduction of shoot growth (Wang and Nii,
2000). The shoot growth reduction causes a delay in emergence of leaves and lateral buds, which
reduces the number of lateral branches (Munns and Tester, 2008). In term of production, cotton
yield is reduced as the salt concentration increases due to higher boll shedding and lower number
of fruiting branches (Chen et al., 2010; Longenecker, 1974). Additionally, excess salinity has
been shown to reduce lint percentage, fiber fineness, maturity, length, strength, and micronaire,
which combine to reduce fiber quality (Ashraf and Ahmad, 2000; Korkor et al., 1974;
Longenecker, 1974).
Exclusion of Na+, ion regulation and compartmentalization, osmotic adjustment,
induction of antioxidants, and synthesis of solutes are well known salt tolerant mechanisms
observed in many plant species (Munns and Tester, 2008; Parida and Das, 2005). Janardhan et al.
(1976) reported Na+ exclusion in salt tolerant Indian cotton varieties, which prevents Na+
accumulation to toxic levels in the leaves. At a cellular level, compartmentalization of Na+ into
the vacuoles from the cytosol through a Na+/H+ anti-transporter was observed in Avp1
expressing cotton genotypes (Pasapula et al., 2011). For cotton breeders, identification of inter-
and intra-specific sources of variation and the identification of the mechanisms of salt tolerance
across accessions are important to the development of salt tolerant cotton cultivars. Compared to
the total number of germplasm accessions in US cotton germplasm collection, even
8
cumulatively, the number of cotton germplasm lines included in past studies for screening and
characterizing their salt tolerance is quite low.
With regard to salt tolerance, there is scant data available on the variation in the cotton
germplasm pool. The lack of information hinders efforts to understand the mechanism of salt
tolerance and to select appropriate salt tolerant cotton genotypes for use in the development or
breeding of salt tolerant cotton varieties. There is a need for more systematic studies of salt
tolerance response over a larger number of germplasm accessions to provide the foundation upon
which to develop salt tolerant cotton cultivars. This study provides an opportunity to identify the
degree of salt tolerance among one hundred fifty genotypes obtained from the Mississippi
Converted Race Stock program. The information collected, in regard to salt tolerance will be
available in the National Cotton Germplasm collection so that cotton breeders can use this
information to develop and improve the salt tolerant cotton cultivars.
In addition to biotic and abiotic stresses, cotton breeders from public and private
institutions are interested is to develop high yielding cotton varieties with improved fiber
qualities to meet the requirements of standard yarn properties. The improved fiber quality is a
key to success in the competitive global textile industries. Knowledge of the relationship
between yarn and fiber properties is important for cotton breeders to select high quality
genotypes/offspring in the breeding program. In the textile industry, yarn quality is a vital
component which determines the quality of fabric and clothes (Zhu and Ethridge, 1996).
High volume instruments (HVI) and Advanced Fiber Information System (AFIS) are
widely used instruments in selection of high quality cotton bales in the textile industry (Sasser,
1981; Shofner et al., 1990). For cotton breeders, HVI is the most popular tool in selection of
progenies and cultivars with high quality fibers because a large number of fiber samples can be
9
processed in short periods of time at low cost (Suh and Sasser, 1996). Although various fiber
properties are determined by using HVI and AFIS, it is still challenging to give priority to a
parameter or group of parameters to select the best fibers for industrial uses (Majumdar, 2010).
The interrelationship between the various HVI and AFIS parameters is not represented and it is
their interplay, along with spinning equipment variables that lead to the production of usable
yarn. In essence, some sort of selection index could be useful if it was able to reasonably and
reliably predict yarn quality. Two recent attempts to develop such an index, based on the HVI
data and consultation with the textile professionals, are the fiber quality indices: Qscore 1 and
Qscore 2. Although these indices were developed as a single index incorporating four different
fiber properties, most cotton breeders hesitate to use this score in their breeding program because
this algorithm gives an arbitrary weight for each fiber property and the optimum weight of each
fiber property in relation to yarn quality is still unknown (Bourland et al., 2010).
With an advancement of computational and analytical tools, a number of data mining and
machine learning techniques, such as multiple linear regression, path analysis, regression tree,
random forest, boosting and artificial neural network, are increasingly popular and widely used
to develop predictive models for simple to complex data in many scientific disciplines (Breiman,
2001; Gurney, 1997; James et al., 2014; Kang et al., 1983; Kutner et al., 2004). There are limited
studies in the application of other data mining tools and techniques in cotton breeding. Since as
early as 1980, cotton breeders have investigated two data mining and machine learning
techniques, such as classical linear regression and artificial neural network (ANN) to determine
the functional relationship between yarn and fiber properties (Cheng and Adams, 1995; Ramesh
et al., 1995). The varieties used in these older experiments and their limited data sets may no
longer be relevant. Additionally, none of the published classical linear regression and ANN
10
models used AFIS data. From HVI it is possible to calculate a spinning consistency index (SCI),
which suggests the overall quality and spinning ability of cotton fibers and can be used to
evaluate the technological value of cotton fibers. Unfortunately, this index is a “black box” for
the cotton breeder, as the research that led to its development provides little rationale about how
and what fiber parameters were considered in its development and SCI’s ability to predict yarn
properties. Therefore, the objective of this research is to develop a number of statistical models
using data mining and machine learning tools to identify the important fiber properties, which
affects SCI and to compare this index with yarn strength to determine its applicability in the
textile industries.
1.2 REFERENCES
Agudelo, P., R.T. Robbins, J.M. Stewart, and A.L. Szalanski. 2005. Intraspecific variability of
Rotylenchulus reniformis from cotton-growing regions in the United States. J. Nematol.
37: 105-144.
Arias, R.S., S.R. Stetina, J.L. Tonos, J.A. Scheffler, and B.E. Scheffler. 2009. Microsatellites
reveal genetic diversity in Rotylenchulus reniformis populations. J. Nematol. 41: 146-
156.
Ashraf, M., and S. Ahmad. 2000. Influence of sodium chloride on ion accumulation, yield
components and fibre characteristics in salt-tolerant and salt-sensitive lines of cotton
(Gossypium hirsutum L.). Field Crops Res. 66: 115-127.
Bernstein, L. 1975. Effects of salinity and sodicity on plant growth. Annu. Rev. Phytopathol. 13:
295-312.
Birchfield, W., and J.E. Jones. 1961. Distribution of the reniform nematode in relation to crop
failure of cotton in Louisiana. Plant Dis. Rep. 45: 671-673.
Bird, A.F. 1984. Growth and moulting in nematodes: changes in the dimensions and morphology
of Rotylenchulus reniformis from start to finish of moulting. Int. J. Parasitol. 13: 201-206.
Bird, A.F. 1984. Growth and moulting in nematodes: Moulting and development of the hatched
larva of Rotylenchulus reniformis. Parasitol. 89: 107-120.
11
Bourland, F.M., R. Hogan, D.C. Jones, and E. Barnes. 2010. Development and utility of Q-score
for characterizing cotton fiber quality. J. Cotton Sci. 14: 53-63.
Brady, N.C., and R.R. Weil. 2009. Elements of the nature and properties of soils. 3rd ed. Pearson
Educational International, Upper Saddle River, NJ.
Breiman, L. 2001. Random forests. Mach. Learn. 45: 5-32.
Burris, E., D. Burns, K.S. McCarter, C. Overstreet, M. Wolcott, and E. Clawson. 2010.
Evaluation of the effects of Telone II (fumigation) on nitrogen management and yield in
Louisiana delta cotton. Precis. Agric. 11: 239-257.
Chen, W., Z. Hou, L. Wu, Y. Liang, and C. Wei. 2010. Effects of salinity and nitrogen on cotton
growth in arid environment. Plant Soil 326: 61-73.
Cheng, L., and D.L. Adams. 1995. Yarn strength prediction using neural networks part I: fiber
properties and yarn strength relationship. Text. Res. J. 65: 495-500.
Cohn, E. 1973. Histology of the feeding site of Rotylenchulus reniformis. Nematologica 19: 455-
458.
Dasgupta, D.R., and A.R. Seshadri. 1971. Races of the reniform nematode, Rotylenchulus
reniformis Linford and Oliveira, 1940. Indian J. Nematol. 1: 21-24.
Davis, R.F., S.R. Koenning, R.C. Kemerait, T.D. Cummings, and W.D. Shurley. 2003.
Rotylenchulus reniformis management in cotton with crop rotation. J. Nematol. 35: 58-
64.
Gaur, H.S., and R.N. Perry. 1991. The biology and control of the plant parasitic nematode
Rotylenchulus reniformis. Agric. Zool. Rev. 4: 177-212.
Ghassemi, F., A.J. Jakeman, and H.A. Nix. 1995. Salinisation of land and water resources:
human causes, extent, management and case studies. 1st ed. CAB international,
Wallingford, Oxon, UK.
Gurney, K. 1997. An introduction to neural networks. 1st ed. CRC press, Brookfield, VT.
Hamdy, A., S. Abdel-Dayem, and M. Abu-Zeid. 1993. Saline water management for optimum
crop production. Agric. Water Manage. 24: 189-203.
Hasegawa, P.M., R.A. Bressan, J.-K. Zhu, and H.J. Bohnert. 2000. Plant cellular and molecular
responses to high salinity. Ann. Rev. Plant Biol. 51: 463-499.
Heald, C.M. 1975. Pathogenicity and histopathology of Rotylenchulus reniformis infecting
cantaloup. J. Nematol. 7: 149-152.
James, G., D. Witten, and T. Hastie. 2014. An introduction to statistical learning: With
applications in R. 1st ed. Springer, New York, NY.
12
Janardhan, K.V., A.S.P. Murthy, K. Giriraj, and S. Panchaksharaiah. 1976. Salt tolerance of
cotton and potential use of saline water for irrigation. Curr. Sci. 45: 334–336.
Jones, J.E., L.D. Newsom, and E.L. Finley. 1959. Effect of the reniform nematode on yield, plant
characters, and fiber properties of upland cotton. Agron. J. 51: 353-356.
Kang, M.S., J.D. Miller, and P.Y.P. Tai. 1983. Genetic and phenotypic path analyses and
heritability in sugarcane. Crop Sci. 23: 643-647.
Khan, A.N., R.H. Qureshi, and N. Ahmad. 1995. Performance of cotton cultivars in saline
growth media at germination stage. Sarhad J. Agric. 11: 643–646.
Korkor, S., M.Y. Tayel, and F. Antar. 1974. The effect of salinity on cotton yield and quality.
Egypt. J. Soil Sci. 14: 137–148.
Kutner, M.H., J. Neter, C.J. Nachtsheim, and W. Wasserman. 2004. Applied linear statistical
models. 5th ed. McGraw-Hill, Chicago, IL.
Latif, A., and M.A. Khan. 1976. Effect of soil salinity on cotton (Gossypium hirsutum L.) at
different stages of growth. Pak. J. Bot. 20: 91-104.
Lawrence, G.W., and K.S. McLean. 2000. Effect of foliar applications of oxamyl with aldicarb
for the management of Rotylenchulus reniformis on cotton. J. Nematol. 32: 542-549.
Lawrence, G.W., K.S. McLean, W.E. Batson, D. Miller, and J.C. Borbon. 1990. Response of
Rotylenchulus reniformis to nematicide applications on cotton. J. Nematol. 22: 707-711.
Lawrence, K., M. Olsen, T. Faske, R. Hutmacher, J. Muller, J. Mario, R. Kemerait, C.
Overstreet, G. Sciumbato, G. Lawrence, S. Atwell, S. Thomas, S. Koenning, R. Boman,
H. Young, J. Woodward, and H. Mehl. 2014. Cotton disease loss estimate committee
report, 2013. p. 247-248. In Proc. Beltwide Cotton Conf., New Orleans, LA. Jan. 6-8.
Natl. Cotton Counc. Am., Memphis, TN.
Leach, M., P. Agudelo, and P. Gerard. 2009. Effect of temperature on the embryogenesis of
geographic populations of Rotylenchulus reniformis. J. Nematol. 41: 23-27.
Longenecker, D.E. 1974. The influence of high sodium in soils upon fruiting and shedding, boll
characteristics, fiber properties, and yields of two cotton species. Soil Sci. 118: 387-396.
Maas, E.V., and G.J. Hoffman. 1977. Crop salt tolerance\current assessment. J. Irr. Drain. Div.
103: 115-134.
Majumdar, A. 2010. Selection of raw materials in textile spinning industry using fuzzy multi-
criteria decision making approach. Fibers Polym. 11: 121-127.
McGawley, E.C., M.J. Pontif, and C. Overstreet. 2010. Variation in reproduction and
pathogenecity of geographic isolates of Rotylenchulus reniformis on cotton. Nematropica
40: 275-288.
13
Moore, S.R., K.S. Lawrence, F.J. Arriaga, C.H. Burmester, and E. Van Santen. 2010a. Natural
migration of Rotylenchulus reniformis in a no-till cotton system. J. Nematol. 42: 307-312.
Morgan, J. 2010. Salt water killing soybeans in Louisiana.
http://deltafarmpress.com/soybeans/salt-water-killing-soybeans-louisiana (accessed 6
July 2014).
Munns, R., and M. Tester. 2008. Mechanisms of salinity tolerance. Ann. Rev. Plant Biol. 59:
651-681.
National Cottonseed Products Association. 2014. Cottonseed oil.
http://www.cottonseed.com/publications/default.asp (accessed 11 June 2014).
Parida, A.K., and A.B. Das. 2005. Salt tolerance and salinity effects on plants: a review.
Ecotoxicol. Environ. Saf. 60: 324-349.
Pasapula, V., G. Shen, S. Kuppu, V. Paez, Julio, M. Mendoza, P. Hou, J. Chen, X. Qiu, L. Zhu,
X. Zhang, D. Auld, E. Blumwald, H. Zhang, R. Gaxiola, and P. Payton. 2011. Expression
of an Arabidopsis vacuolar H+-pyrophosphatase gene (AVP1) in cotton improves drought
and salt tolerance and increases fibre yield in the field conditions. Plant Biotech. J. 9: 88-
99.
Ramesh, M.C., R. Rajamanickam, and S. Jayaraman. 1995. The prediction of yarn tensile
properties by using artificial neural networks. J.Text. I. 86: 459-469.
Reinhardt, D.H., and T.L. Rost. 1995. Primary and lateral root development of dark- and light-
grown cotton seedlings under salinity stress. Bot. Acta 108: 457-465.
Rich, J.R., and R.A. Kinloch. 2000. Influence of aldicarb and 1, 3-dichloropropene applications
on cotton yield and Rotylenchulus reniformis post-harvest populations. Nematropica 30:
47-54.
Robinson, A.F. 2007. Reniform in U.S. cotton: when, where, why, and some remedies. Annu.
Rev. Phytopathol. 45: 263-288.
Sasser, P.E. 1981. Basics of high volume instruments for fiber testing. p. 4-8. In Proc. Beltwide
Cotton Prod. Res. Conf., New Orleans, LA. 4-8 Jan. 1981. Natl. Cotton Counc. Am.,
Memphis,TN.
Shofner, F.M., Y.T. Chu, and D.P. Thibodeaux. 1990. An overview of the advanced fiber
information system. p. 173-181. In Proc. Int. Cotton Conf., Faserinstitut, Bremen,
Germany.
Singh, N., and M.F. Azam. 2011. Studies on the status of races of reniform nematode,
Rotylenchulus reniformis infecting castor in Aligarh district of UP. Curr. Nematol. 22:
69-74.
14
Starr, J.L., S.R. Koenning, T.L. Kirkpatrick, A.F. Robinson, P.A. Roberts, and R.L. Nichols.
2007. The future of nematode management in cotton. J. Nematol. 39: 283-294.
Suh, M.W., and P.E. Sasser. 1996. The technological and economic impact of high volume
instrument (HVI) systems on the cotton and cotton textile industries. J.Text. I. 87: 43-59.
Tilahun, Y., K. Soliman, K.S. Lawrence, L.J. Cseke, and J.W. Ochieng. 2008. Nuclear ribosomal
DNA diversity of a cotton pest (Rotylenchulus reniformis) in the United States. Afr. J.
Biotech. 7: 3217-3224.
USDA. 2014. Cotton: world markets and trade.
http://apps.fas.usda.gov/psdonline/circulars/cotton.pdf (accessed 10 September 2014).
Wang, R., Y. Kang, S. Wan, W. Hu, S. Liu, and S. Liu. 2011. Salt distribution and the growth of
cotton under different drip irrigation regimes in a saline area. Agric. Water Manage. 100:
58-69.
Wang, W., B. Vinocur, and A. Altman. 2003. Plant responses to drought, salinity and extreme
temperatures: towards genetic engineering for stress tolerance. Planta 218: 1-14.
Wang, Y., and N. Nii. 2000. Changes in chlorophyll, ribulose bisphosphate carboxylase-
oxygenase, glycine betaine content, photosynthesis and transpiration in Amaranthus
tricolor leaves during salt stress. J. Hortic. Sci. Biotech. 75: 623-627.
Wolcott, M., C. Overstreet, E. Burris, D. Cook, D. Sullivan, G.B. Padgett, and R. Goodson.
2005. Evaluating cotton nematicide response across soil electrical conductivity zones
using remote sensing. p. 215-220. In Proc. Belt. Cotton Conf., 4-7 Jan. 2005. Natl. Cotton
Counc. Am., Memphis, TN.
Ye, W.W., J.D. Liu, B.X. Fan, and Q.M. Hu. 1997. The effect of salt on the fibre characteristics
in upland cotton. China Cottons 24: 17-18.
Younis, M.E., M.N.A. Hasaneen, and M.M. Nemet-Alla. 1987. Plant growth, metabolism and
adaptation in relation to stress conditions IV. Effects of salinity on certain factors
associated with the germination of three different seeds high in fats. Ann. Bot. 60: 337-
344.
Zhu, R., and M.D. Ethridge. 1996. The prediction of cotton yarn irregularity based on the
‘AFIS’measurement. J.Text. I. 87: 509-512.
15
CHAPTER 2: RESPONSE OF FIVE RESISTANT/TOLERANT COTTON CULTIVARS
TO ISOLATES OF ROTYLENCHULUS RENIFORMIS COLLECTED FROM
RENIFORM INFESTED FIELDS OF LOUISIANA
2.1 INTRODUCTION
Cotton (primarily Gossypium hirsutum L. and to a lesser extent G. barbadense, G.
arboreum, and G. herbaceum) is the leading textile fiber as well as one of the most important
oilseed crops in the world. In terms of total area harvested, cotton ranks fourth after corn,
soybean and wheat in the United States. Approximately two-thirds of the cotton grown in the US
is exported, amounting to 10.50 million bales (500 lbs lint/bale) in 2012/13. Exports have been
steadily rising as a percent of total production largely due to strong demand from China (USDA,
2014). Globally, US cotton production is ranked third after China and India. In the US, it is
estimated that 13.19 million bales were produced in 2013/2014, 24% lower than in 2012/2013. In
comparison, world cotton production in 2013/14 (117.81 million bales) decreased 4% relative to
2012/2013. This worldwide production decrease is a direct response to a decrease in planted area
from 34.13 to 33.12 million hectares in 2013/14 to 2012/13, respectively. In the US, the
production decrease in 2013/14 vs 2012/13 is largely a result of a decrease in production area
from 3.79 to 3.10 million hectares (USDA, 2014). As an oilseed, cotton is ranked third,
worldwide, in terms of volume behind soybean and corn. The oil produced from cotton is largely
used for human consumption. The cake left after oil extraction is a high protein animal feed
principally used in the beef and dairy industries (National Cottonseed Products Association,
2014). Collectively, these uses contribute to cotton’s prominence as one of the important
agricultural row crops in the US.
Cotton is vulnerable to several plant insects and diseases that decrease production. Out of
12% loss in cotton production caused by various insects and diseases, the loss caused by
16
reniform nematode (Rotylenchulus reniformis) is estimated to be 1.48% in the US (Lawrence et
al., 2014). The most severe yield losses (> 4%) to reniform nematode are observed in Louisiana,
Arkansas, Georgia, Mississippi, Texas, and Tennessee (Lawrence et al., 2014). Depending upon
the level of infestation, cultivars grown, and environment conditions, yield losses caused by
reniform nematode have been estimated to be as high as 40% (Farias et al., 2002). The reniform
nematode was first reported as a cotton parasite in Louisiana in 1941 (Smith and Taylor, 1941).
Since the initial report of its occurrence in Louisiana, the reniform nematode has spread,
increasing from 3 to 24 parishes during the period of 1961 to 2010 (McGawley et al., 2010).
Compared to the root knot nematode (Meloidogyne incognita), the area infested by reniform
nematode has increased rapidly over the years because of its short life cycle (16-22 days), its
ability to establish feeding sites along primary, secondary and tertiary roots, as well as its ability
to survive in desiccated weather and soil conditions (Gaur and Perry, 1991; Rebois, 1973). Due
to its aggressive nature, the reniform nematode out competes root knot nematode populations in
cotton fields and has rapidly begun the major nematode pathogen affecting cotton production
(Robinson, 2007).
Reniform nematode is a sedentary, amphimictic and semi endoparasite, which feeds on
more than 350 plant species across 77 families in warm temperate, sub-tropical, and tropical
regions of world (Gaur and Perry, 1991). The mature female is easily identified by her kidney
shape, while the male is vermiform in shape and shorter than females. The life cycle of the
reniform nematode is comprised of four vermiform stages i.e. eggs, J1, J2 J3, J4 and adults. A
mature female can lay from 60-200 eggs in a gelatinous matrix she exudes on the surface of plant
roots (Dasgupta and Seshadri, 1971). It takes 7-10 days for eggs to hatch before entering the
different vermiform stages, which are demarcated by molting. Upon infection by root

17
penetration, a multinucleated cell is formed from the dissolution of cell walls between adjacent
cells forming a syncytia (Cohn, 1973; Heald, 1975). Upon infestation, the anterior portion of
female is embedded in the root, whereas posterior portion remains outside the root surface. After
establishing a feeding site in the root cortex, females develop further and form the typical kidney
shape (Gaur and Perry, 1991). The life cycle of the reniform nematode normally takes about 16-
22 days, but is dependent upon the host species, temperature, and soil conditions (Bird, 1984;
Gaur and Perry, 1991; Leach et al., 2009). Host plant symptoms include stunting, yellowing of
lower leaves, browning of the lower margins and tips, a delay in maturity, and yield reduction
(pathogenicity) (Birchfield and Jones, 1961; Jones et al., 1959).
Cotton growers have various management options available to reduce yield loss due to
reniform nematode infestation. These include crop rotation, the use of nematicides or the
planting of resistant/tolerant varieties to manage reniform nematodes in the field (Burris et al.,
2010; Davis et al., 2003; Robinson, 2007; Starr et al., 2007). Crop rotation with non-host crops,
such as peanut, corn, resistant soybean or sorghum is effective in reducing the reniform
population (Davis et al., 2003; Gazaway et al., 2000; Koenning et al., 2004). Nematicides are a
reliable option for growers because they are easy to apply at the time of planting and effectively
reduce initial nematode population densities (Lawrence and McLean, 2000; Lawrence et al.,
1990; Rich and Kinloch, 2000; Wolcott et al., 2005). However, there are environmental concerns
associated with nematicide use and they can be expensive. Host plant resistance is an effective,
viable, and typically profitable management option to manage and control nematode infestations
in cotton fields. To date, several cotton germplasm lines that show moderate to high levels of
resistance or tolerance to the reniform nematode have been released (Bell et al., 2014; McCarty
et al., 2013; McCarty et al., 2012; Robinson et al., 2004; Robinson and Percival, 1997; Yik and
18
Birchfield, 1984). No commercial cultivars that have high level of resistance to reniform
nematode are available.
Due to increasing infestation of the reniform nematodes in cotton fields, researchers
started screening wild and cultivated species of cotton genotypes to identify a source of
resistance for reniform nematode in late 1980. Yirk and Birchfield (1984) evaluated four
different species of Gossypium and found that the germplasm line TX-110 was highly tolerant to
reniform nematodes. Robinson et al. (2004) screened 1866 primitive accessions of G. hirsutum
and 907 of G. barbendese against reniform nematodes. They reported that a majority of the G.
hirsutum accessions were moderate to highly susceptible, while six primitive accessions of G.
barbendese were moderately tolerant to reniform nematode. Out of these six accessions, GB-713
was highly tolerant to reniform nematodes and has been widely used to develop reniform
resistant breeding germplasm. Bell et al. (2014) developed two highly reniform resistant lines;
Lonren-1 and Lonren-2 by introgression of a source of reniform resistance from G. longicalyx
into upland cotton. Stewart and Robbins (1994) evaluated Asiatic cotton germplasm and found
that G. arboreum (A2-190) was highly tolerant to reniform nematodes. Although moderate levels
of reniform resistance were observed in wild species of G. aridum and G. herbaceum, they are
not extensively used for breeding because of genetic incompatibility and linkage drag.
Past research on the reniform nematode was conducted by using a single isolate collected
from a specific geographical region of US, typically a locally infested field. However, variations
in both morphological and genetic, as well in reproduction and pathogenicity of the isolates, have
been observed (Agudelo et al., 2005; Arias et al., 2009; Dasgupta and Seshadri, 1971;
McGawley et al., 2010; Tilahun et al., 2008). Dasgupta and Seshadri (1971) designated two races
of reniform nematode, i.e. race A and race B, based on host assay and the rate of reproduction on
19
castor, cowpea and cotton in India. Out of ten isolates, nine isolates of similar morphology
reproduced on all three hosts, while one isolate reproduced only on cowpea. In Japan, Nakasono
(2004) classified the reniform nematode into three categories: small, medium, and large based on
body size and three different biological types, i.e. male-numerous type, male-rare type, and male-
absent type. Rao and Ganguly (1998) reported a variation in body length and width, stylet length,
distance from head to vulva, and position of the dorsal esophageal gland orifice among reniform
populations from different geographic regions in India. Agudelo et al. (2005) observed variation
in nematode morphology and reproduction among isolates collected from different geographical
regions. They reported that a reniform population collected from Hawaii has a larger body than
other isolates, while a population collected from Limestone, Alabama has a small body size.
Morphological variations i.e. size and length of stylet, position of esophagus gland orifice, and
esophagus length were also observed among reniform populations. The population collected
from Limestone, Alabama had a higher rate of reproduction on the hosts than isolates collected
from Huxford, Alabama, Louisiana, and Hawaii.
Based on the 18S ribosomal DNA and first internally transcribed space (ITS1), genetic
variation was observed among the populations collected within reniform infested fields of
Alabama (Tilahun et al., 2008). Arias et al. (2009) reported that 88 microsatellite markers are
polymorphic across six isolates collected from Texas, Louisiana, Mississippi, and Georgia. The
isolate collected from Georgia had the highest reproduction and pathogenicity as compared to
other isolates. McGawley et al. (2010) showed that reniform populations collected from
Mississippi and Louisiana had higher reproduction than populations collected from Arkansas,
Texas, Hawaii, and Alabama. A common feature of all of these studies, however, is that the
20
reproduction and pathogenicity tests were conducted upon a single host genotype (but not
necessarily the same one across the studies).
It is now established that there is variability in reproduction and pathogenicity among
various reniform nematode isolates collected from different US States. The variation in
reproduction and pathogenicity may have an impact on host plant resistance management. It is
unknown if there is variation among reniform nematode isolates collected from reniform infested
fields within Louisiana. Furthermore, if variation does exist, is it detectable by the use of
different host genotypes of the same genus. It would be valuable to establish a differential
response of resistant/tolerant lines of cotton to different reniform isolates if such variation exists.
Therefore, this study seeks to evaluate the response of tolerant cotton cultivars to reniform
nematode isolates collected from reniform infested fields in Louisiana and provide information
useful to plant breeders for future research to develop cotton cultivars with resistance/tolerance
to the reniform nematode.
2.2 MATERIALS AND METHODS
2.2.1 Reniform isolates and cotton cultivars
Five isolates collected from reniform nematode infested fields in Louisiana were used in
this study (Table 2.1). Using a dissecting microscope, 25 egg masses were collected from each
isolate and transferred to previously established tomato seedlings (Lycopersium esculentum L.
cv. ‘Rutgers’) planted in 20.3 cm (diameter) terra cotta pots filled with steam pasteurized sandy
loam soil in a greenhouse under natural light conditions. The reniform isolates were carefully
handled and maintained in the greenhouse to maintain isolate purity. Reniform inoculum was
extracted on the day of inoculation by using the centrifugal sugar flotation technique (Jenkins,
1964).
21
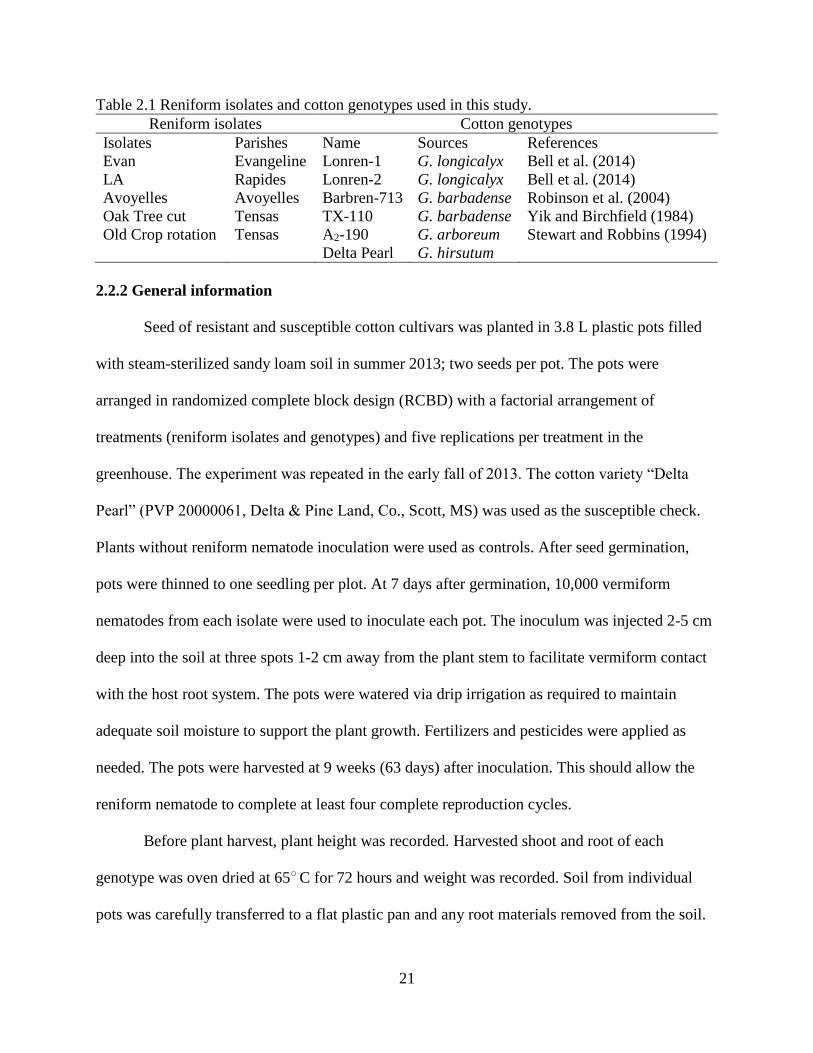
Table 2.1 Reniform isolates and cotton genotypes used in this study.
Reniform isolates Cotton genotypes
Isolates Parishes Name Sources References
Evan Evangeline Lonren-1 G. longicalyx Bell et al. (2014)
LA Rapides Lonren-2 G. longicalyx Bell et al. (2014)
Avoyelles Avoyelles Barbren-713 G. barbadense Robinson et al. (2004)
Oak Tree cut Tensas TX-110 G. barbadense Yik and Birchfield (1984)
Old Crop rotation Tensas A2-190 G. arboreum Stewart and Robbins (1994)
Delta Pearl G. hirsutum
2.2.2 General information
Seed of resistant and susceptible cotton cultivars was planted in 3.8 L plastic pots filled
with steam-sterilized sandy loam soil in summer 2013; two seeds per pot. The pots were
arranged in randomized complete block design (RCBD) with a factorial arrangement of
treatments (reniform isolates and genotypes) and five replications per treatment in the
greenhouse. The experiment was repeated in the early fall of 2013. The cotton variety “Delta
Pearl” (PVP 20000061, Delta & Pine Land, Co., Scott, MS) was used as the susceptible check.
Plants without reniform nematode inoculation were used as controls. After seed germination,
pots were thinned to one seedling per plot. At 7 days after germination, 10,000 vermiform
nematodes from each isolate were used to inoculate each pot. The inoculum was injected 2-5 cm
deep into the soil at three spots 1-2 cm away from the plant stem to facilitate vermiform contact
with the host root system. The pots were watered via drip irrigation as required to maintain
adequate soil moisture to support the plant growth. Fertilizers and pesticides were applied as
needed. The pots were harvested at 9 weeks (63 days) after inoculation. This should allow the
reniform nematode to complete at least four complete reproduction cycles.
Before plant harvest, plant height was recorded. Harvested shoot and root of each
genotype was oven dried at 65○ C for 72 hours and weight was recorded. Soil from individual
pots was carefully transferred to a flat plastic pan and any root materials removed from the soil.
22
After thoroughly mixing the soil, 250 g of soil was taken for extraction of vermiform nematodes
using an elutriator (customized by Agriculture Engineering, University of Georgia, 1998) (Byrd
et al., 1976). A soil suspension was poured through the elutriator and collected on stacked sieves
arranged 100 mesh sieve on the top followed by a 400 mesh sieve. The materials collected on the
400 mesh sieve was transferred into a 50 mL centrifuge tube and centrifuged at 1500 rpm
(revolutions per minute) for 5 minutes. The suspension at the top of centrifuge tube was carefully
discarded without disturbing the soil pellet at the bottom. About forty (40) mL of sugar solution
(450 g sucrose/L) was added and thoroughly mixed in the centrifuge tube. This was then
centrifuged at 1500 rpm for 1 minute. The supernatant was quickly poured into 400 mesh sieve
and washed thoroughly with tap water. The suspension was collected in graduated sample
beakers and adjusted to the final volume of 100 mL. For vermiform counting, 10 mL of
suspension was pipetted onto a petri dish having 5 mm cross section lines. Using the dissecting
microscope, vermiform nematodes across a cross section (2 or 4 lines) were counted at 4X (or
10X) and multiplied by 800 (counted across 2 cross section line) or 400 (4 cross sectional lines)
to calculate the total number of reniform nematodes in 250 gram soil. The number of nematodes
in 250 gram of soil was multiplied by 10 to get the total number of vermiform nematodes (pf) in
each pot. The reproduction value (Rf) was determined by dividing the final population (pf) by
the initial inoculum level (pi).
2.2.3 Statistical analysis
Analysis of variance (ANOVA) were conducted using SAS 9.3 (SAS Institute Inc., Cary,
NC) for number of vermiform nematodes per 250 g soil, plant height, dry shoot and root weight.
Prior to ANOVA, the number of vermiform nematodes was log transformed to meet an
23
assumption of normality. To determine the difference among isolates and genotypes, T-grouping
was used for mean comparisons.
2.3 RESULTS
2.3.1 Reproduction of reniform isolates on cotton genotypes
The reproduction value of reniform isolates across the different genotypes is presented in
Table 2.2. Based on the reproduction on Delta Pearl (susceptible check), the Evan isolate had the
highest reproduction value (Rf) followed by the Avoyelles isolate, while the lowest reproduction
was reported in the Oak Crop rotation isolate. The reproduction values of reniform isolates on
Lonren-1, Lonren-2, and G. arboreum (A2-190) were lower than on TX-110 and Barbren-713
genotypes (Table 2.2).
Table 2.2 The reproduction values (Rf) of reniform isolates across cotton genotypes.
Reniform isolates
Genotypes Evan LA Old Crop rotation Oak Tree cut Avoyelles
Delta Pearl 107.60 66.80 51.04 61.76 86.08
TX-110 29.52 14.96 20.28 17.00 32.00
Barbren-713 29.32 10.56 13.76 12.72 21.52
Lonren-1 17.72 10.40 11.76 3.12 10.64
Lonren-2 9.36 7.52 8.44 3.36 7.40
A2-190 9.24 4.76 7.08 3.20 9.16
The two nine week duration experiments were combined for analyses of variance because
there were not significant differences for a number of vermiform nematodes between two set of
experiments. There were significant differences among reniform isolates and genotypes for a
number of vermiform nematodes (P<0.01). There was a significant interaction between
genotypes and isolates for a number of vermiform nematodes implying that there was a
differential response of different cotton genotypes across reniform isolates (P<0.01) (Table 2.3).
This might be expected due to the different sources of reniform resistance genes among the
24
tested genotypes. Lonren-1 and Lonren-2 are derived from G. longicalyx, while Barbren-713
derives its resistance from G. barbadense L. accession GB713.
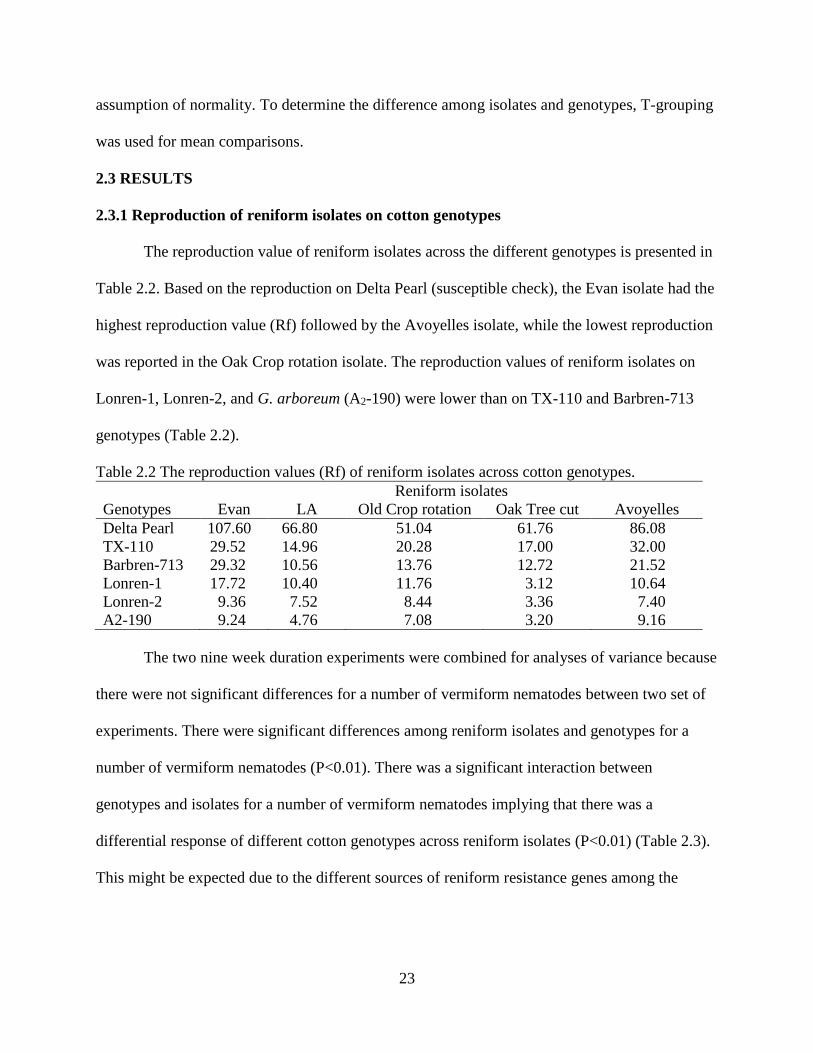
Table 2.3 Number of vermiform nematodes as affected by reniform isolate and cotton genotype.
Source df Mean square F value
Isolate 4 1.52 36.54**
Genotype 5 8.41 201.89**
Isolate x Genotype 20 0.12 2.73**
**=Significant at P ≤ 0.01.
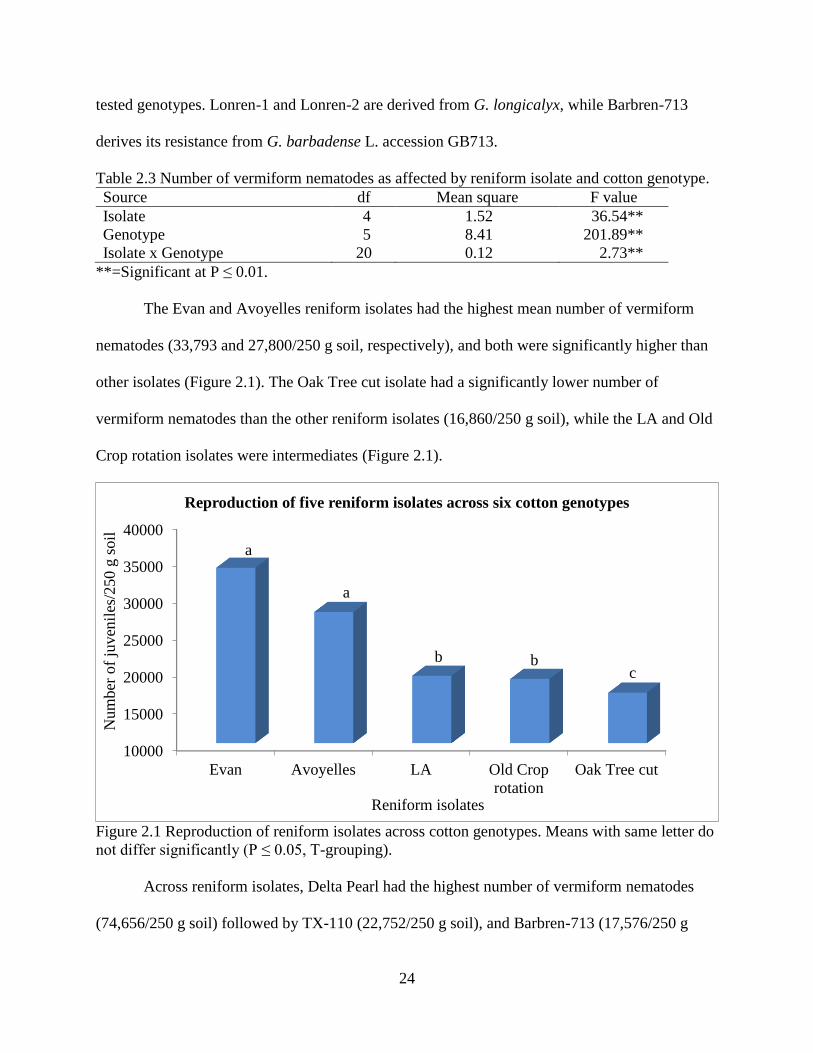
The Evan and Avoyelles reniform isolates had the highest mean number of vermiform
nematodes (33,793 and 27,800/250 g soil, respectively), and both were significantly higher than
other isolates (Figure 2.1). The Oak Tree cut isolate had a significantly lower number of
vermiform nematodes than the other reniform isolates (16,860/250 g soil), while the LA and Old
Crop rotation isolates were intermediates (Figure 2.1).
Figure 2.1 Reproduction of reniform isolates across cotton genotypes. Means with same letter do
not differ significantly (P ≤ 0.05, T-grouping).
Across reniform isolates, Delta Pearl had the highest number of vermiform nematodes
(74,656/250 g soil) followed by TX-110 (22,752/250 g soil), and Barbren-713 (17,576/250 g
10000
15000
20000
25000
30000
35000
40000
Evan Avoyelles LA Old Crop
rotation
Oak Tree cut
Num
ber
of
juven
iles
/250 g
soil
Reniform isolates
Reproduction of five reniform isolates across six cotton genotypes
a
a
b bc
25
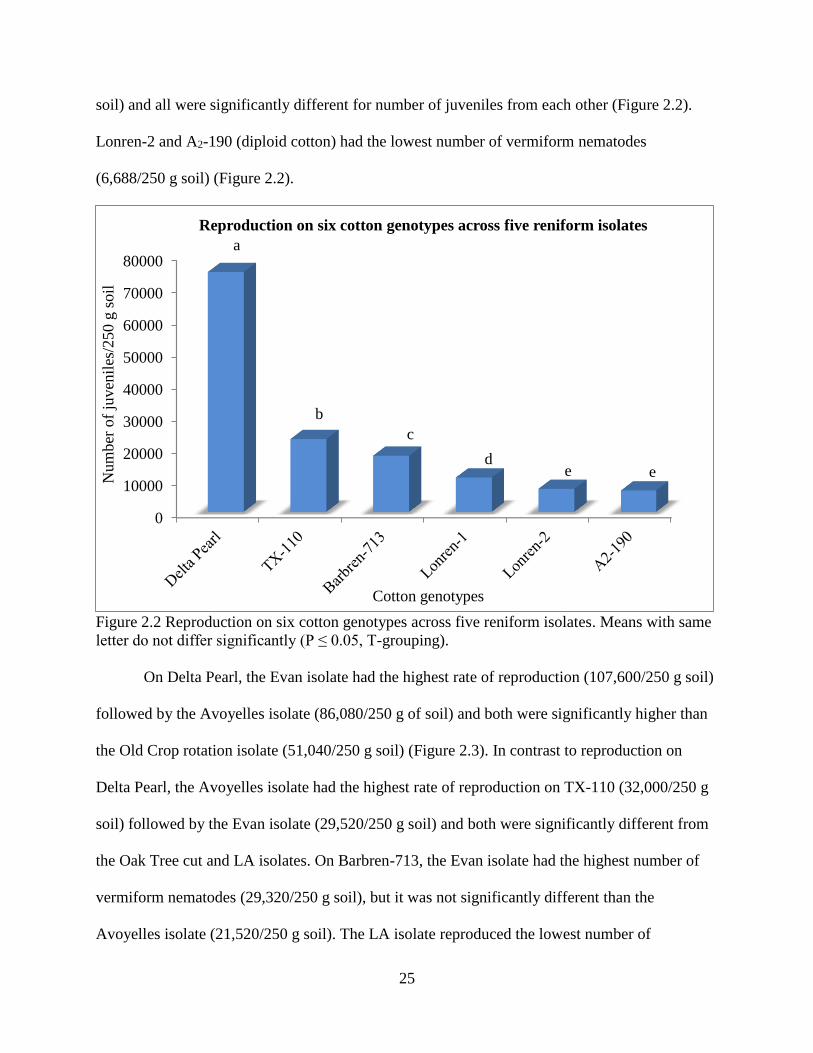
soil) and all were significantly different for number of juveniles from each other (Figure 2.2).
Lonren-2 and A2-190 (diploid cotton) had the lowest number of vermiform nematodes
(6,688/250 g soil) (Figure 2.2).
Figure 2.2 Reproduction on six cotton genotypes across five reniform isolates. Means with same
letter do not differ significantly (P ≤ 0.05, T-grouping).
On Delta Pearl, the Evan isolate had the highest rate of reproduction (107,600/250 g soil)
followed by the Avoyelles isolate (86,080/250 g of soil) and both were significantly higher than
the Old Crop rotation isolate (51,040/250 g soil) (Figure 2.3). In contrast to reproduction on
Delta Pearl, the Avoyelles isolate had the highest rate of reproduction on TX-110 (32,000/250 g
soil) followed by the Evan isolate (29,520/250 g soil) and both were significantly different from
the Oak Tree cut and LA isolates. On Barbren-713, the Evan isolate had the highest number of
vermiform nematodes (29,320/250 g soil), but it was not significantly different than the
Avoyelles isolate (21,520/250 g soil). The LA isolate reproduced the lowest number of
0
10000
20000
30000
40000
50000
60000
70000
80000
Num
ber
of
juven
iles
/250
g s
oil
Cotton genotypes
Reproduction on six cotton genotypes across five reniform isolates
a
b
c
de e
26
vermiform nematodes (10,500/250 g soil) and was not significantly different than the Old Crop
rotation and Oak Tree cut isolates (Figure 2.3). The data also showed that the differences in
number of juveniles of reniform isolates across the cotton genotypes were much wider than the
differences in reproduction of reniform isolates within the cotton genotypes.
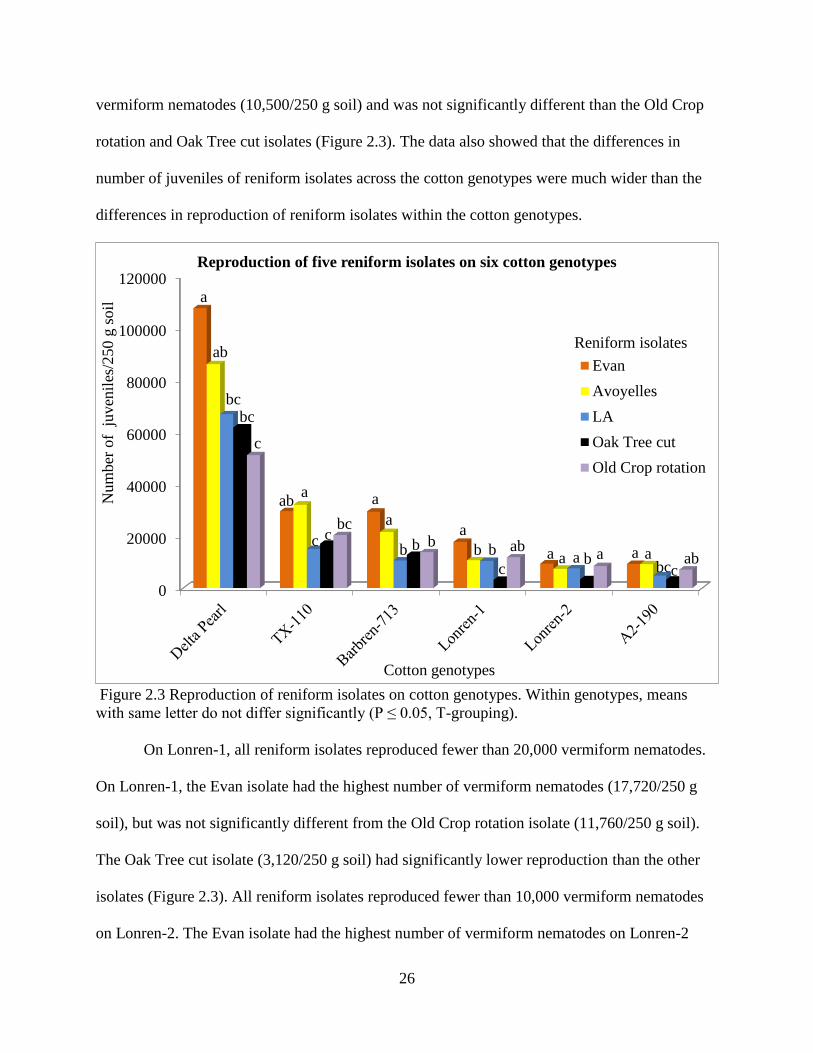
Figure 2.3 Reproduction of reniform isolates on cotton genotypes. Within genotypes, means
with same letter do not differ significantly (P ≤ 0.05, T-grouping).
On Lonren-1, all reniform isolates reproduced fewer than 20,000 vermiform nematodes.
On Lonren-1, the Evan isolate had the highest number of vermiform nematodes (17,720/250 g
soil), but was not significantly different from the Old Crop rotation isolate (11,760/250 g soil).
The Oak Tree cut isolate (3,120/250 g soil) had significantly lower reproduction than the other
isolates (Figure 2.3). All reniform isolates reproduced fewer than 10,000 vermiform nematodes
on Lonren-2. The Evan isolate had the highest number of vermiform nematodes on Lonren-2
0
20000
40000
60000
80000
100000
120000
Num
ber
of
juven
iles
/250
g s
oil
Cotton genotypes
Reproduction of five reniform isolates on six cotton genotypes
Evan
Avoyelles
LA
Oak Tree cut
Old Crop rotation
ab
bcbc
c
aab
c cbc
a
a
b b ba
abb b
ca a a ab a a ab
bcc
a
Reniform isolates
27
(9,360/250g soil), but it was not significantly different compared to the Old Crop rotation, LA
and Avoyelles isolates. Since both Lonren-1 and Lonren-2 have resistance from G. longicalyx
source, they demonstrated a similar pattern of response to the different reniform isolates. Lonren-
1 and Lonren-2 suppressed reproduction the most of all tetraploid genotypes across all isolates.
Even the order of the isolates is generally preserved, although Lonren-2 limited reproduction
almost twice as much as Lonren-1. On the diploid cotton genotype, G. arboreum (A2-190), the
Evan isolate had the highest reproduction potential (9,240/250 g soil) followed by the Avoyelles
isolate (9,160/250 g soil), but they were not significantly different with each other or the Old
Crop rotation isolate.
2.3.2 Effect of reniform isolates on plant height
As was true for reproduction, there were significant differences among reniform isolates
and cotton genotypes for plant height (P<0.01). There was also a significant interaction between
the genotypes and isolates for plant height suggesting that there is a differential pathogenicity of
reniform isolates across the cotton genotypes (P<0.01) (Table 2.4). Mirroring the reproduction
numbers, the Evan and Avoyelles isolates reduced plant height the most across the genotypes
(Figure 2.4).
Table 2.4 Impact of cotton genotype and reniform isolate on plant height, dry shoot and root
weight.
Plant height Dry shoot weight Dry root weight
Source df Mean
square
F value Mean
square
F value Mean
square
F value
Isolate 5 2470.91 15.04** 116.80 7.50** 25.27 17.47**
Genotype 5 12265.00 74.65** 408.94 26.25** 63.08 43.60**
Isolate*
Genotype
25 418.28 2.55** 21.07 1.35 1.73 1.20
**=Significant different at P ≤ 0.01.
The controls were significantly taller than the inoculated cotton genotypes averaged over
the genotypes. The Old Crop rotation treatments gave the smallest average reduction in plant
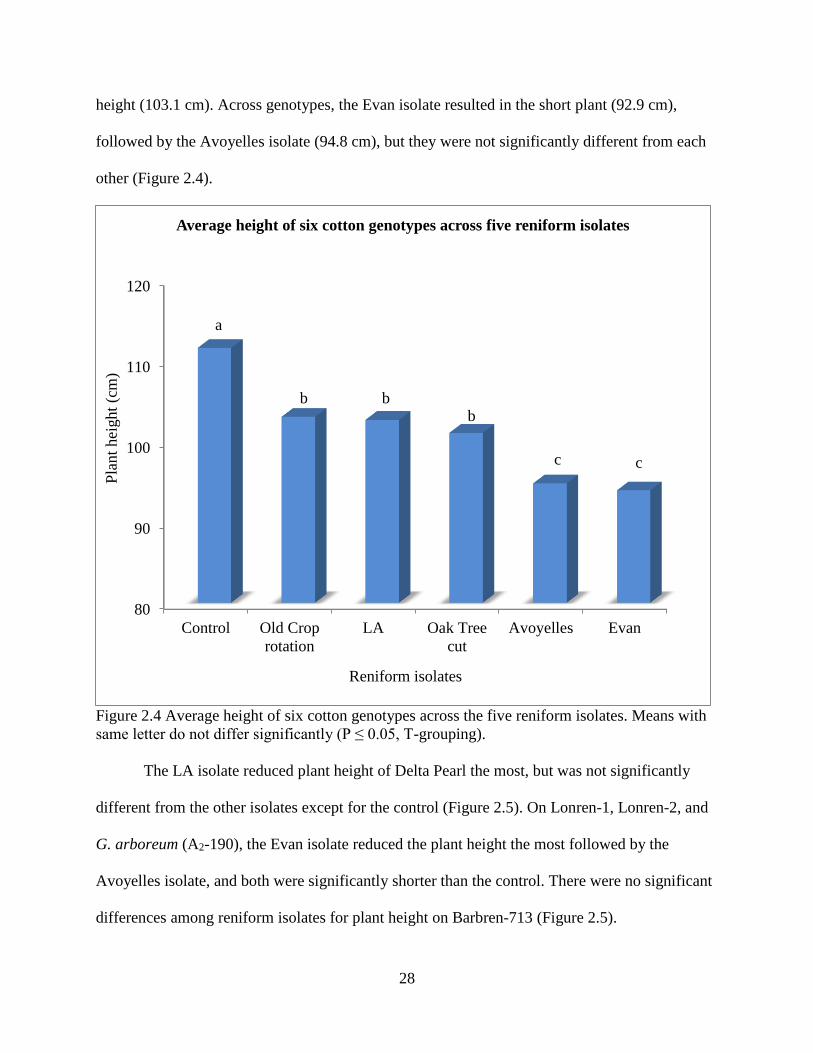
28
height (103.1 cm). Across genotypes, the Evan isolate resulted in the short plant (92.9 cm),
followed by the Avoyelles isolate (94.8 cm), but they were not significantly different from each
other (Figure 2.4).
Figure 2.4 Average height of six cotton genotypes across the five reniform isolates. Means with
same letter do not differ significantly (P ≤ 0.05, T-grouping).
The LA isolate reduced plant height of Delta Pearl the most, but was not significantly
different from the other isolates except for the control (Figure 2.5). On Lonren-1, Lonren-2, and
G. arboreum (A2-190), the Evan isolate reduced the plant height the most followed by the
Avoyelles isolate, and both were significantly shorter than the control. There were no significant
differences among reniform isolates for plant height on Barbren-713 (Figure 2.5).
80
90
100
110
120
Control Old Crop
rotation
LA Oak Tree
cut
Avoyelles Evan
Pla
nt
hei
ght
(cm
)
Reniform isolates
Average height of six cotton genotypes across five reniform isolates
a
b
c c
bb
29
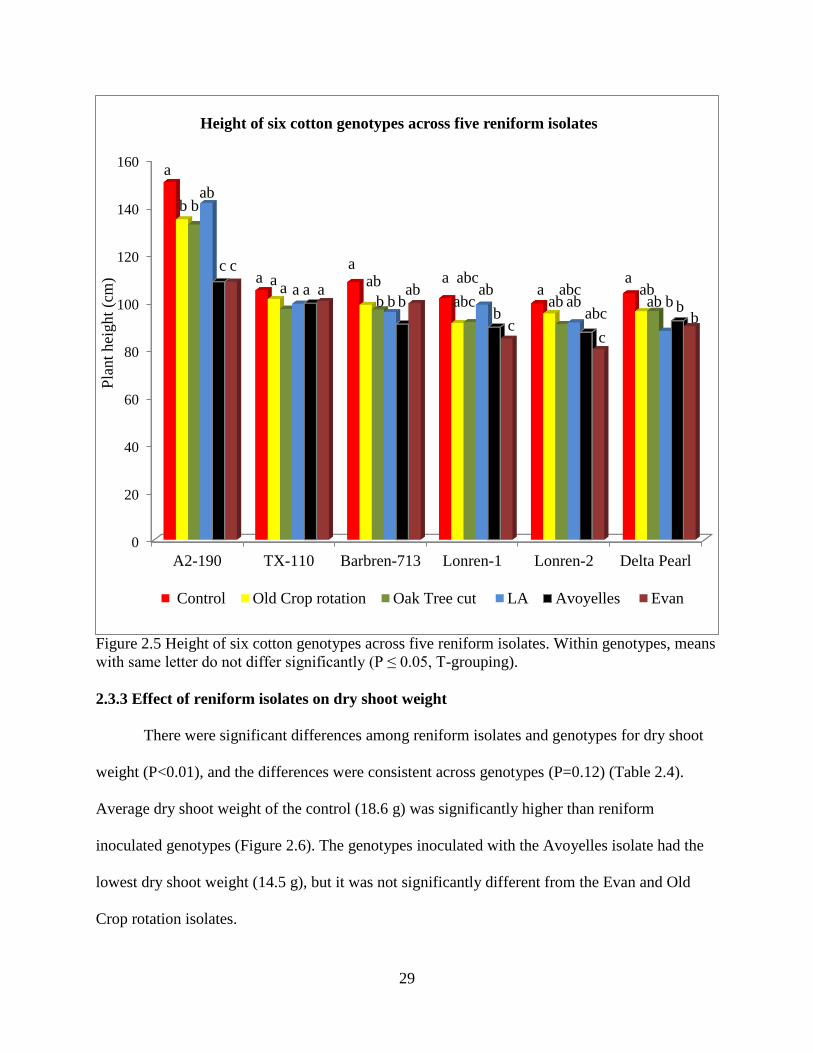
Figure 2.5 Height of six cotton genotypes across five reniform isolates. Within genotypes, means
with same letter do not differ significantly (P ≤ 0.05, T-grouping).
2.3.3 Effect of reniform isolates on dry shoot weight
There were significant differences among reniform isolates and genotypes for dry shoot
weight (P<0.01), and the differences were consistent across genotypes (P=0.12) (Table 2.4).
Average dry shoot weight of the control (18.6 g) was significantly higher than reniform
inoculated genotypes (Figure 2.6). The genotypes inoculated with the Avoyelles isolate had the
lowest dry shoot weight (14.5 g), but it was not significantly different from the Evan and Old
Crop rotation isolates.
0
20
40
60
80
100
120
140
160
A2-190 TX-110 Barbren-713 Lonren-1 Lonren-2 Delta Pearl
Pla
nt
hei
ght
(cm
)Height of six cotton genotypes across five reniform isolates
Control Old Crop rotation Oak Tree cut LA Avoyelles Evan
a
aa
aaa
aa
a
a
b
c
abb
c
b bb
abab
b
abc
abc
c
ab aab
abc
abc
c
ab b bb
abab
30
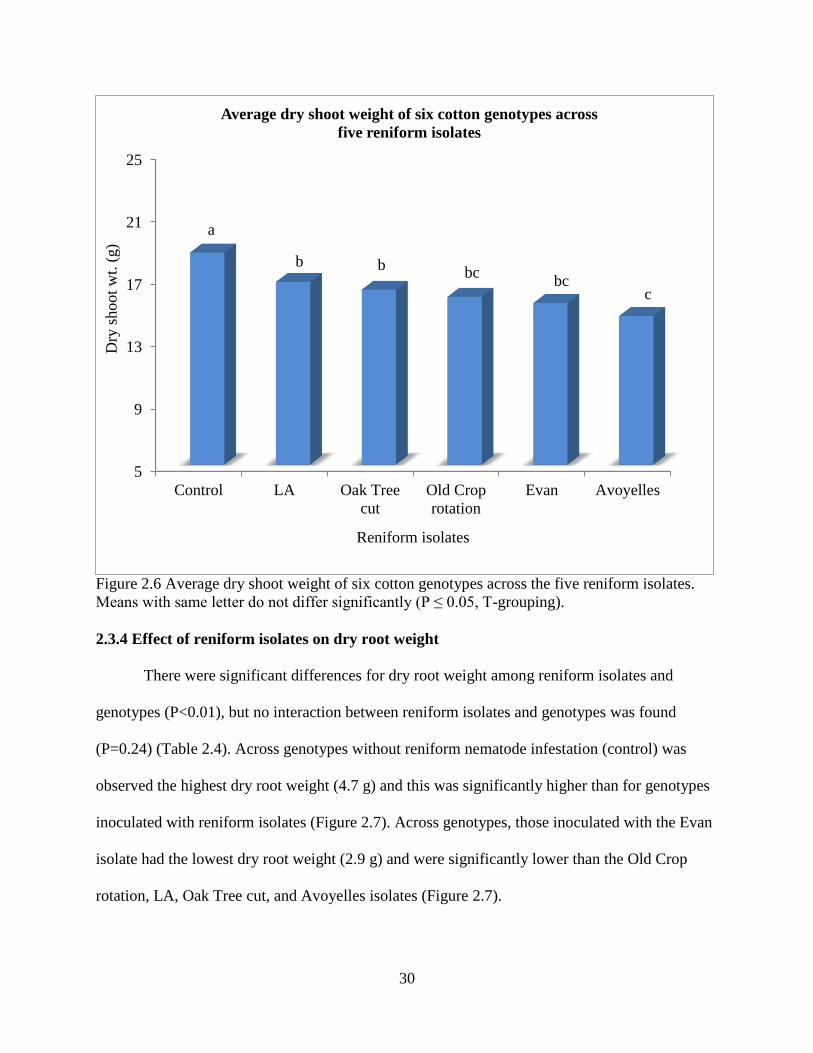
Figure 2.6 Average dry shoot weight of six cotton genotypes across the five reniform isolates.
Means with same letter do not differ significantly (P ≤ 0.05, T-grouping).
2.3.4 Effect of reniform isolates on dry root weight
There were significant differences for dry root weight among reniform isolates and
genotypes (P<0.01), but no interaction between reniform isolates and genotypes was found
(P=0.24) (Table 2.4). Across genotypes without reniform nematode infestation (control) was
observed the highest dry root weight (4.7 g) and this was significantly higher than for genotypes
inoculated with reniform isolates (Figure 2.7). Across genotypes, those inoculated with the Evan
isolate had the lowest dry root weight (2.9 g) and were significantly lower than the Old Crop
rotation, LA, Oak Tree cut, and Avoyelles isolates (Figure 2.7).
5
9
13
17
21
25
Control LA Oak Tree
cut
Old Crop
rotation
Evan Avoyelles
Dry
shoot
wt.
(g)
Reniform isolates
Average dry shoot weight of six cotton genotypes across
five reniform isolates
a
b bbc
bcc
31
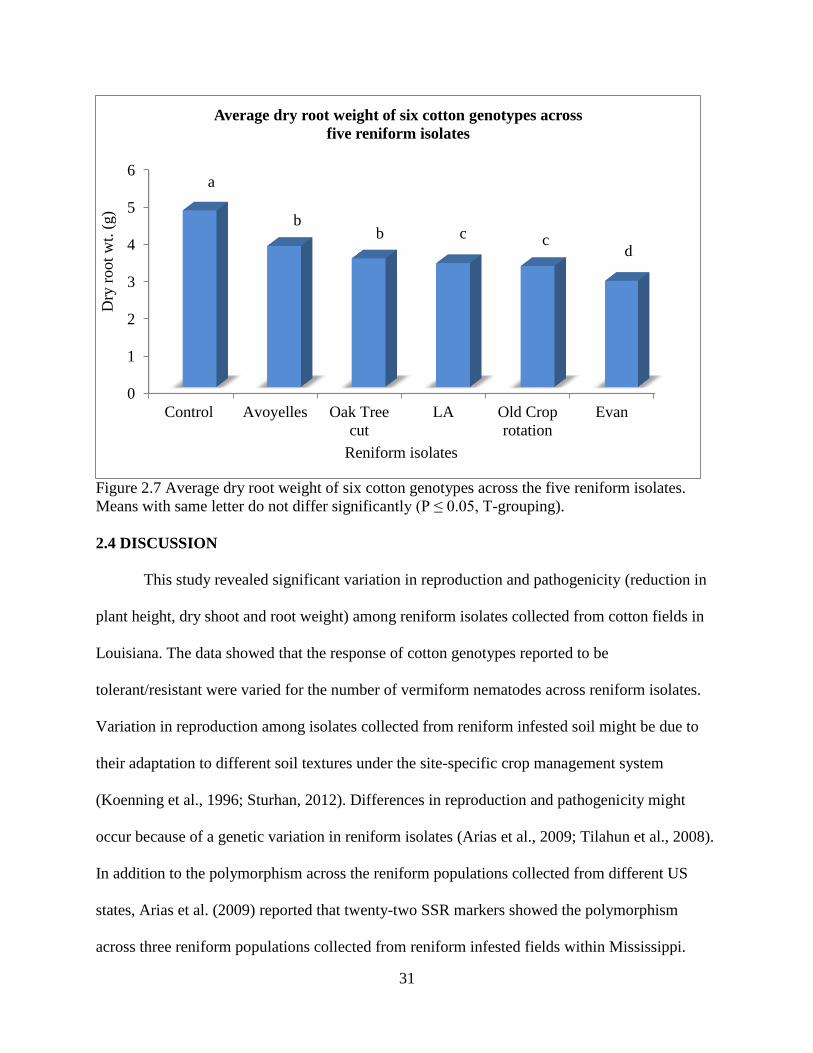
Figure 2.7 Average dry root weight of six cotton genotypes across the five reniform isolates.
Means with same letter do not differ significantly (P ≤ 0.05, T-grouping).
2.4 DISCUSSION
This study revealed significant variation in reproduction and pathogenicity (reduction in
plant height, dry shoot and root weight) among reniform isolates collected from cotton fields in
Louisiana. The data showed that the response of cotton genotypes reported to be
tolerant/resistant were varied for the number of vermiform nematodes across reniform isolates.
Variation in reproduction among isolates collected from reniform infested soil might be due to
their adaptation to different soil textures under the site-specific crop management system
(Koenning et al., 1996; Sturhan, 2012). Differences in reproduction and pathogenicity might
occur because of a genetic variation in reniform isolates (Arias et al., 2009; Tilahun et al., 2008).
In addition to the polymorphism across the reniform populations collected from different US
states, Arias et al. (2009) reported that twenty-two SSR markers showed the polymorphism
across three reniform populations collected from reniform infested fields within Mississippi.
0
1
2
3
4
5
6
Control Avoyelles Oak Tree
cut
LA Old Crop
rotation
Evan
Dry
root
wt.
(g)
Reniform isolates
Average dry root weight of six cotton genotypes across
five reniform isolates
a
bb c c
d
32
Phenotyping and the identification of polymorphic molecular markers within segregating
progenies are essential for successful quantitative trait loci (QTL) mapping and eventual marker
assisted selection. After identifying reniform resistant germplasm, cotton breeders have been
developing mapping populations and identifying QTL linked to reniform resistance loci.
Robinson et al. (2007) reported a single dominant gene was associated with reniform resistance
in G. longicalyx. Dighe et al. (2009) mapped a single dominant QTL locus, designated (Renlon),
on chromosome 11 in G. longicalyx. Romano et al. (2009) reported that a single dominate QTL
locus (Renari) on chromosome 21 is responsible for reniform resistance in G. aridium. Gutiérrez
et al. (2011) found two major QTLs linked to reniform resistance on chromosome 21 (Renbar1,
Renbar2) and one minor QTL on chromosome 18 (Renbar3) in the G. barbadense L. accession 713.
The underlying assumption in all these studies was that there is no variation among reniform
populations regardless of geographic origin and/or that the response of cotton genotypes across
reniform isolates is uniform. There is still a lack of information about whether these QTLs are
stable across different reniform isolates. In this study, the reproduction of reniform isolates on
Lonren-2 and G. arboreum (A2-190) was significantly lower than on other cotton genotypes,
Lonren-2 and G. arboreum (A2-190) also had significantly different responses across the
multiple reniform isolates. It would be valuable to investigate if QTL map differently for
reniform resistance across diverse reniform isolates.
Based on the reproduction potential, cotton fields infested with the Evan isolate are likely
to build reniform populations faster than fields infested with the Old Crop rotation or Oak Tree
cut isolates. It is anticipated that cotton fields infested with the Evan isolate may require a longer
crop rotation with corn, sorghum, resistant soybean or peanut non hosts than fields infested with
other reniform isolates to suppress the juvenile’s populations. Due to differential reproduction
33
and host preferences, Kirkpatrick and Sasser (1984) recommended a specific crop rotation
scheme for each race of root-knot nematode (Meloidogyne incognita) to suppress root-knot
populations in cotton. Due to differential rate of reproduction, application rate of nematicides
may need to vary to manage the reniform isolates in cotton fields in specific agro-ecological
regions. With respect to reproduction, the source of reniform resistance is also important to
manage the reniform nematodes in infested fields. Based on nematode reproduction on TX-110
and Barbren-713, improved cotton varieties derived from these two sources are likely to build up
the reniform population to an economic threshold level after two growing seasons and is wise to
do a crop rotation with corn, sorghum or resistance soybean after two years. Utilization of
reniform resistance sources A2-190, Lonren-2, and Lonren-1 provide better resistance than TX-
110 and Barbren-713, but growing resistant cotton year after year may lead to the resistance
breaking down to the reniform populations. Although Lonren-1 and Lonren-2 display a
hypersensitive reaction at high reniform populations, improved cultivars from these sources can
be utilized to manage Oak Tree cut and Old Crop rotation isolates because the reproduction of
these reniform isolates on Lonren-1 and Lonren-2 are quite low and may not build up enough
juvenile’s populations that cause hypersensitivity. Crop rotation with reniform resistant/tolerant
cultivars is recommended to manage reniform infested cotton fields because it maintains the
reniform population below economic threshold level and reduces the vulnerability to the
development of resistance breaking reniform populations in the field. The reproduction and
pathogenicity of specific reniform isolates as well as a degree of resistance among cotton
cultivars will dictate the type of management needed for acceptable control.
The results of this study justify further investigation into the interaction between the
reproduction of reniform isolates on different sources of resistance in cotton. It also implies that
34
different management strategies may need to be applied to reduce damage from specific reniform
nematode isolates that are specific to geographical regions. Furthermore this study suggests that
both Lonren-2 and G. arboreum (A2-190) exhibit a high level of resistance regardless of the
reniform isolates geographic origin. Within a cotton breeding program, both Lonren-1 and
Lonren-2 (both tetraploids) are good sources of resistance and relatively amenable to use though
they both, especially Lonren-1, have other agronomic performance deficiencies. The diploid
cotton G. arboreum (A2-190) exhibited the highest level of resistance across the reniform
isolates, but would be more problematic to use within a breeding program.
2.5 REFERENCES
Agudelo, P., R.T. Robbins, J.M. Stewart, and A.L. Szalanski. 2005. Intraspecific variability of
Rotylenchulus reniformis from cotton-growing regions in the United States. J. Nematol.
37: 105-144.
Arias, R.S., S.R. Stetina, J.L. Tonos, J.A. Scheffler, and B.E. Scheffler. 2009. Microsatellites
reveal genetic diversity in Rotylenchulus reniformis populations. J. Nematol. 41: 146-
156.
Bell, A.A., A. Forest Robinson, J. Quintana, N.D. Dighe, M.A. Menz, D.M. Stelly, X. Zheng,
J.E. Jones, C. Overstreet, and E. Burris. 2014. Registration of LONREN-1 and
LONREN-2 germplasm lines of upland cotton resistant to reniform nematode. J. Plant
Reg. 8: 187-190.
Birchfield, W., and J.E. Jones. 1961. Distribution of the reniform nematode in relation to crop
failure of cotton in Louisiana. Plant Dis. Rep. 45: 671-673.
Bird, A.F. 1984. Growth and moulting in nematodes: Moulting and development of the hatched
larva of Rotylenchulus reniformis. Parasitol. 89: 107-120.
Burris, E., D. Burns, K.S. McCarter, C. Overstreet, M. Wolcott, and E. Clawson. 2010.
Evaluation of the effects of Telone II (fumigation) on nitrogen management and yield in
Louisiana delta cotton. Precis. Agric. 11: 239-257.
Byrd, D.W., K.R. Barker, H. Ferris, C.J. Nusbaum, W.E. Griffin, R.H. Small, and C.A. Stone.
1976. Two semi-automatic elutriators for extracting nematodes and certain fungi from
soil. J. Nematol. 8: 206-212.
35
Cohn, E. 1973. Histology of the feeding site of Rotylenchulus reniformis. Nematologica 19: 455-
458.
Dasgupta, D.R., and A.R. Seshadri. 1971. Races of the reniform nematode, Rotylenchulus
reniformis Linford and Oliveira, 1940. Indian J. Nematol. 1: 21-24.
Davis, R.F., S.R. Koenning, R.C. Kemerait, T.D. Cummings, and W.D. Shurley. 2003.
Rotylenchulus reniformis management in cotton with crop rotation. J. Nematol. 35: 58-
64.
Dighe, N.D., A. Robinson, A.A. Bell, M.A. Menz, R.G. Cantrell, and D.M. Stelly. 2009. Linkage
mapping of resistance to reniform nematode in cotton following introgression from
Gossypium longicalyx (Hutch. & Lee). Crop Sci. 49: 1151-1164.
Farias, P.R., X. Sanchez-Vila, J.C. Barbosa, S.R. Vieira, L.C. Ferraz, and J. Solis-Delfin. 2002.
Using geostatistical analysis to evaluate the presence of Rotylenchulus reniformis in
cotton crops in Brazil: Economic implications. J. Nematol. 34: 232-238.
Gaur, H.S., and R.N. Perry. 1991. The biology and control of the plant parasitic nematode
Rotylenchulus reniformis. Agric. Zool. Rev. 4: 177-212.
Gazaway, W.S., J.R. Akridge, K. Mclean, P. Dugger, and D. Richter. 2000. Impact of various
crop rotations and various winter cover crops on reniform nematode in cotton. Proc. Belt.
Cotton Conf. 1: 162-163.
Gutiérrez, O.A., A.F. Robinson, J.N. Jenkins, J.C. McCarty, M.J. Wubben, F.E. Callahan, and
R.L. Nichols. 2011. Identification of QTL regions and SSR markers associated with
resistance to reniform nematode in Gossypium barbadense L. accession GB713. Theor.
Appl. Genet. 122: 271-280.
Heald, C.M. 1975. Pathogenicity and histopathology of Rotylenchulus reniformis infecting
cantaloup. J. Nematol. 7: 149-152.
Jenkins, W.R. 1964. A rapid centrifugal-flotation technique for separating nematodes from soil.
Plant Dis. Rep. 48: 692.
Jones, J.E., L.D. Newsom, and E.L. Finley. 1959. Effect of the reniform nematode on yield, plant
characters, and fiber properties of upland cotton. Agron. J. 51: 353-356.
Kirkpatrick, T.L., and J.N. Sasser. 1984. Crop rotation and races of Meloidogyne incognita in
cotton root-knot management. J. Nematol. 16: 323-328.
Koenning, S.R., S.A. Walters, and K.R. Barker. 1996. Impact of soil texture on the reproductive
and damage potentials of Rotylenchulus reniformis and Meloidogyne incognita on cotton.
J. Nematol. 28: 527-536.
36
Koenning, S.R., J.A. Wrather, T.L. Kirkpatrick, N.R. Walker, J.L. Starr, and J.D. Mueller. 2004.
Plant-parasitic nematodes attacking cotton in the United States: Old and emerging
production challenges. Plant Dis. 88: 100-113.
Lawrence, G.W., and K.S. McLean. 2000. Effect of foliar applications of oxamyl with aldicarb
for the management of Rotylenchulus reniformis on cotton. J. Nematol. 32: 542-549.
Lawrence, G.W., K.S. McLean, W.E. Batson, D. Miller, and J.C. Borbon. 1990. Response of
Rotylenchulus reniformis to nematicide applications on cotton. J. Nematol. 22: 707-711.
Lawrence, K., M. Olsen, T. Faske, R. Hutmacher, J. Muller, J. Mario, R. Kemerait, C.
Overstreet, G. Sciumbato, G. Lawrence, S. Atwell, S. Thomas, S. Koenning, R. Boman,
H. Young, J. Woodward, and H. Mehl. 2014. Cotton disease loss estimate committee
report, 2013. p. 247-248. In Proc. Beltwide Cotton Conf., New Orleans, LA. Jan. 6-8.
Natl. Cotton Counc. Am., Memphis, TN.
Leach, M., P. Agudelo, and P. Gerard. 2009. Effect of temperature on the embryogenesis of
geographic populations of Rotylenchulus reniformis. J. Nematol. 41: 23-27.
McCarty, J.C., J.N. Jenkins, M.J. Wubben, O.A. Gutierrez, R.W. Hayes, F.E. Callahan, and D.
Deng. 2013. Registration of three germplasm lines of cotton derived from Gossypium
barbadense L. accession GB713 with resistance to the reniform nematode. J. Plant Reg.
7: 220-223.
McCarty, J.C., J.N. Jenkins, M.J. Wubben, R.W. Hayes, and I.I. LaFoe. 2012. Registration of
three germplasm lines of cotton derived from Gossypium hirsutum L. accession T2468
with moderate resistance to the reniform nematode. J. Plant Reg. 6: 85-87.
McGawley, E.C., M.J. Pontif, and C. Overstreet. 2010. Variation in reproduction and
pathogenecity of geographic isolates of Rotylenchulus reniformis on cotton. Nematropica
40: 275-288.
Nakasono, K. 2004. Studies on morphological and physio-ecological variations of the reniform
nematode, Rotylenchulus reniformis Linford and Oliveira, 1940 with an emphasis on
differential geographical distribution of amphimictic and parthenogenetic populations in
Japan. J. Nematol. 36: 356-420.
National Cottonseed Products Association. 2014. Cottonseed oil.
http://www.cottonseed.com/publications/default.asp (accessed 11 June 2014).
Rao, G.M.V., and S. Ganguly. 1998. Geographical variations in morphobiomatrics of reniform
nematode, Rotylenchulus reniformis. Indian J. Nematol. 28: 56-71.
Rebois, R.V. 1973. Effect of soil temperature on infectivity and development of Rotylenchulus
reniformis on resistant and susceptible soybeans, Glycine max. J. Nematol. 5: 10-13.
37
Rich, J.R., and R.A. Kinloch. 2000. Influence of aldicarb and 1, 3-dichloropropene applications
on cotton yield and Rotylenchulus reniformis post-harvest populations. Nematropica 30:
47-54.
Robinson, A.F. 2007. Reniform in U.S. cotton: when, where, why, and some remedies. Annu.
Rev. Phytopathol. 45: 263-288.
Robinson, A.F., A.A. Bell, N.D. Dighe, M.A. Menz, R.L. Nichols, and D.M. Stelly. 2007.
Introgression of resistance to nematode Rotylenchulus reniformis into upland cotton
(Gossypium hirsutum) from Gossypium longicalyx. Crop Sci. 47: 1865-1877.
Robinson, A.F., A.C. Bridges, and A.E. Percival. 2004. New sources of resistance to the
reniform (Rotylenchulus reniformis) and root-knot (Meloidogyne incognita) nematode in
upland (Gossypium hirsutum L.) and sea island (G. barbadense L.) cotton. J. Cotton Sci.
8: 191-197.
Robinson, A.F., and A.E. Percival. 1997. Resistance to Meloidogyne incognita race 3 and
Rotylenchulus reniformis in wild accessions of Gossypium hirsutum and G. barbadense
from Mexico. J. Nematol. 29: 746-755.
Romano, G.B., E.J. Sacks, S.R. Stetina, A.F. Robinson, D.D. Fang, O.A. Gutierrez, and J.A.
Scheffler. 2009. Identification and genomic location of a reniform nematode
(Rotylenchulus reniformis) resistance locus (Renari) introgressed from Gossypium aridum
into upland cotton (G. hirsutum). Theor. Appl. Genet. 120: 139-150.
Smith, A.L., and A.L. Taylor. 1941. Nematode distribution in the 1940 regional cotton-wilt plots.
Phytopathol. 31: 771.
Starr, J.L., S.R. Koenning, T.L. Kirkpatrick, A.F. Robinson, P.A. Roberts, and R.L. Nichols.
2007. The future of nematode management in cotton. J. Nematol. 39: 283-294.
Stewart, J.M., and R.T. Robbins. 1994. Evaluation of Asiatic cottons for resistance to reniform
nematode. p. 165-168. In Proceedings of the 1994 cotton research meeting and 1994
Summaries of Cotton Research in Progress, Arkansas Agricultural Experiment Station
Special Report, Arkansas Agriculture Research Station, Fayetteville, AR.
Sturhan, D. 2012. Biological races. In: B. M. Zuckermann, W. F. May and R. A. Rhode, editors,
Plant parasitic nematodes. Academic Press, New York, NY. p. 51-69.
Tilahun, Y., K. Soliman, K.S. Lawrence, L.J. Cseke, and J.W. Ochieng. 2008. Nuclear ribosomal
DNA diversity of a cotton pest (Rotylenchulus reniformis) in the United States. Afr. J.
Biotech. 7: 3217-3224.
USDA. 2014. Cotton: world markets and trade.
http://apps.fas.usda.gov/psdonline/circulars/cotton.pdf (accessed 10 September 2014).
Wolcott, M., C. Overstreet, E. Burris, D. Cook, D. Sullivan, G.B. Padgett, and R. Goodson.
2005. Evaluating cotton nematicide response across soil electrical conductivity zones
38
using remote sensing. p. 215-220. In Proc. Belt. Cotton Conf., 4-7 Jan. 2005. Natl. Cotton
Counc. Am., Memphis, TN.
Yik, C.-P., and W. Birchfield. 1984. Resistant germplasm in Gossypium species and related
plants to Rotylenchulus reniformis. J. Nematol. 16: 146-153.
39
CHAPTER 3: IDENTIFICATION OF DAY NEUTRAL PRIMITIVE COTTON
ACCESSIONS TOLERANT TO ELEVATED LEVELS OF SALT CONCENTRATIONS
3.1 INTRODUCTION
Cotton (primarily Gossypium hirsutum L. and to a lesser extent G. barbadense, G.
arboreum, and G. herbaceum) is the leading textile fiber as well as one of the most important
oilseed crops in the world. In terms of total area harvested, cotton ranks fourth after corn,
soybean and wheat in the United States. Approximately two-thirds of the cotton grown in the US
is exported amounting to 10.50 million bales (500 lbs lint/bale) in 2012/13. Exports have been
steadily rising as a percent of total production largely due to strong demand from China (USDA,
2014). Globally, US cotton production is ranked third after China and India. In the US, it is
estimated that 13.19 million bales were produced in 2013/2014, which is 24% lower than in
2012/2013. In comparison, world cotton production in 2013/14 (117.81 million bales) decreased
4% relative to 2012/2013. This worldwide production decrease is a direct response to a decrease
in planted area from 34.13 to 33.12 million hectares. In the US, the production decrease in
2013/14 vs 2012/13 is largely a result of a decrease in production area from 3.79 to 3.10 million
hectares (USDA, 2014). As an oilseed, cotton is ranked in the third position, worldwide, in terms
of volume behind soybean and corn. The oil produced from cotton is largely used for human
consumption. The cake left after oil extraction is a high protein animal feed principally used in
the beef and dairy industries (National Cottonseed Products Association, 2014). Collectively,
these uses contribute to cotton’s prominence as one of the important agricultural row crops in the
US.
Abiotic stresses, i.e. drought, salinity, temperature, and flooding are major problems in
crop production that can reduce yields by 50% (Bray et al., 2000). Of these, soil salinity affects
20% of the total irrigated land in the world (Wang et al., 2003). In the US, soil salinity is a
40
significant problem in the Southwest and West regions that affects 23% of the irrigated land
(Ghassemi et al., 1995). Globally, Wang et al. (2003) predicted that 30% of arable land will be
deteriorated by salinity in the coming 25 years and further project that salinity will affect 50% of
total arable land by 2050. Over this same period, food production needs to be increased by 38%
by 2025 and by 57% by 2050 to supply the current levels of food for a growing world population
(Wild, 2003). In the near future, salinity might become a significant enough issue that it will
need to be managed for crop production either through the soil reclamation /management
practices or through the development of salt tolerant crops and forest trees by breeding
techniques to meet food and fiber demands from a growing global population.
Salinity is a severe problem in areas of high evaporation and low rainfall i.e. arid and
semi-arid regions. In these regions, the amount of rainfall is not enough to leach salt from the
surface resulting in salt accumulations (Bernstein, 1975; Brady and Weil, 2009). Though salt
naturally originated from the weathering of parent materials, the accumulation of salts on the soil
surface is accelerated by the application of fertilizers, soil amendments, and irrigation with salt-
rich water (Chhabra, 1996). The increased availability of sodium ions in the soil surface may
depress other macronutrients available for plant absorption and increases the external osmotic
potential, which hinders the influx of water into the root system (Grattan and Grieve, 1998).
Increased sodium ion concentrations also damage soil structure and cause the dispersal of soil
particles, and ultimately reduces the overall soil aeration (Brady and Weil, 2009).
High concentration of sodium ions within the plant system may partially or fully inhibit
various metabolic, physiological, and biochemical processes and collectively effect, in a negative
manner, plant growth and development at different developmental stages (Hasegawa et al., 2000;
Munns and Tester, 2008). Gossypium spp. are generally considered to be moderately tolerant to
41
salinity with an injury threshold of 7.7 dSM-1 (Maas and Hoffman, 1977). However, even low
levels of salt (concentrations less than 1 dSM-1 or 640 ppm) in the surface soil have been shown
to affect the growth and development of cotton plants (Ahmad et al., 2002; Ashraf, 2002; Ashraf
and Ahmad, 2000; Chachar et al., 2008; Qadir and Shams, 1997; Razzouk and Whittington,
1991). The effect of salinity is more severe when cotton is exposed to salinity for the longer
periods (Ashraf and Ahmad, 2000). Seed germination and emergence are both drastically
decreased with increasing salt concentrations in the soil (Hamdy et al., 1993; Khan et al., 1995;
Latif and Khan, 1976; Younis et al., 1987). Salinity reduces both primary and secondary root
growth, vegetative growth, leaf size and expansion, shoot/root ratio, and stem thickness resulting
in dwarf plants with necrosis and chlorosis of leaves (Chen et al., 2010; Khan et al., 1995;
Reinhardt and Rost, 1995; Wang et al., 2011; Ye et al., 1997). Shoots are more sensitive than
roots in response to salinity (Babu et al., 1987). The effects of salinity on older leaves are more
prominent than on younger leaves because Na+ accumulates over time and at higher levels is
toxic (Munns and Tester, 2008).
The number of cotton bolls per plant is drastically reduced with increasing salt
concentrations due to higher boll shedding and a concomitant decrease in fruit positions (Chen et
al., 2010; Longenecker, 1974). Additionally, salinity has been shown to reduce lint percentage,
fiber fineness, maturity, length, strength, and micronaire, eventually reducing fiber quality
(Ashraf and Ahmad, 2000; Korkor et al., 1974; Longenecker, 1974). At higher salt
concentrations in the soil beyond the threshold level for cotton, salinity kills cotton plants
completely. Overall, high salinity reduces the economic return of cotton by reducing cotton lint
production and the fiber’s quality.
42
In Louisiana, cotton is one of the major crops grown in the Upper Red River region and
on the Macon Ridge. The cotton grown in these areas is susceptible to drought due to low rainfall
during the growing season and shallow hardpans. In such situations, irrigating the field through
surface or sprinkler irrigation methods is the main option to supplement the plant water
requirements at critical stages of development. In these regions, 40% of cotton fields are irrigated
and the percentage is likely to increase to maximize production and reduce risk. Due to high salt
concentrations in the ground water and high cost of pumping, the Red River is the main source of
water for growers in the Red River Valley of northwest Louisiana (Branch, 2004).
Water quality is a key factor in irrigation systems, and is determined by amount of salt
concentration in the irrigating water. Good quality irrigation water should contain less than 400
ppm salt. In the Red River area, some irrigation water contains nearly 2600 ppm salt; which
causes severe injury and limits soybean production (Morgan, 2010). In this region, salt levels in
the irrigation water have been increasing over the last 20 years (Morgan, 2010). As irrigation
becomes more prevalent in cotton production, salinity is likely to become a more serious
problem and the area affected by salinity is expected to rise. To some extent, salinity levels can
be managed by surface drainage, leaching or cultural practices. On the other hand, use of salt
tolerant cotton cultivars would be an alternative option to manage salt affected production
regions. Currently, there are no commercial salt tolerant cotton varieties available for growers.
A logical first step is the identification of variability in response to elevated salt
concentrations among cotton plants. To date, there are a limited number of studies seeking to
identify salt tolerant cotton germplasm. Abul-Naas and Omran (1974) reported that G.
barbadense is more tolerant to salt relative to G. hirsutum. Bhatti and Azhar (2002) evaluated the
root growth of nine cotton cultivars under saline conditions and identified two genotypes as
43
being the most tolerant. Higbie et al. (2010) evaluated six cultivars of pima and upland cotton
and found three genotypes moderately tolerant to salinity. Basel (2011) evaluated five upland
cotton genotypes and found three varieties with moderate to high tolerance against salinity.
Abbas et al. (2011) screened fifty cotton genotypes against different salt concentrations and
identified six genotypes as tolerant. They further reported that salt tolerance traits have a
moderate to high genetic variability and are highly heritable. Castillo (2011) screened 209 wild
primitive TX accessions using a hydroponic technique and found that the accession TX307 was
the most salt tolerant genotypes out of 109 surviving genotypes. Compared to the total number of
germplasm accessions in US cotton germplasm collection, even cumulatively, the number of
cotton germplasm lines included in these past studies for screening and characterizing their salt
tolerance is quite low.
With regard to salt tolerance, there is no comprehensive data available in cotton
germplasm pool. The lack of information hinders researcher’s efforts to understand the
mechanism of salt tolerance and to select appropriate salt tolerant cotton genotypes for use in the
development or breeding of salt tolerant cotton varieties. There is a need for more systematic
studies of salt tolerance response over a larger number of germplasm accessions to provide the
foundation upon which to develop salt tolerant cotton cultivars. This study provides an
opportunity to identify the degree of salt tolerance among one hundred fifty genotypes obtained
from the Mississippi Converted Race Stock program. In this program to date, 169 photoperiodic
primitive accessions collected from Mexico and Central America have been converted to be day
neutral through a series of backcrosses with a day neutral donor “Deltapine 16”. The day neutral
progenies in F2 were selected and backcrossed four times to their original race stock and day
neutral F2 progenies were selected in each backcross (McCarty and Jenkins, 1993; McCarty and
44
Jenkins, 2002; McCarty et al., 2004). The day neutral primitive accessions provide a source of
genetic variation for agronomic and fiber traits, insect and disease resistance (Knutson et al.,
2014; McCarty et al., 1996; McCarty et al., 2006). The information collected, in regard to salt
tolerance will be available in the National Cotton Germplasm collection so that cotton breeders
can use this information to develop and improve the salt tolerant cotton cultivars.
3.2 MATERIALS AND METHODS
3.2.1 Plant materials
Out of one hundred sixty nine day neutral primitive cotton accessions, one hundred fifty
genotypes of G. hirsutum (2n=4x=52) were utilized in this study. The 150 lines were obtained
from Dr. Jack McCarty, USDA-ARS, and are from the Converted Race Stock program.
3.2.2 Hydroponic technique
A preliminary screening was conducted using a hydroponic system consisting of plastic
tubs aerated with an air pump in the greenhouse. The study was conducted in summer, 2013. The
flat plastic tubs (64.4 L) with dimensions of 15x45x100 cm were fitted with one aquarium air
pump and 2 bubble stones of approximately 90 cm in length per tub. A split plot design with two
replications (five plants/replication) was used. A nutrient solution was prepared by dissolving 1 g
of Peter® fertilizer (20:20:20), 150 mg of calcium nitrate and 150 mg of magnesium sulfate per
liter (Castillo, 2011). To limit algal growth, tubs were painted white to reduce light penetration
through the tubs.
Germination towels were used for seed germination. Uniform seven day old seedlings
were transferred individually into holes bored into a Styrofoam insulation panel floating on the
nutrient solution. The dimension of each hole was 1 cm in diameter and holes are spaced in a 2
cm grid. A fine (1mm x 1mm) nylon mesh was attached to the bottom of the styrofoam to hold
45
the seedlings more firmly. An X-shaped hole was made in the nylon mesh that works like a valve
to prevent root girdling. Four days after being transferred to the hydroponic system, holes were
plugged with a small amount of cotton fiber to support upright seedling growth. Seven days after
seedlings being transferred to X hole in hydroponics, sodium chloride (NaCl) was added in an
increments of 62.50 mM every 24 hours until the final concentrations of 125 or 250 mM NaCl
were reached in each tub. Tubs without added sodium chloride were used as a control. The
hydroponic system was monitored daily and solution pH maintained between 6.5-7.0. The
electrical conductivity (EC) was measured daily and adjusted as necessary. The seedlings were
harvested at 18 days after initiation of salt treatments. At harvest, seedling height, fresh shoot
and root weight were measured (from cotyledonary scar). Harvested shoot and root of each
genotype was oven dried at 65○C for 72 hours and weight was recorded.
3.2.3 Advanced salt screening
Based on the performance of day neutral primitive cotton accessions (primarily percent
reduction in seedling height) across salt concentrations under hydroponic technique and
availability of seeds, ten genotypes were selected for further analyses. In addition to the ten
selected genotypes, FiberMax958 (FM958) (Bayer CropScience, Indianapolis, IN) was used as a
check variety. In this study, seedlings were treated with salt solution for one week longer than in
the hydroponics system (preliminary screening) to determine salt tolerance levels among
genotypes. The hydroponic system was felt to have a limitation in its ability to support the
seedlings beyond 18 days after initiation of salt treatments as seedlings became bigger.
Therefore, potting mixture was used in this study.
Due to limited availability of seeds, a single seed was sown in one quart plastic pots
(8.9x6.4x12.7 cm) filled with the Miracle Gro potting mixture (Scotts Company LLC). Seeds of
46
each cultivar were also sown in additional pots to swap the pots (if it was necessary). Seedlings
were watered every 24 hours for two weeks before salt treatments. It was observed that pots still
held a good amount of moisture after 24 hours. After germination, seedlings were fertilized by
adding 300 mL of nutrient solution prepared by dissolving 4 g of Peter® fertilizer (20:20:20) per
liter once each week. At two weeks after sowing, NaCl was added in an increment of 62.50 mM
every 24 hours until the final concentrations of 125 or 250 mM were reached. Seedlings without
added sodium chloride was used as the control. Salt treated plants were treated with 300 mL of
125 and 250 mM salt solutions every 24 hours for 21 days, while control plants were watered
with 300 mL of tap water. It is expected that accumulation of salt in the pots is unlikely because
excess salt or water was well drained out from the bottoms of the pots and the salt concentrations
were maintained in each pot. The seedlings were harvested at 25 days after initiation of salt
treatments. After harvesting, seedling height, fresh and dry shoot weight, fresh and dry root
weight were measured.
3.2.4 Physiological measurement
After measuring dry leaf weight, the tissue was ground with a mortar and pestle. Ground
leaf tissue was processed through a flame photometer to determine Na+ and K+ content in the
leaves.
3.2.5 Statistical analysis
Analysis of variance (ANOVA) was conducted using the SAS 9.3 (SAS Institute Inc.,
Cary, NC). T-grouping was used to compare the plant parameters (percent reduction in plant
height, fresh and dry shoot weight, fresh and dry root weight, and accumulation of sodium (Na+),
potassium (K+), and K+/Na+ ratios) among the cotton genotypes under 0, 125, and 250 mM salt
concentrations.
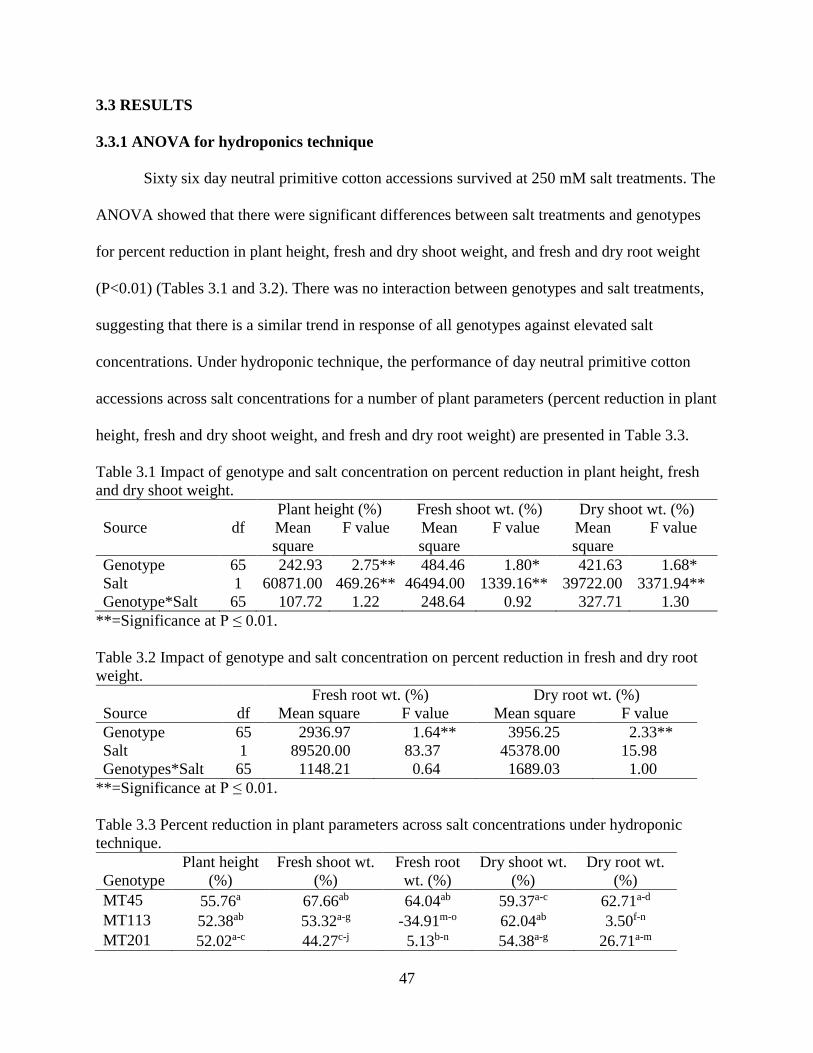
47
3.3 RESULTS
3.3.1 ANOVA for hydroponics technique
Sixty six day neutral primitive cotton accessions survived at 250 mM salt treatments. The
ANOVA showed that there were significant differences between salt treatments and genotypes
for percent reduction in plant height, fresh and dry shoot weight, and fresh and dry root weight
(P<0.01) (Tables 3.1 and 3.2). There was no interaction between genotypes and salt treatments,
suggesting that there is a similar trend in response of all genotypes against elevated salt
concentrations. Under hydroponic technique, the performance of day neutral primitive cotton
accessions across salt concentrations for a number of plant parameters (percent reduction in plant
height, fresh and dry shoot weight, and fresh and dry root weight) are presented in Table 3.3.
Table 3.1 Impact of genotype and salt concentration on percent reduction in plant height, fresh
and dry shoot weight.
**=Significance at P ≤ 0.01.
Table 3.2 Impact of genotype and salt concentration on percent reduction in fresh and dry root
weight.
**=Significance at P ≤ 0.01.
Table 3.3 Percent reduction in plant parameters across salt concentrations under hydroponic
technique.
Genotype
Plant height
(%)
Fresh shoot wt.
(%)
Fresh root
wt. (%)
Dry shoot wt.
(%)
Dry root wt.
(%)
MT45 55.76a 67.66ab 64.04ab 59.37a-c 62.71a-d
MT113 52.38ab 53.32a-g -34.91m-o 62.04ab 3.50f-n
MT201 52.02a-c 44.27c-j 5.13b-n 54.38a-g 26.71a-m
Plant height (%) Fresh shoot wt. (%) Dry shoot wt. (%)
Source df Mean
square
F value Mean
square
F value Mean
square
F value
Genotype 65 242.93 2.75** 484.46 1.80* 421.63 1.68*
Salt 1 60871.00 469.26** 46494.00 1339.16** 39722.00 3371.94**
Genotype*Salt 65 107.72 1.22 248.64 0.92 327.71 1.30
Fresh root wt. (%) Dry root wt. (%)
Source df Mean square F value Mean square F value
Genotype 65 2936.97 1.64** 3956.25 2.33**
Salt 1 89520.00 83.37 45378.00 15.98
Genotypes*Salt 65 1148.21 0.64 1689.03 1.00
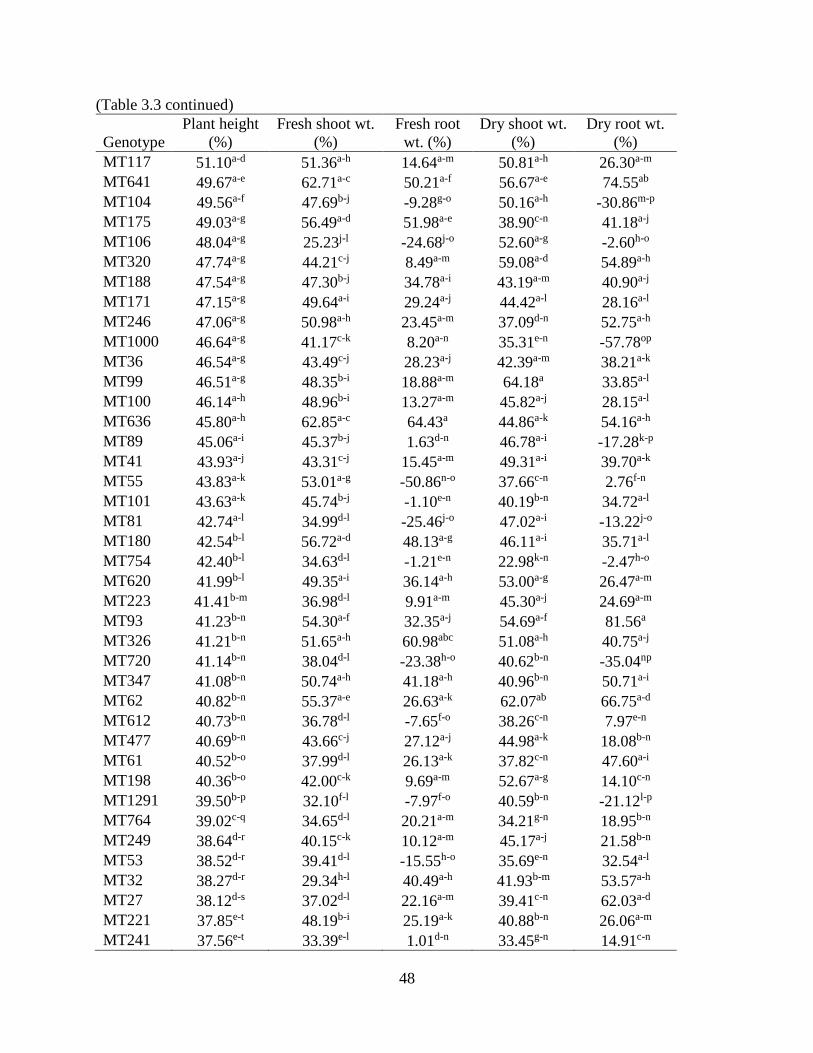
48
(Table 3.3 continued)
Genotype
Plant height
(%)
Fresh shoot wt.
(%)
Fresh root
wt. (%)
Dry shoot wt.
(%)
Dry root wt.
(%)
MT117 51.10a-d 51.36a-h 14.64a-m 50.81a-h 26.30a-m
MT641 49.67a-e 62.71a-c 50.21a-f 56.67a-e 74.55ab
MT104 49.56a-f 47.69b-j -9.28g-o 50.16a-h -30.86m-p
MT175 49.03a-g 56.49a-d 51.98a-e 38.90c-n 41.18a-j
MT106 48.04a-g 25.23j-l -24.68j-o 52.60a-g -2.60h-o
MT320 47.74a-g 44.21c-j 8.49a-m 59.08a-d 54.89a-h
MT188 47.54a-g 47.30b-j 34.78a-i 43.19a-m 40.90a-j
MT171 47.15a-g 49.64a-i 29.24a-j 44.42a-l 28.16a-l
MT246 47.06a-g 50.98a-h 23.45a-m 37.09d-n 52.75a-h
MT1000 46.64a-g 41.17c-k 8.20a-n 35.31e-n -57.78op
MT36 46.54a-g 43.49c-j 28.23a-j 42.39a-m 38.21a-k
MT99 46.51a-g 48.35b-i 18.88a-m 64.18a 33.85a-l
MT100 46.14a-h 48.96b-i 13.27a-m 45.82a-j 28.15a-l
MT636 45.80a-h 62.85a-c 64.43a 44.86a-k 54.16a-h
MT89 45.06a-i 45.37b-j 1.63d-n 46.78a-i -17.28k-p
MT41 43.93a-j 43.31c-j 15.45a-m 49.31a-i 39.70a-k
MT55 43.83a-k 53.01a-g -50.86n-o 37.66c-n 2.76f-n
MT101 43.63a-k 45.74b-j -1.10e-n 40.19b-n 34.72a-l
MT81 42.74a-l 34.99d-l -25.46j-o 47.02a-i -13.22j-o
MT180 42.54b-l 56.72a-d 48.13a-g 46.11a-i 35.71a-l
MT754 42.40b-l 34.63d-l -1.21e-n 22.98k-n -2.47h-o
MT620 41.99b-l 49.35a-i 36.14a-h 53.00a-g 26.47a-m
MT223 41.41b-m 36.98d-l 9.91a-m 45.30a-j 24.69a-m
MT93 41.23b-n 54.30a-f 32.35a-j 54.69a-f 81.56a
MT326 41.21b-n 51.65a-h 60.98abc 51.08a-h 40.75a-j
MT720 41.14b-n 38.04d-l -23.38h-o 40.62b-n -35.04np
MT347 41.08b-n 50.74a-h 41.18a-h 40.96b-n 50.71a-i
MT62 40.82b-n 55.37a-e 26.63a-k 62.07ab 66.75a-d
MT612 40.73b-n 36.78d-l -7.65f-o 38.26c-n 7.97e-n
MT477 40.69b-n 43.66c-j 27.12a-j 44.98a-k 18.08b-n
MT61 40.52b-o 37.99d-l 26.13a-k 37.82c-n 47.60a-i
MT198 40.36b-o 42.00c-k 9.69a-m 52.67a-g 14.10c-n
MT1291 39.50b-p 32.10f-l -7.97f-o 40.59b-n -21.12l-p
MT764 39.02c-q 34.65d-l 20.21a-m 34.21g-n 18.95b-n
MT249 38.64d-r 40.15c-k 10.12a-m 45.17a-j 21.58b-n
MT53 38.52d-r 39.41d-l -15.55h-o 35.69e-n 32.54a-l
MT32 38.27d-r 29.34h-l 40.49a-h 41.93b-m 53.57a-h
MT27 38.12d-s 37.02d-l 22.16a-m 39.41c-n 62.03a-d
MT221 37.85e-t 48.19b-i 25.19a-k 40.88b-n 26.06a-m
MT241 37.56e-t 33.39e-l 1.01d-n 33.45g-n 14.91c-n
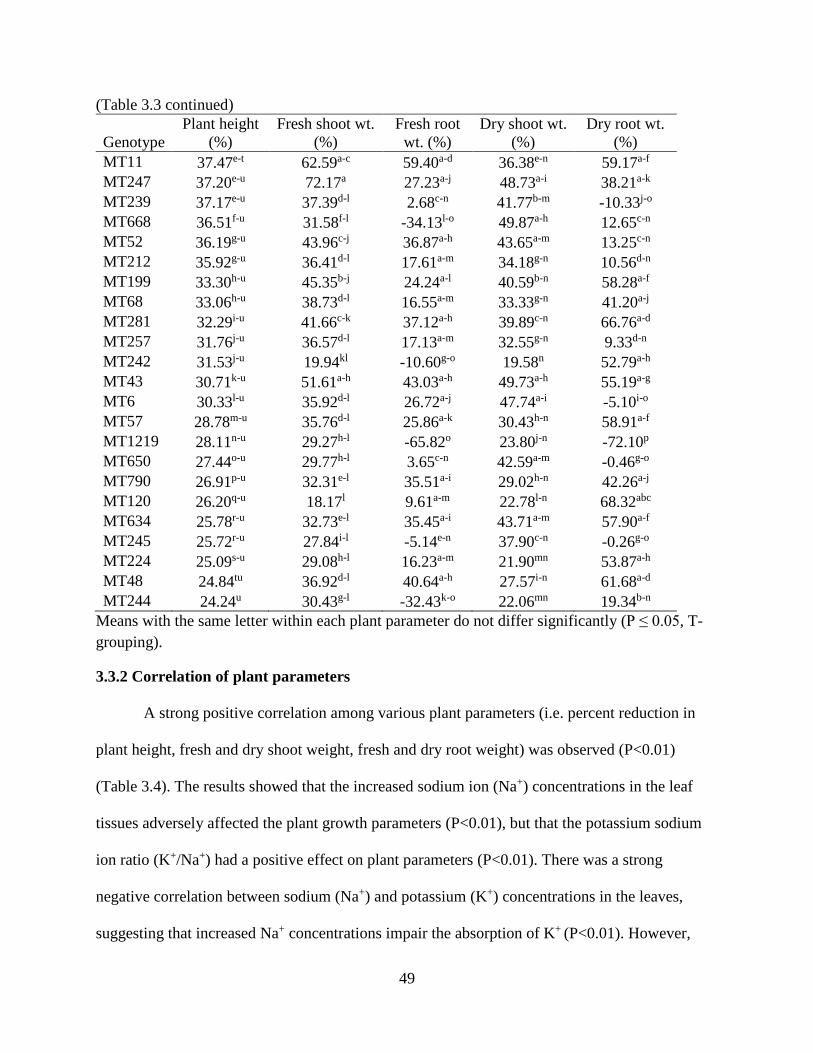
49
(Table 3.3 continued)
Genotype
Plant height
(%)
Fresh shoot wt.
(%)
Fresh root
wt. (%)
Dry shoot wt.
(%)
Dry root wt.
(%)
MT11 37.47e-t 62.59a-c 59.40a-d 36.38e-n 59.17a-f
MT247 37.20e-u 72.17a 27.23a-j 48.73a-i 38.21a-k
MT239 37.17e-u 37.39d-l 2.68c-n 41.77b-m -10.33j-o
MT668 36.51f-u 31.58f-l -34.13l-o 49.87a-h 12.65c-n
MT52 36.19g-u 43.96c-j 36.87a-h 43.65a-m 13.25c-n
MT212 35.92g-u 36.41d-l 17.61a-m 34.18g-n 10.56d-n
MT199 33.30h-u 45.35b-j 24.24a-l 40.59b-n 58.28a-f
MT68 33.06h-u 38.73d-l 16.55a-m 33.33g-n 41.20a-j
MT281 32.29i-u 41.66c-k 37.12a-h 39.89c-n 66.76a-d
MT257 31.76j-u 36.57d-l 17.13a-m 32.55g-n 9.33d-n
MT242 31.53j-u 19.94kl -10.60g-o 19.58n 52.79a-h
MT43 30.71k-u 51.61a-h 43.03a-h 49.73a-h 55.19a-g
MT6 30.33l-u 35.92d-l 26.72a-j 47.74a-i -5.10i-o
MT57 28.78m-u 35.76d-l 25.86a-k 30.43h-n 58.91a-f
MT1219 28.11n-u 29.27h-l -65.82o 23.80j-n -72.10p
MT650 27.44o-u 29.77h-l 3.65c-n 42.59a-m -0.46g-o
MT790 26.91p-u 32.31e-l 35.51a-i 29.02h-n 42.26a-j
MT120 26.20q-u 18.17l 9.61a-m 22.78l-n 68.32abc
MT634 25.78r-u 32.73e-l 35.45a-i 43.71a-m 57.90a-f
MT245 25.72r-u 27.84i-l -5.14e-n 37.90c-n -0.26g-o
MT224 25.09s-u 29.08h-l 16.23a-m 21.90mn 53.87a-h
MT48 24.84tu 36.92d-l 40.64a-h 27.57i-n 61.68a-d
MT244 24.24u 30.43g-l -32.43k-o 22.06mn 19.34b-n
Means with the same letter within each plant parameter do not differ significantly (P ≤ 0.05, T-
grouping).
3.3.2 Correlation of plant parameters
A strong positive correlation among various plant parameters (i.e. percent reduction in
plant height, fresh and dry shoot weight, fresh and dry root weight) was observed (P<0.01)
(Table 3.4). The results showed that the increased sodium ion (Na+) concentrations in the leaf
tissues adversely affected the plant growth parameters (P<0.01), but that the potassium sodium
ion ratio (K+/Na+) had a positive effect on plant parameters (P<0.01). There was a strong
negative correlation between sodium (Na+) and potassium (K+) concentrations in the leaves,
suggesting that increased Na+ concentrations impair the absorption of K+ (P<0.01). However,
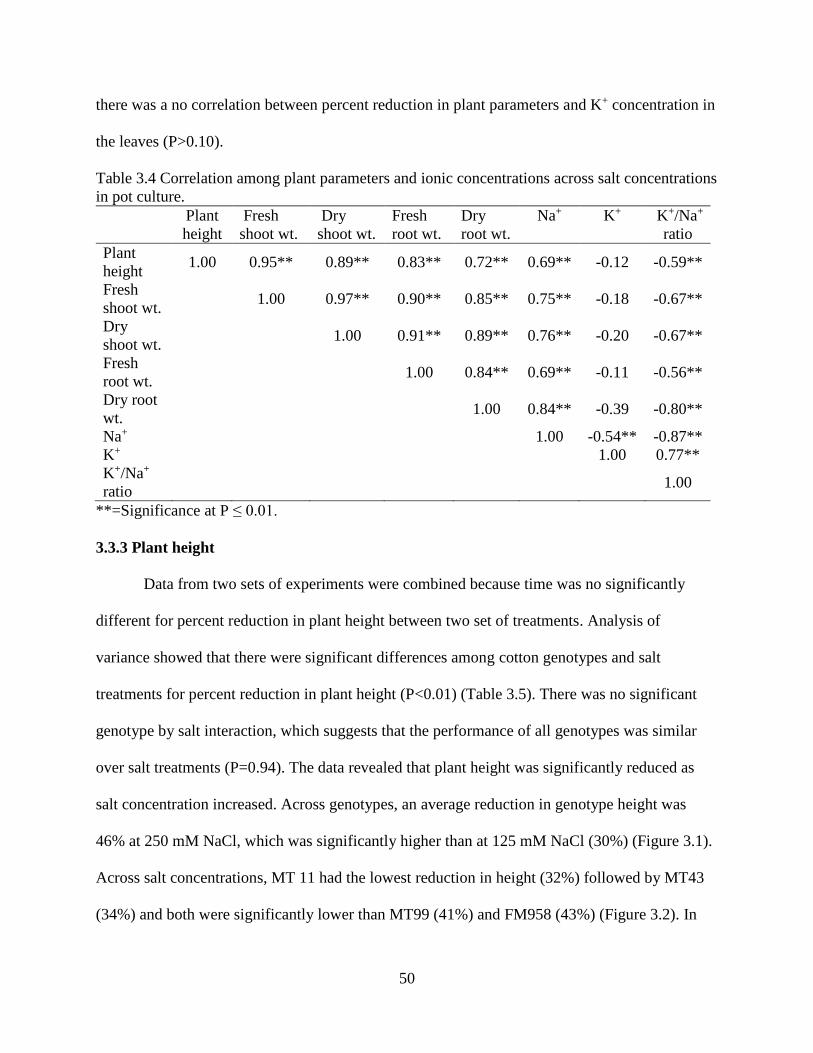
50
there was a no correlation between percent reduction in plant parameters and K+ concentration in
the leaves (P>0.10).
Table 3.4 Correlation among plant parameters and ionic concentrations across salt concentrations
in pot culture.
Plant
height
Fresh
shoot wt.
Dry
shoot wt.
Fresh
root wt.
Dry
root wt.
Na+ K+ K+/Na+
ratio
Plant
height 1.00 0.95** 0.89** 0.83** 0.72** 0.69** -0.12 -0.59**
Fresh
shoot wt. 1.00 0.97** 0.90** 0.85** 0.75** -0.18 -0.67**
Dry
shoot wt. 1.00 0.91** 0.89** 0.76** -0.20 -0.67**
Fresh
root wt. 1.00 0.84** 0.69** -0.11 -0.56**
Dry root
wt. 1.00 0.84** -0.39 -0.80**
Na+ 1.00 -0.54** -0.87**
K+ 1.00 0.77**
K+/Na+
ratio 1.00
**=Significance at P ≤ 0.01.
3.3.3 Plant height
Data from two sets of experiments were combined because time was no significantly
different for percent reduction in plant height between two set of treatments. Analysis of
variance showed that there were significant differences among cotton genotypes and salt
treatments for percent reduction in plant height (P<0.01) (Table 3.5). There was no significant
genotype by salt interaction, which suggests that the performance of all genotypes was similar
over salt treatments (P=0.94). The data revealed that plant height was significantly reduced as
salt concentration increased. Across genotypes, an average reduction in genotype height was
46% at 250 mM NaCl, which was significantly higher than at 125 mM NaCl (30%) (Figure 3.1).
Across salt concentrations, MT 11 had the lowest reduction in height (32%) followed by MT43
(34%) and both were significantly lower than MT99 (41%) and FM958 (43%) (Figure 3.2). In
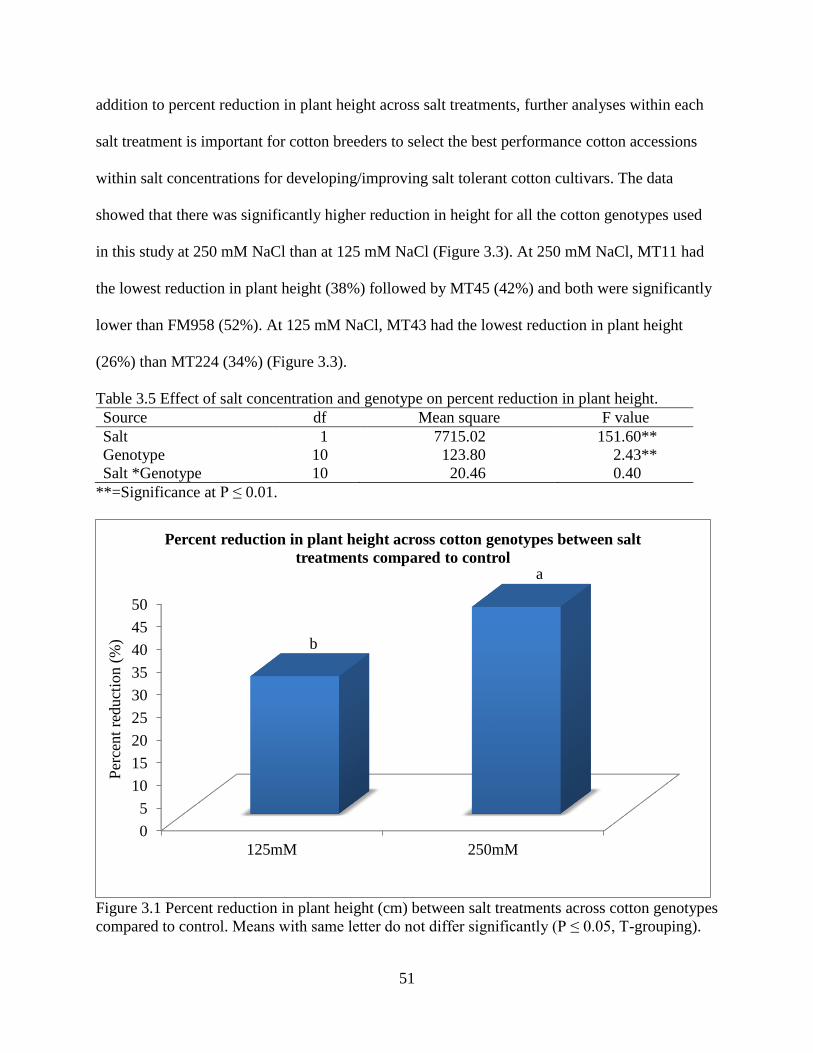
51
addition to percent reduction in plant height across salt treatments, further analyses within each
salt treatment is important for cotton breeders to select the best performance cotton accessions
within salt concentrations for developing/improving salt tolerant cotton cultivars. The data
showed that there was significantly higher reduction in height for all the cotton genotypes used
in this study at 250 mM NaCl than at 125 mM NaCl (Figure 3.3). At 250 mM NaCl, MT11 had
the lowest reduction in plant height (38%) followed by MT45 (42%) and both were significantly
lower than FM958 (52%). At 125 mM NaCl, MT43 had the lowest reduction in plant height
(26%) than MT224 (34%) (Figure 3.3).
Table 3.5 Effect of salt concentration and genotype on percent reduction in plant height.
Source df Mean square F value
Salt 1 7715.02 151.60**
Genotype 10 123.80 2.43**
Salt *Genotype 10 20.46 0.40
**=Significance at P ≤ 0.01.
Figure 3.1 Percent reduction in plant height (cm) between salt treatments across cotton genotypes
compared to control. Means with same letter do not differ significantly (P ≤ 0.05, T-grouping).
0
5
10
15
20
25
30
35
40
45
50
125mM 250mM
Per
cent
reduct
ion (
%)
Percent reduction in plant height across cotton genotypes between salt
treatments compared to control
b
a
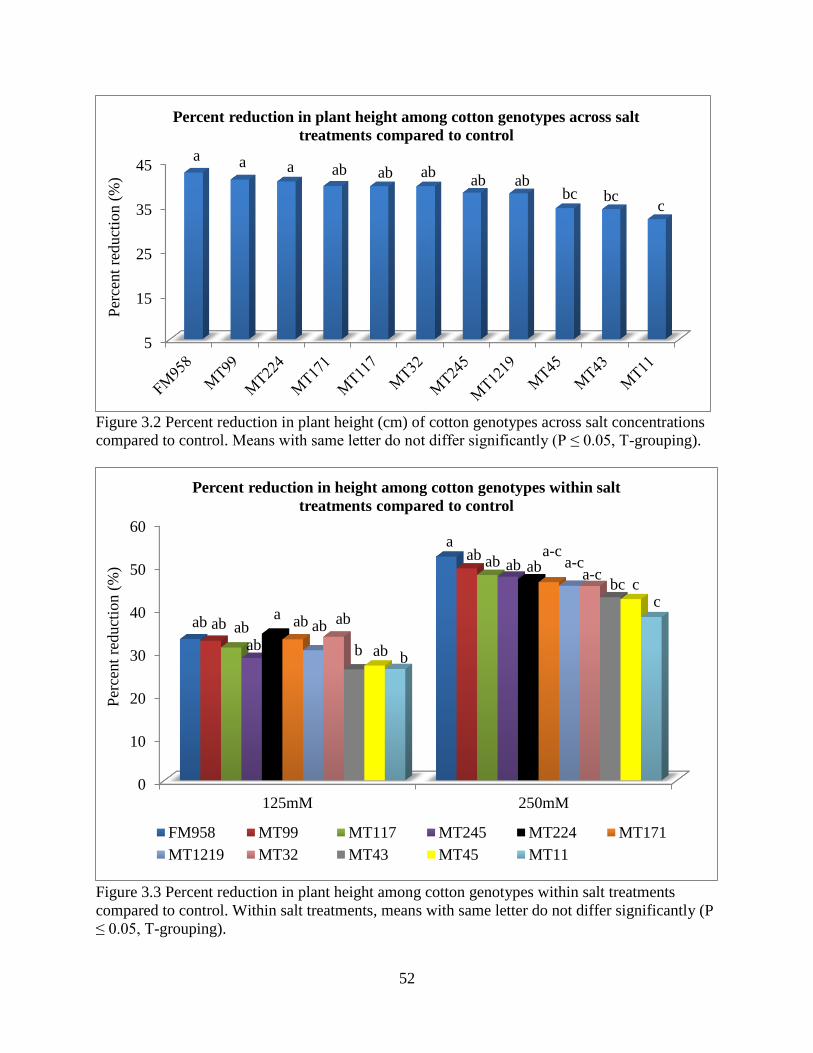
52
Figure 3.2 Percent reduction in plant height (cm) of cotton genotypes across salt concentrations
compared to control. Means with same letter do not differ significantly (P ≤ 0.05, T-grouping).
Figure 3.3 Percent reduction in plant height among cotton genotypes within salt treatments
compared to control. Within salt treatments, means with same letter do not differ significantly (P
≤ 0.05, T-grouping).
5
15
25
35
45
Per
cent
reduct
ion (
%)
Percent reduction in plant height among cotton genotypes across salt
treatments compared to control
a a a ab ab abab ab
bc bcc
0
10
20
30
40
50
60
125mM 250mM
Per
cent
reduct
ion (
%)
Percent reduction in height among cotton genotypes within salt
treatments compared to control
FM958 MT99 MT117 MT245 MT224 MT171
MT1219 MT32 MT43 MT45 MT11
ab aba ab
ab
aab
ab a-ca-c
c
ab ab
bb
aba-c
c
ab
abbc
ab
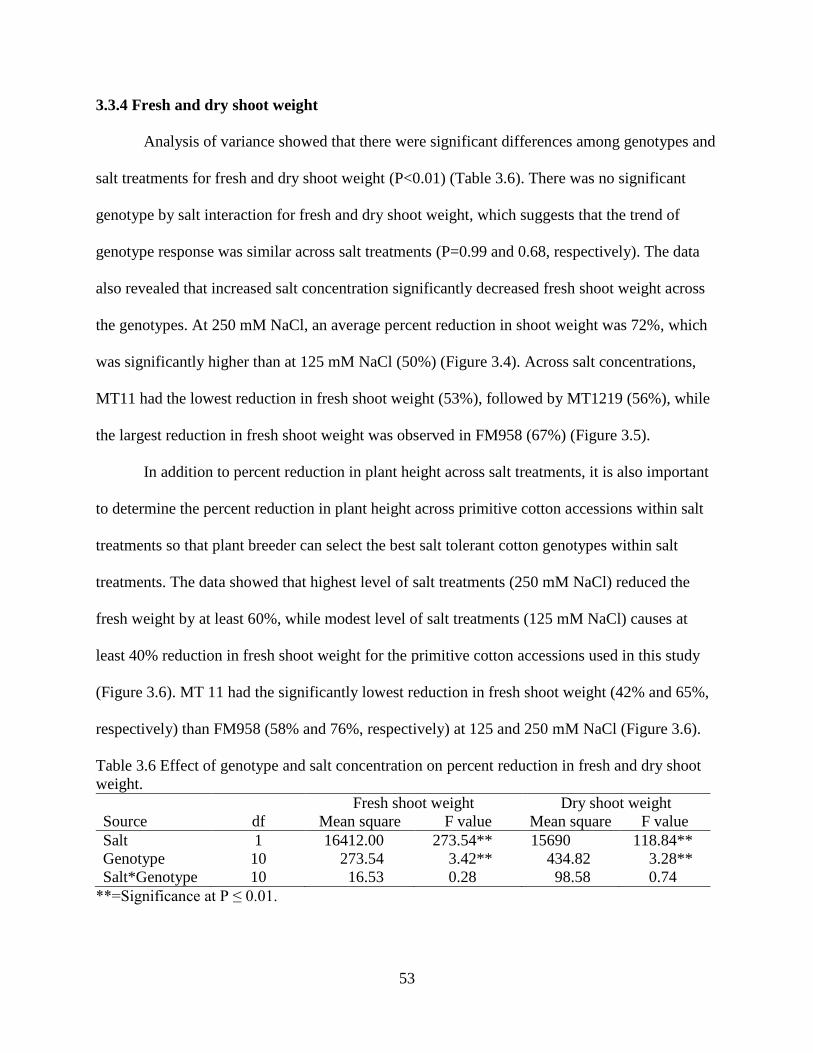
53
3.3.4 Fresh and dry shoot weight
Analysis of variance showed that there were significant differences among genotypes and
salt treatments for fresh and dry shoot weight (P<0.01) (Table 3.6). There was no significant
genotype by salt interaction for fresh and dry shoot weight, which suggests that the trend of
genotype response was similar across salt treatments (P=0.99 and 0.68, respectively). The data
also revealed that increased salt concentration significantly decreased fresh shoot weight across
the genotypes. At 250 mM NaCl, an average percent reduction in shoot weight was 72%, which
was significantly higher than at 125 mM NaCl (50%) (Figure 3.4). Across salt concentrations,
MT11 had the lowest reduction in fresh shoot weight (53%), followed by MT1219 (56%), while
the largest reduction in fresh shoot weight was observed in FM958 (67%) (Figure 3.5).
In addition to percent reduction in plant height across salt treatments, it is also important
to determine the percent reduction in plant height across primitive cotton accessions within salt
treatments so that plant breeder can select the best salt tolerant cotton genotypes within salt
treatments. The data showed that highest level of salt treatments (250 mM NaCl) reduced the
fresh weight by at least 60%, while modest level of salt treatments (125 mM NaCl) causes at
least 40% reduction in fresh shoot weight for the primitive cotton accessions used in this study
(Figure 3.6). MT 11 had the significantly lowest reduction in fresh shoot weight (42% and 65%,
respectively) than FM958 (58% and 76%, respectively) at 125 and 250 mM NaCl (Figure 3.6).
Table 3.6 Effect of genotype and salt concentration on percent reduction in fresh and dry shoot
weight.
Fresh shoot weight Dry shoot weight
Source df Mean square F value Mean square F value
Salt 1 16412.00 273.54** 15690 118.84**
Genotype 10 273.54 3.42** 434.82 3.28**
Salt*Genotype 10 16.53 0.28 98.58 0.74
**=Significance at P ≤ 0.01.
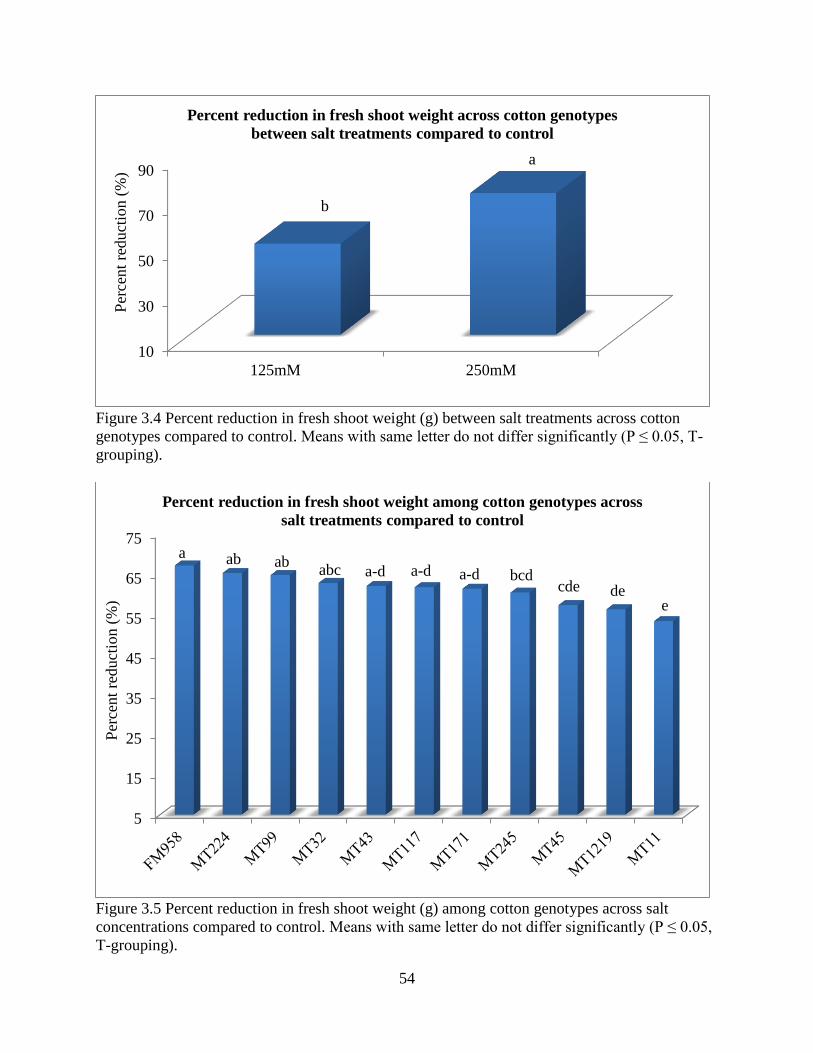
54
Figure 3.4 Percent reduction in fresh shoot weight (g) between salt treatments across cotton
genotypes compared to control. Means with same letter do not differ significantly (P ≤ 0.05, T-
grouping).
Figure 3.5 Percent reduction in fresh shoot weight (g) among cotton genotypes across salt
concentrations compared to control. Means with same letter do not differ significantly (P ≤ 0.05,
T-grouping).
10
30
50
70
90
125mM 250mM
Per
cent
redu
ctio
n (
%)
Percent reduction in fresh shoot weight across cotton genotypes
between salt treatments compared to control
a
b
5
15
25
35
45
55
65
75
Per
cent
reduct
ion (
%)
Percent reduction in fresh shoot weight among cotton genotypes across
salt treatments compared to control
abaab
abc a-d a-d a-d bcdcde de
e
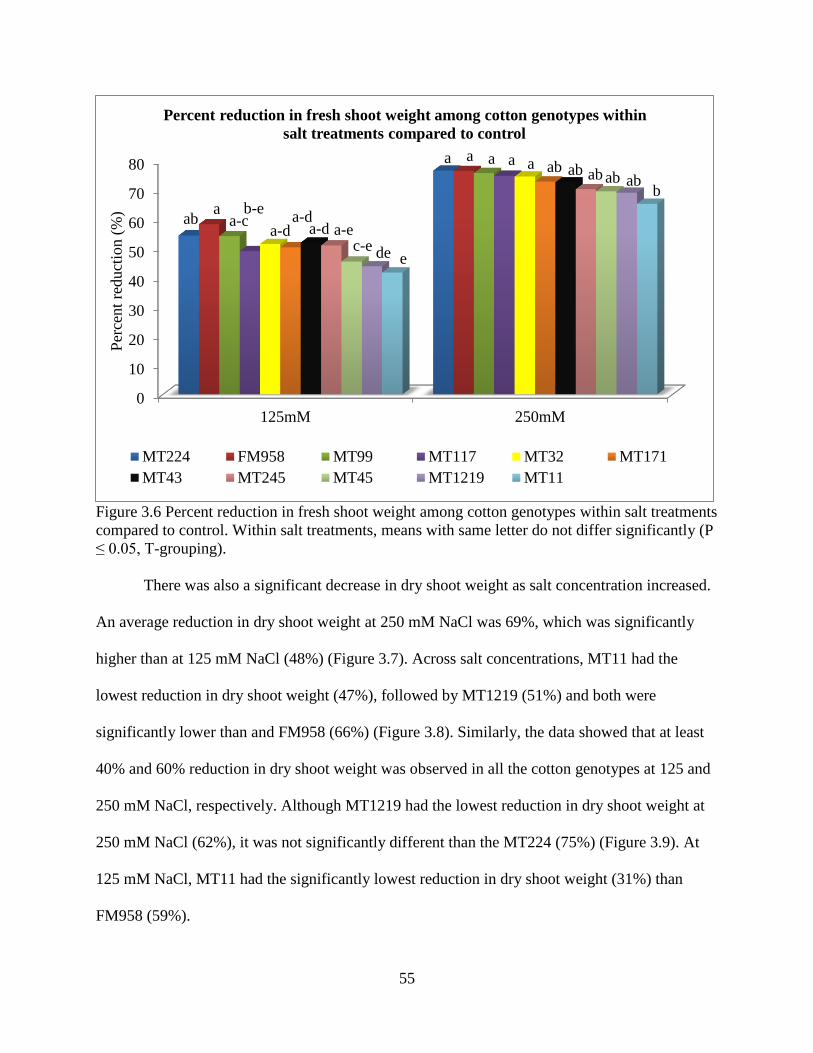
55
Figure 3.6 Percent reduction in fresh shoot weight among cotton genotypes within salt treatments
compared to control. Within salt treatments, means with same letter do not differ significantly (P
≤ 0.05, T-grouping).
There was also a significant decrease in dry shoot weight as salt concentration increased.
An average reduction in dry shoot weight at 250 mM NaCl was 69%, which was significantly
higher than at 125 mM NaCl (48%) (Figure 3.7). Across salt concentrations, MT11 had the
lowest reduction in dry shoot weight (47%), followed by MT1219 (51%) and both were
significantly lower than and FM958 (66%) (Figure 3.8). Similarly, the data showed that at least
40% and 60% reduction in dry shoot weight was observed in all the cotton genotypes at 125 and
250 mM NaCl, respectively. Although MT1219 had the lowest reduction in dry shoot weight at
250 mM NaCl (62%), it was not significantly different than the MT224 (75%) (Figure 3.9). At
125 mM NaCl, MT11 had the significantly lowest reduction in dry shoot weight (31%) than
FM958 (59%).
0
10
20
30
40
50
60
70
80
125mM 250mM
Per
cent
reduct
ion (
%)
Percent reduction in fresh shoot weight among cotton genotypes within
salt treatments compared to control
MT224 FM958 MT99 MT117 MT32 MT171
MT43 MT245 MT45 MT1219 MT11
a a a a aab
ab ab abb
ab
aab a-c a-d
a-d a-d a-e
b-e
c-e de e
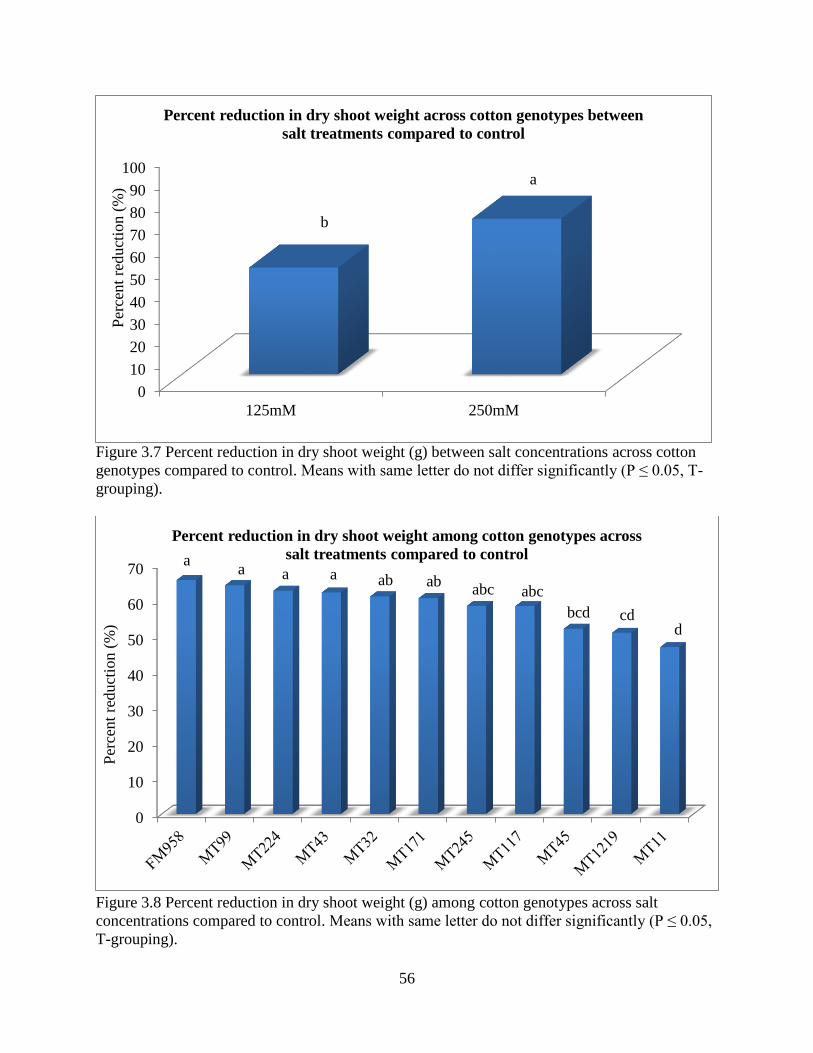
56
Figure 3.7 Percent reduction in dry shoot weight (g) between salt concentrations across cotton
genotypes compared to control. Means with same letter do not differ significantly (P ≤ 0.05, T-
grouping).
Figure 3.8 Percent reduction in dry shoot weight (g) among cotton genotypes across salt
concentrations compared to control. Means with same letter do not differ significantly (P ≤ 0.05,
T-grouping).
0
10
20
30
40
50
60
70
80
90
100
125mM 250mM
Per
cen
t re
du
ctio
n (
%)
Percent reduction in dry shoot weight across cotton genotypes between
salt treatments compared to control
b
a
0
10
20
30
40
50
60
70
Per
cent
reduct
ion (
%)
Percent reduction in dry shoot weight among cotton genotypes across
salt treatments compared to controlaa a a ab ab
abc
dcdbcd
abc
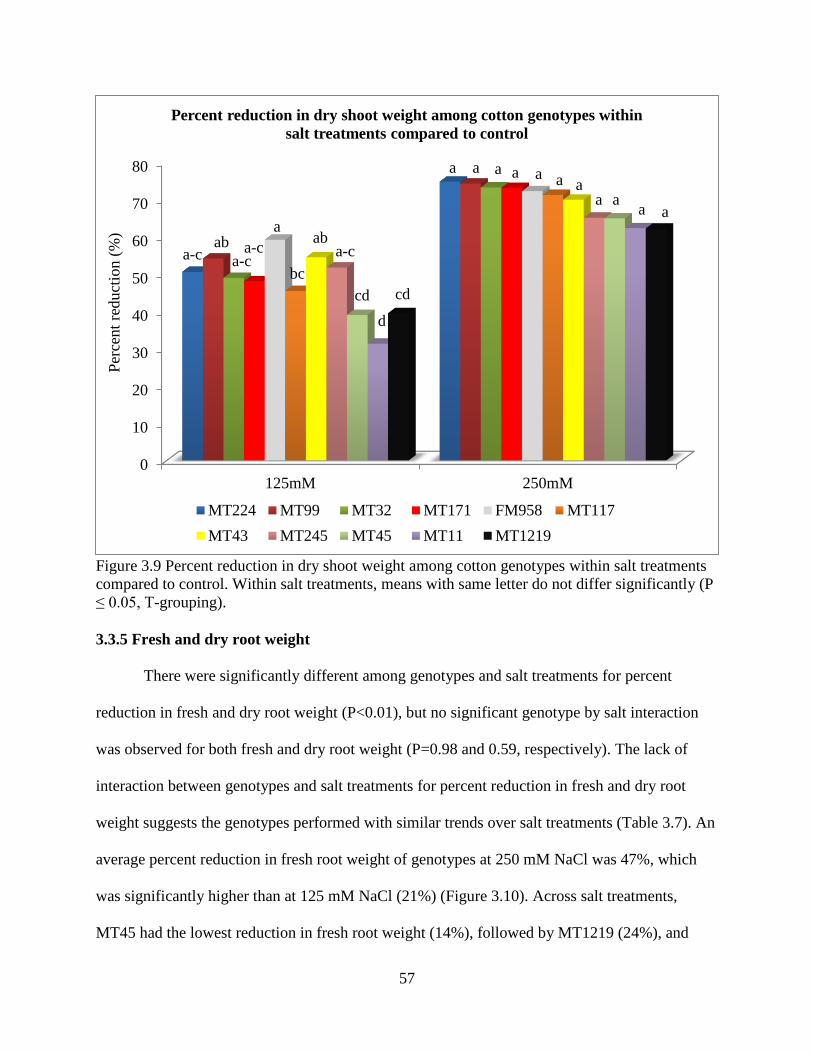
57
Figure 3.9 Percent reduction in dry shoot weight among cotton genotypes within salt treatments
compared to control. Within salt treatments, means with same letter do not differ significantly (P
≤ 0.05, T-grouping).
3.3.5 Fresh and dry root weight
There were significantly different among genotypes and salt treatments for percent
reduction in fresh and dry root weight (P<0.01), but no significant genotype by salt interaction
was observed for both fresh and dry root weight (P=0.98 and 0.59, respectively). The lack of
interaction between genotypes and salt treatments for percent reduction in fresh and dry root
weight suggests the genotypes performed with similar trends over salt treatments (Table 3.7). An
average percent reduction in fresh root weight of genotypes at 250 mM NaCl was 47%, which
was significantly higher than at 125 mM NaCl (21%) (Figure 3.10). Across salt treatments,
MT45 had the lowest reduction in fresh root weight (14%), followed by MT1219 (24%), and
0
10
20
30
40
50
60
70
80
125mM 250mM
Per
cent
reduct
ion (
%)
Percent reduction in dry shoot weight among cotton genotypes within
salt treatments compared to control
MT224 MT99 MT32 MT171 FM958 MT117
MT43 MT245 MT45 MT11 MT1219
a
aa
aaa
a
a
aa
aa
ab aba-c a-c
a-c
bc
cdcd
d
a-c
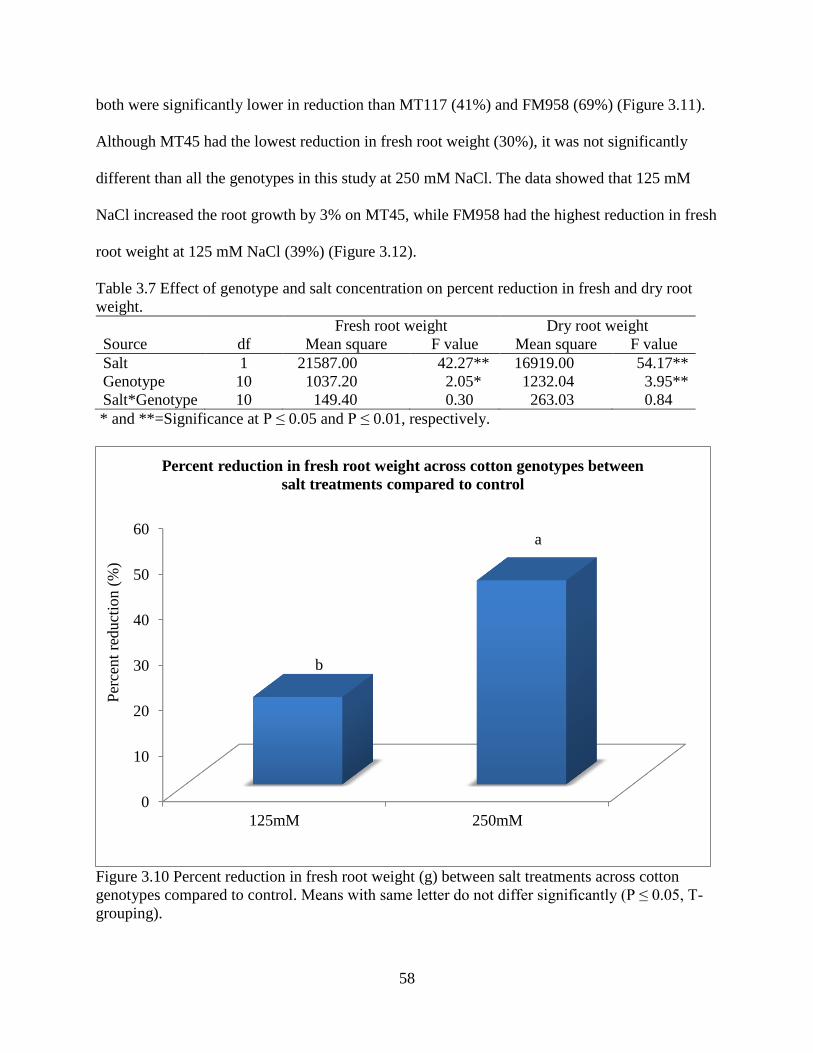
58
both were significantly lower in reduction than MT117 (41%) and FM958 (69%) (Figure 3.11).
Although MT45 had the lowest reduction in fresh root weight (30%), it was not significantly
different than all the genotypes in this study at 250 mM NaCl. The data showed that 125 mM
NaCl increased the root growth by 3% on MT45, while FM958 had the highest reduction in fresh
root weight at 125 mM NaCl (39%) (Figure 3.12).
Table 3.7 Effect of genotype and salt concentration on percent reduction in fresh and dry root
weight.
Fresh root weight Dry root weight
Source df Mean square F value Mean square F value
Salt 1 21587.00 42.27** 16919.00 54.17**
Genotype 10 1037.20 2.05* 1232.04 3.95**
Salt*Genotype 10 149.40 0.30 263.03 0.84
* and **=Significance at P ≤ 0.05 and P ≤ 0.01, respectively.
Figure 3.10 Percent reduction in fresh root weight (g) between salt treatments across cotton
genotypes compared to control. Means with same letter do not differ significantly (P ≤ 0.05, T-
grouping).
0
10
20
30
40
50
60
125mM 250mM
Per
cent
reduct
ion (
%)
Percent reduction in fresh root weight across cotton genotypes between
salt treatments compared to control
a
b
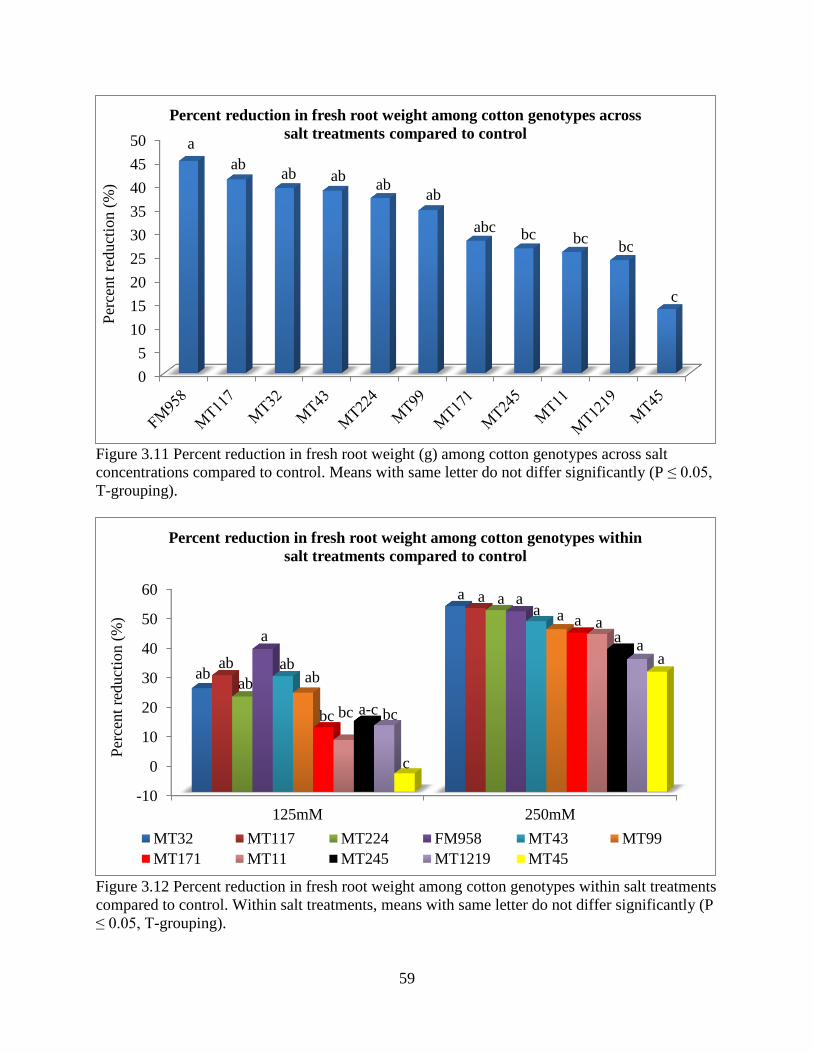
59
Figure 3.11 Percent reduction in fresh root weight (g) among cotton genotypes across salt
concentrations compared to control. Means with same letter do not differ significantly (P ≤ 0.05,
T-grouping).
Figure 3.12 Percent reduction in fresh root weight among cotton genotypes within salt treatments
compared to control. Within salt treatments, means with same letter do not differ significantly (P
≤ 0.05, T-grouping).
0
5
10
15
20
25
30
35
40
45
50
Per
cent
reduct
ion (
%)
Percent reduction in fresh root weight among cotton genotypes across
salt treatments compared to controla
abab ab
abab
abcbc
bcbc
c
-10
0
10
20
30
40
50
60
125mM 250mM
Per
cent
reduct
ion (
%)
Percent reduction in fresh root weight among cotton genotypes within
salt treatments compared to control
MT32 MT117 MT224 FM958 MT43 MT99
MT171 MT11 MT245 MT1219 MT45
a a
a
a aa
aa
a
aa
a
ab
abab ab
bc a-cbc bc
ab
c
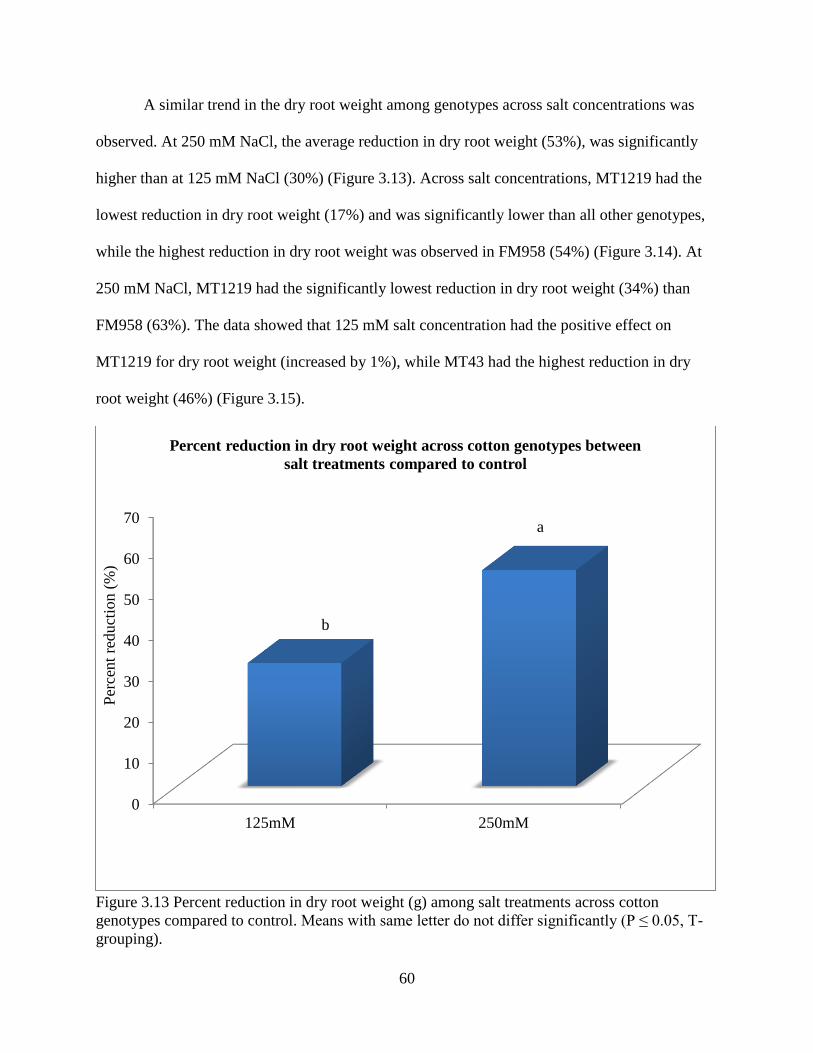
60
A similar trend in the dry root weight among genotypes across salt concentrations was
observed. At 250 mM NaCl, the average reduction in dry root weight (53%), was significantly
higher than at 125 mM NaCl (30%) (Figure 3.13). Across salt concentrations, MT1219 had the
lowest reduction in dry root weight (17%) and was significantly lower than all other genotypes,
while the highest reduction in dry root weight was observed in FM958 (54%) (Figure 3.14). At
250 mM NaCl, MT1219 had the significantly lowest reduction in dry root weight (34%) than
FM958 (63%). The data showed that 125 mM salt concentration had the positive effect on
MT1219 for dry root weight (increased by 1%), while MT43 had the highest reduction in dry
root weight (46%) (Figure 3.15).
Figure 3.13 Percent reduction in dry root weight (g) among salt treatments across cotton
genotypes compared to control. Means with same letter do not differ significantly (P ≤ 0.05, T-
grouping).
0
10
20
30
40
50
60
70
125mM 250mM
Per
cent
reduct
ion (
%)
Percent reduction in dry root weight across cotton genotypes between
salt treatments compared to control
a
b
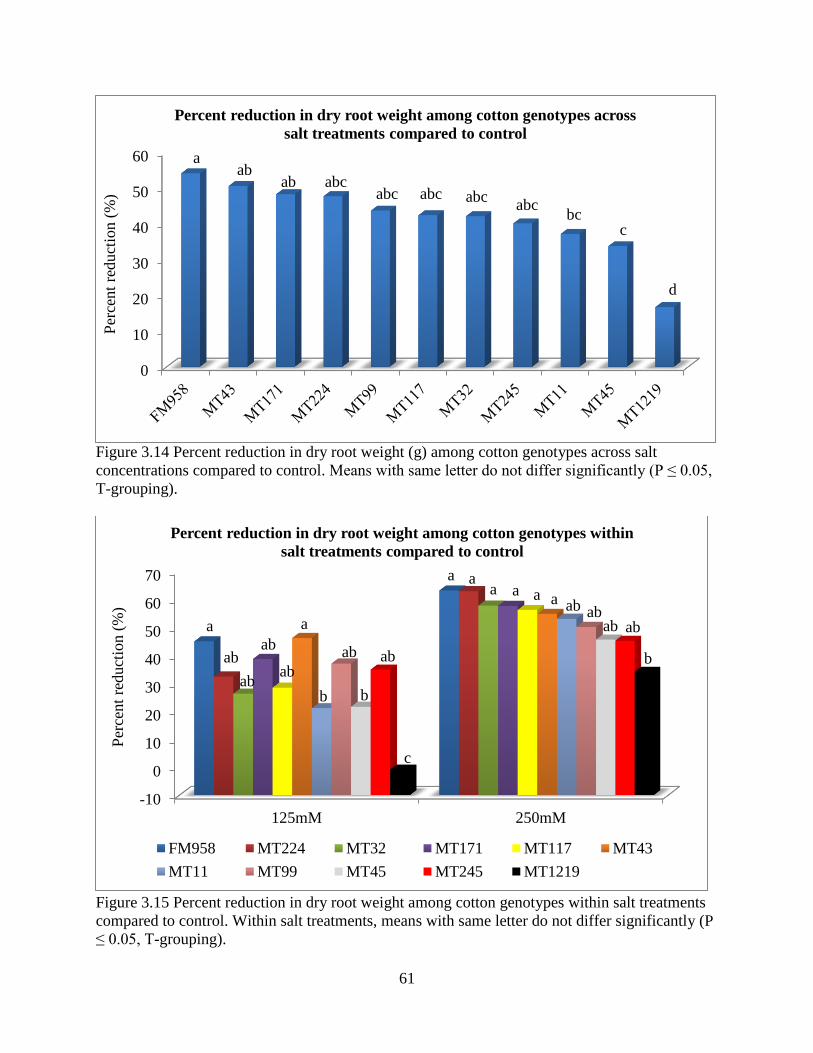
61
Figure 3.14 Percent reduction in dry root weight (g) among cotton genotypes across salt
concentrations compared to control. Means with same letter do not differ significantly (P ≤ 0.05,
T-grouping).
Figure 3.15 Percent reduction in dry root weight among cotton genotypes within salt treatments
compared to control. Within salt treatments, means with same letter do not differ significantly (P
≤ 0.05, T-grouping).
0
10
20
30
40
50
60
Per
cent
reduct
ion (
%)
Percent reduction in dry root weight among cotton genotypes across
salt treatments compared to control
aab
ab abcabc abc
d
cbc
abcabc
-10
0
10
20
30
40
50
60
70
125mM 250mM
Per
cent
reduct
ion (
%)
Percent reduction in dry root weight among cotton genotypes within
salt treatments compared to control
FM958 MT224 MT32 MT171 MT117 MT43
MT11 MT99 MT45 MT245 MT1219
a
a
aa a
ab
ababab
a
b
a
ab
a
ab
ababab ab
b b
c
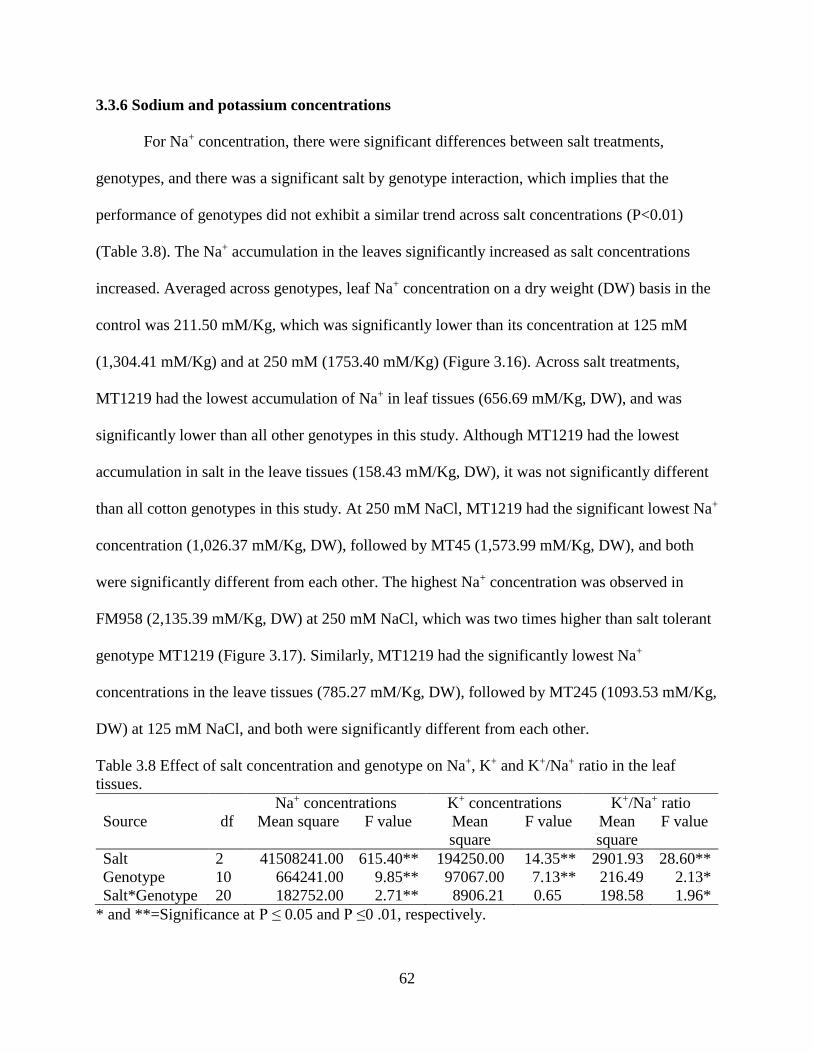
62
3.3.6 Sodium and potassium concentrations
For Na+ concentration, there were significant differences between salt treatments,
genotypes, and there was a significant salt by genotype interaction, which implies that the
performance of genotypes did not exhibit a similar trend across salt concentrations (P<0.01)
(Table 3.8). The Na+ accumulation in the leaves significantly increased as salt concentrations
increased. Averaged across genotypes, leaf Na+ concentration on a dry weight (DW) basis in the
control was 211.50 mM/Kg, which was significantly lower than its concentration at 125 mM
(1,304.41 mM/Kg) and at 250 mM (1753.40 mM/Kg) (Figure 3.16). Across salt treatments,
MT1219 had the lowest accumulation of Na+ in leaf tissues (656.69 mM/Kg, DW), and was
significantly lower than all other genotypes in this study. Although MT1219 had the lowest
accumulation in salt in the leave tissues (158.43 mM/Kg, DW), it was not significantly different
than all cotton genotypes in this study. At 250 mM NaCl, MT1219 had the significant lowest Na+
concentration (1,026.37 mM/Kg, DW), followed by MT45 (1,573.99 mM/Kg, DW), and both
were significantly different from each other. The highest Na+ concentration was observed in
FM958 (2,135.39 mM/Kg, DW) at 250 mM NaCl, which was two times higher than salt tolerant
genotype MT1219 (Figure 3.17). Similarly, MT1219 had the significantly lowest Na+
concentrations in the leave tissues (785.27 mM/Kg, DW), followed by MT245 (1093.53 mM/Kg,
DW) at 125 mM NaCl, and both were significantly different from each other.
Table 3.8 Effect of salt concentration and genotype on Na+, K+ and K+/Na+ ratio in the leaf
tissues.
Na+ concentrations K+ concentrations K+/Na+ ratio
Source df Mean square F value Mean
square
F value Mean
square
F value
Salt 2 41508241.00 615.40** 194250.00 14.35** 2901.93 28.60**
Genotype 10 664241.00 9.85** 97067.00 7.13** 216.49 2.13*
Salt*Genotype 20 182752.00 2.71** 8906.21 0.65 198.58 1.96*
* and **=Significance at P ≤ 0.05 and P ≤0 .01, respectively.
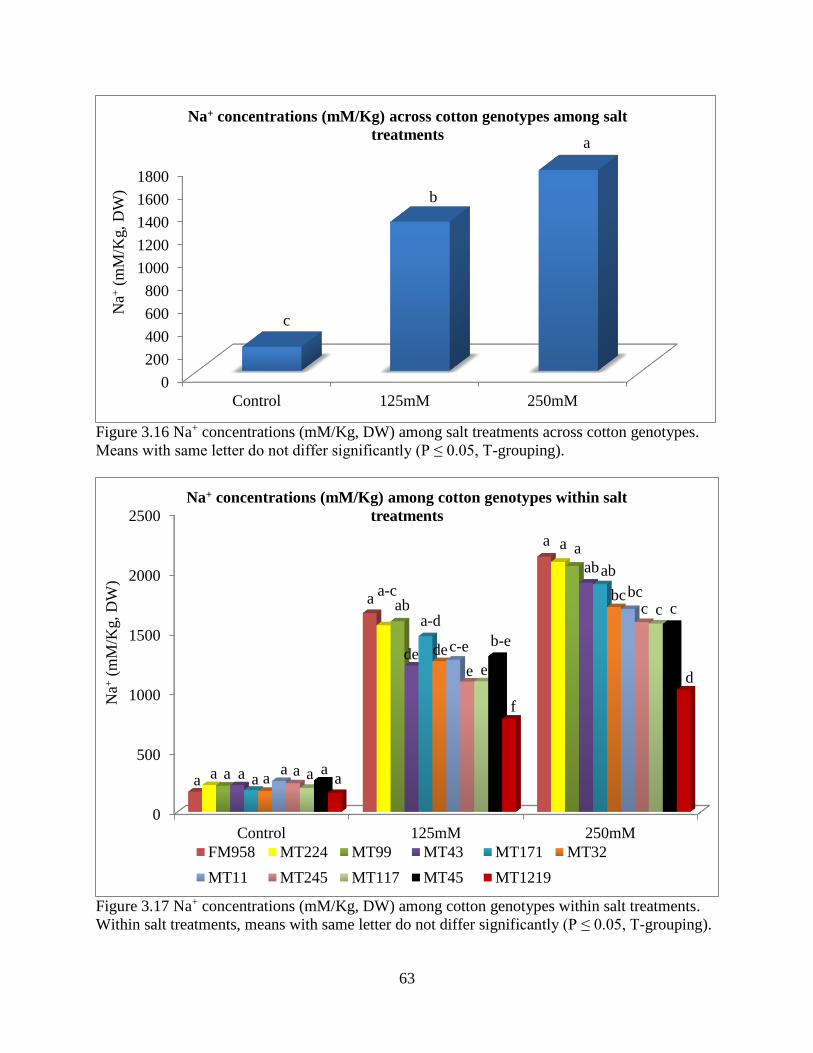
63
Figure 3.16 Na+ concentrations (mM/Kg, DW) among salt treatments across cotton genotypes.
Means with same letter do not differ significantly (P ≤ 0.05, T-grouping).
Figure 3.17 Na+ concentrations (mM/Kg, DW) among cotton genotypes within salt treatments.
Within salt treatments, means with same letter do not differ significantly (P ≤ 0.05, T-grouping).
0
200
400
600
800
1000
1200
1400
1600
1800
Control 125mM 250mM
Na+
(mM
/Kg,
DW
)Na+ concentrations (mM/Kg) across cotton genotypes among salt
treatments
c
b
a
0
500
1000
1500
2000
2500
Control 125mM 250mM
Na+
(mM
/Kg,
DW
)
Na+ concentrations (mM/Kg) among cotton genotypes within salt
treatments
FM958 MT224 MT99 MT43 MT171 MT32
MT11 MT245 MT117 MT45 MT1219
a a a a a aa a a a
a
abaa-c
a-d
b-ec-e
f
e ede de
a a a
abab
bcbcccc
d
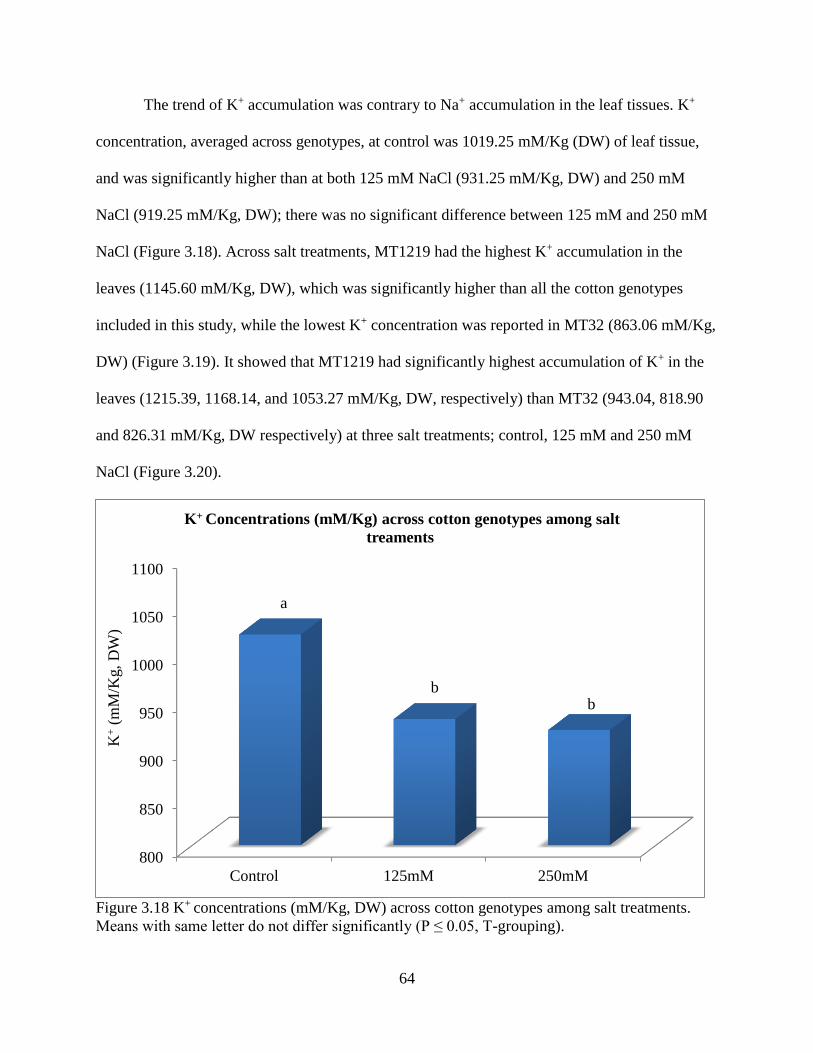
64
The trend of K+ accumulation was contrary to Na+ accumulation in the leaf tissues. K+
concentration, averaged across genotypes, at control was 1019.25 mM/Kg (DW) of leaf tissue,
and was significantly higher than at both 125 mM NaCl (931.25 mM/Kg, DW) and 250 mM
NaCl (919.25 mM/Kg, DW); there was no significant difference between 125 mM and 250 mM
NaCl (Figure 3.18). Across salt treatments, MT1219 had the highest K+ accumulation in the
leaves (1145.60 mM/Kg, DW), which was significantly higher than all the cotton genotypes
included in this study, while the lowest K+ concentration was reported in MT32 (863.06 mM/Kg,
DW) (Figure 3.19). It showed that MT1219 had significantly highest accumulation of K+ in the
leaves (1215.39, 1168.14, and 1053.27 mM/Kg, DW, respectively) than MT32 (943.04, 818.90
and 826.31 mM/Kg, DW respectively) at three salt treatments; control, 125 mM and 250 mM
NaCl (Figure 3.20).
Figure 3.18 K+ concentrations (mM/Kg, DW) across cotton genotypes among salt treatments.
Means with same letter do not differ significantly (P ≤ 0.05, T-grouping).
800
850
900
950
1000
1050
1100
Control 125mM 250mM
K+
(mM
/Kg,
DW
)
K+ Concentrations (mM/Kg) across cotton genotypes among salt
treaments
bb
a
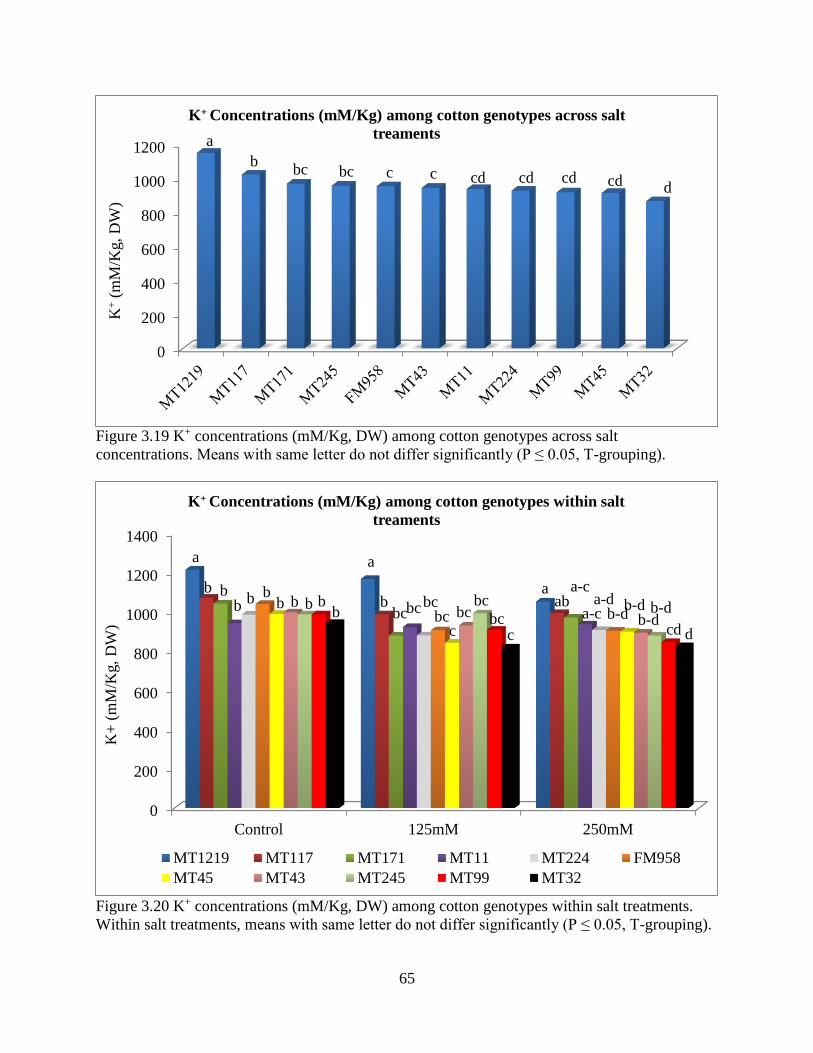
65
Figure 3.19 K+ concentrations (mM/Kg, DW) among cotton genotypes across salt
concentrations. Means with same letter do not differ significantly (P ≤ 0.05, T-grouping).
Figure 3.20 K+ concentrations (mM/Kg, DW) among cotton genotypes within salt treatments.
Within salt treatments, means with same letter do not differ significantly (P ≤ 0.05, T-grouping).
0
200
400
600
800
1000
1200
K+
(mM
/Kg,
DW
)K+ Concentrations (mM/Kg) among cotton genotypes across salt
treamentsa
bbc bc c c cd cd
dcdcd
0
200
400
600
800
1000
1200
1400
Control 125mM 250mM
K+
(m
M/K
g,
DW
)
K+ Concentrations (mM/Kg) among cotton genotypes within salt
treaments
MT1219 MT117 MT171 MT11 MT224 FM958
MT45 MT43 MT245 MT99 MT32
a
bb
bb bb
bb
bb
a
bbc
bcbc
bcbcbc
bcc c
aab
a-c
a-ca-d b-d
b-db-db-d
cd d
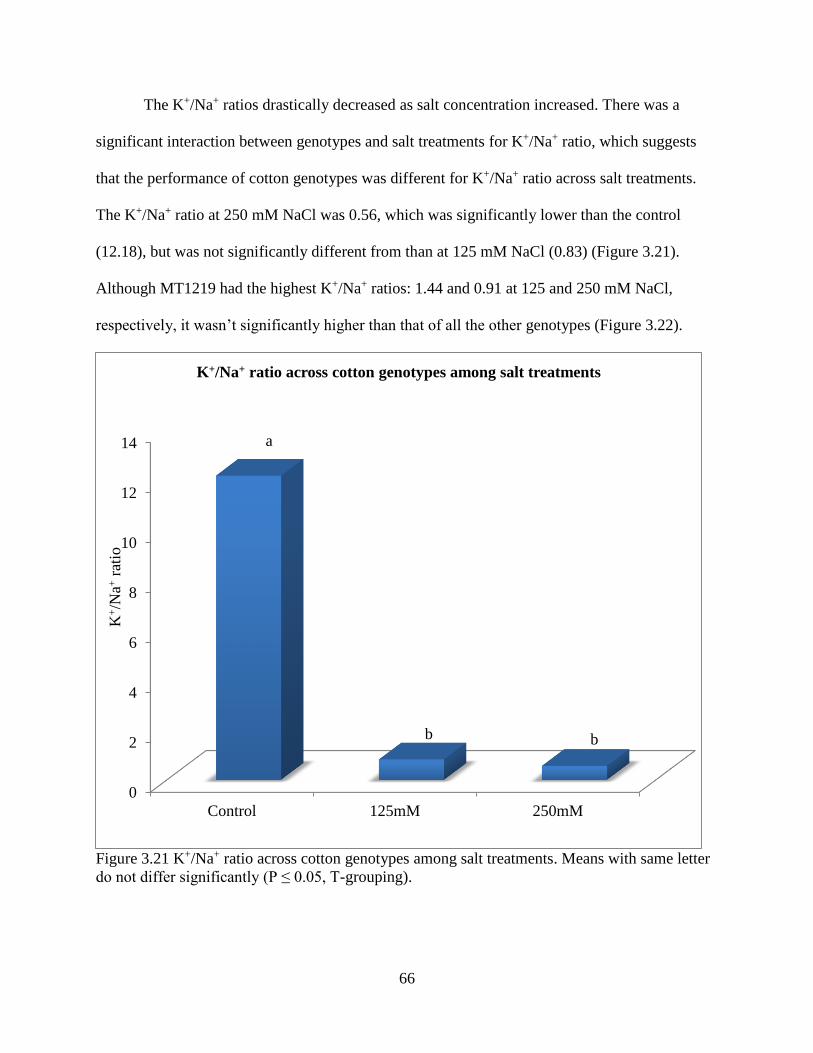
66
The K+/Na+ ratios drastically decreased as salt concentration increased. There was a
significant interaction between genotypes and salt treatments for K+/Na+ ratio, which suggests
that the performance of cotton genotypes was different for K+/Na+ ratio across salt treatments.
The K+/Na+ ratio at 250 mM NaCl was 0.56, which was significantly lower than the control
(12.18), but was not significantly different from than at 125 mM NaCl (0.83) (Figure 3.21).
Although MT1219 had the highest K+/Na+ ratios: 1.44 and 0.91 at 125 and 250 mM NaCl,
respectively, it wasn’t significantly higher than that of all the other genotypes (Figure 3.22).
Figure 3.21 K+/Na+ ratio across cotton genotypes among salt treatments. Means with same letter
do not differ significantly (P ≤ 0.05, T-grouping).
0
2
4
6
8
10
12
14
Control 125mM 250mM
K+/N
a+ra
tio
K+/Na+ ratio across cotton genotypes among salt treatments
a
b b
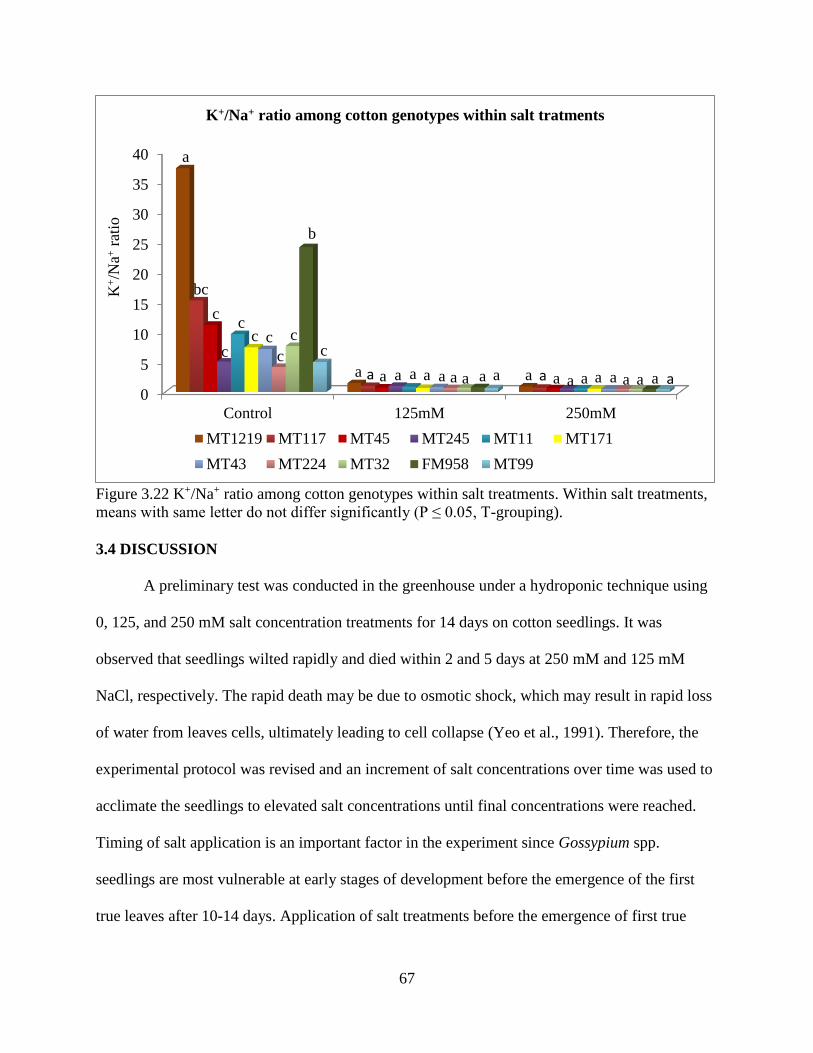
67
Figure 3.22 K+/Na+ ratio among cotton genotypes within salt treatments. Within salt treatments,
means with same letter do not differ significantly (P ≤ 0.05, T-grouping).
3.4 DISCUSSION
A preliminary test was conducted in the greenhouse under a hydroponic technique using
0, 125, and 250 mM salt concentration treatments for 14 days on cotton seedlings. It was
observed that seedlings wilted rapidly and died within 2 and 5 days at 250 mM and 125 mM
NaCl, respectively. The rapid death may be due to osmotic shock, which may result in rapid loss
of water from leaves cells, ultimately leading to cell collapse (Yeo et al., 1991). Therefore, the
experimental protocol was revised and an increment of salt concentrations over time was used to
acclimate the seedlings to elevated salt concentrations until final concentrations were reached.
Timing of salt application is an important factor in the experiment since Gossypium spp.
seedlings are most vulnerable at early stages of development before the emergence of the first
true leaves after 10-14 days. Application of salt treatments before the emergence of first true
0
5
10
15
20
25
30
35
40
Control 125mM 250mM
K+/N
a+ra
tio
K+/Na+ ratio among cotton genotypes within salt tratments
MT1219 MT117 MT45 MT245 MT11 MT171
MT43 MT224 MT32 FM958 MT99
a a aa aa aaa aa aaa a aaa aa aa
a
b
bc
c
c
ccc
c
c
c
68
leaves is not recommend because the salt might suppress or kill the first true leaves and mask
genotypic differences in salt tolerance parameters. Using our recommended protocol, we delayed
the initiation of the salt treatments until the attainment of the first true leaf stage (14 days after
seed sowing) and only then applied the salt concentration treatments in increments of 62.50 mM
in each day to prevent salt stress shock.
Researchers have developed a number of salt screening techniques to evaluate the salt
tolerant cotton genotypes. Due to spatial and temporal variations in soil salinity across the field,
hydroponic and pot cultures have been widely used for salt screening because they are rapid and
reliable (Akhtar et al., 2010; Munns et al., 2002). Akhtar et al. (2010) reported that hydroponic
and soil based screening techniques are both effective in salt screening for cotton genotypes.
However, Tavakkoli et al. (2012) reported that salt screening using hydroponic techniques did
not truly replicate field conditions because seedlings are exposed to salt stress for only a short
period of time. In contrast to hydroponics, a strong correlation between a pot culture based salt
screening technique and field screening was observed (Tavakkoli et al., 2012). In this study, the
hydroponic technique had presented a limitation due to its inability to provide adequate physical
support to seedlings beyond 14 days after salt treatments. The hydroponic technique did have the
advantage of using less space but after the initial screening a pot based protocol was used.
Based on reduction in plant height, there was a similarity in genotype ranking for salt
tolerance across salt treatments between hydroponic and pot culture except for MT45 and
MT224. In the hydroponic technique, MT45 and MT224 had one of the highest and lowest
reduction in plant height across salt concentrations, but the opposite was observed for MT45 and
MT224 in the pot culture, respectively. There were also some discrepancies among the measured
plant parameters between the hydroponics and pot culture. These discrepancies for genotype
69
rankings against elevated salt concentrations might be due to fundamental differences in nature
between the hydroponic and pot culture (Tavakkoli et al., 2012). Compared to pot culture,
smaller and thicker leaves were observed in the medium and high salt concentrations (125 and
250 mM) under hydroponic technique. The rate of reduction (percent reduction) in plant
parameters measured over time was faster in hydroponics than pot culture.
Identification of variation in genotype response to elevated salt concentrations is a first
step to identify and breed for more salt tolerant cotton. Researchers have been using a variety of
phenotypic, physiological, and biochemical criteria to identify the salt tolerant genotypes in
many crop species (Higbie et al., 2010; Parida and Das, 2005). Phenotypic criteria, such as
percent reduction in plant height and dry shoot weight under salt stress are easy and efficient
screening criteria to identify salt tolerant cotton genotypes. Reduction in plant height under salt
stress in the field condition might be an easy, reliable, and non-destructive selection criteria
because the impact of increasing salt concentration on plant height is prominent (Higbie et al.,
2010; Lashin and Atanasiu, 1972). In contrast, Abbas et al. (2011) argued that percent reduction
in dry shoot weight was a more viable criteria to select salt tolerant genotypes because it is
highly correlated with Na+ concentration in the leaves. This study showed that reduction in plant
height and dry shoot weight were both equally effective in screening for salt tolerance of any
cotton genotypes because they were highly correlated with each other (Table 3.4). This study
also supports the finding that reduction in plant height is an easy, rapid, and reliable criteria for
screening salt tolerance in both greenhouse and field conditions.
Although cotton is relatively tolerant to salt (7.7 dSM-1) compared to many other row
crops, a significant and rapid decrease in plant height and dry shoot weight was observed across
elevated salt concentrations. Out of 11 genotypes, the performance of MT1219 and MT245 were
70
phenotypically consistent and better than other genotypes in both hydroponic and pot culture.
Based on pot based screening method, FM958, MT99, and MT224 had the greatest reduction in
plant height, fresh and dry shoot weight and should be considered as salt sensitive genotypes.
Compared to other genotypes, MT11, MT1219, MT45, and MT245 had the lowest reduction in
plant height, fresh and dry shoot weight and should be considered as salt tolerant genotypes.
Physiologically, the accumulation of Na+ in leaves is the primary response of genotypes
against elevated salt concentrations (Cramer, 2002; Meneguzzo et al., 2000). It is well
established that a low Na+ concentration in leaf tissues is positively correlated with salt tolerance
in many crops species (Basel, 2011; Munns et al., 2003). There was a significant positive
correlation between the percent reduction in plant parameters (plant height, fresh and dry shoot
weight, fresh and dry root weight) and Na+ accumulation in this study, supported by the
observation that the lowest reduction in plant height and dry shoot weight was found across
genotypes with the smallest accumulation of Na+ in the leaf tissues (Table 3.4). The data
revealed that there was an increase in Na+ concentration among genotypes when salt treatments
increased from 0 to 250 mM NaCl, but the rate of Na+ accumulation in the leaves varied across
the genotypes (Figures 3.16 and 3.17). Compared to the control, a thin stem with small leaves
was observed across genotypes under salt stress. This might be due to a rapid accumulation of
Na+ on the leaf tissue under elevated salt concentrations which interferes with cellular metabolic
activities, and ultimately reduces cell division and elongation (Cramer, 2002; Fricke and Peters,
2002). Under both low and high salt concentrations (125 mM and 250 mM NaCl), chlorosis and
necrosis was observed in the older leaves across all genotypes. Such symptomology is likely due
to longer exposure to salt stress in old vs. young leaves (Munns and Tester, 2008). Across salt
71
concentrations (250 mM), the lowest Na+ accumulation in the leaf tissues was observed in
MT1219 followed by MT45, MT245, and MT11 and all are considered as salt tolerant varieties.
The pattern of Na+ accumulation in various plant tissues under salt stress may be due to
both inter- and intra-specific variation among genotypes, which allows for the discrimination
between salt tolerant and susceptible genotypes (Ashraf, 2002; Flowers et al., 1977). Exclusion
of sodium ion entry and control of its transport through the root system is one of the important
physiological mechanisms to limit the accumulation of Na+ and prevent it from reaching toxic
levels in leaf tissues. Such exclusion can be achieved by low net Na+ uptake by the root cortex
and by tight control of ion transport into the xylem through the parenchyma cells in the roots
(Davenport et al., 2005). Previous studies reported that Na+/H+ and K+/Na+ anti-transporter are
the two important transport systems, which regulate the flow of Na+ in, between, and within
plant cells (Apse et al., 1999; Zhu et al., 1993). Compartmentalization of Na+ into vacuoles in the
cytosol, regulation of K+, and maintaining a high K+/Na+ ratio in the cytosol are features, also
observed in many salt tolerant crop species (Munis et al., 2010; Munns and Tester, 2008).
The increased concentration of Na+ in the medium competes with K+ for absorption,
which leads to a significant decreased in K+ and an increase in Na+ concentration in the leaves
(Ashraf and Ahmad, 2000; Higbie et al., 2010; Qadir and Shams, 1997). The decrease in K+
concentration in the leaves may also be responsible for reduction in the leaf expansion and plant
growth (Higbie et al., 2010). In this study, K+ concentrations were significantly decreased in the
leaf tissues at elevated salt concentrations (Figure 3.18). Previous studies have shown that
K+/Na+ ratio significantly decreases with increased salt concentration (Ahmad et al., 2002; Khan
et al., 2009). The high K+/Na+ ratio in the leaves is important for normal cellular function and
might be considered another useful indicator for salt tolerance in many crop species (Zhu, 2003).
72
This study also showed that high K+/Na+ ratio in the leaf tissues decreases the rate of reduction in
plant growth under salt stress conditions (Table 3.4). Although there were no significant
differences among genotypes at 250 mM, salt tolerant genotypes, i.e. MT1219, MT45, MT245,
and MT11 had slightly higher K+/Na+ ratios than the salt susceptible genotypes MT224, FM958,
and MT99. A high K+/Na+ ratio in the leaf tissues in the salt tolerant genotypes might be due to
selective uptake of K+ over Na+ and exchange of K+ over Na+ during ion transport in the plasma
lemma of root cortex (Jeschke and Wolf, 1988).
3.5 REFERENCES
Abbas, G., T.M. Khan, A.A. Khan, and A.I. Khan. 2011. Discrimination of salt tolerant and
susceptible cotton genotypes at seedling stage using selection index. Int. J. Agri. Bio. 13:
339-345.
Abul-Naas, A.A., and M.S. Omran. 1974. Salt tolerance of seventeen cotton cultivars during
germination and early seedling development. Z. Acker. Pflanzenbau. 140: 229-236.
Ahmad, S., N. Khan, M.Z. Iqbal, A. Hussain, and M. Hassan. 2002. Salt tolerance of cotton
(Gossypium hirsutum L.). Asian J. Plant Sci. 1: 715-719.
Akhtar, J., Z. Saqib, M. Sarfraz, I. Saleem, and M. Haq. 2010. Evaluating salt tolerant cotton
genotypes at different levels of NaCl stress in solution and soil culture. Pak. J. Bot. 42:
2857-2866.
Apse, M.P., G.S. Aharon, W.A. Snedden, and E. Blumwald. 1999. Salt tolerance conferred by
overexpression of a vacuolar Na+/H+ antiport in Arabidopsis. Sci. 285: 1256-1258.
Ashraf, M. 2002. Salt tolerance of cotton: some new advances. Crit. Rev. Plant Sci. 21: 1-30.
Ashraf, M., and S. Ahmad. 2000. Influence of sodium chloride on ion accumulation, yield
components and fibre characteristics in salt-tolerant and salt-sensitive lines of cotton
(Gossypium hirsutum L.). Field Crops Res. 66: 115-127.
Babu, V.R., S.M. Prasad, and D.S.K. Rao. 1987. Evaluation of cotton genotypes for tolerance to
saline water irrigation. Indian J. Agron. 32: 229-231.
Basel, S. 2011. Effect of salt stress (NaCl) on biomass and K+/Na+ ratio in cotton. J. Stress
Physiol. Biochem. 7: 5-15.
73
Bernstein, L. 1975. Effects of salinity and sodicity on plant growth. Annu. Rev. Phytopathol. 13:
295-312.
Bhatti, M.A., and F.M. Azhar. 2002. Salt tolerance of nine Gossypium hirsutum L. varieties to
NaCl salinity at early stage of plant development. Int. J. Agric. Biol. 4: 544-546.
Brady, N.C., and R.R. Weil. 2009. Elements of the nature and properties of soils. 3rd ed. Pearson
Educational International, Upper Saddle River, NJ.
Branch, B. 2004. Salt water and irrigation in Louisiana.
http://text.lsuagcenter.com/en/communications/publications/agmag/Archive/2004/Spring/
Salt+Water+and+Irrigation+in+Louisiana.htm (accessed 30 June 2013).
Bray, E.A., J. Bailey-Serres, and E. Weretilnyk. 2000. Responses to abiotic stresses. In: W.
Gruissem, B. Buchannan and R. Jones, editors, Biochemistry and molecular biology of
plants. American Society of Plant Physiologists, Rockville, MD. p. 1158–1249.
Castillo, N. 2011. A hydroponic approach to evaluate responses to salinity stress in cotton. Ph.D.
diss., Texas Tech Univ., Lubbock.
Chachar, Q.I., A.G. Solangi, and A. Verhoef. 2008. Influence of sodium chloride on seed
germination and seedling root growth of cotton (Gossypium hirsutum L.). Pak. J. Bot. 40:
183-197.
Chen, W., Z. Hou, L. Wu, Y. Liang, and C. Wei. 2010. Effects of salinity and nitrogen on cotton
growth in arid environment. Plant Soil 326: 61-73.
Chhabra, R. 1996. Soil salinity and water quality. 1st ed. CRC Press, Brookfield, VT.
Cramer, G.R. 2002. Response of abscisic acid mutants of Arabidopsis to salinity. Funct. Plant
Biol. 29: 561-567.
Davenport, R., R.A. James, A. Zakrisson-Plogander, M. Tester, and R. Munns. 2005. Control of
sodium transport in durum wheat. Plant Physiol. 137: 807-818.
Flowers, T.J., P.F. Troke, and A.R. Yeo. 1977. The mechanism of salt tolerance in halophytes.
Ann. Rev. Plant Physiol. 28: 89-121.
Fricke, W., and W.S. Peters. 2002. The biophysics of leaf growth in salt-stressed barley. A study
at the cell level. Plant Physiol. 129: 374-388.
Ghassemi, F., A.J. Jakeman, and H.A. Nix. 1995. Salinisation of land and water resources:
human causes, extent, management and case studies. 1st ed. CAB international,
Wallingford, Oxon, UK.
Grattan, S.R., and C.M. Grieve. 1998. Salinity–mineral nutrient relations in horticultural crops.
Sci. Hortic. 78: 127-157.
74
Hamdy, A., S. Abdel-Dayem, and M. Abu-Zeid. 1993. Saline water management for optimum
crop production. Agric. Water Manage. 24: 189-203.
Hasegawa, P.M., R.A. Bressan, J.-K. Zhu, and H.J. Bohnert. 2000. Plant cellular and molecular
responses to high salinity. Ann. Rev. Plant Biol. 51: 463-499.
Higbie, S.M., F. Wang, J.M. Stewart, T.M. Sterling, W.C. Lindemann, E. Hughs, and J. Zhang.
2010. Physiological response to salt (NaCl) stress in selected cultivated tetraploid
cottons. Int. J. Agron. 2010: 1-12.
Jeschke, W.D., and O. Wolf. 1988. External potassium supply is not required for root growth in
saline conditions: experiments with Ricinus communis L. grown in a reciprocal split-root
system. J. Exp. Bot. 39: 1149-1167.
Khan, A.N., R.H. Qureshi, and N. Ahmad. 1995. Performance of cotton cultivars in saline
growth media at germination stage. Sarhad J. Agric. 11: 643–646.
Khan, M.A., M.U. Shirazi, S.M. Mujtaba, E. Islam, S. Mumtaz, A. Shereen, R.U. Ansari, and
M.Y. Ashraf. 2009. Role of proline, K/Na ratio and chlorophyll content in salt tolerance
of wheat (Triticum aestivum L.). Pak. J. Bot. 41: 633-638.
Knutson, A., S. Isaacs, Carlos Campos, M. Campos, and C.W. Smith. 2014. Resistance to cotton
fleahopper feeding in primitive and converted race stocks of cotton, Gossypium hirsutum.
J. Cotton Sci. 18: 385–392
Korkor, S., M.Y. Tayel, and F. Antar. 1974. The effect of salinity on cotton yield and quality.
Egypt. J. Soil Sci. 14: 137–148.
Lashin, M.H., and N. Atanasiu. 1972. Studies on the effect of salt concentrations on the
formation of dry matter, uptake of mineral nutrients and mineral composition of cotton
plants during the vegetative growth period. J. Agron. Crop Sci. 135: 178-186.
Latif, A., and M.A. Khan. 1976. Effect of soil salinity on cotton (Gossypium hirsutum L.) at
different stages of growth. Pak. J. Bot. 20: 91-104.
Longenecker, D.E. 1974. The influence of high sodium in soils upon fruiting and shedding, boll
characteristics, fiber properties, and yields of two cotton species. Soil Sci. 118: 387-396.
Maas, E.V., and G.J. Hoffman. 1977. Crop salt tolerance\current assessment. J. Irr. Drain. Div.
103: 115-134.
McCarty, J.C., and J.N. Jenkins. 1993. Registration of 79 day-neutral primitive cotton
germplasm lines. Crop Sci. 33: 351.
McCarty, J.C., and J.N. Jenkins. 2002. Registration of 16 day length-neutral flowering primitive
cotton germplasm lines. Crop Sci. 42: 1755-1756.
75
McCarty, J.C., J.N. Jenkins, B. Tang, and C.E. Watson. 1996. Genetic analysis of primitive
cotton germplasm accessions. Crop Sci. 36: 581-585.
McCarty, J.C., J.N. Jenkins, and J. Wu. 2004. Primitive accession derived germplasm by cultivar
crosses as sources for cotton improvement. Crop Sci. 44: 1226-1230.
McCarty, J.C., J. Wu, and J.N. Jenkins. 2006. Genetic diversity for agronomic and fiber traits in
day-neutral accessions derived from primitive cotton germplasm. Euphytica 148: 283-
293.
Meneguzzo, S., F. Navari-Izzo, and R. Izzo. 2000. NaCl effects on water relations and
accumulation of mineral nutrients in shoots, roots and cell sap of wheat seedlings. J. Plant
Physiol. 156: 711-716.
Morgan, J. 2010. Salt water killing soybeans in Louisiana.
http://deltafarmpress.com/soybeans/salt-water-killing-soybeans-louisiana (accessed 6
July 2014).
Munis, M.F.H., L. Tu, K. Ziaf, J. Tan, F. Deng, and X. Zhang. 2010. Critical osmotic, ionic and
physiological indicators of salinity tolerance in cotton (Gossypium hirsutum L.) for
cultivar selection. Pak. J. Bot. 42: 1685-1694.
Munns, R., S. Husain, A.R. Rivelli, R.A. James, A.T. Condon, M.P. Lindsay, E.S. Lagudah, D.P.
Schachtman, and R.A. Hare. 2002. Avenues for increasing salt tolerance of crops, and the
role of physiologically based selection traits. Plant Soil 247: 93-105.
Munns, R., G.J. Rebetzke, S. Husain, R.A. James, and R.A. Hare. 2003. Genetic control of
sodium exclusion in durum wheat. Crop Pasture Sci. 54: 627-635.
Munns, R., and M. Tester. 2008. Mechanisms of salinity tolerance. Ann. Rev. Plant Biol. 59:
651-681.
National Cottonseed Products Association. 2014. Cottonseed oil.
http://www.cottonseed.com/publications/default.asp (accessed 11 June 2014).
Parida, A.K., and A.B. Das. 2005. Salt tolerance and salinity effects on plants: a review.
Ecotoxicol. Environ. Saf. 60: 324-349.
Qadir, M., and M. Shams. 1997. Some agronomic and physiological aspects of salt tolerance in
cotton (Gossypium hirsutum L.). J. Agron. Crop Sci. 179: 101-106.
Razzouk, S., and W.J. Whittington. 1991. Effects of salinity on cotton yield and quality. Field
Crops Res. 26: 305-314.
Reinhardt, D.H., and T.L. Rost. 1995. Primary and lateral root development of dark- and light-
grown cotton seedlings under salinity stress. Bot. Acta 108: 457-465.
76
Tavakkoli, E., F. Fatehi, P. Rengasamy, and G.K. McDonald. 2012. A comparison of hydroponic
and soil-based screening methods to identify salt tolerance in the field in barley. J. Exp.
Bot. 63: 1-15.
USDA. 2014. Cotton: world markets and trade.
http://apps.fas.usda.gov/psdonline/circulars/cotton.pdf (accessed 10 September 2014).
Wang, R., Y. Kang, S. Wan, W. Hu, S. Liu, and S. Liu. 2011. Salt distribution and the growth of
cotton under different drip irrigation regimes in a saline area. Agric. Water Manage. 100:
58-69.
Wang, W., B. Vinocur, and A. Altman. 2003. Plant responses to drought, salinity and extreme
temperatures: towards genetic engineering for stress tolerance. Planta 218: 1-14.
Wild, A. 2003. Soils, land and food: managing the land during the twenty-first century. 1st ed.
Cambridge University Press, Cambridge, UK.
Ye, W.W., J.D. Liu, B.X. Fan, and Q.M. Hu. 1997. The effect of salt on the fibre characteristics
in upland cotton. China Cottons 24: 17-18.
Yeo, A.R., P. Izard, P.J. Boursier, and T.J. Flowers. 1991. Short-and long-term effects of salinity
on leaf growth in rice (Oryza sativa L.). J. Exp. Bot. 42: 881-889.
Younis, M.E., M.N.A. Hasaneen, and M.M. Nemet-Alla. 1987. Plant growth, metabolism and
adaptation in relation to stress conditions IV. Effects of salinity on certain factors
associated with the germination of three different seeds high in fats. Ann. Bot. 60: 337-
344.
Zhu, J.K. 2003. Regulation of ion homeostasis under salt stress. Curr. Opion. Plant Biol. 6: 441-
445.
Zhu, J.K., J. Shi, U. Singh, S.E. Wyatt, R.A. Bressan, P.M. Hasegawa, and N.C. Carpita. 1993.
Enrichment of vitronectin and fibronectin like proteins in NaCl adapted plant cells and
evidence for their involvement in plasma membrane cell wall adhesion. Plant J. 3: 637-
646.
77
CHAPTER 4: PREDICTION OF SPINNING VALUES OF COTTON FIBERS
4.1 INTRODUCTION
Cotton is the leading natural textile fiber as well as one of the most important oilseed
crops in the world. It is important in agricultural trade and is grown in more than 80 countries.
The goal of cotton breeders from public and private institutions is to develop high yielding
cotton varieties with improved fiber qualities to meet the requirements of standard yarn
properties. The development of new cotton varieties takes about 8-10 years and requires
meticulous effort and time (Poehlman, 1987; Russell, 1978). Knowledge of the relationship
between yarn and fiber properties is important for cotton breeders to select high quality
genotypes/offspring in the breeding program. Yarn is a long twisted strand of the cotton fibers
prepared by using various spinning techniques. In the textile industry, yarn quality is a vital
component which determines the quality of fabric and clothes (Zhu and Ethridge, 1996).
Before the introduction of High Volume Instrument techniques, cotton breeders used
hand grading and staple length of fibers to select the cotton fibers for the spinning industry
(Majumdar et al., 2004). In 1969, the High Volume Instrument (HVI) was developed by the
United States Department of Agriculture (USDA) to mechanically measure the fiber properties.
HVI provides information about upper half mean length (UHML), micronaire, strength,
uniformity, elongation, reflectance, and yellowness of fibers (Sasser, 1981). HVI is currently
used as the marketing tool for textile mills to evaluate the fiber properties in the bales of cotton
(Suh and Sasser, 1996). It is very popular tool for cotton breeders because a large number of
fiber samples can be processed in short periods of time at low cost. One of the problems with
using HVI data directly, is that multiple, individual data points are generated. The
interrelationship between the various HVI parameters is not represented and it is their interplay,
78
along with spinning equipment variables that lead to the production of usable yarn. In essence,
some sort of selection index could be useful if it was able to reasonably and reliably predict yarn
quality. Two recent attempts to develop such an index, based on the HVI data and consultation
with the textile professionals, are the fiber quality indices: Qscore 1 and Qscore 2. These were
developed as a single index incorporating four different fiber properties (length, strength,
uniformity, and micronaire) (Bourland et al., 2010). Most cotton breeders hesitate to use this
score in their breeding program because this algorithm gives an arbitrary weight for each fiber
property and the optimum weight of each fiber property in relation to yarn quality is still
unknown (Bourland et al., 2010).
Though HVI provides the overall properties of fiber, textile professionals are also
interested in the variability of individual fiber properties within a sample because uniform
individual fiber properties enhance spinning efficiency and control the quality of fabric products
(Hearle and Morton, 2008). In 1990, the Advanced Fiber Information System (AFIS) was
developed to measure twenty different fiber properties and distribution of fiber length in a
sample used for processing (Shofner et al., 1990). Although various fiber properties are
determined by using HVI and AFIS, it is still challenging to give priority to a parameter or group
of parameters to select the best fibers for industrial uses (Majumdar, 2010). Since various
properties of cotton fibers largely influence the final quality of yarn, researchers have developed
mathematical, regression, and other computation models using various properties of fibers
obtained from HVI and AFIS technology to predict the yarn properties.
With an advancement of computational and analytical tools, a number of data mining and
machine learning techniques are increasingly popular and widely used to develop predictive
models for simple to complex data in many scientific disciplines. Generalized linear models are
79
the simplest and the most widely used tools to determine the functional relationships between
independent and dependent variables. This technique enables us to quantify the effect of each
independent variable on the dependent variable (Tranmer and Elliot, 2008). Multiple linear
regression is represented by the following expression (Kutner et al., 2004).
𝒀 = 𝑿𝜷 + 𝜺
In the model, 𝑌 is represented by the n × 1 matrix of the dependent observations, 𝑋 and
𝛽 are represented by n × p matrix of the independent observations and p × 1 vectors of the
unknown regression coefficients, respectively. The error term (𝜀) is represented by n × 1 matrix
of the errors and assumed to be independent and normally distributed (N (0, σ2)) (Kutner et al.,
2004). The least square estimation is most commonly used in the regression analysis such that it
minimizes sum of square deviations between the actual observation and the regression
(Matthews, 2005). The least square estimator for 𝛽 is given by
�̂� = (𝑿′𝑿)−𝟏 𝑿′𝒀
The individual coefficient (�̂�𝑖) determines the partial effect of 𝑋𝑖 on 𝑌 holding all the
regressors constant (Matthews, 2005; Myers, 2000). In cotton breeding, it has been used to
determine the functional relationship between fiber and yarn properties (Üreyen and Gürkan,
2008; Zhu and Ethridge, 1996).
Path analysis is a form of standardized linear regression, which has been widely used in
agriculture (Bhatt, 1973; Wullschleger et al., 2010). Path analysis determines the interrelation
among the variables, which affect the dependent variable. In other words, it allows us to
determine the direct and indirect effects of each explanatory variable on the response variable in
the system (Wright, 1921). Path analysis is applicable in highly correlated agronomic and genetic
traits (Kang et al., 1983).
80
Regression/decision tree methods are more complex and flexible analytical tools than
classical linear regression, and can be applied to determine the simple linear to complex non-
linear relationships among multiple traits. This technique splits data sequentially into two distinct
and exclusive sets by applying a recursive binary splitting approach and building the trees (Loh,
2002). This approach splits the traits in such a way that minimizes the residual sum of squares
(RSS) and maximizes the homogeneity within each resulting group. The cost complexity pruning
method is used to optimize the size of the trees by pruning the trees and prevent over fitting
(James et al., 2014). Compared to linear modeling, the decision tree method is more graphically
representative, similar to a flow chart and is easier to interpret, but it might not have the same
prediction accuracy (De'ath and Fabricius, 2000). Boosting and random forest are both ensemble
methods, which combine a large number of regression trees obtained from the bootstrapped
dataset (Breiman, 1996; Büchlmann and Yu, 2002; James et al., 2014). These ensemble
techniques improve the stability of the regression tree (Breiman, 1996; Witten et al., 2011).
Boosting uses prior tree information to build the new trees and reduces the correlation between
bagging trees (James et al., 2014). In contrast, random forest uses a random subset of predictors
from all available predictors in each split so that this technique might reduce the correlation
among the bagging trees (Breiman, 2001). Although ensemble techniques minimize the variance
and improve the prediction accuracy, the interpretation is very difficult compared to regression
trees (James et al., 2014).
Artificial neural networks (ANN) is a complex and highly flexible data mining and
machine learning technique, which is widely applied in the modeling of highly correlated,
complex, linear to non-linear, and multidimensional data (Altun et al., 2007). ANN data
processing systems mimic biological nervous systems and seek to establish the complex
81
relationship of between the input and output parameters (Gurney, 1997). In ANN models, input
layers receive the information in the form of explanatory variables and process them through
‘hidden’ layers using the sigmoid activation function and predict the output (Goh, 1995;
Karayiannis and Venetsanopoulos, 1992; Priddy and Keller, 2005). The predicted output is
compared with actual output to determine an error. An error signal is back propagated from the
output layers towards the input layers through a neural network. With ANN, the steepest descent
method is used to adjust the weight in each iteration so that the error signal is decreased and this
process is continued until a minimal difference between two outputs is achieved (Khazaei et al.,
2008; Majumdar, 2010).
Since as early as 1980, cotton breeders have investigated two data mining and machine
learning techniques, such as classical linear regression and artificial neural network (ANN) to
determine the functional relationship between yarn and fiber properties (Cheng and Adams,
1995; Ramesh et al., 1995). The varieties used in these older experiments and their limited data
sets may no longer be relevant. Additionally, none of the published classical linear regression
and ANN models used AFIS data. In addition, there are limited studies in the application of other
data mining tools and techniques in cotton breeding. From HVI it is possible to calculate a
spinning consistency index (SCI), which suggests the overall quality and spinning ability of
cotton fibers and can be used to evaluate the technological value of cotton fibers. Unfortunately,
this index is a “black box” for the cotton breeder, as the research that led to its development
provides little rationale about how and what fiber parameters were considered in its development
and SCI’s ability to predict yarn properties. Therefore, the objective of this research is to develop
a number of statistical models using data mining and machine learning tools to identify the
82
important fiber properties, which affects SCI and to compare this index with yarn strength to
determine its applicability in the textile industries.
4.2 METHODS AND MATERIALS
4.2.1 Data collection
The yarn strength, HVI, and AFIS fiber data were obtained from the Southern Regional
Research Center, New Orleans. The data consists of US National Cotton Variety Trial (NCVT)
fibers samples collected over a two year period (2012 and 2013 growing seasons). The NVCT is
a collaborative testing program wherein adapted high yielding varieties are compared across their
larger target environments. A subset of the NCVT is the Regional High Quality Test where
varieties of superior quality are compared across their target environments. All varieties grown
are harvested for yield and boll sampling is used to analyze fiber quality prior to small scale yarn
spinning. This NCVT data set provides the information about fiber traits of cotton cultivars
grown in 22 locations across 12 US states in 2012 and 2013 growing seasons. In this study, we
used 1610, 1539, and 1552 HVI, AFIS and yarn strength observations for statistical modeling,
respectively. High volume instrument (HVI) provides the following fiber properties (Sasser,
1981):
1. Fiber length expressed as upper half mean length (UHML): It is the average of the
longest 50% of the fibers.
2. Fiber uniformity: It is the ratio of average length to UHML of fibers.
3. Micronaire (Mic): It is determined by measuring the permeability of air passing through
cotton samples. It is an indirect measure of fineness and maturity of the fibers.
4. Fiber strength: It measures the amount of force (g) required to break one tex of fiber
bundle.
83
5. Fiber elongation: It refers to the elasticity of fibers.
6. Reflectance (whiteness) of fibers.
7. Yellowness of fibers.
HVI data also provides the information necessary to calculate a SCI, which determines the
spinning ability of fibers for ring spun in the textile industry (Majumdar et al., 2004).
AFIS provides twenty different fiber properties. Out of them, the following are the most
important fiber properties in cotton breeding program (Kelly et al., 2012):
1. Neps: Refers to clumps of the immature fibers. AFIS measures the number of neps in the
sample.
2. Fiber length expressed as upper quartile length (UQL): AFIS measures the length that
exceeded by 25% of the fibers by weight.
3. Fineness: AFIS measures the cross-section area of individual fiber by penetrating the near
infrared spectrum to determine the fineness.
4. Immature fiber contents (IFC): AFIS measures the number of immature fibers in the
sample.
5. Short fiber content (SFC): It measures the amount of short fiber contents by weight
(length less than 12.5 mm) in the sample.
6. Trash content: It measures the total amount of trash, such as leaf, bark, seed coats per
gram in the fiber sample.
For the fiber data used in this research, HVI data was determined using a Uster® HVI
1000 (Uster Technologies AG, Switzerland). AFIS data was determined using a Uster® AFIS
PRO (Uster Technologies AG, Switzerland). Yarn strength measurements were determined using
a Uster® TENSORAPID (Uster Technologies AG, Switzerland).
84
4.2.2 Model development
The data mining and machine learning tools available in R software (www.r-project.org)
were used to develop the statistical modeling for spinning consistency index except the artificial
neural network. The artificial neural network model was developed in JMP Pro 11.2 (SAS
Institute Inc., Cary, NC). The dataset was randomly split into a 70:30% training to validation
data. The lm and lm.beta functions were used for classical multiple linear regression and path
analysis, respectively. The rpart library package was used for building the regression/decision
trees. The ensemble methods, such as random forest and boosting were developed by using
randomforest and gbm library packages, respectively. Each ensemble method combined 5,000
trees together to determine the relative importance of parameters for spinning value of cotton
fibers. In artificial neural network, the number of hidden layers and number of neurons in each
hidden layer were adjusted to improve the best fitting model.
After developing the models on the training data set, they were validated on the
validation data set to determine the reliability and accuracy of the models. The best models were
selected based on the coefficient of determination (R2) obtained from validation data set.
4.3 RESULTS
4.3.1 Multiple linear regression
Fiber length and uniformity index were highly correlated (>0.75). This is not surprising
because the estimate of uniformity index is based on fiber length. Consequently, uniformity
index was dropped as a independent variable from the statistical models to avoid over fitting,
except in path analysis. Multiple linear regression resulted in all fiber parameters being highly
significant (P<0.01) (Table 4.1). This suggests that any improvement in fiber length, strength,
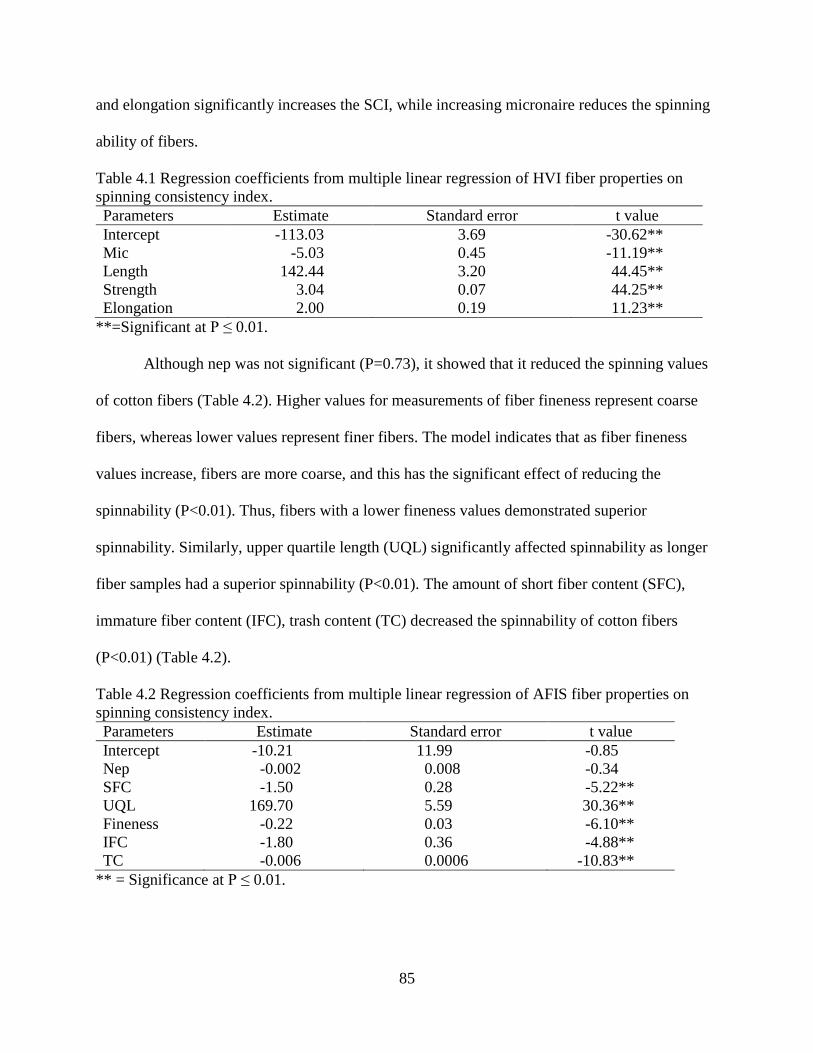
85
and elongation significantly increases the SCI, while increasing micronaire reduces the spinning
ability of fibers.
Table 4.1 Regression coefficients from multiple linear regression of HVI fiber properties on
spinning consistency index.
Parameters Estimate Standard error t value
Intercept -113.03 3.69 -30.62**
Mic -5.03 0.45 -11.19**
Length 142.44 3.20 44.45**
Strength 3.04 0.07 44.25**
Elongation 2.00 0.19 11.23**
**=Significant at P ≤ 0.01.
Although nep was not significant (P=0.73), it showed that it reduced the spinning values
of cotton fibers (Table 4.2). Higher values for measurements of fiber fineness represent coarse
fibers, whereas lower values represent finer fibers. The model indicates that as fiber fineness
values increase, fibers are more coarse, and this has the significant effect of reducing the
spinnability (P<0.01). Thus, fibers with a lower fineness values demonstrated superior
spinnability. Similarly, upper quartile length (UQL) significantly affected spinnability as longer
fiber samples had a superior spinnability (P<0.01). The amount of short fiber content (SFC),
immature fiber content (IFC), trash content (TC) decreased the spinnability of cotton fibers
(P<0.01) (Table 4.2).
Table 4.2 Regression coefficients from multiple linear regression of AFIS fiber properties on
spinning consistency index.
Parameters Estimate Standard error t value
Intercept -10.21 11.99 -0.85
Nep -0.002 0.008 -0.34
SFC -1.50 0.28 -5.22**
UQL 169.70 5.59 30.36**
Fineness -0.22 0.03 -6.10**
IFC -1.80 0.36 -4.88**
TC -0.006 0.0006 -10.83**
** = Significance at P ≤ 0.01.
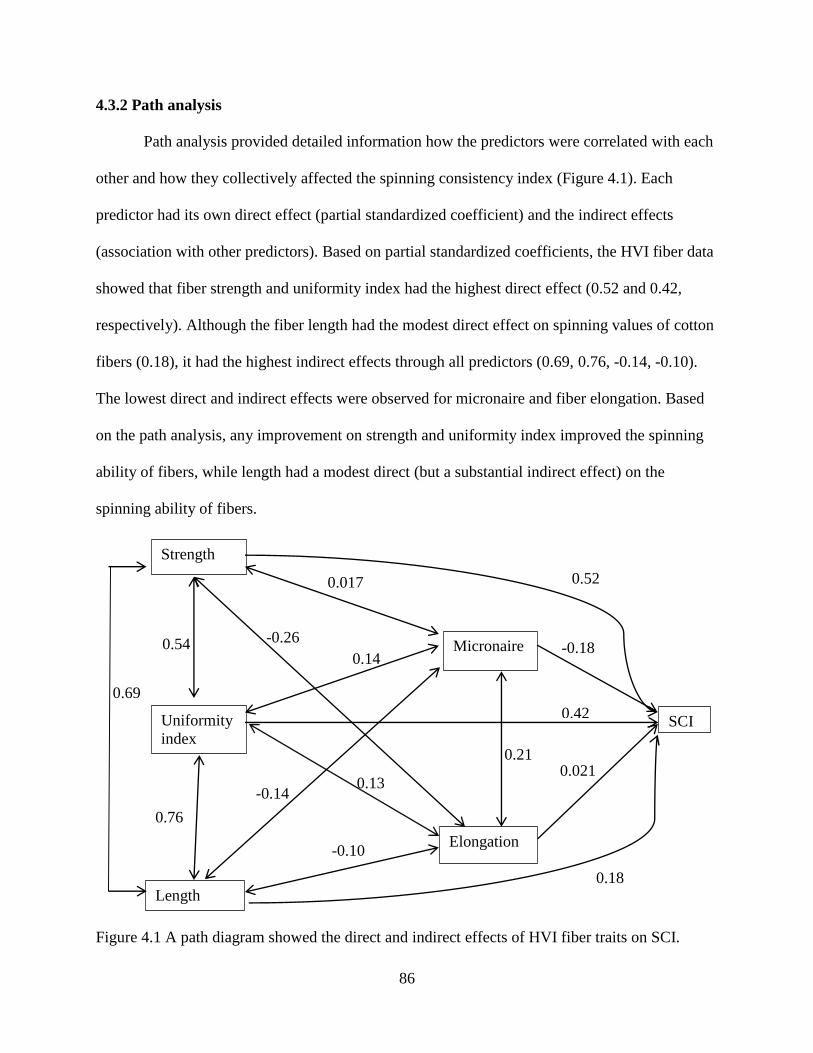
86
4.3.2 Path analysis
Path analysis provided detailed information how the predictors were correlated with each
other and how they collectively affected the spinning consistency index (Figure 4.1). Each
predictor had its own direct effect (partial standardized coefficient) and the indirect effects
(association with other predictors). Based on partial standardized coefficients, the HVI fiber data
showed that fiber strength and uniformity index had the highest direct effect (0.52 and 0.42,
respectively). Although the fiber length had the modest direct effect on spinning values of cotton
fibers (0.18), it had the highest indirect effects through all predictors (0.69, 0.76, -0.14, -0.10).
The lowest direct and indirect effects were observed for micronaire and fiber elongation. Based
on the path analysis, any improvement on strength and uniformity index improved the spinning
ability of fibers, while length had a modest direct (but a substantial indirect effect) on the
spinning ability of fibers.
Figure 4.1 A path diagram showed the direct and indirect effects of HVI fiber traits on SCI.
Strength
Micronaire
Uniformity
index SCI
Elongation
0.13
-0.26 0.54
0.017
0.021
0.42
0.52
-0.18 0.14
-0.14
0.21
-0.10
0.18 Length
0.76
0.69
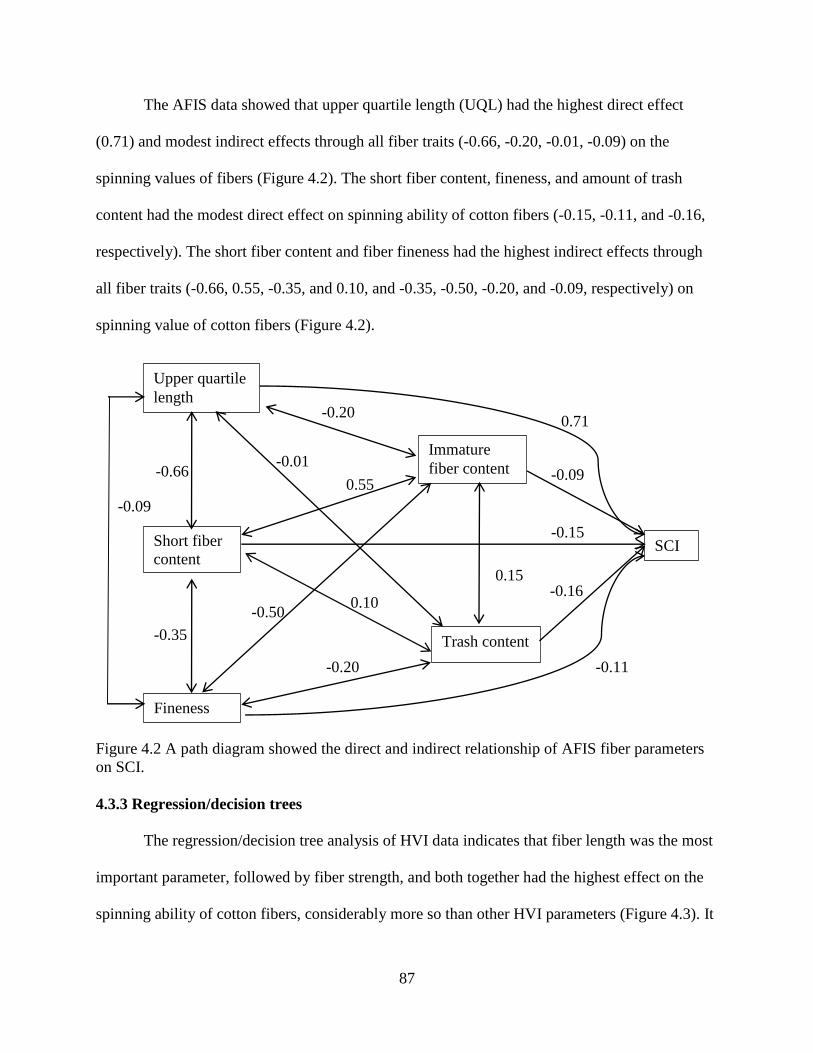
87
The AFIS data showed that upper quartile length (UQL) had the highest direct effect
(0.71) and modest indirect effects through all fiber traits (-0.66, -0.20, -0.01, -0.09) on the
spinning values of fibers (Figure 4.2). The short fiber content, fineness, and amount of trash
content had the modest direct effect on spinning ability of cotton fibers (-0.15, -0.11, and -0.16,
respectively). The short fiber content and fiber fineness had the highest indirect effects through
all fiber traits (-0.66, 0.55, -0.35, and 0.10, and -0.35, -0.50, -0.20, and -0.09, respectively) on
spinning value of cotton fibers (Figure 4.2).
Figure 4.2 A path diagram showed the direct and indirect relationship of AFIS fiber parameters
on SCI.
4.3.3 Regression/decision trees
The regression/decision tree analysis of HVI data indicates that fiber length was the most
important parameter, followed by fiber strength, and both together had the highest effect on the
spinning ability of cotton fibers, considerably more so than other HVI parameters (Figure 4.3). It
Short fiber
content
Upper quartile
length
Immature
fiber content
Trash content
SCI
0.10
-0.01 -0.66
-0.20
-0.16
-0.15
0.71
-0.09 0.55
-0.50
0.15
Fineness
-0.35
-0.11 -0.20
-0.09
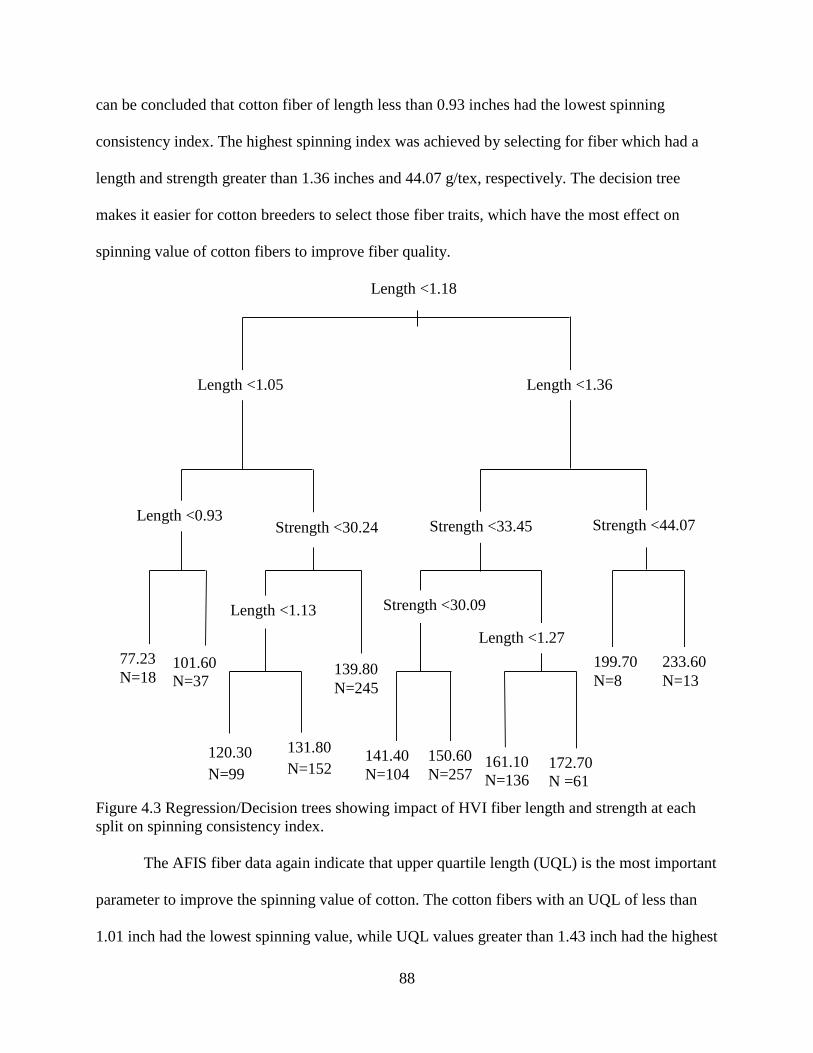
88
can be concluded that cotton fiber of length less than 0.93 inches had the lowest spinning
consistency index. The highest spinning index was achieved by selecting for fiber which had a
length and strength greater than 1.36 inches and 44.07 g/tex, respectively. The decision tree
makes it easier for cotton breeders to select those fiber traits, which have the most effect on
spinning value of cotton fibers to improve fiber quality.
Figure 4.3 Regression/Decision trees showing impact of HVI fiber length and strength at each
split on spinning consistency index.
The AFIS fiber data again indicate that upper quartile length (UQL) is the most important
parameter to improve the spinning value of cotton. The cotton fibers with an UQL of less than
1.01 inch had the lowest spinning value, while UQL values greater than 1.43 inch had the highest
Length <1.05 Length <1.36
Strength <44.07 Length <0.93
Strength <30.24
77.23
N=18 101.60
N=37
Length <1.13
120.30
N=99
131.80
N=152
139.80
N=245
Strength <30.09
Length <1.27
141.40
N=104
150.60
N=257 161.10
N=136 172.70
N =61
199.70
N=8
233.60
N=13
Strength <33.45
Length <1.18
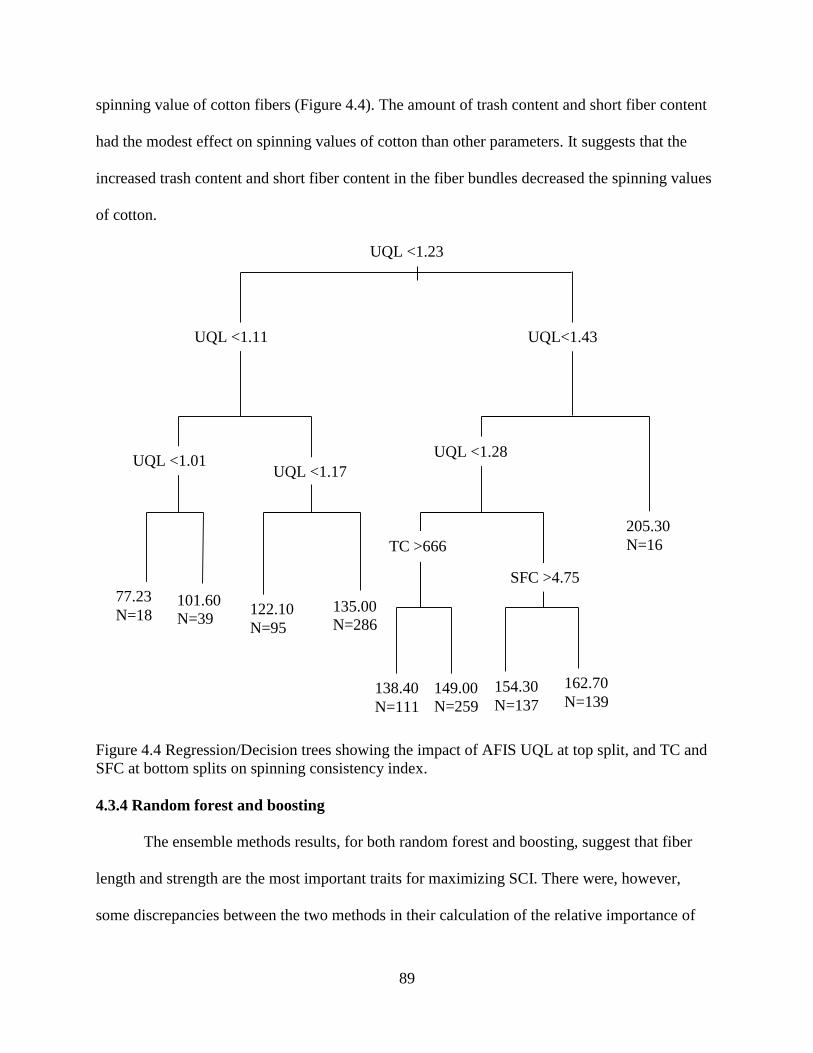
89
spinning value of cotton fibers (Figure 4.4). The amount of trash content and short fiber content
had the modest effect on spinning values of cotton than other parameters. It suggests that the
increased trash content and short fiber content in the fiber bundles decreased the spinning values
of cotton.
Figure 4.4 Regression/Decision trees showing the impact of AFIS UQL at top split, and TC and
SFC at bottom splits on spinning consistency index.
4.3.4 Random forest and boosting
The ensemble methods results, for both random forest and boosting, suggest that fiber
length and strength are the most important traits for maximizing SCI. There were, however,
some discrepancies between the two methods in their calculation of the relative importance of
101.60
N=39
UQL <1.11 UQL<1.43
UQL <1.01 UQL <1.17
77.23
N=18 122.10
N=95
135.00
N=286
TC >666
SFC >4.75
138.40
N=111
149.00
N=259
154.30
N=137
162.70
N=139
205.30
N=16
UQL <1.28
UQL <1.23
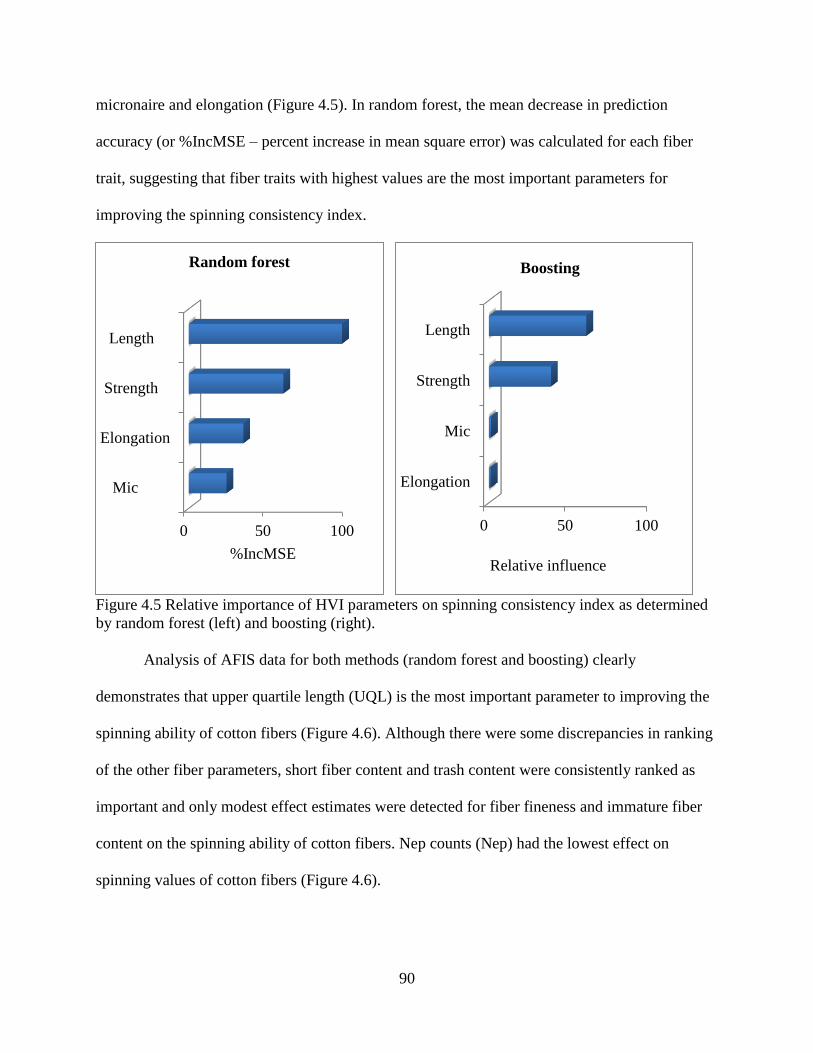
90
micronaire and elongation (Figure 4.5). In random forest, the mean decrease in prediction
accuracy (or %IncMSE – percent increase in mean square error) was calculated for each fiber
trait, suggesting that fiber traits with highest values are the most important parameters for
improving the spinning consistency index.
Figure 4.5 Relative importance of HVI parameters on spinning consistency index as determined
by random forest (left) and boosting (right).
Analysis of AFIS data for both methods (random forest and boosting) clearly
demonstrates that upper quartile length (UQL) is the most important parameter to improving the
spinning ability of cotton fibers (Figure 4.6). Although there were some discrepancies in ranking
of the other fiber parameters, short fiber content and trash content were consistently ranked as
important and only modest effect estimates were detected for fiber fineness and immature fiber
content on the spinning ability of cotton fibers. Nep counts (Nep) had the lowest effect on
spinning values of cotton fibers (Figure 4.6).
0 50 100
Mic
Elongation
Strength
Length
%IncMSE
Random forest
0 50 100
Elongation
Mic
Strength
Length
Relative influence
Boosting
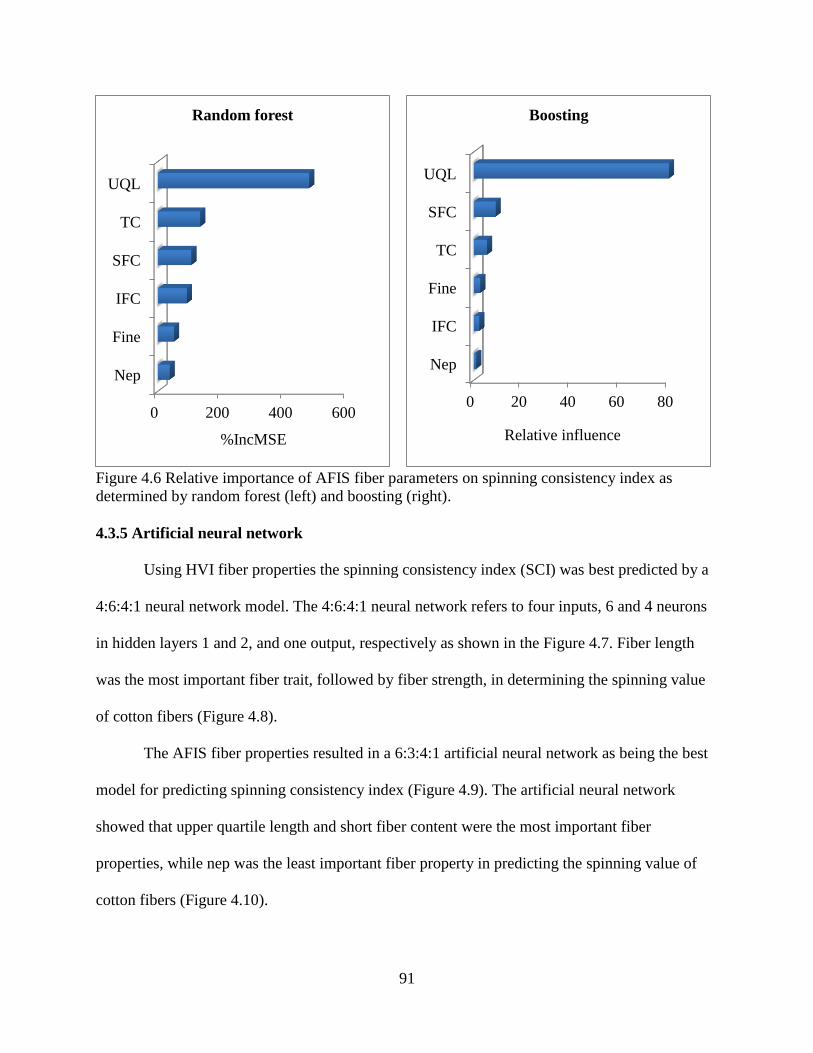
91
Figure 4.6 Relative importance of AFIS fiber parameters on spinning consistency index as
determined by random forest (left) and boosting (right).
4.3.5 Artificial neural network
Using HVI fiber properties the spinning consistency index (SCI) was best predicted by a
4:6:4:1 neural network model. The 4:6:4:1 neural network refers to four inputs, 6 and 4 neurons
in hidden layers 1 and 2, and one output, respectively as shown in the Figure 4.7. Fiber length
was the most important fiber trait, followed by fiber strength, in determining the spinning value
of cotton fibers (Figure 4.8).
The AFIS fiber properties resulted in a 6:3:4:1 artificial neural network as being the best
model for predicting spinning consistency index (Figure 4.9). The artificial neural network
showed that upper quartile length and short fiber content were the most important fiber
properties, while nep was the least important fiber property in predicting the spinning value of
cotton fibers (Figure 4.10).
0 200 400 600
Nep
Fine
IFC
SFC
TC
UQL
%IncMSE
Random forest
0 20 40 60 80
Nep
IFC
Fine
TC
SFC
UQL
Relative influence
Boosting
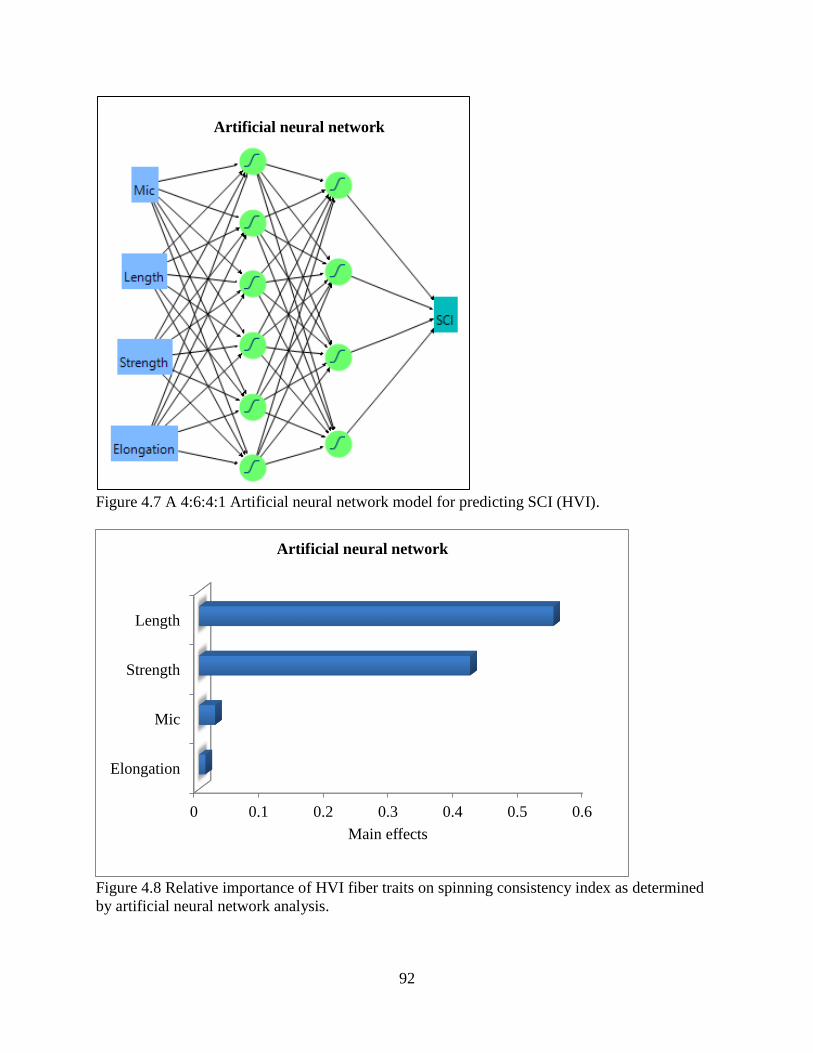
92
Figure 4.7 A 4:6:4:1 Artificial neural network model for predicting SCI (HVI).
Figure 4.8 Relative importance of HVI fiber traits on spinning consistency index as determined
by artificial neural network analysis.
0 0.1 0.2 0.3 0.4 0.5 0.6
Elongation
Mic
Strength
Length
Main effects
Artificial neural network
Artificial neural network
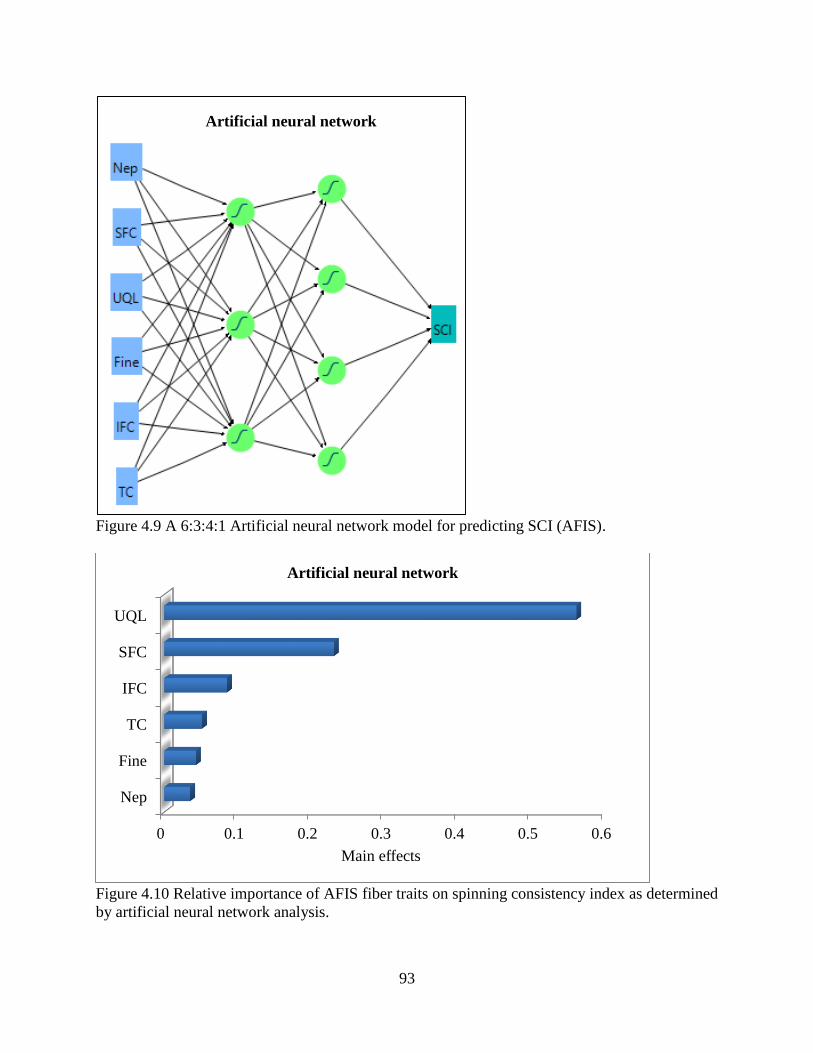
93
Figure 4.9 A 6:3:4:1 Artificial neural network model for predicting SCI (AFIS).
Figure 4.10 Relative importance of AFIS fiber traits on spinning consistency index as determined
by artificial neural network analysis.
0 0.1 0.2 0.3 0.4 0.5 0.6
Nep
Fine
TC
IFC
SFC
UQL
Main effects
Artificial neural network
Artificial neural network
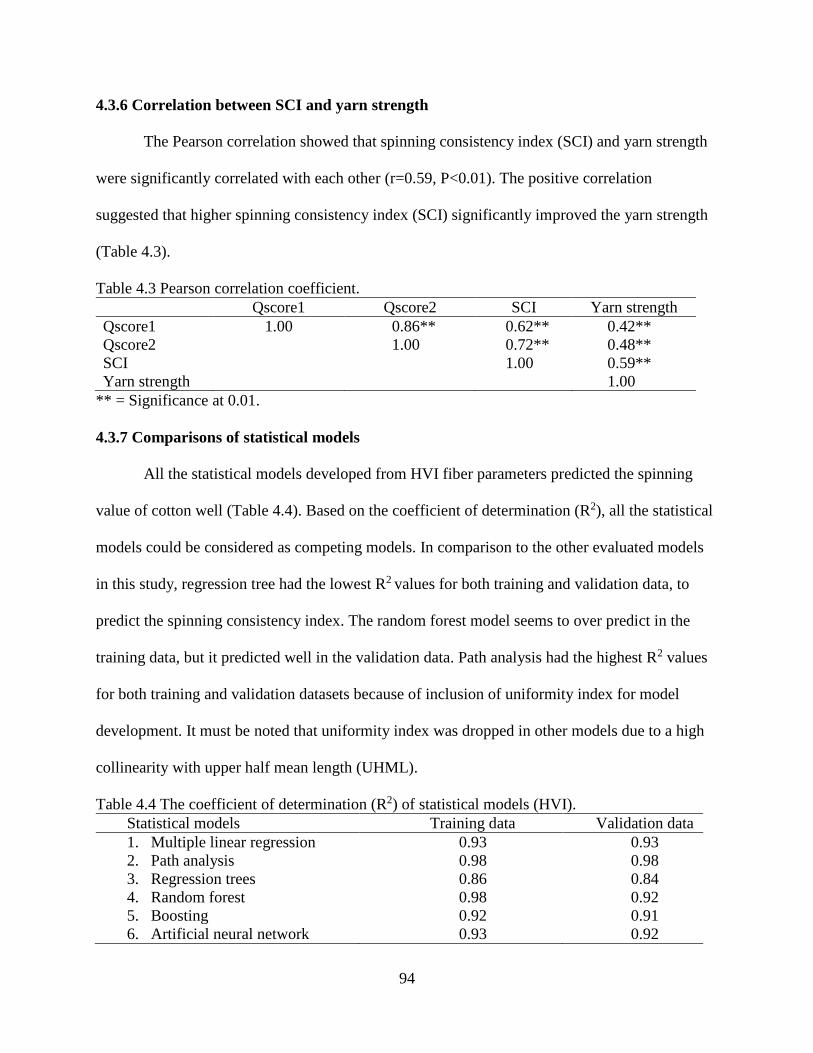
94
4.3.6 Correlation between SCI and yarn strength
The Pearson correlation showed that spinning consistency index (SCI) and yarn strength
were significantly correlated with each other (r=0.59, P<0.01). The positive correlation
suggested that higher spinning consistency index (SCI) significantly improved the yarn strength
(Table 4.3).
Table 4.3 Pearson correlation coefficient.
Qscore1 Qscore2 SCI Yarn strength
Qscore1 1.00 0.86** 0.62** 0.42**
Qscore2 1.00 0.72** 0.48**
SCI 1.00 0.59**
Yarn strength 1.00
** = Significance at 0.01.
4.3.7 Comparisons of statistical models
All the statistical models developed from HVI fiber parameters predicted the spinning
value of cotton well (Table 4.4). Based on the coefficient of determination (R2), all the statistical
models could be considered as competing models. In comparison to the other evaluated models
in this study, regression tree had the lowest R2 values for both training and validation data, to
predict the spinning consistency index. The random forest model seems to over predict in the
training data, but it predicted well in the validation data. Path analysis had the highest R2 values
for both training and validation datasets because of inclusion of uniformity index for model
development. It must be noted that uniformity index was dropped in other models due to a high
collinearity with upper half mean length (UHML).
Table 4.4 The coefficient of determination (R2) of statistical models (HVI).
Statistical models Training data Validation data
1. Multiple linear regression 0.93 0.93
2. Path analysis 0.98 0.98
3. Regression trees 0.86 0.84
4. Random forest 0.98 0.92
5. Boosting 0.92 0.91
6. Artificial neural network 0.93 0.92
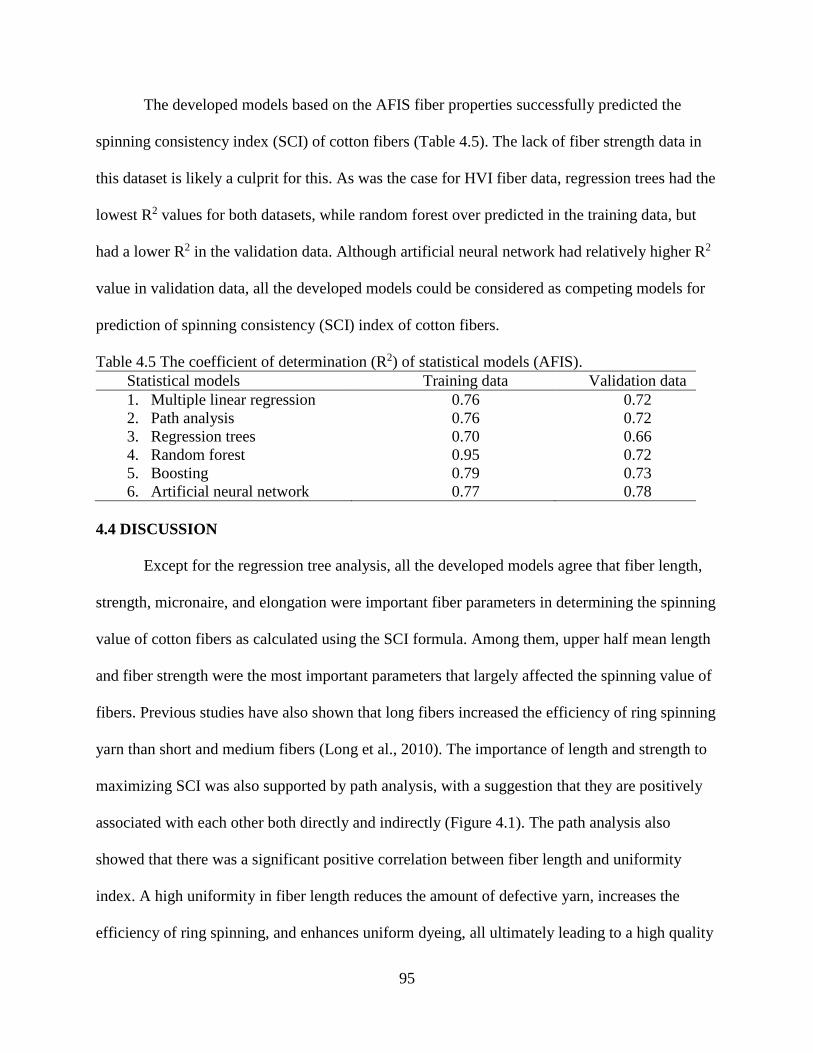
95
The developed models based on the AFIS fiber properties successfully predicted the
spinning consistency index (SCI) of cotton fibers (Table 4.5). The lack of fiber strength data in
this dataset is likely a culprit for this. As was the case for HVI fiber data, regression trees had the
lowest R2 values for both datasets, while random forest over predicted in the training data, but
had a lower R2 in the validation data. Although artificial neural network had relatively higher R2
value in validation data, all the developed models could be considered as competing models for
prediction of spinning consistency (SCI) index of cotton fibers.
Table 4.5 The coefficient of determination (R2) of statistical models (AFIS).
Statistical models Training data Validation data
1. Multiple linear regression 0.76 0.72
2. Path analysis 0.76 0.72
3. Regression trees 0.70 0.66
4. Random forest 0.95 0.72
5. Boosting 0.79 0.73
6. Artificial neural network 0.77 0.78
4.4 DISCUSSION
Except for the regression tree analysis, all the developed models agree that fiber length,
strength, micronaire, and elongation were important fiber parameters in determining the spinning
value of cotton fibers as calculated using the SCI formula. Among them, upper half mean length
and fiber strength were the most important parameters that largely affected the spinning value of
fibers. Previous studies have also shown that long fibers increased the efficiency of ring spinning
yarn than short and medium fibers (Long et al., 2010). The importance of length and strength to
maximizing SCI was also supported by path analysis, with a suggestion that they are positively
associated with each other both directly and indirectly (Figure 4.1). The path analysis also
showed that there was a significant positive correlation between fiber length and uniformity
index. A high uniformity in fiber length reduces the amount of defective yarn, increases the
efficiency of ring spinning, and enhances uniform dyeing, all ultimately leading to a high quality
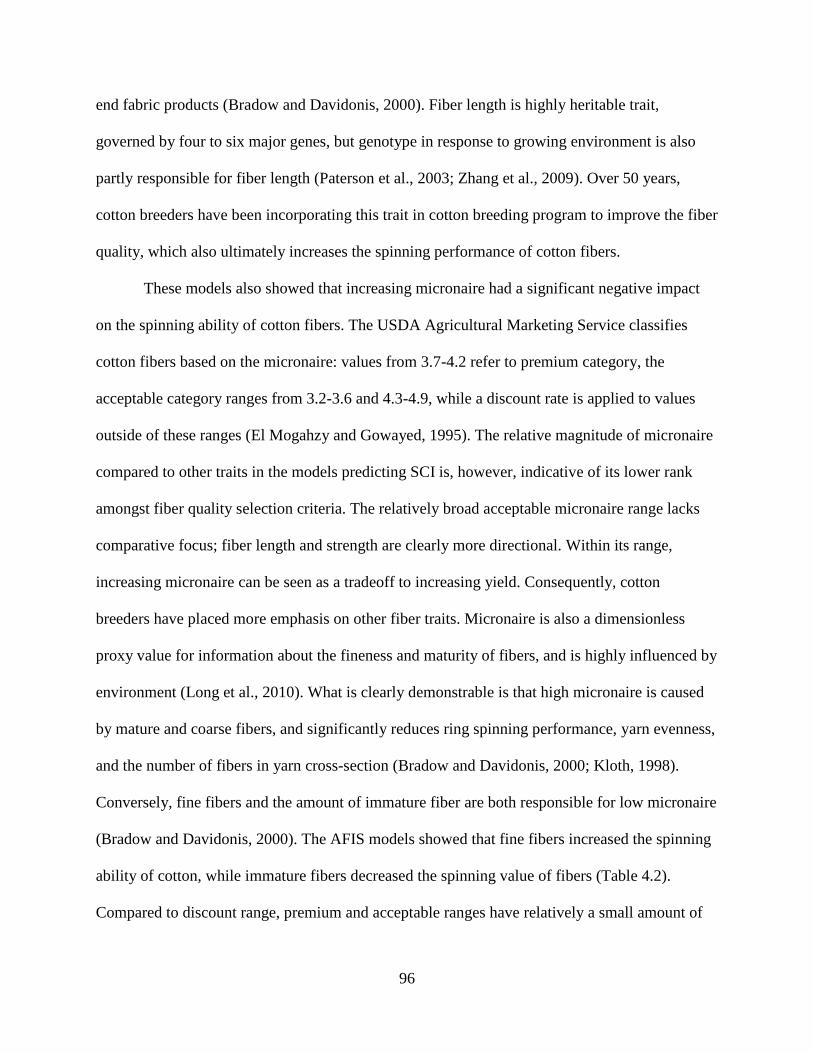
96
end fabric products (Bradow and Davidonis, 2000). Fiber length is highly heritable trait,
governed by four to six major genes, but genotype in response to growing environment is also
partly responsible for fiber length (Paterson et al., 2003; Zhang et al., 2009). Over 50 years,
cotton breeders have been incorporating this trait in cotton breeding program to improve the fiber
quality, which also ultimately increases the spinning performance of cotton fibers.
These models also showed that increasing micronaire had a significant negative impact
on the spinning ability of cotton fibers. The USDA Agricultural Marketing Service classifies
cotton fibers based on the micronaire: values from 3.7-4.2 refer to premium category, the
acceptable category ranges from 3.2-3.6 and 4.3-4.9, while a discount rate is applied to values
outside of these ranges (El Mogahzy and Gowayed, 1995). The relative magnitude of micronaire
compared to other traits in the models predicting SCI is, however, indicative of its lower rank
amongst fiber quality selection criteria. The relatively broad acceptable micronaire range lacks
comparative focus; fiber length and strength are clearly more directional. Within its range,
increasing micronaire can be seen as a tradeoff to increasing yield. Consequently, cotton
breeders have placed more emphasis on other fiber traits. Micronaire is also a dimensionless
proxy value for information about the fineness and maturity of fibers, and is highly influenced by
environment (Long et al., 2010). What is clearly demonstrable is that high micronaire is caused
by mature and coarse fibers, and significantly reduces ring spinning performance, yarn evenness,
and the number of fibers in yarn cross-section (Bradow and Davidonis, 2000; Kloth, 1998).
Conversely, fine fibers and the amount of immature fiber are both responsible for low micronaire
(Bradow and Davidonis, 2000). The AFIS models showed that fine fibers increased the spinning
ability of cotton, while immature fibers decreased the spinning value of fibers (Table 4.2).
Compared to discount range, premium and acceptable ranges have relatively a small amount of
97
immature and coarse fibers. As expected, micronaire does not have a huge impact on spinning
performance of fibers because premium and acceptable ranges are most widely used in the
selection of breeding progenies, cultivated varieties, and bales for yarn spinning.
All the models agreed that fiber strength is one of the important fiber traits, which
influences the spinning value of cotton fibers. Munro (1987) reported that the individual fiber
strength directly affects the yarn strength. With the advancement of high speed spinning
technology, textile professionals prefer highly elastic, strong fibers because they minimize yarn
breakage, and improve the spinning efficiency at low cost and also increase the elasticity of the
fabrics (Bradow and Davidonis, 2000; Cheng and Adams, 1995). Here the developed models
showed that fiber elongation had a very insignificant effect on the spinning consistency index.
This may be due to the fact that all of the varieties used in this study would be considered to have
good to excellent fiber elongation values to begin with, giving the models little variation to
utilize. The path analysis agreed with previous studies and suggested that there was no
significant correlation between fiber strength and elongation (Chee et al., 2005; Riley, 1997).
Fiber strength is also genetically controlled by two to four major genes and highly heritable from
generation to generation (Kohel et al., 2001; Zhang et al., 2009). Therefore, it can be
successfully incorporated into breeding programs to improve the fiber quality. However, fiber
elongation was controlled by twenty two minor genes and hard to incorporate all of them into a
breeding program (Chee et al., 2005).
Using AFIS fiber property data, all the models agreed that upper quartile length (UQL)
was the most important fiber property and positively influenced the spinning performance of
fibers as calculated by SCI. Although there were some discrepancies in the ranking of the other
fiber traits, fiber fineness was one of the more important traits for increasing the spinning value
98
of cotton fibers. Compared to coarse fibers, fine fibers increase yarn strength and uniformity
leading to the production of strong and uniform fabrics largely by fitting a large number of fibers
per unit cross-section (Hearle and Morton, 2008; Munro, 1987). The models also showed that the
amount of short fiber content (SFC) reduced the spinning ability of fibers. Previous studies have
also reported that increased short fiber contents increases the rate of yarn breakage and
irregularities, and also reduces yarn uniformity, strength, and appearance of fabric products
(Backe, 1986; Thibodeaux et al., 2008). Although the fiber length is largely determined by 2-4
major genes, short fiber content is determined by an interaction between genotypes by
environment, harvesting techniques, and processing (e.g. ginning) (Bradow et al., 1999; Cui et
al., 2003). Although nep was not significantly different, both nep and immature fiber contents
reduced the spinning performance of cotton fibers. These factors are somewhat related in that
immature fibers are more likely to entangle and lead to the formation of neps in yarn. These are
important traits from the dyeing point of view, with elevated levels of both drastically reducing
the uniformity dyeing (Smith, 1991; Thompson and Hsieh, 1998). Fortunately, the path analysis
results imply that any improvement in the upper quartile length of fibers drastically reduced the
amount of short and immature fiber contents in the bales. All the developed models agreed that
the amount of trash in the cotton bales reduced the spinning performance of fibers. The presence
of large leaf, bark, and pin trash reduces the marketing value of cotton and processing to remove
them is very expensive (Kang and Kim, 2002).
In the process of variety development the selection of progenies with highly elastic, long,
strong and fine fibers is a key to success in the competitive global textile industries. However, a
complex association among the fiber traits makes the task of combining all these desirable traits
into a single variety difficult for cotton breeders. And therein lies one of the paradoxes that this
99
research and other (e.g. Qscore) seek to address. The immediate clientele for a variety is a
producer whose marketing is influenced by a few specific traits: first and foremost yield, then
fiber quality traits roughly in the order length, strength and micronaire. The textile spinner, on
the other hand has no interest in yield, but considers traits that affect the efficiency of their yarn
production in addition to all the spinning variables such as yarn type, breakages, imperfections,
etc. The SCI is an attempt to condense the needs of the spinner into an index value that could be
of use by the breeder. Historical and more modern attempts, such as Qscore are poorly
documented or not empirically derived. The SCI index is a documented attempt to combine the
important fiber traits into a single index, which enables us to select the multiple fiber traits even
it is imprecisely presented. Assuming SCI is a suitable proxy for actual spinning performance or
at least yarn strength, whether one uses the HVI or AFIS instruments, our results indicate the
relative importance of easily measured individual traits and suggests how they can be combined
into a useful index. Although there were some discrepancies in the ranking of the determined
fiber traits, all the developed statistical models agreed that they can be used to predict the
spinning consistency index, which is also positively associated with yarn strength. In short, this
study revealed that spinning consistency index (SCI) can be used as an alternative and efficient
selection index for combining the multiple fiber traits to enhance yarn spinning.
4.5 REFERENCES
Altun, H., A. Bilgil, and B.C. Fidan. 2007. Treatment of multi-dimensional data to enhance
neural network estimators in regression problems. Expert Syst. Appl. 32: 599-605.
Backe, E.E. 1986. Effect of short fiber content in cotton on plant performance and quality. Text.
Res. J. 56: 112-115.
Bhatt, G.M. 1973. Significance of path coefficient analysis in determining the nature of character
association. Euphytica 22: 338-343.
100
Bourland, F.M., R. Hogan, D.C. Jones, and E. Barnes. 2010. Development and utility of Q-score
for characterizing cotton fiber quality. J. Cotton Sci. 14: 53-63.
Bradow, J.M., and G.H. Davidonis. 2000. Quantitation of fiber quality and the cotton
production-processing interface: A physiologist’s perspective. J. Cotton Sci. 4: 34-64.
Bradow, J.M., R.M. Johnson, P.J. Bauer, G.F. Sassenrath-Cole, and R.M. Johnson. 1999.
Preharvest spatial and temporal variability in short fiber content in relation to processing
success. p. 716-718. In Proc. Beltwide Cotton Conf., Orlando, FL. 3-7 Jan. 1999. Natl.
Cotton Counc. Am., Memphis, TN.
Breiman, L. 1996. Bagging predictors. Mach. Learn. 24: 123-140.
Breiman, L. 2001. Random forests. Mach. Learn. 45: 5-32.
Büchlmann, P., and B. Yu. 2002. Analyzing bagging. Ann. Stat. 30: 927-961.
Chee, P., X. Draye, C.-X. Jiang, L. Decanini, T.A. Delmonte, R. Bredhauer, C.W. Smith, and
A.H. Paterson. 2005. Molecular dissection of interspecific variation between Gossypium
hirsutum and Gossypium barbadense (cotton) by a backcross-self approach: I. Fiber
elongation. Theor. Appl. Genet. 111: 757-763.
Cheng, L., and D.L. Adams. 1995. Yarn strength prediction using neural networks part I: fiber
properties and yarn strength relationship. Text. Res. J. 65: 495-500.
Cui, X., T.A. Calamari, K.Q. Robert, J.B. Price, and M.D. Watson. 2003. Measuring the short
fiber content of cotton. Text. Res. J. 73: 891-895.
De'ath, G., and K.E. Fabricius. 2000. Classification and regression trees: a powerful yet simple
technique for ecological data analysis. Ecol. 81: 3178-3192.
El Mogahzy, Y.E., and Y. Gowayed. 1995. Theory and practice of cotton fiber selection part I:
Fiber selection techniques and bale picking algorithms. Text. Res. J. 65: 32-40.
Goh, A.T.C. 1995. Back-propagation neural networks for modeling complex systems. Artif.
Intell. Eng. 9: 143-151.
Gurney, K. 1997. An introduction to neural networks. 1st ed. CRC press, Brookfield, VT.
Hearle, J.W.S., and W.E. Morton. 2008. Physical properties of textile fibres. 4th ed. Woodhead
Publishing Limited, Cambridge, UK.
James, G., D. Witten, and T. Hastie. 2014. An introduction to statistical learning: With
applications in R. 1st ed. Springer, New York, NY.
Kang, M.S., J.D. Miller, and P.Y.P. Tai. 1983. Genetic and phenotypic path analyses and
heritability in sugarcane. Crop Sci. 23: 643-647.
101
Kang, T.J., and S.C. Kim. 2002. Objective evaluation of the trash and color of raw cotton by
image processing and neural network. Text. Res. J. 72: 776-782.
Karayiannis, N., and A.N. Venetsanopoulos. 1992. Artificial neural networks: learning
algorithms, performance evaluation, and applications. 1st ed. Springer, New York, NY.
Kelly, C.M., E.F. Hequet, and J.K. Dever. 2012. Interpretation of AFIS and HVI fiber property
measurements in breeding for cotton fiber quality improvement. J. Cotton Sci. 16: 1-16.
Khazaei, J., M.R. Naghavi, M.R. Jahansouz, and G. Salimi-Khorshidi. 2008. Yield estimation
and clustering of chickpea genotypes using soft computing techniques. Agron. J. 100:
1077-1087.
Kloth, R.H. 1998. Analysis of commonality for traits of cotton fiber. J. Cotton Sci. 2: 17-22.
Kohel, R.J., J. Yu, Y.-H. Park, and G.R. Lazo. 2001. Molecular mapping and characterization of
traits controlling fiber quality in cotton. Euphytica 121: 163-172.
Kutner, M.H., J. Neter, C.J. Nachtsheim, and W. Wasserman. 2004. Applied linear statistical
models. 5th ed. McGraw-Hill, Chicago, IL.
Loh, W.-Y. 2002. Regression trees with unbiased variable selection and interaction detection.
Stat. Sinica 12: 361-386.
Long, R.L., M.P. Bange, S.G. Gordon, M.H. van der Sluijs, G.R. Naylor, and G.A. Constable.
2010. Fiber quality and textile performance of some Australian cotton genotypes. Crop
Sci. 50: 1509-1518.
Majumdar, A. 2010. Selection of raw materials in textile spinning industry using fuzzy multi-
criteria decision making approach. Fibers Polym. 11: 121-127.
Majumdar, A., P.K. Majumdar, and B. Sarkar. 2004. Selecting cotton bales by spinning
consistency index and micronaire using artificial neural networks. AUTEX Res. J. 4: 1-8.
Matthews, D.E. 2005. Multiple linear regression. In: P. Armitage and T. Colton, editors,
Encyclopedia of biostatistics. Wiley, Chinhester, UK. p. 2812-2816.
Munro, J.M. 1987. Cotton. 2nd ed. John Wiley & Sons, New York, NY.
Myers, R.H. 2000. Classical and modern regression with applications. 2nd ed. Duxbury Press,
Pacific Grove, CA.
Paterson, A.H., Y. Saranga, M. Menz, C.X. Jiang, and R. Wright. 2003. QTL analysis of
genotype× environment interactions affecting cotton fiber quality. Theor. Appl. Genet.
106: 384-396.
Poehlman, J.M. 1987. Breeding field crops. 1st ed. Springer, New York, NY.
102
Priddy, K.L., and P.E. Keller. 2005. Artificial neural networks: an introduction. 1st ed. SPIE
Press, Bellingham, WA.
Ramesh, M.C., R. Rajamanickam, and S. Jayaraman. 1995. The prediction of yarn tensile
properties by using artificial neural networks. J.Text. I. 86: 459-469.
Riley, C.R. 1997. Improved high volume instrument elongation measurements. J. Cotton Sci. 1:
61-71.
Russell, G.E. 1978. Plant breeding for pest and disease resistance. 1st ed. Butterworth & Co
Publishers Ltd, Butterworth, UK.
Sasser, P.E. 1981. Basics of high volume instruments for fiber testing. p. 4-8. In Proc. Beltwide
Cotton Prod. Res. Conf., New Orleans, LA. 4-8 Jan. 1981. Natl. Cotton Counc. Am.,
Memphis,TN.
Shofner, F.M., Y.T. Chu, and D.P. Thibodeaux. 1990. An overview of the advanced fiber
information system. p. 173-181. In Proc. Int. Cotton Conf., Faserinstitut, Bremen,
Germany.
Smith, B. 1991. A review of the relationship of cotton maturity and dyeability. Text. Res. J. 61:
137-145.
Suh, M.W., and P.E. Sasser. 1996. The technological and economic impact of high volume
instrument (HVI) systems on the cotton and cotton textile industries. J.Text. I. 87: 43-59.
Thibodeaux, D., H. Senter, J. Knowlton, D. McAlister, and X. Cui. 2008. Impact of short fiber
content on the quality of cotton ring spun yarn. J. Cotton Sci. 12: 368–377
Thompson, J.A., and Y.L. Hsieh. 1998. Dyeing characteristics of Acala cotton seed fibers. Text.
Res. J. 68: 493-501.
Tranmer, M., and M. Elliot. 2008. Multiple linear regression. 1st ed. The Cathie Marsh Centre
for Census and Survey Research (CCSR), Manchester, UK.
Üreyen, M.E., and P. Gürkan. 2008. Comparison of artificial neural network and linear
regression models for prediction of ring spun yarn properties. II. Prediction of yarn
hairiness and unevenness. Fibers Polym. 9: 92-96.
Witten, I.H., E. Frank, and M.A. Hall. 2011. Data mining: Practical machine learning tools and
techniques. 3rd ed. Morgan Kaufmann Publishers, Burlington, MA.
Wright, R. 1921. Correlation and causation. J. Agric. Res. 20: 557–585.
Wullschleger, S.D., E.B. Davis, M.E. Borsuk, C.A. Gunderson, and L.R. Lynd. 2010. Biomass
production in switchgrass across the United States: database description and determinants
of yield. Agron. J. 102: 1158-1168.
103
Zhang, Z.-S., M.-C. Hu, J. Zhang, D.-J. Liu, J. Zheng, K. Zhang, W. Wang, and Q. Wan. 2009.
Construction of a comprehensive PCR-based marker linkage map and QTL mapping for
fiber quality traits in upland cotton (Gossypium hirsutum L.). Mol. Breeding 24: 49-61.
Zhu, R., and M.D. Ethridge. 1996. The prediction of cotton yarn irregularity based on the
‘AFIS’measurement. J.Text. I. 87: 509-512.
104
CHAPTER 5: CONCLUSIONS
Reniform nematode is one of the major plant pathogens for cotton, which causes heavy
economic loss in Southern United States. Due to lack of resistant/tolerant commercial cotton
varieties, application of nematicides, and crop rotation with nonhost crop species have been
implemented to manage the reniform nematode in cotton fields to some extent. Over last two
decades, extensive screening was conducted to identify sources of reniform resistance within the
cotton germplasm pool available in the National Cotton Germplasm Collection. To date, a
number of cotton genotypes, which are resistant to reniform nematode have been identified, but
little information is available about their response across reniform isolates collected from
different geographical regions. This study showed that tolerant/resistant cotton genotypes had
different responses across the reniform isolates collected from renifrom infested fields across
Louisiana. Compared to other genotypes, both Lonren-2 and G. arboreum (A2-190) exhibit a
high level of resistance regardless of reniform isolates or itsgeographic origin. Within a cotton
breeding program, both Lonren-1 and Lonren-2 (both tetraploids) are good sources of resistance
and relatively amenable to use though they both, especially Lonren-1, have other agronomic
performance deficiencies (poor yield). The diploid cotton G. arboreum (A2-190) exhibited the
highest level of resistance across the reniform isolates, but would be more problematic to use
within a breeding program.
This study also showed that there is a significant variation in reproduction and
pathogenicity among reniform isolates collected from reniform infested cotton fields across
Louisiana. Across reniform isolates, the Evan isolate had the highest reproduction and
pathogenicity compared to other reniform isolates, suggesting that the Evan isolate may build up
a juvenile population in the field faster than other reniform isolates. Although there were limited
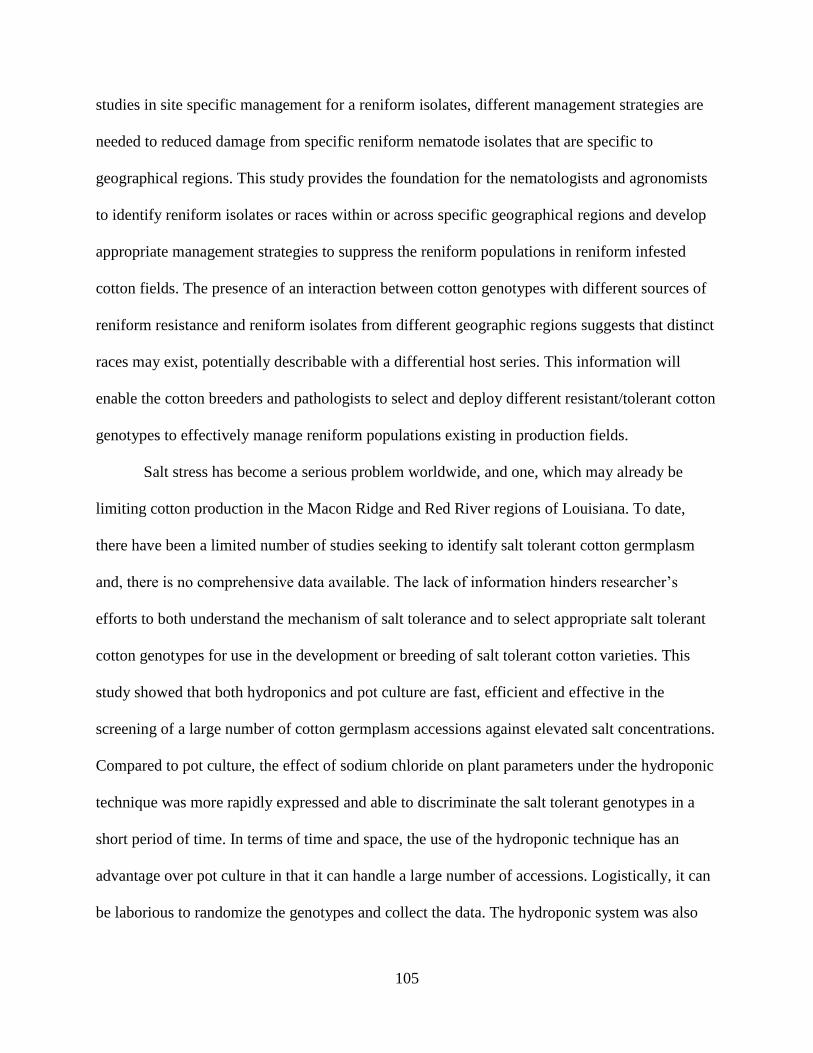
105
studies in site specific management for a reniform isolates, different management strategies are
needed to reduced damage from specific reniform nematode isolates that are specific to
geographical regions. This study provides the foundation for the nematologists and agronomists
to identify reniform isolates or races within or across specific geographical regions and develop
appropriate management strategies to suppress the reniform populations in reniform infested
cotton fields. The presence of an interaction between cotton genotypes with different sources of
reniform resistance and reniform isolates from different geographic regions suggests that distinct
races may exist, potentially describable with a differential host series. This information will
enable the cotton breeders and pathologists to select and deploy different resistant/tolerant cotton
genotypes to effectively manage reniform populations existing in production fields.
Salt stress has become a serious problem worldwide, and one, which may already be
limiting cotton production in the Macon Ridge and Red River regions of Louisiana. To date,
there have been a limited number of studies seeking to identify salt tolerant cotton germplasm
and, there is no comprehensive data available. The lack of information hinders researcher’s
efforts to both understand the mechanism of salt tolerance and to select appropriate salt tolerant
cotton genotypes for use in the development or breeding of salt tolerant cotton varieties. This
study showed that both hydroponics and pot culture are fast, efficient and effective in the
screening of a large number of cotton germplasm accessions against elevated salt concentrations.
Compared to pot culture, the effect of sodium chloride on plant parameters under the hydroponic
technique was more rapidly expressed and able to discriminate the salt tolerant genotypes in a
short period of time. In terms of time and space, the use of the hydroponic technique has an
advantage over pot culture in that it can handle a large number of accessions. Logistically, it can
be laborious to randomize the genotypes and collect the data. The hydroponic system was also
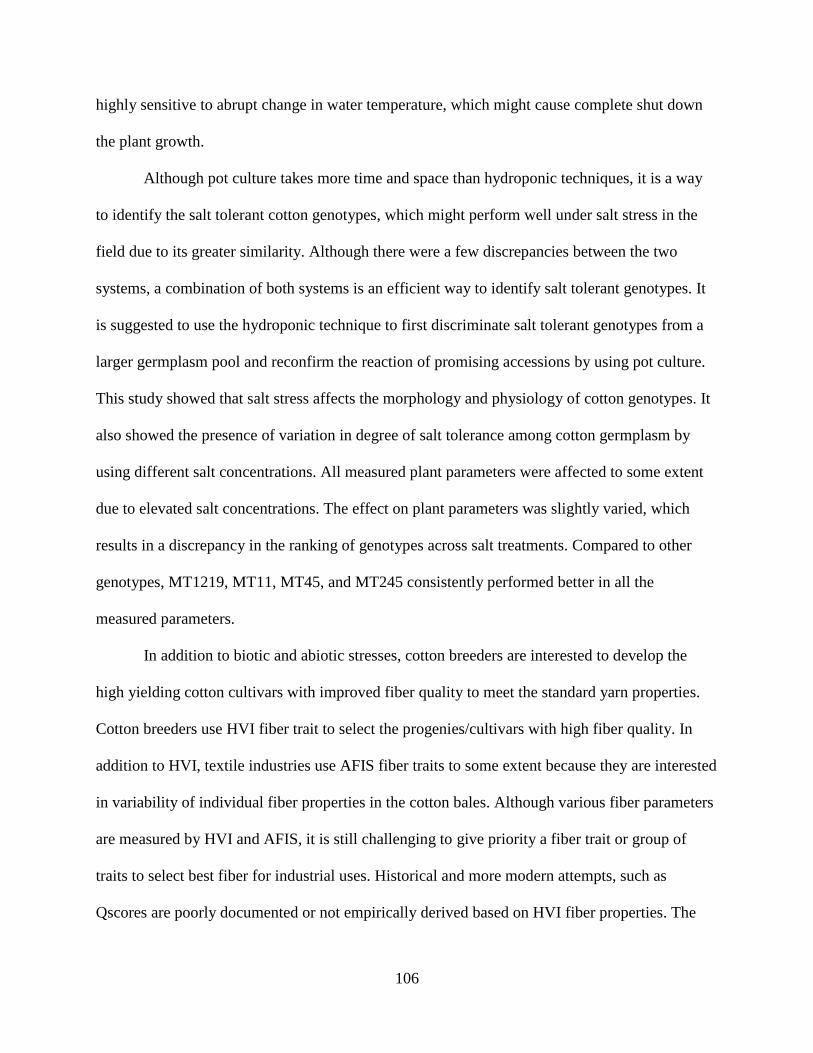
106
highly sensitive to abrupt change in water temperature, which might cause complete shut down
the plant growth.
Although pot culture takes more time and space than hydroponic techniques, it is a way
to identify the salt tolerant cotton genotypes, which might perform well under salt stress in the
field due to its greater similarity. Although there were a few discrepancies between the two
systems, a combination of both systems is an efficient way to identify salt tolerant genotypes. It
is suggested to use the hydroponic technique to first discriminate salt tolerant genotypes from a
larger germplasm pool and reconfirm the reaction of promising accessions by using pot culture.
This study showed that salt stress affects the morphology and physiology of cotton genotypes. It
also showed the presence of variation in degree of salt tolerance among cotton germplasm by
using different salt concentrations. All measured plant parameters were affected to some extent
due to elevated salt concentrations. The effect on plant parameters was slightly varied, which
results in a discrepancy in the ranking of genotypes across salt treatments. Compared to other
genotypes, MT1219, MT11, MT45, and MT245 consistently performed better in all the
measured parameters.
In addition to biotic and abiotic stresses, cotton breeders are interested to develop the
high yielding cotton cultivars with improved fiber quality to meet the standard yarn properties.
Cotton breeders use HVI fiber trait to select the progenies/cultivars with high fiber quality. In
addition to HVI, textile industries use AFIS fiber traits to some extent because they are interested
in variability of individual fiber properties in the cotton bales. Although various fiber parameters
are measured by HVI and AFIS, it is still challenging to give priority a fiber trait or group of
traits to select best fiber for industrial uses. Historical and more modern attempts, such as
Qscores are poorly documented or not empirically derived based on HVI fiber properties. The
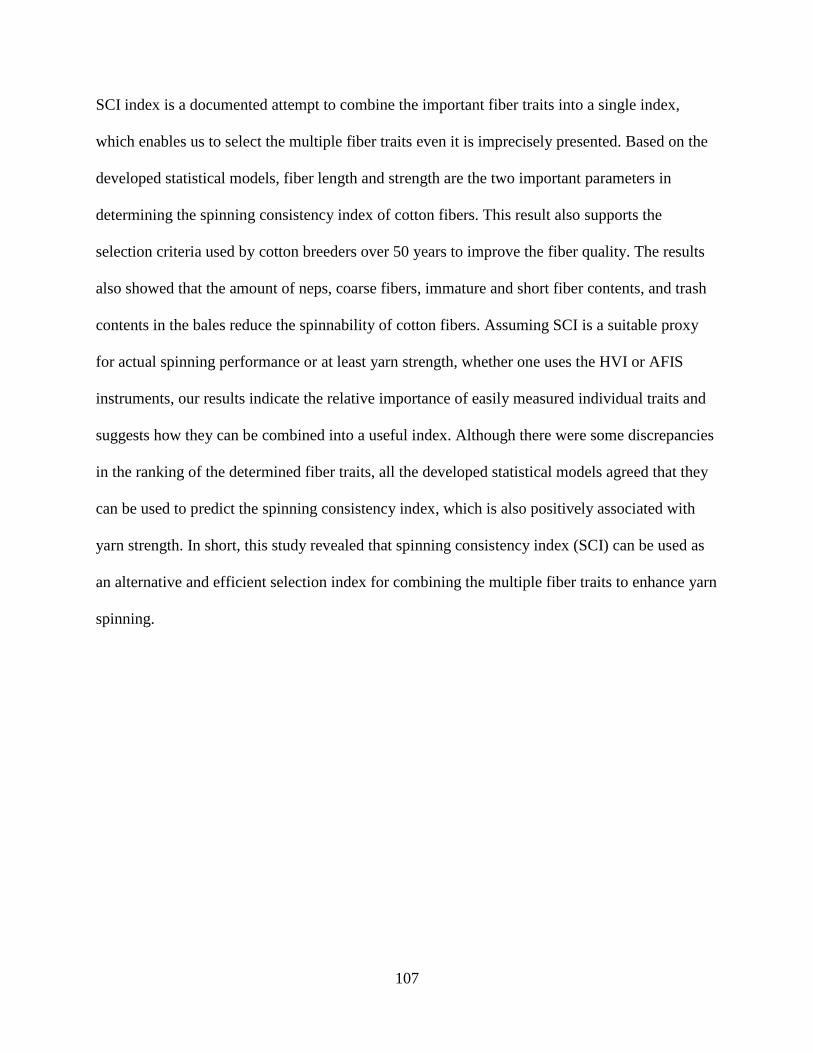
107
SCI index is a documented attempt to combine the important fiber traits into a single index,
which enables us to select the multiple fiber traits even it is imprecisely presented. Based on the
developed statistical models, fiber length and strength are the two important parameters in
determining the spinning consistency index of cotton fibers. This result also supports the
selection criteria used by cotton breeders over 50 years to improve the fiber quality. The results
also showed that the amount of neps, coarse fibers, immature and short fiber contents, and trash
contents in the bales reduce the spinnability of cotton fibers. Assuming SCI is a suitable proxy
for actual spinning performance or at least yarn strength, whether one uses the HVI or AFIS
instruments, our results indicate the relative importance of easily measured individual traits and
suggests how they can be combined into a useful index. Although there were some discrepancies
in the ranking of the determined fiber traits, all the developed statistical models agreed that they
can be used to predict the spinning consistency index, which is also positively associated with
yarn strength. In short, this study revealed that spinning consistency index (SCI) can be used as
an alternative and efficient selection index for combining the multiple fiber traits to enhance yarn
spinning.
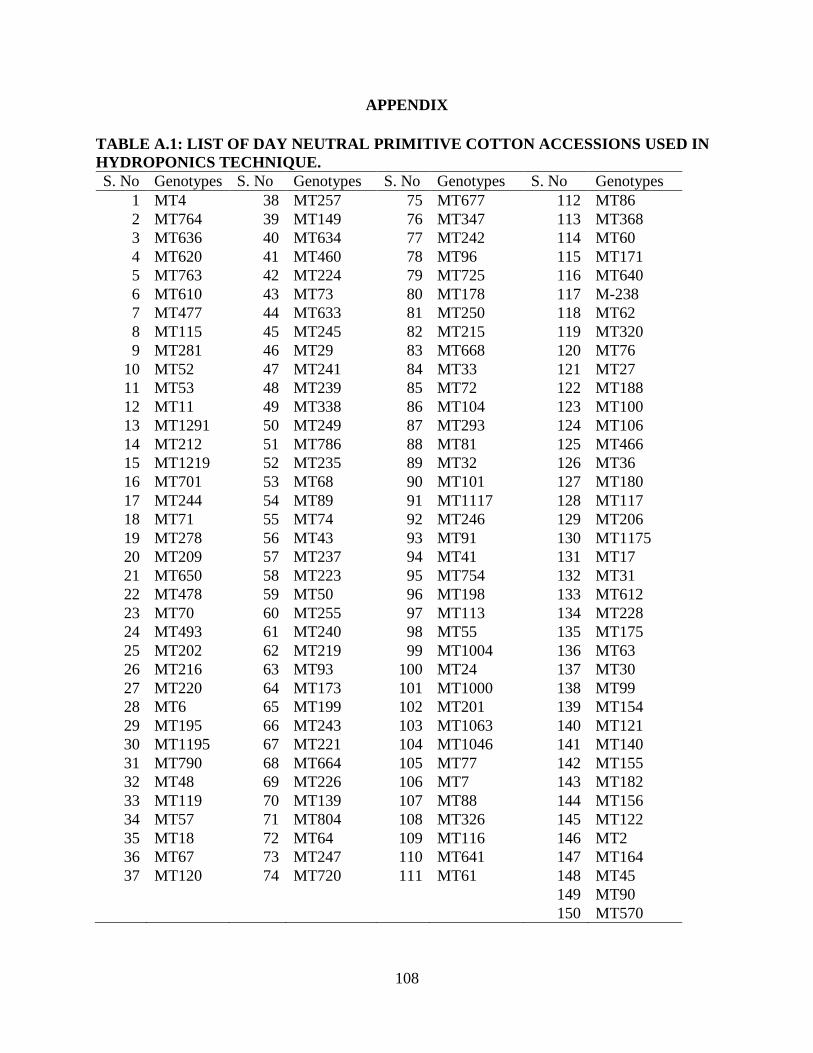
108
APPENDIX
TABLE A.1: LIST OF DAY NEUTRAL PRIMITIVE COTTON ACCESSIONS USED IN
HYDROPONICS TECHNIQUE.
S. No Genotypes S. No Genotypes S. No Genotypes S. No Genotypes
1 MT4 38 MT257 75 MT677 112 MT86
2 MT764 39 MT149 76 MT347 113 MT368
3 MT636 40 MT634 77 MT242 114 MT60
4 MT620 41 MT460 78 MT96 115 MT171
5 MT763 42 MT224 79 MT725 116 MT640
6 MT610 43 MT73 80 MT178 117 M-238
7 MT477 44 MT633 81 MT250 118 MT62
8 MT115 45 MT245 82 MT215 119 MT320
9 MT281 46 MT29 83 MT668 120 MT76
10 MT52 47 MT241 84 MT33 121 MT27
11 MT53 48 MT239 85 MT72 122 MT188
12 MT11 49 MT338 86 MT104 123 MT100
13 MT1291 50 MT249 87 MT293 124 MT106
14 MT212 51 MT786 88 MT81 125 MT466
15 MT1219 52 MT235 89 MT32 126 MT36
16 MT701 53 MT68 90 MT101 127 MT180
17 MT244 54 MT89 91 MT1117 128 MT117
18 MT71 55 MT74 92 MT246 129 MT206
19 MT278 56 MT43 93 MT91 130 MT1175
20 MT209 57 MT237 94 MT41 131 MT17
21 MT650 58 MT223 95 MT754 132 MT31
22 MT478 59 MT50 96 MT198 133 MT612
23 MT70 60 MT255 97 MT113 134 MT228
24 MT493 61 MT240 98 MT55 135 MT175
25 MT202 62 MT219 99 MT1004 136 MT63
26 MT216 63 MT93 100 MT24 137 MT30
27 MT220 64 MT173 101 MT1000 138 MT99
28 MT6 65 MT199 102 MT201 139 MT154
29 MT195 66 MT243 103 MT1063 140 MT121
30 MT1195 67 MT221 104 MT1046 141 MT140
31 MT790 68 MT664 105 MT77 142 MT155
32 MT48 69 MT226 106 MT7 143 MT182
33 MT119 70 MT139 107 MT88 144 MT156
34 MT57 71 MT804 108 MT326 145 MT122
35 MT18 72 MT64 109 MT116 146 MT2
36 MT67 73 MT247 110 MT641 147 MT164
37 MT120 74 MT720 111 MT61 148 MT45
149 MT90
150 MT570
109
VITA
Bikash Bhandari was born in Chitwan-3, Nepal. He completed his bachelor degree in
Agriculture Science from Institute of Agriculture and Animal Science, Tribhuwan University,
Nepal in 2006. After graduation with a bachelor’s degree, he attended the University of Arkansas
at Monticello from 2007 to 2009 for his Master of Science in Forestry. After completing his
master degree, he is continued his doctorate degree in Plant Breeding and Genetics in the School
of Plant, Environmental, and Soil Sciences at Louisiana State University from 2010-2015. He
has three publications in three different Journals, the Arkansas Academy of Science Journal, the
Soil Horizon, and the Beltwide Cotton Proceedings.