Embed Size (px)
Citation preview
Mega Publishing Limited
Bulletin of Applied Economics, 2016, 3(2), 31-42| December 15, 2016
The Resource Curse Hypothesis Revisited: Evidence from
Asian Economies
Hiroyuki Taguchi1 and Ni Lar
2
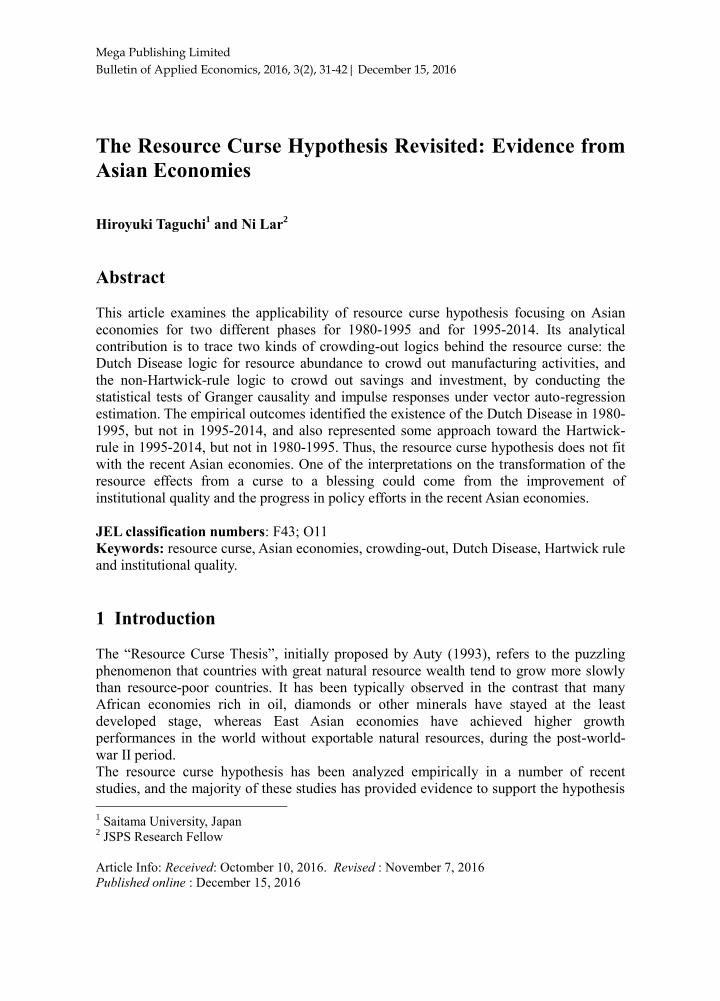
Abstract
This article examines the applicability of resource curse hypothesis focusing on Asian
economies for two different phases for 1980-1995 and for 1995-2014. Its analytical
contribution is to trace two kinds of crowding-out logics behind the resource curse: the
Dutch Disease logic for resource abundance to crowd out manufacturing activities, and
the non-Hartwick-rule logic to crowd out savings and investment, by conducting the
statistical tests of Granger causality and impulse responses under vector auto-regression
estimation. The empirical outcomes identified the existence of the Dutch Disease in 1980-
1995, but not in 1995-2014, and also represented some approach toward the Hartwick-
rule in 1995-2014, but not in 1980-1995. Thus, the resource curse hypothesis does not fit
with the recent Asian economies. One of the interpretations on the transformation of the
resource effects from a curse to a blessing could come from the improvement of
institutional quality and the progress in policy efforts in the recent Asian economies.
JEL classification numbers: F43; O11
Keywords: resource curse, Asian economies, crowding-out, Dutch Disease, Hartwick rule
and institutional quality.
1 Introduction
The “Resource Curse Thesis”, initially proposed by Auty (1993), refers to the puzzling
phenomenon that countries with great natural resource wealth tend to grow more slowly
than resource-poor countries. It has been typically observed in the contrast that many
African economies rich in oil, diamonds or other minerals have stayed at the least
developed stage, whereas East Asian economies have achieved higher growth
performances in the world without exportable natural resources, during the post-world-
war II period.
The resource curse hypothesis has been analyzed empirically in a number of recent
studies, and the majority of these studies has provided evidence to support the hypothesis
1 Saitama University, Japan
2 JSPS Research Fellow
Article Info: Received: Octomber 10, 2016. Revised : November 7, 2016
Published online : December 15, 2016
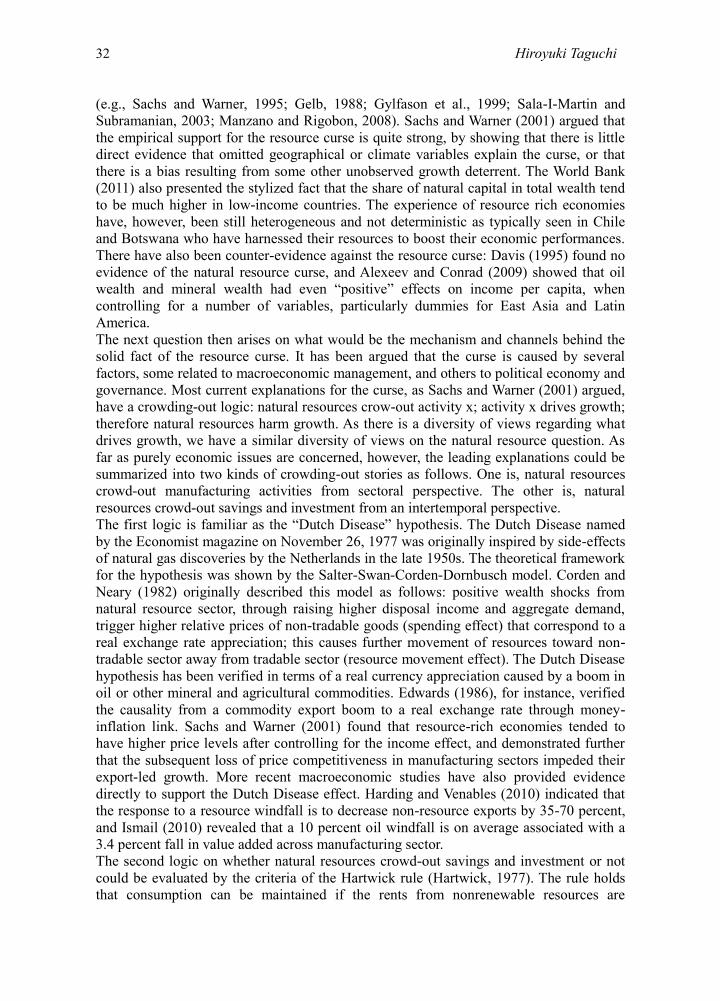
32 Hiroyuki Taguchi
(e.g., Sachs and Warner, 1995; Gelb, 1988; Gylfason et al., 1999; Sala-I-Martin and
Subramanian, 2003; Manzano and Rigobon, 2008). Sachs and Warner (2001) argued that
the empirical support for the resource curse is quite strong, by showing that there is little
direct evidence that omitted geographical or climate variables explain the curse, or that
there is a bias resulting from some other unobserved growth deterrent. The World Bank
(2011) also presented the stylized fact that the share of natural capital in total wealth tend
to be much higher in low-income countries. The experience of resource rich economies
have, however, been still heterogeneous and not deterministic as typically seen in Chile
and Botswana who have harnessed their resources to boost their economic performances.
There have also been counter-evidence against the resource curse: Davis (1995) found no
evidence of the natural resource curse, and Alexeev and Conrad (2009) showed that oil
wealth and mineral wealth had even “positive” effects on income per capita, when
controlling for a number of variables, particularly dummies for East Asia and Latin
America.
The next question then arises on what would be the mechanism and channels behind the
solid fact of the resource curse. It has been argued that the curse is caused by several
factors, some related to macroeconomic management, and others to political economy and
governance. Most current explanations for the curse, as Sachs and Warner (2001) argued,
have a crowding-out logic: natural resources crow-out activity x; activity x drives growth;
therefore natural resources harm growth. As there is a diversity of views regarding what
drives growth, we have a similar diversity of views on the natural resource question. As
far as purely economic issues are concerned, however, the leading explanations could be
summarized into two kinds of crowding-out stories as follows. One is, natural resources
crowd-out manufacturing activities from sectoral perspective. The other is, natural
resources crowd-out savings and investment from an intertemporal perspective.
The first logic is familiar as the “Dutch Disease” hypothesis. The Dutch Disease named
by the Economist magazine on November 26, 1977 was originally inspired by side-effects
of natural gas discoveries by the Netherlands in the late 1950s. The theoretical framework
for the hypothesis was shown by the Salter-Swan-Corden-Dornbusch model. Corden and
Neary (1982) originally described this model as follows: positive wealth shocks from
natural resource sector, through raising higher disposal income and aggregate demand,
trigger higher relative prices of non-tradable goods (spending effect) that correspond to a
real exchange rate appreciation; this causes further movement of resources toward non-
tradable sector away from tradable sector (resource movement effect). The Dutch Disease
hypothesis has been verified in terms of a real currency appreciation caused by a boom in
oil or other mineral and agricultural commodities. Edwards (1986), for instance, verified
the causality from a commodity export boom to a real exchange rate through money-
inflation link. Sachs and Warner (2001) found that resource-rich economies tended to
have higher price levels after controlling for the income effect, and demonstrated further
that the subsequent loss of price competitiveness in manufacturing sectors impeded their
export-led growth. More recent macroeconomic studies have also provided evidence
directly to support the Dutch Disease effect. Harding and Venables (2010) indicated that
the response to a resource windfall is to decrease non-resource exports by 35-70 percent,
and Ismail (2010) revealed that a 10 percent oil windfall is on average associated with a
3.4 percent fall in value added across manufacturing sector.
The second logic on whether natural resources crowd-out savings and investment or not
could be evaluated by the criteria of the Hartwick rule (Hartwick, 1977). The rule holds
that consumption can be maintained if the rents from nonrenewable resources are
The Resource Curse Hypothesis Revisited: Evidence from Asian Economies 33
continuously invested rather than used for consumption. The economy, if its natural
resources never crowd-out investment, can be said to follow the rule, although many
resource-rich developing countries in fact do not keep the rule. The World Bank (2011)
quantified the crowding-out effects of natural resources on investment by comparing
actual capital stocks with the hypothetical ones, i.e., the Hartwick rule counterfactual on
what total capitals would be if countries had invested all the natural resource rents in
produced capital. It represented the fact that the greater the dependence on natural
resource rents, the greater the gap between actual capitals and hypothetical capitals.
International Monetary Fund (2012) discussed the question of how much of resource
windfall inflows to consume and how much to save/invest for resource-rich developing
countries, and argued that a high saving/investment rate is necessary if there is to be a
lasting impact on development, since the scaling up domestic investment would normally
be part of an optimal development strategy.
This paper aims to examine the applicability of the resource curse hypothesis focusing on
Asian economies. The reason why we look at the case of Asian economies is that the
resource curse might not fit with Asian economies since Asian emerging-market
economies have recorded high economic growth in the recent decades regardless of their
abundance of natural resources. We thus verify the resource curse hypothesis for two
different phases: one for 1980-1995 and the other for 1995-2014, and compare the
applicability of the hypothesis between both phases. Our contribution in analyzing the
resource curse is to keep track of the crowding-out logics as well as simple observation on
the relationship between resource abundance and economic growth. In examining the
crowding-out stories, we estimate the Granger causality and impulse response in a vector
auto-regression (VAR) estimation from resource abundance to manufacturing activities in
the aforementioned first logic, and from resource abundance to savings and investment in
the second logic. The causality issue would, in particular, be critical, since manufacturing
activities might also affect the share of natural resources in an economy. Suppose that
manufacturing sectors in an economy boosts its economic growth for a while and makes
the economy reach a high income stage. The economy would eventually appear to have a
low share of natural resources. Similarly, the lack of manufacturing activities in an
economy might make the economy stay at a resource-rich status. The crowding-out
logics, therefore, require causality checks on whether resource abundance really crowd
out growth-boosting activities.
The rest of the paper is structured as follows. The next section represents empirics on the
applicability of the resource curse hypothesis in Asian economies: data for key variables,
methodology for a VAR estimation, and estimation outcomes with their interpretation.
The last section summarizes and concludes.
2 Empirics
This section represents empirics on the applicability of the resource curse hypothesis in
Asian economies: data for key variables, methodology for a VAR estimation, and the
estimation outcomes with their interpretation.
2.1 Data and Overview
For the subsequent analysis, we sample 37 economies in Asia for 1980-2014. Regarding
34 Hiroyuki Taguchi
the scope of Asia, we follow the definition of UNCTADstat.3 As we stated in the
introduction, we divide sample period into 1980-1995 and 1995-2014 for comparing the
applicability of the resource curse hypothesis between the two different phases. For a
VAR model estimation in the next section, we will construct a panel data with 37 Asian
economies for 1980-1995 and for 1995-2014.
We herein identify the following four variables for the resource curse analysis. The first
variable is “natural resources rents (nrr)” to represent natural resource abundance in an
economy. The data is retrieved from the World Development Indicators (WDI) of the
World Bank as the series of “Total natural resources rents (% of GDP)”.4 In this database,
the total natural resources rents are defined as the sum of oil rents, natural gas rents, coal
rents (hard and soft), mineral rents, and forest rents. The second variable is “real GDP per
capita (ypc)” as a partner variable for simply observing the correlation with resource
abundance. The resource curse hypothesis would be implied if the inverse correlation
between natural resources rents and the growth rate of real GDP per capita was verified.
The data for real GDP per capita is retrieved from the UNCTADstat as the series of “GDP
by US Dollars at constant prices (2005) and constant exchange rates (2005) per capita”.
The third variable is “manufacturing-services ratio in GDP base (mos)”. This variable is
introduced to examine the aforementioned first crowding-out logic in the resource curse
mechanism, i.e., the Dutch Disease hypothesis in which resource abundance crowds out
manufacturing activities. The manufacturing-services ratio is derived by dividing
“manufacturing in value-added term” by “services in value-added one”, both of which are
retrieved from the UNCTADstat. The fourth variable is “investment-consumption ratio in
GDP base (ioc)”. This variable is for investigating the second crowding-out logic (namely,
non-Hartwick-rule scenario) in which the resource abundance crowds out savings and
investment. The ratio is produced by dividing “gross fixed capital formation” by “final
consumption expenditure”, both of which are also retrieved from the UNCTADstat.
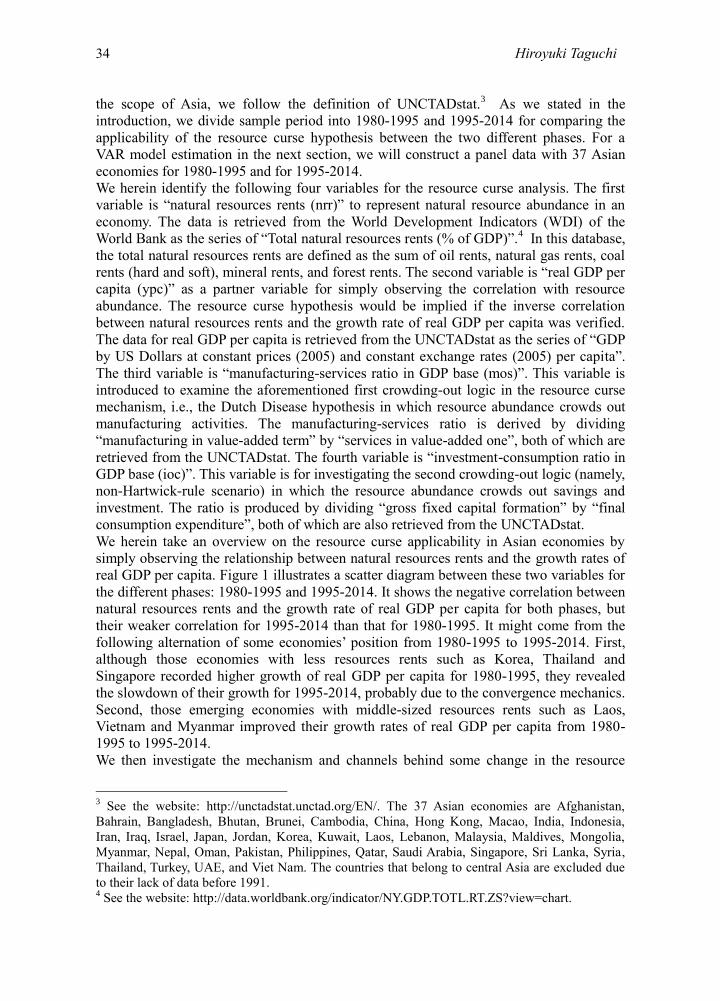
We herein take an overview on the resource curse applicability in Asian economies by
simply observing the relationship between natural resources rents and the growth rates of
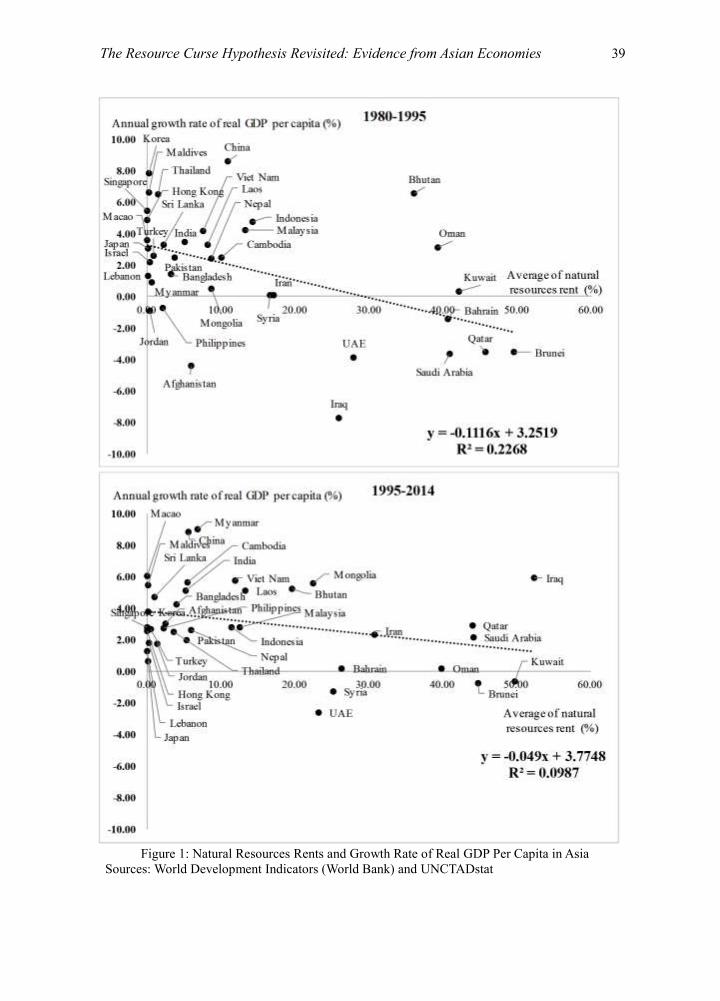
real GDP per capita. Figure 1 illustrates a scatter diagram between these two variables for
the different phases: 1980-1995 and 1995-2014. It shows the negative correlation between
natural resources rents and the growth rate of real GDP per capita for both phases, but
their weaker correlation for 1995-2014 than that for 1980-1995. It might come from the
following alternation of some economies’ position from 1980-1995 to 1995-2014. First,
although those economies with less resources rents such as Korea, Thailand and
Singapore recorded higher growth of real GDP per capita for 1980-1995, they revealed
the slowdown of their growth for 1995-2014, probably due to the convergence mechanics.
Second, those emerging economies with middle-sized resources rents such as Laos,
Vietnam and Myanmar improved their growth rates of real GDP per capita from 1980-
1995 to 1995-2014.
We then investigate the mechanism and channels behind some change in the resource
3 See the website: http://unctadstat.unctad.org/EN/. The 37 Asian economies are Afghanistan,
Bahrain, Bangladesh, Bhutan, Brunei, Cambodia, China, Hong Kong, Macao, India, Indonesia,
Iran, Iraq, Israel, Japan, Jordan, Korea, Kuwait, Laos, Lebanon, Malaysia, Maldives, Mongolia,
Myanmar, Nepal, Oman, Pakistan, Philippines, Qatar, Saudi Arabia, Singapore, Sri Lanka, Syria,
Thailand, Turkey, UAE, and Viet Nam. The countries that belong to central Asia are excluded due
to their lack of data before 1991. 4 See the website: http://data.worldbank.org/indicator/NY.GDP.TOTL.RT.ZS?view=chart.
The Resource Curse Hypothesis Revisited: Evidence from Asian Economies 35
curse applicability in Asian economies from 1980-1995 to 1995-2014, by examining two
kinds of crowding-out logics through a VAR estimation with the panel data in the next
section.
2.2 Methodology for a VAR Model Estimation
In this section, through a VAR estimation with panel data, we examine the Granger
causalities and the impulse responses from natural resources rents (nrr) to manufacturing-
services ratio (mos) based on the crowding-out logic of the Dutch Disease, and those from
natural resources rents (nrr) to investment-consumption ratio (ioc) following another
crowding-out logic of the non-Hartwick-rule scenario. The reason why we adopt a VAR
model for our analyses is that the model allows for potential and highly-likely
endogeneity between the variables of interest, and also for tracing out the dynamic
responses of variables to exogenous shocks overtime.
We now specify a VAR model with panel data for estimation in the following way.5
𝑦𝑖𝑡 = 𝜇 + 𝑉1𝑦𝑖𝑡−1 + 𝜀𝑖𝑡 (1)
where 𝑦𝑖𝑡 is a (2×1) column vector of the endogenous variables with country i and year t,
i.e., 𝑦𝑖𝑡 = (𝑛𝑟𝑟𝑖𝑡 𝑚𝑜𝑠𝑖𝑡)′ for the Dutch Disease logic and 𝑦𝑖𝑡 = (𝑛𝑟𝑟𝑖𝑡 𝑖𝑜𝑐𝑖𝑡)′ for the
non-Hartwick-rule logic, μ is a (2×1) constant vector, V_1 is a (2 ×2) coefficient matrix,
𝑦𝑖𝑡−1 is a (2 ×1) vector of the lagged endogenous variables, and 𝜀𝑖𝑡 it is a (2 ×1) vector of
the random error terms in the system. In the Dutch Disease model, we insert a (2×1)
vector of the control variable of real GDP per capita (ypc), since manufacturing-services
ratio might be also affected by development stages of an economy according to the Petty-
Clark's Law (Clark. 1940). The lag length (-1) is selected by the minimum Akaike
Information Criterion (AIC) with maximum lag equal to (-2) under the limited number of
observations.
Based on the VAR model (1), we examine the Granger causalities between natural
resources rents (nrr) and manufacturing-services ratio (mos), and between natural
resources rents (nrr) and investment-consumption ratio (ioc), and also investigate the
impulse responses of mos and ioc to the Cholesky one-standard-deviation nrr shock, so
that we can trace the 8-year dynamic effects.
2.3 Estimation Outcomes and Interpretation
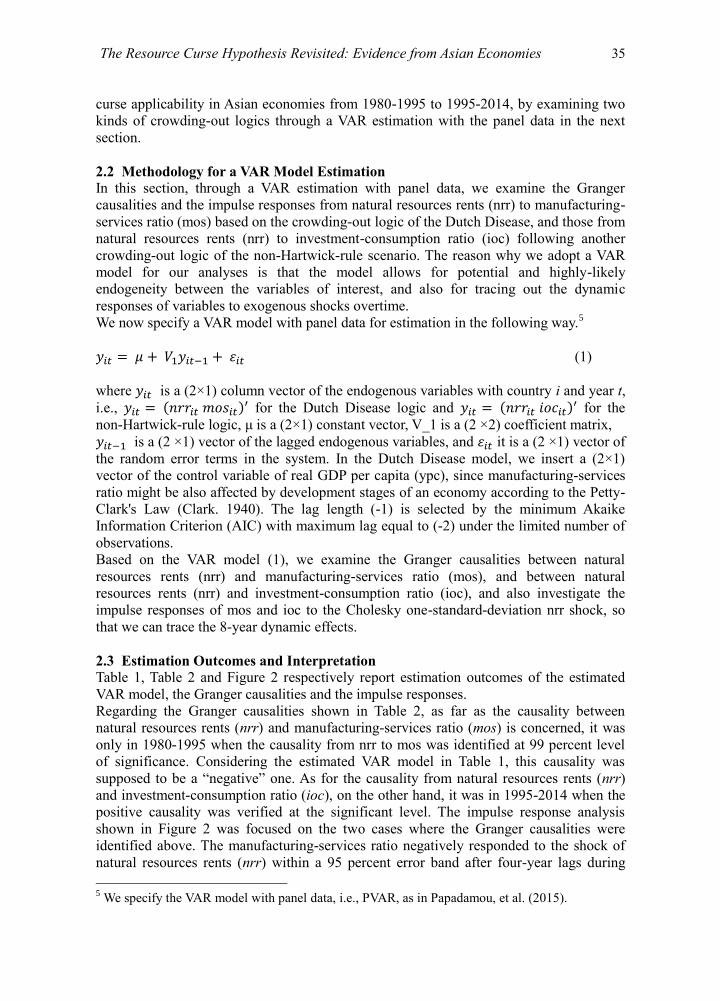
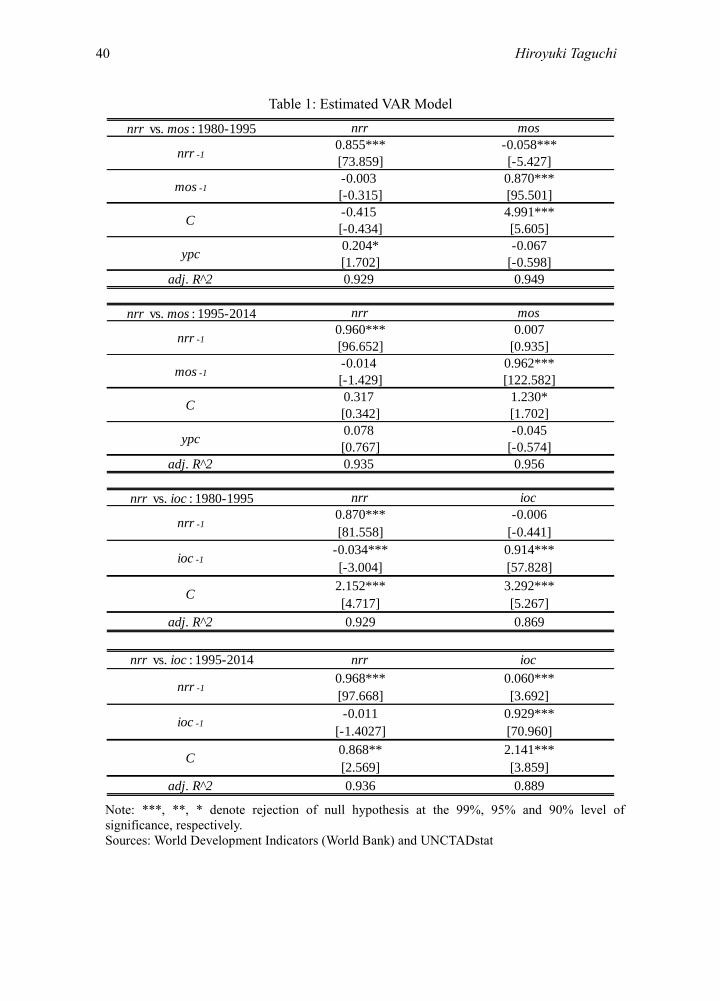
Table 1, Table 2 and Figure 2 respectively report estimation outcomes of the estimated
VAR model, the Granger causalities and the impulse responses.
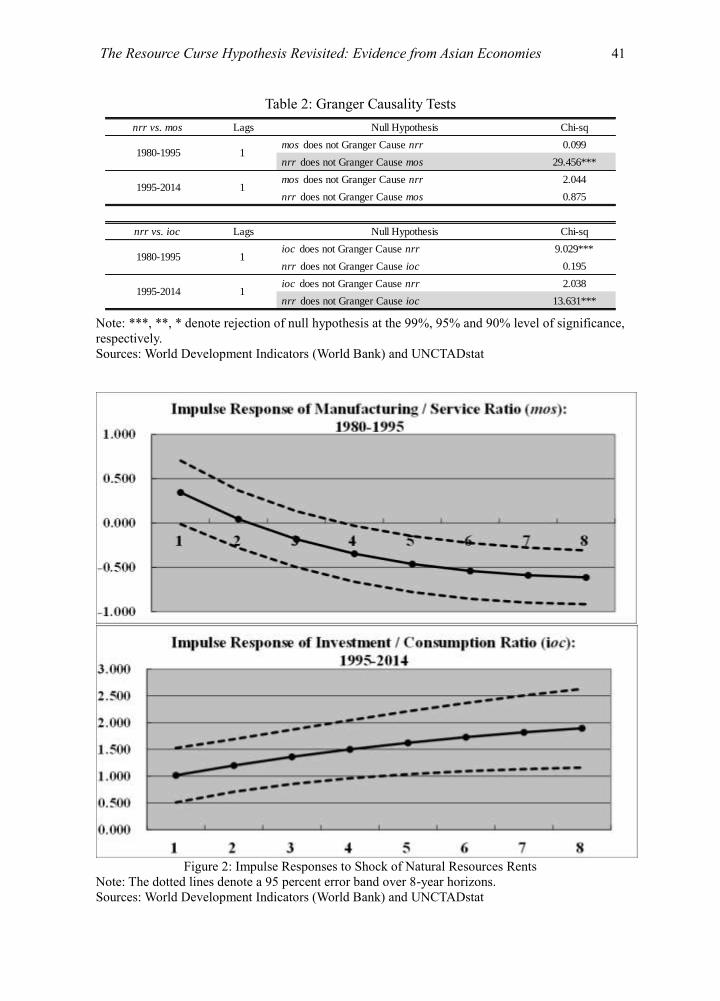
Regarding the Granger causalities shown in Table 2, as far as the causality between
natural resources rents (nrr) and manufacturing-services ratio (mos) is concerned, it was
only in 1980-1995 when the causality from nrr to mos was identified at 99 percent level
of significance. Considering the estimated VAR model in Table 1, this causality was
supposed to be a “negative” one. As for the causality from natural resources rents (nrr)
and investment-consumption ratio (ioc), on the other hand, it was in 1995-2014 when the
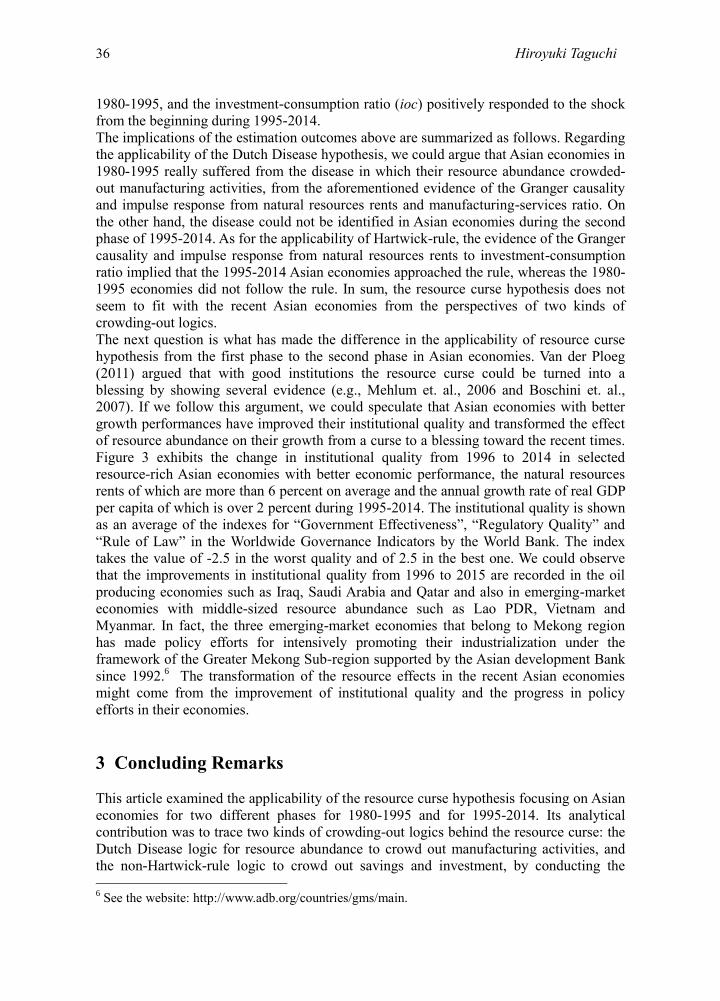
positive causality was verified at the significant level. The impulse response analysis
shown in Figure 2 was focused on the two cases where the Granger causalities were
identified above. The manufacturing-services ratio negatively responded to the shock of
natural resources rents (nrr) within a 95 percent error band after four-year lags during
5 We specify the VAR model with panel data, i.e., PVAR, as in Papadamou, et al. (2015).
36 Hiroyuki Taguchi
1980-1995, and the investment-consumption ratio (ioc) positively responded to the shock
from the beginning during 1995-2014.
The implications of the estimation outcomes above are summarized as follows. Regarding
the applicability of the Dutch Disease hypothesis, we could argue that Asian economies in
1980-1995 really suffered from the disease in which their resource abundance crowded-
out manufacturing activities, from the aforementioned evidence of the Granger causality
and impulse response from natural resources rents and manufacturing-services ratio. On
the other hand, the disease could not be identified in Asian economies during the second
phase of 1995-2014. As for the applicability of Hartwick-rule, the evidence of the Granger
causality and impulse response from natural resources rents to investment-consumption
ratio implied that the 1995-2014 Asian economies approached the rule, whereas the 1980-
1995 economies did not follow the rule. In sum, the resource curse hypothesis does not
seem to fit with the recent Asian economies from the perspectives of two kinds of
crowding-out logics.
The next question is what has made the difference in the applicability of resource curse
hypothesis from the first phase to the second phase in Asian economies. Van der Ploeg
(2011) argued that with good institutions the resource curse could be turned into a
blessing by showing several evidence (e.g., Mehlum et. al., 2006 and Boschini et. al.,
2007). If we follow this argument, we could speculate that Asian economies with better
growth performances have improved their institutional quality and transformed the effect
of resource abundance on their growth from a curse to a blessing toward the recent times.
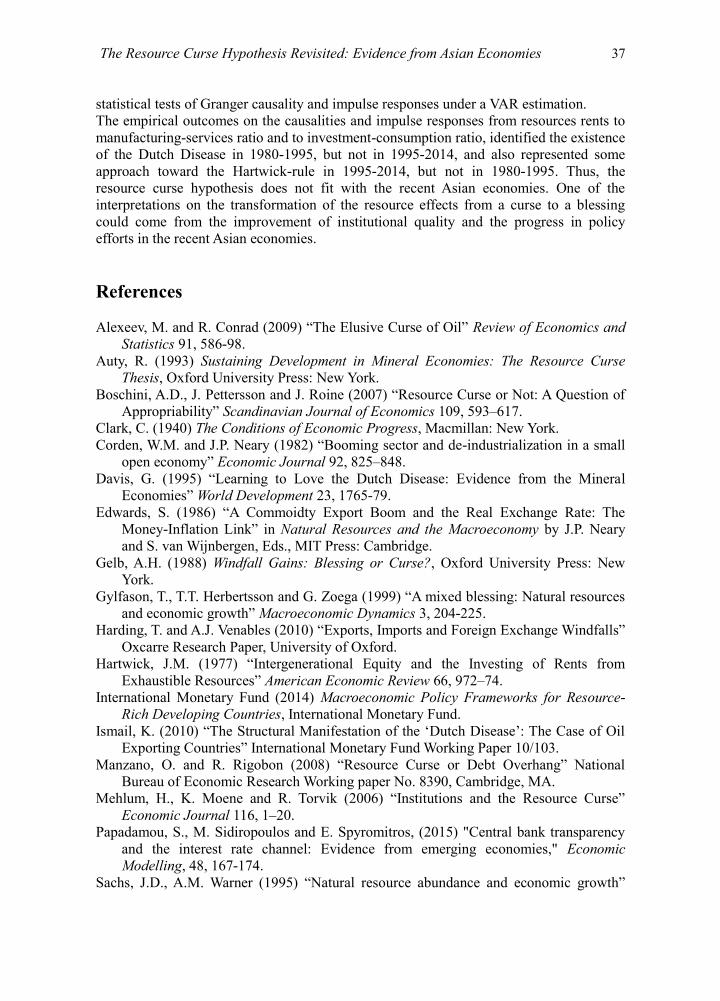
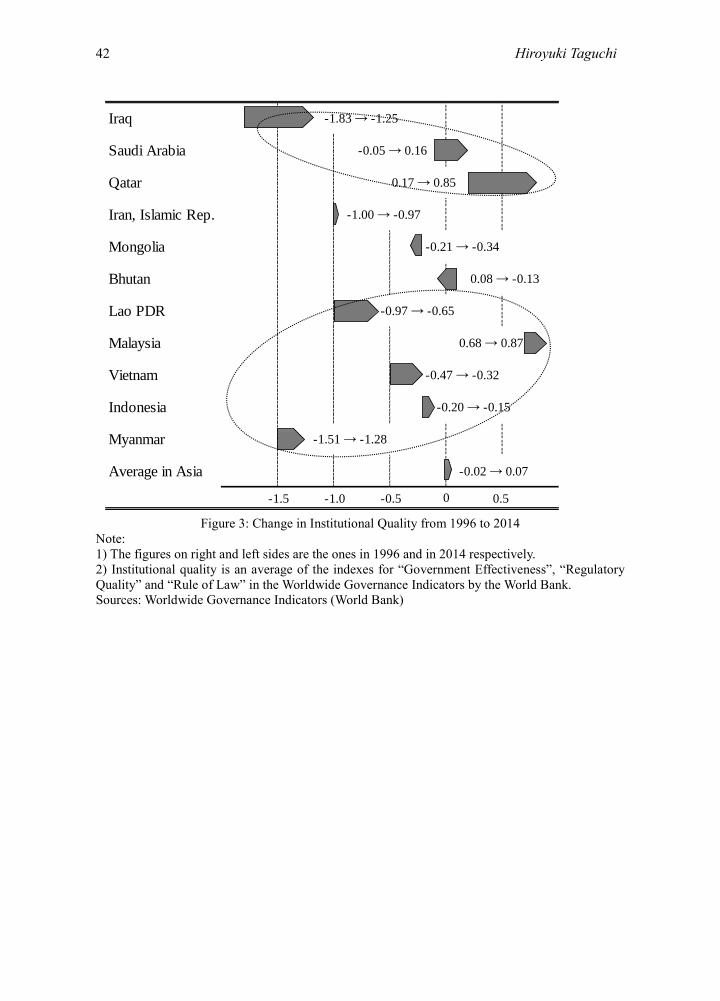
Figure 3 exhibits the change in institutional quality from 1996 to 2014 in selected
resource-rich Asian economies with better economic performance, the natural resources
rents of which are more than 6 percent on average and the annual growth rate of real GDP
per capita of which is over 2 percent during 1995-2014. The institutional quality is shown
as an average of the indexes for “Government Effectiveness”, “Regulatory Quality” and
“Rule of Law” in the Worldwide Governance Indicators by the World Bank. The index
takes the value of -2.5 in the worst quality and of 2.5 in the best one. We could observe
that the improvements in institutional quality from 1996 to 2015 are recorded in the oil
producing economies such as Iraq, Saudi Arabia and Qatar and also in emerging-market
economies with middle-sized resource abundance such as Lao PDR, Vietnam and
Myanmar. In fact, the three emerging-market economies that belong to Mekong region
has made policy efforts for intensively promoting their industrialization under the
framework of the Greater Mekong Sub-region supported by the Asian development Bank
since 1992.6 The transformation of the resource effects in the recent Asian economies
might come from the improvement of institutional quality and the progress in policy
efforts in their economies.
3 Concluding Remarks
This article examined the applicability of the resource curse hypothesis focusing on Asian
economies for two different phases for 1980-1995 and for 1995-2014. Its analytical
contribution was to trace two kinds of crowding-out logics behind the resource curse: the
Dutch Disease logic for resource abundance to crowd out manufacturing activities, and
the non-Hartwick-rule logic to crowd out savings and investment, by conducting the 6 See the website: http://www.adb.org/countries/gms/main.
The Resource Curse Hypothesis Revisited: Evidence from Asian Economies 37
statistical tests of Granger causality and impulse responses under a VAR estimation.
The empirical outcomes on the causalities and impulse responses from resources rents to
manufacturing-services ratio and to investment-consumption ratio, identified the existence
of the Dutch Disease in 1980-1995, but not in 1995-2014, and also represented some
approach toward the Hartwick-rule in 1995-2014, but not in 1980-1995. Thus, the
resource curse hypothesis does not fit with the recent Asian economies. One of the
interpretations on the transformation of the resource effects from a curse to a blessing
could come from the improvement of institutional quality and the progress in policy
efforts in the recent Asian economies.
References
Alexeev, M. and R. Conrad (2009) “The Elusive Curse of Oil” Review of Economics and
Statistics 91, 586-98.
Auty, R. (1993) Sustaining Development in Mineral Economies: The Resource Curse
Thesis, Oxford University Press: New York.
Boschini, A.D., J. Pettersson and J. Roine (2007) “Resource Curse or Not: A Question of
Appropriability” Scandinavian Journal of Economics 109, 593–617.
Clark, C. (1940) The Conditions of Economic Progress, Macmillan: New York.
Corden, W.M. and J.P. Neary (1982) “Booming sector and de-industrialization in a small
open economy” Economic Journal 92, 825–848.
Davis, G. (1995) “Learning to Love the Dutch Disease: Evidence from the Mineral
Economies” World Development 23, 1765-79.
Edwards, S. (1986) “A Commoidty Export Boom and the Real Exchange Rate: The
Money-Inflation Link” in Natural Resources and the Macroeconomy by J.P. Neary
and S. van Wijnbergen, Eds., MIT Press: Cambridge.
Gelb, A.H. (1988) Windfall Gains: Blessing or Curse?, Oxford University Press: New
York.
Gylfason, T., T.T. Herbertsson and G. Zoega (1999) “A mixed blessing: Natural resources
and economic growth” Macroeconomic Dynamics 3, 204-225.
Harding, T. and A.J. Venables (2010) “Exports, Imports and Foreign Exchange Windfalls”
Oxcarre Research Paper, University of Oxford.
Hartwick, J.M. (1977) “Intergenerational Equity and the Investing of Rents from
Exhaustible Resources” American Economic Review 66, 972–74.
International Monetary Fund (2014) Macroeconomic Policy Frameworks for Resource-
Rich Developing Countries, International Monetary Fund.
Ismail, K. (2010) “The Structural Manifestation of the ‘Dutch Disease’: The Case of Oil
Exporting Countries” International Monetary Fund Working Paper 10/103.
Manzano, O. and R. Rigobon (2008) “Resource Curse or Debt Overhang” National
Bureau of Economic Research Working paper No. 8390, Cambridge, MA.
Mehlum, H., K. Moene and R. Torvik (2006) “Institutions and the Resource Curse”
Economic Journal 116, 1–20.
Papadamou, S., M. Sidiropoulos and E. Spyromitros, (2015) "Central bank transparency
and the interest rate channel: Evidence from emerging economies," Economic
Modelling, 48, 167-174.
Sachs, J.D., A.M. Warner (1995) “Natural resource abundance and economic growth”
38 Hiroyuki Taguchi
National Bureau of Economic Research Working paper No. 5398, Cambridge, MA.
Sachs, J.D., A.M. Warner (2001) “Natural Resources and Economic Development: The
Curse of Natural Resources” European Economic Review 45, 827-838.
Sala-I-Martin, X. and A.A. Subramanian (2003) “Addressing the Natural Resource Curse:
An Illustration from Nigeria” IMF Working Paper WP/03/139.
van der Ploeg, F. (2011) “Natural Resources: Curse or Blessing?” Journal of Economic
Literature 49, 366-420.
World Bank (2011) The Changing Wealth of Nations: Measuring Sustainable
Development in the New Millennium, the World Bank.
The Resource Curse Hypothesis Revisited: Evidence from Asian Economies 39
Figure 1: Natural Resources Rents and Growth Rate of Real GDP Per Capita in Asia
Sources: World Development Indicators (World Bank) and UNCTADstat
40 Hiroyuki Taguchi
Table 1: Estimated VAR Model
Note: ***, **, * denote rejection of null hypothesis at the 99%, 95% and 90% level of
significance, respectively.
Sources: World Development Indicators (World Bank) and UNCTADstat
nrr vs. mos : 1980-1995 nrr mos
0.855*** -0.058***
[73.859] [-5.427]
-0.003 0.870***
[-0.315] [95.501]
-0.415 4.991***
[-0.434] [5.605]
0.204* -0.067
[1.702] [-0.598]
adj. R^2 0.929 0.949
nrr vs. mos : 1995-2014 nrr mos
0.960*** 0.007
[96.652] [0.935]
-0.014 0.962***
[-1.429] [122.582]
0.317 1.230*
[0.342] [1.702]
0.078 -0.045
[0.767] [-0.574]
adj. R^2 0.935 0.956
nrr vs. ioc : 1980-1995 nrr ioc
0.870*** -0.006
[81.558] [-0.441]
-0.034*** 0.914***
[-3.004] [57.828]
2.152*** 3.292***
[4.717] [5.267]
adj. R^2 0.929 0.869
nrr vs. ioc : 1995-2014 nrr ioc
0.968*** 0.060***
[97.668] [3.692]
-0.011 0.929***
[-1.4027] [70.960]
0.868** 2.141***
[2.569] [3.859]
adj. R^2 0.936 0.889
ypc
nrr -1
ioc -1
C
nrr -1
mos -1
C
nrr -1
mos -1
nrr -1
ioc -1
C
C
ypc
The Resource Curse Hypothesis Revisited: Evidence from Asian Economies 41
Table 2: Granger Causality Tests
Note: ***, **, * denote rejection of null hypothesis at the 99%, 95% and 90% level of significance,
respectively.
Sources: World Development Indicators (World Bank) and UNCTADstat
Figure 2: Impulse Responses to Shock of Natural Resources Rents
Note: The dotted lines denote a 95 percent error band over 8-year horizons.
Sources: World Development Indicators (World Bank) and UNCTADstat
nrr vs. mos Lags Null Hypothesis Chi-sq
mos does not Granger Cause nrr 0.099
nrr does not Granger Cause mos 29.456***
mos does not Granger Cause nrr 2.044
nrr does not Granger Cause mos 0.875
nrr vs. ioc Lags Null Hypothesis Chi-sq
ioc does not Granger Cause nrr 9.029***
nrr does not Granger Cause ioc 0.195
ioc does not Granger Cause nrr 2.038
nrr does not Granger Cause ioc 13.631***1995-2014 1
1980-1995 1
1995-2014 1
1980-1995 1
42 Hiroyuki Taguchi
Figure 3: Change in Institutional Quality from 1996 to 2014
Note:
1) The figures on right and left sides are the ones in 1996 and in 2014 respectively.
2) Institutional quality is an average of the indexes for “Government Effectiveness”, “Regulatory
Quality” and “Rule of Law” in the Worldwide Governance Indicators by the World Bank.
Sources: Worldwide Governance Indicators (World Bank)
Iraq -1.83 → -1.25
Saudi Arabia -0.05 → 0.16
Qatar 0.17 → 0.85
Iran, Islamic Rep. -1.00 → -0.97
Mongolia -0.21 → -0.34
Bhutan 0.08 → -0.13
Lao PDR -0.97 → -0.65
Malaysia 0.68 → 0.87
Vietnam -0.47 → -0.32
Indonesia -0.20 → -0.15
Myanmar -1.51 → -1.28
Average in Asia -0.02 → 0.07
-1.5 -1.0 -0.5 0.50


![The Resource Curse Revisited and Revised a Tale of Paradoxes JEEM 2008[1]](https://img.pdfslide.us/doc/110x75/577cd4811a28ab9e7898a2d8/the-resource-curse-revisited-and-revised-a-tale-of-paradoxes-jeem-20081.jpg)