Embed Size (px)
Citation preview

1
The resistance of metallic plates to localized impulse
Z. Wei, V.S. Deshpande, A.G. Evans
Materials Department and Mechanical Engineering Department, University of California, Santa Barbara, California 93106
K.P. Dharmasena, D.T. Queheillalt, H.N.G. Wadley Department of Materials Science,
University of Virginia, Charlottesville, Virginia 22904
Y. Murty, R.K. Elzey Cellular Materials International, Inc.
Charlottesville, VA 22903
P. Dudt, Y. Chen, D. Knight Naval Surface Warfare Center,
Carderock, Maryland 20817
K. Kiddy Naval Surface Warfare Center, Indian Head, Maryland 20640
Abstract
The responses of metallic plates and sandwich panels to localized impulse are examined by using a dynamic plate test protocol supported by simulations. The fidelity of the simulation approach is assessed by comparing predictions of the deformations of a strong-honeycomb-core panel with measurements. The response is interpreted by comparing and contrasting the deformations with those experienced by the same sandwich panel (and an equivalent solid plate) subjected to a planar impulse. Comparisons based on the center point displacement reveal the following paradox. The honeycomb panel is superior to a solid plate when subjected to a planar impulse, but inferior when localized. The insights gained from an interpretation of these results are used to demonstrate that a new design with a doubly-corrugated soft core outperforms solid plates both for planar and localized impulses. Keywords: metallic sandwich panels, triangular honeycomb core, doubly-corrugated core, DYSMAS-ABAQUS simulation

Report Documentation Page Form ApprovedOMB No. 0704-0188
Public reporting burden for the collection of information is estimated to average 1 hour per response, including the time for reviewing instructions, searching existing data sources, gathering andmaintaining the data needed, and completing and reviewing the collection of information. Send comments regarding this burden estimate or any other aspect of this collection of information,including suggestions for reducing this burden, to Washington Headquarters Services, Directorate for Information Operations and Reports, 1215 Jefferson Davis Highway, Suite 1204, ArlingtonVA 22202-4302. Respondents should be aware that notwithstanding any other provision of law, no person shall be subject to a penalty for failing to comply with a collection of information if itdoes not display a currently valid OMB control number.
1. REPORT DATE 01 MAR 2007
2. REPORT TYPE N/A
3. DATES COVERED -
4. TITLE AND SUBTITLE The resistance of metallic plates to localized impulse
5a. CONTRACT NUMBER
5b. GRANT NUMBER
5c. PROGRAM ELEMENT NUMBER
6. AUTHOR(S) 5d. PROJECT NUMBER
5e. TASK NUMBER
5f. WORK UNIT NUMBER
7. PERFORMING ORGANIZATION NAME(S) AND ADDRESS(ES) Materials Department and Mechanical Engineering Department,University of California, Santa Barbara, California 93106
8. PERFORMING ORGANIZATIONREPORT NUMBER
9. SPONSORING/MONITORING AGENCY NAME(S) AND ADDRESS(ES) 10. SPONSOR/MONITOR’S ACRONYM(S)
11. SPONSOR/MONITOR’S REPORT NUMBER(S)
12. DISTRIBUTION/AVAILABILITY STATEMENT Approved for public release, distribution unlimited
13. SUPPLEMENTARY NOTES
14. ABSTRACT
15. SUBJECT TERMS
16. SECURITY CLASSIFICATION OF: 17. LIMITATION OF ABSTRACT
UU
18. NUMBEROF PAGES
29
19a. NAME OFRESPONSIBLE PERSON
a. REPORT unclassified
b. ABSTRACT unclassified
c. THIS PAGE unclassified
Standard Form 298 (Rev. 8-98) Prescribed by ANSI Std Z39-18

2
1. Introduction Many of the issues that affect the dynamic response of metallic sandwich panels have been established for a planar blast wave impinging on a plate at zero obliquity (e.g. Xue and Hutchinson, 2004, Deshpande and Fleck, 2005; Hutchinson and Xue, 2005; Deshpande et al., 2006; Tilbrook et al., 2006; Dharmasena et al. 2007a; Liang et al., 2007; Wadley et al., 2007; Wei et al., 2007a,b). Analytic expressions derived for the fluid/structure interaction (FSI) (Deshpande and Fleck, 2005; Liang et al., 2007) predict the time evolution of the face velocities and the momentum acquired by the panel. The analytic formulae have been validated by comparison with numerical simulations and with experimental measurements on panels subjected to dynamic loads. The formulae predict the most important response metrics. These include the center displacements of the back face, the reaction forces induced at the supports and the plastic strains in the face sheets. The latter allow estimates to be made of the occurrence of face sheet tearing. The intent of this article is to explore the corresponding situation in the near-field of a localized blast source with spherically-expanding wave front and thereupon, establish a simulation procedure that decouples determination of the impulse from its imposition onto the structure. Such decoupling has the advantages that it reduces the simulation time while also allowing access to the wide range of material models available in commercial finite element codes such as ABAQUS/Explicit (ABAQUS Inc., 2006). To provide context we recall that the impulsive response of sandwich panels can span a range between soft and strong (Tilbrook et al., 2006; Liang et al., 2007). Soft-cores crush extensively following application of an impulse to the front face. In this situation, the back face displacement arrests while the front face is still in motion. Strong-cores exhibit minimal crushing and both faces acquire a common velocity before arresting. For plane waves, the best combination of performance metrics arises for soft-core designs with unclamped front faces. It will be shown that the requirements differ for localized loadings. To validate the numerical procedures, measurements are performed utilizing the test fixture shown in Figure 1a, incorporating a panel with a triangular honeycomb core fabricated from a super-austenitic stainless steel (Figure 1b). In this test, the panel is rigidly supported around its perimeter and subjected to a localized impulse from a blast source close to the center of the plate. The article is organized in the following manner. The measurements are summarized. The calculations of the blast source pressure and velocity fields are obtained using the Dynamic System Mechanics Analysis Simulation (DYSMAS) code, followed by ABAQUS/Explicit calculations of the response of the panel. Comparisons between the calculations and the measurements are used to assess the fidelity of the simulation approach. Calculations are performed for solid plates as well as for several sandwich designs to establish a pathway towards configurations that outperform solid plates. 2. Experimental Details The sandwich panels were fabricated from a super-austenitic stainless steel alloy by CMI Inc. (Charlottesville, Virginia). The triangular honeycomb core was fabricated using an

3
interlocking assembly approach proposed originally by Dharmasena et al. (2007b), Figure 2. Briefly, a series of 50.8 mm spaced triangular notches and narrow rectangular slots were laser cut into 60.8 mm wide, 0.76 mm thick strips. One pattern (shape #1 in Figure 2) had slots along a single edge. The other (shape #2) had slots along both. Each strip was bent at 90° along the two lengthwise edges to provide ~5mm surface tabs for attachment of the core to the top and bottom faces. The strips were arranged at 600 and assembled to create a core having relative density (ignoring the face attachment tabs):
2 3 b / l (1)
where b is the thickness of the web and l the cell size (node spacing). For the chosen design (with b = 0.76 mm and l = 50.8 mm), the relative density = 0.052. The assembled core with dimensions 0.64 x 0.64 x 0.051 m was mounted in a picture frame with 50.8 x 50.8 mm hollow tube edge members. The core was metallurgically bonded to 0.71 m x 0.71 m x 1.52 mm faces by spraying with braze powder (Wall Colmonoy Nicrobraz 31 alloy), assembling, installing in a vacuum system (Solar Atmospheres, Souderton, PA) at 0.13 Pa and imposing the following thermal cycle. (i) Holding at 550oC for ~30 min. to remove the polymer binder mixed with the braze alloy. (ii) Equilibrating at 925oC for 30 min. (iii) Bonding at 1155oC for 60 min, before cooling to ambient. After brazing, 24 holes were drilled through the edges, for attachment to the test fixture. The as-brazed panel with a core thickness of 50.8 mm had mass/area equivalent to a 5.7 mm thick solid steel plate. For testing purposes, the four edges of the panel were rigidly clamped between two plates with a series of through-bolts (Figure 1a). The test fixture was submersed in water and a large localized impulsive load created by the detonation of a small explosive charge centered above the test plate at a pre-selected standoff. Both faces of the panel suffered significant displacement, accompanied by localized buckling of some of the core members (Figure 3). The front face deformed around the core members with some tearing at the nodes near the center (Figure 4). The back face exhibited much less localized deformation (Figure 5). 3. Impulsively Loaded Sandwich Panels 3.1 Planar Impulsive Loading Time Scales and Velocities. For plane waves characterized by an exponentially-decaying impulse, with maximum pressure, p0 , and time constant, t0 (impulse per area, I0 p0t0 ) the front face rapidly accelerates to a maximum velocity,
vpeak , just before cavitation in
the water, which commences, at time t tc . Thereafter, the core imposes a push-back stress, causing the front face to decelerate and the back face to accelerate in a manner governed by the dynamic strength of the core, YD
c . For a strong core, the front and back face velocities converge to a common velocity, vcommon . This happens at time tII . Thereafter, both faces decelerate together and arrest at time, tIII .

4
For a strong core, the back face velocity attains a maximum velocity at IIt (Tilbrook et al., 2006):
IIb
cYD
b tm
v
, (2)
where bm is the mass of the back face while the dynamic strength of the honeycomb core
is (Xue and Hutchison, 2006):
YDcYD . (3)
Here YD is the dynamic yield strength of the material in the core at the strain rate,
cpeak Hv /
( Hc is the core thickness). The back face decelerates as plastic hinges
propagate along its length and arrest at a time (Tilbrook et al., 2006):
tIII L /Y (4)
where is the density of the material comprising the face, Y its yield strength at low strain-rates and L the half-span of the beam. The average reaction force at the supports RF is related to the total momentum imparted from water to the panel, I ( 0I in most
cases), by:
IIItIRF / (5) Numerical Simulations. For plane-waves it has been possible to conduct successful simulations of the responses of the panel and of the water by using the commercial finite element code ABAQUS/Explicit (Dharmasena et al., 2007a; Liang et al., 2007; Wei et al., 2007a,b). In these investigations, the input to the ABAQUS simulations is the pressure versus time history created in the water by the explosion calculated using the code DYSMAS (Dharmasena et al., 2007a; Wei et al., 2007a,b). A similar DYSMAS-ABAQUS procedure is adopted in this study. 3.2 Localized Impulsive Loading Time Scales and Pressures. A synopsis of the main characteristics of a shock wave resulting from an underwater impulsive source (ascertained over decades by means of large-scale experiments and modeling, e.g. Cole, 1948; Swisdak, 1978) underpins the ensuing assessments. The impulse is transmitted through the surrounding water by the propagation of a spherical shock at near the sonic speed (see Figure 6a). Upon arrival at a fluid element radial distance r from a point-source, the pressure rises (almost instantaneously) to a peak po
. Subsequently, it decreases at nearly exponential rate, with
a time constant 0t (of order milliseconds): 0/t top p e , where t is the time measured
from the instant of arrival of the blast wave. For blast-created impulses, the magnitude of the shock pressure and decay constant depend upon the mass and type of explosive material as well as r. The experimental data and physical models (Cole, 1948; Swisdak, 1978) support the use of simple power-law scaling between the mass M of explosive,

5
the standoff r, po and 0t . For example, for an underwater TNT explosion, the peak
pressure (in MPa) scales as (Swisdak, 1978)
13.13/14.52 rMpo (6)
where M is in kilograms and r in meters. The time constant 0t (in ms) scales as:
23.03/13/10 084.0
rMMt (7)
These relations have been validated for wide domains of M and r. Localized versus planar loading In order to quantify the degree of "planarity" of the impulse loading of a sandwich panel we define a planarity measure
0 /wc t s (8)
where s is the additional distance that the blast wave has to travel before it impinges onto the edge of the panel. It is defined in Figure 6a and given as
s R ( D / 2 R)2 1 1 . (9)
where R is the standoff distance of the panel from the point explosive charge (r=R when the blast wave impinges at the center of the panel) and D the span of the panel. We interpret as the ratio of the decay constant 0t to the time delay for the blast to impinge
on the edge after reaching the mid-span. Here, situations with 1 are considered non-planar (the incident blast pressure at the mid-span has dropped below 0.37 p
o before the
blast wave impinges on the edge). Conversely, cases with 1 are deemed planar. A map with explosive mass M and distance R as coordinates (Figure 6b) is used to display contours of the blast planarity measure for a circular panel, diameter
mD 64.0 (a representative size for the panel tested here). Also included are contours of constant po
and 0t .
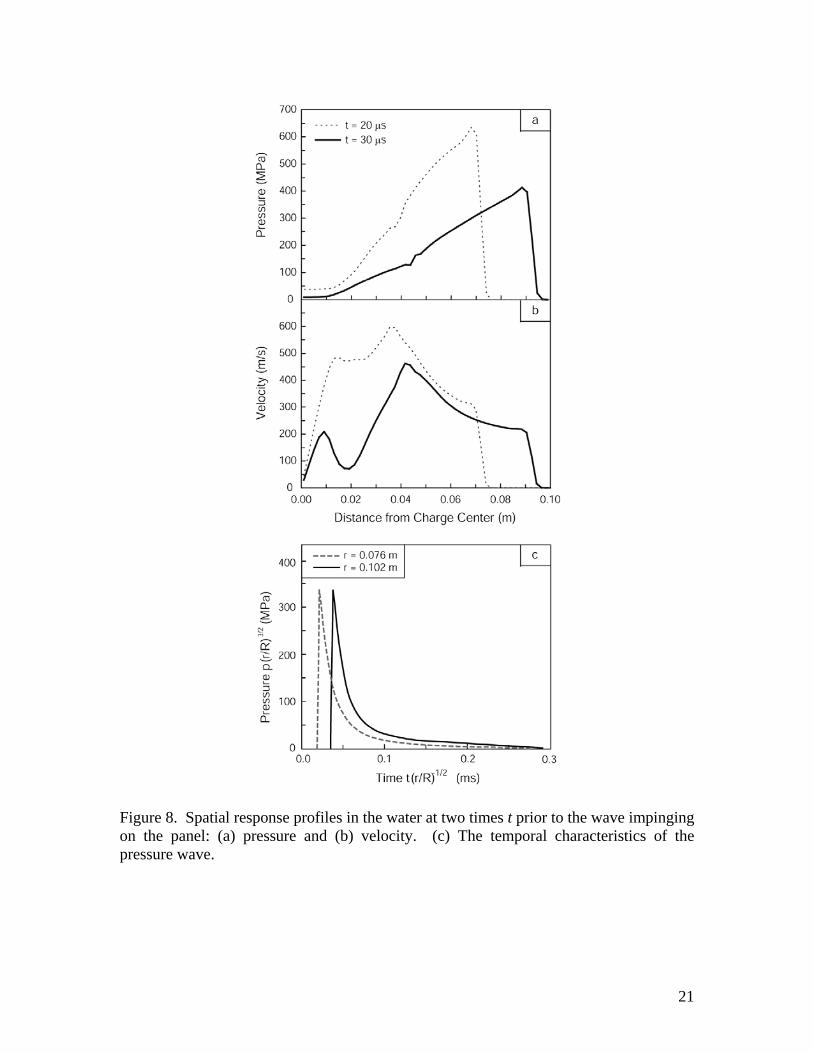
4. The Simulation Scheme The time variation of the predicted pressure wave (using DYSMAS) created by the source at a stand-off R = 0.102m is depicted on Figure 7. Using this pressure history we estimate the source to correspond to kgM 2.0 of TNT using published nomographs for explosions in water (Swisdak, 1978). Prior to the pressure front contacting the panel, the wave is spherically-symmetric. The pressure and velocity profiles in the water at two times prior to impact are summarized on Figure 8a, b. The particle velocity increases with distance from the wave front, attains a maximum, and decreases to zero at the center of the source, albeit in a non-monotonic manner. The temporal characteristics of the
pressure shown on Figure 8c reveal a scaling: 2/12/3 /exp~)/( RrtRrp . The scaling differs from that used for point charges (Eqns. 6 and 7), presumably because of the finite source size and its proximity to the panel. The approach that most faithfully reproduces the FSI effect parameterizes the spatial variation of the pressure and velocity at times preceding contact (Figure 8a,b) and uses these to set up the initial pressure and velocity fields in the water for the ABAQUS analysis. That is, the potential and kinetic energy are

6
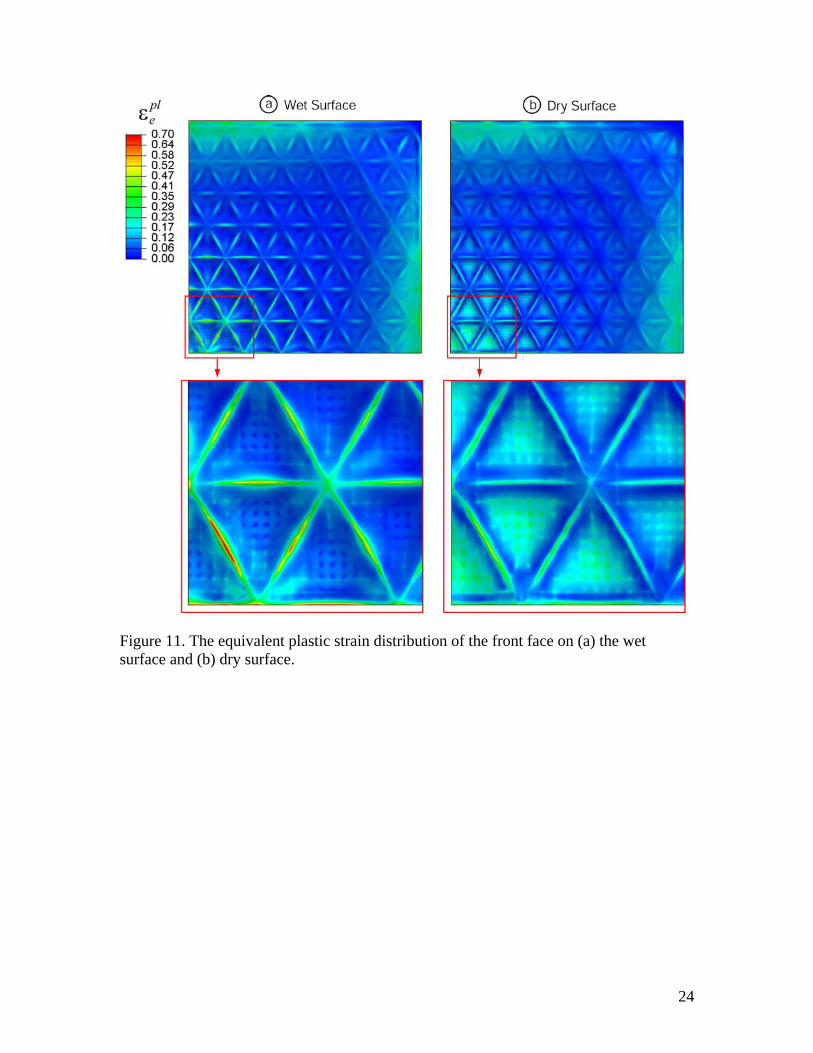
transferred from DYSMAS to ABAQUS through the pressure and velocity fields, respectively. The higher pressures in the reflected wave then become an output of the calculation. FORTRAN programming has been used to facilitate the transfer process. Due to the symmetry, only one-quarter of the sandwich panel need be modeled. For computational efficiency, shell elements with reduced integration (S4R) are used for the panel. Eight-noded solid elements (C3D8R), coupled with linear equation of state, are used to model the water. The mesh is depicted on Figure 9. The general contact algorithm in ABAQUS/Explicit was used. The constitutive laws used for the stainless steel and water have been described elsewhere (Xue and Hutchinson, 2006; Liang et al. 2007), but are summarized in Appendix A for completeness. To adequately simulate the dynamic response of the core members it has often been necessary to incorporate geometric imperfections. However, due to the very large number of degrees of freedom in the model, only the first 50 eigen-modes could be extracted from a modal analysis. These modes depicted in Figure 10a do not include the short-wavelength modes that are critical to accurate predict the dynamic collapse response of honeycombs (McShane et al., 2007). Thus, instead of selecting one of these modes, a short-wavelength imperfection is introduced into the core member at the center of symmetry having amplitude equal the member thickness (Figure 10b). The premise is that all other members will buckle in the appropriate manner because of the bending moments generated in these members. 5. Simulation Results For Honeycomb Core Sandwich Panel The deformations experienced by the panel are depicted in Figure 3. In this figure, the simulated shapes (Figures 3b and 3c) are compared with the cross section of the tested panel (Figure 3a). The close similarity is apparent. For computation tractability a rupture criterion has not been included in the ABAQUS model. Instead, the equivalent plastic strain pl
e distribution in the front face around the centermost unit cell of the core is used
as a surrogate (Figure 11). The large plastic strains occur at two types of locations near the center of the panel: one around the nodes, and the other along the core member edges. The strains at those locations have a maximum of about 70% and exceed the ductility of the alloy: the tensile ductility of the stainless steel is approximately 50% (Nemat-Nasser et al., 2001). However, face tearing only occurred around the nodes in the experiment (Figure 4). This discrepancy is attributed to the tabs on the core members (Figure 2) that were not modeled in the simulation, which reduce the stress concentration and prevent large plastic strains along core member edges. The velocities acquired by the front and back faces at the panel center (Figure 12) have typical strong-core characteristics. Namely, with minimal core crushing, the faces acquire a common velocity after about 0.1ms and (following some oscillations) decelerate together and arrest after about 1.5ms. After arresting there are elastic reverberations. The maximum velocity acquired by the front face, vmax 225m / s is appreciably higher than that found in previous planar wave assessments (Liang et al. 2007; Wei et al., 2007a,b) because of the larger (albeit localized) pressure. The constancy of the acceleration of the

7
back face at its center, prior to attaining a common velocity, suggests that the dynamic strength of the core can be estimated from Eqn. (2). The ensuing estimate, YD 15MPa (along with Eqn. (3) and 0.052 ) would infer a dynamic yield strength,
YD 290MPa at strain-rate (based on the front face velocity, Figure 12), 4x10³ / s . The inference is that, despite the localized nature of the impulse, the back face velocity at the center can still be estimated from Eqn. (2). Moreover, the duration of the deformation (~1.60ms) is close to that expected for plastic hinge propagation time along the back face, tIII (~1.65ms calculated from Eqn. 4), despite a seemingly different deformation sequence. The pressure wave propagation sequence in the water (Figure 13) reveals the magnitude of the reflected wave, as well as the formation and expansion of the cavitated regions (delineated by domains where the pressure in the water is zero). The source creates a spherically-expanding cavitation front. The reflection creates another front propagating in the opposite direction (away from the panel). This front initiates at a stand-off distance ( mmxe 15 ) from the panel, at times greater than 30s , causing an uncavitated layer of
water to attach to the panel. At 60s these cavitation fronts converge along the center-line. Thereafter, the complexity of the velocity field eludes simple description. 6. Comparative responses Equivalent impulses. The source pressure and duration in the test inferred from the calculations (Figure 8) are used to infer the equivalent mass of TNT from (Swisdak, 1978) and the data superimposed on the nomograph (marked as a solid circle in Figure 6b) to affirm that the source in this test is truly localized ( 0.3) . Note, however, that
the decay time ( mst 03.00 ) exceeds that found from the DYSMAS calculations
( mst 02.00 ; see Figure 8c), again presumably because of the close proximity of the
blast source. The velocity and pressure characteristics for the spherical wave front (Figure 8a,b) indicate that it is equivalent to a planar uniform source with the free field impulse, skPaI .60 . In order to gauge the performance of the same panel subjected to
an “equivalent” planar impulse we use the same free field impulse and explore two options. (i) An impulse with essentially the same duration ( 0 0.02t ms ) as that in the test
and peak pressure of about 300MPa. Such a planar source cannot be ascribed to a local (point) event because of the small . However, this could be envisioned as an equivalent impulse emanating from a thin-sheet-explosive described in previous studies (Dharmasena et al. 2007a; Wadley et al., 2007; Wei et al., 2007a,b). (ii) A point source blast with 0 0.1t ms consistent with a previous investigation (Liang et al., 2007) and
peak pressures of about 60 MPa. This corresponds to source at a stand-off 1 mR and indicated by the star in Figure 6b. This source gives, 2 (Figure 6b), satisfying the planarity requirement associated with a point blast source. Deformations. Comparison of the permanent deformations of the solid plate reveal major differences between the response to the two “equivalent” blast sources as well as non-

8
intuitive differences between the planar and localized cases (Figures 14 and 15a,b). Given the small deflection found for the “equivalent” source using the lower pressure (giving a planar blast wave), we assert that this is not the relevant comparison. The ensuing comparison is thus restricted between the local and the planar impulse with
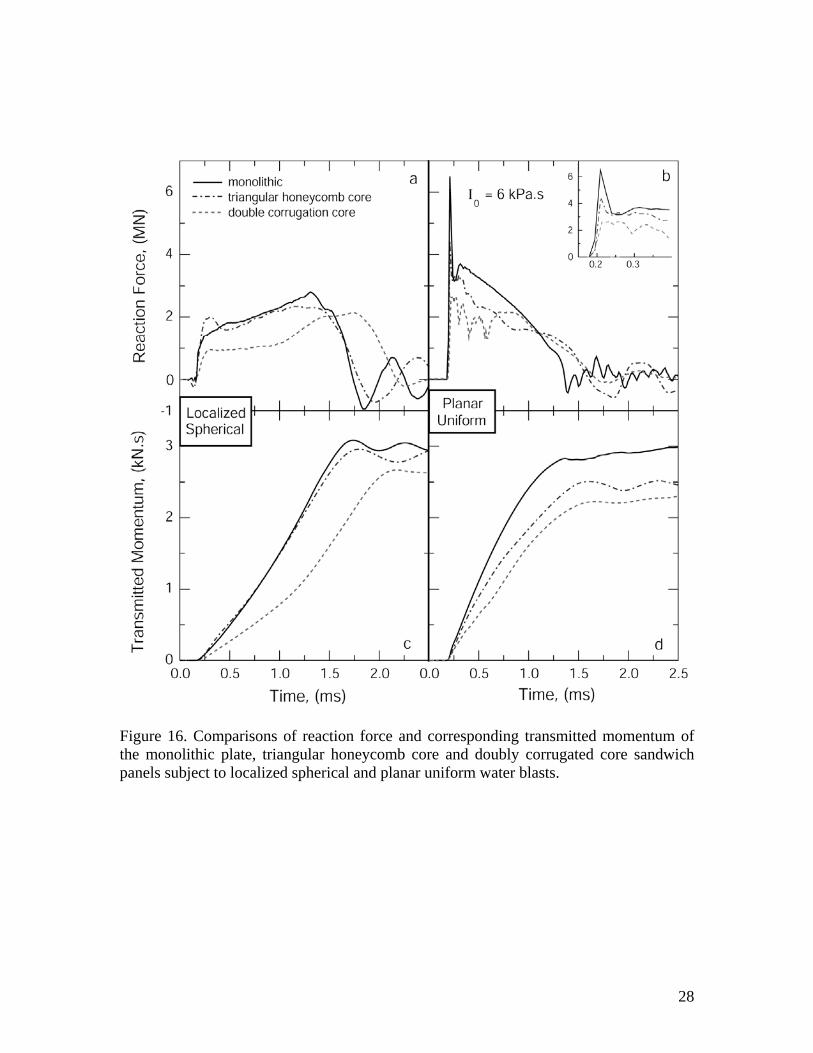
MPap 3000 and mst 02.00 .
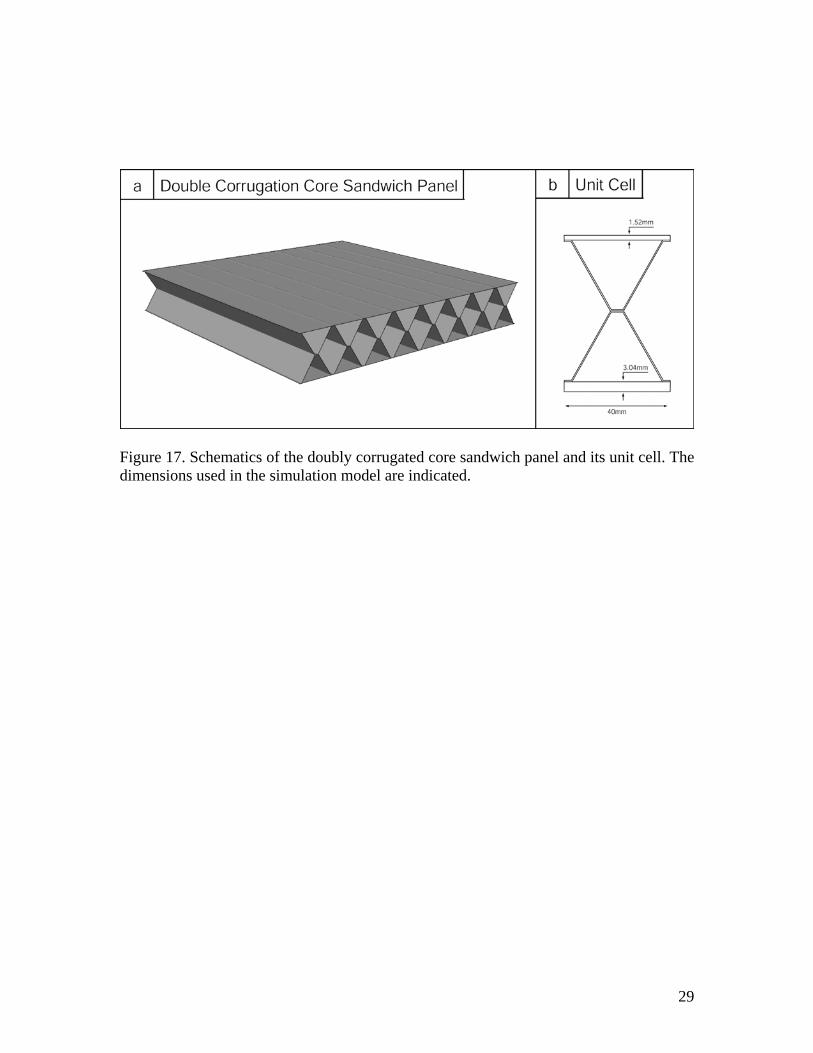
For the planar impulse, the panel assumes a conical shape with maximum deflection at the center (Figure 15b). Conversely, the local impulse results in a planar segment at the center (Figure 15a). The difference is briefly explained as follows: elastic wave reflections from the supports interfere with the propagation of plastic hinges and prevent the formation of the conical shape. The corresponding deformations experienced by the honeycomb core panel are plotted on the same figure and are almost identical. A plot of the maximum deflections from all of the calculations (Figure 15a-d) demonstrates two important effects. (i) For planar impulse, the center deflection of the back face is less than that for the center of the solid plate. Moreover, the reduction in deflection is consistent with that reported previously for honeycomb cores with similar relative density (Xue and Hutchison, 2004; Liang et al., 2007). (ii) Conversely, for localized impulsive source, the center of the panel deflects more than the solid plate. Impulse and Reaction Force. The temporal variation of the reaction force at the peripheral support and the momentum transfer are plotted on Figure 16. Note that the rate of change of momentum is nearly constant for the local source, resulting in an essentially constant reaction force, spread over a relatively long time. This response differs from the plane wave situation wherein the reaction force exhibits a large initial peak with short duration (Liang et al., 2007). The following consequences ensue: (i) The flat response for the local source eliminates any benefit from the sandwich. (ii) The local source generates relatively small transmitted force because the spreading of the impulse increases the duration of the response. Plastic Strains. The maximum equivalent plastic strains in the front and back faces are compared with that found in the solid plate for both localized spherical and planar uniform sources (Table 1). The maximum equivalent plastic strain in the front face is much larger than that in the monolithic plate, while the maximum equivalent plastic strain in the back face is nearly equal to that in the monolithic plate. The implication of the foregoing set of results is that the significant benefits of the honeycomb core panel over a solid plate apparent for planar sources are completely eliminated for local impulses. 7. Designs that Enhance Performance Given the disappointing performance of the strong-honeycomb core, we have explored a soft core to assess whether panels with the appropriate core design can be an attractive option for resisting localized blast. The choice is the doubly-corrugated core with relative density, %2 (Figure 17). The overall sandwich panel dimensions are the same as for

9
the honeycomb panel analyzed above with the core and face-sheet dimensions included in Figure 17b. The results are superposed on Table 1 and Figures 15 and 16. Note that the core indeed crushes at its center indicative of a soft response. The consequence is a back face deflection substantially smaller than the solid plate (Figure 15). The initial reaction force is also lower but increases subsequently to a similar level (Figure 16). This late stage elevation is attributed to slapping of the front face into the back face: a problem that can be eliminated by using either a slightly greater core thickness or larger relative density. The maximum equivalent plastic strain in the front face is much larger than that in the monolithic plate. However, the maximum equivalent plastic strain in the back face is much lower (Table 1). Thus, we see that a suitably well designed soft core sandwich panel can outperform an equal mass monolithic panel even under localized blast loading conditions. However, such soft-core panels suffer from the drawback that they undergo face sheet slap for high values of the blast impulse that significantly degrades their performance as discussed in previous studies (e.g. Hanssen et al., 2002; Nesterenko, 2003; Yen et al., 2005; Tilbrook et al., 2006) and thus are useful only over a limited range of blast impulses. Moreover, soft core panels typically have a poor quasi-static indentation resistance and thus such panels may be unsuitable under normal service conditions. A combined quasi-static and dynamic optimization needs to be performed to design optimal cores over a wide range of loading scenarios. It is worth emphasizing here that the conclusions of this study relate to a rather limited blast loading scenario as marked by the solid circle in the blast nomograph in Figure 6b. A larger set of experiments and simulations need be carried to scope out the nomograph in order to draw broader conclusions. 8. Concluding Remarks The resistance of metallic sandwich panels to localized spherical impulsive sources has been examined with the objective of devising and implementing a simulation capability amenable to the discovery of panel configurations that impart the best combination of performance metrics. The simulation protocol uses the output from a hydro-code characterization of the pressure wave as input to ABAQUS Explicit. Experiments on a triangular-honeycomb-core sandwich panel have been used to assess the fidelity. The accurate duplication of the deformations (both global and local) provides confidence in the approach. Thereafter, the code has been used to compare and contrast various features governing the response of panels to localized and planar impulses in water. (i) The responses of monolithic plates subject to local and planar impulses have been compared and shown to be quite different. For the planar case, the plate assumes a conical shape with maximum deflection at the center. Conversely, the localized case results in a planar segment around the center. (ii) For planar sources, the maximum deflections of both the (strong) triangular honeycomb and (soft) doubly-corrugated core panels are less than that for the solid plate

10
having the same mass/area. The maximum reaction force at the supports is similarly reduced. The benefits of the sandwich designs are consistent with those demonstrated in previous studies (Xue and Hutchinson, 2004; Liang et al., 2007). (iii) For localized sources, the situation differs. The deflection of the strong honeycomb core panel now exceeds that for the monolithic plate. However the soft doubly-corrugated core panel exhibits much smaller deflection. Thus a dependence of the response on core softness again emerges, but the characteristics differ from those found for planar blast. Continuing assessments will pursue designs that provide the best performance subject to localized loading. (iv) The reaction forces for local source case are not that sensitive to the design and thus appear to be a second order performance metric. Acknowledgements We are grateful to ONR for support of this work under Contract Nos. 123163-03 and N00014-03-1-0281. Appendix A. Material Models for Water and Stainless Steel In the FE computations, the water is considered to be linear elastic under compression but has zero tensile strength and zero shear modulus (Liang et al., 2007). The pressure p in the water is then given by p cw
2wV , where the sound speed in water 11500 mscw ,
the water density 31000 kgmw and V is the volumetric strain. When V 0 ,
cavitation means that all stresses in the water become zero. In the FE calculations, the monolithic plates and sandwich panels are assumed to be made from a von-Mises material with properties representative of stainless steel. Thus, the material is taken to have a relatively high strain hardening capacity and moderate strain rate dependence. The uniaxial tensile true stress versus strain ( ) behavior is represented by the rate-dependent bilinear relation (Xue and Hutchinson, 2006):
E
k
E
kEk
E
kE
YYtY
Y
,
, (A1)
Here, E is Young’s modulus, tE is the linear strain hardening rate and Y is the quasi-
static yield strength. Rate-dependence is tied to the plastic strain rate, Ep / ,
through the factor mpk 0/1 which elevates the flow stress. Here 0 and m are
material parameters determined by experiment. The following choice of material parameters used in all the computations in this paper: GPaE 200 , MPaY 305 ,

11
GPaEt 9.1 , 10 4916 s , 154.0m , density 38000 kgm , and elastic Poisson’s
ratio 3.0v . References ABAQUS, Inc. 2006. ABAQUS Analysis User’s Manual, Version 6.5. Cole, R.H. 1948. Underwater explosions. Princeton University Press. Deshpande, V.S. and Fleck, N.A. 2005. One-dimensional shock response of sandwich
plates. J. Mech. Phys. Solids. 53: pp2347-2383. Deshpande, V.S., Heaver, A. and Fleck, N.A. 2006. An underwater shock simulator.
Proc. R. Soc. A. 462: pp1021-1041. Dharmasena, K.P., Queheillalt, D.T, Wadley, H.N.G., Chen, Y., Dudt, P., Knight, D.,
Wei, Z. and Evans, A.G. 2007a. Dynamic response of a multilayer prismatic structure to impulsive loads incident from water. Int. J. Impact Eng. in press.
Dharmasena, K.P., Queheillalt, D.T., Wadley, H.N.G., Dudt, P., Chen, Y. and Knight, D. 2007b. The dynamic compressive response of periodic cellular metals subjected to underwater impulsive loading. in preparation.
Hanssen, A.G., Enstock, L. and Langseth, M. 2002. Close-range blast loading of aluminum foam panels. Int. J. Impact Eng. 27: pp593-618.
Hutchinson, J.W. and Xue, Z. 2005. Metal sandwich plates optimized for pressure impulses. Int. J. Mech. Sci. 47: pp545-569.
Liang, Y., Spuskanyuk, A.V., Flores, S.E., Hayhurst, D.R., Hutchinson, J.W., McMeeking, R.M., and Evans, A.G. 2007. The response of metallic sandwich panels to water blast. J. Appl. Mech. 74: pp81-99.
McShane, G. J., Radford, D.D., Deshpande, V.S. and Fleck, N.A. 2007. The dynamic compressive response of square-honeycombs. J. Appl. Mech. 74: pp 658-667.
Nemat-Nasser, S., Guo, W.G. and Kihl, D.P. 2001. Thermomechanical response of AL-6XN stainless steel over a wide range of strain rates and temperatures. J. Mech. Phys. Solids. 49: pp1823-1846.
Nesterenko, V.F. 2003. Shock (blast) mitigation by "soft" condensed matter. MRS Symp. Proc. 759: pp4.3.1- 4.3.12.
Swisdak, M.M. 1978. Explosion effects and properties: part II - explosion effects in water. Naval Surface Warfare Center Report, NSWC/WOL TR 76-116.
Tilbrook, M.T., Deshpande, V.S. and Fleck, N.A. 2006. The impulsive response of sandwich beams: analytical and numerical investigation of regimes of behavior. J. Mech. Phys. Solids. 54: pp2242-2280.
Wadley, H.N.G., Dharmasena, K.P., Chen, Y., Dudt, P., Knight, D., Charette, R. and Kiddy, K. 2007. Compressive response of multilayered pyramidal lattices during underwater shock loading. Int. J. Impact Eng. in press.
Wei, Z., Dharmasena, K.P., Wadley, H.N.G. and Evans, A.G. 2007a. Analysis and interpretation of a test for characterizing the response of metallic sandwich panels to water blast. Int. J. Impact Eng. 34: pp1602-1618.
Wei, Z., He, M.Y. and Evans, A.G. 2007b. Application of a dynamic constitutive law to multilayer metallic sandwich panels subject to impulsive loads. J. Appl. Mech. 74: pp636-644.

12
Xue, Z.Y., and Hutchinson, J.W. 2004. A comparative study of impulse-resistant metal sandwich plates. Int. J. Impact Eng. 30: pp1283-1305.
Xue, Z. and Hutchinson, J.W. 2006. Crush dynamics of square honeycomb sandwich cores. Int. J. Num. Meth. Eng. 65: pp2221-2245.
Yen, C.F., Skaggs, R. and Cheeseman, B.A. 2005. Modeling of shock mitigation by sandwich structures for blast protection. The International Conference on Structural Stability and Dynamics, Kissimmee, Florida.
Table 1. Maximum equivalent plastic strain in the monolithic plate as well as the front and back faces of the triangular honeycomb and doubly-corrugated core panels.

13
FIGURES Figure 1. (a) The configuration used for the paddle wheel test. (b) The triangular honeycomb sandwich panel used for the measurements (the front face sheet is not shown). Figure 2. Cutting, bending and assembling operations used to fabricate triangular honeycomb cores. Figure 3. The deformations of the sandwich panel. (a) A cross-section through the center of the panel. (b) The corresponding cross-section obtained by simulation. (c) An inclined view of a quarter of the panel. Figure 4. Plan view of the front face after testing and high resolution view of the center revealing the deformation of the face around the core members and the tearing of the face at the node intersections. Figure 5. Plan view of the back face after testing revealing minimal localized deformations around core members around the center. Figure 6. (a) Schematic of a circular panel subject to a spherical blast. (b) Underwater explosion map for spherical blasts with axes of the explosive mass M and stand-off R. Contours of constant peak pressure p
o and decay time 0t are plotted on the map. Also
included are contours of the blast planarity measure for a circular panel of diameter mD 64.0 . The blast investigated experimentally in this study is marked by the solid
circle while the star denotes an equivalent "planar" blast due to a point source. Figure 7. DYSMAS simulation of the propagation of the blast wave generated by a spherical charge at selected times t after the detonation: (a) t=10s, (b) t=20s, (c) t=30s and (d) t=40s. Figure 8. Spatial response profiles in the water at two times t prior to the wave impinging on the panel: (a) pressure and (b) velocity. (c) The temporal characteristics of the pressure wave. Figure 9. The finite element mesh used for simulations. (a) The water column and (b) the front face adjacent to the center of the configuration. Figure 10 (a). Selected eigen-modes for the triangular honeycomb core. (b) The short wavelength geometric imperfection introduced in the core member at the center of symmetry. Figure 11. The equivalent plastic strain distribution of the front face on (a) the wet surface and (b) dry surface.

14
Figure 12. The time variation of the velocities acquired by the front and back faces at the panel center. Figure 13. The propagation sequence of the pressure wave in the water, indicating the reflected wave as well as the formation and expansion of the cavitated regions. The contours signify the pressure, with black being zero (the black domains contain the cavitated water). Note the (blue) region of non-cavitated water attached to the front face has thickness, 15 mm. Figure 14. Comparison of deformed shapes of the monolithic plate subject to two "equivalent" planar uniform water blasts: (a) MPap 3000 and mst 02.00 and (b)
MPap 600 and mst 1.00 .
Figure 15. Comparisons of deformed shapes of the monolithic plate, triangular honeycomb core and doubly corrugated core sandwich panels subject to localized spherical and planar uniform water blasts. Figure 16. Comparisons of reaction force and corresponding transmitted momentum of the monolithic plate, triangular honeycomb core and doubly corrugated core sandwich panels subject to localized spherical and planar uniform water blasts. Figure 17. Schematics of the doubly corrugated core sandwich panel and its unit cell. The dimensions used in the simulation model are indicated.

15
Figure 1. (a) The configuration used for the paddle wheel test. (b) The triangular honeycomb sandwich panel used for the measurements (the front face sheet is not shown).

16
Figure 2. Cutting, bending and assembling operations used to fabricate triangular honeycomb cores.

17
Figure 3. The deformations of the sandwich panel. (a) A cross-section through the center of the panel. (b) The corresponding cross-section obtained by simulation. (c) An inclined view of a quarter of the panel.

18
Figure 4. Plan view of the front face after testing and high resolution view of the center revealing the deformation of the face around the core members and the tearing of the face at the node intersections.
Figure 5. Plan view of the back face after testing revealing minimal localized deformations around core members around the center.

19
Figure 6. (a) Schematic of a circular panel subject to a spherical blast. (b) Underwater explosion map for spherical blasts with axes of the explosive mass M and stand-off R. Contours of constant peak pressure p
o and decay time 0t are plotted on the map. Also
included are contours of the blast planarity measure for a circular panel of diameter mD 64.0 . The blast investigated experimentally in this study is marked by the solid
circle while the star denotes an equivalent "planar" blast due to a point source.

20
Figure 7. DYSMAS simulation of the propagation of the blast wave generated by a spherical charge at selected times t after the detonation: (a) t=10s, (b) t=20s, (c) t=30s and (d) t=40s.
21
Figure 8. Spatial response profiles in the water at two times t prior to the wave impinging on the panel: (a) pressure and (b) velocity. (c) The temporal characteristics of the pressure wave.

22
Figure 9. The finite element mesh used for simulations. (a) The water column and (b) the front face adjacent to the center of the configuration.

23
Figure 10 (a). Selected eigen-modes for the triangular honeycomb core.
Figure 10 (b). The short wavelength geometric imperfection introduced in the core member at the center of symmetry.
24
Figure 11. The equivalent plastic strain distribution of the front face on (a) the wet surface and (b) dry surface.

25
Figure 12. The time variation of the velocities acquired by the front and back faces at the panel center.

26
Figure 13. The propagation sequence of the pressure wave in the water, indicating the reflected wave as well as the formation and expansion of the cavitated regions. The contours signify the pressure, with black being zero. Hence the black domains contain the cavitated water. Note the (blue) region of non-cavitated water attached to the front face having thickness, 15mm.

27
Figure 14. Comparison of deformed shapes of the monolithic plate subject to two "equivalent" planar uniform water blasts: (a) MPap 3000 and mst 02.00 and (b)
MPap 600 and mst 1.00 .
Figure 15. Comparisons of deformed shapes of the monolithic plate, triangular honeycomb core and doubly corrugated core sandwich panels subject to localized spherical and planar uniform water blasts.
28
Figure 16. Comparisons of reaction force and corresponding transmitted momentum of the monolithic plate, triangular honeycomb core and doubly corrugated core sandwich panels subject to localized spherical and planar uniform water blasts.
29
Figure 17. Schematics of the doubly corrugated core sandwich panel and its unit cell. The dimensions used in the simulation model are indicated.


![Title Properties of electromagnetic wave propagation ... · modes contribute wave propagation along them [4] in a similar manner to localized surface plasmon in metallic photonic](https://img.pdfslide.us/doc/110x75/5f6c5c48041bbf414967cff1/title-properties-of-electromagnetic-wave-propagation-modes-contribute-wave-propagation.jpg)