Embed Size (px)
Citation preview

THE RESIDENTIAL ROOFTOP SOLAR ACCELERATORINSTRUMENT ANALYSISSEPTEMBER 2018

1
Rooftop Solar Accelerator
LAB INSTRUMENT ANALYSIS
SEPTEMBER 2018
DESCRIPTION & GOAL —
To accelerate mass adoption of residential rooftop solar to power 200 million households in
India, through standardized product offering, easy financing, and efficient execution at
scale
SECTOR —
Electricity/Power
PRIVATE FINANCE TARGET —
Commercial equity: private equity and venture capital, debt from banks and NBFCs (non-
banking financial companies)
GEOGRAPHY—
India

2
The Lab identifies, develops, and launches sustainable finance
instruments that can drive billions to a low-carbon economy. It is
comprised of three programs: the Global Innovation Lab for
Climate Finance, the Brasil Innovation Lab for Climate Finance,
and the India Innovation Lab for Green Finance.
AUTHORS AND ACKNOWLEDGEMENTS
The authors of this brief are Divjot Singh, Jolly Sinha and Gireesh Shrimali.
The authors would like to acknowledge the following professionals for their cooperation and valued
contributions including the proponents Aniket Baheti and Karthik Chandrasekar, the working group
members Ashish Kulkarni (E&Y), Guneet Singh (Tata Cleantech), Jayant Prasad (cKers Finance), Divya
Charen and Venkataraman Rajaraman(India Ratings), Pustav Joshi (Shakti Foundation), Piyush Mishra
(AZB Partners) and Simmi Sareen (Loans4SME).
The authors would also like to thank Gireesh Shrimali, Vivek Sen, and Maggie Young for their
continuous advice, support, comments, and internal review, and Angela Pavuk and Tim Varga for
graphic design.
The Lab’s programs have been funded by Bloomberg Philanthropies, the David and Lucile Packard
Foundation, the German Federal Ministry for the Environment, Nature Conservation, and Nuclear
Safety (BMU), the Netherlands Ministry for Foreign Affairs, Oak Foundation, the Rockefeller Foundation,
Shakti Sustainable Energy Foundation, the UK Department for Business, Energy & Industrial Strategy,
and the U.S. Department of State. Climate Policy Initiative serves as Secretariat and analytical
provider.

3
1. CONTEXT
Despite holding vast potential of up to 60 GW of power, the residential rooftop solar
market in India hasn't realized its promise. Barriers include low consumer demand,
limited access to commercial finance for developers, and high costs of customer
acquisition for developers.
To date, India has only achieved 2.5 GW of rooftop solar installations, mostly on commercial
and industrial roofs. In the residential rooftop solar market specifically, there is vast potential
of over 60 GW, but less than 0.5 GW had been installed as of March 2018. (Bridge to India,
2018).
This is due to a number of barriers. On the demand side, there is low customer awareness,
insignificant economic incentives, and perceived performance risks. On the developer side,
there is difficulty in identifying the right customer segments, high customer acquisition costs,
limited access to commercial finance, and long payback periods that often render the
business model unsustainable.
However, a confluence of factors including a renewed push from government, rising grid
tariffs, and declining PV prices are also working in favor of residential solar. The Rooftop Solar
Accelerator (RSA)aims to tap the residential segment in the hitherto uncharted smaller-sized
cities through using analytics to identify and market to the apt customer segments, offering a
lease model to combat high upfront costs for customers, and by standardizing product
offering to achieve operational efficiencies.
2. INSTRUMENT MECHANICS
The Rooftop Solar Accelerator will install solar panels on the rooftops of identified
customer segments. The revenues generated through monthly payments made by its
customers will be used to service loan repayments and meet operational expenses.
The residual cashflows will be either reinvested or returned to equity holders.
The Rooftop Solar Accelerator (RSA) aims to accelerate mass adoption of residential rooftop
solar in India, through standardized product offering, easy financing, and efficient execution
at scale.
By scaling a standard solar leasing model into an untapped market in India, the proponent
company, a project developer called Peacock Solar, will generate revenues through
monthly payments made by its customers. These revenues will be used to service loan
repayments as well as meet operational expenses. The residual cashflows will be either
reinvested or given back to equity shareholders. The Rooftop Solar Accelerator’s interaction
with different stakeholders is depicted in the following graphic.

4
Figure 1: Rooftop Solar Accelerator instrument mechanics
In addition to the leasing model – which is still relatively new to India – this instrument differs
from other attempts to unlock rooftop solar in several important ways:
• It introduces an analytic-driven framework for customer acquisition and credit
evaluation. Data will be leveraged to segment customers on the basis of income
levels, appliance ownership, education, awareness levels, profession etc. Advanced
analytics will uncover early adopters, allow effective communication, raise the
conversion ratios, and lower acquisition costs.
• It will apply a standardized product offering that brings in operational efficiencies to
the leasing model, while making it easier for customers to decide - homeowners will
be presented with only 1 or 2 configurations of system sizing and financing options.
• The entire sales cycle will be managed through a mobile app, which will further ease
the training process and optimize the sales cycles.
3. INNOVATION
The instrument improves upon existing business models of rooftop solar in India through
lease offerings, use of analytics and technology, product standardization and stringent
lease agreements.
3.1 THE INSTRUMENT AIMS TO ADDRESS BARRIERS HINDERING THE ADOPTION
OF ROOFTOP SOLAR IN THE RESIDENTIAL SEGMENT
There are several prominent barriers hindering scale up of rooftop solar for residential
consumers in India that the Rooftop Solar Accelerator would address:
• Low consumer awareness: Grid electricity in the residential segment is subsidized in
India (compared to commercial/industrial segment), and the economic case for
adopting rooftop solar exists only for certain segment of consumers in specific states.

5
Thus the impetus to adopt rooftop solar remains largely missing from consumers’ end.
This instrument addresses this barrier by identifying and marketing to only those
customer segments for which there is an economic case to adopt rooftop solar.
• High upfront costs: One of the biggest barriers to adoption of solar is the high upfront
cost associated with equipment purchase. Consumers are reluctant to incur high
upfront cost given their limited familiarity with the product and the lack of any urgency
in adopting solar. Acquiring a bank loan to fund the purchase is a bureaucratic
process with high interest rates and short tenure, thereby resulting in monthly payments
greater than savings on the electricity bills. This instrument offers a monthly lease model
characterized by easy, mutually agreed upon periodic payments, which will not
require significant upfront payments.
• Operational barriers: Small and upcoming developers are often plagued by
operational inefficiencies such as costly and time-consuming customer acquisition,
slow sales cycles, and high training costs. These tend to drive up their costs multifold.
The RSA model utilizes an analytically-driven customer acquisition framework,
standardized product offering, and mobile sales to overcome these barriers.
• Limited access to commercial finance for a small-scale developer: Accessing private
finance, especially debt, is a challenge for any young company in India. To provide
comfort to debt financiers, the instrument reduces the loan payback period to 3-5
years (even if the tenure of the lease with customers is longer). In addition, third-party
credit assessment of off-takers and stringent lease agreements, such as 24x7 access to
terrace to ensure asset recovery in case of payment default, will further reduce
default rates.
3.2 A COMPARISON WITH THE EXISTING BUSINESS MODELS
In India, the residential rooftop solar segment based on business operations can be divided
into various business models:
• The Capital Expenditure (CAPEX) model, wherein the user of the rooftop owns
the assets, consisting primarily of solar panels. The upfront cost may be paid via
own capital or through bank borrowings.
• The Renewable Energy Service Company (RESCO) model, or the Operational
Expenditure (OPEX) model, wherein the assets are owned by developers or
third-party investors, and installed at the customers’ premise. The customer
typically pays a pre-determined price per unit generated as defined in the
Power Purchasing Agreement (PPA) over a pre-specified period of time,
normally 15 to 20 years.
• Hybrid models, whereby customers lease systems from developers for a certain
period of time, after which they buy back the system at a pre-specified price.
This reduces the risk for developers and financiers, and is an attractive option for
users since they are able to own the assets but aren’t required to pay the entire
sum upfront. However, it hasn’t yet taken off at scale in India, due to legal
complications associated with ownership transfer and difficulty in risk
assessment in such a business model.
The table below expounds on the value proposition offered by RSA with respect to other
competitors in the market. We have compared the RSA model with that of a general CAPEX
model, OPEX PPA model, and other hybrid models in the market.

6
Table 1: How RSA differentiates itself from existing business models
ISSUES WITH EXISTING MODELS RSA’s DIFFERENTIATION
OP
EX
(P
PA
) M
OD
EL
Developers have limited access to
finance due to financiers’ discomfort
around risk of default and asset
recovery.
➢ Stringent lease agreements, such as a
clause on 24x7 access to terrace to
recover asset in case of default, to
provide comfort to debt funders.
➢ Third-party credit assessment of off-takers
to lower default rates.
➢ Reduced payback period of 3-5 years for
loan repayment even if lease tenure with
customer is longer.
➢ Unlike traditional PPA model, RSA’s
offering has a fixed monthly payout,
implying predictable cash outflows for
homeowners.
CA
PEX
MO
DEL
High upfront cost of installing rooftop
solar.
➢ Centralized monthly payouts instead of
high one-time installation costs. There will
be electricity bill savings from day 1.
➢ Centralized procurement to enable
economies of scale for distributed systems.
ALL
BU
SIN
ESS M
OD
ELS
(C
AP
EX
+ O
PEX
)
Inefficient operations such as slow
sales cycle, duplication in marketing
efforts and training render the business
unprofitable.
➢ Tech enabled operations and lease
management for cost transparency and
efficiency.
➢ Standardized agreements (in terms of
system configuration and lease pricing)
enable simpler training/sales.
High cost of marketing and
maintenance on a per unit basis
➢ Comprehensive data analysis aims at
learning customer behavior and improve
customer acquisition at every sales
interaction.
➢ All distributed systems to be wifi monitored
for remote performance management,
proactive defect reduction, which will
result in lower O&M costs.
3.3 CHALLENGES TO INSTRUMENT SUCCESS
The idea faces several challenges in terms of actionability and financial sustainability. The
feasibility of this idea is yet to be tested as the planned test phase (pre-pilot phase) is not yet
complete and the proponent is currently conducting on-ground market research through
surveys and interviews to finalize on the strategy.
Further, even though the model per se is self-sustainable, revenue generation would depend
on the success of the idea in terms of price realization and default rates. Additionally, scaling
up can be impacted by the availability and timing of capital, which is usually difficult to
come by for small/upcoming developers.

7
Lastly, while the use of data analytics and technological solutions may reduce costs and
unlock new opportunities, it also poses threats in terms of data privacy and security. Over
time, as copious amounts of data is gathered, there is a cost involved in ensuring its
protection (Renewable Watch, 2018).
To ensure the proponent is able to successfully face these challenges, there is a continuous
need to evolve the business model and tweak its strategy based on the level of success of its
operations.
MARKET TEST AND BEYOND
4. IMPLEMENTATION PATHWAY AND REPLICATION
The proponent – Peacock Solar – will initially test this instrument by installing 20 projects
by the end of 2018 in Kota, after which the company plans to perform a larger-scale
pilot of ~250 projects, spread across multiple cities.
4.1 SCOPE AND GEOGRAPHY
The proponent has chosen to venture into hitherto untapped smaller cities in India due to
higher availability of owned, independent houses with off-takers possessing terrace rights.
Criteria such as normalized electricity tariffs, state net metering policies, population density,
digital penetration, among other factors, were used to screen states and cities for the pilot
implementation. The cities that have been shortlisted are Kota, Nagpur, Jaipur, and Jodhpur.
After further analysis, Kota (Rajasthan) has been chosen for pilot. Within the target
geographies, potential customers will be evaluated on parameters such as income levels,
home appliance profiles, electricity usage, home ownership, among others.
Figure 2: Key customer selection criteria
Targ
et
Cu
sto
me
rs
Income LevelsHousehold income 70k-300k p.m. for easy EMI
payments
Home Appliance Profile
Early adopters will be using latest gadgets
and equipment
Risk ProfileHas a good CIBIL score and qualifies for a bank
loan
Electricity Usage Profile
Consuming 500-1000 units per month
Home OwnershipCustomer must be the
owner of the roof
Lease ReadinessOpen to the concept
of lease/ PayGo
8
4.2 THE TEAM
The proponent of this idea is Peacock Solar, a developer with presence in Kota, Nagpur,
Jodhpur, Maharashtra and Uttar Pradesh. Peacock’s team consists of 7 staff, each holding
responsibility for key business functions. Their team includes: i) Aniket Baheti – An IIT Madras
and ISB, Hyderabad alumnus, Aniket has been engaged in India’s solar sector since 2010
with the advent of Jawaharlal National Solar mission. He managed India’s first private
100MW solar park in Jaisalmer and helped Govt. of Rajasthan frame its solar policy in 2011.
ii) Hardik Jain – An IIT Kanpur & IIM Bangalore alumnus, Hardik brings in deep technology
experience working multinational companies. He manages data analytics and technology
development at Peacock Solar.
In addition, since Peacock Solar is incubated by Sangam Ventures, it is currently availing
accounting & finance services from Sangam’s finance team.
4.3 TEST AND PILOT
To test out its service and to collect/analyze consumer behavioral data, the proponent will
first install around 20 projects of 5 KW each in Kota by the end of 2018. Learnings from the
test of these 20 installations will be used to build data models, develop the prototype
customer profile, and fine tune the strategy for future operations.
After the test phase is finished, the proponent aims to install close to 250 projects by the
second quarter of 2019, as part of the pilot. To scale up rapidly, the proponent plans to
standardize product offerings and configurations to ease the decision making for uptake.
The total capital required for the pilot will be in excess of US$1 million, which will be a
combination of debt and equity that the proponent plans to raise from VC (Venture Capital)
firms, banks, and NBFCs (non-banking financial corporations).
In addition, the proponent seeks the support of philanthropic capital. Although the idea is
predicated on self-sustenance, philanthropic support during the initial stages can be
extremely useful in crowding-in commercial investment. Such capital can be in the form of
junior equity to provide downside protection to commercial equity investors or a credit
guarantee to partially cover for defaults and instill confidence in debt investors, or project
preparation support to fund activities related to market research and credit assessment.
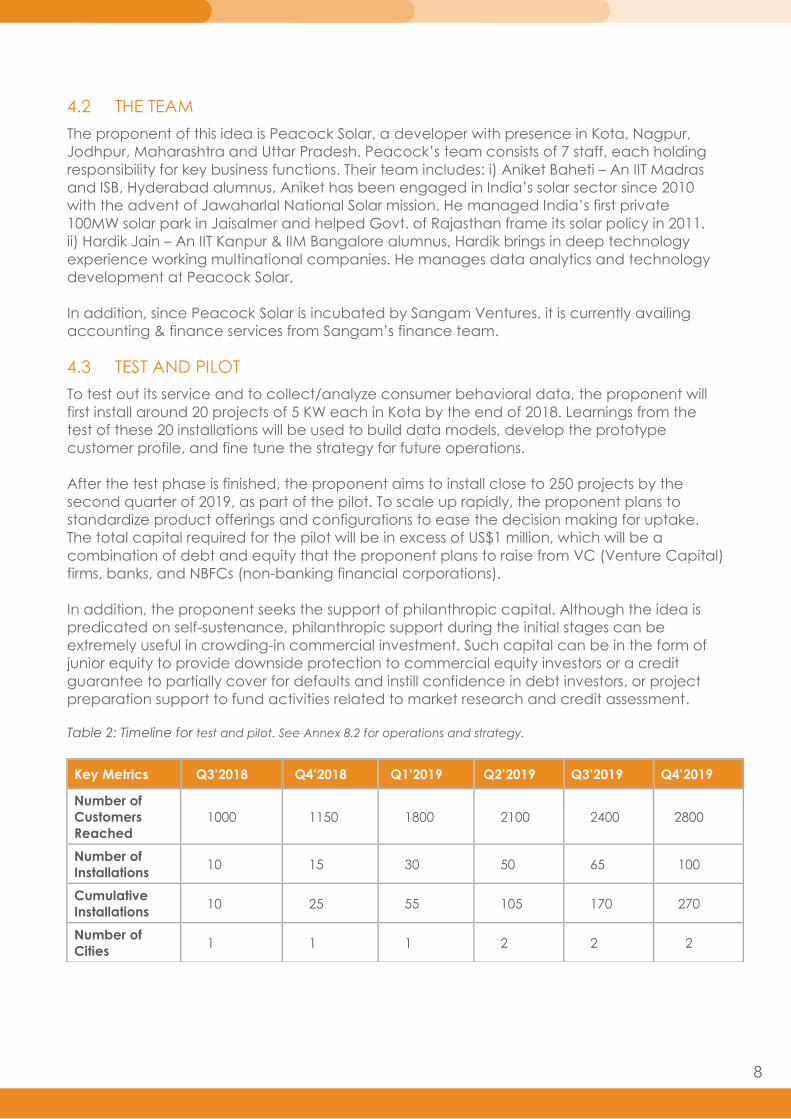
Table 2: Timeline for test and pilot. See Annex 8.2 for operations and strategy.
Key Metrics Q3’2018 Q4’2018 Q1’2019 Q2’2019 Q3’2019 Q4’2019
Number of
Customers
Reached
1000 1150 1800 2100 2400 2800
Number of
Installations 10 15 30 50 65 100
Cumulative
Installations 10 25 55 105 170 270
Number of
Cities 1 1 1 2 2 2

9
Figure 3: Timeline for operations and strategy
5. IMPACT
If successful, the idea can mobilize capital worth US$ 75 million by 2022. In case this
business model sets a precedent for other companies to replicate, the total capital
mobilized can be as high as US$ 380 million, while abating 640,000 tons of CO2, by
2022. This represents 500 MW of installed capacity.
5.1 QUANTITATIVE MODELLING
The Lab Secretariat has built a cash flow model based on a representative capital structure
and the pricing Peacock Solar is likely to pursue in its pilot. For the following assumptions, the
returns yielded come out to be 12.7% at the project level and 13.9% at the equity level.
Table 3: Internal rate return (IRR) model
Parameter Details
Monthly Payment Amount INR 3375 (or INR 675/kW)
Tenure of Lease 15 years
Typical Project Size 5 kW
Security Deposit INR 25000 (or INR 5000/ kW)
Capital Structure 70% Equity, 30% Debt
Cost of Debt 12%
Loan Payback Period 5 Years
Project IRR (Internal Rate of Return) 12.7%
Equity IRR 13.9%

10
The Lab Secretariat is also of a view that there is a compelling case for utilization of
philanthropic capital given the instrument’s potential for high impact as it reaches pilot,
and then scales up. Philanthropic capital could speed this process by crowding in
commercial capital; allocating a small proportion of concessional capital (supported by
a donor/philanthropic entity) to the overall pool of capital can boost the returns for
common shareholders. This can have a strong catalytic effect, whereby a commercial
investor who previously might not be sure of investing may now see this as a very
attractive investment opportunity.
Table 4: Effect of concessional equity on common shareholder returns
Capital Structure 70% Equity, 30% Debt
Proportion of
Concessional Equity (in
the overall capital
structure)
0% 10% 15%
Equity IRR 13.9% 16.1% 17.8%
Incremental IRR - 2.2% 3.9%
Capital Structure 60% Equity, 40% Debt
Proportion of
Concessional Equity (in
the overall capital
structure)
0% 10% 15%
Equity IRR 14.0% 16.6% 18.5%
Incremental IRR - 2.6% 4.5%
For instance, our analyses show that a 10% contribution of concessional equity can raise the
returns for common shareholders by 200 to 300 basis points. In case concessional equity’s
contribution rises to 15%, the incremental returns for common shareholders can jump by 350
to 450 basis points.
The concessional equity’s returns are capped at 3% - that is, anything in excess of 3% are
distributed to common shareholders, thereby raising their returns disproportionately. In case
of negative cash flows in a particular year, the returns are shared between common equity
and junior equity in the proportion of their contribution to the overall capital.
Since there is uncertainty regarding the capital structure at the time of pilot, we have
computed the figures for multiple cases: the first one with equity constituting 70% of the total
capital, while the second one with equity accounting for 60% of the capital. Given that
Peacock Solar is still a startup and may not be able to access debt as easily as a mature
company, we have generally assumed equity will play a more significant role than usual, at
least till the pilot (compared to utility-scale projects, where equity’s contribution may be as
low as 25%).
5.2 ENVIRONMENTAL AND SOCIAL IMPACT
As highlighted in Section 4.2, the proponent plans to install 250 projects of 5 KW each during
the pilot. This would mobilize US$ 1 million for clean energy and save up to 1600 tons of CO2
per year.

11
The impact can be much higher in case the company becomes successful and is able to
scale up. Table 5 summarizes these impacts. For the purposes of computation, we have
assumed Peacock Solar will eventually be able to achieve 100 MW of installations at scale, if
successful, which would abate 130,000 tons of CO2. In case the proponent’s business model
sets a precedent for other companies to replicate, the impact can be even higher. We
assume companies having business models similar to that of Peacock Solar would account
for 500 MW of installed capacity by 2022, enough to power 100,000 homes, abating 640,000
tons of CO2 which is roughly equivalent to the carbon footprint of a small town in India with a
population of 350,000.
Achieving 20 GW of India’s residential rooftop solar policy targets by 2022 is pivotal not just to
meet the targets set in the Paris Agreement, but also for job creation. A report by Council On
Energy, Environment and Water (CEEW) estimates that the rooftop solar segment generates
seven times more jobs compared to the utility-scale segment, on a per MW basis. The
proponent’s business model, when replicated, can thus create as many as 12,500 jobs
annually.
Table 5: Environmental impact of the project
Pilot phase At Scale Replication
No. of households 250 20,000 100,000
Average project size (in KW) 5 5 5
Total Capacity (in MW) 1.25 100 500
Capital Mobilized (in USD
Millions) 1 75 380
Jobs created (job-years) 31 2500 12500
CO2 abated (tons per year) 1600 130,000 640,000
Assumptions: 1. Reduction of CO2 emission per 1 kWh of solar power = 1 kg of CO2. Please note that the above
calculation considers only the reduction in CO2 emissions for the electricity generated from a solar power plant
vs. a coal plant and does not take into account CO2 from other parts of the value chain. 2. Rooftop Solar
generates 25 FTE per MW. 3. Capital mobilized per KW= INR 50,000. Source: Solar Mango, CEEW, MNRE

12
6. KEY TAKEAWAYS
As highlighted previously, barriers such as high upfront costs for customers, challenges in
identifying the right customers, limited access to commercial finance for developers, etc.
have limited the adoption of rooftop solar in the residential segment. This instrument
improves upon current business models for rooftop solar to address some or all of these
barriers.
• Innovative: The idea introduces a successful business model in other countries, solar
leasing, to India and also improves upon it for the Indian context through
standardization and leveraging data.
• Financially Sustainable: The business model is predicated on self-sustenance.
Philanthropic support is only required during the test/pilot phase to cushion any
unexpected losses and to incentivize commercial investment participation.
• Catalytic: If successful, the company can attract commercial capital that
otherwise would not have flowed to the sector. Additionally, success of this idea
can showcase demonstration and be replicated by other companies, which can
further scale up the sector.
• Actionable: The proponent, Peacock Solar is a committed entity, and is backed by
Sangam Ventures. The proponent has outlined a clear implementation pathway,
as highlighted in the previous sections.

13
7. REFERENCES
Residential Rooftop Solar Potential
http://cdn.cseindia.org/attachments/0.07765900_1531131144_Going-Solar-Gurugram-solar-rooftop-
action-plan.pdf
https://solarrooftop.gov.in/notification/Notification-08112016903.pdf
Mytrah Energy, Suzlon Energy, (2018, July). Digitizing Operations. Renewable Watch, 8(9), 28-28.
http://www.solarmango.com/in/tools/co2-emission-reduction-results/
https://www.ceew.in/focus-areas/renewables?page=1
https://www.downtoearth.org.in/news/rooftop-solar-power-s-massive-job-potential-untapped-60563
Bridge to India. (2018). India Solar rooftop map. Retrieved from:
http://www.bridgetoindia.com/wp-content/uploads/2018/08/india-solar-rooftop-map-_-March-2018-
1.pdf
CPI Scaling-up-Rooftop-Solar-Power-in-India-The-Potential-of-Solar-Municipal-Bonds. Retrieved from
https://climatepolicyinitiative.org/wp-content/uploads/2018/02/Scaling-up-Rooftop-Solar-Power-in-
India-The-Potential-of-Solar-Municipal-Bonds.pdf
Carbon Brief: Guest post: Why India’s CO2 emissions grew strongly in 2017
https://www.carbonbrief.org/guest-post-why-indias-co2-emissions-grew-strongly-in-2017
CEEW (2018) Scaling rooftop solar. Retrieved from
http://www.ceew.in/sites/default/files/CEEW-Scaling-rooftop-solar-Report-20Jul18.pdf

14
8. ANNEX
8.1 ALTERNATIVE COMPANY STRUCTURE
As Peacock Solar’s scale grows, there is a possibility that the company might be split into 2
distinct entities: a Management Company (Mgmt Co) and an Operating Company (OpCo),
with the former being the holding company of the latter.
The rationale for such a move is to ensure that lease payments collected by the OpCo first
go towards servicing the loans provided by debt financiers. Such a hierarchy of cash flows
would instill confidence in debt financiers, and encourages debt funding. Accessing
commercial debt is a challenge for any young company in India, irrespective of the sector.
The residual cash flows will be paid back to the Mgmt Co via dividends, given that Mgmt Co
is the holding company. The equity infusions in Peacock Solar will channeled through the
Mgmt Co.
Such a structure is not suitable for initial stages of company’s operations given that equity
is likely to play a more significant role. Moreover, such a structure may invite double
taxation, first at the OpCo level and then at the Mgmt Co level, and therefore Peacock
Solar will assess the viability of this structure at a later stage.

15
8.2 OPERATIONS AND STRATEGY
Annex Table 1: Timeline for key activities
Activities Q3’2018 Q4’2018 Q1’2019 Q2’2019 Q3’2019 Q4’2019
Data
Analytics
Collect
household
level data
(surveys,
customer
interactions)
-Analyze
household
level data.
-Test credit
evaluation
model
-Improvise
credit
evaluation
model.
-Test
marketing
campaigns
in new city.
Improvise
Credit
evaluation
model
Analyze
generation
data and
optimize
system
configuratio
n
Analyze
marketing
campaign
success in 2
cities
Marketing
Identify &
deploy
marketing
campaigns
Test
efficiency
of
marketing
campaigns
Test
efficacy of
communic
ation
channels
(online,
offline).
-Deploy
marketing
campaigns
in new city
Optimize
marketing
campaigns
in both
cities
Optimize
marketing
campaigns
in both cities
Optimize
marketing
campaigns
in both
cities
Funding
Seed equity
funding
Begin
equity
fund-raise
for 250
installations
Secure
equity
funding for
250
installations
Refinance
debt once
100+
customers
are
achieved
Begin
equity
fund-raise
for 2500
installations
Growth
Begin
operations
in 1 city
Achieve
rapid
growth in
customers
reached
and
installations
per quarter
Maintain
growth for
the 1st city
and begin
soft launch
in 2nd city
Achieve
consistent
growth rate
in key
metrics
Maintain
growth rate
of key
metrics
Maintain
growth rate
in
Customers
reached
and
installations
per quarter