Embed Size (px)
Citation preview

The research program of the Center for Economic Studies produces a widerange of theoretical and empirical economic analyses that serve to improve thestatistical programs of the U.S. Bureau of the Census. Many of these analysestake the form of research papers. The purpose of the Discussion Papers is tocirculate intermediate and final results of this research among interestedreaders within and outside the Census Bureau. The opinions and conclusionsexpressed in the papers are those of the authors and do not necessarily representthose of the U.S. Bureau of the Census. All papers are screened to ensure thatthey do not disclose confidential information. Persons who wish to obtain a copyof the paper, submit comments about the paper, or obtain general informationabout the series should contact Sang V. Nguyen, Editor, Discussion Papers, Centerfor Economic Studies, Room 1587, FB 3, U.S. Bureau of the Census, Washington, DC20233-6300, (301-763-2065).
THE CLASSIFICATION OF MANUFACTURINGINDUSTRIES: AN INPUT-BASED
CLUSTERING OF ACTIVITY
by
Thomas A. Abbott*Stephen H. Andrews**
CES 90-7 August 1990

Abstract
The classification and aggregation of manufacturing data is vitalfor the analysis and reporting of economic activity. Mostorganizations and researchers use the Standard IndustrialClassification (SIC) system for this purpose. This is, however,not the only option. Our paper examines an alternativeclassification based on clustering activity using productiontechnologies. While this approach yields results which are similarto the SIC, there are important differences between the twoclassifications in terms of the specific industrial categories andthe amount of information lost through aggregation.
Keywords
Industrial aggregation, SIC, manufacturing data
*Rutgers University **Bureau of the Census, Washington, D.C.


For example, the 1982 Census of Manufactures contains information on1
almost 100 different data items for over 348,000 individual establishments.
2
I. Introduction
The classification and grouping of manufacturing activity is an
important component of any program designed to examine and report
statistics on economic activity because of the overriding need to
organize and condense the vast amounts of information currently
collected. The appropriate method of selecting a smaller, more1
manageable, subset of data depends on the objectives of the
particular analysis. One method of reducing the size of the data
set is through random selection of the detailed records. This
method provides a representative sample that can be used to
estimate the population characteristics. This approach is
frequently used for studies which focus on the broad impact of
policy or environmental changes on manufacturing as a whole. A
second method is to limit the analysis to specifically selected
"like-units," such as industry groups or geographical regions.
This approach is typically used for more narrowly defined studies
of the impact of policy or environmental changes within specific
industries or states. A third alternative is to aggregate "like-
units" into a single observation. This approach is frequently used
to study the differential impacts of changes in the environment
across the different firms, industries, or states.
In the latter two cases, it is necessary to develop a hierarchial

Within the Standard Industrial Classification, different principles are2
used to determine the similarity of industries and products in differentsections. For example, in some instances, industries are grouped on the basisof the production process (hot versus cold rolled steel) while in other instancesmaterials consumed (cane versus beet sugar) or even end uses (hospital versusoffice furniture) are used. The use of these multiple principles results inindustry definitions which may overlap, are either over- or under-inclusive withrespect to a particular application, and frequent establishment-industry codeswitches.
3
structure for organizing the detailed data into different groups
for either selection or aggregation. Such a structure should be
designed to maximize the informational content of the relevant
grouped data while providing increased manageability. In keeping
with this principle, information which is most similar should be
grouped first, while information which is least similar should only
be grouped as a last resort. This principle of grouping like data
first applies whether one is aggregating data items within a single
reporting unit (such as aggregating various expenditures on
materials or energy) or aggregating over reporting units (such as
aggregating establishments' sales to form firm or industry totals).
Unfortunately, the key question, "How does one measure the
similarity between the different data items or reporting units?"
can only be answered in the context of a particular application.
In an earlier paper, Andrews-Abbott (1988), we discussed the
principles used in constructing the Standard Industrial
Classification (SIC) and some of the problems resulting from a
classification with such diverse objectives. We also discussed2
several alternatives to the SIC for classifying industrial

4
activity. Each alternative was based on a single principle of
classification and geared towards a specific application of the
data, such as marketing analysis, productivity analysis or
financial analysis. This paper extends our earlier analysis by
developing a classification using one of the alternatives
discussed, the production technology classification.
Starting with a sample of establishment-level data from the 1982
Census of Manufactures classified by the 449 manufacturing 4-digit
SIC industries, we examine the feasibility of using clustering
methods to develop higher levels of aggregation based on the
underlying production technologies. In principle, this type of
classification may be used to analyze supply side issues such as:
examining resource allocation, constraints and competition;
measuring technological proximity, progress and spillovers; and
forecasting production and substitution possibilities. Moreover,
the widespread use of the aggregated manufacturing data provided by
the Census Bureau and the availability of the establishment-level
microdata made this a natural first step in developing alternative
classifications.
Assuming that the production technology can be described by a
vector of inputs, one measure of the technological proximity
between any two industries is the distance between their respective
input share vectors, as discussed in Andrews and Abbott. This

5
measure of proximity may subsequently be used to form successively
higher levels of aggregation while preserving as much of the
variation in the original data. Our analysis clusters the existing
4-digit SIC industries into "pseudo-3-digit" industry groups and
"pseudo-2-digit" major industrial groups using these measures of
technological distance. Our results show that, although the SIC is
reasonably efficient in retaining the factor input information,
there are a number of important differences between the SIC and
this new classification which result in significantly less
information loss.
Overall, we find that clustering industries on the basis of
production technology provides an interesting and promising avenue
for future analysis. It raises several key issues about how the
current SIC is structured, and what principles should be used to
derive the classification. In addition, it provides specific
recommendations for how industrial data might be structured in the
future to facilitate productivity and technological analysis.
The remainder of the paper is organized as follows. Section two
discusses theoretical basis for using input vectors to define
production technologies. Section three discusses the methodology
used to cluster the industry data. Section four discusses the
empirical results and compares our new classification to the
existing SIC. The final section discusses conclusions and
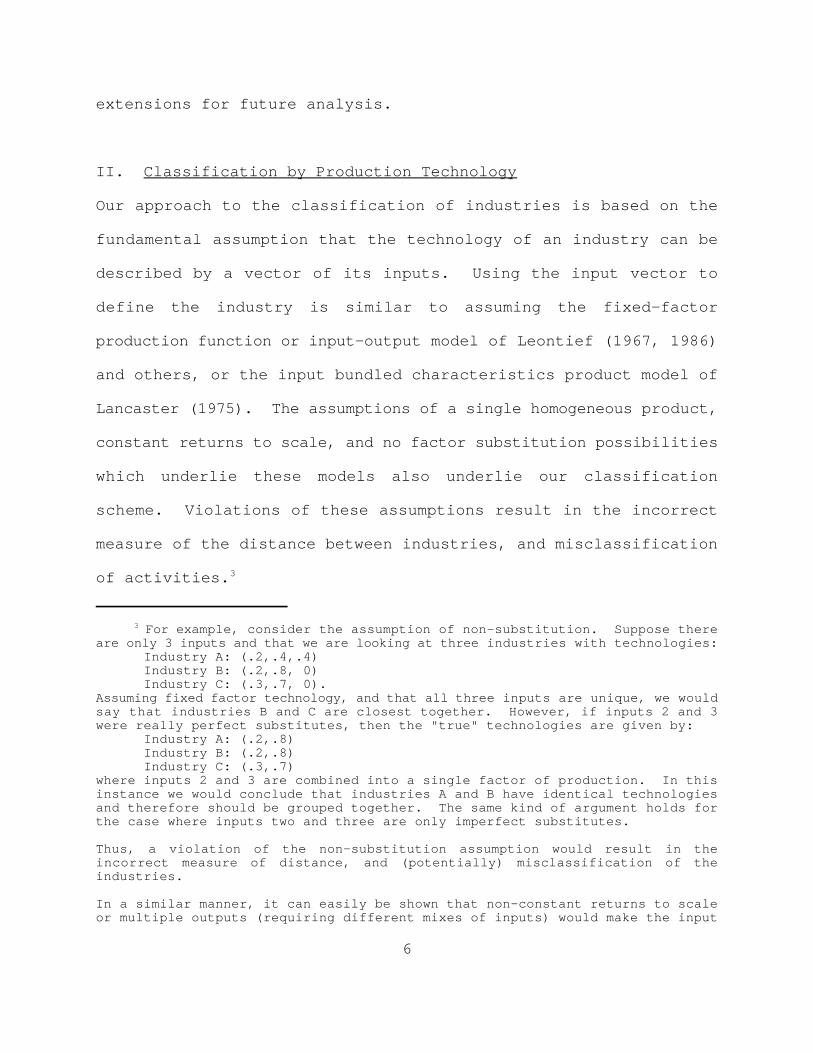
For example, consider the assumption of non-substitution. Suppose there3
are only 3 inputs and that we are looking at three industries with technologies:Industry A: (.2,.4,.4)Industry B: (.2,.8, 0)Industry C: (.3,.7, 0).
Assuming fixed factor technology, and that all three inputs are unique, we wouldsay that industries B and C are closest together. However, if inputs 2 and 3were really perfect substitutes, then the "true" technologies are given by:
Industry A: (.2,.8)Industry B: (.2,.8)Industry C: (.3,.7)
where inputs 2 and 3 are combined into a single factor of production. In thisinstance we would conclude that industries A and B have identical technologiesand therefore should be grouped together. The same kind of argument holds forthe case where inputs two and three are only imperfect substitutes.
Thus, a violation of the non-substitution assumption would result in theincorrect measure of distance, and (potentially) misclassification of theindustries.
In a similar manner, it can easily be shown that non-constant returns to scaleor multiple outputs (requiring different mixes of inputs) would make the input
6
extensions for future analysis.
II. Classification by Production Technology
Our approach to the classification of industries is based on the
fundamental assumption that the technology of an industry can be
described by a vector of its inputs. Using the input vector to
define the industry is similar to assuming the fixed-factor
production function or input-output model of Leontief (1967, 1986)
and others, or the input bundled characteristics product model of
Lancaster (1975). The assumptions of a single homogeneous product,
constant returns to scale, and no factor substitution possibilities
which underlie these models also underlie our classification
scheme. Violations of these assumptions result in the incorrect
measure of the distance between industries, and misclassification
of activities.3

share vectors unstable measures of the underlying technologies (given that theywould depend on either the scale of production or mix of outputs) and result inpotential misclassification.
The clustering of the 5-digit product classes used the input cost shares4
of: production workers salaries and wages; other workers salaries and wages;purchased fuels; purchased electricity; purchased services; agriculturalmaterials; mineral materials; non-durable goods materials; durable goodsmaterials; and capital (measured as the residual) as provided by Gollop-Monahan(1986).
If the inputs are measured at too aggregated a level (i.e. if they are5
heterogeneous) then misclassification will result. To illustrate this, we cansimply reverse the example in footnote 4. Suppose inputs 2 and 3 are incorrectlyaggregated, we would conclude that industries A and B are closer together (andin fact identical) and group them, rather than grouping industries B and Ctogether first.
7
The implementation of the production technology clustering
methodology requires a comprehensive list of the inputs used to
manufacture each product. The choice of the 4-digit SIC industry
level resulted from our early attempts to cluster the 1,657 5-digit
product classes into meaningful industries using vectors of ten
input shares to define each technology. This analysis failed4
because, in addition to the aforementioned assumptions, the
clustering methodology also requires homogeneity of each of the
inputs. From these initial results, we concluded that we needed5
(a) more detailed input data and (b) a more identifiable and
manageable level of activity. Both of these objectives could be
addressed by examining the 4-digit SIC industries.
The results presented here are based on an analysis of the 4-digit
SIC industries, using 29 different classes of material input costs
based on the detailed (6-digit code) materials consumed data

The use of the existing SIC to define the material inputs probably biases6
our results towards clusters which resemble the existing SIC. The extent of thisbias is, however, unknown and does not appear to be a significant problem whenexamining the results in Appendix I, that is, one finds some major differencesbetween the SIC and our classification.
All establishments in the LRD are classified using the 1972 SIC; which7
later underwent minor revisions in 1977. An establishment is defined asoperations, generally in one physical location performing a distinct economicactivity.
These sampling restrictions were used to insure that all materials inputs8
consumed by the establishment were used to produce output for that specificindustry, and avoid potential contamination from diversification in production.Such diversification in production may indicate a failure in the currentdefinition of the industry, but such an examination is beyond the scope of thecurrent study.
8
aggregated to the 2-digit SIC major group level. Unfortunately,6
similarly detailed information on specific types of labor, energy,
and capital were not readily available for our analysis and had to
be omitted. A complete list of inputs used in our analysis is
provided in Table 1.
The materials input cost data were constructed using the
Longitudinal Research Data Base (LRD) described in McGuckin and
Pascoe (1988) for the year 1982. The LRD contains input and output
data on manufacturing establishments surveyed in the Census
Bureau's annual surveys and censuses of manufactures. We chose7
1982 because it is the most recent year in which a census of all
manufacturing establishments is available. In constructing the
data, we chose establishments that (a) produced at least 95 percent
of their output within one 4-digit SIC industry and (b) reported
detailed cost of materials. Within each industry, we calculated8
total cost of materials (excluding materials, not specified by

Given that the basic data is at the establishment level, one has two9
options for constructing an "industry" input vector. One could aggregate thedata first, and then compute the share vector; or one could compute the sharevectors first, and then average them. Because the latter method places equalweight on all establishments (rather than weighting by their relative size) itis more likely to be sensitive to outlying observations. Thus we have chosen touse the former method for this analysis.
We initially identified over 170,000 establishments whose output was 9510
percent or higher within one industry, but approximately 100,000 plants did notreport detailed material costs. In addition, we also found ten industries whereno detailed materials was collected from the establishments.
A data appendix consisting of the material input share vector for each11
4-digit industry is available upon request from the authors subject to disclosurereview.
9
kind) and the cost of each of the 29 material categories. The cost
share of each material input was calculated as its share of the
computed total cost described above. Our sample consists of over9
70,000 establishments covering 439 different 4-digit SIC
industries.10
Implicit in defining the production technology using cost shares is
the assumption that there is no factor substitution (as discussed
above). This implies that the material input factors of production
form an orthogonal basis for a 29 dimensional space and that each
industry can be uniquely represented by a single vector in this
space. Because the vectors represent factor shares for each
industry, they are restricted to lie on the unit simplex (that is,
sum to one) and the distance between any two industries can be
defined as the Euclidean distance between the vectors on this
simplex.11

The variance-covariance matrix also revealed that some inputs are12
strongly correlated; this, however, does not necessarily imply that factorsubstitution is possible.
For a discussion of clustering see, for example, Hartigan (1975),13
Anderberg (1973), Aldenderfer and Blashfield (1984), and Fisher (1969).
10
If the factor substitution assumption is violated, the input
factors are not orthogonal and the Euclidean distance does not
accurately measure the distance between industries. Moreover, it
is possible that all of the observations could lie in a sub-space
of the 29-dimensions in which case the vector representations are
not unique. A check of the eigenvalues of the variance/covariance
matrix of the factor inputs reveals that there are no exact linear
combinations among the factor inputs and all inputs are needed to
span the space. This implies that the industry vector
representations are unique.12
III. Clustering Methodology
In implementing the technology based classification, it is
necessary to choose a statistical method for forming groups or
clusters for the aggregation. There are several hierarchical
methods discussed in the literature and available through the SAS
statistical package CLUSTER procedure. These methods include13
Average Linkage, the Centroid Method, and Ward's Method. The
clustering methods differ primarily in how the distance between

11
clusters is measured to determine which clusters are joined at
successive stages of the analysis. For our preliminary analysis of
the 4-digit SIC industries, we have chosen Ward's Method (1963)
because of the ease in computation and interpretation of the
distance function. Subsequent analysis will focus on comparing the
resulting classifications based on other algorithms.
In Ward's minimum-variance method, the distance between any two
clusters is defined as:
D = || X - X || /(1/N +1/N )KL K L K L2
where x is the mean input vector for cluster JJ
N is the number of industries in cluster JJ
and || || denotes the Euclidean distance function.
At each step of the aggregation, the two clusters closest together
are combined to form a new cluster for the next higher level of
aggregation.
This procedure minimizes the within cluster sum of squared
deviations while maintaining the hierarchical structure of the
data, that is, once two industries are put into the same cluster
they remain together at all higher levels of aggregation. The
percentage information lost due to aggregation can be measured by
the ratio of the sum of squared distances from the cluster means,

As discussed earlier, ten of the 4-digit industries did not have detailed14
materials data and had to be dropped from our analysis.
12
that is, the within variance in an analysis of variance (ANOVA)
decomposition, to the total sum of squares. From this, a measure
of R can be constructed to represent the percentage of the2
information remaining in the aggregated data, as defined by:
R = 1 - (P /T)2G
where T = 3 ||x - x|| i i2
W = 3 ||x - x || k i ,Ck i k2
P = 3 W , where summation is over the G clusters at theG g g
Gth level of the hierarchy. Our empirical results show that our
clustering approach retains significantly more variation than the
current SIC classification for comparable levels of aggregation.
IV. Empirical Results
Using Ward's Method, we have grouped 439 4-digit industries into
143 new pseudo-3-digit (PS3) clusters and 20 new pseudo-2-digit
(PS2) clusters. These clusters were chosen to be comparable in14
number (but not necessarily composition) to the existing 2- and 3-
digit groupings used in the 1982 Census of Manufactures. In this
section, we discuss the similarities and differences between the
two classifications.

13
As a first cut, the SIC divides manufacturing into ten non-durable
2-digit major groups, and ten durable major groups. In this
alternative classification, those 4-digit SIC industries classified
as non-durable goods are primarily found in the first 12 of our PS2
clusters while the durable goods industries tend to be found in the
remaining eight clusters, as shown in Table 2.
A more detailed of this comparison can be found in Table 3, which
provides a frequency distribution of the 4-digit SIC industries
across both the 2-digit SIC and PS2 clusters. As can be seen from
this table, the new PS2 clusters have a strong resemblance to the
existing 2-digit SIC Major Groups, that is many of the 4-digit SIC
industries within the same 2-digit group remain together under the
new classification.
Examining these PS2 clusters in more detail, as found in
Appendix I, we find that the first PS2 cluster consists of 14 4-
digit industries which are predominately food-related (SIC 20),
although Tobacco Stemming and Redrying Products (SIC 2141) and
Broad Woven Cotton Mills (SIC 2211) are also included. This
cluster can be further broken down into five PS3 clusters, three of
which contain only one 4-digit SIC indicating that at this level
(143 clusters) no other industries were closely related. The
average primary material cost shares for this PS2 cluster, shown in
Table 4, are 85 percent Agricultural Food Crops (SIC 01), 6 percent

14
in Food Processing (SIC 20), and 2 percent in Fabricated Metal
Products (SIC 34). Thus, these industries appear to be closely
tied to the agricultural sector for their primary inputs and we
have labeled this cluster, "Food Products - Crop Using."
The Foods Manufacturing Sector of the U.S. economy, as defined by
SIC Major Group 20, consists of 47 4-digit industries of which only
12 are included in the first PS2 cluster. Most of the remaining
food industries are included in the next two clusters, which we
have labeled "Food Products - Processed Food Using", and "Food
Products - Livestock Using." The separation of these three food
clusters is attributable to differing mixes of their inputs across
the "Agricultural Products - Crops" (SIC 01), "Agricultural
Products - Livestock" (SIC 02), and "Processed Foods" (SIC 20)
sectors, as shown in Table 4.
The fourth PS2 cluster is "Tobacco Products" and it is nearly
identical to its SIC counterpart (21) except that "Tobacco Stemming
and Redrying" is in the first PS2 cluster as discussed above.
The fifth PS2 cluster groups primarily apparel-related industries.
It consists of 36 SIC industries and contains two PS3 groups. One
PS3 group clusters primarily apparel industries (SIC 23) while the
other one groups industries that are part of the textile group (SIC
22). By examining the average materials cost shares for this PS2

Materials cost shares for the pseudo 3-digit clusters are not presented15
in this paper but may be made available upon request.
15
group, we find that 96 percent of the costs are comprised of
textile materials (SIC 22) with 3 percent in chemicals (SIC 28).
The distinction in the two PS3 clusters which form this apparel-
related PS2 is made in the amount of textiles and chemicals that
each PS3 uses. The apparel PS3 consumes 98 percent of textiles and
one percent in chemicals, while the textile-related PS3 uses 84
percent of textiles and 12 percent of chemicals. This PS2 is one15
of three textile-related clusters. The separation is caused by
differences in their shares of textiles, chemicals, leather and
rubber and plastics, as shown in Table 4.
The remaining non-durable goods can be found in clusters: "Manmade
Fibers & Chemical Products" (Cluster 8); "Chemical Products"
(Cluster 9); "Paper Products" (Cluster 10); "Printing Services"
(Cluster 11); and "Petroleum Products" (Cluster 12).
The first durable goods cluster, "Lumber and Wood Products"
(Cluster 13), consists of primarily wood and lumber using
industries - 81 percent of the materials cost is SIC 24. This PS2
consists of 19 4-digit industries and five PS3 groupings from not
only the lumber industries (SIC 24), but also industries producing
wood furniture (SIC 25) and "Pulp Mills" (SIC 2611). In addition
to lumber, the major material inputs of this cluster include eight

Note that while industries currently classified by the Standard16
Industrial Classification in major group SIC 25, Furniture, such as wood officefurniture (SIC 2521) and metal office furniture (SIC 2522) are placed in SIC 25regardless of the materials used, our materials-based procedure places woodfurniture with this lumber-related grouping and the metals with a fabricatedmetals group (Cluster 16).
16
percent chemicals (SIC 28) and five percent fabricated metal
products (SIC 34).16
The Stone, Clay and Glass Industry (SIC 32) is divided into two
clusters under our classification. Specifically, "Stone and
Pottery Products" are found in Cluster 14, while "Concrete and
Glass Products" are found in Cluster 15. The division of this
industry appears to be driven by the fact that industries in
Cluster 14 use materials primarily from the Minerals industry (SIC
14) - 80 percent cost share, while industries in Cluster 15 use
intermediate products from the Stone, Clay, and Glass Industry (SIC
32) - 56 percent cost share.
Three of the remaining durable goods clusters have relatively large
numbers of 4-digit industries within them. Briefly, these are:
Cluster 16, "Metals and Fabricated Metal Products," with 60 SIC
industries; Cluster 17, "Machinery," with 70 SIC industries;
Cluster 20, "Miscellaneous Manufacturing," with 42 SIC industries.
In addition to having a large number of 4-digit SIC industries,
they also have a large number of PS3s, indicating that although
many of these 4-digit SIC industries are grouped at the PS2 level

17
they are not closely related at a less aggregated level.
One could, of course, go on to examine each and every pseudo-2-
digit classification; but we feel that the point is fairly well
made by these examples. A classification system based on materials
inputs captures much of the essence of the current SIC, with some
interesting changes -- for example, "Apparel Belts" (SIC 2387) are
grouped with leather goods (Cluster 7) rather than with other
apparel goods (Cluster 6 or 7); "Metal Partitions, Shelves and
Furniture" (SIC 2542) is grouped with metal products (Cluster 16)
rather than with other furniture; and "Primary Aluminum" (SIC 3334)
is grouped with the chemicals and textiles (Cluster 8) rather than
with other metals (Cluster 16) because alumina, its major material
input, is classified as a chemical rather than as a mineral like
the other primary metal ores.
Beyond simply pointing out these anomalies, which are interesting
in their own right, is there any method of comparing the two
classifications to determine which is better? As discussed
earlier, one of the objectives of aggregation is to maintain as
much of the variation in the original data as possible while
providing manageability. The R statistic is one measure of2
success in this regard. It provides a measure of the information
(that is, the variation) lost due to using the cluster means as
proxies for the individual 4-digit SIC industry input vectors.

18
Using the R statistic, our new classification retains over 982
percent of the original variation in the data at the pseudo-3-digit
level, and over 82 percent of the variation at the pseudo-2-digit.
By comparison, the original SIC classification system retains only
75 percent of the variation at the 3-digit level and 54 percent at
the 2-digit level. Thus, it would appear that the new
classification is much better at retaining the original
technological information than the existing SIC.
In addition to looking at the classification as a static system, it
is also useful to examine how the clusters change as one moves from
one level of aggregation to the next. For example, in moving from
21 to 20 clusters, Cluster 2, "Food Products - Processed Food
Using" was formed by combining two separate food clusters as
footnoted in the appendix. And in moving from 22 to 21 clusters,
"Canned and Cured Fish and Seafoods" (SIC 2091) and "Fresh and
Frozen Seafoods" (SIC 2092) were moved from their own cluster into
the Miscellaneous Manufacturing cluster. If the aggregation were
to continue, the next step would be to combine Cluster 4, "Tobacco
Products," with Cluster 20 "Miscellaneous Manufacturing." This
would be followed by combining Cluster 8, "Manmade Fibers &
Chemicals," with Cluster 9, "Chemical Products." And so on, until
there would be only one remaining cluster.
In looking at classification as a process of grouping industries

19
into fewer and fewer clusters, one realizes the arbitrariness of
stopping at 20 clusters, rather than 21, or 19. By using a
hierarchial procedure, one can ask what is the most reasonable
level to conduct this analysis. Is it important to have a separate
Tobacco grouping? And, do we want to examine a separate Seafoods
group?
There are many ways that one would like to extend this analysis.
For example, one might consider using alternative definitions of
the factor inputs. Using the existing 2-digit SIC to define the
material inputs undoubtedly biases the clusters towards looking
like the SIC -- particularly in areas where the primary input is
very narrowly defined like Tobacco or Agricultural Products -
Livestock. This may provide an explanation as to why the durable
goods industries appear to be more densely packed together than the
non-durable goods and is suggestive of problems with the
homogeneity and non-substitutability assumptions.
A second extension is to examine the use alternative distance
measures. Even though the share vectors are constrained to lie on
the unit simplex they still have different vector lengths. As a
result, industries that are more spread out in their materials
consumption are necessarily closer together than those that use
only one or two primary inputs. Alternative measures of distance,
such as the angular measure discussed in Andrews-Abbott, have

20
different levels of
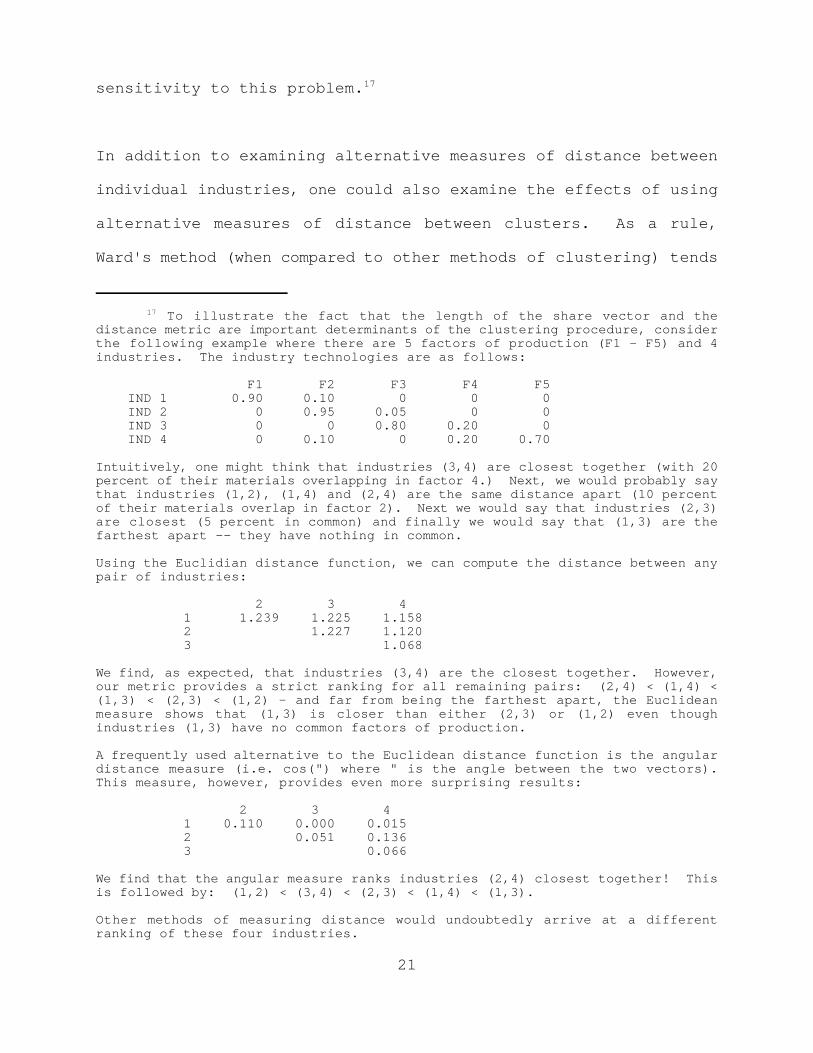
To illustrate the fact that the length of the share vector and the17
distance metric are important determinants of the clustering procedure, considerthe following example where there are 5 factors of production (F1 - F5) and 4industries. The industry technologies are as follows:
F1 F2 F3 F4 F5 IND 1 0.90 0.10 0 0 0 IND 2 0 0.95 0.05 0 0 IND 3 0 0 0.80 0.20 0 IND 4 0 0.10 0 0.20 0.70
Intuitively, one might think that industries (3,4) are closest together (with 20percent of their materials overlapping in factor 4.) Next, we would probably saythat industries (1,2), (1,4) and (2,4) are the same distance apart (10 percentof their materials overlap in factor 2). Next we would say that industries (2,3)are closest (5 percent in common) and finally we would say that (1,3) are thefarthest apart -- they have nothing in common.
Using the Euclidian distance function, we can compute the distance between anypair of industries:
2 3 4 1 1.239 1.225 1.158 2 1.227 1.120 3 1.068 We find, as expected, that industries (3,4) are the closest together. However,our metric provides a strict ranking for all remaining pairs: (2,4) < (1,4) <(1,3) < (2,3) < (1,2) - and far from being the farthest apart, the Euclideanmeasure shows that (1,3) is closer than either (2,3) or (1,2) even thoughindustries (1,3) have no common factors of production.
A frequently used alternative to the Euclidean distance function is the angulardistance measure (i.e. cos(") where " is the angle between the two vectors).This measure, however, provides even more surprising results:
2 3 4 1 0.110 0.000 0.015 2 0.051 0.136 3 0.066
We find that the angular measure ranks industries (2,4) closest together! Thisis followed by: (1,2) < (3,4) < (2,3) < (1,4) < (1,3).
Other methods of measuring distance would undoubtedly arrive at a differentranking of these four industries.
21
sensitivity to this problem.17
In addition to examining alternative measures of distance between
individual industries, one could also examine the effects of using
alternative measures of distance between clusters. As a rule,
Ward's method (when compared to other methods of clustering) tends

See, for example, Aldenderfer and Blashfield, pp. 43-45.18
22
to join clusters with smaller numbers of observations and is thus
biased toward producing clusters with roughly the same number of
observations.18
Our examination of the clusters suggests that this is not a
significant problem with our data. Like the original SIC, some of
our clustered pseudo-2-digit major groups, (that is, clustering the
449 industries into 20 groups), have only a few industries while
others have many. However, one may wish to compare the results
presented here to other methods to determine how sensitive these
results are.
V. Concluding Remarks
In this study, we have grouped manufacturing industries based on
their materials input structure reasoning that industries which
consume the same inputs in similar shares have similar
technologies. Next we compared these groupings to the 2- and 3-
digit SIC industry groups and found that although there are many
similarities, there are also important differences. These
differences allow the new classification to retain significantly
more information about material usage than the existing SIC,
information which could be important for economic and policy
analysis.

23
We must, however, emphasize that the results presented are
preliminary. Our specific clusters clearly depend on the number,
type, and definition of the input data used, as well as the
clustering algorithm. Had we chosen to use more detailed materials
definitions or a different clustering algorithm, our clusters would
be different. Thus, it is important to follow up this analysis to
determine the sensitivity of our results to these crucial
assumptions. Nevertheless, it is useful to examine the
classification process and relationships between the various
industries as they are clustered from 449 individual industries to
a single group. From this, one can gain new insights into the
structure of the American manufacturing sector and the
technological similarities between industries.
More important than the specific findings of this or any future
study, clustering economic activity using hierarchial algorithms
demonstrates that one need not confine empirical analysis to a
single method of classification, nor to only one or two levels of
aggregation. Any level of aggregation from single industries to
large industrial groups is feasible using these techniques. The
appropriate level of aggregation should be determined by the
specific objectives at hand.
The next logical step is to examine the definitions of the 4-digit
industries themselves, using the 5- and 7-digit product extensions
24
to the SIC. Do the current 4-digit definitions optimally group
products based on their production technology? If so, why do many
establishments manufacture products in more than one 4-digit
industry? And why do the same products appear in more than one 4-
digit industry? Can we group the products to minimize these
problems? Using these clustering techniques, we can begin to
address these questions.
There is also no reason to limit this approach to the manufacturing
sector. One could clearly use measures of technology and inputs to
help classify business units (and products) in the retail,
wholesale and service sectors as well. Moreover, as discussed in
our earlier paper, production technology is but one of several
alternative methods for grouping data. The Census Bureau, and
other data providing organizations, should continue to work on
developing environments which facilitate the aggregation and
grouping of data to suit the needs of all users. As demonstrated
here, given sufficiently detailed microdata, the technology exists
for providing many alternatives to the SIC.

Table 1. MATERIAL INPUTS
SIC DESCRIPTION*
01 Agricultural Production - Crops02 Agricultural Production - Livestock08 Forestry09 Fishing, Hunting, and Trapping10 Metal Mining12 Bituminous Coal and Lignite Mining13 Oil and Gas Extraction14 Mining and Quarrying of Nonmetallic Minerals, Except Fuels20 Food and Kindred Products21 Tobacco Manufactures22 Textile Mill Products23 Apparel and Other Textile Products24 Lumber and Wood Products25 Furniture and Fixtures26 Paper and Allied Products27 Printing and Publishing28 Chemicals and Allied Products29 Petroleum and Coal Products30 Rubber and Plastics Products31 Leather and Leather Products32 Stone, Clay and Glass Products33 Primary Metal Industries34 Fabricated Metal Products35 Machinery, Except Electrical36 Electrical Equipment and Supplies37 Transportation Equipment38 Instruments and Related Products39 Miscellaneous Manufacturing49 Electric, Gas, and Sanitary Services
Source: U.S. Office of Management and Budget, Standard Industrial Classification Manual, 1972.
The material codes are the 1972 Standard Industrial Classification Major Group*
codes.

Table 2. DISTRIBUTION OF INDUSTRIAL CLUSTERS
NUMBER OF: 4-DIGIT SIC
ACTIVITY PS2 GROUPS PS3 GROUPS INDUSTRIES Nondurable Goods:
Foods 3 18 47Tobacco 1 1 3Textile & Apparel 3 12
58Chemicals 2 18
51Paper & Printing 2 12
36Petroleum Products 1 4 7Total 12 65 202
Durable Goods:Lumber & Wood Products 1 5 19Stone, Clay, & Glass 2 12 23Metals & Fabr. Metals 1 7
60Machinery 2 24
86Telecom. & Electronics 1 2 7Miscellaneous Mfg. 1 28 42Total 8 78
237
Total 20 143 439
Source: U.S. Bureau of the Census, Census of Manufactures, 1982, and the Longitudinal Research Data Base.

TABLE 3. COMPARISON OF 2-DIGIT SIC AND PSEUDO 2-DIGIT CLUSTERS PSEUDO 2-DIGIT CLUSTERS
SIC 1 2 3 4 5 6 7 8 9 10 11 12 13 14 15 16 17 18 19 20 M TOTAL 20 12 29 3 0 0 0 0 0 0 1 0 0 0 0 0 0 0 0 0 2 0 47
21 1 0 0 3 0 0 0 0 0 0 0 0 0 0 0 0 0 0 0 0 0 04
22 1 0 0 0 8 5 0 12 0 0 0 0 0 0 0 0 0 0 0 0 4 30
23 0 0 0 0 28 0 2 0 0 0 0 0 0 0 0 0 0 0 0 0 3 33
24 0 0 0 0 0 0 0 0 0 0 0 0 15 0 0 0 0 0 0 2 0 17
25 0 0 0 0 0 2 0 0 0 0 0 0 3 0 0 1 5 0 0 2 0 13
26 0 0 0 0 0 0 0 0 0 14 0 0 1 0 0 0 0 0 0 2 0 17
27 0 0 0 0 0 0 0 0 0 11 4 0 0 0 0 0 1 0 0 1 0 17
28 0 0 0 0 0 0 0 15 7 1 0 2 0 1 0 0 0 0 0 1 1 28
29 0 0 0 0 0 0 0 0 1 0 0 4 0 0 0 0 0 0 0 0 0 05
30 0 0 0 0 0 1 0 2 2 0 0 0 0 0 0 0 0 0 0 1 0 06
31 0 1 0 0 0 2 8 0 0 0 0 0 0 0 0 0 0 0 0 0 0 11
32 0 0 0 0 0 0 0 1 6 1 0 0 0 11 8 0 0 0 0 0 0 27
33 0 0 0 0 0 0 0 1 0 0 0 0 0 0 0 18 4 0 0 1 2 26
34 0 0 0 0 0 0 0 1 2 0 0 0 0 0 0 27 6 0 0 0 0 36
35 0 0 0 0 0 0 0 0 0 0 0 0 0 0 0 5 25 12 0 2 0 44
36 0 0 0 0 0 0 0 0 0 0 0 1 0 0 2 4 21 1 5 3 0 37
37 0 0 0 0 0 0 0 0 0 0 0 0 0 0 0 1 4 3 2 8 0 18
38 0 0 0 0 0 1 0 0 0 0 1 0 0 0 1 1 2 0 0 7 0 13
39 0 0 0 0 0 1 0 1 0 3 0 0 0 0 0 3 2 0 0 10 0 20
TOTAL 14 30 3 3 36 12 10 33 18 31 5 7 19 12 11 60 70 16 7 42 10 449

Table 3. (Cont'd.)
Note: 2-digit SIC descriptions are the same descriptions found in Table 1. The Pseudo 2-digit clusterdescriptions which follow are suggestive only.
PSEUDO 2-DIGIT CLUSTER DESCRIPTION
1 Food Products - Crop Using 2 Food Products - Processed Food Using 3 Food Products - Livestock Using 4 Tobacco 5 Apparel & Textile Products 6 Miscellaneous Textile Products 7 Leather Apparel 8 Manmade Fibers & Chemical Products 9 Chemical Products 10 Paper Products 11 Printing Services 12 Petroleum Products 13 Lumber & Wood Products 14 Stone & Pottery Products 15 Concrete & Glass Products 16 Metals & Fabricated Metal Products 17 Machinery 18 Nonelectrical Machinery 19 Telecommunications Equipment 20 Miscellaneous Manufacturing M Those Industries Without Detailed Materials Records
Source: U.S. Bureau of the Census, Census of Manufactures, 1982, and the Longitudinal Research Data Base.
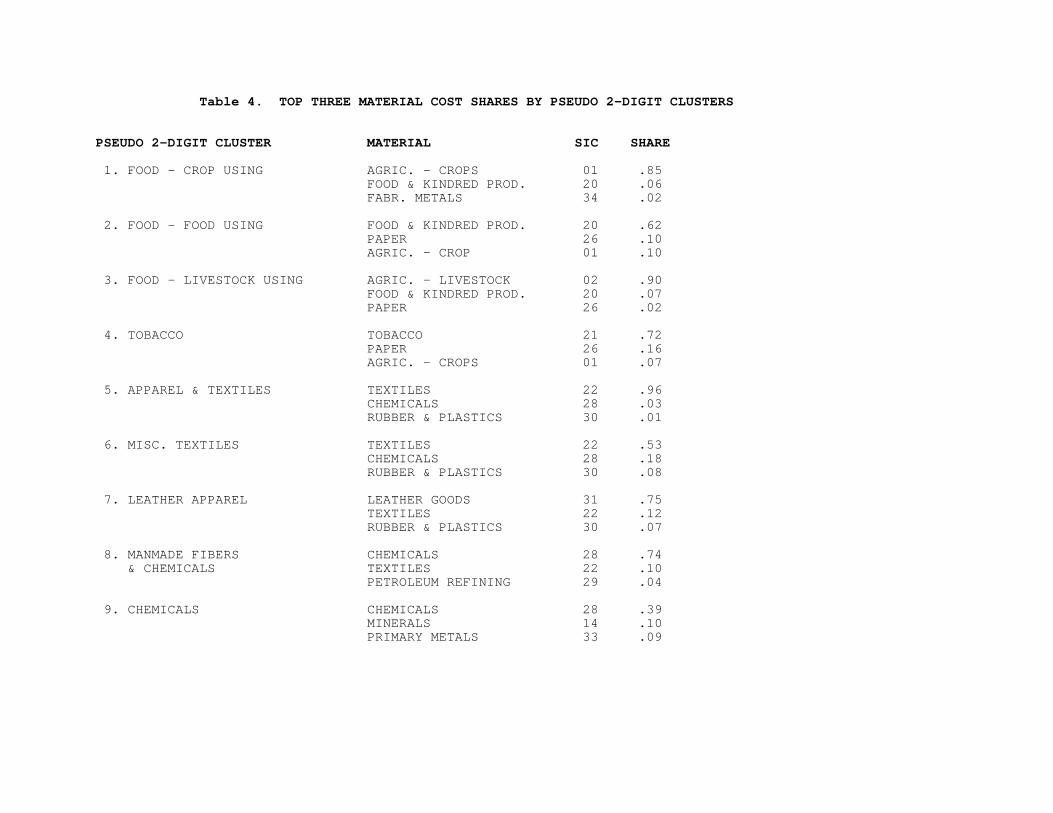
Table 4. TOP THREE MATERIAL COST SHARES BY PSEUDO 2-DIGIT CLUSTERS
PSEUDO 2-DIGIT CLUSTER MATERIAL SIC SHARE
1. FOOD - CROP USING AGRIC. - CROPS 01 .85FOOD & KINDRED PROD. 20 .06FABR. METALS 34 .02
2. FOOD - FOOD USING FOOD & KINDRED PROD. 20 .62PAPER 26 .10AGRIC. - CROP 01 .10
3. FOOD - LIVESTOCK USING AGRIC. - LIVESTOCK 02 .90FOOD & KINDRED PROD. 20 .07PAPER 26 .02
4. TOBACCO TOBACCO 21 .72PAPER 26 .16AGRIC. - CROPS 01 .07
5. APPAREL & TEXTILES TEXTILES 22 .96CHEMICALS 28 .03RUBBER & PLASTICS 30 .01
6. MISC. TEXTILES TEXTILES 22 .53CHEMICALS 28 .18RUBBER & PLASTICS 30 .08
7. LEATHER APPAREL LEATHER GOODS 31 .75TEXTILES 22 .12RUBBER & PLASTICS 30 .07
8. MANMADE FIBERS CHEMICALS 28 .74 & CHEMICALS TEXTILES 22 .10
PETROLEUM REFINING 29 .04
9. CHEMICALS CHEMICALS 28 .39MINERALS 14 .10PRIMARY METALS 33 .09

Table 4. (cont'd.)
10. PAPER PAPER 26 .79CHEMICALS 28 .11RUBBER & PLASTICS 30 .02
11. PRINTING SERVICES INSTRUMENTS 38 .68PRIMARY METALS 33 .14PAPER 26 .12
12. PETROLEUM PRODUCTS PETROLEUM REFINING 29 .72CHEMICALS 28 .10STONE, CLAY & GLASS 32 .06
13. LUMBER & WOOD LUMBER 24 .81CHEMICALS 28 .08FABR. METALS 34 .05
14. STONE & POTTERY MINERALS 14 .80CHEMICALS 28 .07STONE, CLAY & GLASS 32 .04
15. CONCRETE & GLASS STONE, CLAY & GLASS 32 .56MINERALS 14 .21PAPER 26 .07
16. METALS & FABR. METAL PRIMARY METALS 33 .89FABR. METALS 34 .03CHEMICALS 28 .02
17. MACHINERY PRIMARY METALS 33 .52MACHINERY, ELEC. 36 .13FABR. METALS 34 .09
18. NONELEC. MACHINERY MACHINERY, NONELEC. 35 .36PRIMARY METALS 33 .28MACHINERY, ELEC. 34 .13
19. TELECOM. & ELECTRONICS MACHINERY, ELEC. 36 .73PRIMARY METALS 33 .07FABR. METALS 34 .06
20. MISCELLANEOUS MANUFACTURING FABR. METALS 34 .14 PRIMARY METALS 33 .11 MACHINERY, ELEC. 36 .10
Source: U.S. Bureau of the Census, Census of Manufactures, 1982, and the Longitudinal Research Data Base.

APPENDIX I
PSEUDO 2-DIGIT AND 3-DIGIT CLUSTERS
CLUSTER 1: FOOD PRODUCTS - CROP USING
SIC PSEUDO 3-DIGIT TITLE
2041 4 Flour and other grain mill products2044 4 Rice milling2046 4 Wet corn milling2061 4 Cane sugar, except refining only2063 4 Beet sugar2074 4 Cottonseed oil mills2075 4 Soybean oil mills2083 4 Malt2095 4 Roasted coffee
2037 86 Frozen fruits, fruit juices and vegetables2076 86 Vegetable oil mills, except corn, cottonseed, and soybean
2141 127 Tobacco stemming and redrying
2211 134 Broad woven fabric mills, cotton
2033 136 Canned fruits, vegetables, preserves, jams, and jellies
CLUSTER 2: FOOD PRODUCTS - PROCESSED FOOD USING
SIC PSEUDO 3-DIGIT TITLE
2013 11 Sausages and other prepared meat products2021 11 Creamery butter2062 11 Cane sugar refining2067 11 Chewing gum2077 11 Animal and marine fats and oils2079 11 Shortening, table oils, margarine and other edible fats, nec2087 11 Flavoring extracts and flavoring syrups, nec
2034 19 Dried and dehydrated fruits, vegetables and soup mixes1
2048 19 Prepared feeds and feed ingredients for animals, nec1
2066 19 Chocolate and cocoa products1
2099 19 Food preparations, nec1
2035 20 Pickled fruits and vegetables, sauces and seasonings2084 20 Wines, brandy, and brandy spirits

CLUSTER 2: FOOD PRODUCTS - PROCESSED FOOD USING (Cont'd)
2038 21 Frozen specialties2045 21 Blended and prepared flour2052 21 Cookies and crackers
2024 41 Ice cream and frozen deserts2051 41 Bread and other bakery products, except cookies and crackers2065 41 Candy and other confectionery products2098 41 Macaroni, spaghetti, vermicelli, and noodles
2032 61 Canned specialties1
2086 61 Bottled and canned soft drinks and carbonated waters1
2017 80 Poultry and egg processing2022 80 Cheese, natural and processed2023 80 Condensed and evaporated milk
2047 93 Dog, cat and other pet food1
2085 111 Distilled, rectified, and blended liquors1
3111 125 Leather tanning and finishing
2082 132 Malt beverages1
2043 138 Cereal breakfast foods1
Combined to form the 20th cluster.1

CLUSTER 3: FOOD PRODUCTS - LIVESTOCK USING
SIC PSEUDO 3-DIGIT TITLE
2011 23 Meat packing plants2016 23 Poultry dressing plants2026 23 Fluid milk
CLUSTER 4: TOBACCO PRODUCTS
SIC PSEUDO 3-DIGIT TITLE
2111 38 Cigarettes2121 38 Cigars2131 38 Tobacco (chewing and smoking) and snuff
CLUSTER 5: APPAREL & TEXTILE PRODUCTS SIC PSEUDO 3-DIGIT TITLE 2253 1 Knit outerwear mills2259 1 Knitting mills, nec2311 1 Men's, youths', and boys' suits, coats, and overcoats2321 1 Men's, youths', and boys' shirts and nightwear2322 1 Men's, youths', and boys' underwear2323 1 Men's, youths', and boys' neckwear2327 1 Men's, youths', and boys' separate trousers2328 1 Men's, youths', and boys' work clothing2329 1 Men's, youths', and boys' clothing, nec2331 1 Women's, misses', and juniors' blouses, waists, and shirts2335 1 Women's, misses', and juniors' dresses2337 1 Women's, misses', and juniors' suits, skirts, and coats2339 1 Women's, misses', and juniors' outerwear, nec2341 1 Women's, misses', children's, and infants' underwear and nightwear2342 1 Brassieres, girdles, and allied garments2361 1 Girls', children's, and infants' dresses, blouses, & shirts2363 1 Girls', children's, and infants' coats and suits2369 1 Girls', children's,; and infants' outerwear, nec2381 1 Dress and work gloves, except knit and all-leather2384 1 Robes and dressing gowns2385 1 Raincoats and other waterproof outer garments2389 1 Apparel and accessories, nec2391 1 Curtains and draperies2392 1 House furnishings, except curtains and draperies

2393 1 Textile bags
CLUSTER 5: APPAREL & TEXTILE PRODUCTS (Cont'd) SIC PSEUDO 3-DIGIT TITLE
2395 1 Pleating, decorating and novelty stitching2396 1 Automotive trimmings, apparel findings and related products2397 1 Schiffli machine embroideries2399 1 Fabricated textile products, not elsewhere classified
2231 9 Broad woven fabric mills, wool2252 9 Hosiery, except women's full length and knee length hosiery2254 9 Knit underwear mills2262 9 Finishers of broad woven fabrics of man-made fiber and silk2269 9 Finishers of textiles, not elsewhere classified2283 9 Yarn mills, wool, including carpet and rug yarn2394 9 Canvas and related products
CLUSTER 6: MISCELLANEOUS TEXTILE PRODUCTS
SIC PSEUDO 3-DIGIT TITLE
2257 10 Circular knit fabric mills2261 10 Finishers of broad woven fabrics of cotton2284 10 Thread mills2292 10 Lace goods2295 10 Coated fabrics, not rubberized
2515 83 Mattresses and bedsprings3161 83 Luggage
2512 87 Wood household furniture, upholstered3142 87 House slippers
3021 96 Rubber and plastics footwear
3842 112 Orthopedic, prosthetic, and surgical supplies
3942 133 Dolls

CLUSTER 7: LEATHER APPAREL
SIC PSEUDO 3-DIGIT TITLE
2387 7 Apparel belts3151 7 Leather gloves and mittens3171 7 Women's handbags and purses3172 7 Personal leather goods, except women's handbags and purses
2386 17 Leather and sheep lined clothing3199 17 Leather goods, nec
3131 48 Boot and shoe cut stock and findings3143 48 Men's footwear, except athletic3149 48 Footwear, except rubber, nec
3144 107 Women's footwear, except athletic
CLUSTER 8: MANMADE FIBERS & CHEMICAL PRODUCTS
SIC PSEUDO 3-DIGIT TITLE
2251 12 Women's full length and knee length hosiery2293 12 Paddings and upholstery filling2294 12 Processed waste and recovered fibers and flock3011 12 Tires and inner tubes3291 12 Abrasive products
2221 18 Broad woven fabric mills, manmade fiber and silk2258 18 Warp knit fabric mills2291 18 Felt goods, except woven felts and hats2299 18 Textile goods, nec
2282 27 Yarn texturizing, throwing, twisting, and winding mills2297 27 Nonwoven fabrics2298 27 Cordage and twine2824 27 Synthetic organic fibers, except cellulosic3334 27 Primary production of aluminum
2296 31 Tire cord and fabric2831 31 Biological products2833 31 Medicinal chemicals and botanical products2851 31 Paints, varnishes, lacquers, enamels, and allied products

2865 31 Cyclic (coal tar) crudes, and cyclic intermediates2879 31 Pesticides and agricultural chemicals, nec2892 31 Explosives
CLUSTER 8: MANMADE FIBERS & CHEMICAL PRODUCTS (Cont'd)
SIC PSEUDO 3-DIGIT TITLE
2893 31 Printing ink3471 31 Electroplating, plating, polishing, anodizing and coloring3963 31 Buttons
2843 32 Surface active agents, finishing agents, sulfonated oils2891 32 Adhesives and sealants2899 32 Chemicals and chemical preparations, nec
2834 47 Pharmaceutical preparations2841 47 Soap and other detergents, except specialty cleaners3079 47 Miscellaneous plastics products
2821 79 Plastics materials, resins, and nonvulcanizable elastomers2869 79 Industrial organic chemicals, nec
2281 130 Yarn spinning mills: cotton, man-made fibers and silk
CLUSTER 9: CHEMICAL PRODUCTS
SIC PSEUDO 3-DIGIT TITLE
2842 50 Specialty cleaning, polishing, and sanitation preparations2844 50 Perfumes, cosmetics, and other toilet preparations
3229 54 Pressed and blown glass and glassware, nec3296 54 Mineral wood
3293 56 Gaskets, packing, and sealing devices3479 56 Coating, engraving, and allied services, nec3482 56 Small arms ammunition
2816 71 Inorganic pigments2819 71 Industrial inorganic chemicals, nec
2812 74 Alkalies and chlorine2875 74 Fertilizers, mixing only3292 74 Asbestos products

3041 89 Rubber and plastics hose and belting3069 89 Fabricated rubber products, nec
3211 94 Flat glass
CLUSTER 9: CHEMICAL PRODUCTS (Cont'd)
SIC PSEUDO 3-DIGIT TITLE
3299 115 Nonmetallic mineral products, nec
2873 123 Nitrogenous fertilizers
2911 124 Petroleum refining
CLUSTER 10: PAPER PRODUCTS
SIC PSEUDO 3-DIGIT TITLE
2097 3 Manufactured ice2642 3 Envelopes2645 3 Die-cut paper and paperboard and cardboard2647 3 Sanitary paper products2648 3 Stationery, tablets and related products2649 3 Converted paper and paperboard products, nec2651 3 Folding paperboard boxes2652 3 Set-up paperboard boxes2653 3 Corrugated and solid fiber boxes2654 3 Sanitary food containers2711 3 Newspapers: publishing, publishing and printing2721 3 Periodicals: publishing, publishing and printing2731 3 Books: publishing, publishing and printing2741 3 Miscellaneous publishing2761 3 Manifold business forms2771 3 Greeting card publishing
2641 13 Paper coating and glazing2643 13 Bags, except textile bags2754 13 Commercial printing, gravure2823 13 Cellulosic man-made fibers
2732 22 Book printing2751 22 Commercial printing, letterpress and screen2752 22 Commercial printing, lithographic
2789 82 Bookbinding and related work3955 82 Carbon paper and inked ribbons

2646 85 Pressed and molded pulp goods3962 85 Feathers, plumes, and artificial trees and flowers
2621 90 Paper mills, except building paper mills

CLUSTER 10: PAPER PRODUCTS (Cont'd)
SIC PSEUDO 3-DIGIT TITLE
2655 102 Fiber cans, tubes, drums, and similar products
3221 108 Glass containers
3996 109 Linoleum, asphalted-felt-base, and other hard surface floors
CLUSTER 11: PRINTING SERVICES
SIC PSEUDO 3-DIGIT TITLE
2793 49 Photoengraving2795 49 Lithographic platemaking and related services
2791 78 Typesetting3873 78 Watches, clocks, clockwork operated devices, and parts
2753 106 Engraving and plate printing
CLUSTER 12: PETROLEUM PRODUCTS
SIC PSEUDO 3-DIGIT TITLE
2822 59 Synthetic rubber (vulcanizable elastomers)2992 59 Lubricating oils and greases3624 59 Carbon and graphite products
2895 75 Carbon black2999 75 Products of petroleum and coal, nec
2951 97 Paving mixtures and blocks
2952 129 Asphalt felts and coatings
CLUSTER 13: LUMBER AND WOOD PRODUCTS
SIC PSEUDO 3-DIGIT TITLE
2426 5 Hardwood dimension and flouring mills2431 5 Millwork2435 5 Hardwood veneer and plywood

2436 5 Softwood veneer and plywood
CLUSTER 13: LUMBER AND WOOD PRODUCTS (Cont'd)
SIC PSEUDO 3-DIGIT TITLE
2439 5 Structural wood members, not elsewhere classified2441 5 Nailed and lock corner wood boxes and shook2448 5 Wood pallets and skids2449 5 Wood containers, not elsewhere classified
2491 42 Wood preserving2499 42 Wood products, nec2611 42 Pulp mills
2434 52 Wood kitchen cabinets2452 52 Prefabricated wood buildings and components2511 52 Wood household furniture, except upholstered2517 52 Wood television, radio, and phonograph cabinets2521 52 Wood office furniture
2421 62 Sawmills and planing mills, general2429 62 Special product sawmills, not elsewhere classified
2492 122 Particleboard
CLUSTER 14: STONE & POTTERY PRODUCTS
SIC PSEUDO 3-DIGIT TITLE
3261 6 Vitreous china plumbing fixtures and china3262 6 Vitreous china table and kitchen articles3263 6 Fine earthenware (whiteware) table and kitchen articles3269 6 Pottery products, nec

CLUSTER 14: STONE & POTTERY PRODUCTS (Cont'd)
SIC PSEUDO 3-DIGIT TITLE
3251 34 Brick and structural clay tile3253 34 Ceramic wall and floor tile3259 34 Structural clay products, nec
3274 67 Lime3281 67 Cut stone and stone products3295 67 Minerals and earths, ground or otherwise treated
2874 95 Phosphatic fertilizers
3264 137 Porcelain electrical supplies
CLUSTER 15: CONCRETE & GLASS PRODUCTS
SIC PSEUDO 3-DIGIT TITLE
3241 43 Cement, hydraulic3271 43 Concrete block and brick3273 43 Ready-mixed concrete3297 43 Nonclay refractories
3231 81 Glass products, made of purchased glass3671 81 Radio and television receiving type electron tubes
3641 91 Electric lamps
3851 92 Ophthalmic goods
3255 121 Clay refractories
3272 139 Concrete products, except block and brick
3275 140 Gypsum products

CLUSTER 16: METALS & FABRICATED METAL PRODUCTS
SIC PSEUDO 3-DIGIT TITLE
3315 2 Steel wire drawing and steel nails and spikes3316 2 Cold rolled steel sheet, strip, and bars3317 2 Steel pipe and tubes3333 2 Primary smelting and refining of zinc3341 2 Secondary smelting and refining of nonferrous metals3351 2 Rolling, drawing, and extruding of copper3353 2 Aluminum sheet, plate, and foil3354 2 Aluminum extruded products3355 2 Aluminum rolling and drawing, nec3356 2 Roll, draw, and extrude of nonferrous metals3362 2 Brass, bronze, copper, copper base alloy foundries3441 2 Fabricated structural metal3444 2 Sheet metal work3446 2 Architectural and ornamental metal work3448 2 Prefabricated metal buildings and components3449 2 Miscellaneous metal work3462 2 Iron and steel forgings3489 2 Ordnance and accessories, nec3496 2 Miscellaneous fabricated wire products3914 2 Silverware, plated ware, and stainless steel ware
3361 8 Aluminum foundries (castings)3369 8 Nonferrous foundries (castings), nec3412 8 Metal shipping barrels, drums, kegs, and pails3425 8 Hand saws and saw blades3443 8 Fabricated plate work (boiler shops)3451 8 Screw machine products3452 8 Bolts, nuts, screws, rivets, and washers3463 8 Nonferrous forgings3465 8 Automotive stampings3469 8 Metal stampings, nec3493 8 Steel springs, except wire3495 8 Wire springs3498 8 Fabricated pipe and fabricated pipe fittings3499 8 Fabricated metal products, nec3544 8 Special dies and tools, die sets, jigs and fixtures3545 8 Machine tool accessories and measuring devices3599 8 Machinery, except electrical, nec3795 8 Tanks and tank components

CLUSTER 16: METALS AND FABRICATED METAL PRODUCTS (Cont'd)
SIC PSEUDO 3-DIGIT TITLE
3321 15 Gray iron foundries3322 15 Malleable iron foundries3324 15 Steel investment foundries3339 15 Primary smelting and refining of nonferrous metals, nec3442 15 Metal doors, sash, frames, molding, and trim
2542 25 Metal partitions, shelving, lockers, and office fixtures3411 25 Metal cans3423 25 Hand and edge tools, except machine tools and hand saws3431 25 Enameled iron and metal sanitary ware3432 25 Plumbing fixture fittings and trim (brass goods)3433 25 Heating equipment, except electric and warm air furnaces3592 25 Carburetors, pistons, piston rings and valves3675 25 Electronic capacitors
3564 30 Blowers and exhaust and ventilation fans3612 30 Power, distribution, and specialty transformers3677 30 Electronic coils, transformers and other inductors3843 30 Dental equipment and supplies
3357 33 Drawing and insulating of nonferrous wire3466 33 Crowns and closures3644 33 Noncurrent-carrying wiring devices
3911 51 Jewelry, precious metal3915 51 Jewelers' findings and materials, and lapidary work

CLUSTER 17: MACHINERY
SIC PSEUDO 3-DIGIT TITLE
3429 14 Hardware, nec3483 14 Ammunition, except for small arms, nec3484 14 Small arms3494 14 Valves and pipe fittings, except plumbers' brass goods3568 14 Mechanical power transmission equipment, nec3714 14 Motor vehicle parts and accessories
3325 16 Steel foundries, nec3535 16 Conveyors and conveying equipment3542 16 Machine tools, metal forming types3546 16 Power driven hand tools3549 16 Metalworking machinery, nec3551 16 Food products machinery3552 16 Textile machinery3554 16 Paper industries machinery3567 16 Industrial process furnaces and ovens3621 16 Motors and generators3623 16 Welding apparatus, electric3636 16 Sewing machines
3536 24 Hoists, industrial cranes, and monorail systems3559 24 Special industry machinery, nec3566 24 Speed changers, industrial high speed drives, and gears3569 24 General industrial machinery and equipment, nec3643 24 Current-carrying wiring devices3678 24 Connectors, for electronic applications3824 24 Totalizing fluid meters and counting devices
3534 26 Elevators and moving stairways3555 26 Printing trades machinery and equipment3629 26 Electrical industrial apparatus, nec3648 26 Lighting equipment, nec3699 26 Electrical machinery, equipment and supplies, nec
3541 28 Machine tools, metal cutting types3553 28 Woodworking machinery3561 28 Pumps and pumping equipment3576 28 Scales and balances, except laboratory3582 28 Commercial industry, dry cleaning, and pressing machines
3581 36 Automatic merchandising machines3589 36 Service industry machines, nec3676 36 Resistors, for electronic applications

3679 36 Electronic components, nec
CLUSTER 17: MACHINERY (Cont'd)
SIC PSEUDO 3-DIGIT TITLE
3822 36 Automatic controls for regulating environments
2514 37 Metal household furniture2522 37 Metal office furniture3421 37 Cutlery3497 37 Metal foil and leaf
3613 40 Switchgear and switchboard apparatus3646 40 Commercial, industrial, and institutional electric fixtures
3533 45 Oil field machinery and equipment3562 45 Ball and roller bearings
3631 46 Household cooking equipment3633 46 Household laundry equipment3639 46 Household appliances, nec
3634 53 Electric housewares and fans3635 53 Household vacuum cleaners3647 53 Vehicular lighting equipment
3715 57 Truck trailers3743 57 Railroad equipment3799 57 Transportation equipment, nec
2531 70 Public building and related furniture2599 70 Furniture and fixtures, nec3565 70 Industrial patterns
3645 72 Residential electric lighting fixtures3694 72 Electrical equipment for internal combustion engines3999 72 Manufacturing industries, nec
3312 76 Blast furnaces, steel works, and rolling mills3313 76 Electrometallurgical products
2591 77 Drapery hardware and window blinds and shades3964 77 Needles, pins, hooks and eyes, and similar notions
3691 110 Storage batteries

2794 131 Electrotyping and stereotyping
3331 135 Primary smelting and refining of copper
CLUSTER 18: NONELECTRICAL MACHINERY
SIC PSEUDO 3-DIGIT TITLE
3519 39 Internal combustion engines, nec3523 39 Farm machinery and equipment3532 39 Mining machinery and equipment, except oil field3563 39 Air and gas compressors3585 39 Air conditioning and warm air heating equipment3586 39 Measuring and dispensing pumps3731 39 Ship building and repairing
3573 58 Electronic computing equipment3574 58 Calculating and accounting machines, except electronic3579 58 Office machines, nec
3524 63 Garden tractors and lawn and garden equipment3537 63 Industrial trucks, tractors, trailers, and stackers3547 63 Rolling mill machinery and equipment
3632 66 Household refrigerators and home and farm freezers3732 66 Boat building and repairing 3751 101 Motorcycles, bicycles, and parts
CLUSTER 19: TELECOMMUNICATIONS EQUIPMENT SIC PSEUDO 3-DIGIT TITLE
3622 35 Industrial controls3651 35 Radio and television receiving sets, except communication3661 35 Telephone and telegraph apparatus3662 35 Radio and television transmitting, signaling, and detection3693 35 Radiographic, fluoroscopic, and therapeutic X-ray apparatus3769 35 Guided missile and space vehicle parts and equipment, nec
3761 116 Guided missiles and space vehicles

CLUSTER 20: MISCELLANEOUS MANUFACTURING
SIC PSEUDO 3-DIGIT TITLE
3674 29 Semiconductors and related devices3811 29 Engineering, laboratory, scientific, & research instruments3823 29 Industrial instruments for measurement, display3829 29 Measuring and controlling devices, nec
3713 44 Truck and bus bodies3724 44 Aircraft engines and engine parts
3511 55 Steam, gas, and hydraulic turbines, and turbine generators3728 55 Aircraft parts and auxiliary equipment, nec
3716 60 Motor Homes Produced on Purchased Chassis3721 60 Aircraft3764 60 Guided missile and space vehicle propulsion units
2091 64 Canned and cured fish and seafoods2
2092 64 Fresh or frozen packaged fish and seafoods2
3652 65 Phonograph records and prerecorded magnetic tape3944 65 Games, toys, and children's vehicles
3825 68 Instruments for measuring and testing of electricity3832 68 Optical instruments and lenses
3692 69 Primary batteries, dry and wet3949 69 Sporting and athletic goods, nec
2451 73 Mobile homes3792 73 Travel trailers and campers
2631 84 Paperboard mills2661 84 Building paper and building board mills
3841 88 Surgical and medical instruments and apparatus3993 88 Signs and advertising displays
3995 98 Burial caskets

2541 99 Wood partitions, shelving, lockers, and office fixtures
3991 100 Brooms and brushes
3861 103 Photographic equipment and supplies
CLUSTER 20: MISCELLANEOUS MANUFACTURING (Cont'd.)
SIC PSEUDO 3-DIGIT TITLE
3952 104 Lead pencils, crayons, and artists' materials
3953 105 Marking devices
3931 113 Musical instruments
3951 114 Pens, mechanical pencils, and parts
2782 117 Blankbooks, looseleaf binders and devices
2519 118 Household furniture, nec
3031 119 Reclaimed rubber
3711 120 Motor vehicles and passenger car bodies
3961 126 Costume jewelry and costume novelties
2861 128 Gum and wood chemicals
2411 141 Logging camps and logging contractors
3332 142 Primary smelting and refining of lead
3531 143 Construction machinery and equipment
Combined to form 21st cluster.2

THOSE INDUSTRIES WITHOUT DETAILED MATERIALS RECORDS
SIC PSEUDO 3-DIGIT TITLE
2241 . Narrow fabrics and other smallwares mills 2271 . Woven carpets and rugs 2272 . Tufted carpets and rugs 2279 . Carpets and rugs, not elsewhere classified 2351 . Millinery 2352 . Hats and caps, except millinery 2371 . Fur goods 2813 . Industrial gases 3398 . Metal heat treating 3399 . Primary metal products, nec
Source: U.S. Bureau of the Census, Census of Manufactures, 1982, and the Longitudinal Research Data Base.

ACKNOWLEDGMENTS
The opinions expressed are those of the authors and do not represent the viewsof Rutgers University or the Bureau of the Census. The authors would like tothank Robert McGuckin, Tim Dunne, Sang Nguyen, Peter Zadrozny and Mark Domsfor their helpful comments on an earlier draft. As usual, responsibility forany remaining errors rests solely with the authors.
REFERENCES
ALDENDERFER, M.S. and BLASHFIELD, R.K. (1984), "Cluster Analysis," SageUniversity Paper Series on Quantitative Applications in the Social Sciences,07-044. Beverly Hills and London: Sage Publications.
ANDERBERG, M.R. (1973), Cluster Analysis for Applications. New York: Academic Press.
ANDREWS, S.H. and ABBOTT, T.A. (1988), "An Examination of the StandardIndustrial Classification of Manufacturing Activity Using the LongitudinalResearch Data Base," Fourth Annual Research Conference Proceedings, U.S.Bureau of the Census.
FISHER, W.D. (1969), Clustering and Aggregation in Economics. Baltimore: Johns Hopkins Press.
GOLLOP, F.M. and MONAHAN, J.L. (1989), "From Homogeneity to Heterogeneity: AnIndex of Diversification," Technical Paper 60, U.S. Bureau of the Census.
HARTIGAN, J. (1975), Clustering Algorithms. New York: John Wiley.
LEONTIEF, W.W. (1986), Input-Output Economics. Second Edition, New York: Oxford University Press.
LEONTIEF, W.W. (1967), "An Alternative to Aggregation in Input-Ouput Analysisin National Income Accounts," Review of Economics and Statistics, August.
LANCASTER, K.J. (1975), "Socially Optimal Product Differentiation," AmericanEconomic Review, pp. 567-85.
MCGUCKIN, R.H. and PASCOE G. (1988), "The Longitudinal Research Database: Status and Research Possibilities," Survey of Current Business, November, pp.30-37.
SAS Institute Inc. (1987) SAS/STAT Guide for Personal Computers, Version 6Edition. Cary, North Carolina.
U.S. Department of Commerce, Bureau of the Census, 1982 Census ofManufactures, General Summary, Subject Series, Government Printing Office,Washington, D.C., MC82-S-1.
U.S. Office of Management and Budget, Standard Industrial ClassificationManual, 1972, Government Printing Office, Washington, D.C.
WARD, J.H. (1963), "Hierarchical Grouping to Optimize an Objective Function,"Journal of the American Statistical Association, 58, 236-244.1