Embed Size (px)
Citation preview

The Reputation of Networks – RIPE Region
Manish Karir, Kyle Creyts(Merit Network Inc)

Outline
• Goal• Background: IPv4 address allocation distribution
in RIPE, commonly used blocklists• Analysis
– foreach(country, asn, bgp prefix)• SPAM Lists Distribution• Malware/Phishing Lists Distribution• Active Malicious Activity Lists• Highlight points of interest in data
• Network Reputation Discussion

The Problems
• How do you create incentives for the need to run a clean network
• How do you measure the relative security posture of a given network
• How do you balance the need to communicate with another network with the risks
• How can you estimate the likelihood of malicious activity from another network
• Can you assign a risk metric with a BGP path
You need to know about the historical and current reputation of networks

Network Reputation• Network reputation is an attempt to construct a metric or set of metrics
that illustrate the collective reputation of all hosts in your administrative domain
• While infected hosts and botnets are a fact of life, how much of such activity represents an acceptable level of network pollution 1%? 10% of all hosts?
• Hosts that engage in malicious activity such as spam, phishing, malware, scanning in a network reduce the externally visible global network reputation of that network – it does not go un-noticed
• Reputation of hosts on your network has an impact on the usability of your network as portions might get blocked for various services
• It can be seen that not all networks are equal when it comes to network reputation. What policies, topology, connectivity, other factors make some networks better than others? How can we learn from them?

Reputation based security policies
• Network reputation is not just something other people know about you.
• You can use it to craft flexible local policies which better manage your risk profile
• We are creating an index of reputation for networks based on aggregation of many diverse sources of reputation data

Reputation-based Security Policies
• Some Interesting possibilities:– BGP : For each path compute the relative
reputation over entire path or the lowest hop AS in any path and influence policy to avoid that path
– SPAM Scoring – use reputation of source in scoring, but more interestingly – bypass other checks if reputation is > 95

Other interesting possibilities
– Inbound Firewall – Allow all traffic to regular servers from sources with reputation > 10 but for reputation < 10 send traffic to alternate servers or services, require additional authentication etc
– Outbound traffic – disallow traffic to networks with poor reputation
– Making DPI viable/scalable for more people – normally route traffic for reputation > 30 but for poor reputation sources pass traffic through DPI for further inspection

Common -Host- Reputation Block Lists (RBLs)
• RBLs are mostly lists of IP addresses of domains that have been observed to participate in suspicious behavior
• RBLs can be clustered by type of activity on which it is based:– SPAM Lists: SPAMHAUS(CBL), BRBL, SpamCop, wpbl, UCEPROTECT– Malware/Phishing hosts: SURBL (multi), phishtank, hpHosts– Active Attack Behavior: Darknet Scanner (merit), Dshield, ssh
brute-force (fail2ban, denyhosts)• Our goal is to analyze relative distribution of hosts on these
lists to determine if there are some common traits that can broadly characterize the observed relative malicious activity originating from a country, ASN, and prefix

RIPE Address Space Distribution by Country
• Roughly 2.8M /24 blocks allocated ~ 733M IP addresses
• EU is 21% of allocations, GB, DE, FR, together account for another 30% of all allocations
EU DE IT ES SE CH DK UA CZ BE PT IE GR SA AE LT KZ
HR KW EE GE IS M
D M
K JO0
20000000
40000000
60000000
80000000
100000000
120000000
140000000
160000000
180000000
EU 21%
GB 11%
DE 11%
FR 9%
IT 5%
RU 5%
ES 3%
NL 3%
SE 3%
PL 2%
CH 2% TR 2%
SPAM Lists Distribution Analysis
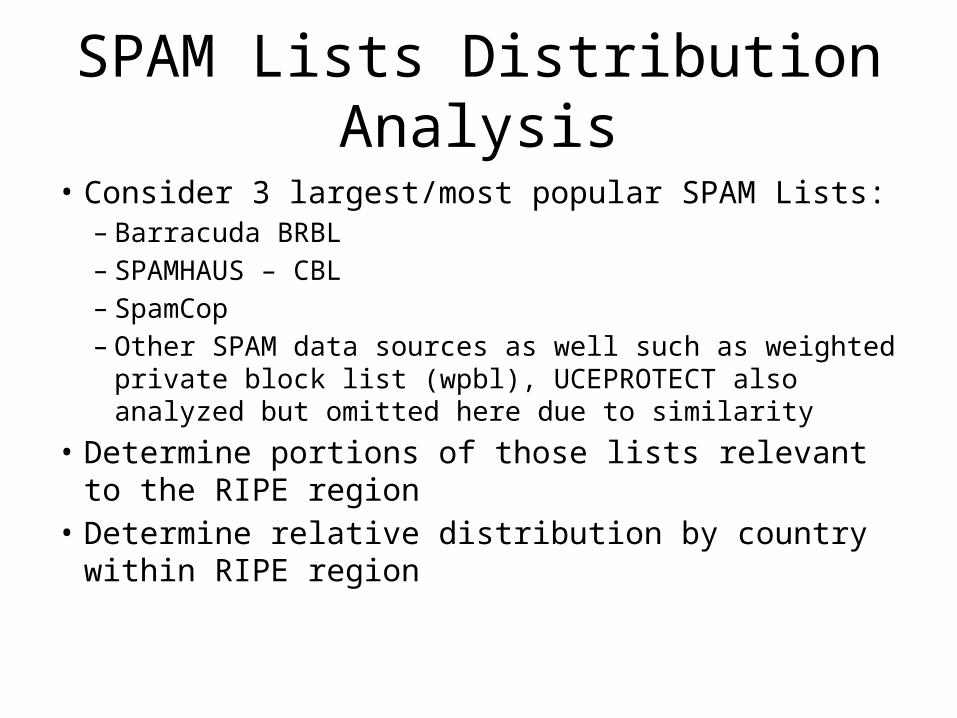
• Consider 3 largest/most popular SPAM Lists:– Barracuda BRBL– SPAMHAUS – CBL– SpamCop– Other SPAM data sources as well such as weighted private
block list (wpbl), UCEPROTECT also analyzed but omitted here due to similarity
• Determine portions of those lists relevant to the RIPE region
• Determine relative distribution by country within RIPE region
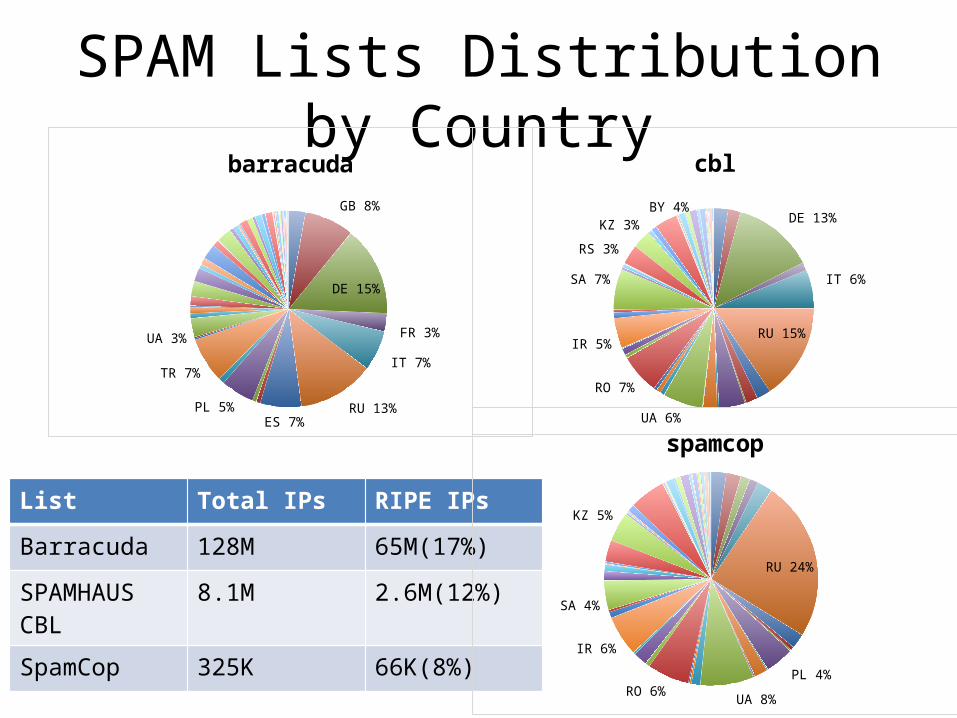
SPAM Lists Distribution by Country
List Total IPs RIPE IPs
Barracuda 128M 65M(17%)
SPAMHAUS CBL 8.1M 2.6M(12%)
SpamCop 325K 66K(8%)
GB 8%
DE 15%
FR 3% IT 7%
RU 13% ES 7%
PL 5%
TR 7%
UA 3%
barracuda
DE 13%
IT 6%
RU 15%
UA 6%
RO 7%
IR 5%
SA 7%
RS 3% KZ 3%
BY 4%
cbl
RU 24%
PL 4%
UA 8% RO 6%
IR 6%
SA 4%
KZ 5%
spamcop

SPAM List Relative Distribution
• In general: countries with larger allocations have more entries in block lists
• Expected – if you assume infection rates are a steady fact of life.
• This assumes that on average, a constant % of any given IP address range will be on a block list

Is this true?
• What happens when we look at block list entries relative to allocation sizes
• We should look at both the large and the small ends of allocation spectrum to remove allocation size from the equation
• What do we expect to see?

Relative SPAM List Distribution by Country
EU DE IT ES SE CH DK UA CZ BE PT IE GR SA AE LT KZ
HR KW EE GE IS M
D M
K JO0
2000000
4000000
6000000
8000000
10000000
12000000
0
20000000
40000000
60000000
80000000
100000000
120000000
140000000
160000000
180000000
Barracuda Reputation Block List
EU DE IT ES SE CH DK UA CZ BE PT IE GR SA AE LT KZ
HR KW EE GE IS M
D M
K JO0
0.1
0.2
0.3
0.4
0.5
0.6
0.7
0
20000000
40000000
60000000
80000000
100000000
120000000
140000000
160000000
180000000
Relative Barracuda Reputation Block List
Frac
tion
of A
ddre
ss S
pace
on
RBL
BRBL
IPs
Tota
l Add
ress
Spa
ceTo
tal A
ddre
ss S
pace

Relative SPAM List Distribution by Country
Frac
tion
of A
ddre
ss S
pace
on
RBL
EU DE IT ES SE CH DK UA CZ BE PT IE GR SA AE LT KZ
HR KW EE GE IS M
D M
K JO0
50000
100000
150000
200000
250000
300000
350000
400000
450000
0
20000000
40000000
60000000
80000000
100000000
120000000
140000000
160000000
180000000
EU DE IT ES SE CH DK UA CZ BE PT IE GR SA AE LT KZ
HR KW EE GE IS M
D M
K JO0
0.01
0.02
0.03
0.04
0.05
0.06
0.07
0.08
0
20000000
40000000
60000000
80000000
100000000
120000000
140000000
160000000
180000000
CBL
Relative CBL
Tota
l Add
ress
Spa
ceTo
tal A
ddre
ss S
pace
CBL
IPs

SPAM List Discussion• All networks are not created equal when it comes to entries on a
SPAM list• Interesting things to notice:
– Almost 65% of Belarus is on BRBL– Almost 40% of Saudi Arabia is on BRBL– Almost 35% of Turkey is on BRBL– Only 10% of Germany but that is a lot of IPs– More than half of the countries have greater than 10% of their IP addresses
on BRBL– Given the allocation sizes Netherlands, Sweden, Denmark and Norway have
unusually low listing rates on BRBL– Smaller percentages of listed IPs on other lists but the relative trends
between countries seem to be the same• What accounts for these regional variations? Local policy?
Connectivity? Network topology?

Relative SPAM List Distribution by Country
EU DE IT ES SE CH DK UA CZ BE PT IE GR SA AE LT KZ
HR KW EE GE IS M
D M
K JO0
2000000
4000000
6000000
8000000
10000000
12000000
0
20000000
40000000
60000000
80000000
100000000
120000000
140000000
160000000
180000000
Barracuda Reputation Block List
EU DE IT ES SE CH DK UA CZ BE PT IE GR SA AE LT KZ
HR KW EE GE IS M
D M
K JO0
0.1
0.2
0.3
0.4
0.5
0.6
0.7
0
20000000
40000000
60000000
80000000
100000000
120000000
140000000
160000000
180000000
Relative Barracuda Reputation Block List
Frac
tion
of A
ddre
ss S
pace
on
RBL
BRBL
IPs
Tota
l Add
ress
Spa
ceTo
tal A
ddre
ss S
pace

Malware/Phishing Lists Distribution Analysis
• Consider 3 common malware/phishing Lists:– SURBL-multi– hpHosts– phishtank– Other popular data sources such as
malwaredomains and malwaredomainsList are included in the SURBL-multi dataset
• Use same methodology as SPAM analysis
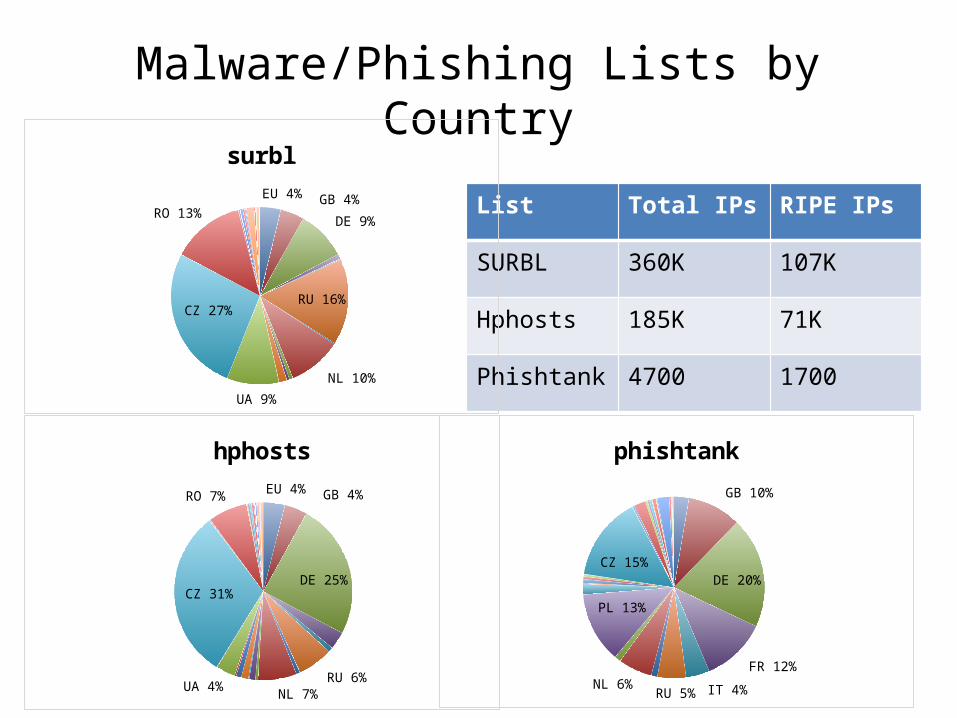
Malware/Phishing Lists by Country
List Total IPs RIPE IPs
SURBL 360K 107K
Hphosts 185K 71K
Phishtank 4700 1700
EU 4% GB 4%
DE 9%
RU 16%
NL 10%
UA 9%
CZ 27%
RO 13%
surbl
EU 4% GB 4%
DE 25%
RU 6% NL 7%
UA 4%
CZ 31%
RO 7%
hphosts GB 10%
DE 20%
FR 12%
IT 4% RU 5% NL 6%
PL 13%
CZ 15%
phishtank

Malware/Phishing Discussion
• Czech Republic relatively higher percentage of Malware/Phishing listed domains ~ 30% of all RIPE region domains
• Poland and France have a unusually high percentage of IPs listed as hosting phishing sites.
• Aside from Russia there appears to be little in common with SPAM blocklists

Malware/Phishing Lists by Country
List Total IPs RIPE IPs
SURBL 360K 107K
Hphosts 185K 71K
Phishtank 4700 1700
EU 4% GB 4%
DE 9%
RU 16%
NL 10%
UA 9%
CZ 27%
RO 13%
surbl
EU 4% GB 4%
DE 25%
RU 6% NL 7%
UA 4%
CZ 31%
RO 7%
hphosts GB 10%
DE 20%
FR 12%
IT 4% RU 5% NL 6%
PL 13%
CZ 15%
phishtank

Active Malicious Activity by Country
EU 9%
DE 10%
RU 23%
UA 11%
RO 8%
LT 9%
zeus
FR 6%
RU 21%
PL 4% TR 12%
UA 5%
RO 6%
dshield
IT 6%
RU 30% RO 7%
Darknet Scanning
DE 13%
RU 16%
UA 6%
ssh bruteforce
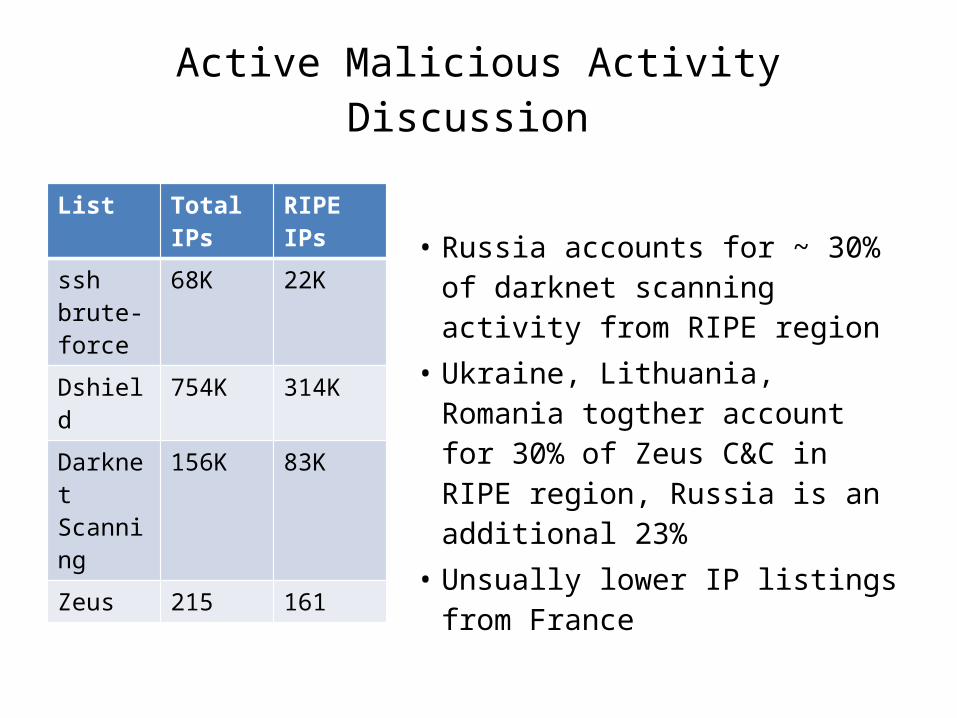
Active Malicious Activity Discussion
• Russia accounts for ~ 30% of darknet scanning activity from RIPE region
• Ukraine, Lithuania, Romania togther account for 30% of Zeus C&C in RIPE region, Russia is an additional 23%
• Unsually lower IP listings from France
List Total IPs RIPE IPsssh brute-force
68K 22K
Dshield 754K 314KDarknet Scanning
156K 83K
Zeus 215 161

Boundaries
• What are effective boundaries• What other boundaries can we use• National borders are not good enough for
making truly effective policy decisions• Certainly not good enough for making service
decisions

Address Distribution by ASN
• Roughly 16.5K ASNs in use in RIPE region• They account for roughly 88.1K of prefixes in the BGP routing table
(total 360K entries)• A total of 733.6M IPs• We focus on the largest 100 ASNs• Total number of IPs announced by these ASNs varies from 34M to
1.2M
332031399
32159121
155571267
320929328
68053303
56071257
914331334
54322200
673924608
1254241440
5538708
684813127
110120825
90506849
21161680
54005430
12730
5000000
10000000
15000000
20000000
25000000
30000000
35000000
40000000
total
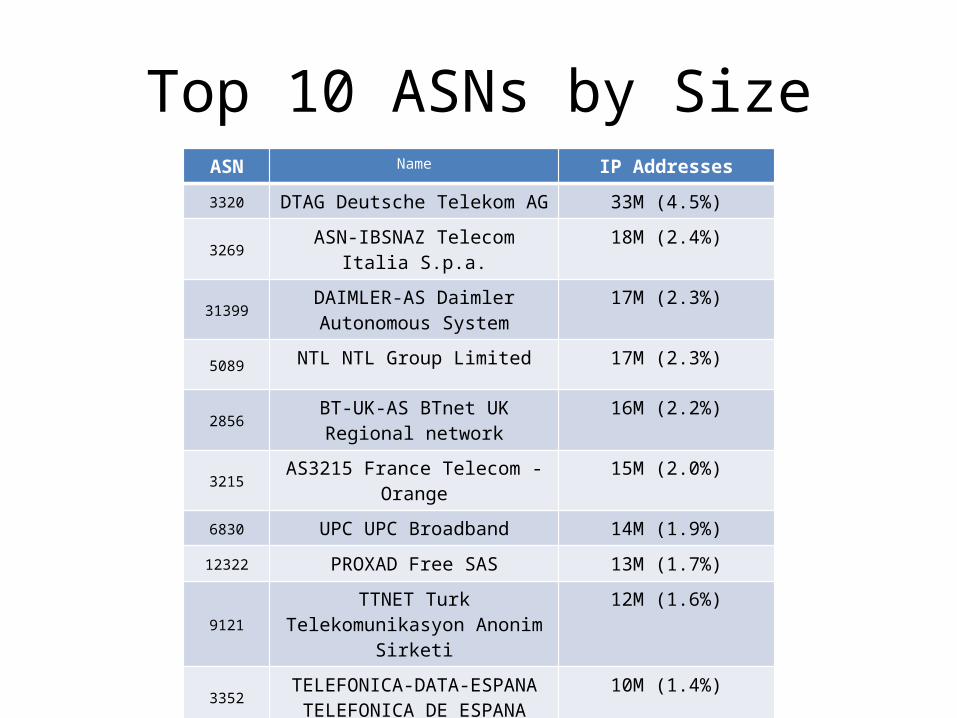
Top 10 ASNs by SizeASN Name IP Addresses
3320 DTAG Deutsche Telekom AG 33M (4.5%)
3269 ASN-IBSNAZ Telecom Italia S.p.a. 18M (2.4%)
31399DAIMLER-AS Daimler Autonomous
System17M (2.3%)
5089NTL NTL Group Limited 17M (2.3%)
2856BT-UK-AS BTnet UK Regional
network16M (2.2%)
3215 AS3215 France Telecom - Orange 15M (2.0%)
6830 UPC UPC Broadband 14M (1.9%)
12322 PROXAD Free SAS 13M (1.7%)
9121TTNET Turk Telekomunikasyon
Anonim Sirketi12M (1.6%)
3352TELEFONICA-DATA-ESPANA
TELEFONICA DE ESPANA10M (1.4%)

SPAM List IP Distribution by ASN
332031399
32159121
155571267
320929328
68053303
56071257
914331334
54322200
673924608
1254241440
5538708
684813127
110120825
90506849
21161680
54005430
12730
0.2
0.4
0.6
0.8
1
1.2
0
5000000
10000000
15000000
20000000
25000000
30000000
35000000
40000000
2856
9121
1267
5617 13285
25019
5384
6799 91988997
13184
6849
332031399
32159121
155571267
320929328
68053303
56071257
914331334
54322200
673924608
1254241440
5538708
684813127
110120825
90506849
21161680
54005430
12730
1000000
2000000
3000000
4000000
5000000
6000000
7000000
0
5000000
10000000
15000000
20000000
25000000
30000000
35000000
40000000
3320
2856
9121
561713285
25019
BRBL
Relative BRBL
TTNET
DTAG SAUDINETTPNET
SAUDINET
TTNETTPNET
KHZAKTELECOMOTENET
UKRTELECOM
Ratio
of A
ddre
ss S
pace
BRBL
IPs
Tota
l Add
ress
Spa
ceTo
tal A
ddre
ss S
pace
BTNET
BTNET
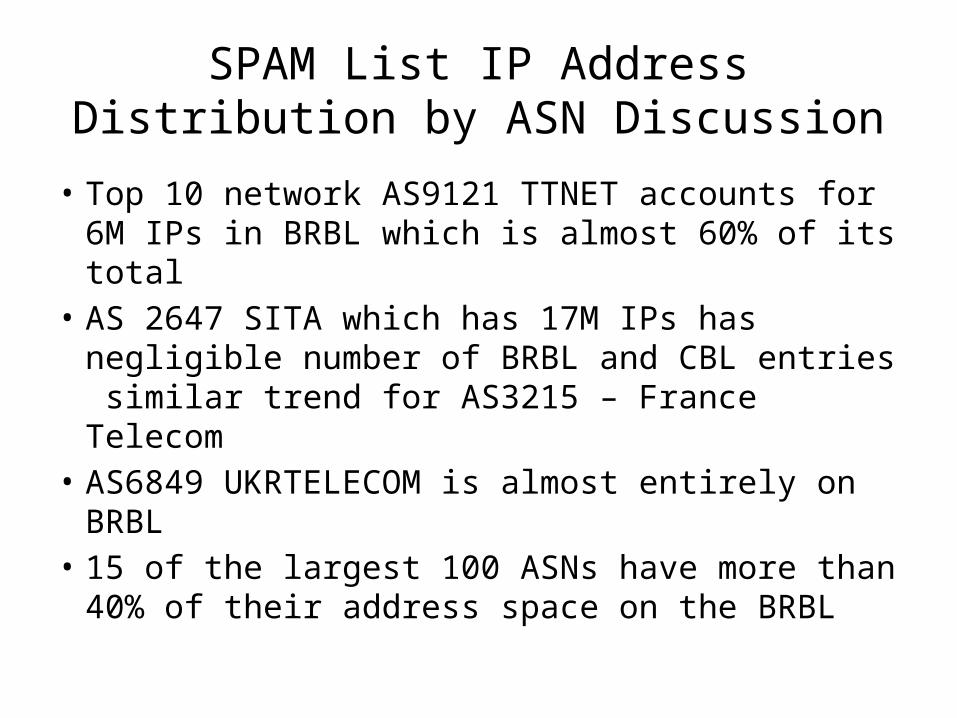
SPAM List IP Address Distribution by ASN Discussion
• Top 10 network AS9121 TTNET accounts for 6M IPs in BRBL which is almost 60% of its total
• AS 2647 SITA which has 17M IPs has negligible number of BRBL and CBL entries similar trend for AS3215 – France Telecom
• AS6849 UKRTELECOM is almost entirely on BRBL
• 15 of the largest 100 ASNs have more than 40% of their address space on the BRBL

ASN IP Blocklisting Distribution
1 49 97 1451932412893373854334815295776256737217698178659139610
0.2
0.4
0.6
0.8
1
1.2
0
2000000
4000000
6000000
8000000
10000000
12000000 • Top 1000 ASNs with largest percentage of their networks on SPAM blocklists
• Almost 500 ASNs have atleast 40% of their Ips on BRBL
• Almost 200 ASNs have at least 5% of their IPs on CBL
1 49 97 1451932412893373854334815295776256737217698178659139610
0.05
0.1
0.15
0.2
0.25
0.3
0.35
0.4
0.45
0
2000000
4000000
6000000
8000000
10000000
12000000
CBL
BRBL

Malware/Phishing Domains Distribution by ASN
44557 12%
44546 12%
16138 8%
16276 6%
15598 5%24940 5%24961 4%47583 4%24867 3%12322 2%
3216 2%8708 2%
21155 2%8622 2%
12824 1%
21069 1%
8972 1%8660 1%
39647 1%
phishtank
• AS5610 - Telefonica O2, Czech Republic represents 30% of SURBL RIPE region entries and 47% of hphosts entries
• AS 3257 - TINET-BACKBONE Tinet is the next highest contributor
• AS 44557 (Dragonara) and AS4546 (AlfaTelecom)- together represent 25% of the RIPE region phishtank listings
5610 31%
3257 8%
3216 4%197088 4%15535 4%
surbl
5610 47%
3257 15%
hphosts

Active Malicious Activity by ASN
8402 24%
6830 6%
3269 4%
5617 3%
Darknet Scanners
9121 8%
8402 7%
34619 7%
8452 4%
6830 4%
dshield
9121 8%
6724 6%
12322 4%
5617 4%
8452 3%
denyhosts
47583 9%
25406 9%
12695 5%
16125 4%
16265 4%
56773 3%
zeus

Active Malicious Activity Discussion
• AS9121 - TTNET Turk Telekomunikasyon accounts for almost 25% of darknet scanning IPs from RIPE region
• AS9121 – TTNET Turk Telekomunikasyon is also almost 10% of IPs on ssh-brute-force activity lists as well as dshield. Unsually lower IP listings from France
• Zeus list IPs too few for meaningful results but more than half of all reported C&C IPs are in RIPE region.
List Total IPs RIPE IPsssh brute-force
65K 22K
Dshield 754K 314KDarknet Scanning
158K 83K
Zeus 215 161

Are ASNs the most useful boundary?
• ASN does not necessarily indicate administrative domain
• How can we more effectively identify administrative domains
• We used prefixes observed from our view• Quality of reputation data, and proper
identification of administrative domains should evolve from additional views
BGP Prefix SPAM List IP Distribution
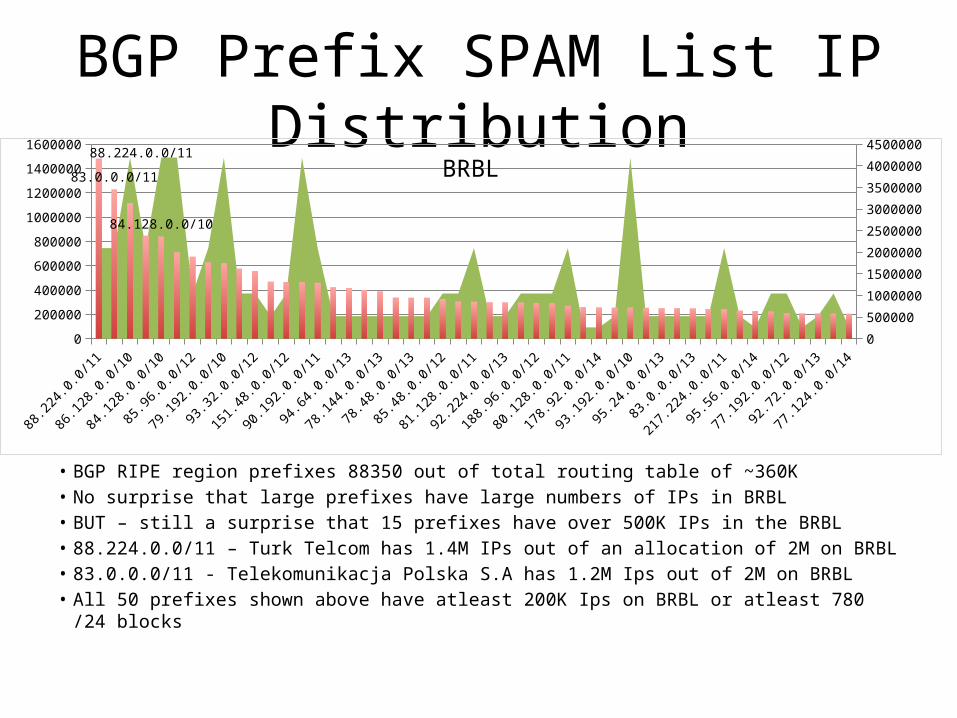
• BGP RIPE region prefixes 88350 out of total routing table of ~360K• No surprise that large prefixes have large numbers of IPs in BRBL• BUT – still a surprise that 15 prefixes have over 500K IPs in the BRBL• 88.224.0.0/11 – Turk Telcom has 1.4M IPs out of an allocation of 2M on BRBL• 83.0.0.0/11 - Telekomunikacja Polska S.A has 1.2M Ips out of 2M on BRBL• All 50 prefixes shown above have atleast 200K Ips on BRBL or atleast 780 /24
blocks
88.224.0.0/11
86.128.0.0/10
84.128.0.0/10
85.96.0.0/12
79.192.0.0/10
93.32.0.0/12
151.48.0.0/12
90.192.0.0/11
94.64.0.0/13
78.144.0.0/13
78.48.0.0/13
85.48.0.0/12
81.128.0.0/11
92.224.0.0/13
188.96.0.0/12
80.128.0.0/11
178.92.0.0/14
93.192.0.0/10
95.24.0.0/13
83.0.0.0/13
217.224.0.0/11
95.56.0.0/14
77.192.0.0/12
92.72.0.0/13
77.124.0.0/14
0
200000
400000
600000
800000
1000000
1200000
1400000
1600000
0
500000
1000000
1500000
2000000
2500000
3000000
3500000
4000000
450000088.224.0.0/11
83.0.0.0/11
84.128.0.0/10
BRBL
BGP Prefix SPAM List IP Distribution
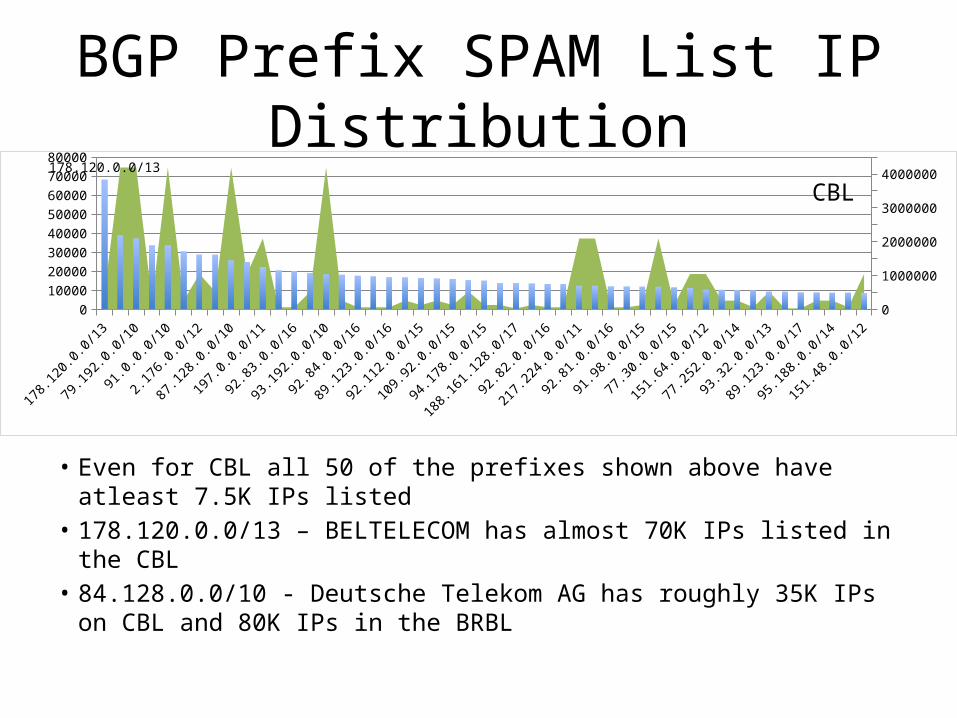
• Even for CBL all 50 of the prefixes shown above have atleast 7.5K IPs listed
• 178.120.0.0/13 – BELTELECOM has almost 70K IPs listed in the CBL• 84.128.0.0/10 - Deutsche Telekom AG has roughly 35K IPs on CBL
and 80K IPs in the BRBL
178.120.0.0/13
79.192.0.0/10
91.0.0.0/10
2.176.0.0/12
87.128.0.0/10
197.0.0.0/11
92.83.0.0/16
93.192.0.0/10
92.84.0.0/16
89.123.0.0/16
92.112.0.0/15
109.92.0.0/15
94.178.0.0/15
188.161.128.0/17
92.82.0.0/16
217.224.0.0/11
92.81.0.0/16
91.98.0.0/15
77.30.0.0/15
151.64.0.0/12
77.252.0.0/14
93.32.0.0/13
89.123.0.0/17
95.188.0.0/14
151.48.0.0/12
0
10000
20000
30000
40000
50000
60000
70000
80000
050000010000001500000200000025000003000000350000040000004500000
178.120.0.0/13
CBL

Relative Amounts of IP addresses in SPAM lists
92.255.216.0/22
94.180.160.0/22
94.180.148.0/22
212.220.100.0/24
84.240.203.0/24
93.81.8.0/21
95.79.72.0/22
92.46.25.0/24
94.180.24.0/22
94.181.52.0/22
94.181.156.0/22
212.220.55.0/24
89.179.24.0/23
85.132.91.0/24
95.66.41.0/24
188.186.132.0/22
94.231.160.0/20
94.20.32.0/24
188.186.48.0/22
79.127.2.0/24
89.179.104.0/22
84.240.206.0/24
85.132.110.0/24
95.78.32.0/22
91.202.134.0/23
0
0.2
0.4
0.6
0.8
1
1.2
050010001500200025003000350040004500
• 253 prefixes are completely included• Over 3500 prefixes out of all RIPE region prefixes
have over 85% of their IP address block listed in the BRBL
BRBL-R
Relative Amounts of IP Address in SPAM Lists
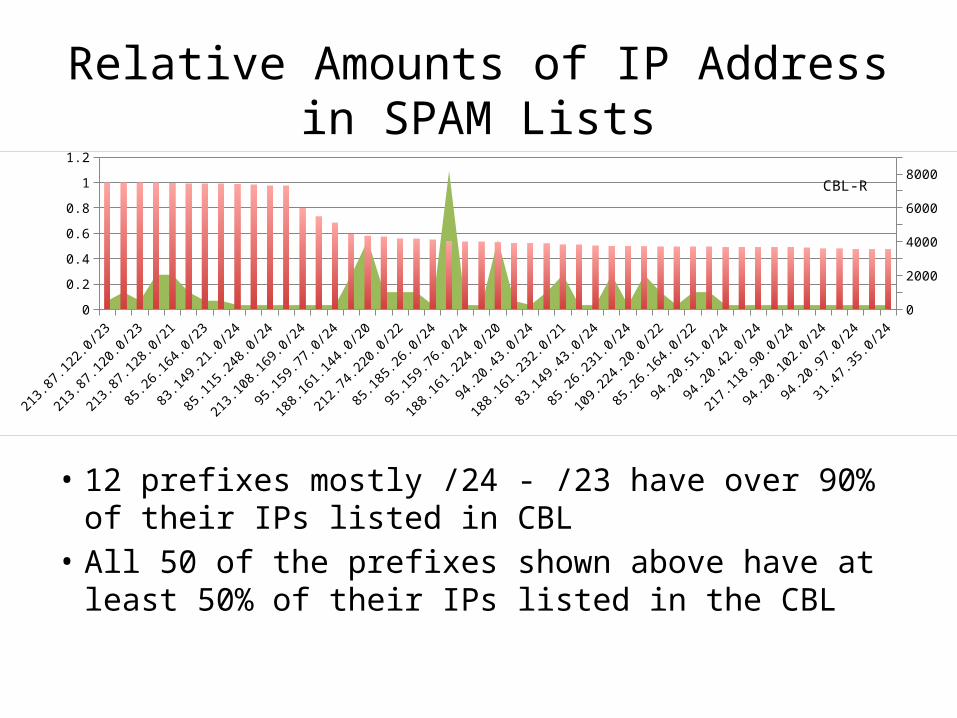
• 12 prefixes mostly /24 - /23 have over 90% of their IPs listed in CBL
• All 50 of the prefixes shown above have at least 50% of their IPs listed in the CBL
213.87.122.0/23
213.87.120.0/23
213.87.128.0/21
85.26.164.0/23
83.149.21.0/24
85.115.248.0/24
213.108.169.0/24
95.159.77.0/24
188.161.144.0/20
212.74.220.0/22
85.185.26.0/24
95.159.76.0/24
188.161.224.0/20
94.20.43.0/24
188.161.232.0/21
83.149.43.0/24
85.26.231.0/24
109.224.20.0/22
85.26.164.0/22
94.20.51.0/24
94.20.42.0/24
217.118.90.0/24
94.20.102.0/24
94.20.97.0/24
31.47.35.0/24
0
0.2
0.4
0.6
0.8
1
1.2
0100020003000400050006000700080009000
CBL-R

Malware/Phishing Hosting IP Address Distribution
90.176.0.0/13 19%
90.180.0.0/14 19%
67.218.208.0/20 8%
91.216.141.0/24 5%
surbl
90.176.0.0/13 28%
90.180.0.0/14 28%217.20.112.0/20 13%
hphosts
• Relative percentages of IPs for the top 50 prefixes for each data type are shown above
• 90.176.0.0/13 and 90.180.0.0/14 - Telefonica O2 Czech Republic appear on both lists. Together 40% of SURBL entries and 56% of hphosts entries

Active Malicious Activity List IP Distribution
• Relative percentages of IPs in the top 50 prefixes are shown above
• 95.24.0.0/13, 2.92.0.0/14, 93.80.0.0/15 and 95.26.0.0/15 - CORBINA TELECOM accounts for 31% of all scanning IPs in the top 50 prefixes in RIPE region
• 94.73.145.0/24 - Cizgi Telekom is almost 22% of the activity from top 50 prefixes in RIPE region
• 85.214.0.0/16 and 85.214.0.0/15 - Strato AG represent 18% of ssh brute-force activity
• 88.160.0.0/11 ProXad network – and 88.224.0.0/11 – Turk Telecom account for another 13%.
94.73.145.0/24 22%
41.232.0.0/13 6%
95.24.0.0/13 6%
88.224.0.0/11 5%
dshield95.24.0.0/13 16%
2.92.0.0/14 6%
95.26.0.0/15 5%
95.28.0.0/15 4%
93.80.0.0/15 4%
Darknet Scanners
85.214.0.0/16 9%
85.214.0.0/15 9%
88.160.0.0/11 8%
88.224.0.0/11 5%
85.25.0.0/16 5%
denyhosts
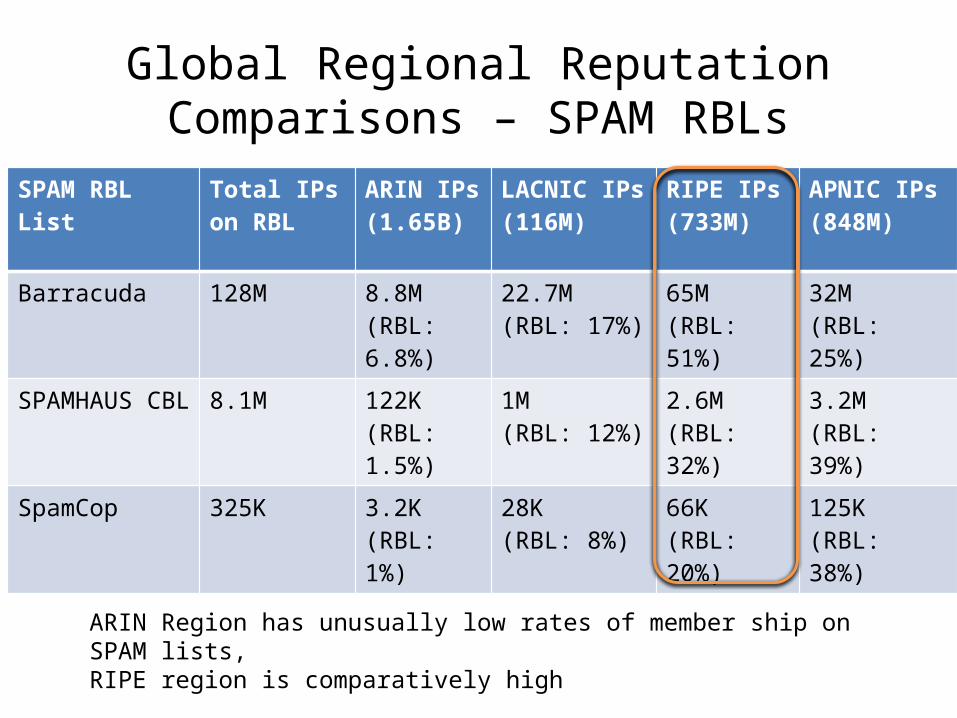
Global Regional Reputation Comparisons – SPAM RBLs
SPAM RBL List Total IPs on RBL
ARIN IPs (1.65B)
LACNIC IPs (116M)
RIPE IPs (733M)
APNIC IPs (848M)
Barracuda 128M 8.8M (RBL: 6.8%)
22.7M (RBL: 17%)
65M (RBL: 51%)
32M (RBL: 25%)
SPAMHAUS CBL 8.1M 122K (RBL: 1.5%)
1M (RBL: 12%)
2.6M (RBL: 32%)
3.2M (RBL: 39%)
SpamCop 325K 3.2K (RBL: 1%)
28K (RBL: 8%)
66K (RBL: 20%)
125K(RBL: 38%)
ARIN Region has unusually low rates of member ship on SPAM lists, RIPE region is comparatively high

Global Regional Reputation Comparisons – Malware RBLs
Malware RBL List
Total IPs on RBL
ARIN (Total IPs: 1.65B)
LACNIC (Total IPs: 116M)
RIPE (Total IPs: 733M)
APNIC (Total IPs: 848M)
SURBL 360K 194K (RBL: 54%)
3K (RBL: <1%)
107K (RBL: 30%)
51K (RBL: 14%)
Hphosts 185K 94K (RBL: 51%)
2K(RBL: <2%)
71K (RBL: 38%)
17K (RBL: 9%)
Phishtank 4700 2627 (RBL: 56%)
124 (RBL: < 3%)
1700 (RBL: 36%)
216(RBL: 4%)
ARIN Region has unusually high rates of membership on malware lists, RIPE region is also high, LACNIC and APNIC regions comparatively lower

Global Regional Comparisons – Active Malicious Activity RBLs
Active Malicious RBL List
Total IPs on RBL
ARIN (Total IPs: 1.65B)
LACNIC (Total IPs: 116M)
RIPE (Total IPs: 733M)
APNIC (Total IPs: 848M)
ssh brute-force
68K 11K (RBL: 16%)
11.6K (RBL: 17%)
22K (RBL: 32%)
20K (RBL: 29%)
Dshield 754K 128K (RBL: 17%)
61K (RBL: 8%)
314K (RBL: 42%)
224K (RBL: 29%)
Darknet Scanning
156K 7.8K (RBL: 5%)
28K (RBL: 17%)
83K (RBL: 53%)
36K (RBL: 23%)
Zeus 215 35 (RBL: 16%)
1(RBL: 0%)
161 (RBL: 75%)
17 (RBL: 8%)
RIPE region has comparatively higher rates of membership on active malicious activity lists

Conclusions and Future Work• Our goal is to develop a comprehensive global network reputation system
that computes, for each prefix you observe in the BGP routing table, a reputation metric.
• Variations can allow arbitrary network boundaries not simply BGP boundaries but that is the starting point
• Data from common sources such as RBLs are a starting point for bootstrapping the reputation system, however in order to be successful the system must have data from many many vantage points
• Different networks have different views of reputations of other networks• The more vantage points you have the closer to “true reputation you will get”• The system must allow all networks to participate and contribute reputation
information regarding all other networks while being resistant to collusion and false reporting
• Current project at Merit Network Inc is building such a system and an effort will soon be made to recruit participant networks on various mailing lists
• If you would like to participate please send email to: [email protected]• How reputable is your network?