Embed Size (px)
Citation preview
The Replacement Mix
Introduction of a Method for the Assessment of District Heat from CHP in the European Union Regarding Primary Energy
Final Report © FfE, July 2012

The Replacement Mix
Introduction of a Method for the Assessment of District Heat from CHP in the European Union Regarding Primary Energy
Client: AGFW - German Heat and Power Association
FfE Order No.: AGFW-02
Author: Dipl.-Ing. Luis Carr
Completion: July 2012
Imprint:
Final Report of The Research Center for Energy Economics (Forschungsstelle für Energiewirtschaft e.V.), (FfE)
For the Project:
The Replacement Mix
Introduction of a Method for the Assessment of District Heat from CHP in the European Union Regarding Primary Energy
Client: AGFW - German Heat and Power Association
Contact:
Am Blütenanger 71 80995 Munich, Germany Ph.: +49 (0) 89 158121-0 Fax: +49 (0) 89 158121-10 E-Mail: [email protected] Internet: www.ffe.de/en
Scientific Director: Prof. Dr.-Ing. U. Wagner
Managing Director: Prof. Dr.-Ing. W. Mauch
Project-Manager: Dipl.-Phys. R. Corradini
Inhaltsverzeichnis i
Contents
1 Background and Motivation .............................................................................. 1
2 Method for the Energetic Allocation of CHP .................................................... 3
3 The German Replacement Mix - Concept and Conclusions ........................... 5
4 The Replacement Mix for the EU ...................................................................... 7
4.1 Logic for a Simplified Replacement Mix for the EU .................................................. 7
4.2 Calculation of a Simplified Replacement Mix for the EU .......................................... 7
5 Average Primary Energy Factor for the EU ................................................... 11
5.1 Average Annual Gross Electrical Efficiency ............................................................11
5.2 Average Annual Net Electrical Efficiency ................................................................13
5.3 Calculation of an Average Primary Energy Factor for the EU .................................14
6 CO2 Emission Coefficients .............................................................................. 17
7 Conclusion and Outlook .................................................................................. 19
8 Bibliography ..................................................................................................... 20
9 Annex ................................................................................................................ 22

1
The Replacement Mix
An Assessment of District Heat in the European Union Regarding Primary Energy
1 Background and Motivation
As stated in the EU-Directive 2004/8/EC on the promotion of cogeneration, “The
potential for use of cogeneration as a measure to save energy is underused in the
Community at present.” /EU–02 04/
The supply of district heat generated in highly efficient combined heat and power (CHP)
plants is a reasonable and well-established measure to increase energy efficiency and to
promote the resource saving use of primary energy carriers in the European Union (EU).
Regarding the different climatic conditions in the member states of the EU, apart from
district heating, the supply of district cooling from CHP could also be a viable option to
increase the share of CHP.
In order to establish the expansion of CHP in the EU, it is necessary to be able to assess
the actual primary energy saving potential for district heat/cold from CHP in comparison
to other technologies. In Germany, the so called “Stromgutschriftmethode” (“Power
Bonus Method”) as part of the EnEV (German Energy Savings Ordinance) /ENEV–01 07/
is a common method for the allocation of primary energy and CO2-emissions for district
heat from CHP.
This allocation method will form the basis for the assessment of district heat from CHP
in this study. But it has to be considered, that the increasing share of renewable energy
sources (RES) in EU, as depicted in Figure 1-1, has a major influence on this allocation
method, as the calculated primary energy factor for district heat, that is calculated based
on the standard fuel mix for electricity, increases even though CHP does not compete
with RES from an market-based point of view. In order to address this methodical
disadvantage, the Research Center for Energy Economics (FfE) has introduced a method
for the calculation of a primary energy factor for district heat from CHP applying the
concept of the so called “Replacement Mix” for Germany /FFE-27 09/. By now, this
method has been incorporated into the German prestandard DIN V 18599-1:2011 -12
/DIN–02 11/.
Generally, the assessment of the primary energy input for the electricity generation from
CHP strongly depends on the according primary energy factor. Regarding the EU, only a
very simplified suggestion is made in case no national primary energy factor is available:
the EU-Directive 2006/32/EC on energy end-use efficiency and energy services proposes
that “for savings in kWh electricity Member States may apply a default co-efficient of 2,5
reflecting the estimated 40 % average EU generation efficiency during the target period.”
/EU–03 06/.
In order to make this allocation method based on the Replacement Mix available for the
Member States of the European Union, this study will introduce a simplified, uniform
and comprehensible concept for the Replacement Mix that can be applied for each
member state (EU-27). Based on the resulting Replacement Mixes, a primary energy
factor for the electricity from CHP will be calculated for each member state. This

2 Background and Motivation
primary energy factor will form the basis for the quantification of CO2-emission savings
as well as the assessment of district heat from CHP regarding primary energy.
Figure 1-1: Renewable Energy Sources in the EU (EU-27) – Increase of installed
capacity from 1999 to 2008 /EUST-02 11/
0
50
100
150
200
250
300
1999 2000 2001 2002 2003 2004 2005 2006 2007 2008
Inst
alle
d C
apac
ity
[GW
]
PV & Geothermal Energy
Biomass
Wind Power
Hydro Power
©FfE AGFW-02 EU Verdrängungsmix_eV_00001
Logic for a Simplified Replacement Mix for the EU 3
2 Method for the Energetic Allocation of CHP
In CHP plants heat and electricity are generated simultaneously. Consequently, it is
difficult to precisely allocate the primary energy input, emissions or operating costs to
either of these energy outputs. In order to address this problem, different allocation
methods have been developed. This study will focus on the so called
“Stromgutschriftmethode” (“Power Bonus Method”), which is included in the German
Regulation for Energy Saving in Buildings and Building Systems (EnEV) /ENEV–01 07/.
This allocation method is based on the principle of energetic allocation.
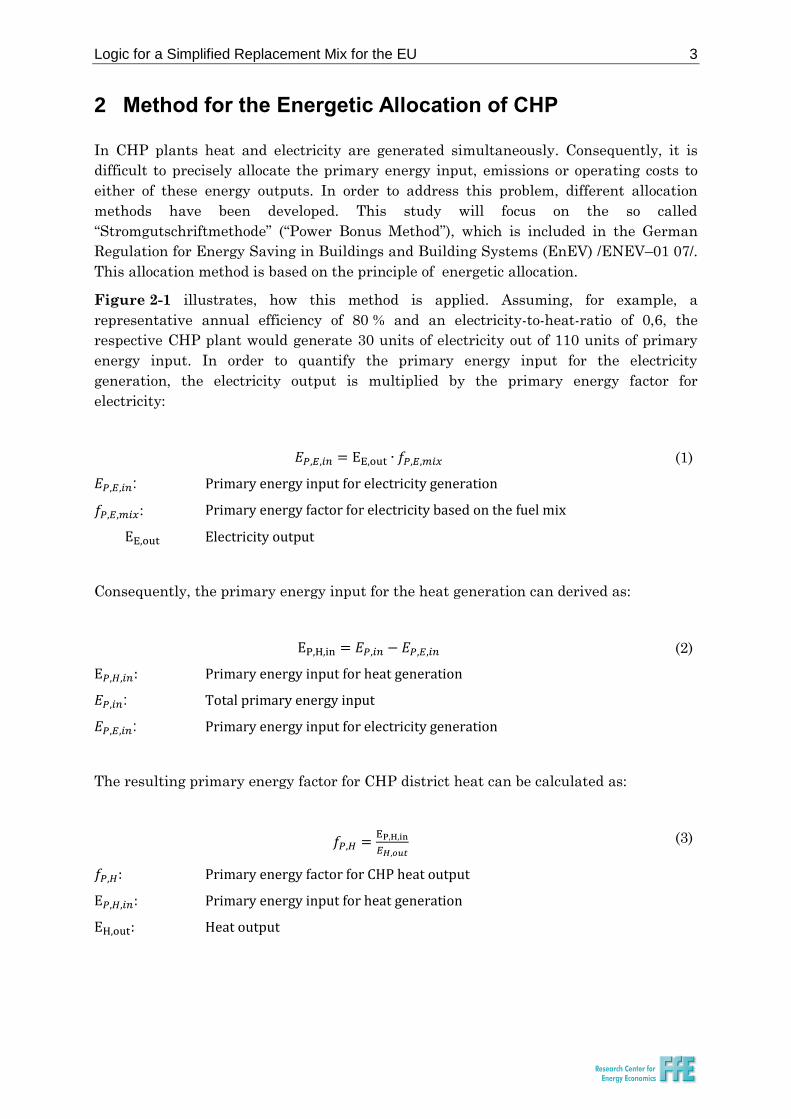
Figure 2-1 illustrates, how this method is applied. Assuming, for example, a
representative annual efficiency of 80 % and an electricity-to-heat-ratio of 0,6, the
respective CHP plant would generate 30 units of electricity out of 110 units of primary
energy input. In order to quantify the primary energy input for the electricity
generation, the electricity output is multiplied by the primary energy factor for
electricity:
(1)
: Primary energy input for electricity generation
: Primary energy factor for electricity based on the fuel mix
Electricity output
Consequently, the primary energy input for the heat generation can derived as:
(2)
Primary energy input for heat generation
: Total primary energy input
: Primary energy input for electricity generation
The resulting primary energy factor for CHP district heat can be calculated as:
(3)
Primary energy factor for CHP heat output
Primary energy input for heat generation
Heat output
4 Method for the Energetic Allocation of CHP
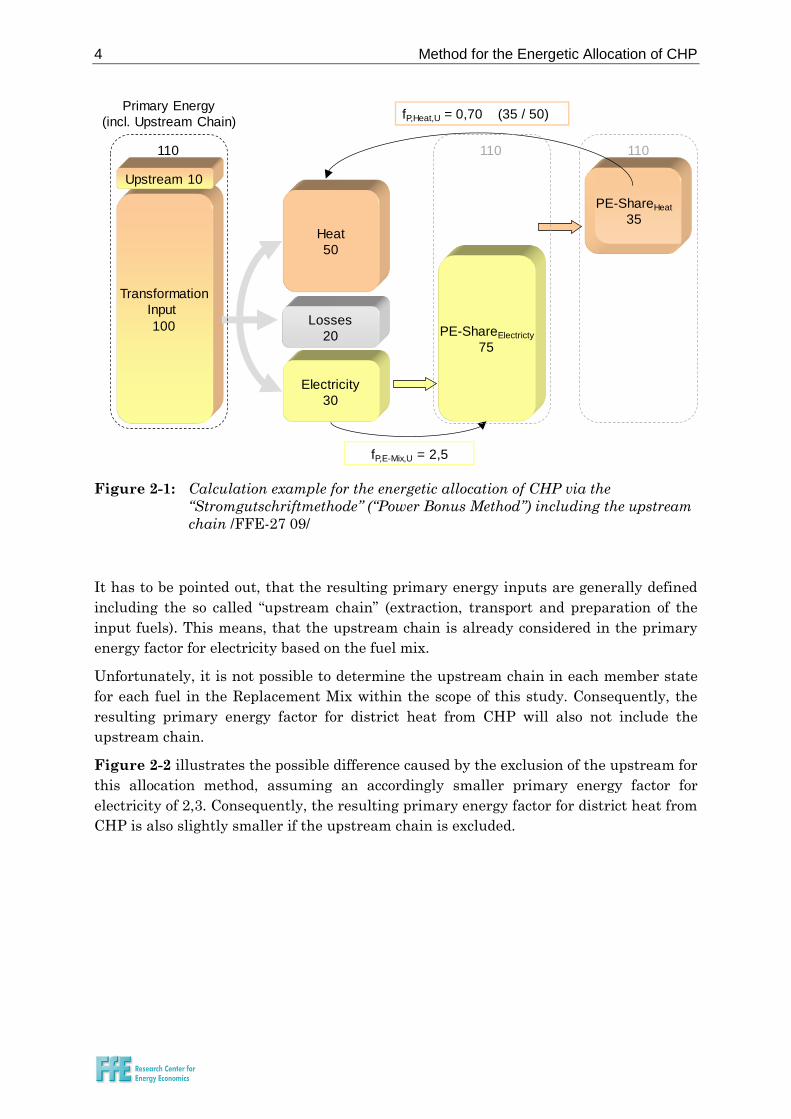
Figure 2-1: Calculation example for the energetic allocation of CHP via the
“Stromgutschriftmethode” (“Power Bonus Method”) including the upstream
chain /FFE-27 09/
It has to be pointed out, that the resulting primary energy inputs are generally defined
including the so called “upstream chain” (extraction, transport and preparation of the
input fuels). This means, that the upstream chain is already considered in the primary
energy factor for electricity based on the fuel mix.
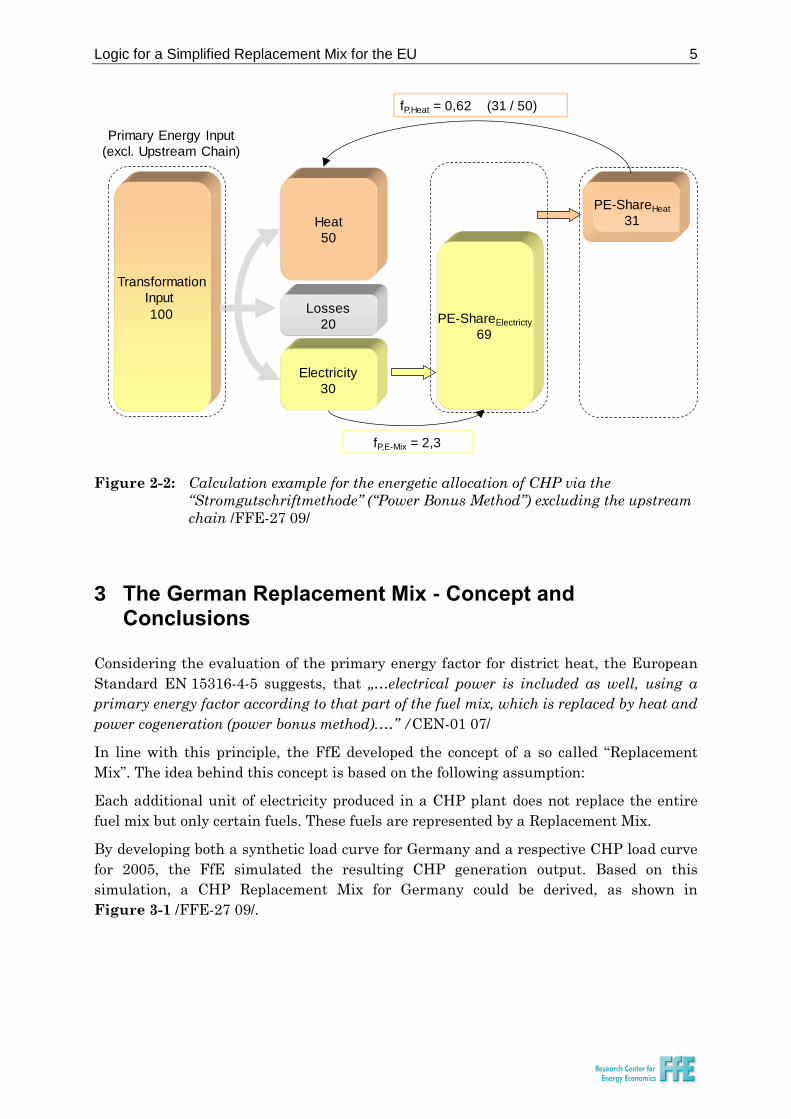
Unfortunately, it is not possible to determine the upstream chain in each member state
for each fuel in the Replacement Mix within the scope of this study. Consequently, the
resulting primary energy factor for district heat from CHP will also not include the
upstream chain.
Figure 2-2 illustrates the possible difference caused by the exclusion of the upstream for
this allocation method, assuming an accordingly smaller primary energy factor for
electricity of 2,3. Consequently, the resulting primary energy factor for district heat from
CHP is also slightly smaller if the upstream chain is excluded.
Heat
50
fP,E-Mix,U = 2,5
fP,Heat,U = 0,70 (35 / 50)
Transformation
Input
100 PE-ShareElectricty
75
Electricity
30
Losses
20
PE-ShareHeat
35
110 110 110
Upstream 10
Primary Energy
(incl. Upstream Chain)
Logic for a Simplified Replacement Mix for the EU 5
Figure 2-2: Calculation example for the energetic allocation of CHP via the
“Stromgutschriftmethode” (“Power Bonus Method”) excluding the upstream
chain /FFE-27 09/
3 The German Replacement Mix - Concept and Conclusions
Considering the evaluation of the primary energy factor for district heat, the European
Standard EN 15316-4-5 suggests, that „…electrical power is included as well, using a
primary energy factor according to that part of the fuel mix, which is replaced by heat and
power cogeneration (power bonus method).…” /CEN-01 07/
In line with this principle, the FfE developed the concept of a so called “Replacement
Mix”. The idea behind this concept is based on the following assumption:
Each additional unit of electricity produced in a CHP plant does not replace the entire
fuel mix but only certain fuels. These fuels are represented by a Replacement Mix.
By developing both a synthetic load curve for Germany and a respective CHP load curve
for 2005, the FfE simulated the resulting CHP generation output. Based on this
simulation, a CHP Replacement Mix for Germany could be derived, as shown in
Figure 3-1 /FFE-27 09/.
Heat
50
fP,E-Mix = 2,3
fP,Heat = 0,62 (31 / 50)
Transformation
Input
100 PE-ShareElectricty
69
Electricity
30
Losses
20
PE-ShareHeat
31
Primary Energy Input
(excl. Upstream Chain)
6 The German Replacement Mix - Concept and Conclusions
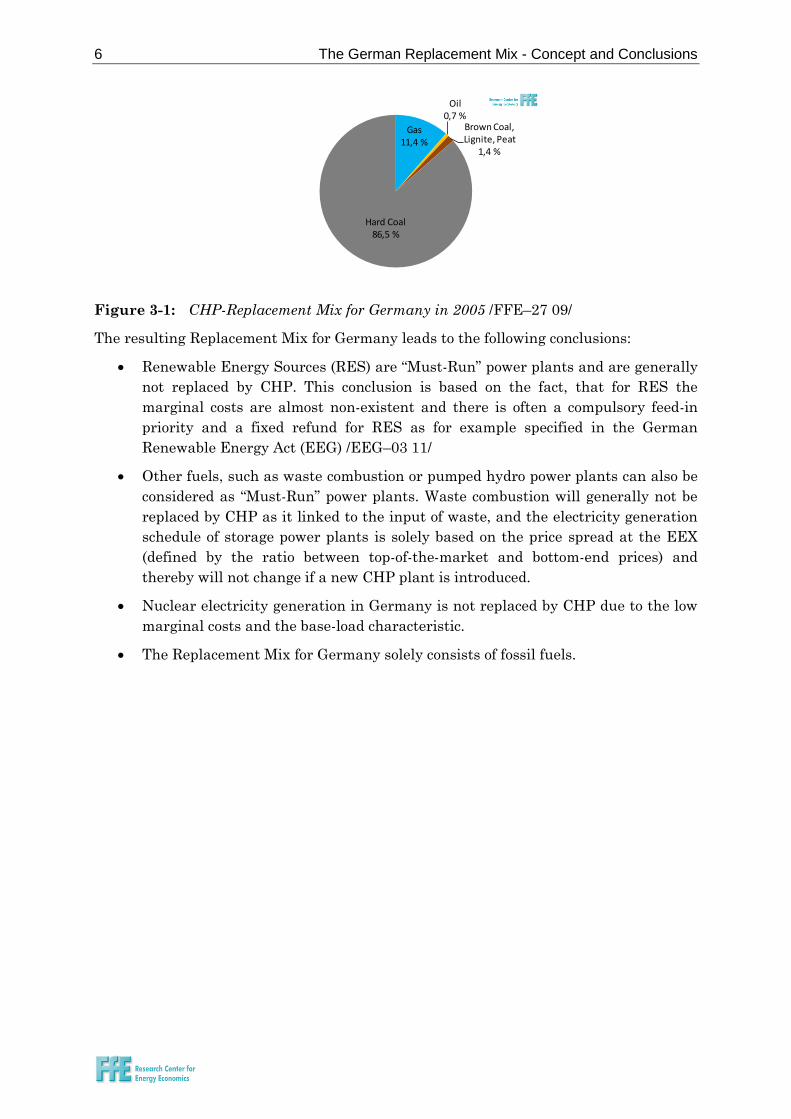
Figure 3-1: CHP-Replacement Mix for Germany in 2005 /FFE–27 09/
The resulting Replacement Mix for Germany leads to the following conclusions:
Renewable Energy Sources (RES) are “Must-Run” power plants and are generally
not replaced by CHP. This conclusion is based on the fact, that for RES the
marginal costs are almost non-existent and there is often a compulsory feed-in
priority and a fixed refund for RES as for example specified in the German
Renewable Energy Act (EEG) /EEG–03 11/
Other fuels, such as waste combustion or pumped hydro power plants can also be
considered as “Must-Run” power plants. Waste combustion will generally not be
replaced by CHP as it linked to the input of waste, and the electricity generation
schedule of storage power plants is solely based on the price spread at the EEX
(defined by the ratio between top-of-the-market and bottom-end prices) and
thereby will not change if a new CHP plant is introduced.
Nuclear electricity generation in Germany is not replaced by CHP due to the low
marginal costs and the base-load characteristic.
The Replacement Mix for Germany solely consists of fossil fuels.
Gas11,4 %
Oil0,7 %
Brown Coal, Lignite, Peat
1,4 %
Hard Coal86,5 %
Logic for a Simplified Replacement Mix for the EU 7
4 The Replacement Mix for the EU
Regarding the European Union (EU-27), it is not possible to simulate the load curves for
each member state within the scope of this study. Therefore, a simplified logic for the
Replacement Mix based on the conclusions from the German Replacement Mix will be
presented in this section.
4.1 Logic for a Simplified Replacement Mix for the EU
Despite the fact, that it is not possible to define a precise quantification of the share of
fuels that are replaced by CHP in each member state, a simplified estimation of a
comprehensible Replacement Mix can be derived.
Not all of the above-mentioned conclusions for the German Replacement Mix (see
Section 3) can be adopted for each member state of the EU without verification.
Therefore, the proposed simplified method for the calculation of a primary energy factor
solely consists of the assumption, that the electricity generation from renewable energy
sources (RES)1 is generally not replaced by CHP.
This assumption is in line with the definition of a non-renewable primary energy-factor
in the European Standard EN 15603:”…the conversion factors represent the overheads of
delivery of the point of use but exclude the renewable energy component of primary energy,
which may lead to primary energy conversion factor less than unity for renewable energy
sources.” /CEN–01 08/
4.2 Calculation of a Simplified Replacement Mix for the EU
In order to calculate the simplified Replacement Mix for each member state of the
EU-27, the fuel mix for each member state as well as for the adjoining electricity export
countries has to be defined. The share of electricity production by fuel type for 2009 has
been published by the European Environment Agency (EEA) /EEA–03 10/. This data set
is based on the annual statistical data provided by EUROSTAT /EUST–02 10/. Because
the EEA publication does not distinguish hard coal from brown coal (including peat and
lignite), the electricity generation from brown coal, lignite and peat was derived
separately from the EUROSTAT primary statistical data summarized in the data series
“Supply, transformation, consumption - electricity - annual data (nrg_105a)”
/EUST-01 09/.
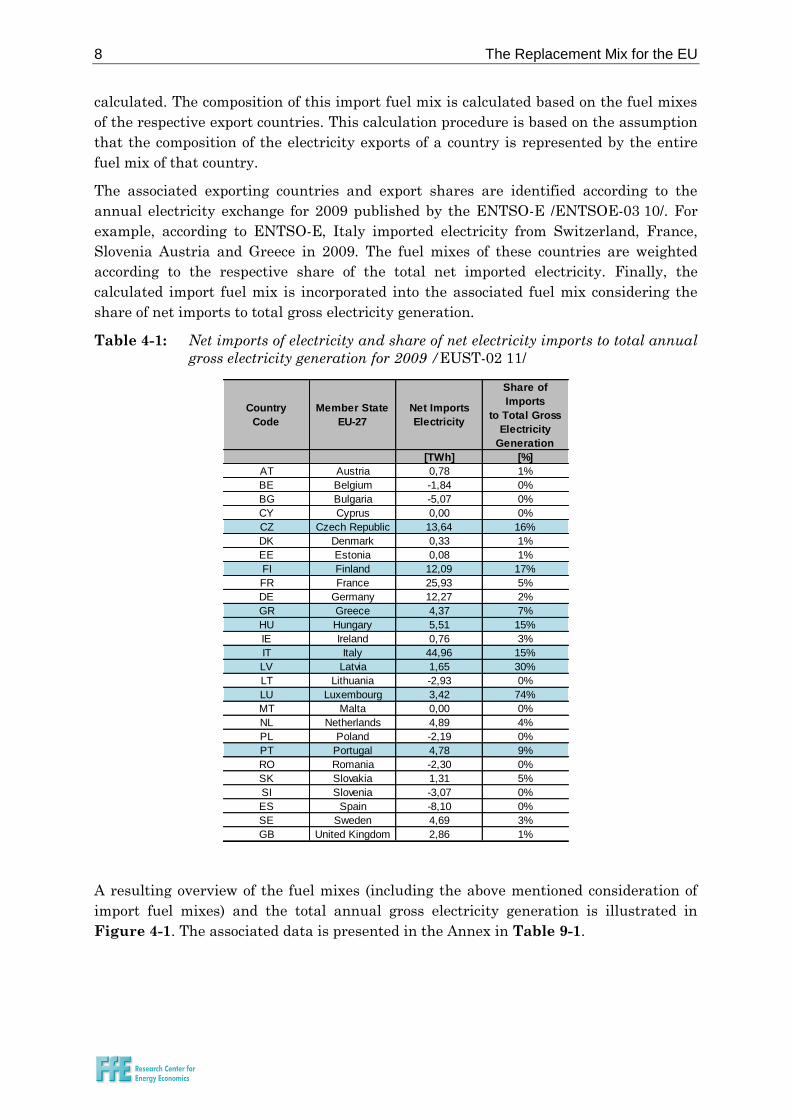
For the calculation of a Replacement Mix in each member state, it has to be considered,
that CHP can also replace electricity that is imported into a country. An evaluation of
the import share of electricity related to the total annual gross electricity generation is
given in Table 4-1. The member states with an electricity import ratio higher than 5 %
are considered separately. For those member states, a so called “import fuel mix” is
1 As the power plants depending on “other fuels“ such as waste combustion and pumped hydro
power can also be generally classified as “Must-Run” plants, they are also associated to the
renewable energy sources within the scope of this study.
8 The Replacement Mix for the EU
calculated. The composition of this import fuel mix is calculated based on the fuel mixes
of the respective export countries. This calculation procedure is based on the assumption
that the composition of the electricity exports of a country is represented by the entire
fuel mix of that country.
The associated exporting countries and export shares are identified according to the
annual electricity exchange for 2009 published by the ENTSO-E /ENTSOE-03 10/. For
example, according to ENTSO-E, Italy imported electricity from Switzerland, France,
Slovenia Austria and Greece in 2009. The fuel mixes of these countries are weighted
according to the respective share of the total net imported electricity. Finally, the
calculated import fuel mix is incorporated into the associated fuel mix considering the
share of net imports to total gross electricity generation.
Table 4-1: Net imports of electricity and share of net electricity imports to total annual
gross electricity generation for 2009 /EUST-02 11/
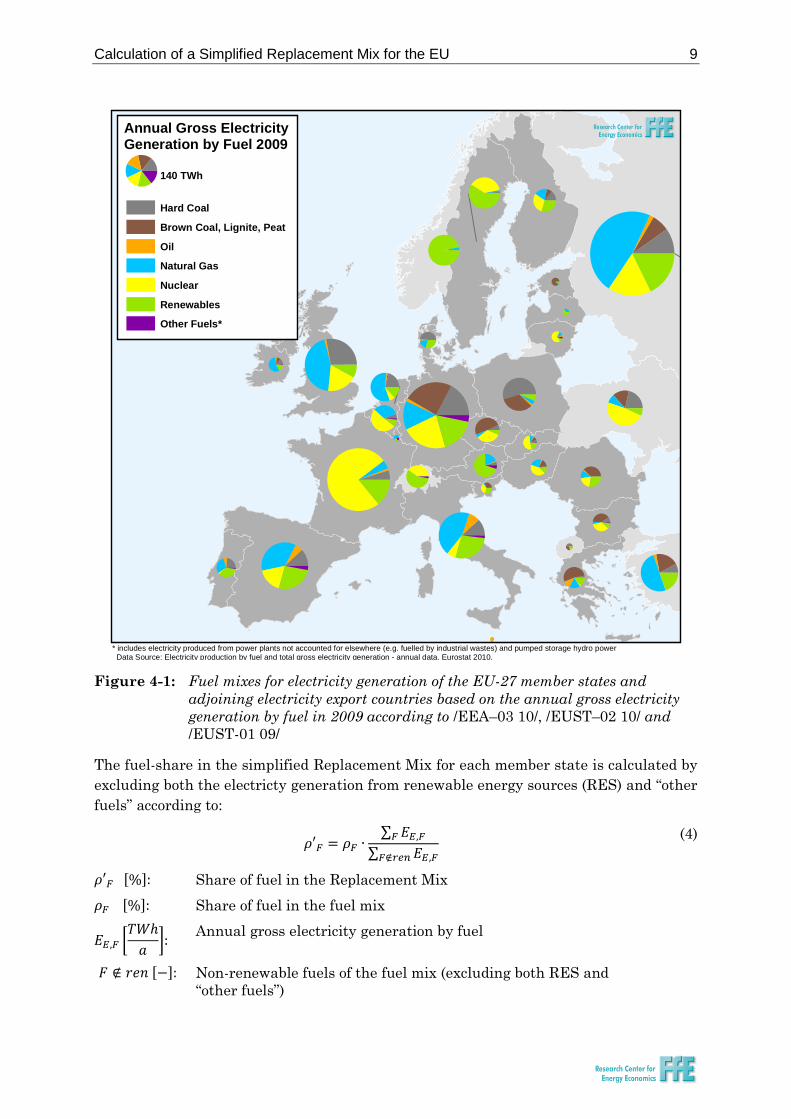
A resulting overview of the fuel mixes (including the above mentioned consideration of
import fuel mixes) and the total annual gross electricity generation is illustrated in
Figure 4-1. The associated data is presented in the Annex in Table 9-1.
Country
Code
Member State
EU-27
Net Imports
Electricity
Share of
Imports
to Total Gross
Electricity
Generation
[TWh] [%]
AT Austria 0,78 1%
BE Belgium -1,84 0%
BG Bulgaria -5,07 0%
CY Cyprus 0,00 0%
CZ Czech Republic 13,64 16%
DK Denmark 0,33 1%
EE Estonia 0,08 1%
FI Finland 12,09 17%
FR France 25,93 5%
DE Germany 12,27 2%
GR Greece 4,37 7%
HU Hungary 5,51 15%
IE Ireland 0,76 3%
IT Italy 44,96 15%
LV Latvia 1,65 30%
LT Lithuania -2,93 0%
LU Luxembourg 3,42 74%
MT Malta 0,00 0%
NL Netherlands 4,89 4%
PL Poland -2,19 0%
PT Portugal 4,78 9%
RO Romania -2,30 0%
SK Slovakia 1,31 5%
SI Slovenia -3,07 0%
ES Spain -8,10 0%
SE Sweden 4,69 3%
GB United Kingdom 2,86 1%
Calculation of a Simplified Replacement Mix for the EU 9
Figure 4-1: Fuel mixes for electricity generation of the EU-27 member states and
adjoining electricity export countries based on the annual gross electricity
generation by fuel in 2009 according to /EEA–03 10/, /EUST–02 10/ and
/EUST-01 09/
The fuel-share in the simplified Replacement Mix for each member state is calculated by
excluding both the electricty generation from renewable energy sources (RES) and “other
fuels” according to:
∑
∑
(4)
[ ] Share of fuel in the Replacement Mix
[ ] Share of fuel in the fuel mix
[
]
Annual gross electricity generation by fuel
[ ] Non-renewable fuels of the fuel mix (excluding both RES and
“other fuels”)
Annual Gross Electricity Generation by Fuel 2009
140 TWh
Hard Coal
Brown Coal, Lignite, Peat
Oil
Natural Gas
Nuclear
Renewables
Other Fuels*
* includes electricity produced from power plants not accounted for elsewhere (e.g. fuelled by industrial wastes) and pumped storage hydro power Data Source: Electricity production by fuel and total gross electricity generation - annual data. Eurostat 2010.
10 The Replacement Mix for the EU
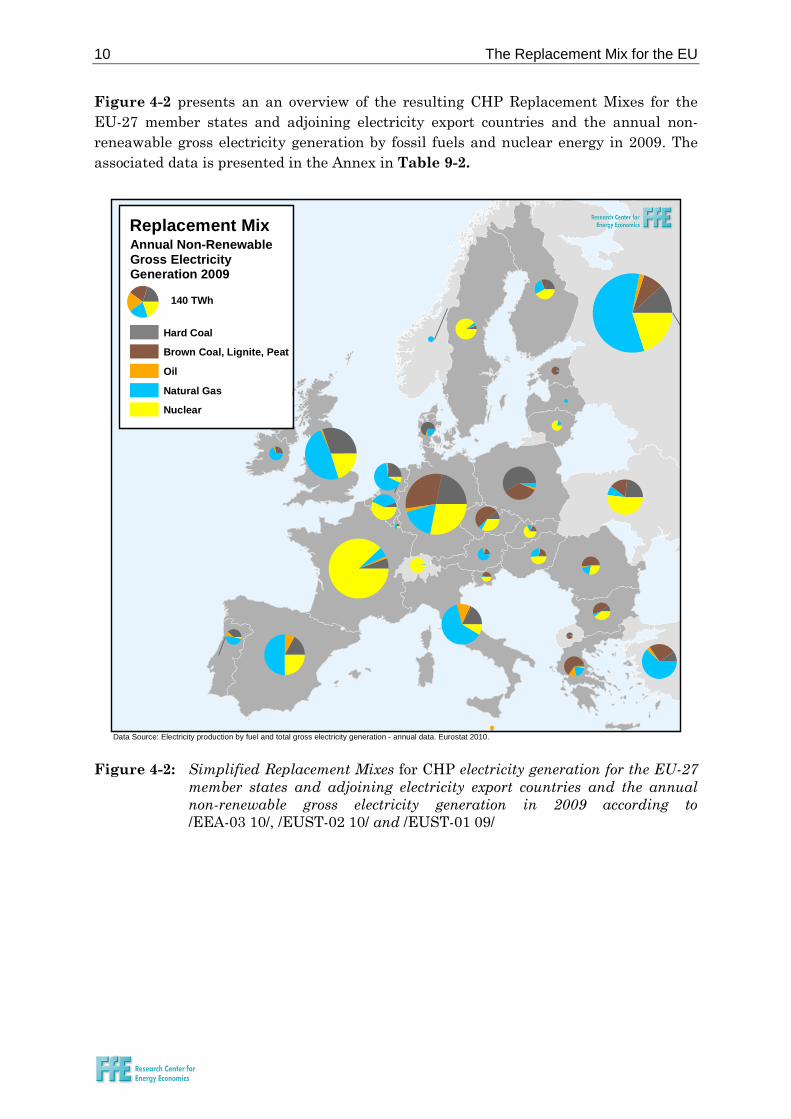
Figure 4-2 presents an an overview of the resulting CHP Replacement Mixes for the
EU-27 member states and adjoining electricity export countries and the annual non-
reneawable gross electricity generation by fossil fuels and nuclear energy in 2009. The
associated data is presented in the Annex in Table 9-2.
Figure 4-2: Simplified Replacement Mixes for CHP electricity generation for the EU-27
member states and adjoining electricity export countries and the annual
non-renewable gross electricity generation in 2009 according to
/EEA-03 10/, /EUST-02 10/ and /EUST-01 09/
Replacement Mix
140 TWh
Hard Coal
Brown Coal, Lignite, Peat
Oil
Natural Gas
Nuclear
Annual Non-Renewable
Gross ElectricityGeneration 2009
Data Source: Electricity production by fuel and total gross electricity generation - annual data. Eurostat 2010.
Average Annual Gross Electrical Efficiency 11
5 Average Primary Energy Factor for the EU
The Replacement Mixes identified in Section 4.2 form the basis for the calculation of a
primary energy factor for the electricity replaced by CHP. In this section, it will be
explained how this primary energy factor is calculated for each member state
considering the average annual efficiency of the power plants, that could potentially be
replaced by CHP.
5.1 Average Annual Gross Electrical Efficiency
The primary energy input for electricity generation strongly depends on the electrical
efficiency of a power plant. Therefore, the average annual gross electrical efficiency for
each member state of the EU-27 has to be determined. It shall be defined as:
(5)
[ ] Average annual gross electrical efficiency
[
]
Annual electricity generation by fuel
[
]
Fuel input for electricity generation by fuel type
Data on the annual electricity generation by fuel and the associated fuel input are taken
from the Energy Balances for 2009 published by the International Energy Agency (IEA)
/IEA–03 11/ and /IEA-04 11/.
As stated by the IEA, a gross electrical efficiency for nuclear energy of 33 % can be
assumed for all member states representing the average efficiency for nuclear power
plants in Europe /IEA-03 11/.
Unfortunately, it is not possible to calculate the average annual gross electrical
efficiency for each fuel of the Replacement Mix for each member state based on the IEA
data. The reasons for the partial incompleteness are:
The IEA Energy Balances do not distinguish brown coal, lignite and peat from
hard coal, therefore, only a summarized gross efficiency for coal can be
determined.
If the electricity generated by a fossil fuel is only generated in CHP plants in a
member state, the average annual gross electrical efficiency cannot be calculated.
This is due to the fact, that within the IEA Energy Balances the following
definitions apply:
“If one or more units of the plant is a CHP unit (and the inputs and outputs can
not be distinguished on a unit basis) then the whole plant is designated as a CHP
plant.”
12 Average Primary Energy Factor for the EU
“…for autoproducer CHP plants, all fuel inputs to electricity production are taken
into account, while only the part of fuel inputs to heat sold is shown. Fuel inputs
for the production of heat consumed within the autoproducer's establishment are
not included here…” /IEA–03 11/
Consequently, no precise allocation of the fuel input for the electricity generation
in CHP plants can be conducted. Thereby, the average annual gross electrical
efficiency can not be calculated for the electricity generation from CHP plants.
For some countries the energy balances where either incomplete or inconsistent
In order to address these problems, the following assumptions and simplifications are
applied, if no average annual gross electrical efficiency can be calculated according to
Equation (5):
If the share of the respective fuel in the Replacement Mix is smaller than 5 %, an
average gross efficiency by fuel based on the evaluation of all member states can
be applied resulting in only a minor discrepancy.
As the exact fuel input for CHP electricity generation cannot be determined, the
calculated average annual gross electrical efficiency for the fossil fuels only
represents electricity generation in non-CHP plants. It is assumed, that the
resulting error is acceptable considering the overall inaccuracy of the simplified
methodology for the calculation of the primary energy factor.
The countries Denmark, Latvia, Lithuania and Sweden are completely excluded.
In these member states, the electricity from fossil fuels is almost solely generated
in CHP plants. Therefore, it is on the one hand not possible to determine the
average annual gross electrical efficiency based on the IEA data. On the other
hand, the concept of a CHP Replacement Mix is considered as not suitable for
these countries, as the potential replacement of existing CHP plants strongly
depends on the heating demand.
For Poland, the share of CHP of the total gross electricity generation is supposed
to be 98 % in 2009 according to the IEA Energy Balances /IEA–03 11/. This is
completely inconsistent with the CHP share of 17,2 % for Poland in 2009
published by EUROSTAT /EUST–02 11/. Consequently, it is assumed, that the
figures on electricity generation in the respective IEA energy balance are not
correct. Therefore, the average gross efficiency by fuel based on the evaluation of
all member states is applied for Poland.
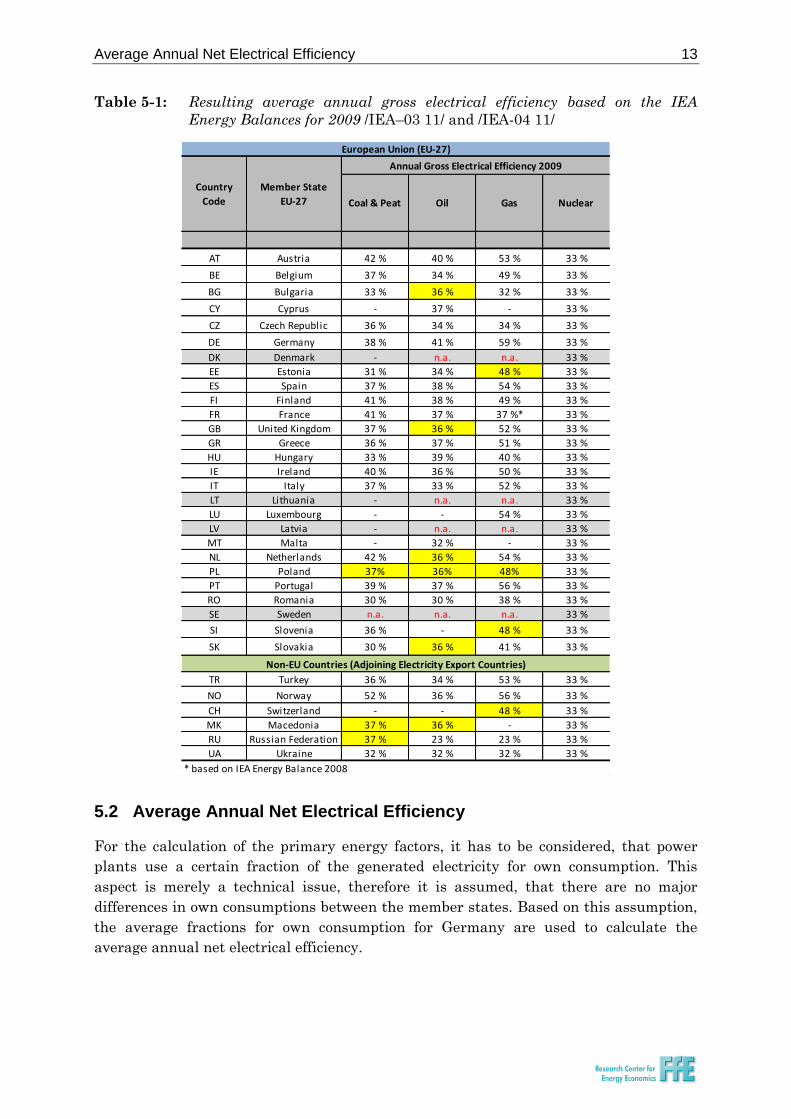
The resulting average annual gross electrical efficiencies are summarized in Table 5-1.
Values that are marked in yellow are average values by fuel based on an evaluation of
the remaining EU-27 member states. The symbol “-“ represents cases, where there is no
electricity generation associated to the respective fuel. The term “n.a.” (not applicable)
represents cases, where no average annual gross electrical efficiency could be calculated.
The member states that are marked in grey are excluded from the following calculation
of the primary energy factors as explained above.
Average Annual Net Electrical Efficiency 13
Table 5-1: Resulting average annual gross electrical efficiency based on the IEA
Energy Balances for 2009 /IEA–03 11/ and /IEA-04 11/
5.2 Average Annual Net Electrical Efficiency
For the calculation of the primary energy factors, it has to be considered, that power
plants use a certain fraction of the generated electricity for own consumption. This
aspect is merely a technical issue, therefore it is assumed, that there are no major
differences in own consumptions between the member states. Based on this assumption,
the average fractions for own consumption for Germany are used to calculate the
average annual net electrical efficiency.
Coal & Peat Oil Gas Nuclear
AT Austria 42 % 40 % 53 % 33 %
BE Belgium 37 % 34 % 49 % 33 %
BG Bulgaria 33 % 36 % 32 % 33 %
CY Cyprus - 37 % - 33 %
CZ Czech Republic 36 % 34 % 34 % 33 %
DE Germany 38 % 41 % 59 % 33 %
DK Denmark - n.a. n.a. 33 %
EE Estonia 31 % 34 % 48 % 33 %
ES Spain 37 % 38 % 54 % 33 %
FI Finland 41 % 38 % 49 % 33 %
FR France 41 % 37 % 37 %* 33 %
GB United Kingdom 37 % 36 % 52 % 33 %
GR Greece 36 % 37 % 51 % 33 %
HU Hungary 33 % 39 % 40 % 33 %
IE Ireland 40 % 36 % 50 % 33 %
IT Italy 37 % 33 % 52 % 33 %
LT Lithuania - n.a. n.a. 33 %
LU Luxembourg - - 54 % 33 %
LV Latvia - n.a. n.a. 33 %
MT Malta - 32 % - 33 %
NL Netherlands 42 % 36 % 54 % 33 %
PL Poland 37% 36% 48% 33 %
PT Portugal 39 % 37 % 56 % 33 %
RO Romania 30 % 30 % 38 % 33 %
SE Sweden n.a. n.a. n.a. 33 %
SI Slovenia 36 % - 48 % 33 %
SK Slovakia 30 % 36 % 41 % 33 %
TR Turkey 36 % 34 % 53 % 33 %
NO Norway 52 % 36 % 56 % 33 %
CH Switzerland - - 48 % 33 %
MK Macedonia 37 % 36 % - 33 %
RU Russian Federation 37 % 23 % 23 % 33 %
UA Ukraine 32 % 32 % 32 % 33 %
* based on IEA Energy Balance 2008
Non-EU Countries (Adjoining Electricity Export Countries)
European Union (EU-27)
Country
Code
Member State
EU-27
Annual Gross Electrical Efficiency 2009
14 Average Primary Energy Factor for the EU
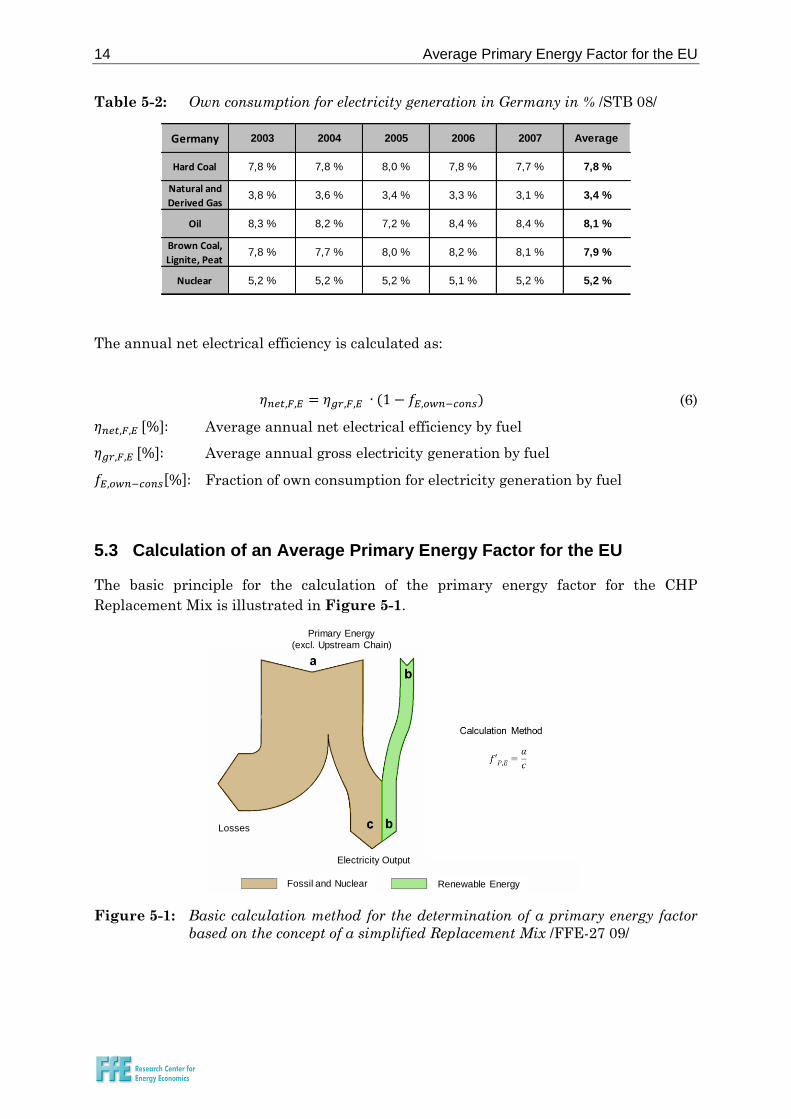
Table 5-2: Own consumption for electricity generation in Germany in % /STB 08/
The annual net electrical efficiency is calculated as:
(6)
[ ] Average annual net electrical efficiency by fuel
[ ] Average annual gross electricity generation by fuel
[ ] Fraction of own consumption for electricity generation by fuel
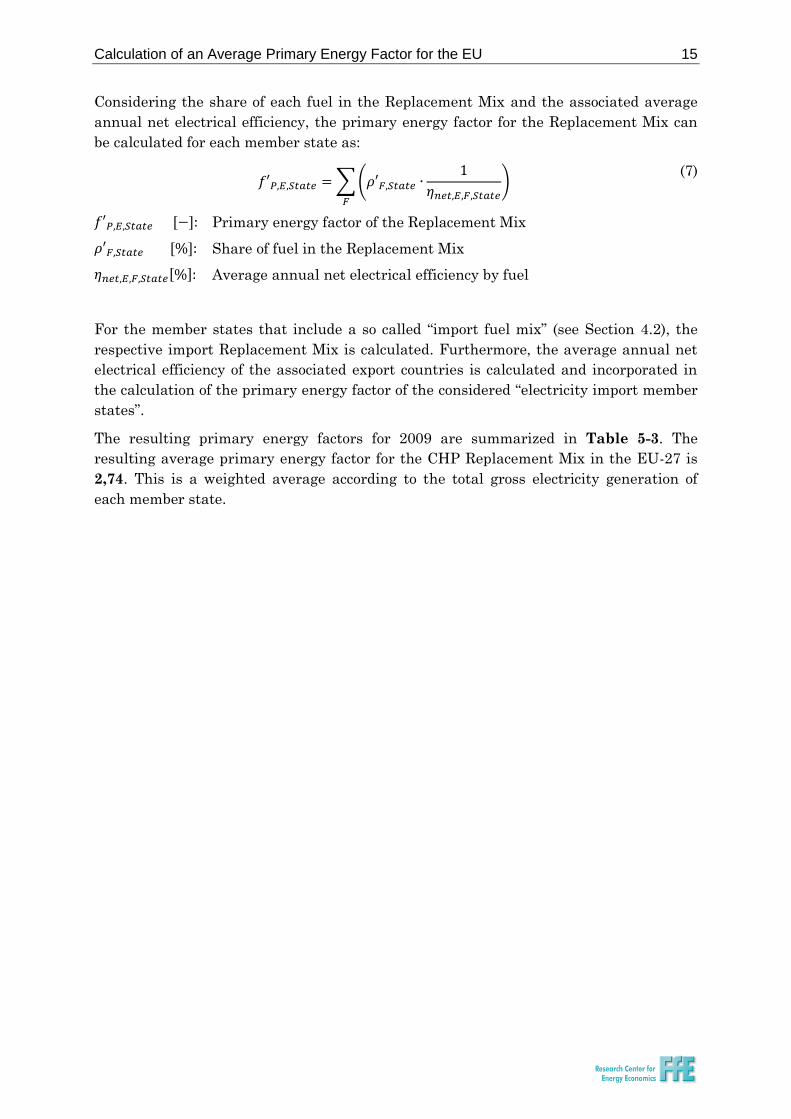
5.3 Calculation of an Average Primary Energy Factor for the EU
The basic principle for the calculation of the primary energy factor for the CHP
Replacement Mix is illustrated in Figure 5-1.
Figure 5-1: Basic calculation method for the determination of a primary energy factor
based on the concept of a simplified Replacement Mix /FFE-27 09/
Germany 2003 2004 2005 2006 2007 Average
Hard Coal 7,8 % 7,8 % 8,0 % 7,8 % 7,7 % 7,8 %
Natural and
Derived Gas3,8 % 3,6 % 3,4 % 3,3 % 3,1 % 3,4 %
Oil 8,3 % 8,2 % 7,2 % 8,4 % 8,4 % 8,1 %
Brown Coal,
Lignite, Peat7,8 % 7,7 % 8,0 % 8,2 % 8,1 % 7,9 %
Nuclear 5,2 % 5,2 % 5,2 % 5,1 % 5,2 % 5,2 %
Primary Energy
(excl. Upstream Chain)
Losses
Electricity Output
Fossil and Nuclear Renewable Energy
Calculation of an Average Primary Energy Factor for the EU 15
Considering the share of each fuel in the Replacement Mix and the associated average
annual net electrical efficiency, the primary energy factor for the Replacement Mix can
be calculated for each member state as:
∑(
)
(7)
[ ] Primary energy factor of the Replacement Mix
[ ] Share of fuel in the Replacement Mix
[ ] Average annual net electrical efficiency by fuel
For the member states that include a so called “import fuel mix” (see Section 4.2), the
respective import Replacement Mix is calculated. Furthermore, the average annual net
electrical efficiency of the associated export countries is calculated and incorporated in
the calculation of the primary energy factor of the considered “electricity import member
states”.
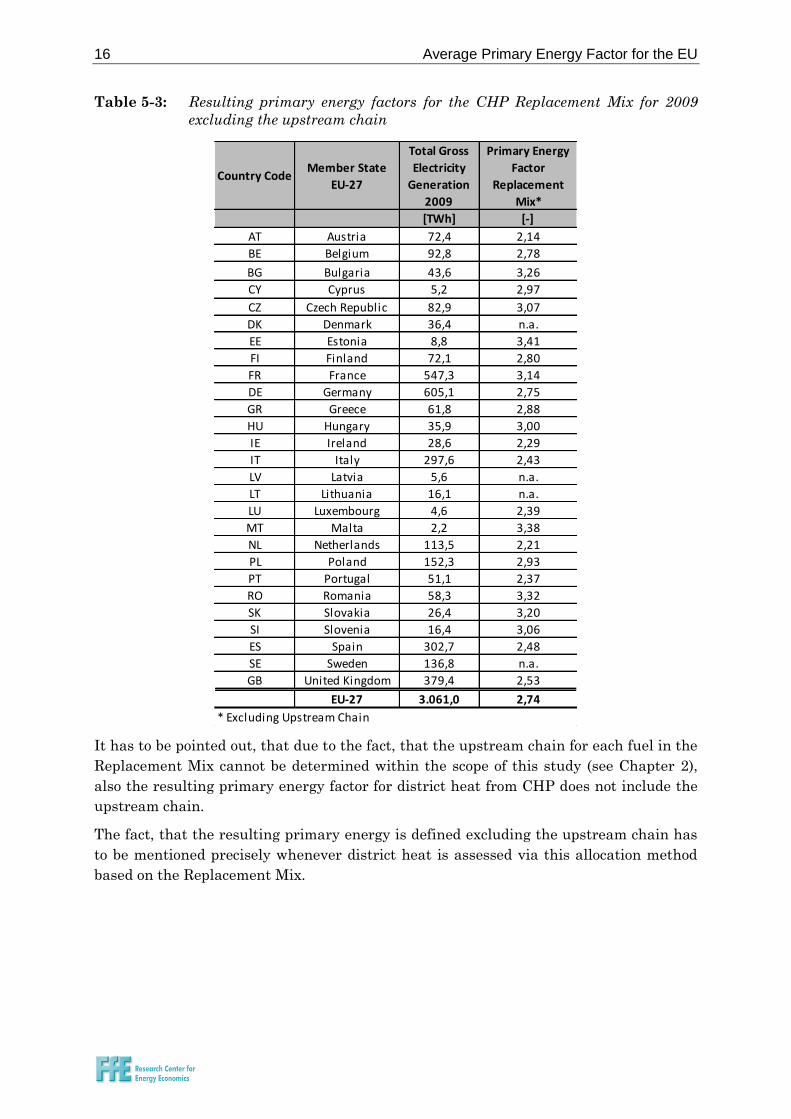
The resulting primary energy factors for 2009 are summarized in Table 5-3. The
resulting average primary energy factor for the CHP Replacement Mix in the EU-27 is
2,74. This is a weighted average according to the total gross electricity generation of
each member state.
16 Average Primary Energy Factor for the EU
Table 5-3: Resulting primary energy factors for the CHP Replacement Mix for 2009
excluding the upstream chain
It has to be pointed out, that due to the fact, that the upstream chain for each fuel in the
Replacement Mix cannot be determined within the scope of this study (see Chapter 2),
also the resulting primary energy factor for district heat from CHP does not include the
upstream chain.
The fact, that the resulting primary energy is defined excluding the upstream chain has
to be mentioned precisely whenever district heat is assessed via this allocation method
based on the Replacement Mix.
Country CodeMember State
EU-27
Total Gross
Electricity
Generation
2009
Primary Energy
Factor
Replacement
Mix*
[TWh] [-]
AT Austria 72,4 2,14
BE Belgium 92,8 2,78
BG Bulgaria 43,6 3,26
CY Cyprus 5,2 2,97
CZ Czech Republic 82,9 3,07
DK Denmark 36,4 n.a.
EE Estonia 8,8 3,41
FI Finland 72,1 2,80
FR France 547,3 3,14
DE Germany 605,1 2,75
GR Greece 61,8 2,88
HU Hungary 35,9 3,00
IE Ireland 28,6 2,29
IT Italy 297,6 2,43
LV Latvia 5,6 n.a.
LT Lithuania 16,1 n.a.
LU Luxembourg 4,6 2,39
MT Malta 2,2 3,38
NL Netherlands 113,5 2,21
PL Poland 152,3 2,93
PT Portugal 51,1 2,37
RO Romania 58,3 3,32
SK Slovakia 26,4 3,20
SI Slovenia 16,4 3,06
ES Spain 302,7 2,48
SE Sweden 136,8 n.a.
GB United Kingdom 379,4 2,53
EU-27 3.061,0 2,74
* Excluding Upstream Chain

CO2 Emission Coefficients 17
6 CO2 Emission Coefficients
The resulting primary energy factors for electricity that could potentially be replaced by
CHP (see Section 5.3) can be used to estimate the potentially saved CO2 emissions by
CHP. Therefore, specific CO2-Emission coefficients have to be calculated according to:
∑(
)
(8)
[
]: Specific CO2 emission coefficient related to electricity output
[
]: Specific CO2 emission coefficient related to total thermal energy content
[ ] : Average annual net electrical efficiency by fuel
The respective specific CO2 emission coefficients (related to total thermal energy content)
are presented in Table 6-1.
Table 6-1: Specfic CO2 emission coefficients related to total thermal energy content
/FfE-15 08/
Coal & Peat Oil Gas Nuclear
[g/kWhT] [g/kWhT] [g/kWhT] [g/kWhT]
370 281 202 0
Specfic CO2 Emission Coefficient Related to Total Thermal Energy Content
18 CO2 Emission Coefficients
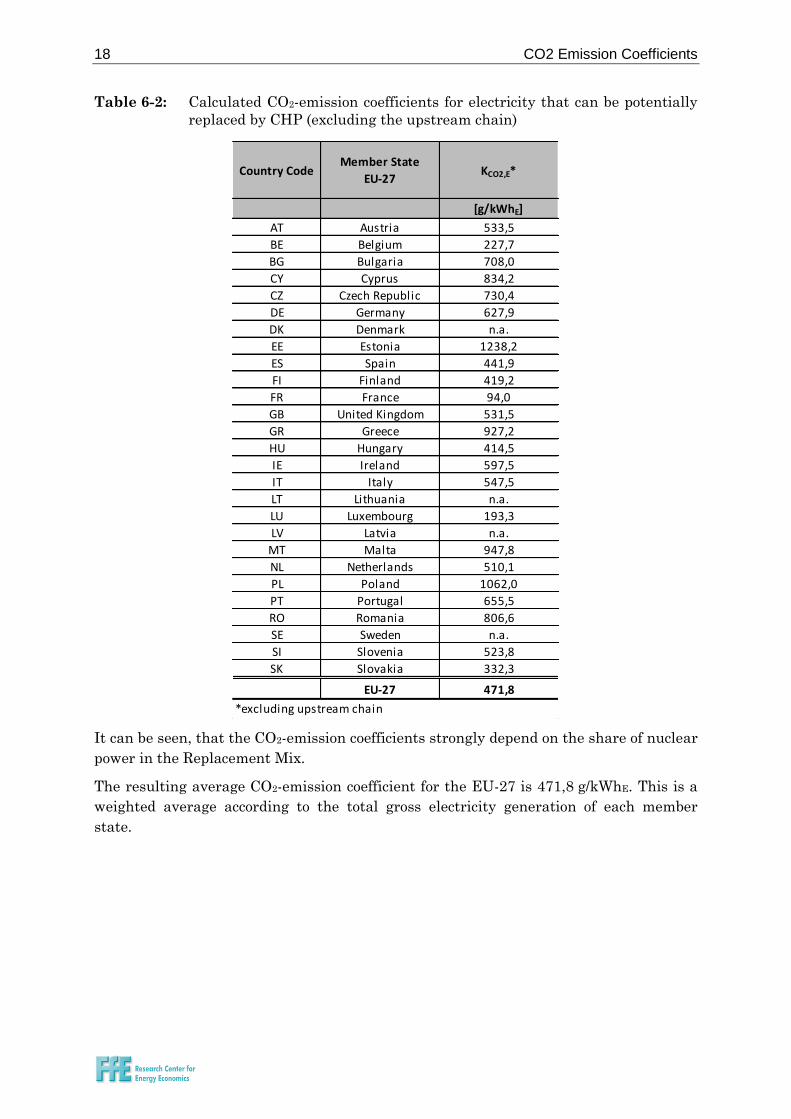
Table 6-2: Calculated CO2-emission coefficients for electricity that can be potentially
replaced by CHP (excluding the upstream chain)
It can be seen, that the CO2-emission coefficients strongly depend on the share of nuclear
power in the Replacement Mix.
The resulting average CO2-emission coefficient for the EU-27 is 471,8 g/kWhE. This is a
weighted average according to the total gross electricity generation of each member
state.
Country CodeMember State
EU-27KCO2,E*
[g/kWhE]
AT Austria 533,5
BE Belgium 227,7
BG Bulgaria 708,0
CY Cyprus 834,2
CZ Czech Republic 730,4
DE Germany 627,9
DK Denmark n.a.
EE Estonia 1238,2
ES Spain 441,9
FI Finland 419,2
FR France 94,0
GB United Kingdom 531,5
GR Greece 927,2
HU Hungary 414,5
IE Ireland 597,5
IT Italy 547,5
LT Lithuania n.a.
LU Luxembourg 193,3
LV Latvia n.a.
MT Malta 947,8
NL Netherlands 510,1
PL Poland 1062,0
PT Portugal 655,5
RO Romania 806,6
SE Sweden n.a.
SI Slovenia 523,8
SK Slovakia 332,3
EU-27 471,8
*excluding upstream chain
Conclusion and Outlook 19
7 Conclusion and Outlook
In this study, a simplified method for the calculation of primary energy factors for
electricity that could potentially be replaced by CHP was introduced.
The resulting average primary energy factor for the Replacement Mix in the EU-27 is
2,74. This primary energy factor as well as the calculated country specific primary
energy factors for the member states of the EU-27 can be used as an indicator for the
assessment of district heat from CHP in the European Union via the “Power Bonus”
allocation method.
The resulting average CO2-emission coefficient for the EU-27 is 471,8 g/kWhE (excluding
the upstream chain). This is a weighted average according to the total gross electricity
generation of each member state.
It has to be pointed out, that these reference values are only to be used if no respective
national primary energy factors exist.
The fact, that the resulting primary energy factors are defined excluding the upstream
chain has to be mentioned precisely whenever the primary energy for district heat or the
CO2-emissions are assessed via this allocation method based on the Replacement Mix.
Furthermore, it has to be acknowledged, that the presented simplified Replacement
Mixes only serve as a general indicator for the fuels that might be replaced by CHP in a
member state. An exact quantification of the Replacement Mix in each Member State is
only possible by means of a detailed simulation of respective load curves.
The average primary energy factor for the EU-27 does not include the countries
Denmark, Latvia, Lithuania and Sweden. For these countries, it was on the one hand
not possible to determine the average annual gross electrical efficiency based on the IEA
data. On the other hand, the concept of a CHP Replacement Mix is considered as not
suitable for these countries, as the potential replacement of existing CHP plants strongly
depends on the heating demand.
The evaluation of the average annual gross electrical efficiency via the IEA Energy
Balances was only possible to a certain extent. The resulting inaccuracy has to be
considered whenever the resulting primary energy factors and CO2 coefficients are used
for assessment purposes.
For further evaluation of CHP in each member state, a detailed analysis of the
Replacement Mix based on simulated load curves is strongly recommended.
Finally, the resulting primary energy factors and the proposed allocation method based
on a simplified Replacement Mix can serve as a basis for further discussion of the
targeted expansion of CHP in the European Union. However, due to the strong
simplifications assumed and the limited data availability the resulting primary energy
factors itself cannot serve as a direct reference for relevant decision making processes.
20 Bibliography
8 Bibliography
CEN-01 07 European Standard EN 15316-4-5 - Heating systems in buildings - Method
for calculation of system energy requirements and system efficiencies -
Part 4-5: Space heating generation systems, the performance and quality
of district heating and large volume systems. Brussels: European
Committee for Standardization, 2007
CEN-01 08 European Standard EN 15603 - Energy performance of buildings - Overall
energy use and definition of energy ratings. Brussels: European
Committee for Standardization (CEN), 2008
DIN-02 11 DIN V 18599-1:2011-12 - Energy efficiency of buildings - Calculation of the
net, final and primary energy demand for heating, cooling, ventilation,
domestic hot water and lighting - Part 1: General balancing procedures,
terms and definitions, zoning and evaluation of energy sources. Berlin:
DIN Deutsches Institut für Normung e.V. (DIN), 2011
EEA-03 10 Share of electricity production by fuel type in 2009. Copenhagen: European
Environment Agency (EEA), 2010
EEG-03 11 Gesetz für den Vorrang Erneuerbarer Energien (Erneuerbare-Energien-
Gesetz - EEG) - in der Fassung vom 25.10.2008, zuletzt geändert am
28.07.2011. Berlin: Bundesrepublik Deutschland, 2011
ENEV-01 07 Verordnung über energiesparenden Wärmeschutz und energiesparende
Anlagentechnik bei Gebäuden - Energieeinsparverordnung – EnEV 2007.
Berlin: Bundesrepublik Deutschland, 2007
ENTSOE-03 10 Electricity Exchange of a specific range of time. Brussels: European
Network of Transmission System Operators for Electricity (ENTSO-E),
2010
EU-02 04 Directive 2004/8/EC of the European Parliament and of the Council - on
the promotion of cogeneration based on a useful heat demand in the
internal energy market and amending Directive 92/42/EEC. Brussels: The
European Parliament and the Council, 2004
EU-03 06 Directive 2006/32/EC of the European Parliament and of the Council - on
energy end-use efficiency and energy services and repealing Council
Directive 93/76/EEC. Brussels: The European Parliament and the Council,
2006
EUST-01 09 Supply, transformation, consumption - electricity - annual data - nrg_105a.
Brussels: Eurostat, 2009
EUST-02 10 Electricity production by fuel and total gross electricity generation -
annual data 2009. Brussels: Eurostat, 2010
EUST-02 11 Energy, transport and environment indicators. Luxembourg: Publications
Office of the European Union - Eurostat, 2011
Bibliography 21
FFE-15 08 Beer, M.; Corradini, R.; Gobmaier, T.; Köll, L.; Podhajsky, R.; Vogler, G.;
Zotz, M.: CO2-Verminderung in Deutschland. München: Forschungsstelle
für Energiewirtschaft e.V., 2009
FFE-27 09 Pfeifroth, Philipp; Beer, Michael: Primärenergetische Bewertung von
Fernwärme aus KWK. München: Forschungsstelle für Energiewirtschaft
e.V. (FfE), 2009
IEA-03 11 Energy Balances of OECD Countries - 2011 Edition. Paris: International
Energy Agency (IEA), 2011
IEA-04 11 Energy Balances of Non-OECD Countries - 2011 Edition. Paris:
International Energy Agency (IEA), 2011
STB 08 Statistisches Bundesamt: Monatsberichte über die
Elektrizitätsversorgung, laufende Aktualisierung, Wiesbaden:
Statistisches Bundesamt verschiedene Monate, 2008
22 Annex
9 Annex
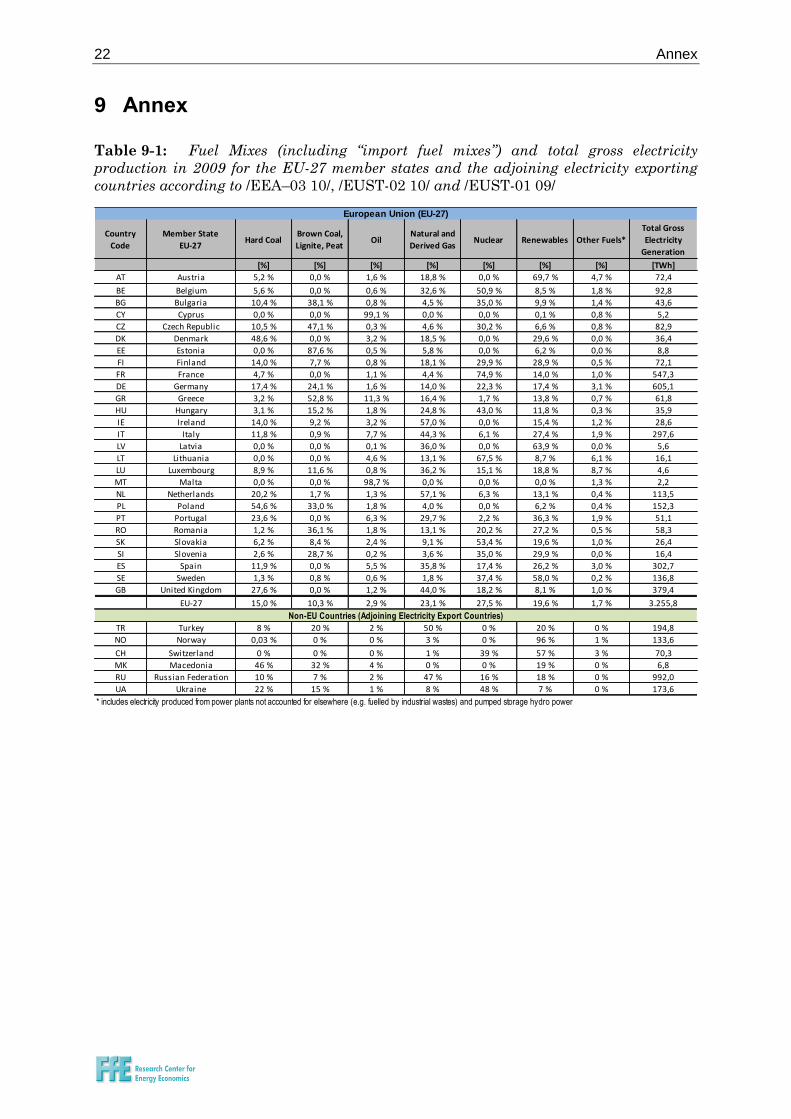
Table 9-1: Fuel Mixes (including “import fuel mixes”) and total gross electricity
production in 2009 for the EU-27 member states and the adjoining electricity exporting
countries according to /EEA–03 10/, /EUST-02 10/ and /EUST-01 09/
Country
Code
Member State
EU-27Hard Coal
Brown Coal,
Lignite, PeatOil
Natural and
Derived GasNuclear Renewables Other Fuels*
Total Gross
Electricity
Generation
[%] [%] [%] [%] [%] [%] [%] [TWh]
AT Austria 5,2 % 0,0 % 1,6 % 18,8 % 0,0 % 69,7 % 4,7 % 72,4
BE Belgium 5,6 % 0,0 % 0,6 % 32,6 % 50,9 % 8,5 % 1,8 % 92,8
BG Bulgaria 10,4 % 38,1 % 0,8 % 4,5 % 35,0 % 9,9 % 1,4 % 43,6
CY Cyprus 0,0 % 0,0 % 99,1 % 0,0 % 0,0 % 0,1 % 0,8 % 5,2
CZ Czech Republic 10,5 % 47,1 % 0,3 % 4,6 % 30,2 % 6,6 % 0,8 % 82,9
DK Denmark 48,6 % 0,0 % 3,2 % 18,5 % 0,0 % 29,6 % 0,0 % 36,4
EE Estonia 0,0 % 87,6 % 0,5 % 5,8 % 0,0 % 6,2 % 0,0 % 8,8
FI Finland 14,0 % 7,7 % 0,8 % 18,1 % 29,9 % 28,9 % 0,5 % 72,1
FR France 4,7 % 0,0 % 1,1 % 4,4 % 74,9 % 14,0 % 1,0 % 547,3
DE Germany 17,4 % 24,1 % 1,6 % 14,0 % 22,3 % 17,4 % 3,1 % 605,1
GR Greece 3,2 % 52,8 % 11,3 % 16,4 % 1,7 % 13,8 % 0,7 % 61,8
HU Hungary 3,1 % 15,2 % 1,8 % 24,8 % 43,0 % 11,8 % 0,3 % 35,9
IE Ireland 14,0 % 9,2 % 3,2 % 57,0 % 0,0 % 15,4 % 1,2 % 28,6
IT Italy 11,8 % 0,9 % 7,7 % 44,3 % 6,1 % 27,4 % 1,9 % 297,6
LV Latvia 0,0 % 0,0 % 0,1 % 36,0 % 0,0 % 63,9 % 0,0 % 5,6
LT Lithuania 0,0 % 0,0 % 4,6 % 13,1 % 67,5 % 8,7 % 6,1 % 16,1
LU Luxembourg 8,9 % 11,6 % 0,8 % 36,2 % 15,1 % 18,8 % 8,7 % 4,6
MT Malta 0,0 % 0,0 % 98,7 % 0,0 % 0,0 % 0,0 % 1,3 % 2,2
NL Netherlands 20,2 % 1,7 % 1,3 % 57,1 % 6,3 % 13,1 % 0,4 % 113,5
PL Poland 54,6 % 33,0 % 1,8 % 4,0 % 0,0 % 6,2 % 0,4 % 152,3
PT Portugal 23,6 % 0,0 % 6,3 % 29,7 % 2,2 % 36,3 % 1,9 % 51,1
RO Romania 1,2 % 36,1 % 1,8 % 13,1 % 20,2 % 27,2 % 0,5 % 58,3
SK Slovakia 6,2 % 8,4 % 2,4 % 9,1 % 53,4 % 19,6 % 1,0 % 26,4
SI Slovenia 2,6 % 28,7 % 0,2 % 3,6 % 35,0 % 29,9 % 0,0 % 16,4
ES Spain 11,9 % 0,0 % 5,5 % 35,8 % 17,4 % 26,2 % 3,0 % 302,7
SE Sweden 1,3 % 0,8 % 0,6 % 1,8 % 37,4 % 58,0 % 0,2 % 136,8
GB United Kingdom 27,6 % 0,0 % 1,2 % 44,0 % 18,2 % 8,1 % 1,0 % 379,4
EU-27 15,0 % 10,3 % 2,9 % 23,1 % 27,5 % 19,6 % 1,7 % 3.255,8
TR Turkey 8 % 20 % 2 % 50 % 0 % 20 % 0 % 194,8
NO Norway 0,03 % 0 % 0 % 3 % 0 % 96 % 1 % 133,6
CH Switzerland 0 % 0 % 0 % 1 % 39 % 57 % 3 % 70,3
MK Macedonia 46 % 32 % 4 % 0 % 0 % 19 % 0 % 6,8
RU Russian Federation 10 % 7 % 2 % 47 % 16 % 18 % 0 % 992,0
UA Ukraine 22 % 15 % 1 % 8 % 48 % 7 % 0 % 173,6
* includes electricity produced from power plants not accounted for elsewhere (e.g. fuelled by industrial wastes) and pumped storage hydro power
European Union (EU-27)
Non-EU Countries (Adjoining Electricity Export Countries)
Annex 23
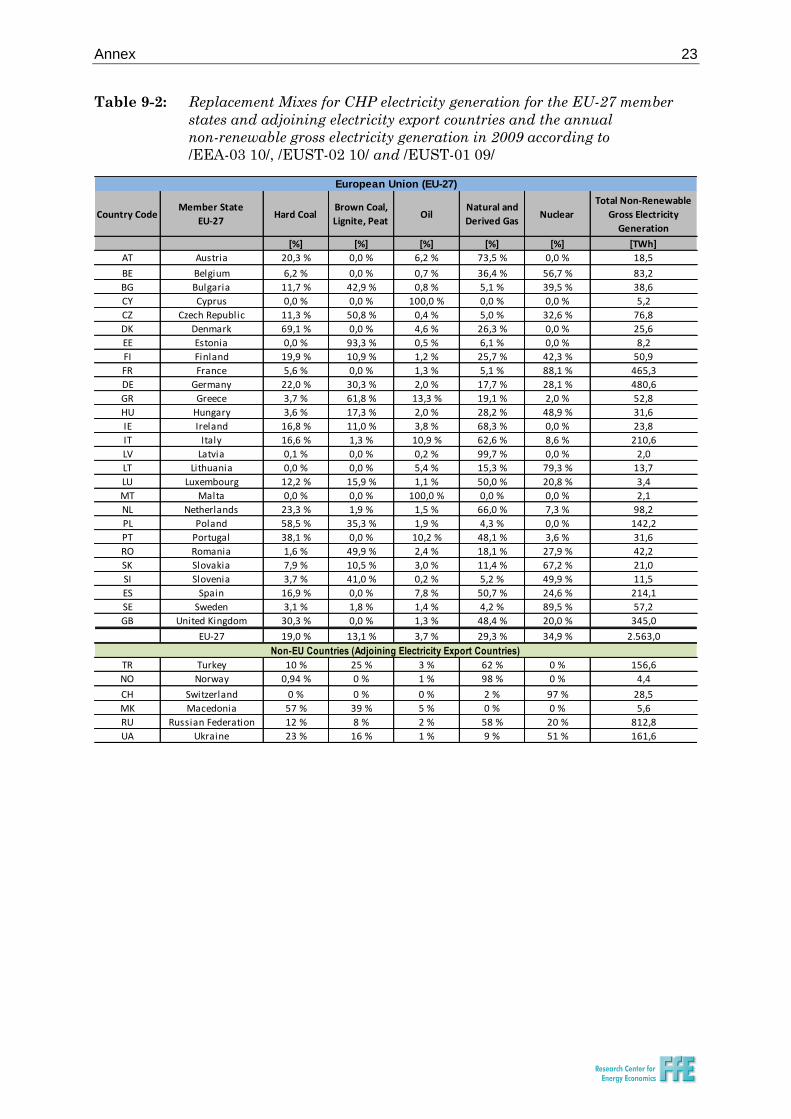
Table 9-2: Replacement Mixes for CHP electricity generation for the EU-27 member
states and adjoining electricity export countries and the annual
non-renewable gross electricity generation in 2009 according to
/EEA-03 10/, /EUST-02 10/ and /EUST-01 09/
Country CodeMember State
EU-27Hard Coal
Brown Coal,
Lignite, PeatOil
Natural and
Derived GasNuclear
Total Non-Renewable
Gross Electricity
Generation
[%] [%] [%] [%] [%] [TWh]
AT Austria 20,3 % 0,0 % 6,2 % 73,5 % 0,0 % 18,5
BE Belgium 6,2 % 0,0 % 0,7 % 36,4 % 56,7 % 83,2
BG Bulgaria 11,7 % 42,9 % 0,8 % 5,1 % 39,5 % 38,6
CY Cyprus 0,0 % 0,0 % 100,0 % 0,0 % 0,0 % 5,2
CZ Czech Republic 11,3 % 50,8 % 0,4 % 5,0 % 32,6 % 76,8
DK Denmark 69,1 % 0,0 % 4,6 % 26,3 % 0,0 % 25,6
EE Estonia 0,0 % 93,3 % 0,5 % 6,1 % 0,0 % 8,2
FI Finland 19,9 % 10,9 % 1,2 % 25,7 % 42,3 % 50,9
FR France 5,6 % 0,0 % 1,3 % 5,1 % 88,1 % 465,3
DE Germany 22,0 % 30,3 % 2,0 % 17,7 % 28,1 % 480,6
GR Greece 3,7 % 61,8 % 13,3 % 19,1 % 2,0 % 52,8
HU Hungary 3,6 % 17,3 % 2,0 % 28,2 % 48,9 % 31,6
IE Ireland 16,8 % 11,0 % 3,8 % 68,3 % 0,0 % 23,8
IT Italy 16,6 % 1,3 % 10,9 % 62,6 % 8,6 % 210,6
LV Latvia 0,1 % 0,0 % 0,2 % 99,7 % 0,0 % 2,0
LT Lithuania 0,0 % 0,0 % 5,4 % 15,3 % 79,3 % 13,7
LU Luxembourg 12,2 % 15,9 % 1,1 % 50,0 % 20,8 % 3,4
MT Malta 0,0 % 0,0 % 100,0 % 0,0 % 0,0 % 2,1
NL Netherlands 23,3 % 1,9 % 1,5 % 66,0 % 7,3 % 98,2
PL Poland 58,5 % 35,3 % 1,9 % 4,3 % 0,0 % 142,2
PT Portugal 38,1 % 0,0 % 10,2 % 48,1 % 3,6 % 31,6
RO Romania 1,6 % 49,9 % 2,4 % 18,1 % 27,9 % 42,2
SK Slovakia 7,9 % 10,5 % 3,0 % 11,4 % 67,2 % 21,0
SI Slovenia 3,7 % 41,0 % 0,2 % 5,2 % 49,9 % 11,5
ES Spain 16,9 % 0,0 % 7,8 % 50,7 % 24,6 % 214,1
SE Sweden 3,1 % 1,8 % 1,4 % 4,2 % 89,5 % 57,2
GB United Kingdom 30,3 % 0,0 % 1,3 % 48,4 % 20,0 % 345,0
EU-27 19,0 % 13,1 % 3,7 % 29,3 % 34,9 % 2.563,0
TR Turkey 10 % 25 % 3 % 62 % 0 % 156,6
NO Norway 0,94 % 0 % 1 % 98 % 0 % 4,4
CH Switzerland 0 % 0 % 0 % 2 % 97 % 28,5
MK Macedonia 57 % 39 % 5 % 0 % 0 % 5,6
RU Russian Federation 12 % 8 % 2 % 58 % 20 % 812,8
UA Ukraine 23 % 16 % 1 % 9 % 51 % 161,6
European Union (EU-27)
Non-EU Countries (Adjoining Electricity Export Countries)