Embed Size (px)
Citation preview
NREL is a national laboratory of the U.S. Department of Energy, Office of Energy Efficiency and Renewable Energy, operated by the Alliance for Sustainable Energy, LLC.
The Renewable Energy Integration Challenge: Mitigation Options
Lori Bird, NREL
NCSL Webinar
April 28, 2013
2
Overview
• What challenges do higher penetrations of wind and solar pose for grids?
• How much wind/solar can be integrated?
• What solutions are available to address variable nature of wind, solar?
• What are the costs of integration?
• What can policymakers do?
Source: First Wind
Source: Dennis Schroeder
3
Renewable Energy Integration Challenges
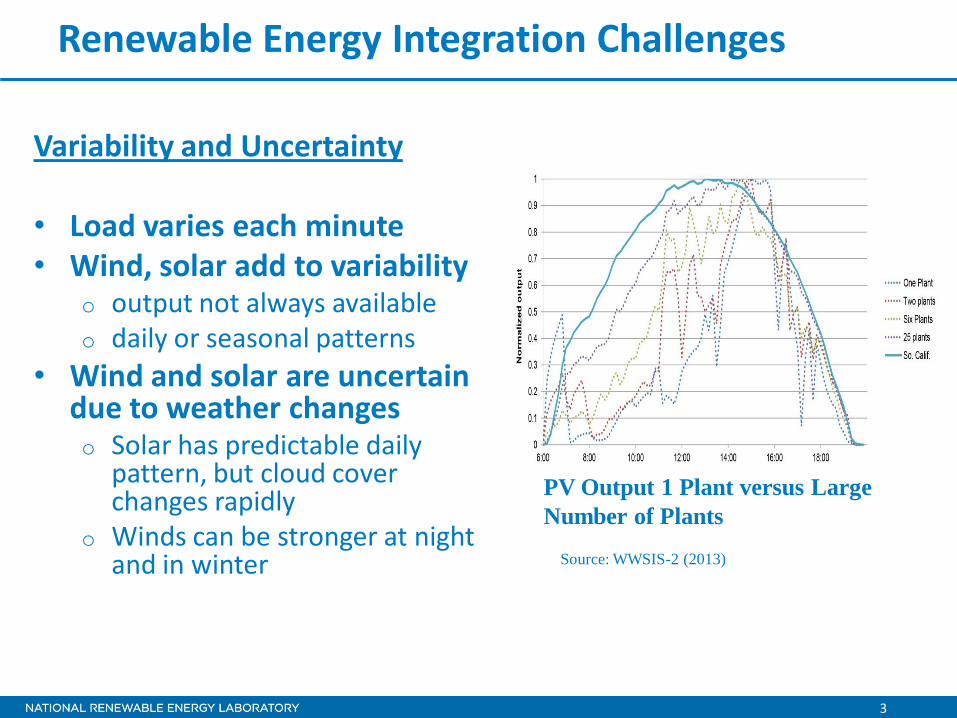
Variability and Uncertainty
• Load varies each minute • Wind, solar add to variability
o output not always available o daily or seasonal patterns
• Wind and solar are uncertain due to weather changes o Solar has predictable daily
pattern, but cloud cover changes rapidly
o Winds can be stronger at night and in winter
Source: WWSIS-2 (2013)
PV Output 1 Plant versus Large
Number of Plants
4
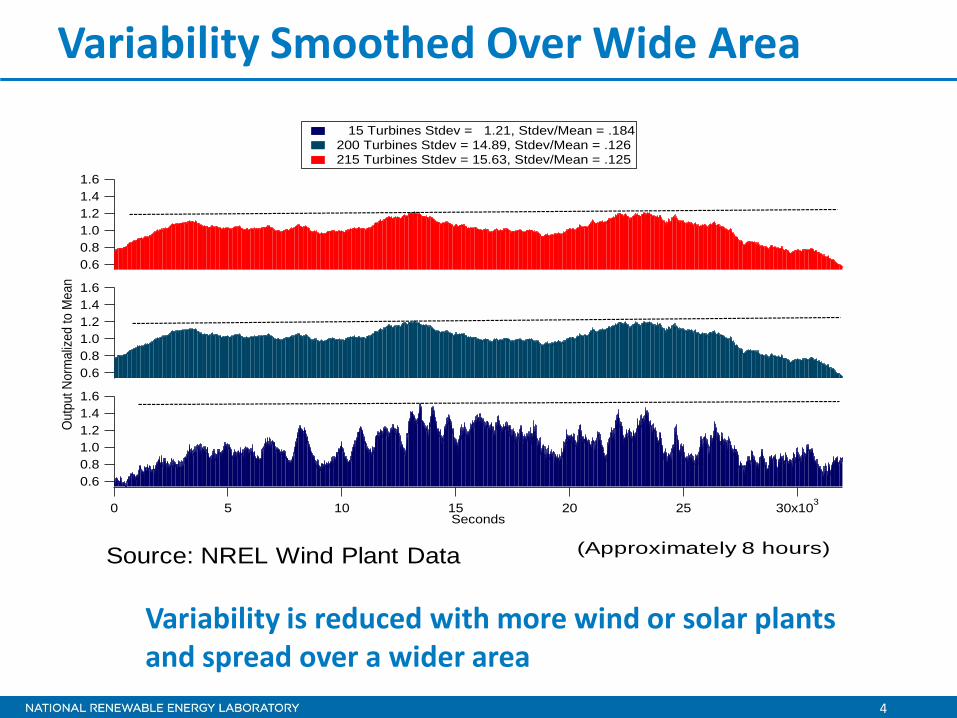
Variability Smoothed Over Wide Area
Variability is reduced with more wind or solar plants and spread over a wider area
(Approximately 8 hours)
1.6
1.4
1.2
1.0
0.8
0.6
Ou
tput
Norm
aliz
ed
to
Me
an
30x103
2520151050Seconds
1.6
1.4
1.2
1.0
0.8
0.6
1.6
1.4
1.2
1.0
0.8
0.6
15 Turbines Stdev = 1.21, Stdev/Mean = .184 200 Turbines Stdev = 14.89, Stdev/Mean = .126 215 Turbines Stdev = 15.63, Stdev/Mean = .125
Source: NREL Wind Plant Data
5
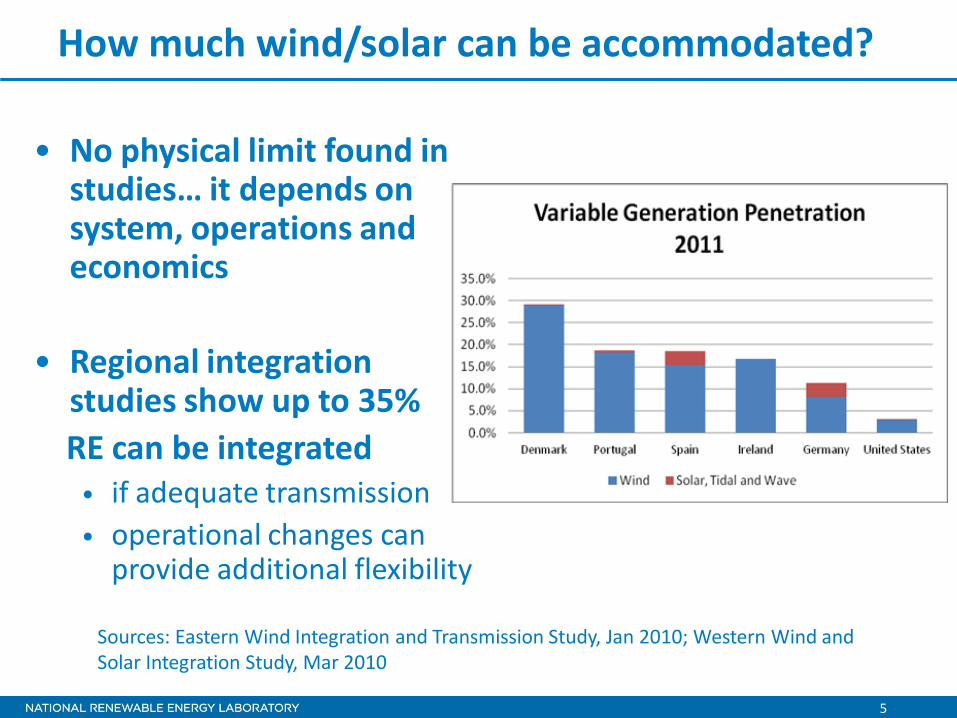
How much wind/solar can be accommodated?
• No physical limit found in studies… it depends on system, operations and economics
• Regional integration studies show up to 35%
RE can be integrated • if adequate transmission
• operational changes can provide additional flexibility
Sources: Eastern Wind Integration and Transmission Study, Jan 2010; Western Wind and Solar Integration Study, Mar 2010
6
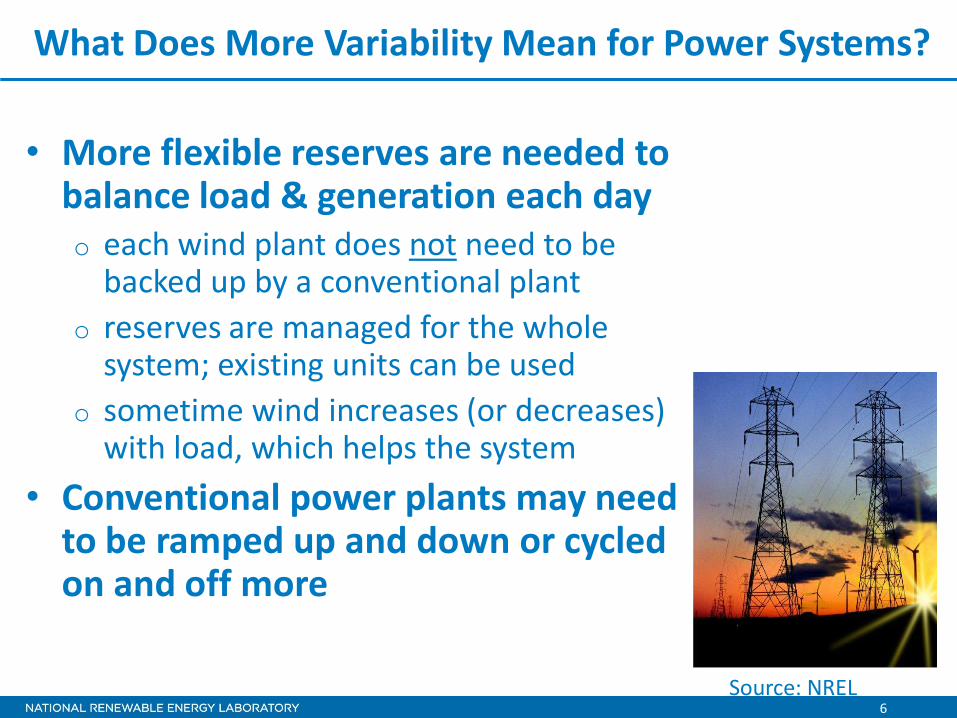
What Does More Variability Mean for Power Systems?
• More flexible reserves are needed to balance load & generation each day o each wind plant does not need to be
backed up by a conventional plant
o reserves are managed for the whole system; existing units can be used
o sometime wind increases (or decreases) with load, which helps the system
• Conventional power plants may need to be ramped up and down or cycled on and off more
Source: NREL
7
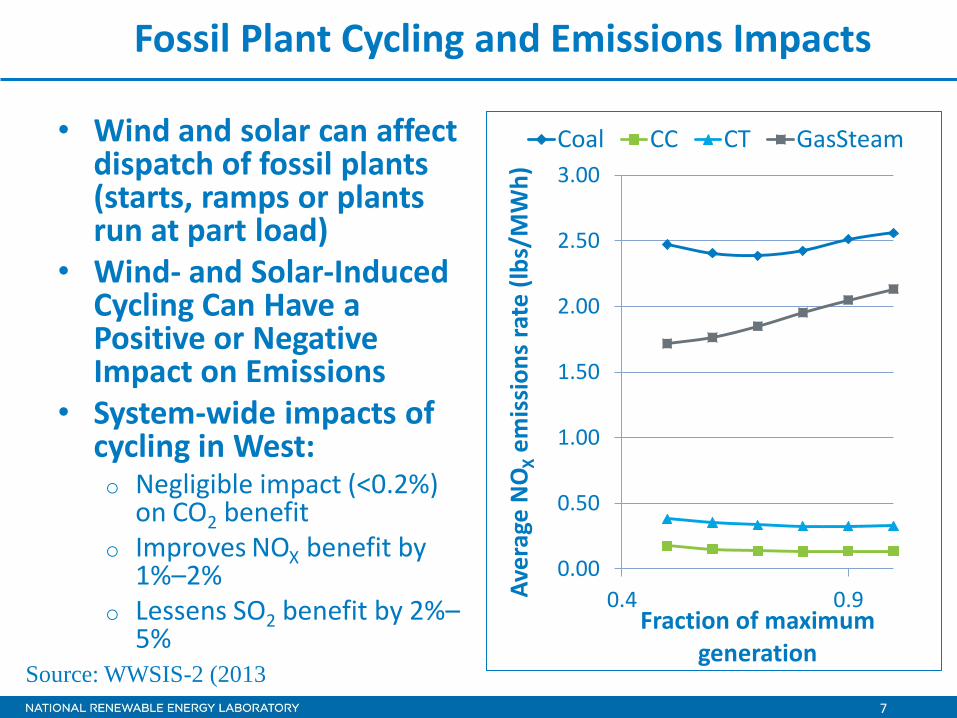
Fossil Plant Cycling and Emissions Impacts
• Wind and solar can affect dispatch of fossil plants (starts, ramps or plants run at part load)
• Wind- and Solar-Induced Cycling Can Have a Positive or Negative Impact on Emissions
• System-wide impacts of cycling in West: o Negligible impact (<0.2%)
on CO2 benefit o Improves NOX benefit by
1%–2% o Lessens SO2 benefit by 2%–
5%
0.00
0.50
1.00
1.50
2.00
2.50
3.00
0.4 0.9 Ave
rage
NO
X e
mis
sio
ns
rate
(lb
s/M
Wh
)
Fraction of maximum generation
Coal CC CT GasSteam
Source: WWSIS-2 (2013
8
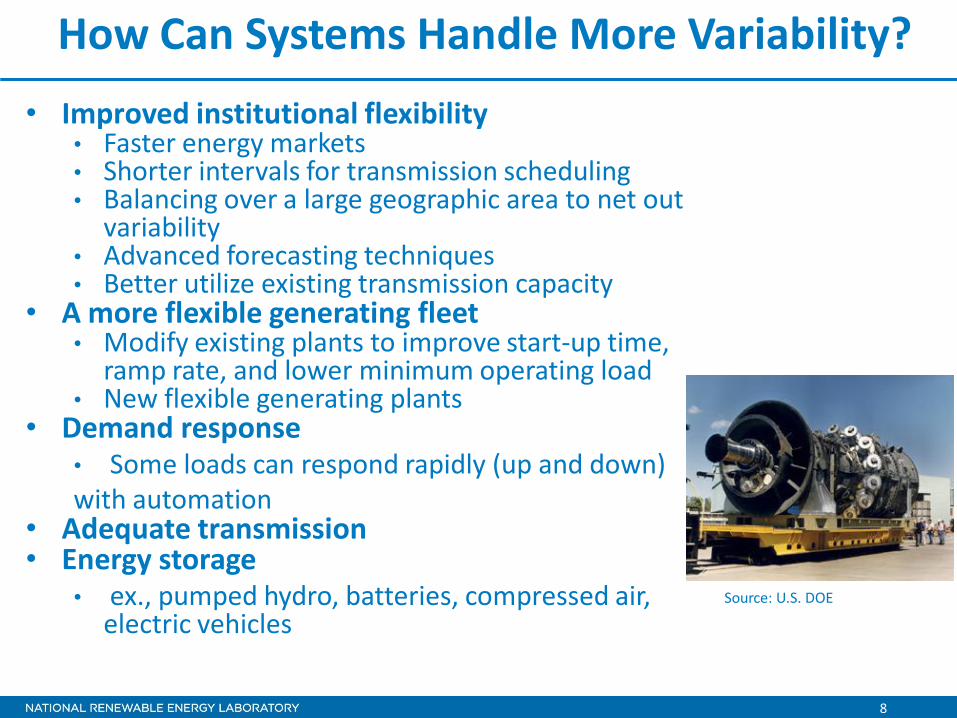
How Can Systems Handle More Variability?
• Improved institutional flexibility • Faster energy markets • Shorter intervals for transmission scheduling • Balancing over a large geographic area to net out
variability • Advanced forecasting techniques • Better utilize existing transmission capacity
• A more flexible generating fleet • Modify existing plants to improve start-up time,
ramp rate, and lower minimum operating load • New flexible generating plants
• Demand response • Some loads can respond rapidly (up and down) with automation
• Adequate transmission • Energy storage
• ex., pumped hydro, batteries, compressed air, electric vehicles
Source: U.S. DOE
9
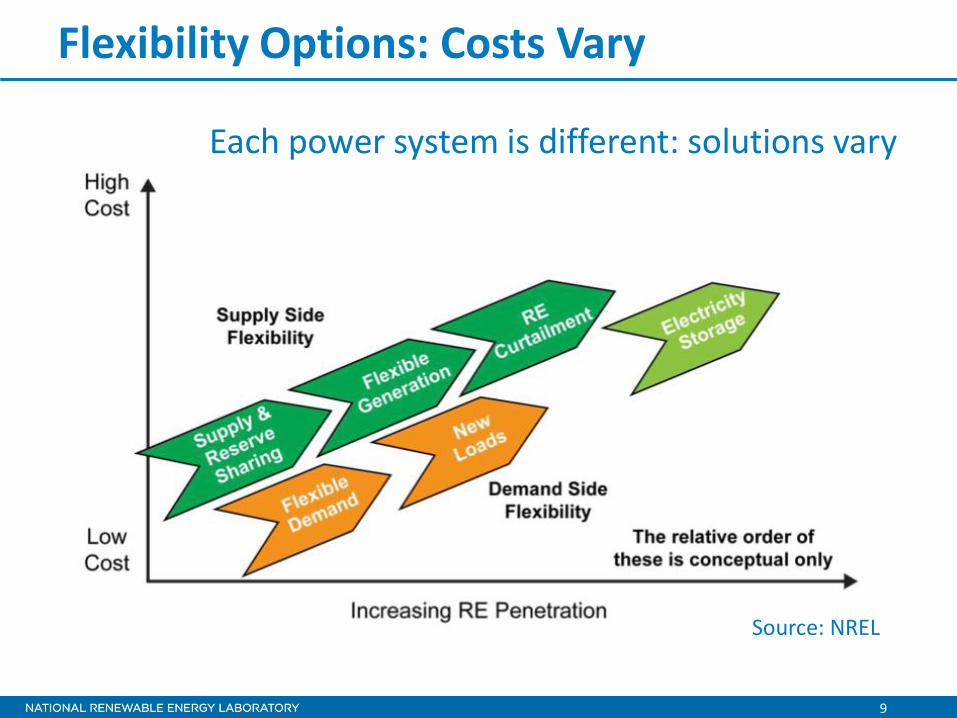
Flexibility Options: Costs Vary
Each power system is different: solutions vary
Source: NREL
10
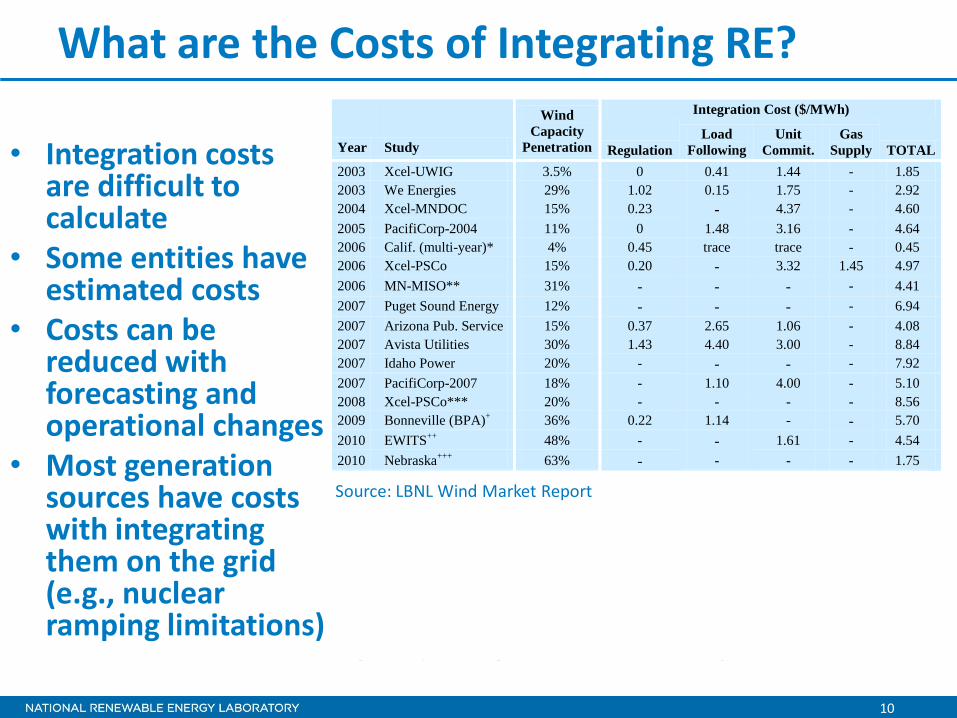
What are the Costs of Integrating RE?
• Integration costs are difficult to calculate
• Some entities have estimated costs
• Costs can be reduced with forecasting and operational changes
• Most generation sources have costs with integrating them on the grid (e.g., nuclear ramping limitations)
Integration Cost ($/MWh)
Year Study
Wind
Capacity
Penetration Regulation Load
Following Unit
Commit. Gas
Supply TOTAL
2003 Xcel-UWIG 3.5% 0 0.41 1.44 - 1.85
2003 We Energies 29% 1.02 0.15 1.75 - 2.92
2004 Xcel-MNDOC 15% 0.23 - 4.37 - 4.60
2005 PacifiCorp-2004 11% 0 1.48 3.16 - 4.64
2006 Calif. (multi-year)* 4% 0.45 trace trace - 0.45
2006 Xcel-PSCo 15% 0.20 - 3.32 1.45 4.97
2006 MN-MISO** 31% - - - - 4.41
2007 Puget Sound Energy 12% - - - - 6.94
2007 Arizona Pub. Service 15% 0.37 2.65 1.06 - 4.08
2007 Avista Utilities 30% 1.43 4.40 3.00 - 8.84
2007 Idaho Power 20% - - - - 7.92
2007 PacifiCorp-2007 18% - 1.10 4.00 - 5.10
2008 Xcel-PSCo*** 20% - - - - 8.56
2009 Bonneville (BPA)+
36% 0.22 1.14 - - 5.70
2010 EWITS++ 48% - - 1.61 - 4.54
2010 Nebraska+++
63% - - - - 1.75
* Regulation costs represent 3-year average.
** Highest over 3-year evaluation period.
*** This integration cost reflects a $10/MMBtu natural gas price scenario. This cost is much higher than the
integration cost calculated for Xcel-PSCo in 2006, in large measure due to the higher natural gas price: had the gas
price from the 2006 study been used in the 2008 study, the integration cost would drop to $5.13/MWh.
+ Costs in $/MWh assume 31% capacity factor. Aside from regulation and following reserves, the costs of BPA’s
imbalance reserves are $4.33/MWh.
++ The unit commitment costs listed in EWITS are the cost of day-ahead wind forecast error; the remaining
integration costs included in the total are for shorter term variable reserves that account for regulation and short-term
forecast errors (energy imbalance).
+++ These integration costs only capture regulating reserves and day-ahead forecast error. A sensitivity case in this
study shows that integration costs increase if the differences between the actual hourly deliveries of wind energy are
compared to daily flat block of power. The increased costs are shown in Figure 39.
Sources: Brooks et al. (2003) [Xcel-UWIG]; Electrotek Concepts, Inc. (2003) [We Energies]; EnerNex Corp. and
Wind Logics, Inc. (2004) [Xcel-MNDOC]; PacifiCorp (2005) [Pacificorp-2004]; Shiu et al. (2006) [Calif. (multi-
year)]; EnerNex Corp. (2006) [Xcel-PSCo]; EnerNex Corp. and Windlogics Inc. (2006) [MN-MISO]; Puget Sound
Energy (2007) [Puget Sound Energy]; Acker (2007) [Arizona Pub. Service]; EnerNex Corp. (2007) [Avista
Utilities]; EnerNex Corp. and Idaho Power Co. (2007) [Idaho Power]; PacifiCorp (2007) [PacifiCorp-2007];
EnerNex Corp. (2008) [Xcel-PSCo]; BPA (2009) [Bonneville]; EnerNex Corp (2010) [EWITS]; EnerNex et al.
(2010) [Nebraska]
Source: LBNL Wind Market Report

11
Options for Cost-Effectively Integrating Wind/Solar
1. Improve wind and solar forecasting
2. Encourage geographic diversity of resources
3. Retool demand response to complement variable generation
4. Access greater flexibility in the dispatch of existing generating plants
5. Focus on flexibility for new generating plants
6. Expand subhourly dispatch & scheduling
7. Implement an energy imbalance market
WGA Report: Meeting Renewable Energy Targets at Least Cost: The Integration Challenge http://www.westgov.org/
Operational and market tools, flexible demand and supply side resources

12
Improve and Expand Forecasting
Improve wind and solar forecasting o Forecasting helps utilities and grid operators anticipate the amount of
renewable energy generations – reduces uncertainty o Advanced forecasting improves scheduling of other resources to reduce
reserves, fuel consumption, and operating, maintenance costs o Substantial cost savings and reduction in integration costs:
– Xcel Energy found that 1% improvement in forecast error saved $800k (PSCO)
Policy and regulatory options: – Encourage expanded use of wind, solar forecasting by utilities and balancing areas – Encourage regional forecasts or
exchange of forecasts among balancing areas – Encourage forecasting improvements
12
Source : Alstom 2010.
13
Increase Flexibility of Generation
• Access greater flexibility in the dispatch of existing generating plants o Some plants can be retrofitted to increase flexibility by lowering
minimum loads, reducing cycling costs and increasing ramp rates. • Focus on flexibility for new generating plants
o Requires rethinking resource adequacy analysis to reflect the economic benefit of flexibility service
o Changes to resource planning and procurement frameworks
Policy and Regulatory Options • Conduct a flexibility inventory for existing resources • Analyze the potential for retrofitting less flexible generating plants • Review incentives/disincentives for plant owners to invest in increased
flexibility • Examine and amend guidance for evaluating flexibility needs in utility
resource planning • Use competitive procurement processes to evaluate alternative flexible
capacity solutions
13
14
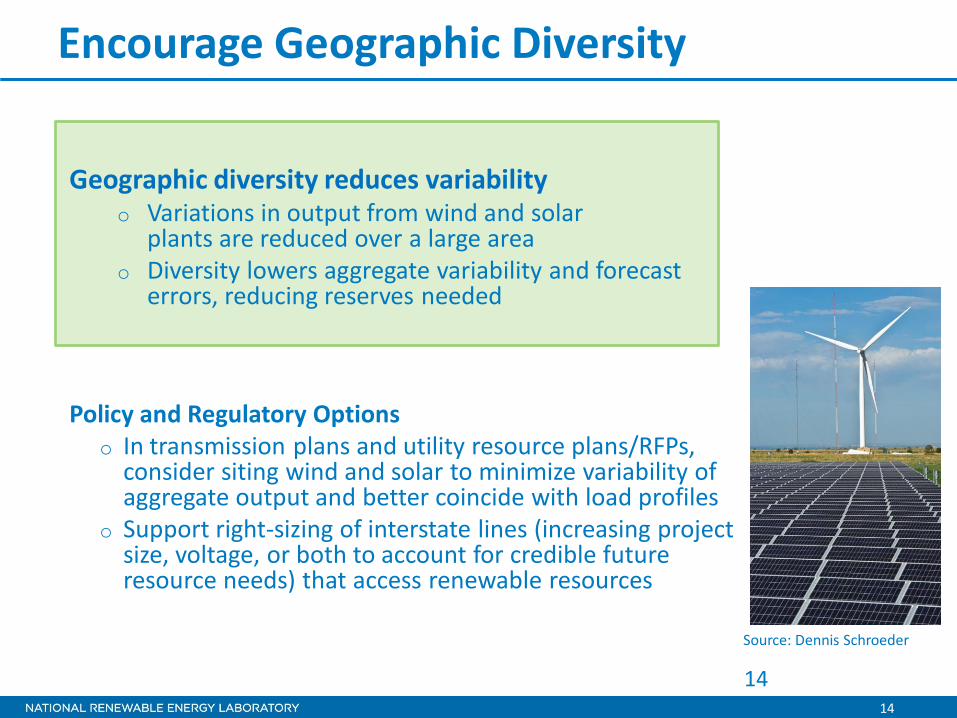
Encourage Geographic Diversity
Geographic diversity reduces variability
o Variations in output from wind and solar plants are reduced over a large area
o Diversity lowers aggregate variability and forecast errors, reducing reserves needed
Policy and Regulatory Options
o In transmission plans and utility resource plans/RFPs, consider siting wind and solar to minimize variability of aggregate output and better coincide with load profiles
o Support right-sizing of interstate lines (increasing project size, voltage, or both to account for credible future resource needs) that access renewable resources
14
Source: Dennis Schroeder
15
Encourage Demand Response
• Shift customer load up and down to complement wind and solar through direct load control and real-time pricing with automation
• Demand response (DR) may be less expensive than supply-side resources and energy storage technologies
Policy and Regulatory Options
• Allow DR to compete on a par with supply-side alternatives in utility resource planning and acquisition
• Consider potential value of enabling DR when evaluating advanced metering
• Examine ratemaking practices for features that discourage cost-effective DR – e.g., demand charges that penalize large customers for higher peaks when they shift loads away from periods of limited energy supplies
15
16
Concluding Remarks
• Higher penetrations of wind, solar can be managed through operational changes
• All power systems differ depending on generation mix, operations, markets, etc. --- solutions differ
• Policymakers can play a role in helping to manage higher penetrations of RE by encouraging: o new generation sources to be flexible o flexible loads – i.e., demand response o use of forecasting o transmission investments o installed RE technologies can support the grid o geographic diversity of RE, if appropriate
Source: Steve Wilcox