Embed Size (px)
Citation preview
The reliability and stability of visual working memory capacity
Z. Xu1& K. C. S. Adam2
& X. Fang1 & E. K. Vogel2
Published online: 7 April 2017# Psychonomic Society, Inc. 2017
Abstract Because of the central role of workingmemory capac-ity in cognition, many studies have used short measures of work-ingmemory capacity to examine its relationship to other domains.Here, we measured the reliability and stability of visual workingmemory capacity, measured using a single-probe change detec-tion task. In Experiment 1, the participants (N = 135) completed alarge number of trials of a change detection task (540 in total, 180each of set sizes 4, 6, and 8).With large numbers of both trials andparticipants, reliability estimates were high (α > .9).We then usedan iterative down-sampling procedure to create a look-up table forexpected reliability in experiments with small sample sizes. InExperiment 2, the participants (N = 79) completed 31 sessionsof single-probe change detection. The first 30 sessions took placeover 30 consecutive days, and the last session took place 30 dayslater. This unprecedented number of sessions allowed us to exam-ine the effects of practice on stability and internal reliability. Evenafter much practice, individual differences were stable over time(average between-session r = .76).
Keywords Visual workingmemory . Reliability . Changedetection
Working memory (WM) capacity is a core cognitive abilitythat predicts performance across many domains. For example,WM capacity predicts attentional control, fluid intelligence,
and real-world outcomes such as perceiving hazards whiledriving (Engle, Tuholski, Laughlin, & Conway, 1999;Fukuda, Vogel, Mayr, & Awh, 2010; Wood, Hartley, Furley,& Wilson, 2016). For these reasons, researchers are often in-terested in devising brief measures of WM capacity to inves-tigate the relationship of WM capacity to other cognitive pro-cesses. However, truncated versions of WM capacity taskscould potentially be inadequate for reliably measuring an in-dividual’s capacity. Inadequate measurement could obscurecorrelations between measures, or even differences in perfor-mance between experimental conditions. Furthermore, al-though WM capacity is considered to be a stable trait of theobserver, little work has directly examined the role of exten-sive practice in the measurement of WM capacity over time.This is of particular concern because of the popularity of re-search examining whether training affects WM capacity(Melby-Lervåg & Hulme, 2013; Shipstead, Redick, &Engle, 2012). Extensive practice on any given cognitive taskhas the potential to significantly alter the nature of the variancethat determines performance. For example, extensive practicehas the potential to induce a restriction-of-range problem, inwhich the bulk of the observers reach similar performancelevels—thus reducing any opportunity to observe correlationswith other measures. Consequently, a systematic study of thereliability and stability ofWM capacity measures is critical forimproving the measurement and reproducibility of major phe-nomena in this field.
In the present study, we sought to establish the reliabilityand stability of one particular WM capacity measure: changedetection. Change detection measures of visual WM havegained popularity as a means of assessing individual differ-ences in capacity. In a typical change detection task, partici-pants briefly view an array of simple visual items (for ~100–500 ms), such as colored squares, and remember these itemsacross a short delay (~1–2 s). At test, observers are presented
Z. Xu and K. C. S. Adam contributed equally to this work.
* K. C. S. [email protected]
1 School of Psychology, Southwest University, Chongqing, China2 Department of Psychology, University of Chicago, 940 E 57th Street,
Chicago, Illinois 60637, USA
Behav Res (2018) 50:576–588DOI 10.3758/s13428-017-0886-6
with an item at one of the remembered locations, and theyindicate whether the presented test item is the same as theremembered item (Bno-change^ trial) or is different (Bchangetrial^). Performance can be quantified as raw accuracy or con-verted into a capacity estimate (BK^). In capacity estimates,performance for change trials and no-change trials is calculat-ed separately as hits (the proportion of correct change trials)and false alarms (the proportion of incorrect no-change trials)and converted into a set-size-dependent score (Cowan, 2001;Pashler, 1988; Rouder, Morey, Morey, & Cowan, 2011).
Several beneficial features of change detection tasks haveled to their increased popularity. First, change detection mem-ory tasks are simple and short enough to be used with devel-opmental and clinical populations (e.g., Cowan, Fristoe,Elliott, Brunner, & Saults, 2006; Gold, Wilk, McMahon,Buchanan, & Luck, 2003; Lee et al., 2010). Second, the rela-tively short length of trials lends the task well to neural mea-sures that require large numbers of trials. In particular, neuralstudies employing change detection tasks have providedstrong corroborating evidence of capacity limits in WM(Todd & Marois, 2004; Vogel & Machizawa, 2004) and haveyielded insights into potential mechanisms underlying indi-vidual differences in WM capacity (for a review, see Luria,Balaban, Awh, & Vogel, 2016). Finally, change detectiontasks and closely related memory-guided saccade tasks canbe used with animal models from pigeons (Gibson,Wasserman, & Luck, 2011) to nonhuman primates(Buschman, Siegel, Roy, & Miller, 2011), providing a rareopportunity to directly compare behavior and neural correlatesof task performance across species (Elmore, Magnotti, Katz,& Wright, 2012; Reinhart et al., 2012).
A main aim of this study is to quantify the effect of mea-surement error and sample size on the reliability of changedetection estimates. In previous studies, change detection es-timates of capacity have yielded good reliability estimates(e.g., Pailian & Halberda, 2015; Unsworth, Fukuda, Awh, &Vogel, 2014). However, measurement error can vary dramat-ically with the number of trials in a task, thus impacting reli-ability; Pailian and Halberda found that reliability of changedetection estimates greatly improved when the number of tri-als was increased. Researchers frequently employ vastly dif-ferent numbers of trials and participants in studies of individ-ual differences, but the effect of trial number on change detec-tion reliability has never been fully characterized. In studiesusing large batteries of tasks, time and measurement error areforcesworking in opposition to one another.When researcherswant to minimize the amount of time that a task takes, mea-sures are often truncated to expedite administration. Suchtruncated measures increase measurement noise and potential-ly harm the reliability of the measure. At present, there is noclear understanding of the minimum number of either partic-ipants or trials that is necessary to obtain reliable estimates ofchange detection capacity.
In addition to measurement error within-session, reliabilityof individual differences could be compromised with exten-sive practice. Previously, it was found that visual WM capac-ity estimates were stable (r = .77) after 1.5 years betweentesting sessions (Johnson et al., 2013). However, the effectof extensive practice on change detection estimates of capac-ity has yet to be characterized. Extensive practice could harmthe reliability and stability of measures in a couple of ways.First, it is possible that participants could improve so muchthat they reach performance ceiling, thus eliminating variabil-ity between individuals. Second, if individual differences aredue to the utilization of optimal versus suboptimal strategies,then participants might converge to a common mean afterengaging in extensive practice and finding optimal task strat-egies. Both of these hypothetical possibilities would call intoquestion the true stability of WM capacity estimates, and like-wise severely harm the statistical reliability of the measure. Assuch, in Experiment 2 we directly quantified the extent ofextensive practice on the stability of WM capacity estimates.
Overview of experiments
We measured the reliability and stability of a single-probechange detection measure of visual WM capacity. InExperiment 1, we measured the reliability of capacity esti-mates obtained with a commonly used version of the colorchange detection task for a relatively large number of partic-ipants (n = 135) and a larger than typical number of trials (t =540). In Experiment 2, we measured the stability of capacityestimates across an unprecedented number of testing sessions(31). Because of the large number of sessions, we could in-vestigate the stability of change detection estimates after ex-tended practice and over a period of 60 days.
Experiment 1
Materials and method
Participants A total of 137 individuals (102 females, 35males; mean age = 19.97, SD = 1.07) with normal orcorrected-to-normal vision participated in the experiment.Participants provided written informed consent, and the studywas approved by the Ethics Committee at SouthwestUniversity. Participants received monetary compensation fortheir participation. Two participants were excluded becausethey had negative average capacity values, resulting in a finalsample of 135 participants.
Stimuli The stimuli were presented on monitors with a refreshrate of 75 Hz and a screen resolution of 1,024 × 768.Participants sat approximately 60 cm from the screen, though
Behav Res (2018) 50:576–588 577
a chinrest was not used so all visual angle estimates are ap-proximate. In addition, there were some small variations inmonitor size (five 16-in. CRT monitors, three 19-in. LCDmonitors) in testing rooms, leading to small variations in thesize of the colored squares from monitor to monitor. Detailsare provided about the approximate range in degrees of visualangle.
All stimuli were generated in MATLAB (The MathWorks,Natick, MA) using the Psychophysics Toolbox (Brainard,1997). Colored squares (51 pixels; range of 1.55° to 2.0° vi-sual angle) served as memoranda. Squares could appear any-where within an area of the monitor subtending approximately10.3° to 13.35° horizontally and 7.9° to 9.8° vertically.Squares could appear in any of nine distinct colors, and colorswere sampled without replacement within each trial (RGBvalues: red = 255 0 0; green = 0 255 0; blue = 0 0 255;magenta = 255 0 255; yellow = 255 255 0; cyan = 0 255255; orange = 255 128 0; white = 255 255 255; black = 0 00). Participants were instructed to fixate a small black dot(approximate range: .36° to .47° of visual angle) at the centerof the display.
Procedures Each trial began with a blank fixation period of1,000 ms. Then, participants briefly viewed an array of four,six, or eight colored squares (150 ms), which they remem-bered across a blank delay period (1,000 ms). At test, onecolored square was presented at one of the remembered loca-tions. The probabilities were equal that the probed square wasthe same color (no-change trial) or was a different color(change trial). Participants made an unspeeded response bypressing the Bz^ key, if the color was the same, or the B/^key, if the color was different. Participants completed 180trials of set sizes 4, 6, and 8 (540 trials total). Trials weredivided into nine blocks, and participants were given a briefrest period (30 s) after each block. To calculate capacity,change detection accuracy was transformed into a K estimateusing Cowan’s (2001) formula K = N × (H − FA), where Nrepresents the set size, H is the hit rate (proportion of correctresponses to change trials), and FA is the false alarm rate(proportion of incorrect responses to no-change trials).Cowan’s formula is best for single-probe displays like theone employed here. For change detection tasks using whole-display probes, Pashler’s (1988) formula may be more appro-priate (Rouder et al., 2011).
Results
Descriptive statistics for each set size condition are shown inTable 1, and data for both Experiments 1 and 2 are availableonline at the website of the Open Science Framework, athttps://osf.io/g7txf/. We observed a significant difference inperformance across set sizes, F(2, 268) = 20.6, p < .001, ηp
2
= .133, and polynomial contrasts revealed a significant lineartrend, F(1, 134) = 36.48, p < .001, ηp
2 = .214, indicating thatthe average performance declined slightly with increasedmemory load.
Reliability of the full sample: Cronbach’s alpha We com-puted Cronbach’s alpha (unstandardized) using K scores fromthe three set sizes as items (180 trials contributing to eachitem), and obtained a value of α = .91 (Cronbach, 1951). Wealso computed Cronbach’s alpha using K scores from the nineblocks of trials (60 trials contributing to each item) and ob-tained a nearly identical value of α = .92. Finally, we comput-ed Cronbach’s alpha using raw accuracy for single trials (540items), and obtained an identical value of α = .92. Thus,change detection estimates had high internal reliability for thislarge sample of participants, and the precise method used todivide trials into Bitems^ does not impact Cronbach’s alphaestimates of reliability for the full sample. Furthermore, usingraw accuracy versus bias-corrected K scores did not impactreliability.
Reliability of the full sample: Split-half The split-half cor-relation of theK scores for even and odd trials was reliable, r =.88, p < .001, 95% CI [.84, .91]. Correcting for attenuationyielded a split-half correlation value of r = .94 (Brown, 1910;Spearman, 1910). Likewise, the capacity scores from individ-ual set sizes correlated with each other: rss4-ss6 = .84, p < .001,95% CI [.78, .88]; rss6-ss8 = .79, p < .001, 95% CI [.72, .85];rss4-ss8 = .76, p < .001, 95% CI [.68, .83]. Split-half correla-tions for individual set sizes yielded Spearman–Brown-corrected correlation values of r = .91 for set size 4, r = .86for set size 6, and r = .76 for set size 8, respectively.
The drop in capacity from set size 4 to set size 8 has beenused in the literature as a measure of filtering ability. However,the internal reliability of this difference score has typicallybeen low (Pailian & Halberda, 2015; Unsworth et al., 2014).Likewise, we found here that the split-half reliability of theperformance decline from set size 4 to set size 8 (B4–8 Drop^)was low, with a Spearman–Brown-corrected correlation valueof r = .24. Although weak, this correlation is of the same
Table 1 Descriptive statistics for Experiment 1
Mean K SD Min Max Kurtosis Skewness
Set Size 4 2.32 0.70 0.58 3.87 −0.49 −0.35Set Size 6 2.10 0.97 0.07 4.80 −0.18 0.34
Set Size 8 1.99 0.97 −0.18 4.53 −0.52 0.14
Average 2.14 0.82 0.38 4.31 −0.47 0.07
Descriptive statistics are shown separately for each set size and for theaverage of the three set sizes. Kurtosis and skewness values are bothcentered around 0. Neither kurtosis nor skewnesswas credibly nonnormalin any condition (Cramer, 1997).
578 Behav Res (2018) 50:576–588
strength that was reported in earlier work (Unsworth et al.,2014). The split-half reliability of the performance declinefrom set size 4 to set size 6 was slightly higher, r = .39, andthe split-half reliability of the difference between set size 6 andset size 8 performance was very low, r = .08. The reliability ofdifferences scores can be impacted both by (1) the internalreliability of each measure used to compute the differenceand (2) the degree of correlation between the two measures(Rodebaugh et al., 2016). Although the internal reliability ofeach individual set size was high, the positive correlation be-tween set sizes may have decreased the reliability of the setsize difference scores.
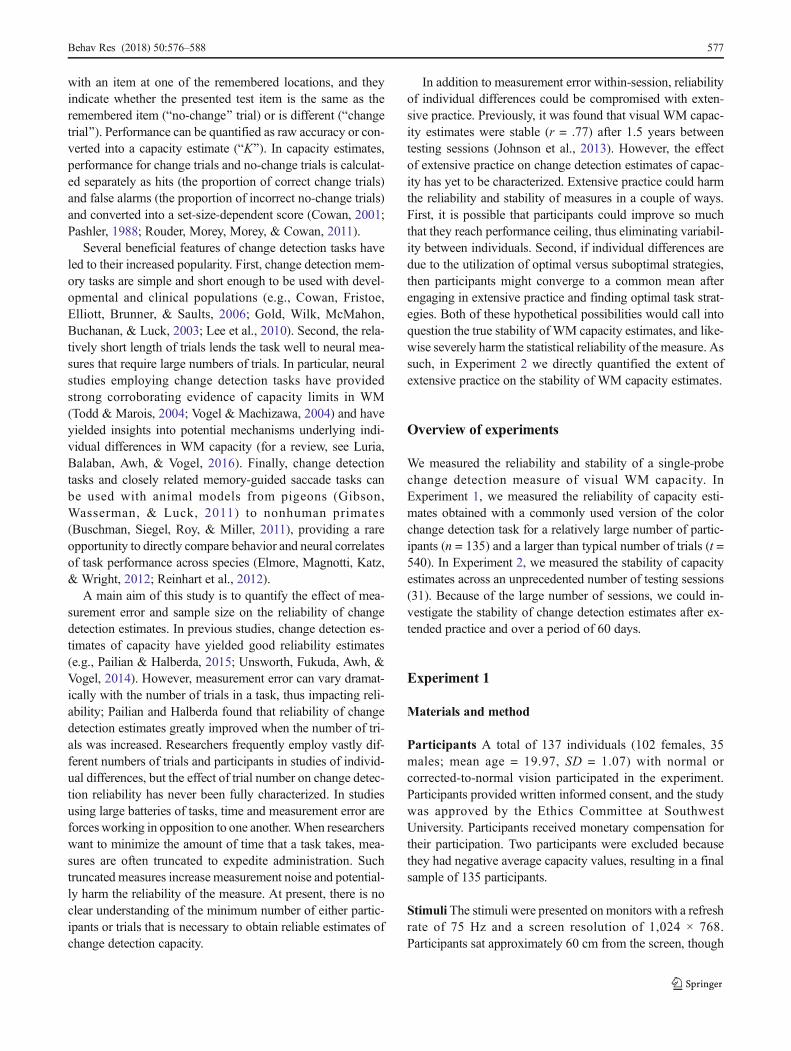
An iterative down-sampling approach To investigate theeffects of sample size and trial number on the reliability esti-mates, we used an iterative down-sampling procedure. Tworeliability metrics were assessed: (1) Cronbach’s alpha usingsingle-trial accuracy as items, and (2) split-half correlationsusing all trials. For the down-sampling procedure, we random-ly sampled participants and trials from the full dataset. Thenumber of participants (n) was varied from 5 to 135 in steps of5. The number of trials (t) was varied from 5 to 540 in steps of5. Number of participants and number of trials were factoriallycombined (2,916 cells total). For each cell in the design, weran 100 sampling iterations. On each iteration, n participantsand t trials were randomly sampled from the full dataset andreliability metrics were calculated for the sample.
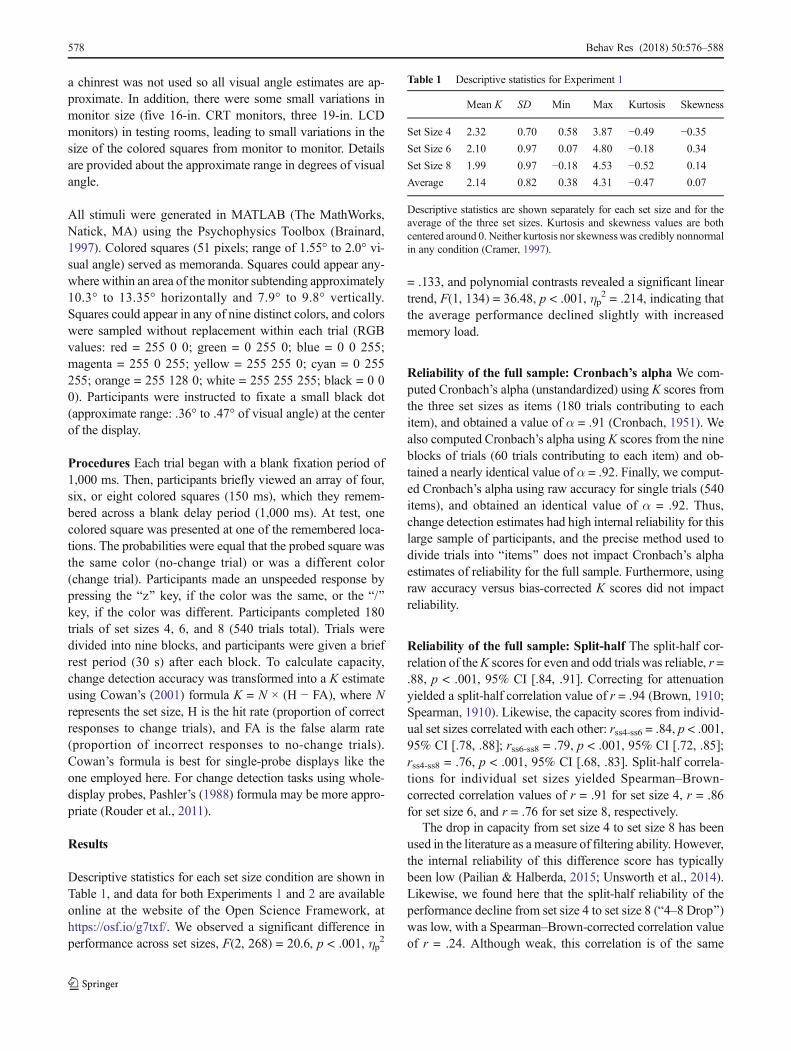
Figure 1 shows the results of the down-sampling procedurefor Cronbach’s alpha. Figure 2 shows the results of the down-sampling procedure for split-half reliability estimates. In eachplot, we show both the average reliabilities obtained across the100 iterations (Figs. 1a and 2a) and the worst reliabilitiesobtained across the 100 iterations (Figs. 1b and 2b).Conceptually, we could think of each iteration of the down-sampling procedure as akin to running one Bexperiment,^withparticipants randomly sampled from our Bpopulation^ of 137.Although it is good to know the average expected reliability
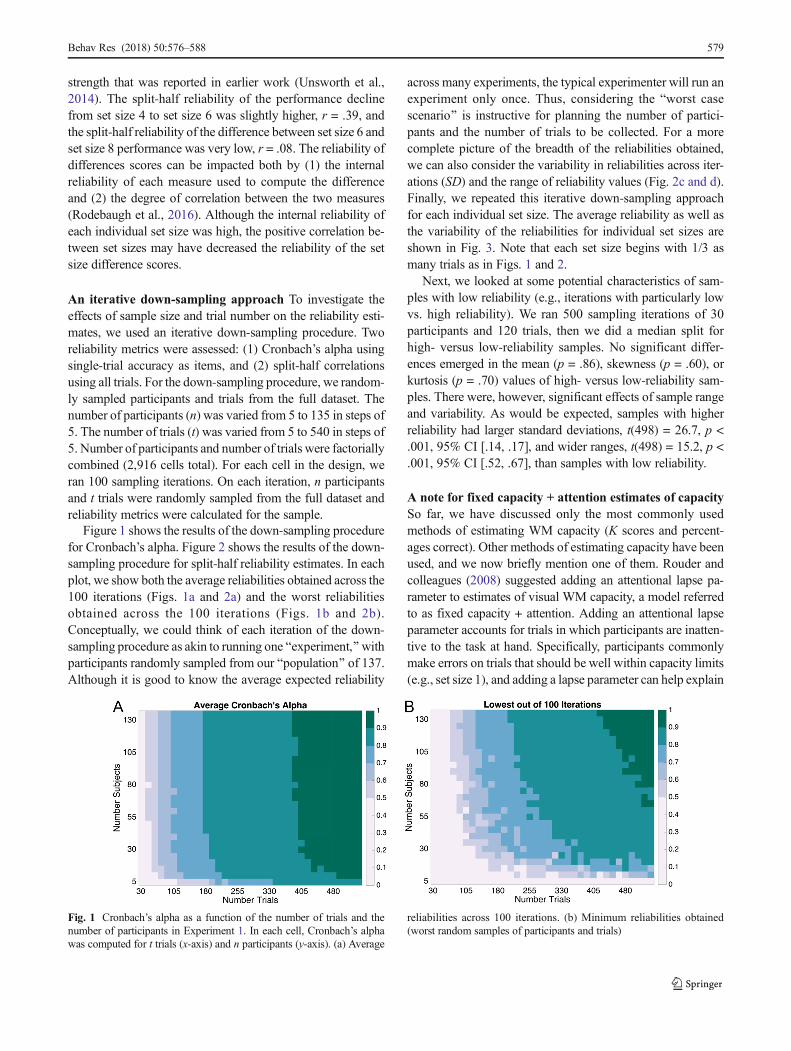
across many experiments, the typical experimenter will run anexperiment only once. Thus, considering the Bworst casescenario^ is instructive for planning the number of partici-pants and the number of trials to be collected. For a morecomplete picture of the breadth of the reliabilities obtained,we can also consider the variability in reliabilities across iter-ations (SD) and the range of reliability values (Fig. 2c and d).Finally, we repeated this iterative down-sampling approachfor each individual set size. The average reliability as well asthe variability of the reliabilities for individual set sizes areshown in Fig. 3. Note that each set size begins with 1/3 asmany trials as in Figs. 1 and 2.
Next, we looked at some potential characteristics of sam-ples with low reliability (e.g., iterations with particularly lowvs. high reliability). We ran 500 sampling iterations of 30participants and 120 trials, then we did a median split forhigh- versus low-reliability samples. No significant differ-ences emerged in the mean (p = .86), skewness (p = .60), orkurtosis (p = .70) values of high- versus low-reliability sam-ples. There were, however, significant effects of sample rangeand variability. As would be expected, samples with higherreliability had larger standard deviations, t(498) = 26.7, p <.001, 95% CI [.14, .17], and wider ranges, t(498) = 15.2, p <.001, 95% CI [.52, .67], than samples with low reliability.
A note for fixed capacity + attention estimates of capacitySo far, we have discussed only the most commonly usedmethods of estimating WM capacity (K scores and percent-ages correct). Other methods of estimating capacity have beenused, and we now briefly mention one of them. Rouder andcolleagues (2008) suggested adding an attentional lapse pa-rameter to estimates of visual WM capacity, a model referredto as fixed capacity + attention. Adding an attentional lapseparameter accounts for trials in which participants are inatten-tive to the task at hand. Specifically, participants commonlymake errors on trials that should be well within capacity limits(e.g., set size 1), and adding a lapse parameter can help explain
Fig. 1 Cronbach’s alpha as a function of the number of trials and thenumber of participants in Experiment 1. In each cell, Cronbach’s alphawas computed for t trials (x-axis) and n participants (y-axis). (a) Average
reliabilities across 100 iterations. (b) Minimum reliabilities obtained(worst random samples of participants and trials)
Behav Res (2018) 50:576–588 579
these anomalous dips in performance. Unlike typical estimatesof capacity, in which a K value is computed directly for per-formance for each set size and then averaged, this model usesa log-likelihood estimation technique that estimates a single
capacity parameter by simultaneously considering perfor-mance across all set sizes and/or change probability condi-tions. Critically, this model assumes that data are obtainedfor at least one subcapacity set size, and that any error made
Fig. 2 Spearman–Brown-corrected split-half reliability estimates as afunction of the numbers of trials and participants in Experiment 1. (a)Average reliabilities across 100 iterations. (b) Minimum reliabilities
obtained (worst random samples of participants and trials). (c) Standarddeviations of the reliabilities obtained across samples. (d) Range of reli-ability values obtained across samples
Fig. 3 Spearman–Brown-corrected split-half reliability estimates for each set size in Experiment 1. Top panels: Average reliabilities for each set size.Bottom panels: Standard deviations of the reliabilities for each set size across 100 down-sampling iterations
580 Behav Res (2018) 50:576–588
on this set size reflects an attentional lapse. If the model is fitto data that lack at least one subcapacity set size (e.g., one ortwo items), then the model will fit poorly and provide nonsen-sical parameter estimates.
Recently, Van Snellenberg, Conway, Spicer, Read, andSmith (2014) used the fixed capacity + attention model tocalculate capacity for a change detection task, and they foundthat the reliability of the model’s capacity parameter was low(r = .32) and did not correlate with other WM tasks. Critically,however, this study used only relatively high set sizes (4 and8) and lacked a subcapacity set size, so model fits were likelypoor. Using code made available by Rouder et al., we fit afixed capacity + attention model to our data (Rouder, n.d.).Wefound that when this model is misapplied (i.e., used on datawithout at least one subcapacity set size), the internal reliabil-ity of the capacity parameter was low (r uncorrected = .35)and was negatively correlated with raw change detection ac-curacy, r = −.25, p = .004. If we had only applied this model toour data, we would have mistakenly concluded that changedetection measures offer poor reliability and do not correlatewith other measures of WM capacity.
Discussion
Here, we have shown that when sufficient numbers of trialsand participants are collected, the reliability of change detec-tion capacity is remarkably high (r > .9). On the other hand, asystematic down-sampling method revealed that insufficienttrials or insufficient participant numbers could dramaticallyreduce the reliability obtained in a single experiment. If re-searchers hope to measure the correlation between visual WMcapacity and some other measure, Figs. 1 and 2 can serve as anapproximate guide to expected reliability. Because we hadonly a single sample of the largest n (137), we cannot makedefinitive claims about the reliabilities of future samples ofthis size. However, given the stabilization of correlation coef-ficients with large sample sizes and the extremely high corre-lation coefficient obtained, we can be relatively confident thatthe reliability estimate for our full sample (n = 137) would notchange substantially in future samples of university students.Furthermore, we can make claims about how the reliability ofsmall, well-defined subsamples of this Bpopulation^ can sys-tematically deviate from an empirical upper bound.
The average capacity obtained for this sample was slightlylower than some other values in the literature, typically citedas around three or four items. The slightly lower average forthis sample could potentially cause some concern about thegeneralizability of these reliability values for future samples.For the present study’s sample, the average K scores for setsizes 4 and 8 were K = 2.3 and 2.0, respectively. The largest,most comparable sample to the present sample is a 495-participant sample in a work by Fukuda, Woodman, andVogel (2015). The average K scores for set sizes 4 and 8 were
K = 2.7 and 2.4, respectively, and the task design was nearlyidentical (150-ms encoding time, 1,000-ms retention interval,no color repetitions allowed, and set sizes 4 and 8). The dif-ference of 0.3–0.4 items between these two samples is rela-tively small, though likely significant. However, for the pur-poses of estimating reliability, the variance of the distributionis more important than the mean. The variabilities observed inthe present sample (SD = 0.7 for set size 4, SD = 0.97 for setsize 8) were very similar to those observed in the Fukuda et al.sample (SD = 0.6 for set size 4 and SD = 1.2 for set size 8),though unfortunately the Fukuda et al. study did not reportreliability. Because of the nearly identical variabilities ofscores across these two samples, we can infer that our reliabil-ity results would indeed generalize to other large samples forwhich change detection scores have been obtained.
We recommend applying an iterative down-sampling ap-proach to other measures when expediency of task adminis-tration is valued, but reliability is paramount. The stats-savvyreader may note that the Spearman–Brown prophecy formulaalso allows one to calculate how many observations must beadded to improve the expected reliability, according to theformula
N ¼ρ*xx0 1−ρ
xx0
� �
ρxx0 1− ρ*xx0� �
where ρ*xx0 is the desired correlation strength, ρxx0 is the ob-
served correlation, and N is the number of times that a testlength must be multiplied to achieve the desired correlationstrength. Critically, however, this formula does not accountfor the accuracy of the observed correlation. Thus, if onestarts from an unreliable correlation coefficient obtained witha small number of participants and trials, one will obtain anunreliable estimate of the number of observations needed toimprove the correlation strength. In experiments such as thisone, both the number of trials and the number of participantswill drastically change estimates of the number of participantsneeded to observe correlations of a desired strength.
Let’s take an example from our iterative down-samplingprocedure. Imagine that we ran 100 experiments, each with15 participants and 150 total trials of change detection. Doingso, we would obtain 100 different estimates of the strength ofthe true split-half correlation. We could then apply theSpearman-Brown formula to each of these 100 estimates inorder to calculate the number of trials needed to obtain adesired reliability of r = .8. So doing, we would find that, onaverage, we would need around 140 trials to obtain the desiredreliability. However, because of the large variability in theobserved correlation strength (r = .37 to .97), if we had onlyrun the Bbest case^ experiment (r = .97), we would estimatethat we need only 18 trials to obtain our desired reliability of r= .8 with 15 participants. On the other hand, if we had run the
Behav Res (2018) 50:576–588 581
Bworst case^ experiment (r = .37), then we would estimatethat we need 1,030 trials. There are downsides to both types ofestimation errors. Although a pessimistic estimate of the num-ber of trials needed (>1,000) would certainly ensure adequatereliability, this might come at the cost of time and participants’frustration. Conversely, an overly optimistic estimate of thenumber of trials needed (<20) would lead to underpoweredstudies that would waste time and funds.
Finally, we investigated an alternative parameterization ofcapacity based on a model that assumes a fixed capacity andan attention lapse parameter (Rouder et al., 2008). Critically,this model attempts to explain errors for set sizes that are wellwithin capacity limits (e.g., one item). If researchers inappro-priately apply this model to change detection data with onlylarge set sizes, they would erroneously conclude that changedetection tasks yield poor reliability and fail to correlate withother estimates of capacity (e.g., Van Snellenberg et al., 2014).
In Experiment 2, we shifted our focus to the stability ofchange detection estimates. That is, how consistent are esti-mates of capacity from day to day? We collected an unprece-dented number of sessions of change detection performance(31) spanning 60 days. We examined the stability of capacityestimates, defined as the correlation between individuals’ ca-pacity estimates from one day to the next. Since capacity isthought to be a stable trait of the individual, we predicted thatindividual differences in capacity should be reliable acrossmany testing sessions.
Experiment 2
Materials and methods
ParticipantsAgroup of 79 individuals (22males, 57 females;mean age = 22.67 years, SD = 2.31) with normal or corrected-to-normal vision participated for monetary compensation. Thestudy was approved by the Ethics Committee of SouthwestUniversity.
Stimuli Some experimental sessions were completed in thelab and others were completed in participants’ homes. In thelab, stimuli were presented on monitors with a refresh rate of75Hz. At home, stimuli were presented on laptop screens withsomewhat variable refresh rates and sizes. In both cases, par-ticipants sat approximately 60 cm from the screen, though achinrest was not used, so all visual angle estimates are approx-imate. In the lab there were some small variations in monitorsize (five 18.5-in. LCD monitors, one 19-in. LCD monitor) inthe testing rooms, leading to small variations in the sizes of thecolored squares. Details are provided about the approximaterange in degrees of visual angle in the lab.
All stimuli were generated in MATLAB (The MathWorks,Natick, MA) using the Psychophysics Toolbox (Brainard,1997). Colored squares (51 pixels; range of 1.28° to 1.46°visual angle) served as the memoranda. Squares could appearanywhere within an area of the monitor subtending approxi-mately 14.4° to 14.8° horizontally and 8.1° to 8.4° vertically.Squares could appear in any of nine distinct colors (RGBvalues: red = 255 0 0; green = 0 255 0; blue = 0 0 255;magenta = 255 0 255; yellow = 255 255 0; cyan = 0 255255; orange = 255 128 0; white = 255 255 255; black = 0 00). Colors were sampled without replacement for set size 4and set size 6 trials. Each color could be repeated up to onetime in set size 8 trials (i.e., colors were sampled from a list of18 colors, with each of the nine unique colors appearingtwice). Participants were instructed to fixate a small blackdot (~0.3° visual angle) at the center of the display.
Procedures Trial procedures for the change detection taskwere identical to Experiment 1. Participants completed a totalof 31 sessions of the change detection task. In each session,participants completed a total of 120 trials (split over fiveblocks). There were 40 trials each of set sizes 4, 6, and 8.Participants were asked to finish the change detection taskonce a day for 30 consecutive days. They could do this taskon their own computers or on the experimenters’ computersthroughout the day. Participants were instructed that theyshould complete the task in a relatively quiet environmentand not do anything else (e.g., talking to others) at the sametime. Experimenters reminded the participants to finish thetask and collected the data files every day.
Results
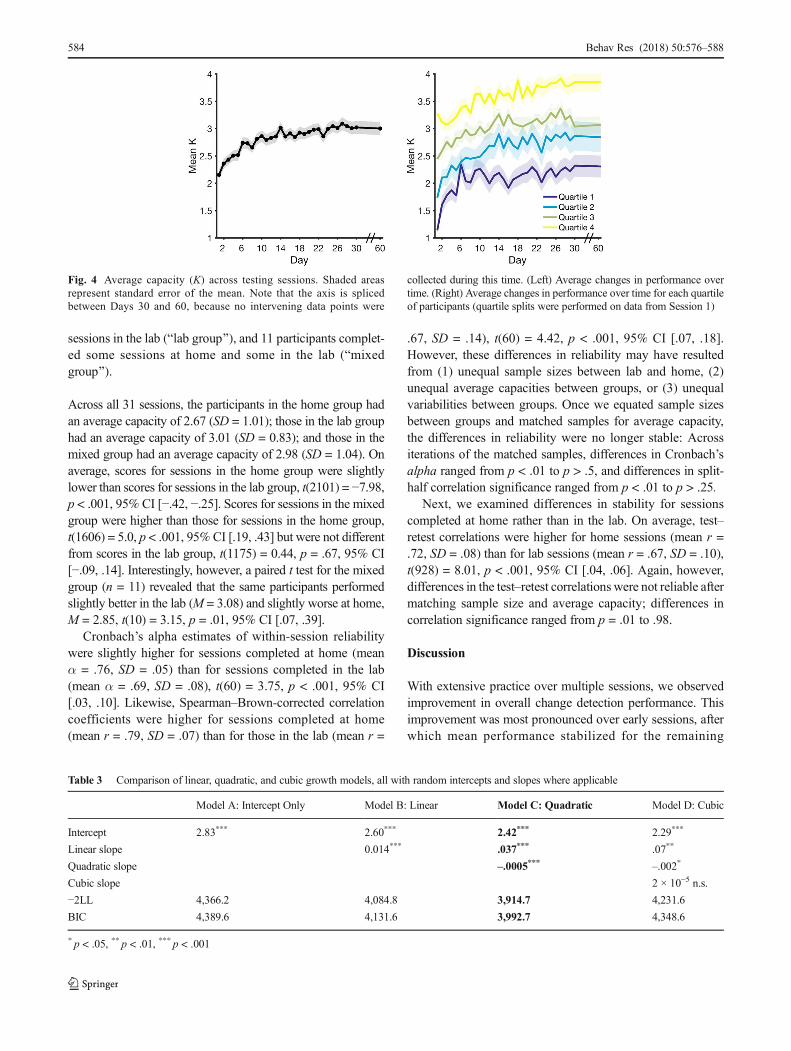
Descriptive statistics Descriptive statistics for the average Kvalues across the 31 sessions are shown in Table 2. Across allsessions, the average capacity was 2.83 (SD = 0.23). Changein mean capacity over time is shown in Fig. 4a. A repeatedmeasures ANOVA revealed a significant difference in capac-ity across sessions, F(18.76, 1388.38)1 = 15.04, p < .001, ηp
2
= .169. Participants’ performance initially improved acrosssessions, then leveled off. The group-average increase in ca-pacity over time is well-described by a two-term exponentialmodel (SSE = .08, RMSE = .06, adjusted R2 = .94), describedby the equation y = 2.776 × e.003x − 0.798 × e−.26x. To test theimpression that individuals’ improvement slowed over time,we fit several growth curve models to the data using maxi-mum likelihood estimation (fitmle.m) with Subject entered asa random factor. We coded time as days from the first session(Session 1 = 0). Model A included only a random intercept,Model B included a random intercept and a random linear
1 Greenhouse–Geisser values reported when Mauchly’s test of sphericity isviolated.
582 Behav Res (2018) 50:576–588
effect of time,Model C added in a quadratic effect of time, andModel D added a cubic effect of time. As is shown in Table 3,the quadratic model provided the best fit to the data. Furthertesting revealed that both random slopes and intercepts wereneeded to best fit the data (see Table 4, comparing ModelsC1–C4). That is, participants started out with different base-line capacity values, and they improved at different rates.However, the covariance matrix for Model C revealed no sys-tematic relationship between initial capacity (intercept) andeither the linear effect of time, r = .21, 95% CI [−.10, .49] orthe quadratic effect of time, r = −.14, 95% CI [−.48, .24]. Thissuggests that there was no meaningful relationship between a
participant’s initial capacity and that participant’s rate of im-provement. To visualize this point, we did a quartile split ofSession 1 performance and then plotted the change for each ofeach group (Fig. 4).
Within-session reliability Within-session reliability wasassessed using Cronbach’s alpha and split-half correlations.Cronbach’s alpha (using single-trial accuracy as items)yielded an average within-session reliability of α = .76 (SD= .04, min. = .65, max. = .83). Equivalently, spit-half correla-tions on K scores calculated from even versus odd trials re-vealed an average Spearman–Brown-corrected reliability of r= .76 (SD = .06, min. = .62, max. = .84). As in Experiment 1,using raw errors (Cronbach’s alpha) versus bias-adjusted ca-pacity measures (Cowan’s K) did not affect the reliability es-timates. Within-session reliability increased slightly over time(Fig. 5). Cronbach’s alpha values were positively correlatedwith session number (1–31), r = .82, p < .001, 95% CI [.66,.91], as were the split-half correlation values, r = .67, p < .001,95% CI [.42, .83].
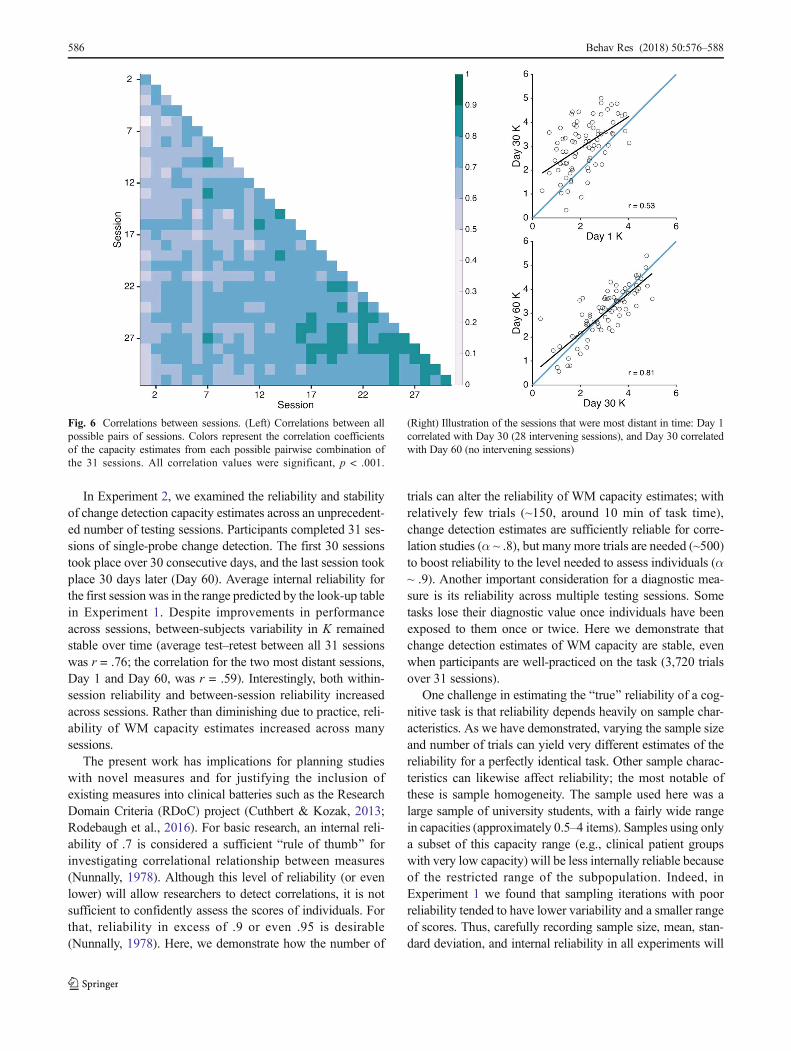
Between-session stability We first assessed stability overtime by computing correlation coefficients for all pairwisecombinations of sessions (465 total combinations). Missingsessions were excluded from the correlations, meaning thatsome pairwise correlations included 78 participants insteadof 79 (see Table 2). All sessions correlated with each other,mean r = .71 (SD = .06, min. = .48, max. = .86, all p values <.001). A heat map of all pairwise correlations is shown inFig. 6. Note that the most temporally distant sessions stillcorrelated with each other. The correlation between Day 1and Day 30 (28 intervening sessions) was r = .53, p < .001,95% CI [.35, .67]; the correlation between Day 30 and Day 60(no intervening sessions) was r = .81, p < .001, 95% CI [.72,.88]; the correlation between Day 1 and Day 60 was r = .59, p< .001, 95% CI [.42, .71]. Finally, we observed that between-session stability increased over time, likely due to increasedinternal reliability across sessions. To compute change inreliability over time, we calculated the correlation coeffi-cient for temporally adjacent sessions (e.g., the correlationsof Session 1 and Session 2, of Session 2 and Session 3,etc.). The average adjacent-session correlation was r = .76(SD = .05, min. = .64, max. = .86), and the strength ofadjacent-session correlations was positively correlated withsession number, r = .68, p < .001, indicating an increasein stability over time.
Differences by testing locationWe tested for systematic dif-ferences in performance, reliability, and stability for sessionscompleted at home versus in the lab. In total, 41 of the partic-ipants completed all of their sessions in their own home(Bhome group^), 27 participants completed all of their
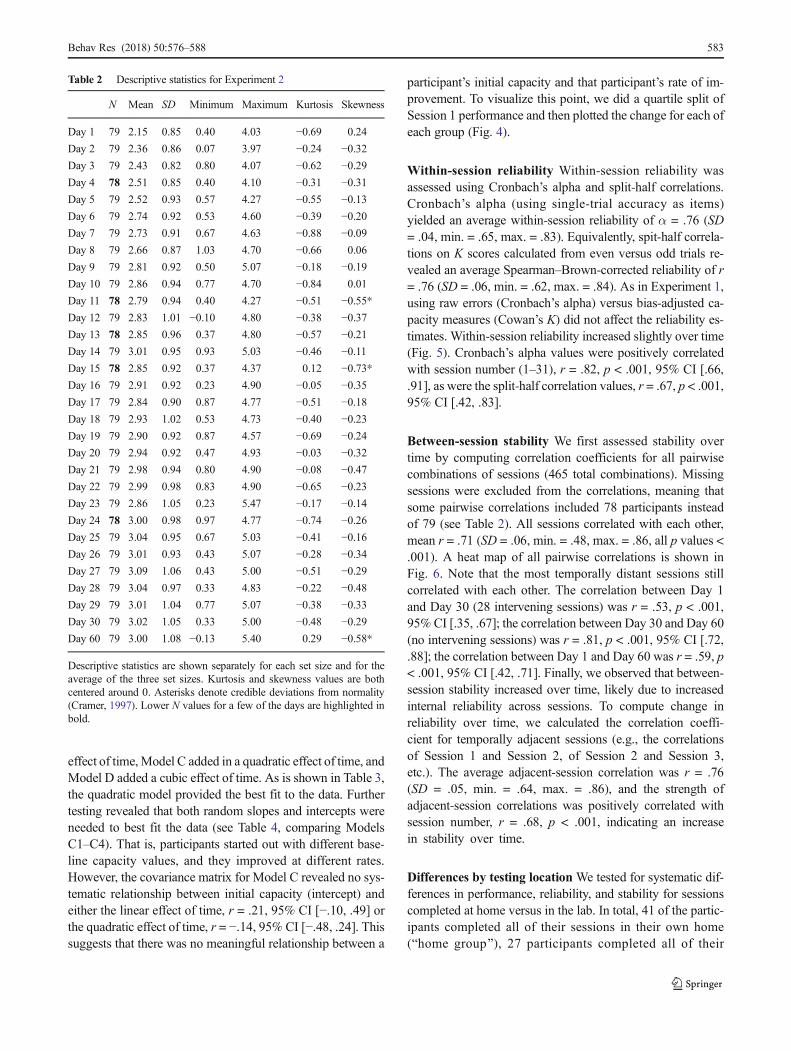
Table 2 Descriptive statistics for Experiment 2
N Mean SD Minimum Maximum Kurtosis Skewness
Day 1 79 2.15 0.85 0.40 4.03 −0.69 0.24
Day 2 79 2.36 0.86 0.07 3.97 −0.24 −0.32Day 3 79 2.43 0.82 0.80 4.07 −0.62 −0.29Day 4 78 2.51 0.85 0.40 4.10 −0.31 −0.31Day 5 79 2.52 0.93 0.57 4.27 −0.55 −0.13Day 6 79 2.74 0.92 0.53 4.60 −0.39 −0.20Day 7 79 2.73 0.91 0.67 4.63 −0.88 −0.09Day 8 79 2.66 0.87 1.03 4.70 −0.66 0.06
Day 9 79 2.81 0.92 0.50 5.07 −0.18 −0.19Day 10 79 2.86 0.94 0.77 4.70 −0.84 0.01
Day 11 78 2.79 0.94 0.40 4.27 −0.51 −0.55*Day 12 79 2.83 1.01 −0.10 4.80 −0.38 −0.37Day 13 78 2.85 0.96 0.37 4.80 −0.57 −0.21Day 14 79 3.01 0.95 0.93 5.03 −0.46 −0.11Day 15 78 2.85 0.92 0.37 4.37 0.12 −0.73*Day 16 79 2.91 0.92 0.23 4.90 −0.05 −0.35Day 17 79 2.84 0.90 0.87 4.77 −0.51 −0.18Day 18 79 2.93 1.02 0.53 4.73 −0.40 −0.23Day 19 79 2.90 0.92 0.87 4.57 −0.69 −0.24Day 20 79 2.94 0.92 0.47 4.93 −0.03 −0.32Day 21 79 2.98 0.94 0.80 4.90 −0.08 −0.47Day 22 79 2.99 0.98 0.83 4.90 −0.65 −0.23Day 23 79 2.86 1.05 0.23 5.47 −0.17 −0.14Day 24 78 3.00 0.98 0.97 4.77 −0.74 −0.26Day 25 79 3.04 0.95 0.67 5.03 −0.41 −0.16Day 26 79 3.01 0.93 0.43 5.07 −0.28 −0.34Day 27 79 3.09 1.06 0.43 5.00 −0.51 −0.29Day 28 79 3.04 0.97 0.33 4.83 −0.22 −0.48Day 29 79 3.01 1.04 0.77 5.07 −0.38 −0.33Day 30 79 3.02 1.05 0.33 5.00 −0.48 −0.29Day 60 79 3.00 1.08 −0.13 5.40 0.29 −0.58*
Descriptive statistics are shown separately for each set size and for theaverage of the three set sizes. Kurtosis and skewness values are bothcentered around 0. Asterisks denote credible deviations from normality(Cramer, 1997). Lower N values for a few of the days are highlighted inbold.
Behav Res (2018) 50:576–588 583
sessions in the lab (Blab group^), and 11 participants complet-ed some sessions at home and some in the lab (Bmixedgroup^).
Across all 31 sessions, the participants in the home group hadan average capacity of 2.67 (SD = 1.01); those in the lab grouphad an average capacity of 3.01 (SD = 0.83); and those in themixed group had an average capacity of 2.98 (SD = 1.04). Onaverage, scores for sessions in the home group were slightlylower than scores for sessions in the lab group, t(2101) = −7.98,p < .001, 95% CI [−.42, −.25]. Scores for sessions in the mixedgroup were higher than those for sessions in the home group,t(1606) = 5.0, p < .001, 95%CI [.19, .43] but were not differentfrom scores in the lab group, t(1175) = 0.44, p = .67, 95% CI[−.09, .14]. Interestingly, however, a paired t test for the mixedgroup (n = 11) revealed that the same participants performedslightly better in the lab (M = 3.08) and slightly worse at home,M = 2.85, t(10) = 3.15, p = .01, 95% CI [.07, .39].
Cronbach’s alpha estimates of within-session reliabilitywere slightly higher for sessions completed at home (meanα = .76, SD = .05) than for sessions completed in the lab(mean α = .69, SD = .08), t(60) = 3.75, p < .001, 95% CI[.03, .10]. Likewise, Spearman–Brown-corrected correlationcoefficients were higher for sessions completed at home(mean r = .79, SD = .07) than for those in the lab (mean r =
.67, SD = .14), t(60) = 4.42, p < .001, 95% CI [.07, .18].However, these differences in reliability may have resultedfrom (1) unequal sample sizes between lab and home, (2)unequal average capacities between groups, or (3) unequalvariabilities between groups. Once we equated sample sizesbetween groups and matched samples for average capacity,the differences in reliability were no longer stable: Acrossiterations of the matched samples, differences in Cronbach’salpha ranged from p < .01 to p > .5, and differences in split-half correlation significance ranged from p < .01 to p > .25.
Next, we examined differences in stability for sessionscompleted at home rather than in the lab. On average, test–retest correlations were higher for home sessions (mean r =.72, SD = .08) than for lab sessions (mean r = .67, SD = .10),t(928) = 8.01, p < .001, 95% CI [.04, .06]. Again, however,differences in the test–retest correlations were not reliable aftermatching sample size and average capacity; differences incorrelation significance ranged from p = .01 to .98.
Discussion
With extensive practice over multiple sessions, we observedimprovement in overall change detection performance. Thisimprovement was most pronounced over early sessions, afterwhich mean performance stabilized for the remaining
Fig. 4 Average capacity (K) across testing sessions. Shaded areasrepresent standard error of the mean. Note that the axis is splicedbetween Days 30 and 60, because no intervening data points were
collected during this time. (Left) Average changes in performance overtime. (Right) Average changes in performance over time for each quartileof participants (quartile splits were performed on data from Session 1)
Table 3 Comparison of linear, quadratic, and cubic growth models, all with random intercepts and slopes where applicable
Model A: Intercept Only Model B: Linear Model C: Quadratic Model D: Cubic
Intercept 2.83*** 2.60*** 2.42*** 2.29***
Linear slope 0.014*** .037*** .07**
Quadratic slope –.0005*** –.002*
Cubic slope 2 × 10⁻⁵ n.s.
−2LL 4,366.2 4,084.8 3,914.7 4,231.6
BIC 4,389.6 4,131.6 3,992.7 4,348.6
* p < .05, ** p < .01, *** p < .001
584 Behav Res (2018) 50:576–588

sessions. The internal reliability of the first session (Spearman–Brown-corrected r = .71, Cronbach’s α = .67) was within therange predicted by the look-up table created in Experiment 1 for80 participants and 120 trials (predicted range: r = .61 to .87 andα = .58 to .80, respectively). Both reliability and stabilityremained high over the span of 60 days. In fact, reliabilityand stability increased slightly across sessions. An importantconsideration for any cognitive measure is whether or not re-peated exposure to the task will harm the reliability of the mea-sure. For example, re-exposure to the same logic puzzles willdrastically reduce the amount of time needed to solve the puz-zles and inflate accuracy. Thus, for such tasks great caremust betaken to generate novel test versions to be administered at dif-ferent dates. Similarly, over-practice effects could lead to asharp decrease in variability of performance (e.g., ceiling ef-fects, floor effects), which would by definition lead to a de-crease in reliability. Here, we demonstrated that although ca-pacity estimates increase when participants are frequently ex-posed to a change detection task, the reliability of themeasure isnot compromised by either practice effects or ceiling effects.
We also examined whether reliability was harmed for par-ticipants who completed the change detection sessions in theirown homes as compared to those in the lab. Although remotedata collection sacrifices some degree of experimental control,the use of at-home tests is becoming more common with theease of remote data collection through resources like
Amazon’s Mechanical Turk (Mason & Suri, 2012).Reliability was not noticeably disrupted by noise arising fromsmall differences in stimulus size between different testingenvironments. After controlling for number of participantsand capacity, there was no longer a consistent difference inreliability or stability for sessions completed at home as com-pared to in the lab. However, the capacity estimates obtainedin participants’ homes were significantly lower than thoseobtained in the lab. Larger sample sizes will be needed tomorefully investigate systematic differences in capacity and reli-ability between testing environments.
General discussion
In Experiment 1, we developed a novel approach for estimatingexpected reliability in future experiments. We collected changedetection data from a large number of participants and trials,and then we used an iterative down-sampling procedure to in-vestigate the effect of sample size and trial number on reliabil-ity. Average reliability across iterations was fairly impervious tothe number of participants. Instead, average reliability estimatesacross iterations relied more heavily on the number of trials perparticipant. On the other hand, the variability of reliability esti-mates across iterations was highly sensitive to the number ofparticipants. For example, with only ten participants, the aver-age reliability estimate for an experiment with 150 trials washigh (α = .75) but the worst iteration (akin to the worst expectedexperiment out of 100) gave a poor reliability estimate (α =.42). On the other hand, the range between the best and worstreliability estimates decreased dramatically as the number ofparticipants increased. With 40 participants, the minimum ob-served reliability for 150 trials was α = .65.
Fig. 5 Change in within-session reliabilities across sessions in Experiment 2. There was a significant positive relationship between session number(1:31) and internal reliability
Table 4 Comparison of fixed versus random slopes and intercept
Model C1:Fixed Int.Fixed Slope
Model C2:Fixed Int.Random Slope
Model C3:Random Int.Fixed Slope
Model C4:Random Int.Random Slope
−2LL 6,672.3 4,627.7 4,009.1 3,914.7
BIC 6,703.5 4,682.3 4,048.1 3,992.7
Behav Res (2018) 50:576–588 585
In Experiment 2, we examined the reliability and stabilityof change detection capacity estimates across an unprecedent-ed number of testing sessions. Participants completed 31 ses-sions of single-probe change detection. The first 30 sessionstook place over 30 consecutive days, and the last session tookplace 30 days later (Day 60). Average internal reliability forthe first session was in the range predicted by the look-up tablein Experiment 1. Despite improvements in performanceacross sessions, between-subjects variability in K remainedstable over time (average test–retest between all 31 sessionswas r = .76; the correlation for the two most distant sessions,Day 1 and Day 60, was r = .59). Interestingly, both within-session reliability and between-session reliability increasedacross sessions. Rather than diminishing due to practice, reli-ability of WM capacity estimates increased across manysessions.
The present work has implications for planning studieswith novel measures and for justifying the inclusion ofexisting measures into clinical batteries such as the ResearchDomain Criteria (RDoC) project (Cuthbert & Kozak, 2013;Rodebaugh et al., 2016). For basic research, an internal reli-ability of .7 is considered a sufficient Brule of thumb^ forinvestigating correlational relationship between measures(Nunnally, 1978). Although this level of reliability (or evenlower) will allow researchers to detect correlations, it is notsufficient to confidently assess the scores of individuals. Forthat, reliability in excess of .9 or even .95 is desirable(Nunnally, 1978). Here, we demonstrate how the number of
trials can alter the reliability of WM capacity estimates; withrelatively few trials (~150, around 10 min of task time),change detection estimates are sufficiently reliable for corre-lation studies (α ~ .8), but many more trials are needed (~500)to boost reliability to the level needed to assess individuals (α~ .9). Another important consideration for a diagnostic mea-sure is its reliability across multiple testing sessions. Sometasks lose their diagnostic value once individuals have beenexposed to them once or twice. Here we demonstrate thatchange detection estimates of WM capacity are stable, evenwhen participants are well-practiced on the task (3,720 trialsover 31 sessions).
One challenge in estimating the Btrue^ reliability of a cog-nitive task is that reliability depends heavily on sample char-acteristics. As we have demonstrated, varying the sample sizeand number of trials can yield very different estimates of thereliability for a perfectly identical task. Other sample charac-teristics can likewise affect reliability; the most notable ofthese is sample homogeneity. The sample used here was alarge sample of university students, with a fairly wide rangein capacities (approximately 0.5–4 items). Samples using onlya subset of this capacity range (e.g., clinical patient groupswith very low capacity) will be less internally reliable becauseof the restricted range of the subpopulation. Indeed, inExperiment 1 we found that sampling iterations with poorreliability tended to have lower variability and a smaller rangeof scores. Thus, carefully recording sample size, mean, stan-dard deviation, and internal reliability in all experiments will
Fig. 6 Correlations between sessions. (Left) Correlations between allpossible pairs of sessions. Colors represent the correlation coefficientsof the capacity estimates from each possible pairwise combination ofthe 31 sessions. All correlation values were significant, p < .001.
(Right) Illustration of the sessions that were most distant in time: Day 1correlated with Day 30 (28 intervening sessions), and Day 30 correlatedwith Day 60 (no intervening sessions)
586 Behav Res (2018) 50:576–588
be critical for assessing and improving the reliability of stan-dardized tasks used for cognitive research. In the interest ofreplicability, open source code repositories (e.g., theExperiment Factory) have sought to make standardized ver-sions of common cognitive tasks better-categorized, open, andeasily available (Sochat et al., 2016). However, one potentialweakness for task repositories is a lack of documentationabout expected internal reliability. Standardization of taskscan be very useful, but it should not be over-applied. In par-ticular, experiments with different goals should use differenttest lengths that best suit the goals of the experimental ques-tion. We feel that projects such as the Experiment Factory willcertainly lead to more replicable science, and including esti-mates of reliability with task code could help to further thisgoal.
Finally, the results presented here have implications forresearchers who are interested in differences between experi-mental conditions and not individual differences per se. Trialnumber and sample size will affect the degree of measurementerror for each condition used within change detection experi-ments (e.g., set sizes, distractor presence, etc.). To detect sig-nificant differences between conditions and avoid false posi-tives, it would be desirable to estimate the number of trialsneeded to ensure adequate internal reliability for each condi-tion of interest within the experiment. Insufficient trial num-bers or sample sizes can lead to intolerably low internal reli-ability, and could spoil an otherwise well-planned experiment.
The results of Experiments 1 and 2 revealed that changedetection capacity estimates of visual WM capacity are bothinternally reliable and stable across many testing sessions.This finding is consistent with previous studies showing thatother measures ofWMcapacity are reliable and stable, includ-ing complex span measures (Beckmann, Holling, & Kuhn,2007; Foster et al., 2015; Klein & Fiss, 1999; Waters &Caplan, 1996) and the visuospatial n-back (Hockey &Geffen, 2004). The main analyses from Experiment 1 suggestconcrete guidelines for designing studies that require reliableestimates of change detection capacity. When both samplesize and trial numbers were high, the reliability of changedetection was quite high (α > .9). However, studies with in-sufficient sample sizes or number of trials frequently had lowinternal reliability. Consistent with the notion that WM capac-ity is a stable trait of the individual, individual differences incapacity remained stable over many sessions in Experiment 2despite practice-related performance increases.
Both the effects of trial number and sample size are impor-tant to consider, and researchers should be cautious aboutgeneralizing expected reliability across vastly different samplesizes. For example, in a recent article by Foster and colleagues(2015), the authors found that cutting the number of complexspan trials by two-thirds had only a modest effect on thestrength of the correlation between WM capacity and fluidintelligence. Critically, however, the authors used around
500 participants, and such a large sample size will act as abuffer against increases in measurement error (i.e., fewer trialsper participant). Readers wishing to conduct a new study witha smaller sample size (e.g., 50 participants) would be ill-advised to dramatically cut trial numbers on the basis of thisfinding alone; as we demonstrated in Experiment 1, cuttingtrial numbers leads to greater volatility of reliability values forsmall sample sizes relative to large ones. Given the currentconcerns about power and replicability in psychological re-search (Open Science Collaboration, 2015), we suggest thatrigorous estimations of task reliability, considering both par-ticipant and trial numbers, will be useful for planning bothnew studies and replication efforts.
Acknowledgements
Contributions Z.X. and E.V. designed the experiments; Z.X. and X.F.collected data. K.A. performed the analyses and drafted the manuscript,and K.A., Z.X., and E.V. revised the manuscript.
Author note Research was supported by the Project of Humanities andSocial Sciences, Ministry of Education, China (15YJA190008), theFundamental Research Funds for the Central Universities(SWU1309117), NIH Grant 2R01 MH087214-06A1, and Office ofNaval Research Grant N00014-12-1-0972. Datasets for all experimentsare available online on Open Science Framework at https://osf.io/g7txf/.
Compliance with ethical standards
Conflicts of interest None.
References
Beckmann, B., Holling, H., & Kuhn, J.-T. (2007). Reliability of verbal–numerical working memory tasks. Personality and IndividualDifferences, 43, 703–714. doi:10.1016/j.paid.2007.01.011
Brainard, D. H. (1997). The psychophysics toolbox. Spatial Vision, 10,433–436. doi:10.1163/156856897X00357
Brown,W. (1910). Some experimental results in the correlation of mentalabilities. British Journal of Psychology, 1904–1920(3), 296–322.doi:10.1111/j.2044-8295.1910.tb00207.x
Buschman, T. J., Siegel, M., Roy, J. E., & Miller, E. K. (2011). Neuralsubstrates of cognitive capacity limitations. Proceedings of theNational Academy of Sciences, 108, 11252–11255. doi:10.1073/pnas.1104666108
Cowan, N. (2001). The magical number 4 in short-term memory: Areconsideration of mental storage capacity. Behavioral and BrainSciences 24, 87–114–185. doi:10.1017/S0140525X01003922
Cowan, N., Fristoe, N. M., Elliott, E. M., Brunner, R. P., & Saults, J. S.(2006). Scope of attention, control of attention, and intelligence inchildren and adults. Memory & Cognition, 34, 1754–1768. doi:10.3758/BF03195936
Cramer, D. (1997). Basic statistics for social research: Step-by-step cal-culations and computer techniques using Minitab. London:Routledge.
Cronbach, L. J. (1951). Coefficient alpha and the internal structure oftests. Psychometrika, 16, 297–334. doi:10.1007/BF02310555
Behav Res (2018) 50:576–588 587
Cuthbert, B. N., & Kozak, M. J. (2013). Constructing constructs forpsychopathology: The NIMH research domain criteria. Journal ofAbnormal Psychology, 122, 928–937. doi:10.1037/a0034028
Elmore, L. C.,Magnotti, J. F., Katz, J. S., &Wright, A. A. (2012). Changedetection by rhesus monkeys (Macaca mulatta) and pigeons(Columba livia). Journal of Comparative Psychology, 126, 203–212. doi:10.1037/a0026356
Engle, R. W., Tuholski, S. W., Laughlin, J. E., & Conway, A. R. A.(1999). Working memory, short-term memory, and general fluidintelligence: A latent-variable approach. Journal of ExperimentalPsychology: General, 128, 309–331. doi: 10.1037/0096-3445.128.3.309
Foster, J. L., Shipstead, Z., Harrison, T. L., Hicks, K. L., Redick, T. S., &Engle, R. W. (2015). Shortened complex span tasks can reliablymeasure working memory capacity. Memory & Cognition, 43,226–236. doi:10.3758/s13421-014-0461-7
Fukuda, K., Vogel, E., Mayr, U., & Awh, E. (2010). Quantity, not quality:The relationship between fluid intelligence and working memorycapacity. Psychonomic Bulletin & Review, 17, 673–679. doi:10.3758/17.5.673
Fukuda, K., Woodman, G. F., & Vogel, E. K. (2015). Individual differ-ences in visual working memory capacity: Contributions of atten-tional control to storage. In P. Jolicœur, C. Lefebvre, & J. Martinez-Trujillo (Eds.), Mechanisms of sensory working memory: Attentionand performance XXV (pp. 105–119). San Diego: Academic PressElsevier.
Gibson, B., Wasserman, E., & Luck, S. J. (2011). Qualitative similaritiesin the visual short-term memory of pigeons and people.Psychonomic Bulletin & Review, 18, 979–984. doi:10.3758/s13423-011-0132-7
Gold, J. M., Wilk, C. M., McMahon, R. P., Buchanan, R. W., & Luck, S.J. (2003). Working memory for visual features and conjunctions inschizophrenia. Journal of Abnormal Psychology, 112, 61–71. doi:10.1037/0021-843X.112.1.61
Hockey, A., & Geffen, G. (2004). The concurrent validity and test-retestreliability of a visuospatial working memory task. Intelligence, 32,591–605. doi: 10.1016/j.intell.2004.07.009
Johnson, M. K., McMahon, R. P., Robinson, B. M., Harvey, A. N., Hahn,B., Leonard, C. J., & Gold, J. M. (2013). The relationship betweenworking memory capacity and broad measures of cognitive abilityin healthy adults and people with schizophrenia. Neuropsychology,27, 220–229. doi:10.1037/a0032060
Klein, K., & Fiss, W. H. (1999). The reliability and stability of the Turnerand Engle working memory task. Behavior Research Methods,Instruments, & Computers, 31, 429–432. doi:10.3758/BF03200722
Lee, E.-Y., Cowan, N., Vogel, E. K., Rolan, T., Valle-Inclan, F., &Hackley, S. A. (2010). Visual working memory deficits in patientswith Parkinson’s disease are due to both reduced storage capacityand impaired ability to filter out irrelevant information. Brain, 133,2677–2689. doi:10.1093/brain/awq197
Luria, R., Balaban, H., Awh, E., & Vogel, E. K. (2016). The contralateraldelay activity as a neural measure of visual working memory.Neuroscience & Biobehavioral Reviews, 62, 100–108. doi:10.1016/j.neubiorev.2016.01.003
Mason, W., & Suri, S. (2012). Conducting behavioral research onAmazon’s Mechanical Turk. Behavior Research Methods, 44, 1–23. doi:10.3758/s13428-011-0124-6
Melby-Lervåg, M., & Hulme, C. (2013). Is working memory trainingeffective? A meta-analytic review. Developmental Psychology, 49,270–291. doi:10.1037/a0028228
Nunnally, J. C. (1978). Psychometric theory (2nd ed.). New York:McGraw-Hill.
Open Science Collaboration. (2015). Estimating the reproducibility ofpsychological science. Science, 349, aac4716. doi:10.1126/science.aac4716
Pailian, H., & Halberda, J. (2015). The reliability and internal consistencyof one-shot and flicker change detection for measuring individualdifferences in visual working memory capacity. Memory &Cognition, 43, 397–420. doi:10.3758/s13421-014-0492-0
Pashler, H. (1988). Familiarity and visual change detection. Perception &Psychophysics, 44, 369–378. doi:10.3758/BF03210419
Reinhart, R. M. G., Heitz, R. P., Purcell, B. A., Weigand, P. K., Schall, J.D., & Woodman, G. F. (2012). Homologous mechanisms of visuo-spatial working memory maintenance in macaque and human: prop-erties and sources. Journal of Neuroscience, 32, 7711–7722. doi:10.1523/JNEUROSCI.0215-12.2012
Rodebaugh, T. L., Scullin, R. B., Langer, J. K., Dixon, D. J., Huppert, J.D., Bernstein, A., & Lenze, E. J. (2016). Unreliability as a threat tounderstanding psychopathology: The cautionary tale of attentionalbias. Journal of Abnormal Psychology, 125, 840–851. doi:10.1037/abn0000184
Rouder, J. N. (n.d.). Applications and source code. Retrieved June 22,2016, from http://pcl.missouri.edu/apps
Rouder, J. N., Morey, R. D., Cowan, N., Zwilling, C. E., Morey, C. C., &Pratte, M. S. (2008). An assessment of fixed-capacity models ofvisual working memory. Proceedings of the National Academy ofSciences, 105, 5975–5979. doi:10.1073/pnas.0711295105
Rouder, J. N., Morey, R. D., Morey, C. C., & Cowan, N. (2011). How tomeasure working memory capacity in the change detection para-digm. Psychonomic Bulletin & Review, 18, 324–330. doi:10.3758/s13423-011-0055-3
Shipstead, Z., Redick, T. S., & Engle, R. W. (2012). Is working memorytraining effective? Psychological Bulletin, 138, 628–654. doi:10.1037/a0027473
Sochat, V. V., Eisenberg, I. W., Enkavi, A. Z., Li, J., Bissett, P. G., &Poldrack, R. A. (2016). The experiment factory: Standardizing be-havioral experiments. Frontiers in Psychology, 7, 610. doi:10.3389/fpsyg.2016.00610
Spearman, C. (1910). Correlation calculated from faulty data. BritishJournal of Psychology, 1904–1920(3), 271–295. doi:10.1111/j.2044-8295.1910.tb00206.x
Todd, J. J., & Marois, R. (2004). Capacity limit of visual short-termmemory in human posterior parietal cortex. Nature, 428, 751–754.doi:10.1038/nature02466
Unsworth, N., Fukuda, K., Awh, E., & Vogel, E. K. (2014). Workingmemory and fluid intelligence: Capacity, attention control, and sec-ondary memory retrieval. Cognitive Psychology, 71, 1–26. doi:10.1016/j.cogpsych.2014.01.003
Van Snellenberg, J. X., Conway, A. R. A., Spicer, J., Read, C., & Smith,E. E. (2014). Capacity estimates inworkingmemory: Reliability andinterrelationships among tasks. Cognitive, Affective, & BehavioralNeuroscience, 14, 106–116. doi:10.3758/s13415-013-0235-x
Vogel, E. K., & Machizawa, M. G. (2004). Neural activity predicts indi-vidual differences in visual working memory capacity. Nature, 428,748–751. doi:10.1038/nature02447
Waters, G. S., & Caplan, D. (1996). The measurement of verbal workingmemory capacity and its relation to reading comprehension.Quarterly Journal of Experimental Psychology, 49A, 51–75. doi:10.1080/713755607
Wood, G., Hartley, G., Furley, P. A., & Wilson, M. R. (2016). Workingmemory capacity, visual attention and hazard perception in driving.Journal of Applied Research inMemory and Cognition, 5, 454–462.doi:10.1016/j.jarmac.2016.04.009
588 Behav Res (2018) 50:576–588


![Ch 5: Measurement Concepts. Reliability Reliability refers to the consistency or stability of a measure of behavior [p92] If you weighed yourself](https://img.pdfslide.us/doc/110x75/551bd5c6550346af588b57e6/ch-5-measurement-concepts-reliability-reliability-refers-to-the-consistency-or-stability-of-a-measure-of-behavior-p92-if-you-weighed-yourself.jpg)