Embed Size (px)
Citation preview

THE RELATIVE STABILITY OF STORED EXTRACT WITH AND WITHOUT INOCULATION WITH HIGH LEVELS
OF DIFFERENT MICROBIAL TYPES
Indrani S Samaraweera Diane L Rheault Lynn Buschette Terry McGillivray and David Groom
American Crystal Sugar Company Technical Services Center PO Box 1227 Moorhead MN 56561-1227
INTRODUCTION At the 2003 ASSBT Meeting I presented a paper on Microbes and Extract Storage and referred to microbial issues we bad in one of the American Crystal Sugar molasses desugarization (MDS) facilities at Hillsboro Also the remedial measures we had taken to circumvent these problems (1 and 3)
About the same time Willems et al (5) had been working on microbial issues and spoilage in thick juice in Belgium In their studies they had found two microbial types namely mesophilic anaerobes and fastidious microbes to be the causative agents of thick juice spoilage American Crystal Sugar Company at the time did not monitor for these two particular microbial types on a routine basis in stored extract from our MDS plants Therefore we wanted to find out what level of fastidious and mesophilic anaerobic microbial loading was in extract from our MDS facilities and what effect they had on long-term storage This resulted in routine monitoring for these two microbial types for a period of 13-14 months in extract from both of our MDS facilities at Hillsboro (1-ll-B) and East Grand Forks (EGF) In addition we carried out challenge studies with inoculation of extract with high loading ofdifferent microbial types and observed the stability of this extract during long-tenn storage These studies involved the preparation of large amounts of inoculum for initial challenge of extract This in itself was a challenge and resulted in some interesting findings which will be discussed
MATERIALS AND METHODS A) Microbiology
1) Sample collection Samples of material were obtained aseptically in sterile screw cap containers from each location (extract to storage or different points on extract tanks) at HiUsboro (HLB) and East Grand Forks (EGF) molasses desugarization (MDS) facilities The samples were boxed and sent to the ACS Technical Services Center Microbiology Lab via UPS next day service Microbiological analyses were carried out the same day or on the following day the samples were received For storage trials extract was obtained aseptically in clean 5 gal pails from the respective MDS facilities
2) Mesophilic and thennophilic counts Appropriate serial dilutions were made and decimal dilutions of samples were pipetted into labeled sterile Petri plates A pour plate technique with tempered plate count agar
88
-- -------------~
(PCA) was used The plates were incubated at 35degC for Mesophiles and 55degC for thermophiles per 48 hrs
3) Lactic acid bacteria Appropriate serial dilutions were made and decimal dilutions of samples were pipetted into labeled sterile Petri plates A pour plate technique with tempered MRS Agar (DeMan Rogosa Sharpe) was used The plates were incubated at 30degC for 72 hrs in a 5 C02 incubator and observed for growth and counts made
4) Mesophilic anaerobes Appropriate serial dilutions were made and decimal dilutions of sample were pipetted into labeled sterile Petri plates A pour plate technique with tempered Reinforced Clostridial Agar (RCA) was used The inverted plates were placed in an anaerobic jar with an anaerobic gas generator sachet and anaerobic indicator pill The closed jars with plates were incubated at 30degC for 48-72 hrs and counts made
5) Regular and osmophilic yeast and mold counts Appropriate serial dilutions were made using Butterfields phosphate buffer for regular yeasts and mold and the same buffer with 40 sucrose for osmophilic yeast and mold The microbial counts were obtained using the Hydrophobic Grid Membrane Filter (HGMF) method or Iso-Grid Method with use of 045 lm membrane filters and YM-ll agar with chlortetracycline-HCI supplement for regular yeast and mold The medium used for Osmophilic yeast and mold had 40 sucrose added to the YM-ll agar with chlortetracycline-HCl The YM-ll plates were incubated at 28degC for 48 hrs and the YM-ll sucrose plates at 30degC for 72 hrs and counts were made
6) Flat sours and total thermophilic spore counts The dilution used for mesophiles and regular yeast and mold analyses was boiled for 5 minutes and cooled Decimal dilutions were then plated with Brom dextrose tryptone agar using a pour plate technique Plates were incubated at 55degC for 48 hrs and counts were made
7) Thermophilic anaerobes producing HzS The remaining content of heated storage juice solution from test 6) above was used in thermophilic anaerobic analyses A 20 mI portion of the boiled solution was divided equally among 6 tubes of sulfite agar and the tubes were cooled rapidly The 6 tubes per sample were then incubated at 55degC for 24 and 48 hrs and counts were made
8) Thermophilic anaerobes not producing HzS The remaining content of heated storage juice solution from test 6) above was used in this test Another 20 mI portion of the boiled solution was divided equaIly among 6 tubes of Brom PE-2 medium (pea tube test) Each tube was then stratified on the surface with 2 agar and cooled rapidly The 6 tubes per sample were incubated at 55degC per 72 hrs and counts made
89
9) Fastidious bacteria Pre-poured plates of Columbia Agar with 5 sheep blood (Hardy Diagnostics A 1 b) level and not dehydrated were warmed to room temperature Appropriate serial dilutions were made and decimal dilutions of sample were plated in a spiral pattern using an Autoplate 4000 Spiral Plater Inverted plates were incubated at 35C C for 72 hrs or longer if required The colonies were counted manually over the entire plate and the calculation in the Autoplate User Guide was used to determine cfulg
10) Inoculum preparation for microbial challenge of EGF-MDS extract in the Challenge Study I begun in September 2005 The EGF 3middot4 extract was used for inoculum preparation for the microbial challenge and storage study of extract This EGF extract was used to prepare four different cultures by adding 1 ml of extract to approximately 100 ml of each type of broth
i) Thermophilic culture in plate count (PC) broth and incubated at 55degC ii) Mesophilic culture in plate count (PC) broth and incubated at 35degC iii) Mesophilic anaerobic culture in Reinforced Clostridial (RC) medium and incubated at
30degC iv) Fastidious microorganism culture in Columbia broth (CB) and incubated at 35degC
The above cultures were grown for - 48 hrs and 1 ml of each of these cultures was transferred to 30 ml of the appropriate broth in seven centrifuge tubes for each culture These centrifuge tubes (7 per each microbial type) were incubated at the appropriate temperatures given above overnight (-18 hrs) Six of the culture tubes for each microbial type were centrifuged at 19000 rpm (SS-34 rotor) in a Sorvall RC-5B refrigerated super speed centrifuge from DuPont instrwnents for 20 minutes The 7th tube of each of the culture types was plated to obtain a viable cell count The supernatant from each tube was discarded and the six pellets of each microbial type were consolidated into one tube using as little 40 sucrose as needed Each of the combined pellet tubes were then centrifuged again as before to obtain one large pellet of cells for each microbial type Each large pellet (thermophiles mesophiles mesophilic anaerobes fastidious microbes) was then added to separate screw cap plastic containers containing one liter ofEGF extract (3-4) See Fig 3 for detail The inoculated extract samples and controls were then swirled fairly vigorously for even distribution of the inoculum and then incubated at 30degC for a period of nine months (91305 to 62606) Sample aliquots were obtained from each container and microbial counts pH and brix measurements were made throughout the storage period
11) Inoculum preparation for microbial challenge of MDS extract in Challenge Study II begun in NovemberlDecember 2006 In this study
i) for initial preparation of inoculum Hillsboro (HLB) extract from Tank C (mixture of St 7 sample from 52205 and St 6 sample from 52905) were used East Grand Forks (EGF) extract from Tank 3 (53106) and a 11 mix of the above HLB and EGF extract was made up and used These three extract samples (EGF HLB and EGFIHLB mix) were diluted to 20 RDS with sterile water and incubated at 35degC for
90
--- - --- -------- shy
72 hrs Sample a1iquots were obtained at periodic intervals (16~ hr 24 hr 42 hr 44 hr 46 hr 48 hr 72 hr) for mesophilic microbial assessment See Fig 6 for detail
ii) The second set of inoculum for this trial was prepared using only EGF Tank 3 extract from 53106 (RDS ~7082) and only the mesophilic microbial population was cultured The extract was made to 20 brix with sterile water After 48 hr growth at 30degC 10 ml of inoculum was transferred to a new 20 RDS bottle and incubated for 24 hrs Two more similar transfers were made every 24 hrs to new 20 RDS bottles to increase microbial population The 4th transfer was made into two 20 RDS bottles and incubated for 24 hrs The inoculum from the two bottles were mixed together and used to inoculate the extract in the challenge study See Fig 8 for detail
iii) For the Challenge Study II EGF extract from the evaporators (RDS of6845) taken on 111206 was used For this study Set I ofthe EGF extract was concentrated to 7426 RDS and 45 g of the 20 RDS inoculum was added to it giving a final RDS of6893 Four bottles of the microbial challenged 6893 RDS extract were made up and duplicate bottles were incubated at 20degC and 30degC respectively To Set II of EGF extract at 6845 RDS 45 g ofthe 20 RDS inoculum was added giving a fmal RDS of 6445 RDS Four bottles of the microbial challenged 6445 RDS extract were made up and duplicate bottles were incubated at 20degC and 30degC One control of the starting extract (6845 RDS) was incubated at each temperature (20degC and 30degC)
B) Chemistry 1) Sample - on completion of collection of aseptic samples a small volume of sample was
poured off aseptically in the factory lab for pH brix and L-Iactic acid measurements
2) pH - measurements were made using pH meter (Orion Beckman or Accumet basic)
3) Brix - measurements were made using an Index GPR 10-23 or 1045 refractometer
4) L-Iactic acid - Measurements were made using a YSI Model 1500 or YSI model 2700 biochemistry analyzer from Yellow Springs Instrument Company
C) GRampR Studies for Repeatability and Reproducibility In Test 1 of the GRampR test two analysts (1 amp 2) tested the same EGF extract sample for aerobic thermophiles mesophiles mesophilic anaerobes and fastidious microorganisms 10 times over giving 20 readings for these microbes on the same sample
In Test 2 of the GRampR test each of the two analysts (1 amp 2) tested 10 different EGF extract samples for aerobic thermophiles mesophiles mesophilic anaerobes and fastidious microbes giving 20 readings (duplicate sample readings) for the 10 different samples
RESULTS AND DISCUSSION At American Crystal Sugar (ACS) Company we have been carrying out microbial testing of extract from both our molasses desugarization plants for a long time The number of tests we
91
carry out on each extract sample also has increased over the years As such in May and June of 2005 we began assessing mesophilic anaerobes and fastidious microbes in extract as well This was after Willems et al (5) published findings of degradation of thick juice by these two microbial types
The fastidious microbes are termed as such as they are more difficult to detect and require a more nutritive medium for growth Therefore a nutritively rich medium called Columbia agar with 5 sheep blood for growth and detection of these microbes same as in (5) was used The test results for these microbes obtained over a period of 13-14 months which is longer than one beet campaign for both East Grand Forks (EGF) and Hillsboro (HLB) facilities show that the fastidious microbial counts tend to be higher than the mesophilic counts (Fig 1 and Fig 2) in extract with pH of 98-102 and brix of 685-7113 range in these samples This would be expected as the Columbia agar with sheep blood is a more nutritive medium than the standard methods agar used for the cultivation of mesophiles
Willems et al in their paper state that the ratio of fastidious to mesophilic counts is an ideal ratio for monitoring degradation of thick juice According to them the fastidious bacteria coevolve with mesophilic microbes in non infected thick juice and the fastidious component shifts to dominance at the onset of a serious pH fall and increase of invert sugar This is contrary to our fmding in desugarized extract where the fastidious microbial population is higher than the mesophilic population throughout the campaign with no drop in pH In the Willems studies with thick juice they observed a peak for mesophi1ic and the fastidious group about 35 days after storage at log 4-log 6 cfulg Since we were looking at microbial counts as per 109 DSE this would be relative to a pH drop at log 6-10g 8 cfullO g DSE range After about 70 days ofstorage they observed a switch in populations with the mesophiles decreasing rapidly in numbers to log 1 cfulg while the fastidious counts increased rapidly further to log 5-10g 6 cfulg after 80 days of storage
Willems et at (5) also found that once mesophilic anaerobic populations reach peak microbial loading of log 7 cfulg (relative to ~Iog 9 cfuIO g DSE) it could cause spoilage in thick juice within 24 hrs Therefore in May of 2005 we began monitoring for mesophilic anaerobes in MDS extract from both EGF and HLB facilities Soon after we started this testing we observed counts of log 6 cful0 g DSE in one of our EGF tanks (Tank 3) in regions just below the surface See Table 1 for detail During 3 successive weeks of testing of this extract (517 514 and 521105) it seemed as though the mesophilic anaerobic infection was going deeper into the tank Therefore EGF started processing Tank 3 first (around 52405) However as soon as we began pulling extract out of this tank the mesophilic anaerobic counts decreased rapidly to zero Therefore we did not see the same decay observed by Willems and co-workers in desugarized extract and we were not able to give an explanation for the sudden change in counts to zero
Lactic acid bacteria were also monitored in extract on MRS agar plates incubated in 5 CO2
However as we obtained hardly any growth on plates we discontinued testing for this microbe
Some other workers who have reported on problems in thick juice storage were Sargent et al (4) They observed deterioration of thick juice in some storage tanks at British Sugar at fairly low
92
mesophilic counts (log 3 cfulOg range) and osmophilic yeast counts (log 2 cfullO g range) See Table 2 However our MDS extract tanks stored during the beet campaign 20052006 at both HLB and EGF and in previous campaigns (3) typically show higher microbial loading See Table 3
The main problem area during extract storage at ACS facilities has been the surface ofthe tank As shown in Table 4 when increase in microbial loading over consecutive weeks was observed we managed to quell the infections by applying 25 caustic solution on the surface of the tank (3)
In addition we have had no degradation ofMDS extract with a drop in pH for the past 4-5 years The following Table 5 gives the length of storage of extract in some HLB and EGF tanks from 2003 to 2006 This table shows we have stored extract from ~65 to 145 months in HLB and 8shy11 months at EGF from start of filling the tanks to end of processing Therefore the long length in storage time ofextract without degradation concerns is quite significant
Inoculum Preparation and Microbial Challenge Studies ofExtract Two microbial challenge studies were carried out with EGF extract The purpose of these studies was to see what type of microbial populations would have the greatest impact on degradation of extract when inoculated at high levels Two different approaches were used for the preparation of inoculum for the two challenge studies
Challenge Study I - This study was begun in September 2005 The EGF extract was used for inoculum preparation for the microbial challenge and storage study of extract Four different cultures (mesophiles thermophiles mesophilic anaerobes and fastidious microbes) were prepared using this EGF extract and appropriate broth and incubation temperatures required for growth of these microbes were used See Material and Methods Section A-1O and Fig 3 for details of inoculum preparation and extract microbial challenge The inoculated extract samples and controls were monitored over a period of nine months (Sept 13 2005 - June 6 2006) Fig 4 shows the level of microbes in extract throughout the storage period Fig 5 gives the microbial levels in the controls These graphs show that we did not increase the microbial levels very much more than was originally there in the extract except for the level of fastidious microbes However all these populations decreased to the log 3-4 cful0 g DSE range in 24 hrs and close to the original microbial levels in the extract After this the different microbial levels kept fairly steady for about 4 months and a further decrease in counts was observed closer to 8 months storage time similar to the control microbial loading See Table 6 In addition Table 7 gives the range of pH and brix values in separate challenged extract containers and controls throughout the storage period This shows if extract is stored at high pH (99-105) and Brix (686-708) it will remain stable even if inoculated with high levels of microbes
Challenge Study II - (NovlDec 2006) Here a different approach for inoculum preparation (by lowering brix of extract) was utilized Also in this study instead of using a large number of different microbial types we focused only on the mesophilic population In the initial inoculum preparation in this study (See Materials and Methods section A-l1a and Fig 6) we used Hillsboro (HLB) extract East Grand Forks (EGF) extract and a 11 mix of the above HLB and EGF extract These three extract samples (EGF HLB and EGFIHLB mix) were diluted to 20
93
- -
RDS with sterile water and incubated at 35degC for 72 hrs Sample aliquots were taken at periodic intervals over a 72 hr period for mesophilic microbial assessment This gave us some very interesting results
We expected both HLB and EGF extract at 20 RDS to give high growth but instead only the EGF 20 RDS extract gave a high mesophilic count (log 823 cfug) after 72 hrs of incubation The HLB 20 RDS extract remained at a low log 1 cfug range throughout the incubation period The EGFIHLB 11 (20 RDS) mix started off initially at a low count and then caught up to the EGF microbial loading (log 8 cfug) at ~8 hrs of incubation See Table 8 and Fig 7 for detail This showed us that the remedial measures taken at HLB during 20012002 were certainly producing a very stable extract which was almOst sterile and was difficult to deteriorate even if we intentionally wanted to This added further credence to Table 6 referred to earlier as to why we could store HLB extract in our tanks for 145 months without any problems
Since it was almost impossible to obtain a large amount of inoculum for challenge studies from HLB extract we had to use the EGF extract for inoculum preparation and microbial challenge of extract in Study II See Materials and Methods section A-II b and Fig 8 for inoculum preparation for Challenge Study II Also Materials and Methods section A-II c for the protocols used in the set up and inoculation ofextract in Challenge Study II
This study is continuing and the results obtained so far (2-2 ~ months after inoculation) do not show differences in mesophilic counts in extract samples of 6845 RDS and 6445 RDS incubated at 20degC or 30degC which was surprising See Table 9 and Fig 9 for detail This study again goes to show that if extract is produced under sufficiently stringent measures it probably would take a lot of mesophilic inoculum to deteriorate the extract even if there was a drop in RDS or increase in ambient temperatures
GRampR Studies During the past 13-14 months of evaluation of fastidious and mesophilic anaerobic tests on extract we observed large variation in counts especially for fastidious microbes Therefore we questioned the reliability of these counts and other microbial tests we were carrying out As such it was decided to carry out some GRampR or repeatability and reproducibility testing for these microbial tests to check variation (2)
Repeatability looks at the variation between measurements of the same part when measured by the same analyst with the same measurement device Reproducibility is the difference in measurements between analysts Therefore the RampR test will tell us the total variation in the measurement system that comes from Repeatability and Reproducibility together
In Test 1 of the GRampR test the two analysts (1amp2) tested the same EGF extract sample for aerobic thermophiles mesophiles mesophilic anaerobes and fastidious microorganisms 10 times over giving 20 readings for these microbes on the same sample See Table 10 The resuhs here show that the mesophilic and thermophilic counts obtained by the 2 analysts were close while the fastidious and mesophilic anaerobic counts showed variation
94
~~~~--- -- --- - shy
---- - -------- -
In Test 2 of the GRampR test each of the two analysts (1amp2) tested 10 different EGF extract samples for the same 4 microbes as L1 Test 1 giving 20 readings (duplicate sample readings) for the 10 different samples See Table 11 Here again the same type of results for the 4 microbial tests were obtained as before
Statistical analysis was carried out on these tests and the confidence interval was found to be very broad for the fastidious and mesophilic anaerobic tests (7 and 5 log units respectively) on a single sample while for the mesophilic and thermophilic tests the confidence interval was narrow (05 and 11 log units respectively) See Table 12 for detail The mean of the test was 55 - 65 In the analysis of variance for the analysts the p factor was 07 - 09 This shows that there was no difference between the analysts and the variation was in the fastidious and mesophilic anaerobic tests
Therefore due to the very variable results and the lack in reliability ofthese numbers we decided to discontinue testing for the fastidious and mesophilic anaerobic microbes from the beginning of this campaign
CONCLUSIONS These studies have shown that
1) The I-llB storage intervention strategies taken in 2002 have produced a very stable extract For instance lowering the HLB extract to 20 RDS and incubating the same extract at 35degC for 72 hrs hardly increased the microbial loading from the initial level (log I cfug range) This was further demonstrated by the HLB MDS facilitys ability to store extract for 145 months or longer
2) The microbial challenge studies carried out withmiddot EGF extract using mesophilic aerobic thermophilic fastidious and mesophilic anaerobic microbes show that degradation of extract will not occur if it had been produced under sufficiently stringent measures That is microbes inoculated at high levels die out and are maintained at levels close to those found in uninoculated control extract samples
3) The GRampR tests for repeatability and reproducibility have shown large variation in numbers for the fastidious and mesophilic anaerobic tests Therefore routine assessment of these two types of microbes in MDS extract was discontinued at American Crystal Sugar Co from the beginning of this campaign after 13-14 months of routine testing
4) These studies have given us some indication of the frequency of testing required for these microbial types
95
- - - -- -------
REFERENCES 1 Groom D R McGillivray T D Heggeness J H Samaraweera I S (2003) Chemistry
of storage and processing problems encountered with molasses desugarization extract Paper presented at the Joint Meeting of the IIRB and ASSBT at San Antonio Texas 26 February to 1 March 2003 and CITS Madrid May 19-212003
2nd2 Ryan TP (2000) Statistical Methods for Quality Improvement Ed A Wiley- Interscience Publication John Wiley and Sons Inc New York USA pp 121-122
3 Samaraweera I S Rheault D L Groom D R Buschette L (2003) Microbes and storage of extract from molasses desugarization Zuckerind 128 Nr 7 pp 518-527 (paper also presented at the joint meeting of IIRB and ASSBT at San Antonio TX 26 February to 1 March 2003)
4 Sargent D Briggs S Spencer S (1997) Thick juice degradation during storage Zuckerind 122 Nr 8 pp 615-621 (paper also presented at the Euro Tech Link 97 York June 1997)
5 Willems K A Willems M L Dardenne F Klingeberg M Michelberger Th Witte G (2003) Microbiological observations during storage of thick juice on a pilot and industrial scale Paper presented at the CITS 22nd General Assembly Meeting Madrid Spain May 18 to 21 2003 Proceedings pp 419-448
ACKNOWLEDGEMENTS The authors wish to thank Mike Goettel (HLBMDS Supervisor) Steve Clausen (EGFIMDS Supervisor) the factory chemists at Hillsboro and East Grand Forks (namely Pete Anderson and Jim Weinlaeder) Paul Hanson (Assistant Chemist - IDB) and the MDS staff at both facilities for samples and chemical data Our thanks are also due to Jim Heggeness for technical assistance and Mary Johnson for typing the report
96
Fig 1 EGF Extract Tank Samples(7-5-0577-05) Fastidious ampMesophilic Microbial Count
1-W middot 1-E 1-S 1-N 1-2 1-3 1-4 1-Top 2-W 2-E 2-S 2-N 2-2 2-3
Extract tank 10
0 -J
600 ~
w CIJ c
8
500
4 00
300 c 5 ()
~ J
200
100
000
Fig 2 HLB Extract Tank Samples (6-19-056-20-05) Fastidious and Mesophilic Microbial Count
~~~600 --_o__ _~__ _________
--f500 I
400 +1-----shyW til C
g 300
0 c 00 ~ o
()
9 200
100
000
Ext to Qd 2- Qd 4- St 1- St 2- Qd 1- Qd 3- St 1- St 2- St 4- St 5- St 6- St 7- B- Qd 2- Qd 4- St 1- St 2- St 3shystor A A A A B B B B B B B B Top C C C C C
Extract tank 10
bull Fastidious I bull Mesophiles I
Table 1
EAST GRAND FORKS EXTRACT STORAGE SAMPLES 2005
Tank 3 (Mesophiles and Mesophilic Anaerobes)
Log Count
ID Sample taken pH
Lactic Acid
Brix I (ppm) Mesophiles 110gDSE
Mesophilic Anaerobes
1109 DSE
1 3-2 5-7-4raquo5 94 7140 928 245 1000
2 3-3 5-7-05 94 7083 968 285 1000
3 3-4 5-7-05 94
7061 1084 263 602 4 3-1 5-7-05 96 6986 1124 263 604 5 3-Top 5-7-05 97 6977 1128 374 263
1 3-2 5middot14-05 95 7056 736 215 347
2 3-3 5-14-05 95 6977 820 216 622 3 3-4 5-14-05 95 7008 936 215 624 4 3-5 5-14-05 96 6982 980 263 517
5 3-Top 5-14-05 96 6999 1000 445 454
I 1 3-2 5-21-05 956 7052 992 245 263 I
2 3-3 5-21-05 956 7034 12116 215 590 3 3-4 5-21-05 960 7039 1212 285 583 4 3-6 5-21-05 963 7034 1316 285 581
5 3-Top 5-21-05 1965 6973 2036 386 553
1 3-N 5-28-G5 1956 7078 620 000 000 2 3-2 5-28-05 953 6986 640
6912 1 892 276 000
3 3-3 5-28-05 1
1 954 286 000
Note Began taking extract out of this tank on 5-24-05 for processing
99
1shy
Table 2
THICK JUICE QUALITY IN TWO BRITISH SUGAR FACTORIES (199495 Campaign)
Table 152 Development of thick juice quality in two British Sugar factories during the 1994195 campaign (Sargent et al ~ ~1997 NOTE Log counts were added for com~arison
Days OS Lactate after tank pH Incontent filled value mgkgin
Factory 1
40 880 689 1307
76 889 687 834
104 890 685 1739 8 132 903 684 1545
160 887 686 1854
187 879 689 1644
216 880 685 1905
Factory 2
40 887 690 1345
63 913 685 1133
99 907 683 1587
127 909 686 1444
155 902 683 1233
184 832 672 2500
204 709 686 3256
212 711 684 3527
239 707 684 3770
M880philes counts per 10 9
1400
670
660
980
190
lt1000
323
9787
5893
2533
5253
3440
72400
6667
4667
1540
Mesophllea LOG count per 10 9
315
283
282
299
228
lt300
251
399
377
340
372
354
486
382
367
319
Osmophillc
I yeastscounts per
I 10 9
1 44
342
60
11
5
591
485
9873
6467
160
193
19
1
240
0
353
Osmophlllc yeasts LOG count per 10 9
164
253
178
104
070
2 77
269
399
381
220
229
128
000
238
255
Table 3
EXTRACT MICROBIAL RANGE - Campaign 20052006 LOG COUNTS
-o-
EGF EXTRACT (cfu10g DSE)
HLB EXTRACT (cfu10g DSE)
I
MICROBIAL TYPES Tank (range) Top (max) Tank (range) Top (max) I
Mesophiles o-log 439 log 526 o-log 378 log 563
Thermophiles o-log 412 log 341 o-log 330 log 216
Fastidious microbes 0-log516 log 564 o-log 510 log 525
Mesophilic anaerobes o-log 348 log 498 o-log 361 log 593
Osmophilic yeast o-log 422 log 525 o-log 327 log 256 I
i
Osmophilic mold o-log 463 log 184 o-log 412 log 193 i
Thermophilic flat sours 0- log 337 log 215 0-log216 log 116
Total thermophilic spores o-log 337 log 215 o-log 217
Table 4
EAST GRAND FORKS SURFACE SAMPLE WITH HIGH YEAST COUNTS DECREASING TO ZERO WITH THE ADDITION OF CAUSTIC
Tank 2 Surface Sample 1-31-02
LOG COUNT
pH Brix
Lactic Acid (ppm)
Anaerobes Not Producing H2S
Anaerobes Producing H2S ( of spores)
Thermoshyphilic Flat Sours 110gDSE
Total Thermoshyphilic Spores 110gDSE
Mesoshyphiles 110gDSE
Thermoshyphiles 110gDSE
Yeast 110g0SE
Mold 110gDSE
Osmophilic Yeast 110gDSE
Osmoshyphilic Mold 110gDSE
989 7043 484 36 50 000 000 412 375 377 000 411 I 000 I
ot )
Tank 2 Surface Sample 2-5-02 - After addition of Caustic
pH Brix
Lactic Acid (ppm)
Anaerobes Not Producing H2S
Anaerobes Producing H2S ( of spores)
LOG COUNT T Total
Thermo- Thermoshyphilic philic Flat Sours Spores 110g DSE 110aDSE
Mesoshyphiles 110aDSE
Thermoshyphiles 110gDSE
Yeast 110gDSE
Mold 110gDSE
Osmophilic Yeast 110gDSE
Osmoshyphilic Mold 110gDSE
1069 7052 452 36 43 000 000 216 415 000 000 000 000
l
Table 5
STORAGE LENGTHS OF MDS EXTRACT IN TANKS AT HLB AND EGF (2003 TO 2006)
HLBTANKS Fill Start Date Processing End Date Days Months
a 9-11-03 6-16-04 279 19
B 9-26-04 12-6-05 437 145
C 12-23~04 7-7-05 196 65
C 10-1-05 5-16-06 228 75
-8 EGFTANKS Fill Start Date Processing End Date Days Months
TANK 1 1-19-03 216 8~-20-03
TANK 3 2849-5-03 6-15-04 9 I
TANK 2 11-7-06 279 910-8-04
11 TANK 1 3-10-05 2-18-06 348
959-30-05 6-13-06 256 TANK 3 -
Fig 3
FLOW DIAGRAM FOR INITIAL CULTURE GROWTH (4 Microbial Types) AND INOCULATION INTO EXTRACT (September 2005) EGF 3-4 (5-7-05) extract used to make up cultures
DAY 1 (9-9-07)
~e~ F35C
35C T 55CM
CPC flasks shy
~ ~ ~ DAY 4 (9-12-07)
7 centrifuge tubes for each culture type with 30 ml broth in each
+ + + BBffB fmiddot B B BBBBBee BB
24 hr 24 hr I 24 hr I
B 5B- B1 tube plated
MA 30C
~
1 tube plated
screw cap 1 liter bottles for storage
6 tubes centrifuged
+copy
1 large pellet mesophilic microbes
~
A extract 30e
6 tubes centrifuged
+copy
1 large pellet thermophilic microbes
~
extract 30e
104
1 tube 1 tube plated plated
6 tubes centrifuged
+
1 large pellet fastidious microbes
~
A extract 30e
6 tubes centrifuged
+
1 large pellet mesophilic anaerobes
~
extract 30e
Fig 4 Extract Storage Trial with microbial challenge (begun Sept 2005) Inoculated Samples
7 ~-----------------------------------------------------------------------------------------------~
6 1
5 middot1 wu Q
1 4 =--- shy~ ~ VI -tio
z 38 C) o I 2 I
o bull bull
gt -
-- ~ - ~ ~ ~
bull bull ~-----4~------~~
-Thermophiles ___ Fastidious
Mesophiles
~Meso-anaerobes
9-13-05 9-14-05 9-20-05 9-27-05 10-4-0510-18-05 11-7-05 11-21-0512-29-051-24-06 6-26-06 after (24 hrs)
spiking
DATE TESTED
Fig 5 Extract Storage Trial Control Sample
450 -r ------------ shy
400 I
350 ~ =0 _ --I ~
J --~ --- ~
300 _ - ~ I ~ ---1 n
i 250 I Thermophile- a -+-Fastidious~ u - 0 I Mesophilessect 200 1-1 i_ Meso-anaerobes o ()
8 150 I ----I J
100 rl---------------~----------
50 t0
000 middot ----------------------r- - - -- -----r--- ----- --f
9-13-05 9-20-05 9-27-05 10-4-05 10-18-05 11-7-05 11-21-05 12-29-05 1-24-06 6-26-06
DATE TESTED
Table 6
EXTRACT STORAGE TRIAL-1 (9-13-06 to 6-26-06) Log counts (cfu10 g DSE)
Control SamRle ThennoRhiles Fastidious MesoRbUes Meso-anaerobes
9-13-05 324 376 337 307
9-20-05 334 424 342 320
9-27-05 324 376 324 316
10-4-05 344 346 339 328
10-18-05 312 377 346 307
11-7-05 342 394 354 286
11-21-05 312 376 337 334
12-29-05 339 376 339 342
1-24-06 301 376 342 342
6-26-06 263 346 215 285
Inoculated SamRles ThennoRhiles Fastidious MesoRhiles Meso-anaerobes
9-13-05 after spiking 407 646 387 346
9-14-05 (24 hrs) 348 446 334 351
9-20-05 331 407 346 344
9-27-05 342 000 352 321
10-4-05 312 376 367 324
10-18-05 324 346 334 316
11-7-05 331 4 16 358 277
11-21-05 301 407 337 324
12-29-05 321 000 340 342
1-24-06 294 394 352 328
6-26-06 215 345 293 263
107
-- -_ __ ___--_ _-- ----------shy
Table 7
EXTRACT STORAGE STUDY I (at 30degC) 9-13-05 through 6-26-06
MICROBIAL TYPES pH Range Storaae
during Brix Range during Storage
Thermophiles 99 -105 678 -706
Fastidious Microbes 99 -105 682 -708
Mesophiles 100 -105 678 -705
Mesophilic Anaerobes 100 - 105 678 -701
Controls for each of the 4 microbial types
100 -105 686 -701
108
Fig 6
INITIAL INOCULUM TRANSFERS AT 35C (August 2006) for Challenge Study II (Egf =20 RDS Hlb =20 RDS EgflHlb Mix =20 RDS)
Set 1 1A 18 1C 10 1E 1F 1G 1H Day 1 Day 2 Day 2 Day 3 Day 3 Day 3 Day 3 Day 4
16 12 --- ----- ----- ----- ----- -----hr 24 hr 42 hr 44 hr 46 hr 48 hr 72 hr
~ mIx 900 430 1030 1230 230 430 430-lTI~reg-am pm am pm pm pm pm
430 pm plate plate plate plate plate plate plate
I
Table 8
INITIAL 20 RDS INOCULUM Mesophilic log counts (cfug)
bull Time hrs EGF HLB EGFHLB
1B 165 482 130 100
1C
1D
24
42
615
746
195 254 -shy757
1E 44 645 759
1F 46 654 130 762
1G 48 626 178 800
1H 72 823 148 737
no
Fig 7 - Challenge Study II (Mesophilic growth) Initial Inoculum
900
---
800
700
6 00
-~ J ~ 500c J 0 (J 400 ~ J
300
200
100
-+-EGF ---HLB
EGFHLB
000 +--------------------------------------------------------------------------------------------------------------
24 42 44 46 48165 72
Hr
Fig 8 Mesophilic Inoculum 35C (EGF = 20 RDS)
48 hr
Set 1
5et2
5et2
5et3
Set 1 1A Day 1
~ LTI ~
LTIbull2A
Day 3 24 hr plate
[fJ +
LTI ~
3A Day 4 24 hr plate
transfer 10mI
Incubate 24 hr
transfer 10 ml
Incubate 24 hr
transfer 10 mV LTI ~tranSfer 10 ml
20RDS 20 RDS bull LTILTI ~
24hr9~
Mixedtoculum ----~ For extract storage trial (from 2 containe - log 8 cfulg)
plate sample
11 2
Table 9
CHALLENGE STUDY II EGF EXTRACT Averaged Log Count for Mesophilesg of Sample
10 pH
Initial Day 0 121412006
Day 1 121512006
Day2 121612006
Day 7 1211112006
Day 15 121192006
Day 45 11912007
Day 81 212312007
6845 RDS (20C) 964 380 391 382 378 382 395 382 6845 RDS (30C) 964 378 384 379 378 390 384 6445 RDS (20C) 963 378 345 357 347 344 345 337 6445 RDS (30C) 963 354 357 343 345 345 346 Control (20C) 967 130 100 050 100 050 000 050
113
Fig9 SURVIVAL OF MESOPHILES IN EXTRACT AFTER MICROBIAL CHALLENGE (STUDY II) AVERAGED COUNTS (Log count cfug)
450 --------__--__--- ---- --- - - -- - -- --shy 1
400 ~~~~==~h---- shy
r-- - )( _~_______ a bull l---- ___350 --- Z~~ K---- 300
~ ~ ~ 250 c
~ s 0 U 200
150 i
100 -1--------
I
050L -000 - W
1242006 (Day 0) 1252006 (Day 1) 1262006 (Day 2) 12112006 (Day 7) 12192006 (Day 15) 11912007 (Day 45) 2232007 (Day 81)
Dates of Sampling
-+-6845 rds (20C) pH=964 -6845 rds (30C) pH=964 6445 rds (20C) pH=963 yen 64 45 rds (30C) pH=963 --Control (6845 rds) pH=967
Table 10
GAUGE RampR TEST - 1 (EGF Extract Samples Plated 7-14-06)
Lab Analyst
Thermophiles in 1 g
Fastidious mo in 1 g
Mesophiles in 1 g
Mesophilic Anaerobes in 1 g
1I 1 50 200 280 10
2 1 70 600 230 20
3 1 80 600 220 0
4 1 100 200 230 20
5 1 50 0 380 10
6 1 140 400 290 20
7 1 30 0 190 20
8 1 70 0 280 0 9 1 40 400 310 10 10 1 120 400 250 0 11 2 70 0 320 20 12 2 60 400 230 0 13 2 150 200 230 10 14 2 140 0 310 10 15 2 100 800 190 0 16 2 40 0 290 20 17 2 80 0 28 30 18 2 100 400 260 20 19 2 60 0 190 20 20 2 80 200 250 0
115
Table 11
GAUGE RampR TEST - 2 (EGF Extract Samples Plated 7-14-06)
shyI
Mesophilic Lab Thennophiles Fastidious Mesophiles Anaerobes Analyst Sample 10 in 1 g mo in 1 g in 1 9 in 1 g
21 1 1 2 (4-29-06) 210 middot 800 80 20
22 1 2 2 (4-29-06) 100 400 100 30
23 2 1 14 (4-29-06) 10 0 20 0
24 2 2 14 (4-29-06) 20 0 0 0
25 3 1 16 (4-29-06) 0 ~OO 90 0 -shy
26 3 12 16 (4-29-06) 110 0 30 10
27 4 1 9 (5-20-06) 10 400 130 0 I
28 4 2 9 (5-6-06) 40 200 20 0
29 5 1 7 (5-13-06) 20 0 30 0
30 5 2 7 (5-13-06) 20 200 20 0
31 6 1 8 (5-13-061 30 0 40 0
32 6 2 8 (5-13-06) 20 0 50 0
33 7 1 9 (5-20-06) 20 600 30 0
34 7 2 9 (5-20-06) 0 200 30 10
35 8 1 3 (6-3-06) 40 200 10 10
36 8 2 3 (6-3-06) 50 0 50 0
37 9 1 8 (6-3-06) 30 400 120 110
38 9 2 8 (6-3-06) 50 400 200 190
39 10 1 3 (6-24-06) 20 0 40 20
40 10 2 3 (6-24-06) 20 0 20 10
116
Table 12
CONFIDENCE INTERVALS FOR MICROBIAL TESTING
Microbial Types Confidence Interval (CI) 110 g DSE (on a single sample)
Mesophiles 05 log units
Thermophiles il 11 log units
Fastidious microbes I 7 log units (to tighten CI to 1 log unit need to run Ia minimum of 6 samples)
Mesophilic anaerobes 15 log units (to tighten CI to 1 log unit need to run 5 samples)
Range of means 55-65
117
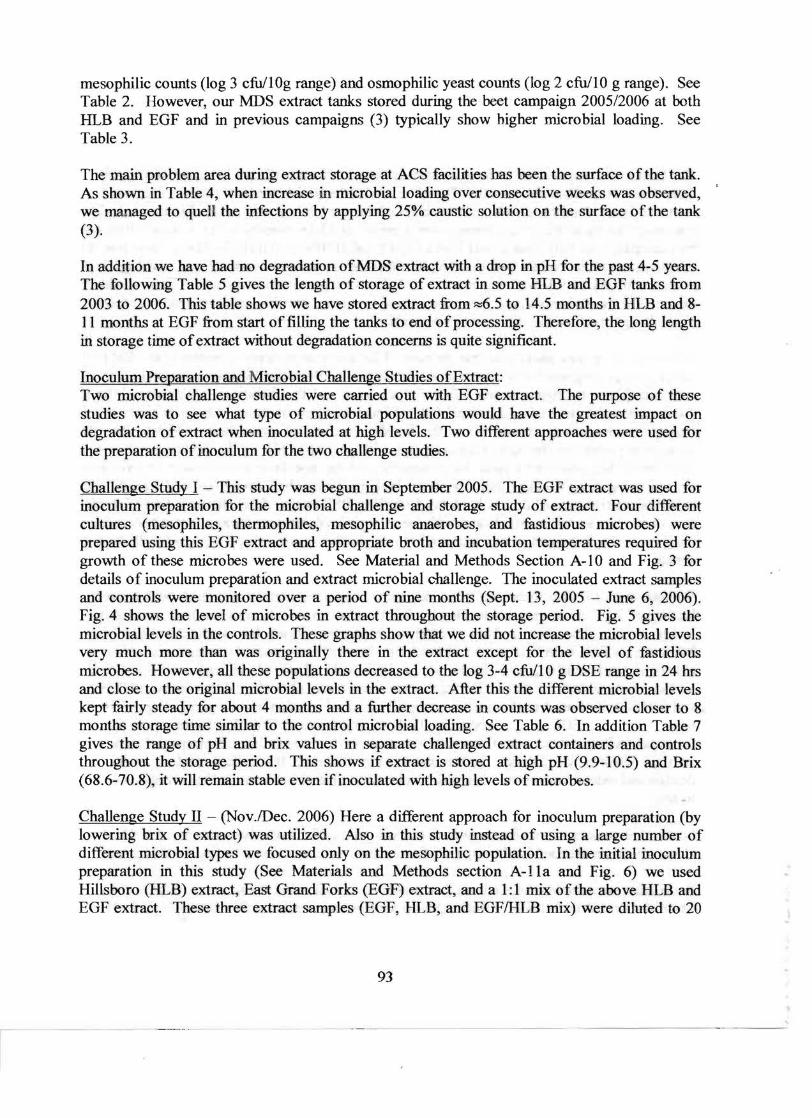
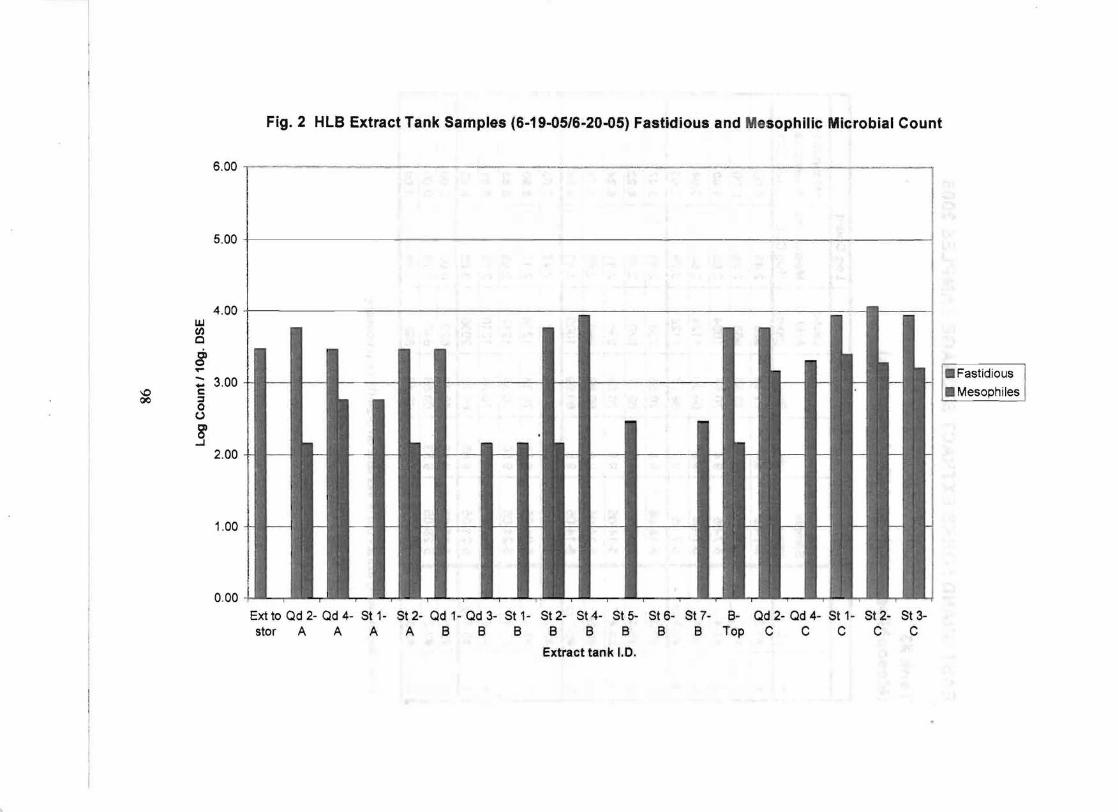
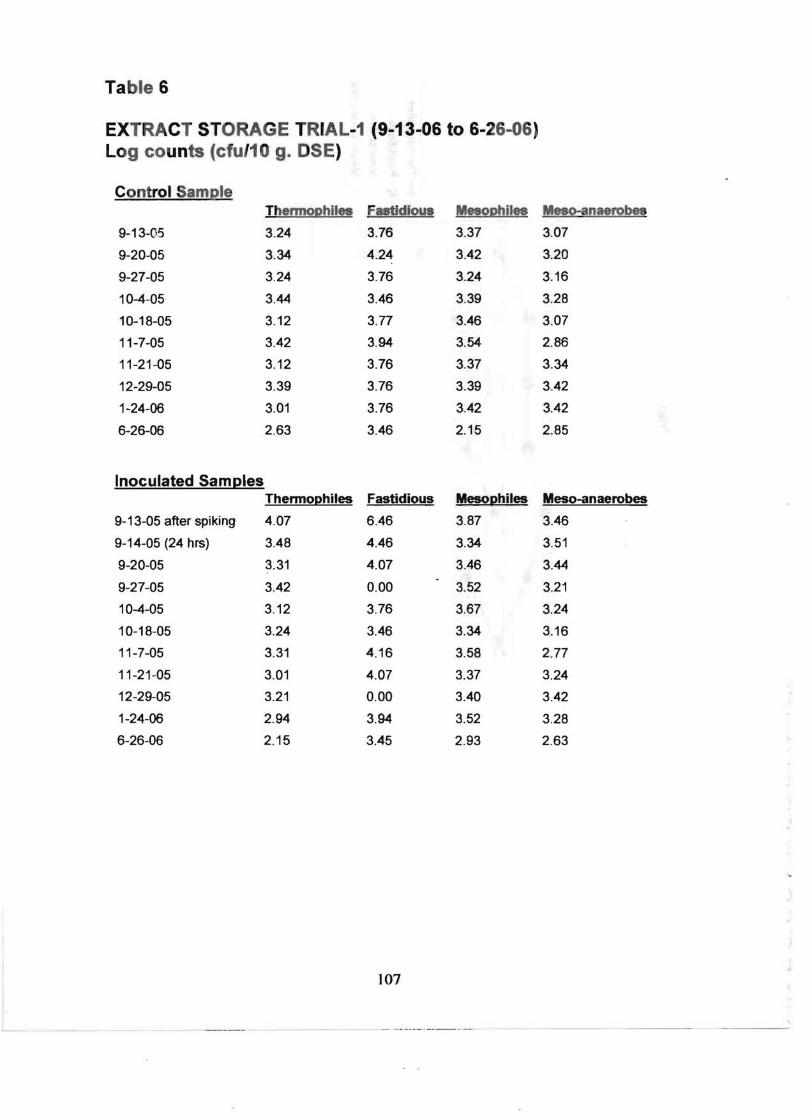

I
Table 8
INITIAL 20 RDS INOCULUM Mesophilic log counts (cfug)
bull Time hrs EGF HLB EGFHLB
1B 165 482 130 100
1C
1D
24
42
615
746
195 254 -shy757
1E 44 645 759
1F 46 654 130 762
1G 48 626 178 800
1H 72 823 148 737
no
Fig 7 - Challenge Study II (Mesophilic growth) Initial Inoculum
900
---
800
700
6 00
-~ J ~ 500c J 0 (J 400 ~ J
300
200
100
-+-EGF ---HLB
EGFHLB
000 +--------------------------------------------------------------------------------------------------------------
24 42 44 46 48165 72
Hr
Fig 8 Mesophilic Inoculum 35C (EGF = 20 RDS)
48 hr
Set 1
5et2
5et2
5et3
Set 1 1A Day 1
~ LTI ~
LTIbull2A
Day 3 24 hr plate
[fJ +
LTI ~
3A Day 4 24 hr plate
transfer 10mI
Incubate 24 hr
transfer 10 ml
Incubate 24 hr
transfer 10 mV LTI ~tranSfer 10 ml
20RDS 20 RDS bull LTILTI ~
24hr9~
Mixedtoculum ----~ For extract storage trial (from 2 containe - log 8 cfulg)
plate sample
11 2
Table 9
CHALLENGE STUDY II EGF EXTRACT Averaged Log Count for Mesophilesg of Sample
10 pH
Initial Day 0 121412006
Day 1 121512006
Day2 121612006
Day 7 1211112006
Day 15 121192006
Day 45 11912007
Day 81 212312007
6845 RDS (20C) 964 380 391 382 378 382 395 382 6845 RDS (30C) 964 378 384 379 378 390 384 6445 RDS (20C) 963 378 345 357 347 344 345 337 6445 RDS (30C) 963 354 357 343 345 345 346 Control (20C) 967 130 100 050 100 050 000 050
113
Fig9 SURVIVAL OF MESOPHILES IN EXTRACT AFTER MICROBIAL CHALLENGE (STUDY II) AVERAGED COUNTS (Log count cfug)
450 --------__--__--- ---- --- - - -- - -- --shy 1
400 ~~~~==~h---- shy
r-- - )( _~_______ a bull l---- ___350 --- Z~~ K---- 300
~ ~ ~ 250 c
~ s 0 U 200
150 i
100 -1--------
I
050L -000 - W
1242006 (Day 0) 1252006 (Day 1) 1262006 (Day 2) 12112006 (Day 7) 12192006 (Day 15) 11912007 (Day 45) 2232007 (Day 81)
Dates of Sampling
-+-6845 rds (20C) pH=964 -6845 rds (30C) pH=964 6445 rds (20C) pH=963 yen 64 45 rds (30C) pH=963 --Control (6845 rds) pH=967
Table 10
GAUGE RampR TEST - 1 (EGF Extract Samples Plated 7-14-06)
Lab Analyst
Thermophiles in 1 g
Fastidious mo in 1 g
Mesophiles in 1 g
Mesophilic Anaerobes in 1 g
1I 1 50 200 280 10
2 1 70 600 230 20
3 1 80 600 220 0
4 1 100 200 230 20
5 1 50 0 380 10
6 1 140 400 290 20
7 1 30 0 190 20
8 1 70 0 280 0 9 1 40 400 310 10 10 1 120 400 250 0 11 2 70 0 320 20 12 2 60 400 230 0 13 2 150 200 230 10 14 2 140 0 310 10 15 2 100 800 190 0 16 2 40 0 290 20 17 2 80 0 28 30 18 2 100 400 260 20 19 2 60 0 190 20 20 2 80 200 250 0
115
Table 11
GAUGE RampR TEST - 2 (EGF Extract Samples Plated 7-14-06)
shyI
Mesophilic Lab Thennophiles Fastidious Mesophiles Anaerobes Analyst Sample 10 in 1 g mo in 1 g in 1 9 in 1 g
21 1 1 2 (4-29-06) 210 middot 800 80 20
22 1 2 2 (4-29-06) 100 400 100 30
23 2 1 14 (4-29-06) 10 0 20 0
24 2 2 14 (4-29-06) 20 0 0 0
25 3 1 16 (4-29-06) 0 ~OO 90 0 -shy
26 3 12 16 (4-29-06) 110 0 30 10
27 4 1 9 (5-20-06) 10 400 130 0 I
28 4 2 9 (5-6-06) 40 200 20 0
29 5 1 7 (5-13-06) 20 0 30 0
30 5 2 7 (5-13-06) 20 200 20 0
31 6 1 8 (5-13-061 30 0 40 0
32 6 2 8 (5-13-06) 20 0 50 0
33 7 1 9 (5-20-06) 20 600 30 0
34 7 2 9 (5-20-06) 0 200 30 10
35 8 1 3 (6-3-06) 40 200 10 10
36 8 2 3 (6-3-06) 50 0 50 0
37 9 1 8 (6-3-06) 30 400 120 110
38 9 2 8 (6-3-06) 50 400 200 190
39 10 1 3 (6-24-06) 20 0 40 20
40 10 2 3 (6-24-06) 20 0 20 10
116
Table 12
CONFIDENCE INTERVALS FOR MICROBIAL TESTING
Microbial Types Confidence Interval (CI) 110 g DSE (on a single sample)
Mesophiles 05 log units
Thermophiles il 11 log units
Fastidious microbes I 7 log units (to tighten CI to 1 log unit need to run Ia minimum of 6 samples)
Mesophilic anaerobes 15 log units (to tighten CI to 1 log unit need to run 5 samples)
Range of means 55-65
117
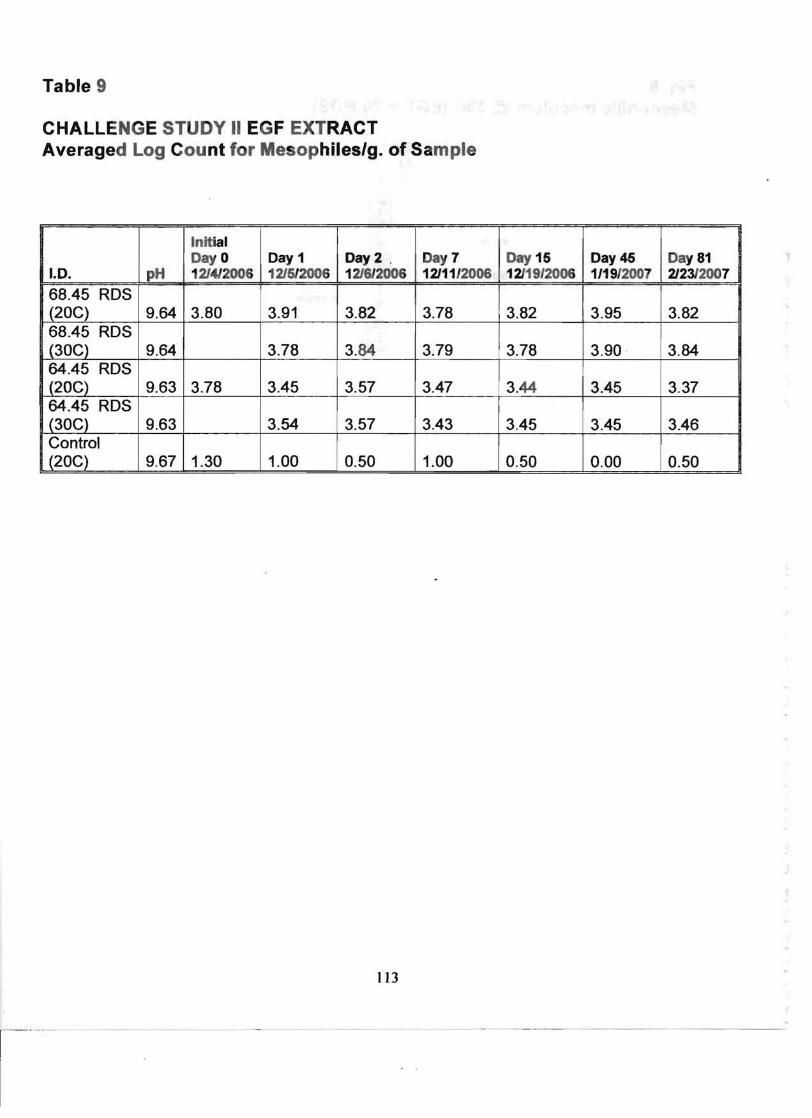