Embed Size (px)
Citation preview

The Relationship of Weddell Polynya and Open-Ocean Deep Convection tothe Southern Hemisphere Westerlies
WOO GEUN CHEON
The 6th R&D Institute-1, Agency for Defense Development, Jinhae, South Korea
YOUNG-GYU PARK
Ocean Circulation and Climate Research Division, Korea Institute of Ocean Science and Technology, Ansan, South Korea
J. R. TOGGWEILER
NOAA/Geophysical Fluid Dynamics Laboratory, Princeton, New Jersey
SANG-KI LEE
Cooperative Institute for Marine and Atmospheric Studies, University of Miami, and NOAA/Atlantic Oceanographic
and Meteorological Laboratory, Miami, Florida
(Manuscript received 26 May 2013, in final form 3 October 2013)
ABSTRACT
The Weddell Polynya of the mid-1970s is simulated in an energy balance model (EBM) sea ice–ocean
coupled general circulation model (GCM) with an abrupt 20% increase in the intensity of Southern Hemi-
sphere (SH) westerlies. This small upshift of applied wind stress is viewed as a stand in for the stronger zonal
winds that developed in the mid-1970s following a long interval of relatively weak zonal winds between 1954
and 1972. Following the strengthening of the westerlies in this model, the cyclonic Weddell gyre intensifies,
raising relatively warmWeddell Sea DeepWater to the surface. The raised warm water then melts sea ice or
prevents it from forming to produce theWeddell Polynya.Within the polynya, large heat loss to the air causes
surface water to become cold and sink to the bottom via open-ocean deep convection. Thus, the underlying
layers cool down, the warm water supply to the surface eventually stops, and the polynya cannot be main-
tained anymore. During the 100-yr-long model simulation, two Weddell Polynya events are observed. The
second one occurs a few years after the first one disappears; it is much weaker and persists for less time than
the first one because the underlying layer is cooler. Based on thesemodel simulations, the authors hypothesize
that the Weddell Polynya and open-ocean deep convection were responses to the stronger SH westerlies that
followed a prolonged weak phase of the southern annular mode.
1. Introduction
From 1974 to 1976, a persistent large-scale open-
ocean polynya was observed in the Weddell Sea by
scanning passive microwave sensors on polar-orbiting
satellites (Zwally andGloersen 1977; Carsey 1980;Gordon
and Comiso 1988). This polynya, termed the ‘‘Weddell
Polynya,’’ was situated far off the Antarctic coast, west
of the Greenwich meridian. The ice-enclosed open-water
area of the polynya was observed throughout the period,
except from late spring to early fall when sea ice in this
region is routinely absent (Carsey 1980). Martinson et al.
(1981) proposed a vertical redistribution of heat with
weak horizontal variation as a triggering factor for the
Weddell Polynya. They also argued that a transient fea-
ture, rather than the mean atmospheric and oceanic cir-
culations,must be responsible for this polynya’s occurrence
because the maximum divergence areas of the atmosphere
and ocean in the Weddell Sea do not correspond to the
observed polynya area. Comparing hydrographic station
data, Gordon (1982) revealed that the Weddell Sea Deep
Water (WSDW) extending from about 200 to 2700m be-
neath the observed Weddell Polynya became significantly
Corresponding author address: Young-Gyu Park, Ocean Circula-
tion andClimateResearchDivision, Korea Institute ofOcean Science
and Technology, 787 Hean-ro(st), Sangnok-gu, Ansan, South Korea.
E-mail: [email protected]
694 JOURNAL OF PHYS ICAL OCEANOGRAPHY VOLUME 44
DOI: 10.1175/JPO-D-13-0112.1
� 2014 American Meteorological Society

colder and fresher in 1976–78 than in 1973. This suggests
that full-scale open-ocean deep convection giving rise
to the so-called Weddell chimney (Killworth 1979) oc-
curred after the first opening of the Weddell Polynya in
1974.
The whole process, from the preconditioning to the
open-ocean deep convection, consists of four stages. In
the first stage, a large area of the pycnocline is raised
over a large area so that the warm and salty WSDW
lies just below the cold fresh surface layer above. In
the second stage, the warmth of the upwelled WSDW
thermodynamically generates the Weddell Polynya by
hindering new sea ice formation or by melting existing
sea ice (Martinson et al. 1981). In the third stage, rela-
tively warm surface water in the large-scale ice-free
ocean area surrounded by sea ice is brought in direct
contact with extremely cold air and is thus transformed
to sea ice. The ensuing brine rejection, combined with
the relatively high salinity of the upwelled WSDW, acts
to destabilize the whole water column, generating and
maintaining open-ocean deep convection (Gordon 1982;
Killworth 1983). On the other hand, the warmth of the
WSDW injected into the surface layer periodically re-
stores stratification of the water column by slowing down
sea ice formation. Such an oscillatory mode is inherent in
the formation process of open-ocean polynyas (Gordon
1991; Goosse and Fichefet 2001). In the final stage, the
multiyear persisting large-scale polynya disappears when
the upwelled water is no longer warm enough to melt the
sea ice, which is a part of the results derived from this
study and is described in the following.
So what generates the preconditions for the Weddell
Polynya in the first stage? Martinson et al. (1981) first
speculated that larger-than-normal salt rejection due to
the anomalous formation of sea ice is the cause for this.
Using observational data, Gordon et al. (2007) made an
attempt to connect it with major climate modes of var-
iability. They presented a hypothesis that drier-than-
normal air that the Weddell Sea experienced during the
prolonged negative phase of the southern annular mode
(SAM) and increased sea ice formation due to colder-than-
normal conditions in the polynya area under La Ni~na
conditions can generate the preconditions for the Weddell
Polynya. At some point these conditions result in small-
scale overturning, leading to upwelling of the WSDW. It
should be noted that small-scale overturning is distinct from
open-ocean deep convection in the third stage because the
Weddell chimney occurred after the first occurrence of the
Weddell Polynya as discussed earlier. A topographic effect
ofMaudRisewas also studied as the preconditioning factor
(Ou 1991; Alverson and Owens 1996; Holland 2001).
Here, we present and explore a possible link be-
tween the SAM and theWeddell Polynya. The observed
Weddell Polynya first occurred in 1974 (markedwith blue
character B), which was 2 years after the SAM [SAM
index is based on sea level pressure (SLP) data as shown
in Fig. 1] reached a minimum in 1972 (marked with red
character A). That is, the Weddell Polynya formed in a
transition period when the weakened Southern Hemi-
sphere (SH) westerlies began to regain strength. This
suggests another important candidate mechanism for
preconditioning the Weddell Polynya (i.e., strengthening
of the SH westerlies).
The Antarctic continent is dominated by an overlying
yearlong high pressure center and is continuously sur-
rounded by several low pressure systems. The northern
part of the Southern Ocean (SO) is dominated by the
SH westerlies, while its southern part is dominated by
easterly winds and strong offshore katabatic winds
(Wadhams 2000). The Weddell gyre controls the influx
of relativelywarm, saltyCircumpolarDeepWater (CDW)
into the interior of the Weddell Sea (Orsi et al. 1993), and
its northern limb is in contact with the Antarctic Circum-
polar Current (ACC), the intensity of which is barotropi-
cally and baroclinically linked with the SH westerlies (Cai
and Baines 1996; McDermott 1996; Gnanadesikan and
Hallberg 2000; Gent et al. 2001).Moreover, according to
the analysis of hydrographic data (Orsi et al. 1993), the
CDW that splits off the ACC enters the eastern limb of
the Weddell gyre, mixes with the cold shelf water, and
then forms the Weddell Sea Bottom Water (WSBW),
which over time moves upward to replenish the over-
lying WSDW. The relatively warm and salty WSDW is
displaced upward by Ekman pumping due to the nega-
tive wind stress curl over the SO and subsequentlymixed
with the cold and fresh surface water. These facts in-
dicate that the SO sea ice–ocean system is closely con-
nected to the SH westerlies. Meanwhile, the SAM, the
FIG. 1. SAM time series based on SLP indices for various sectors
of the SO. Yearly values are shown as the black line connecting
annual values. The thicker gray line and gray shading denote the
5-yr low-pass-filtered data. This figure is quoted from Fig. 4 of
Gordon et al. (2007). The red character A is indicative of 1972
when the negative phase of the SAM reached its peak, and the blue
character B is indicative of 1974 when the Weddell Polynya first
occurred.
FEBRUARY 2014 CHEON ET AL . 695

representative climate mode associated with the SH
westerlies, is characterized by swings between the stron-
ger and poleward-shifted westerlies in its positive phase
and the weaker and equatorward-shifted westerlies in
its negative phase (Gong and Wang 1999; Thompson
and Wallace 2000). For clarity, we only consider in-
tensification of the SH westerlies without taking into
account their meridional movement.
Since the studies of Toggweiler and Samuels (1993,
1995), the influence of the SH westerlies on the global
ocean, for example, the Antarctic Surface Water and
the Antarctic Intermediate Water (AAIW; e.g., Oke
and England 2004), the North Atlantic Deep Water
(NADW; e.g., Rahmstorf and England 1997; Brix and
Gerdes 2003), the Atlantic Ocean heat transport (e.g.,
Lee et al. 2011), and the ACC (e.g., Gnanadesikan and
Hallberg 2000), has been extensively studied. In this
study we aim to investigate how, at the beginning, the
intensification of the SH westerlies acts to generate the
Weddell Polynya and open-ocean deep convection and
how the SO sea ice–ocean system finds its new steady
state afterward. The model used is a sea ice–ocean
general circulation model (GCM) coupled to a global
atmosphere energy balance model (EBM), in which the
SH westerlies are intensified by a factor of 1.2. Detailed
descriptions of the model and experimental design are
given in the next section. All the processes, from pre-
conditioning of theWeddell Polynya to an occurrence of
open-ocean deep convection to the decay of the Weddell
Polynya, are described in detail in section 3 along with
verification of themodel results. The final section provides
a summary and conclusions.
2. Model description
a. Model configuration
The main framework of the model is the Modular
Ocean Model, version 4 (MOM4), of the Geophysical
Fluid Dynamics Laboratory (GFDL), in which the
primitive equation ocean model (Griffies et al. 2004) is
coupled with a dynamic and thermodynamic sea ice
model (Winton 2000). It is also coupled with the two-
dimensional global atmosphere EBM (Gerdes et al.
2005) and the land model (LM2; Anderson et al. 2004).
All model components are coupled via the GFDL Flex-
ible Modeling System (FMS). The sea ice–ocean model
(MOM4) extends from 808S to 908N with a tripolar grid
(Murray 1996), and its horizontal resolution is 28 in
longitude and 0.78–18 in latitude. In the vertical, it con-
tains 50 levels: 22 upper levels with uniform 10-m thick-
ness and 28 lower levels of gradually increasing thickness
to about 400m at 5500-mdepth. The bottom layer follows
the actual topography based on Smith and Sandwell
(1997) using satellite data in the region from 728S to
728N, the National Oceanic and Atmospheric Admin-
istration (NOAA) 5-Minute Gridded Global Relief
Data (ETOPO5), and the International Bathymetric
Chart of the Arctic Ocean (IBCAO). The EBM extends
globally and has T42 horizontal resolution. The present
model configurations are similar to those used in Gerdes
et al. (2005).
The oceanmodel has an explicit free surface, employing
the K-profile parameterization (KPP) scheme of Large
et al. (1994) for simulation of the surface mixed layer.
It uses the Gent–McWilliams (GM) scheme (Gent and
McWilliams 1990) for parameterizing mesoscale eddy
mixing on isopycnal surfaces. The coefficients for ver-
tical mixing vary in the upper layers from 1025m2 s21 in
the tropics to 3 3 1025m2 s21 at high latitudes and in-
crease at depth to 1.23 1024m2 s21 following Bryan and
Lewis (1979). The model uses the convective scheme of
Rahmstorf (1993) for convective adjustment.
The sea ice model consists of three layers, one snow
layer and two sea ice layers, and is run on the same grid
as the ocean model. The thermodynamics of sea ice is
formulated according toWinton (2000), and the physical
description of the sea ice dynamics involves the viscous–
plastic constitutive law introduced by Hibler (1979)
from rheological principles.
The EBM provides thermodynamic forcing by solving
prognostic equations for atmospheric temperature and
specific humidity. Atmospheric temperature is deter-
mined by the surface heat balance calculation composed
of shortwave radiation, longwave radiation, and sensible
and latent heat fluxes. The balance between evaporation
and both liquid and frozen precipitation determines the
specific humidity. It should be noted that the wind field
and precipitation are not calculated by the EBM but are
directly derived from data. Bulk formulas are used to
calculate heat and momentum fluxes at the ocean or sea
ice surface. The atmospheric dataset contains monthly-
mean wind fields from the 15-yr European Centre for
Medium-Range Weather Forecasts (ECMWF) Re-
Analysis (ERA-15) data between 1979 and 1993, which
is augmented by daily variability from a selected year
(1982). The sea ice–ocean model is repeatedly forced by
the day-to-day variability of this year.
b. Experimental design
According to reanalyses with phases 3 and 5 of the
Coupled Model Intercomparison Project (CMIP) (Swart
and Fyfe 2012), the SH westerlies have been significantly
intensified over the last 30 years, although its annual-
mean jet position did not show a robust trend. The ob-
jective of this study is to investigate the response of the
696 JOURNAL OF PHYS ICAL OCEANOGRAPHY VOLUME 44

SO sea ice–ocean system to the intensification of the
westerlies at the beginning of this interval. Figure 2
shows the zonal-mean zonal wind stress for the control
case (hereafter denoted as CTRL) and the intensified
SH westerlies (hereafter denoted as SW20), respec-
tively. In CTRL the wind stress is as stated above, while
in SW20 only the zonal wind stress in the latitudinal
band between 668 and 328S is uniformly intensified by
a factor of 1.2. In the wind field employed in the model,
this latitudinal band covers most of the area domi-
nated by the SH westerlies [40-yr ECMWFRe-Analysis
(ERA-40) data between 1957 and 2002] and the ACC
(Orsi et al. 1995). In the CTRL experiment, the model
starts from a ‘‘cold start’’ condition and is run for 500
years as a spinup period. This is not enough for the
whole bottom water mass to reach a full equilibrium
state, that is, a variation of global-mean bottom water
properties smaller than 0.018C (100 yr)21 for temper-
ature and 0.001 psu (100 yr)21 for salinity (England
1993). However, as discussed in the following section,
most main features of the global ocean circulation and
the SO sea ice are in a reasonable range and are thus
FIG. 2. Zonal-mean zonal wind stress tx for CTRL (solid) and SW20 (short dashed lines).
FIG. 3. Zonal-mean potential temperature and salinity in the Atlantic (608–108W) for CTRL (20-yr mean over 481 and 500) and
observation (Locarnini et al. 2006; Antonov et al. 2006).
FEBRUARY 2014 CHEON ET AL . 697

judged to be in a suitable state for this type of sensitivity
experiment. After the spinup, the SW20 experiment
starts from the last year of CTRL and is run for 100
years. Our analysis is conducted for the whole 100 years
of the SW20 experiment. All variables analyzed in this
paper are calculated inside of the model.
In this study, the SH westerlies are intensified by only
a factor of 1.2, smaller than factors ranging from 1.5 to
3.0 applied in many previous studies (Toggweiler and
Samuels 1993, 1995; Rahmstorf and England 1997;
De Boer et al. 2008). Although not presented in this
paper, an experiment in which the SH westerlies were
intensified by a factor of 1.5 was also performed; the
response of the SO sea ice–ocean system was more
drastic and faster than that with the SH westerlies in-
tensified by a factor of 1.2, but main phenomena such as
the Weddell Polynya and open-ocean deep convection
occurred via the same process in both experiments.
Moreover, because we focus on the transition period
when the weakened SH westerlies begin to regain
strength, a relatively small increase factor is employed
in this study to explore whether the SO sea ice–ocean
system is susceptible to a small change in the SH
westerlies.
FIG. 4. Horizontal distributions of the winter-mean sea ice (a) concentration, (b) thickness, (c) sea surface height
with sea ice drift, and (d) upper-ocean temperature ($50m) for CTRL over the period of the last 20 years (481–500).
Only the sea ice whose concentration is higher than 20% is presented.
698 JOURNAL OF PHYS ICAL OCEANOGRAPHY VOLUME 44

3. Results
a. Control run
Figure 3 shows meridional sections of zonal-mean,
annual-mean SH Atlantic potential temperature and
salinity for CTRL and observed data (Locarnini et al.
2006; Antonov et al. 2006), respectively. Though dif-
fering in magnitude in comparison with the observa-
tional data, CTRL indicates a northward intrusion of the
AAIW and a southward intrusion of the NADW in its
FIG. 5. Horizontal distributions of the winter-mean (June–August) sea ice concentration over the first 24 years of the
SW20 integration.
FEBRUARY 2014 CHEON ET AL . 699

salinity distribution. In the SO to the south of 608S,however, a tongue of relatively warm deep water cannot
be found in CTRL, and the whole water column is
fresher than in the observations. TheAtlanticmeridional
overturning circulation (MOC) and the NADW outflow
are main choke points of the thermohaline circulation in
the Atlantic Ocean and affect the volume transport of
the ACC bordering the Weddell gyre via thermal wind
balance (McDermott 1996; Gnanadesikan and Hallberg
2000). TheAtlantic MOC at 308N reaches 21.7 Sverdrups
FIG. 5. (Continued)
700 JOURNAL OF PHYS ICAL OCEANOGRAPHY VOLUME 44

(Sv; 1 Sv [ 106m3 s21), placing it near the upper bound
of values from climatemodels for the present-day climate
[see Fig. 10.15 of Solomon et al. (2007)]. The NADW
outflow passing through 308S is 20.6 Sv and is also larger
than the observed estimate [from;17 to;18Sv according
toGanachaud andWunsch (2000) andDong et al. (2009)].
The transport of the ACC across the Drake Passage is
189.1 Sv. This is greater than the observed transports
that vary between 110 and 150 Sv (Whitworth et al.
1982; Orsi et al. 1995; Cunningham et al. 2003), but is
FIG. 6. Horizontal distributions of the annual-mean AOW at 4000-m depth over the first 24 years of the SW20
integration.
FEBRUARY 2014 CHEON ET AL . 701

in agreement with other modeling results (Hallberg and
Gnanadesikan 2006; Kuhlbrodt et al. 2012). The global-
mean potential temperature at 4000-m depth reaches
1.638C and is higher than the observed estimate [1.088Caccording to Levitus (1982)]. These results are attributed
to the relatively large Atlantic MOC, which is linked to
larger NADW outflow and enhances the ACC via ther-
mal wind balance.
Figures 4a and 4b show the austral winter–mean (June–
August) sea ice concentration and thickness surrounding
Antarctica over the last 20 years (481–500) of the CTRL
integration period. Although performed in the framework
FIG. 6. (Continued)
702 JOURNAL OF PHYS ICAL OCEANOGRAPHY VOLUME 44

of the coarse-resolution model, they are in overall agree-
ment with results of other ice–ocean coupled models
(Fichefet et al. 2003; St€ossel 2008) and observations
(Maksym and Markus 2008; Parkinson and Comiso
2008). The distribution of the sea ice thickness is similar
to that of the winter-mean sea surface height (Fig. 4c):
relatively thick (thin) sea ice is observed where the
winter-mean sea surface height is relatively low (high).
It seems that the southern limb of the Weddell gyre acts
to push sea ice westward and thus the sea ice piles up in
the western limb of the gyre. Although most pack ice
consists of sea ice concentrations higher than 92%, there
is a small area in the central Weddell Sea where the sea
ice concentration drops to 82% at most. According to
satellite observations (Parkinson and Comiso 2008), this
region is generally covered by highly concentrated sea
ice. Thus, one might argue that our model has a prefer-
ence for an open-ocean polynya in the central Weddell
Sea, but the winter-mean upper-ocean temperature
(,50-m depth) uniformly lower than21.58C under sea
ice cover (Fig. 4d) is important evidence to dispel this
concern.
Within the SW20 experiment, the Weddell Polynya
could be generated in two ways: a dynamic way due to
a wind- and current-driven divergent sea ice drift and
a thermodynamic way due to upwelled relatively warm
WSDWmelting the sea ice. The uniformly near-freezing
upper-ocean temperature under sea ice cover in CTRL
indicates that the relatively less concentrated and thinner
sea ice in the central Weddell Sea is not due to surface
warming but to sea ice drift. As discussed in detail in the
following section, the simulated Weddell Polynya is
due to the upwelled relativelywarmWSDW.These imply
that the modeled SO sea ice in CTRL does not have an
intrinsic tendency to generate Weddell Polynyas.
In summary, the simulated ocean states are within
reasonable ranges, although the global thermohaline
circulation does not reach an equilibrium state in terms
of criteria suggested by England (1993); that is, the water
temperature and salinity at 4000-m depth still increase
about 0.028C and 0.002psu during the last 100 years of
CTRL. The simulated sea ice shows reasonably good
agreement with observations. Therefore, the SO sea ice–
ocean system simulated in CTRL is appropriate for in-
vestigating its responses to SW20.
b. Opening of the Weddell Polynya
Figures 5 and 6 show horizontal distributions of winter-
mean sea ice concentration and annual-mean age of
water (AOW) at 4000-m depth over the first 24 years of
SW20 integration, in which the AOW indicates how old
the water masses are after sinking from the surface.
Immediately after the SH westerlies are intensified by
a factor of 1.2, sea ice concentration in the vicinity of
688S, 388Wstarts to decrease gradually. At year 5 the sea
ice concentration suddenly drops at maximum to 32%
(Fig. 5), at year 6 the younger water mass begins to ap-
pear at 4000-m depth, and at year 7 the 1-yr-old water
mass is observed at depth (Fig. 6). This means that the
surface water sinks to this depth in just 2 years after the
drastic reduction of sea ice in the central Weddell Sea,
which is clear evidence for open-ocean deep convection
and is in good agreement with the observed results of
Gordon (1982). That is, the water column beneath the
ice-reduced area is destabilized by the dense water newly
formed by the extreme cooling and the ensuing sea ice
formation releasing salt to the ocean, leading to open-
ocean deep convection. Figure 7 shows time series of
the maximum barotropic streamfunction in the Weddell
Sea (i.e., the intensity of Weddell gyre) and the AOW at
1000-m depth over the whole period of SW20 integration.
At first both show gradual changes until year 4. The rate
of change is slightly larger in year 4 than in year 3. Then at
year 5, when the sea ice in the central Weddell Sea is
drastically reduced, the Weddell gyre is also drastically
intensified and open-ocean deep convection begins to oc-
cur, as indicated by the AOW getting younger at 1000-m
depth (see the purple line of Fig. 7). In the case of the 1970s
Weddell Polynya, the sea ice concentration dropped be-
low 15% (Carsey 1980), whereas in the fifth year of the
SW20 simulation it dropped only to 32%. Although af-
terward the sea ice concentration continued to drop and
at year 7 reached below 15%, in this paper the Weddell
Polynya is considered to occur first at year 5 because open-
ocean deep convection, which is the most important event
resulting from theWeddell Polynya, is triggered that year.
The ice-free area expands eastward south of Australia
to the South Pacific Ocean and becomes largest in year 8
as can be seen in Fig. 5. The ice reduction outside of the
Weddell Sea is not related to the Weddell Polynya, but
to the experimental setup, which is explained with the
detailed mechanism of Weddell Polynya in the follow-
ing. At year 9 the ice-free area starts to shrink and dis-
appears completely by year 15 when the SO sea ice is
fully recovered. The surface water masses beneath the
areas where the sea ice disappears keep sinking to the
bottom during this period. At year 16 sea ice again starts
to open gradually, but this time it is closer to the coast
and just west of the Greenwich meridian, thus closer to
the site of the observed 1970s Weddell Polynya and on
a much smaller scale than the first one.
The Weddell Polynya occurs again in year 19, disap-
pears in the next year, and never occurs again during the
next 76 model years. As shown in Fig. 7, after the first
occurrence of Weddell Polynya, the intensity of the
Weddell gyre reaches its peak at years 7 and 8, thereafter
FEBRUARY 2014 CHEON ET AL . 703

oscillates, and shows a sudden increase at year 19. The
AOWat 1000-m depth reaches its minimum at years 8, 9,
and 10 when open-ocean deep convection is active, gets
older from years 11 to 18, indicating that the convection
gets weakened, and suddenly gets younger at year 19,
indicating that the convection is triggered again. At year
19 the sea ice concentration in the central Weddell
Sea also drops below 20%, and thus the secondWeddell
Polynya is considered to occur at this year.
In the aforementioned small area where the sea ice
concentration is originally low, sea ice concentration
slightly decreases from 82% to 76% after the second
polynya event and maintains this condition to the end of
SW20 experiment. It should be noted that, even after the
Weddell Polynyas are closed, the narrow chimney lasts
until the end of the SW20 experiment (not shown here),
which is attributed to the slightly warmed SST in the
spot that becomes the cause of additional salt rejection
due to sea ice formation [discussed in the next sub-
section, with Fig. 11 (described in greater detail below)].
We speculate that this salt rejection anomaly—and thus
the weakly stratified water column—causes the narrow
chimney to remain to the end of the SW20 experiment.
When the SH westerlies regain their original state in an
additional experiment, this narrow chimney disappears
in a few years (not shown here).
c. Detailed mechanism to trigger open-ocean polynyaand deep convection
How does the application of SW20 trigger an open-
ocean polynya and deep convection in theWeddell Sea?
The sea ice–ocean interactions when the first Weddell
Polynya starts to form are examined fromvarious angles in
the following. Figure 8 shows changes in the winter-mean
SST and AOW at the second layer over the first 6 years
of the SW20 integration when the Weddell Polynya first
occurs. The second layer’s AOW is selected because the
first layer is always turned into new water (i.e., zero-age
water). The new water, shaded by purple color, is in-
dicative of sinking down from the surface, while the
older water shaded by other colors is indicative of the
upwelling of deep water. After the SH westerlies are
intensified, SST in the central Weddell Sea rises very
slowly until year 3, begins to show an obvious increase
at year 4, and reaches at most20.98C at year 5, which is
consistent with the location and period where the first
Weddell Polynya appears. Changes in the SST are very
similar to changes in the second layer’s AOW, which
indicate a strong upwelling of deep water at year 4. This
confirms that the surface warming in the Weddell Sea
is attributed to the upwelling of the relatively warm
WSDW.Note that upwelled warm deep waters are older
than the surrounding ones at the observed depth. Mean-
while, the aforementioned ice-reduced area outside of the
Weddell Sea is also attributed to the relatively warm
deep water upwelled at the location, which is associated
with the experimental setup that intensifies the zonal
wind uniformly between 668 and 328S and thus gives rise
to upwelling of deep water outside of the Weddell Sea.
Figure 9 shows a detailed representation of this up-
welling with zonal-mean, winter-mean potential tem-
perature, and zonally integrated, winter-meanmeridional
streamfunction between 458 and 308W where the first
polynya occurs. In CTRLone sees the coldest layer above
a black dotted line (#21.28C), preventing the relatively
warmWSDW from entraining into the mixed layer.With
the application of SW20, the enhanced wind stress curl
over the SO intensifies not only upwelling of the CDW
FIG. 7. Time series of the max winter-mean horizontal barotropic streamfunction in the Weddell Sea (black line
with circles) and of thewinter-meanAOWat 1000-m depth in the centralWeddell Sea (black line with triangles). The
former is indicative of the intensity of Weddell gyre and is averaged between 808 and 608S and between 608W and
208E, and the latter is averaged between 758 and 658S and between 408 and 108W. The purple (blue) line is indicative
of the time when the first (second) Weddell Polynya occurs.
704 JOURNAL OF PHYS ICAL OCEANOGRAPHY VOLUME 44

but also the Weddell gyre. Although upwelling at year
1 appears to be weaker than that averaged over the last
20 years of CTRL (see Figs. 9a and 9b), it is stronger than
that at the last year of CTRL (not shown here), implying
that upwelling begins to intensify simultaneously with
the application of SW20. As discussed with Fig. 7 above,
the Weddell gyre is, regardless of northward Ekman
transport outside of it, gradually intensified until year 4
and is drastically intensified at year 5, as illustrated in
Figs. 10a–f. Likewise, in the vicinity of 708S the upward
motion of theWSDW shows gradual change until year 4
and so does the thickness of the coldest layer (see Fig. 9).
The rates of change in the upward motion and the
thickness of the coldest layer at year 4 are larger than
those by year 3. Then at year 5 the upward motion is
drastically intensified, and thus the upwelled WSDW
destroys the coldest layer completely. This whole ther-
modynamic process is in a good agreement with the
FIG. 8. Changes in the winter-mean (a)–(f) sea surface temperature and (g)–(l) AOW at the second model layer
(15-m depth) over the first 6 years of the SW20 integration when the open-ocean polynya event occurs in theWeddell
Sea. Note that the AOW in the second layer is shown because it is always set to 0 in the first layer.
FEBRUARY 2014 CHEON ET AL . 705

theory suggested by previous studies (Martinson et al.
1981; Gordon 1982; Gordon and Huber 1984; Martin
et al. 2012). Note that the upward motion is dominant in
the narrow longitudinal range between 458 and 308W,
but in other areas of the Weddell Sea the downward
motion due to near-boundary convection generally pre-
vails and is gradually intensified with the application of
SW20 (not shown here). Meanwhile, from years 1 to 4 the
cold surface water gradually sinks down near 678S, andits sinking becomes intense from year 5 in association
with open-ocean deep convection, which is consistent
with the inference from the AOW at 1000-m depth in
Fig. 7. Moreover, from year 6 the downward motion in
the vicinity of 668S is so intense that the area where the
upward motion prevails is pushed poleward and thus
becomes small. That is, the Weddell Polynya is gener-
ated by the upwelling of warm deep waters, which
is, however, suppressed by the ensuing event of open-
ocean deep convection. In summary, by year 4 the up-
ward motion is mainly due to theWeddell gyre, at year 5
is drastically intensified by the density overturning
triggered by the Weddell Polynya, and from year 6 be-
gins to be rather suppressed by the intense open-ocean
deep convection.
FIG. 9. Meridional sections of zonal-mean, winter-mean potential temperature (color shading), and zonally in-
tegrated winter-mean meridional overturning (contours) between 458 and 308W for CTRL and the first 6 years of the
SW20 integration. Positive lines are indicative of clockwise circulation, and their units are Sv. The black dotted line is
indicative of the isotherm of 21.28C.
706 JOURNAL OF PHYS ICAL OCEANOGRAPHY VOLUME 44

The next issue is the possibility that the dynamic
process associated with the wind- and current-driven di-
vergent sea ice drift plays a role in generating preconditions
for the Weddell Polynya. As shown in Figs. 10a–f, imme-
diately after the SH westerlies are intensified, surface
water north of 668S is strongly advected northward by
Ekman transport, and more importantly the cyclonic
Weddell gyre begins to intensify gradually. While the
northward Ekman transport between 608 and 508S
maintains its increase at year 1 until year 6, the Weddell
gyre is, as previously discussed, drastically intensified at
year 5 and reaches its peak at years 7 and 8 (see Fig. 7)
along with baroclinic intensification of the ACC. These
oceanic changes lead to the anomalous cyclonic drift of
sea ice but not to its uniform divergence (Figs. 10g–l).
This indicates that the simulatedWeddell Polynya is not
triggered by ocean-to-ice momentum stress from the
cyclonic gyre anomaly.
FIG. 10. Changes in (a)–(f) winter-mean horizontal barotropic streamfunction and surface current and (g)–(l)
winter-mean sea ice drift and its divergence over the same time period as Fig. 8. A positive (negative) value in the sea
ice divergence is indicative of a divergent (convergent) flow.
FEBRUARY 2014 CHEON ET AL . 707
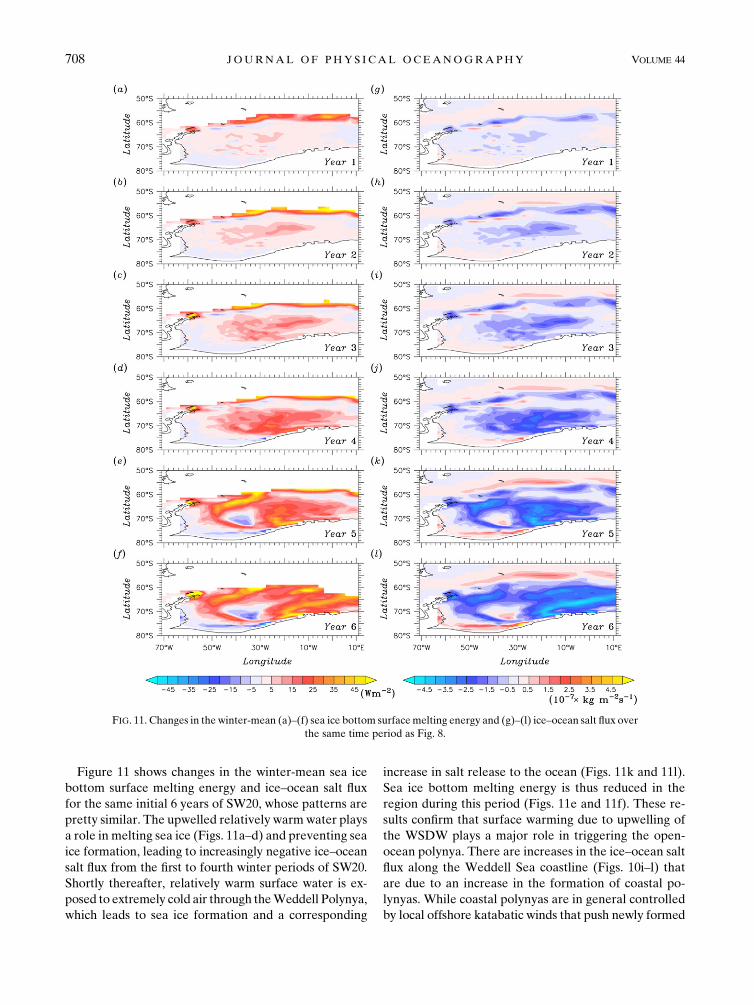
Figure 11 shows changes in the winter-mean sea ice
bottom surface melting energy and ice–ocean salt flux
for the same initial 6 years of SW20, whose patterns are
pretty similar. The upwelled relatively warmwater plays
a role in melting sea ice (Figs. 11a–d) and preventing sea
ice formation, leading to increasingly negative ice–ocean
salt flux from the first to fourth winter periods of SW20.
Shortly thereafter, relatively warm surface water is ex-
posed to extremely cold air through theWeddell Polynya,
which leads to sea ice formation and a corresponding
increase in salt release to the ocean (Figs. 11k and 11l).
Sea ice bottom melting energy is thus reduced in the
region during this period (Figs. 11e and 11f). These re-
sults confirm that surface warming due to upwelling of
the WSDW plays a major role in triggering the open-
ocean polynya. There are increases in the ice–ocean salt
flux along the Weddell Sea coastline (Figs. 10i–l) that
are due to an increase in the formation of coastal po-
lynyas. While coastal polynyas are in general controlled
by local offshore katabatic winds that push newly formed
FIG. 11. Changes in the winter-mean (a)–(f) sea ice bottom surfacemelting energy and (g)–(l) ice–ocean salt flux over
the same time period as Fig. 8.
708 JOURNAL OF PHYS ICAL OCEANOGRAPHY VOLUME 44

sea ice constantly away from the coastline, in this ex-
periment the offshore sea ice drift anomalies play a role,
though they are much weaker than the sea ice drift
anomalies in the central Weddell Sea. Although impor-
tant in increasing dense water formation and thus to en-
hancing near-boundary convection, these events are not
the focus of our study.
d. Differences between the first and second polynya
Together with Fig. 7, sea ice–ocean interactions oc-
curring in the Weddell Sea for the whole integration
period of SW20 are summarized in Fig. 12, showing the
time series of the areal-mean, winter-mean SST, AOW
at the second layer (15-m depth), and sea ice concen-
tration in the region where the simulated Weddell Po-
lynyas occur, and in Fig. 13, showing vertical profiles of
winter-mean potential temperature and salinity aver-
aged over the same area for selected years. The processes
associated with the first-occurring Weddell Polynya are
those described above: 1) coldwater at the surface layer is
replaced with relatively warm water from the deeper
layer via upwelling enhanced by SW20, 2) surface water
under the sea ice becomeswarmenough tomelt sea ice or
to prevent its new formation, and 3) sea ice concentration
suddenly drops, generating the Weddell Polynya and
triggering oceanic deep convection. The surface water
becomes warmer in association with the entrained warm
deep water and becomes saltier in association with the
increased new sea ice formation, while the deep water
becomes colder and fresher because the relatively warm
and salty deep water masses are mixed with the cold and
fresh surface water masses, eventually enhancing in-
stability of the whole water column.
The second-occurring Weddell Polynya is, as illus-
trated in Figs. 5 and 12, much smaller and persists shorter
than the first polynya. The intensity of upwelling is also
much smaller than before and so is the SST increase rate.
The processes associated with the second event are
slightly different from those of the first event described
above. The upwelling ceases between years 8 and 10,
gets its strength back very gradually by year 14, in ear-
nest restarts from year 15, and reaches its second peak at
year 18. As previously discussed with Fig. 9, for the first
Weddell Polynya upwelling is gradually intensified until
year 4 along with theWeddell gyre beginning to spin up,
reaches its peak at year 5 when the open-ocean polynya
triggers the oceanic deep convection, and begins to get
weakened from year 6 with the intensification of con-
vection. Similar processes operate for the generation of
the secondWeddell Polynya. The Weddell gyre weakens
between years 8 and 10, oscillates until year 14, and be-
gins to be intensified from year 15 (see Fig. 7). Between
years 15 and 18, surface water sinking is weakened (black
line with triangles in Fig. 7), and the upwelling starts to
recover its strength (red line with triangles in Fig. 12). As
indicated by comparison between vertical profiles of po-
tential temperature in years 14 and 18 in Fig. 13, during
this period the surface water again becomes warmer be-
cause of recovered upwelling, and the deep water also
becomes warmer because of reduced sinking of cold
surface water. At year 19, which is 1 year after the up-
welling reaches its second peak, the gyre shows a sub-
stantial spinup (black line with circles in Fig. 7) and the
SST in the central Weddell Sea reaches its second peak
(black line with circles in Fig. 12), triggering the second
polynya near 688S, 158W (Fig. 5 and green line with
squares in Fig. 12). Consequently, the convection re-
gains its strength (black line with triangles in Fig. 7) and
begins to suppress the upwelling (red line with triangles
in Fig. 12). In comparison with the first event, the deep
FIG. 12. Time series of winter-mean sea surface temperature anomaly (black line with circle), AOW at the second
layer (red line with triangle), and sea ice concentration (green line with square), averaged between 758 and 658S and
between 408 and 108W, during the whole period of the SW20 integration. The purple (blue) line is indicative of the
time when the first (second) Weddell Polynya occurs.
FEBRUARY 2014 CHEON ET AL . 709

water is much colder [see the vertical profile of potential
temperature in year 14 (Fig. 13) just before the second
upwelling in earnest restarts] because extremely cold
surface water keeps sinking to the bottom via open-
ocean deep convection until this time. This explains why
the second peak of SST is smaller than the first and why
the second-occurring Weddell Polynya is much smaller
and persists shorter than the first. At year 22, the second
polynya is entirely closed (Fig. 5), leading to weakening
of open-ocean deep convection (Fig. 7).
Vertical profiles of potential temperature in years 14,
18, 20, and 24 (Fig. 13) reveal an oscillatory mode as-
sociated with open-ocean polynya formation and decay,
which is in line with the study of Goosse and Fichefet
(2001). Although this oscillatory mode significantly de-
creases in magnitude after the second Weddell Polynya
event ceases, it weakly continues until about year 70 of
SW20 (not shown here). The vertical profile of salinity
reveals a similar pattern too. At the end of the SW20
model integration, the WSDW reaches its equilibrium
state (black dashed lines in Fig. 13).
4. Summary and conclusions
A small step up in the intensity of SH westerlies
produces a realistic simulation of the Weddell Polynya
FIG. 13. Vertical profiles of winter-mean (a) potential temperature and (b) salinity, averaged
between 758 and 658S and between 408 and 108W for the designated years. The black dashed
lines are indicative of those averaged over years 81–100 of the SW20 simulation.
710 JOURNAL OF PHYS ICAL OCEANOGRAPHY VOLUME 44
observed between 1974 and 1976. During the first quarter
of the 100-yr SW20 simulation, a polynya occurs twice in
the central Weddell Sea, leading to open-ocean deep
convection, while during the remaining period it never
occurs again. Intensification of the SH westerlies in-
creases not only upwelling of CDWbut also theWeddell
gyre, causing relatively warm WSDW to rise up to the
surface in the central Weddell Sea. This appears to play
a crucial role in triggering these open-ocean polynya and
convection events. The two Weddell Polynya events
occur in slightly different locations: the first in the vi-
cinity of 688S, 388W, which is slightly southwest of the
observed polynya during the 1970s, and the second near
the observed one. The secondWeddell Polynya is smaller
and persists for less time than the first one because up-
welling is weaker and the underlying WSDW is colder
than when the first occurs.
As discussed in section 3, the relatively low sea ice
concentration in the simulated centralWeddell Sea does
not have a significant influence on the discussion hith-
erto because the simulated open-ocean polynyas are
triggered mainly by thermodynamic processes associ-
ated with surface warming that affects sea ice regardless
of its concentration and thickness, not by dynamics as-
sociated with anomalous divergent drift of sea ice that
mainly affects less concentrated and thin sea ice. We
expect the result would be unchanged even if the sim-
ulated sea ice in the central Weddell Sea was highly
concentrated and thick. What determines the location
where an open-ocean polynya occurs is dependent on the
location where the WSDW mass rises up to the surface,
which in turn depends on the inherent capability of the
ocean GCM used in the study, such as how accurately the
Weddell gyre is reproduced and how well the bottom to-
pography is resolved. Moreover, in order to reproduce the
1970s Weddell Polynya by use of the model, we should
consider how much the effective atmosphere–ocean salt
flux increases during the prolonged negative phase of the
SAMand how the SOwinds actually change at the period.
The role of Maud Rise also helps focus the polynya loca-
tion (Ou 1991; Alverson and Owens 1996; Holland 2001).
Even in a relatively short integration time, major
ocean flows in the SO reveal their trends clearly. SO
overturning is intensified in association with convection
events occurring in the SO, leading to an increase in Ant-
arctic Bottom Water (AABW) formation, and Deacon
overturning is significantly intensified in associationwith the
enhanced northward Ekman transport below the SH
westerlies. Because of the activated SO sea ice–ocean in-
teractions, deep water to the south of the ACC becomes
much denser than that to the north of the ACC (not shown
here), significantly increasing the Drake Passage Through-
flow, that is, the volume transport ofACC, by about 20% to
223.7Sv in the latter half of the SW20 experiment. When
open-ocean polynyas exist and open-ocean convection is
most pronounced, the strength of the ACC reaches a max-
imum of 245.5Sv. Because the 100-yr integration time of
SW20 is too short to evaluate changes associated with the
Atlantic MOC, we do not discuss it in this study.
The slight intensification of SHwesterlies in the SW20
experiment appeared to play a critical role in triggering
the Weddell Polynya and open-ocean deep convection.
It should be accompanied by the Weddell Sea adjusting
to the relatively weak SH westerlies during the pro-
longed negative phase of the SAM between 1954 and
1974. As previously discussed in connection with Fig. 1,
the effective atmosphere–ocean salt flux due to drier-than-
normal atmospheric conditions, proposed byGordon et al.
(2007), will also play an important role in generating
preconditions for Weddell Polynyas during the pro-
longed negative SAM period. The results of SW20 dis-
cussed in this study not only satisfy the hypothesis of
Gordon et al. (2007) but also provide another clue ex-
plaining why a persisting Weddell Polynya has not oc-
curred since the 1970s: there has not been a period to
satisfy the prolonged negative phase of SAM followed
by a sharp increase in SH westerlies since that time.
The long-term response of the global ocean circulation
to SW20 will be investigated in detail in a future paper.
Moreover, further studies are necessary to assess the
response of the SO sea ice–ocean system to a more re-
alistic change in the SH westerlies, for example, SH
westerlies gradually oscillating between strengthening
and weakening and between pole- and equatorward shifts
or to actual wind stress data from a data assimilation
model.
Acknowledgments. The authors thank the editor and
two anonymous reviewers for their critical and constructive
comments and suggestions that helped us greatly. This
research has been sponsored by the Project 311776-
912221201 administrated by the Korean Agency for
Defense Development and by the National Research
Foundation of Korea Grant funded by the Korean Gov-
ernment (MEST) (NRF-2009-C1AAA001-2009-0093042)
KIOST Project PE 98991.
REFERENCES
Alverson, K., and W. B. Owens, 1996: Topographic precondition-
ing of open-ocean deep convection. J. Phys. Oceanogr., 26,
2196–2213.
Anderson, J. L., and Coauthors, 2004: The new GFDL global at-
mosphere and land model AM2–LM2: Evaluation with pre-
scribed SST simulations. J. Climate, 17, 4641–4673.
Antonov, J. I., R. A. Locarnini, T. P. Boyer, A. V. Mishonov, and
H. E. Garcia, 2006: Salinity. Vol. 2, World Ocean Atlas 2005,
NOAA Atlas NESDIS 62, 182 pp.
FEBRUARY 2014 CHEON ET AL . 711

Brix, H., and R. Gerdes, 2003: North Atlantic Deep Water and
Antarctic Bottom Water: Their interaction and influence on
the variability of the global ocean circulation. J. Geophys.
Res., 108, 3022, doi:10.1029/2002JC001335.
Bryan, K., and L. J. Lewis, 1979: A water mass model of the world
ocean. J. Geophys. Res., 84 (C5), 2503–2517.
Cai, W., and P. Baines, 1996: Interactions between thermohaline-
and wind-driven circulations and their relevance to the dynamics
of the Antarctic Circumpolar Current, in a coarse-resolution
global ocean circulation model. J. Geophys. Res., 101 (C6),
14 073–14 093.
Carsey, F. D., 1980: Microwave observations of the Weddell
Polynya. Mon. Wea. Rev., 108, 2032–2044.
Cunningham, S. A., S. G. Alderson, B. A. King, andM. A. Brandon,
2003: Transport and variability of the Antarctic Circumpolar
Current in Drake Passage. J. Geophys. Res., 108, 8084,
doi:10.1029/2001JC001147.
DeBoer, A.M., J. R. Toggweiler, andD.M. Sigman, 2008: Atlantic
dominance of the meridional overturning circulation. J. Phys.
Oceanogr., 38, 435–450.Dong, S., S. L. Garzoli, M. O. Baringer, C. S. Meinen, and G. J.
Goni, 2009: Interannual variations in the Atlantic meridional
overturning circulation and its relationship with the net north-
ward heat transport in the South Atlantic. Geophys. Res. Lett.,
36, L20606, doi:10.1029/2009GL039356.
England, M. H., 1993: Representing the global-scale water masses
in ocean general circulation models. J. Phys. Oceanogr., 23,
1523–1552.
Fichefet, T., B. Tartinville, and H. Goose, 2003: Antarctic sea ice
variability during 1958–1999: A simulation with a global
ice–ocean model. J. Geophys. Res., 108, 3102, doi:10.1029/
2001JC001148.
Ganachaud, A., and C. Wunsch, 2000: Improved estimates of
global ocean circulation, heat transport and mixing from hy-
drographic data. Nature, 408, 453–457.
Gent, P. R., and J. C. McWilliams, 1990: Isopycnal mixing in ocean
circulation models. J. Phys. Oceanogr., 20, 150–155.
——, W. G. Large, and F. O. Bryan, 2001: What sets the mean
transport through Drake Passage? J. Geophys. Res., 106 (C2),
2693–2712.
Gerdes, R., W. Hurlin, and S. M. Griffies, 2005: Sensitivity of
a global ocean model to increased run-off from Greenland.
Ocean Modell., 12, 416–435.
Gnanadesikan, A., and R. W. Hallberg, 2000: On the relationship
of the circumpolar current to Southern Hemisphere winds in
coarse-resolution models. J. Phys. Oceanogr., 30, 2013–2034.Gong, D., and S. Wang, 1999: Definition of Antarctic Oscillation
index. Geophys. Res. Lett., 26, 459–462.
Goosse,H., andT. Fichefet, 2001:Open-ocean convection and polynya
formation in a large-scale ice–ocean model. Tellus, 53A, 94–111.Gordon, A. L., 1982:Weddell DeepWater variability. J. Mar. Res.,
40, 199–217.
——, 1991: Two stable modes of Southern Ocean winter stratifi-
cation. Deep Convection and Deep Water Formation in the
Oceans, P. C. Chu and J. C. Gascard, Eds., Elsevier Ocean-
ography Series, Vol. 57, Elsevier, 17–35.
——, and B. A. Huber, 1984: Thermohaline stratification below the
Southern Ocean sea ice. J. Geophys. Res., 89 (C1), 641–648.
——, and J. C. Comiso, 1988: Polynyas in the Southern Ocean. Sci.
Amer., 256, 90–97.——, M. Visbeck, and J. C. Comiso, 2007: A possible link between
the Weddell Polynya and the southern annular mode. J. Cli-
mate, 20, 2558–2571.
Griffies, S. M., M. J. Harrison, R. C. Pacanowski, and A. Rosati,
2004: A technical guide toMOM4.GFDLOceanGroup Tech.
Rep. 5, 295 pp.
Hallberg, R., and A. Gnanadesikan, 2006: The role of eddies in
determining the structure and response of the wind-driven
Southern Hemisphere overturning: Results from the Model-
ing Eddies in the Southern Ocean (MESO) project. J. Phys.
Oceanogr., 36, 2232–2252.
Hibler, W. D., III, 1979: A dynamic thermodynamic sea ice model.
J. Phys. Oceanogr., 9, 815–846.Holland, D. M., 2001: Transient sea-ice polynya forced by oceanic
flow variability. Prog. Oceanogr., 28, 403–460.
Killworth, P. D., 1979: On ‘‘chimney’’ formation in the ocean.
J. Phys. Oceanogr., 9, 531–554.
——, 1983: Deep convection in the world ocean.Rev. Geophys., 21,
1–26.
Kuhlbrodt, T., R. S. Smith, Z. Wang, and J. M. Gregory, 2012: The
influence of eddy parameterizations on the transport of the
Antarctic Circumpolar Current in coupled climate models.
Ocean Modell., 52-53, 1–8.Large, W. G., J. C. McWilliams, and S. C. Doney, 1994: Oceanic
vertical mixing: A review and a model with a verticalK-profile
boundary layer parameterization. Rev. Geophys., 32, 363–403.
Lee, S.-K., W. Park, E. van Sebille, M. O. Baringer, C. Wang, D. B.
Enfield, S. Yeager, and B. P. Kirtman, 2011: What caused the
significant increase in Atlantic Ocean heat content since the
mid-20th century?Geophys. Res. Lett., 38, L17607, doi:10.1029/
2011GL048856.
Levitus, S., 1982: Climatological Atlas of the World Ocean.NOAA
Prof. Paper 13, 173 pp. and 17 microfiche.
Locarnini, R. A., A. V. Mishonov, J. I. Antonov, T. P. Boyer, and
H. E. Garcia, 2006: Temperature. Vol. 1, World Ocean Atlas
2005, NOAA Atlas NESDIS 61, 182 pp.
Maksym, T., and T. Markus, 2008: Antarctic sea ice thickness and
snow-to-ice conversion from atmospheric reanalysis and pas-
sive microwave snow depth. J. Geophys. Res., 113, C02S12,
doi:10.1029/2006JC004085.
Martin, T., W. Park, and M. Latif, 2012: Multi-centennial vari-
ability controlled by Southern Ocean convection in the Kiel
Climate Model. Climate Dyn., 40, 2005–2022, doi:10.1007/
s00382-012-1586-7.
Martinson, D. G., P. D. Killworth, and A. L. Gordon, 1981: A
convective model for the Weddell Polynya. J. Phys. Ocean-
ogr., 11, 466–488.
McDermott, D. A., 1996: The regulation of northern overturning by
SouthernHemispherewinds. J. Phys.Oceanogr., 26, 1234–1255.
Murray, R. J., 1996: Explicit generation of orthogonal grids for
ocean models. J. Comput. Phys., 126, 251–273.
Oke, P., andM. England, 2004: Oceanic response to changes in the
latitude of the Southern Hemisphere subpolar westerly winds.
J. Climate, 17, 1040–1054.
Orsi, A. H., W. D. Nowlin, and T. Whitworth III, 1993: On the
circulation and stratification of the Weddell gyre. Deep-Sea
Res., 40, 169–203.
——, T.Whitworth III, andW. D. Nowlin, 1995: On themeridional
extent and fronts of theAntarctic Circumpolar Current.Deep-
Sea Res., 42, 641–673.
Ou, H. W., 1991: Some effects of a seamount on oceanic flows.
J. Phys. Oceanogr., 21, 1835–1845.Parkinson, C. L., and J. C. Comiso, 2008: Antarctic sea ice pa-
rameters from AMSR-E data using two techniques and com-
parisons with sea ice from SSM/I. J. Geophys. Res., 113,
C02S06, doi:10.1029/2007JC004253.
712 JOURNAL OF PHYS ICAL OCEANOGRAPHY VOLUME 44
Rahmstorf, S., 1993: A fast and complete convection scheme for
ocean models. Ocean Modell., 101, 9–11.
——, and M. H. England, 1997: Influence of Southern Hemisphere
winds on North Atlantic DeepWater flow. J. Phys. Oceanogr.,
27, 2040–2054.
Smith, W. H. F., and D. T. Sandwell, 1997: Global seafloor to-
pography from satellite altimetry and ship depth soundings.
Science, 277, 1957–1962.
Solomon, S., D. Qin, M. Manning, Z. Chen, M. Marquis, K. B.
Averyt, M. Tignor, and H. L. Miller Jr., Eds., 2007: Climate
Change 2007: The Physical Science Basis. Cambridge Uni-
versity Press, 996 pp.
St€ossel, A., 2008: Employing satellite-derived sea ice concentration
to constrain upper-ocean temperature in a global oceanGCM.
J. Climate, 21, 4498–4513.
Swart, N. C., and J. C. Fyfe, 2012: Observed and simulated changes
in the Southern Hemisphere surface westerly wind-stress.
Geophys. Res. Lett., 39, L16711, doi:10.1029/2012GL052810.
Thompson,D.W. J., and J.M.Wallace, 2000:Annularmodes in the
extratropical circulation. Part I: Month-to-month variability.
J. Climate, 13, 1000–1016.
Toggweiler, J. R., and B. Samuels, 1993: Is the magnitude of the
deep outflow from the Atlantic Ocean actually governed by
Southern Hemisphere winds? The Global Carbon Cycle,
M. Heimann, Ed., Springer, 303–331.
——, and ——, 1995: Effects of Drake Passage on the global
thermohaline circulation. Deep-Sea Res., 42, 477–500.
Wadhams, P., 2000: Ice in the Ocean. Gordon and Breach Science
Publishers, 364 pp.
Whitworth, T., III, W. D. Nowlin, and S. J. Worley, 1982: The net
transport of the Antarctic Circumpolar Current through
Drake Passage. J. Phys. Oceanogr., 12, 960–971.
Winton, M., 2000: A reformulated three-layer sea ice model.
J. Atmos. Oceanic Technol., 17, 525–531.
Zwally, H. J., and P. Gloersen, 1977: Passive microwave images of
the polar regions and research applications. Polar Rec., 18,
431–450.
FEBRUARY 2014 CHEON ET AL . 713


![Flux Modelling of Polynyas - University of Reading of Figures 1.1 Schematic of Sensible Heat polynya and Latent Heat polynya [16] 1 2.1 One Dimensional model diagram, adapted from](https://img.pdfslide.us/doc/110x75/5ab1681d7f8b9a6b468c7c20/flux-modelling-of-polynyas-university-of-reading-of-figures-11-schematic-of-sensible.jpg)