Embed Size (px)
Citation preview
C.Rathsack
The Relationship of Personality Type to
Student Attitudes Towards Computers
By:
Carrie Rathsack
Master’s Thesis
Bowling Green State University
1998
2
C.Rathsack
The Relationship of Personality Type to Student Attitudes Towards Computers
Abstract
The educational setting has become ever-increasingly inundated with new technologies that
assist students and teachers with the learning process. Primarily, the introduction of personal computers
into mainstream society brought immediate applications for educational settings. But for many students
and parents the transition from traditional education practices to the use of computers as an educational
tool is difficult. In order to foster positive learning experiences for students that can transfer into life-long
learning, identification of positive attitudes toward computers, as well as the predictors of such attitudes,
are essential. In order to determine if such a relationship existed, personality types and computer attitude
scores were collected from 532 high school students in Northwest Ohio. Of these results, 478 fell into
one of the 16 Myers-Briggs personality type categories. All were examined to determine if any
relationship existed between personality type and their attitude toward computers. Significantly higher
differences in mean Total Computer Attitude Scale scores were identified for: Extroverts (compared to
Introverts), Judging (compared to Perceiving) individuals, students with a computer at home, and
students whose parent(s) use a computer. All significant differences were found to be so, even when the
extraneous variables (gender, home computer availability, parental computer use, years of computer
experience, and age) were taken into consideration. No significant differences in mean scores could be
attributed to gender, Sensing vs. Intuitive, or Thinking vs. Feeling individuals. Lastly, regarding age of the
student, with each year, the mean Total CAS score decreased by 2.61 out of 120 possible, whereas
years of computer experience had an increasing effect of 6.81 for each additional year of experience.
3
C.Rathsack
Introduction
The educational setting has become ever-increasingly inundated with new technologies that
assist students and teachers with the learning process. Primarily, the introduction of personal computers
into mainstream society brought immediate applications for educational settings. Students and teachers
alike could use the computer as a tool for learning and teaching. More precisely, computers have
become the means by which many students choose to learn and teachers choose to enhance learning;
allowing each group the opportunity to explore, create, communicate, and present their discoveries to
others in ways never before possible. Ideally, once mastered, it is hoped that these skills can become a
foundation for students as they make the gradual transition from the schooling experience to occupational
and societal roles.
But the computer-assisted educational journey is not the same for all students. Just as all
students have different learning styles and personalities, the range of student attitudes toward computers
is just as diverse. The bottom line is that not all students feel comfortable using computers. For some
students, simply being around a computer may cause extreme anxiety (Loyd & Gressard, 1984).
Therefore, it becomes critical to identify any and all factors that may lead to a negative attitude
towards computers, so that actions to improve attitudes can precede such opposing factors. Without
these early predictors, allowing for the intervention of positive computer experiences, students’ negative
attitudes are left to smolder, slowly crystallizing into a belief that they are not capable of working with
computers (Shashaani, 1997). Finding a predictor of negative attitudes toward computers would assist
researchers, teachers, and parents in identifying and possibly preventing the solidification of negative
attitudes by implementing a variety of positive computer experiences (Shashaani, 1997; Loyd & Gressard,
1984; Woodrow, 1991).
Rationale & Purpose of the Study
Since the mid 1950s, researchers have been using personality tests to make a myriad of
connections between an individual’s personality type and personal attributes such as occupation, gender,
and achievement (Myers & McCaulley, 1985; Myers & Myers, 1980). A comparable trend of research
began along with the innovation of personal computers in the mid 1980s to examine the relationships
4
C.Rathsack
between similar types of personal attributes and students’ attitudes toward computers (Loyd & Gressard,
1984; Marshall & Bannon, 1986). Both types of research have uncovered a diverse array of possible
relationships, as well as several specific predictors.
Unfortunately, these two paths of research have rarely merged, leaving the realm of how
personality type affects students’ attitudes toward computers generally undiscovered. In addition, the
factors that researchers have focused upon as possible predictors of positive or negative attitudes toward
computers are usually limited to demographic information or computer-related experiences (Anderson,
1987; Loyd & Gressard, 1984; Marshall & Bannon, 1986; Gardner, Dukes, & Discenza, 1993; Shashaani,
1997; Woodrow, 1991). With such a diversity among students in any educational setting, examining
factors that display each individual’s unique characteristics, such as his or her personality type rather than
basic demographics, appears to be essential.
As researchers and educators continue to develop more meaningful uses for computers in the
classroom, the reliance on computers as part of the educational setting will also increase, making the
experiential gap even larger between students who enjoy utilizing a computer’s potential and students
who do not. Therefore, early identification of individuals who may need additional positive experiences
early and often becomes critical, so that they can successfully make the transition into our expanding
technological world.
The purpose of this study was to determine if a student’s personality type influences his or her
attitude towards computers. At the beginning of the school year, high school students were given the
Keirsey Temperament Sorter to assess their personality type. The Keirsey Temperament Sorter is
comparable to the Myers-Briggs Type Indicator, both categorizing individuals into one or more of 16
possible personality types.
Students’ attitudes toward computers were determined using the 30-item Computer Attitude
Scale (CAS). The Computer Attitude Scale (CAS) uses a 4-point Likert scale to identify attitudes in three
areas or subsections: computer anxiety, computer confidence, and computer liking. The scores from the
three areas were combined to give the researcher an overall representation of each student’s “total”
attitude towards computers. Minimum and maximum scores for each subsection are 10 and 40, and the
5
C.Rathsack
Total CAS score ranges from 30 to 120, a higher score indicating a more positive attitude toward
computers.
The results from both inventories were compared to determine if positive or negative attitudes
toward computers could be linked to one or more of the 16 personality types. Extraneous variables such
as age, gender, computer experience, home computer availability, and parental computer use were also
identified and examined. The demographic information was contributed by students in a section added to
the beginning of the Keirsey Temperament Sorter.
This study sought to examine the following null hypotheses:
1) There are no significant differences between mean Total, Attitude, Confidence, and Liking CAS
scores of the 16 personality types.
2) There are no significant differences between mean Total CAS scores of Extroverted and
Introverted, Sensing and Intuitive, Thinking and Feeling, and Judging and Perceiving types.
3) There are no significant differences between mean Total CAS scores and gender, home
computer availability, parent/guardian computer usage, years of computer experience, and age.
Review of the Research
Over the past decade, numerous researchers have sought to determine the nature of students’
attitudes about computers in their lives. Throughout this research there are common findings that
perpetually reoccur, such as the positive effect of computer experience on attitudes (Loyd & Gressard,
1984; Shashaani, 1997). But there are other findings that differ from one study to the next, gender
differences being the most diametric (Anderson, 1987; Loyd & Gressard, 1984; Shashaani, 1997).
Several of these studies also include the assessment of teachers’ attitudes to determine the effect that
age may have on attitudes towards computers (Katz & Francis, 1995; Marshall & Bannon, 1986). The
instrumentation used in these studies varies, but the type used most often was the Computer Attitude
Scale (CAS), which separates attitudes into three categories: anxiety, confidence, and liking, as well as
providing an overall total attitude toward computers score.
6
C.Rathsack
In regard to personality studies, the Myers-Briggs Type Indicator (MBTI) has been used by
researchers, psychologists, corporations, and schools to determine individuals’ traits primarily for the
purposes of self-awareness and successful grouping. The enormous amount of data collected on
individuals over the last forty years has led to the creation of a database that can be sorted through to
determine common personality traits based on given demographics such as age, gender, and occupation.
Another instrument that measures the same sixteen personality types as the Myers-Briggs Type
Indicator (MBTI) is the Keirsey Temperament Sorter. This is often used by the general public since the
Myers-Briggs can only be administered by licensed clinicians or during officially endorsed workshops.
Like the MBTI, the Keirsey Temperament Sorter can be used for self-awareness and teaming, as well as
for interpersonal compatibility awareness.
In order to understand the direction chosen for this research, it is necessary to examine
comparable research on personality and attitudes towards computers. For this study, three major topics
were reviewed: (a) personality and temperament instrumentation, (b) instruments measuring attitudes
towards computers, and (c) student attitudes towards computers.
Personality and Temperament Instrumentation
The Myers-Briggs Type Indicator (MBTI) was developed in the early 1940s to determine an
individual’s specific type of personality, reflecting his or her preference towards extroversion or
introversion, sensing or intuition, thinking or feeling, and judging or perceiving. Since this time, the MBTI
has been used by schools, clinicians, and corporations to foster self and group awareness (Myers &
Myers, 1980).
The MBTI is primarily intended for adults, but can be used to determine the personality types of
high school students as well (Myers & McCaulley, 1985). When administering this type of instrument to
young adults, Myers & McCaulley suggest it is imperative to stress that this indicator is only a suggestion
of a personality type. Ultimately, determining one’s personality type is the responsibility of the participant
(Myers & McCaulley, 1985).
One of the original high school samples that Myers obtained was of 3,503 male and 2,511 female
college preparatory students from twenty-seven Pennsylvania high schools. The MBTI types were
identified in respect to intelligence scores and grade point averages with a correlation of (.47). The
7
C.Rathsack
results show that almost all “J” types (judging) fall above the line, while most “P” types (perceiving) are
below. These results coincide with the view of J types tending to be the overachievers, whereas the P
types underachieve, based on their expected levels of aptitude. The types that seem to bolster academic
success are the I, N, and J types (introverted, intuitive, and judging). Closer to the mean are the EN
(extroverted-intuitive) types, possibly because in addition to academic pursuits, they require
extracurricular activities to foster their needs for either dominance or affiliation. Myers & McCaulley
hypothesized that the reason why the ES (extroverted-sensing) types fall below the mean when
comparing grades and IQ is because of their interest in learning from “real-life” situations, which is often
lacking in traditional education. This comparison does not suggest that the ES types are less intelligent
than their IN type peers, but rather that they learn in a way that is not often accurately measured in school
(Myers & McCaulley, 1985).
With relation to students’ preferences towards a particular school subject area, the sensing types
(S) preferred practical skills while no intuitive types (N) chose such skills. In addition, mathematics was
favored by the ST (sensing-thinking) types and science was favored by NT (intuitive-thinking) types. The
NF (intuitive-feeling) types had a preference toward the humanities, possibly due to their interest in
communication. The extroverted, sensing, perceiving types, ESTP and ESFP, who tend to learn best
from real-life experiences, surprisingly chose history as their favorite subject. Myers and McCaulley
(1985) theorized that this may be due to their ability to become enveloped in the stories of the past,
thereby making the subject more realistic to them.
The overall distribution of personality types among 4,033 male high school students from a study
performed in the spring of 1957 show the largest differences between sensing and intuitive types. Of the
non-college prep males, only 14.5% were intuitive, compared to 38.0% of the college prep group. The
other types were not significantly different. This shows the need of S (sensing) types to have “real-life”
learning experiences, rather than continue with traditional schooling (Myers & Myers, 1980).
For the 4,039 female high school students, there was a similar representation of sensing types
among the non-college prep students as there were in the males, at 87.3%, compared to the males at
85.5%. For both college and non-college prep females, there was a tendency towards feeling types over
thinking, about 68%, compared to males who displayed only about 39% feeling. These differences in
8
C.Rathsack
gender make it imperative to represent results separately, otherwise both genders will be misrepresented
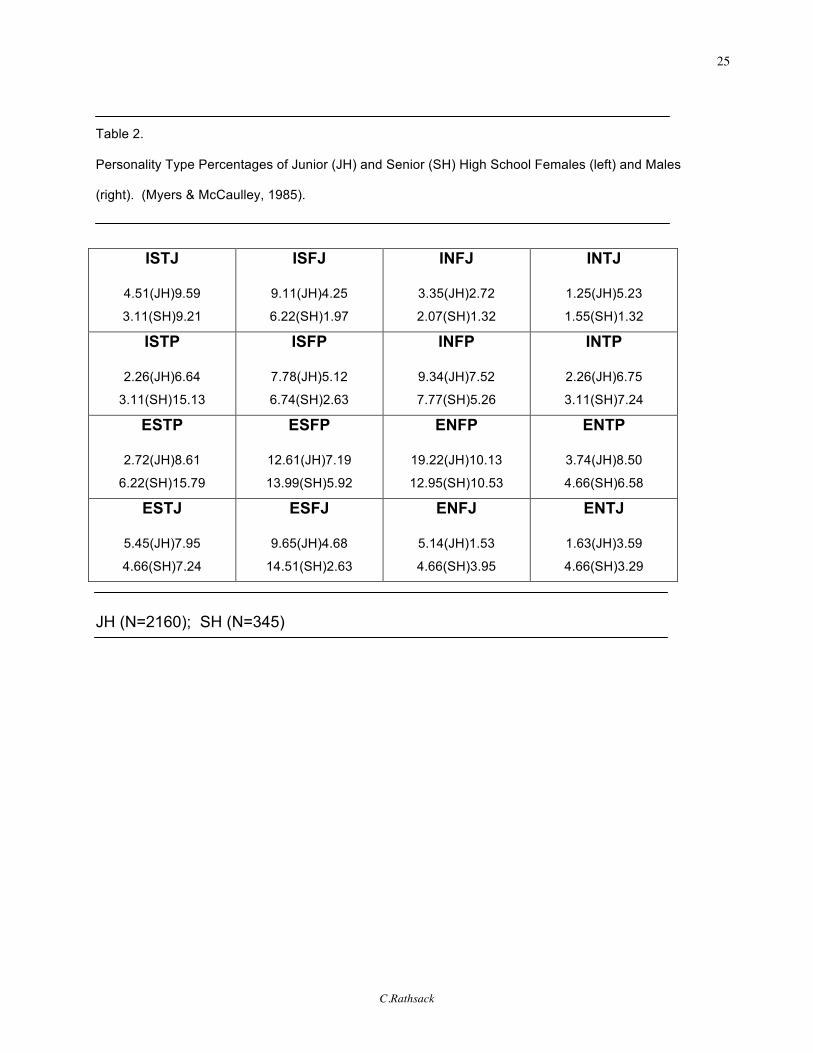
(Myers & Myers, 1980). Table 2 shows the personality type distribution of junior high & high school males
and females.
Anderson (1987) investigated relationships between a student’s attitude toward computers and
his or her personality characteristics. The study categorized 87 male and female college students into
one of four personality categories, based on the Myers-Briggs, consisting of: Introversion, Intuition,
Judging, and Thinking. The students’ attitudes toward computers was assessed using the Computer
Technology Attitude Survey. Pearson correlation coefficients were calculated, showing a significance
between attitude and gender, age, and computer use. More specifically, males, older respondents, and
those that had more computer use time expressed more positive attitudes toward computers. No
significance was found for any of the four personality characteristics.
A second study that, in part, attempted to find a correlation between personality and computer
attitudes was done by Katz and Francis (1995) on 190 female trainee (preservice) teachers in Israel. The
instrumentation included a 15-item Computer Attitudes Questionnaire and the 90-item Eysenck
Personality Questionnaire. The personality questionnaire divided the respondents into three categories,
based on high scores: Extroversion, characterized as sociable, lively, assertive, and venturesome;
Neuroticism, which typifies an anxious, tense, shy, emotional individual with low self-esteem; and finally,
Psychoticism, portraying a cold, impersonal, odd, impulsive individual who lacks insight and often craves
for change. Low scores in the areas of Extroversion and Neuroticism represent individuals who
are opposite of the descriptors, but a low score in the category of Psychoticism represents an empathetic,
unselfish, peaceful, less decisive individual.
The findings show that there appears to be no relationship between extroversion or neuroticism
and computer attitudes, neither positively nor negatively. However, Katz and Francis (1995) did find a
negative association between psychoticism and positive computer attitudes. In other words, the more
positive the attitude towards computers, the less likely the individual is to have a Psychoticistic
personality, characterized by appearing cold, impersonal, odd, and impulsive. In addition, there was a
positive relationship between age and attitude toward CAI (computer-assisted instruction), demonstrating
9
C.Rathsack
as one gets older, the more positive their attitudes will be towards computers assisting them in their
learning.
Instruments Measuring Attitudes Towards Computers
In order to direct student learning towards the future, computer-based or computer-assisted
learning must be examined. Although computers may be interpreted by many students as a welcome
change from the more traditional classroom setting, a section of the population continues to view the
computer as an obstacle, interfering with their learning (Gardner, Dukes, & Discenza, 1993).
Some of the initial research conducted on student attitudes attempted to measure three qualifying
circumstances or behaviors that might contribute to a positive or negative attitude, including gender, age,
and computer experience. Loyd and Gressard (1984) created the Computer Attitude Scale (CAS) to
measure attitudes of on three different subscales: computer anxiety, computer confidence, and computer
liking. In order to test the reliability and validity of this instrument, a study of 155 eighth through twelfth
grade students was conducted. Students ranging in age from 13 to 18 were selected from a large school
district’s computer-based education program. Of the 155 participants, 104 were female, and 51 were
male.
The three sections of the 30-item Computer Attitude Scale (CAS) were administered by
classroom teachers, and responses were coded so that higher scores indicated a more positive attitude
towards computers. Therefore, the coding of items for the computer anxiety section had to be reversed,
so a high score showed low anxiety. Means, standard deviations, estimates of internal consistency, and
correlations among the three subscales were calculated. The results showed each subsection:
Computer Anxiety, Computer Liking, Computer Confidence are consistent enough to be used
independently. Since the CAS consists of only 30 items, it is relatively easy to administer and due to its
the high degree of common variance among all three sections, scores can be combined to create an
overall (Total) computer attitude score.
In addition to the CAS, other instruments that measure attitudes towards computers have been
developed and tested. Woodrow (1991) compared the results from four different computer attitude
scales, primarily measuring an individual’s levels of: Computer Anxiety, Computer Liking, and Social and
Educational Impact of Computers. The four scales were evaluated based on their validity and reliability,
10
C.Rathsack
as well as their efficiency and convenience. The findings were also correlated with age, gender,
computer experience, and computer literacy and achievement.
The subjects of this study were 98 pre-service teachers (61 female, 37 male) enrolled in an
elective one-semester introductory computer course. They completed a comprehensive questionnaire
that combined questions from all four computer attitude scales. Items were presented on a 5-point Likert
scale, typical of all original scales except the Computer Attitude Scale, which usually only has a 4-point
Likert scale. A more positive attitude towards computers was determined by a high score from the coded
Likert-scale items. Data analysis included the means, standard deviations, and the reliability coefficients.
Since the individual scores from each scale varies, means were recomputed using a scales of 10 to 50,
giving an overall score for attitudes towards computers.
The results showed that this sample of individuals had positive attitudes towards computers, as
expected since they chose this course as an elective. This evidence alone shows that the instruments do
measure attitudes towards computers. The most reliable, at (.94), was the Computer Attitude Scale,
which also showed consistency between two administrations. The CAS was found to most accurately
measure attitudes from the affective and behavioral domains, but not the cognitive domain. Similarly, the
Attitudes Towards Computers scale was found to be reliable and valid, and it also neglected to measure
any constructs of the cognitive domain. The third scale, Computer Survey, correlates with the other
scales, but its reliability was low. The Computer Use Questionnaire showed a low correlation between
the other three scales, which can be attributed to its unique focus on the cognitive attitude domain.
Limitations of the study were identified as: low sample number, high female sample proportion,
sample occupation, and computer experience of the respondents. Suggestions were made to broaden
the administration of the combined instrument to a larger, more representative sample, which in theory,
should lower the mean scores on all attitude scales.
Student Attitudes Towards Computers
Measuring students’ attitudes towards computers can be performed using a number of valid and
reliable instruments, but uncertainty often arises when choosing which one to use. The differences in
these instruments may result in the variations of findings that are summarized here.
11
C.Rathsack
Some of the initial research in the area of student attitudes towards computers was completed by
Loyd and Gressard (1984). After creating the valid and reliable Computer Attitude Scale to measure
computer anxiety, confidence, and liking, the researchers conducted a study to determine the effects that
gender, age, and computer experience had upon these attitudes. The subjects included 354 students
from differing institutions: 79 from a liberal arts college, 98 from a community college, and 186 from a
large district high school. The sample represented a wide scope of interests and backgrounds. They
were given the 30-item Computer Attitude Scale, and responded on a four-point Likert scale. As
previously mentioned, the scores for the three subscales (anxiety, confidence, and liking) were converted
into a total score, in which a higher score indicates a more positive attitude towards computers. Analysis
of variance was conducted on the factors of gender, age, and computer experience.
Loyd and Gressard (1984) found that all categories of the CAS showed a positive effect of
computer experience on a student’s attitude towards computers, the more experience, the more positive
their attitudes. The factor of age was only statistically significant for computer liking, while gender was
not significant for computer anxiety, confidence, nor liking. In fact, the scores of both males and females
suggest that their attitudes towards computers in all three areas are fairly similar for each age group.
In another study that focused on the effect of gender and experience on computer attitudes,
Shashaani (1997) found several differences between males and females. In this study, 202
undergraduates, 115 female and 87 male, enrolled in an introductory computer course took pre and post
surveys of their attitudes towards computers. The questionnaire consisted of 5-point Likert scale
questions regarding computer liking, confidence, usefulness, stereotype, computer experience, along with
questions with respect to parental influences, and demographics. The findings highly suggest a gender
gap in respect to computer attitudes, experience, and confidence, where males show a positive
correlation in each of these areas. The post-test showed that attitudes of both males and females
became more positive, possibly increasing the frequency of computer use, but males overall continued to
have a more positive attitude. Shashaani suggests that females need to receive positive computer
experiences at an early age, and that those experiences are fostered by schools and parents alike.
12
C.Rathsack
Summary
The research conducted on personality types has yielded an enormous amount of data from
adults and students over the past forty years. Similarly, as computers become more a part of our lives,
research on how we perceive and use computers will also be ever increasing.
Based on published findings, the Myers-Briggs personality research has determined that the
majority of male and female students and adults are sensing individuals, meaning that they crave real-life
learning situations. Furthermore, females tend to be feeling types as opposed to thinking types (Myers &
McCaulley, 1985). These factors, as well as others, may significantly affect how computers are perceived
and utilized in the classroom.
Throughout the research on student attitudes toward computers, several reliable and valid
instruments have been created (Loyd and Gressard, 1984; Woodrow, 1991). Although the instrument
may be held constant from one study to another, the results do not always follow. Within these two
studies, computer experience was found to be a significant contributor to positive computer attitudes,
while gender influence was found to be contradictory from one study to another.
The research on student personality types and student attitudes toward computers has been
abundant, yet primarily separate. This study would bridge the gap between these areas of study and
attempt to determine if there is a connection between one’s personality type and his or her attitude
towards computers.
Method
Sample
For this study, the accessible population included students from a suburban high school in
northwest Ohio. From this population of over 1300 students, 532 students were sampled. The
participants consisted of 50.8% female and 49.2% male, predominantly white, middle to upper-middle
class students, ages 14 to 18, with a mean age of 14.74 years. Students reporting the availability of a
computer at home was 92.1%, while amount of those with a parent or guardian that uses a computer was
94.2%. The mean number years of computer experience estimated by students was 5.97 years.
Instrumentation
13
C.Rathsack
The purpose of this study was to determine if student personality types influence their attitudes
toward computers, therefore, two instruments were used to determine personality type and attitudes
toward computers, respectively. Students were given the Keirsey Temperament Sorter (KTS) to assess
their personality type, which is comparable to the valid and reliable Myers-Briggs Type Indicator, both
categorizing individuals into one or more of 16 possible personality types. After completing the
inventories, personality types were calculated by the researcher, and a description of that type was given
to students to read and possibly reflect upon.
Students’ attitudes toward computers were determined during the same session, using the 30-
item Computer Attitude Scale (CAS). The valid and reliable Computer Attitude Scale (CAS) uses a 4-
point Likert scale ranging from “strongly agree” to “strongly disagree. Attitudes in three areas were
determined using the CAS: computer anxiety, computer confidence, and computer liking. The scores
from the three areas were combined to give the researcher an overall representation of each student’s
attitude towards computers ranging from 30-120. Several validation studies have confirmed that the CAS
is reliable as both a generalized attitude of computers measure (.95), and in each distinct area of
computer anxiety (.89), confidence (.89), and liking (.89) (Gressard & Loyd, 1986).
Design & Procedures
Convenience was the sampling method used for this study, using existing classes of
students to complete the instruments. Students were sampled from various science classes over a two-
week period in the fall of 1998. Prior to sampling, potential participants were given a consent form to get
parental permission to participate in this study. These consent forms were collected during each session
to determine the participants of this study. The instruments were administered during the middle of
October during the respective class sessions. Each participant was given a packet containing the
questions for each instrument, and an answer sheet.
The administration of both instruments was done at the beginning of the class period for all
groups of participants. After a general statement was given introducing the study and both instruments,
needed materials were distributed. For the KTS and CAS instruments, instructions were printed as well
as verbally recited by the administrator/researcher. Demographic information was provided on each
14
C.Rathsack
student’s answer sheet, consisting of: gender, home computer availability, parent/guardian use of a
computer, years of computer experience, and age.
In completing the instruments, it was stressed that individual responses should reflect an overall
feeling or characteristic, since several options could be considered viable. Participants were thanked in
advance for their cooperation and honest responses, instructions were recited, and questions were
addressed as necessary. Upon completion and collection of the instruments, participants were given a
written summary of their personality types, allowing for individual reflection.
15
C.Rathsack
Data Analysis and Findings
The results from both inventories were analyzed using the SAS statistical analysis computer
program to determine if a relationship exists between attitudes toward computers and one or more of the
16 personality types or traits. Descriptive statistics, including mean scores and standard deviations, were
calculated for the overall attitude toward computers, CAS Total score, as well as for each of the three
subscale scores from the Computer Attitude Scale, Anxiety, Confidence, and Liking, and plotted by
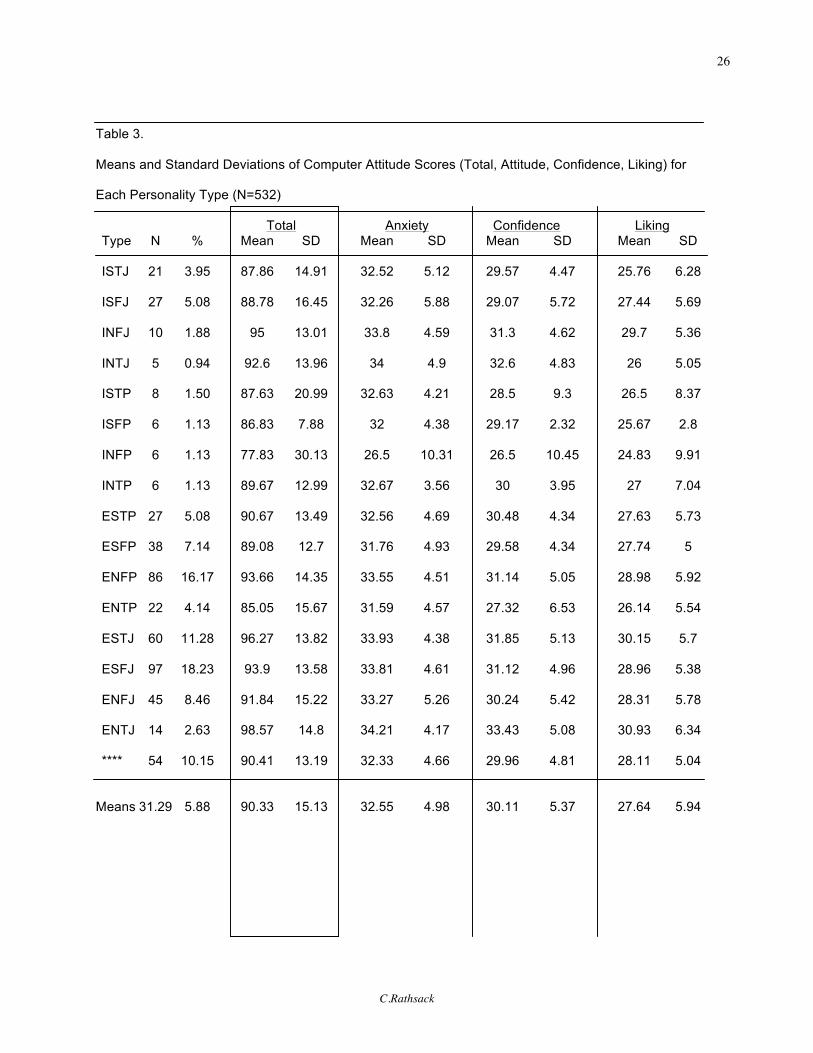
frequency of personality type, as shown in Table 3.
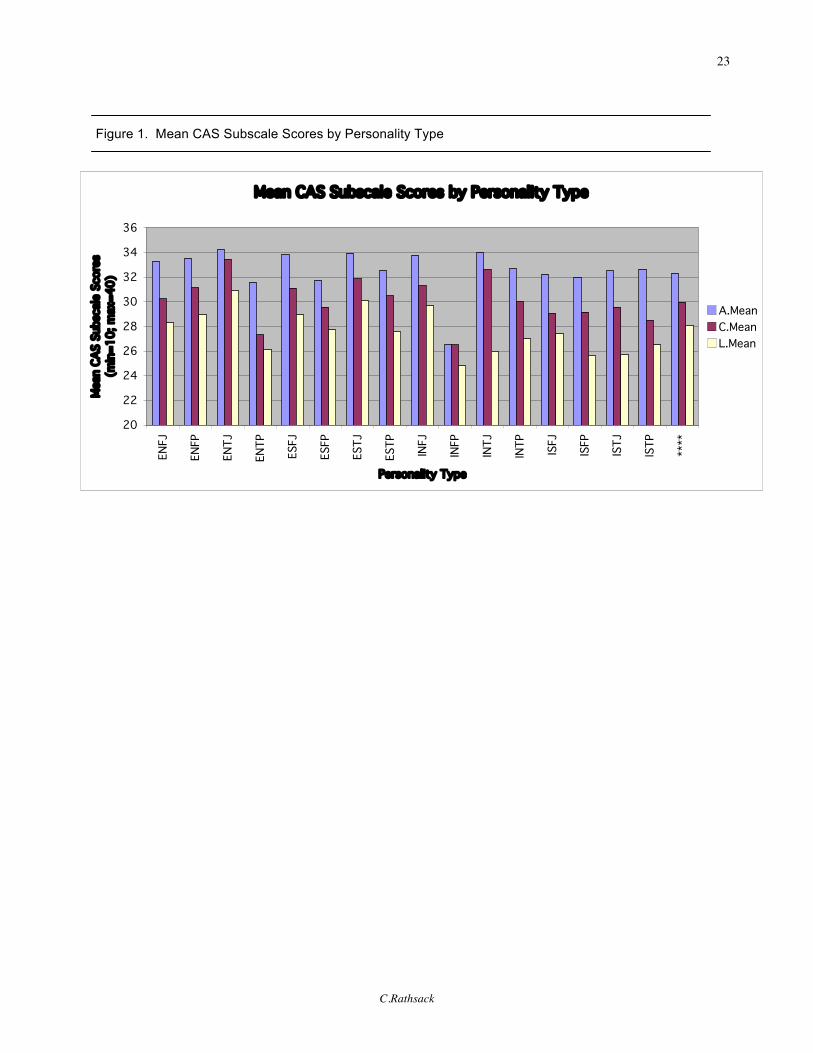
The Total CAS mean scores ranged from a high of 98.57 (SD = 14.8) to a low of 77.83 (SD =
30.13), based on a maximum Total score of 120. The Anxiety, Confidence, and Liking CAS high scores
were 34.21, 33.43, and 30.93, while the lowest scores for the same categories were 26.50, 26.5, and
24.83, respectively. Reverse-coded, a high Anxiety subscale score indicates a low anxiety toward
computers. The highest scores from all three subscales were attained by the ENTJ type, while all the
lowest scores were from the INFP type. Figure 1 shows the mean scores of each subsection as
compared to the determined personality type. In every case, except for the INFP type, each personality
type scored highest in Anxiety, then Confidence, and lowest in Liking. For the INFP, the Anxiety and
Confidence means were equal.
The standard deviations of the calculated Total CAS means were primarily within 1 to 3 standard
deviations away from each other, except for ISTP (N = 5; SD = 20.99), ISFP (N = 8; SD = 7.88), and
INFP (N = 5; SD = 30.13). For the three subscales, a similar pattern is apparent, where the ISTP type
has higher than average standard deviations for Confidence and Liking (9.3 and 8.37), as does the INFP
type, with 10.45, 9.91, and 10.31 for Attitude. The ISFP type has overall lower standard deviations for
Confidence and Liking with 2.32 and 2.8, respectively.
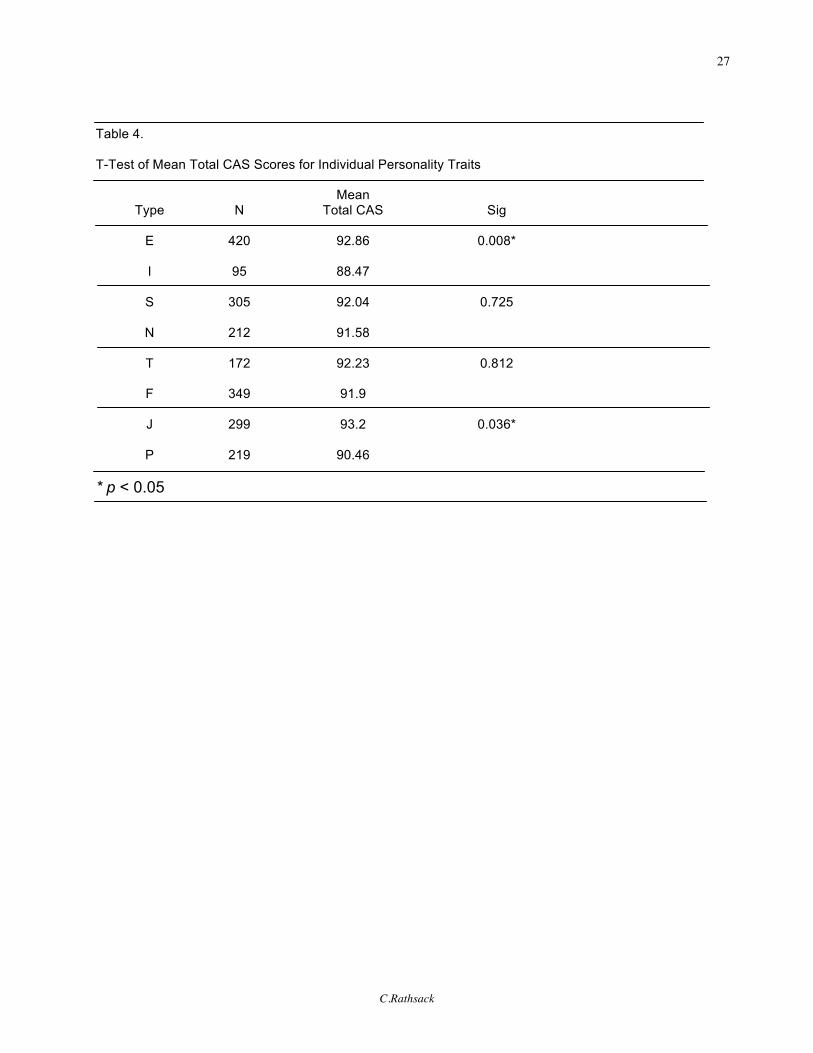
Means based on individual personality traits are shown in Table 4. Of the 8 traits that make up
the personality type: Extroversion (E), Introversion (I), Sensing (S), Intuition (N), Thinking (T), Feeling (F),
Judging (J), and Perceiving (P), the mean Total CAS scores ranged from a low of 88.47 for the Introverts
(I) to 93.2 for the Judging types. For the combined personality traits listed in Table 4, the scores ranged
from 86.17 (IP) to 94.32 (EJ).
16
C.Rathsack
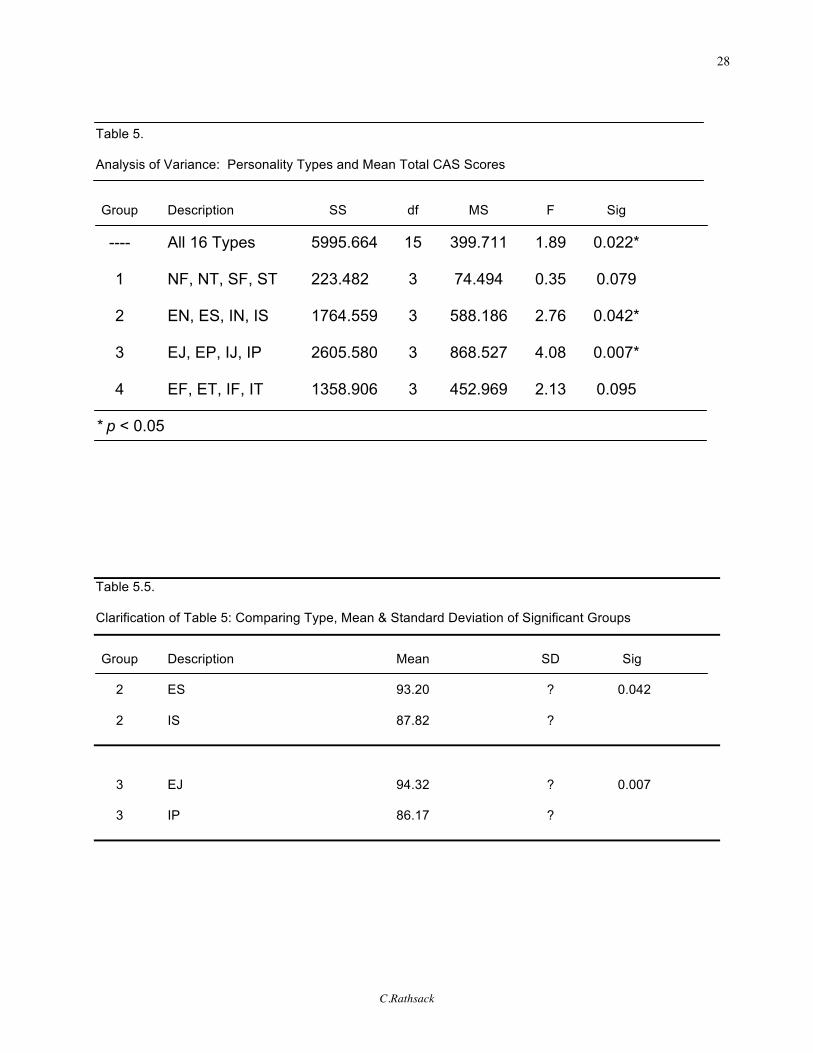
In addition to means and standard deviations, analysis of variance was performed to determine if
any personality types or traits have differences in attitudes towards computers. Table 5 shows the results
of the analysis of variance among 5 different groups compared to their respective Total CAS scores.
When examining all 16 types, a significant difference in Total CAS scores is shown (p = 0.022), but a
post-hoc analysis did not find the specific personality types in which this significance lies. Statistical
significance was achieved in Group 2-EN, ES, IN, IS (p = 0.042) and Group 3-EJ, EP, IJ, IP (p = 0.007).
In Group 2, the ES mean Total CAS score was 93.20 whereas the IS mean was 87.82. Similarly in Group
3, the EJ mean Total CAS score of 94.32 was significantly higher than the IP’s 86.17. Mean Total CAS
scores for each of the four trait-specific Groups is shown in Table 6, and for the main 16 types, means are
shown in Table 3. For Group 1-NF, NT, SF, ST (p = 0.079) and Group 4-EF, ET, IF, IT (p = 0.095), no
significant differences in mean Total CAS scores were established.
In addition to comparing specific personality types, t-tests were used to examine differences
between mean Total CAS scores and: Extroverts /Introverts, Sensing/Intuitive, Thinking/Feeling, and
Judging/Perceiving. As shown in Table 4, the mean Total CAS score of Extroverts was significantly
higher than Introverts, at 92.86 and 88.47, (p = 0.008). The only other significantly different set of mean
scores was between the Judging (93.2), and Perceiving (90.46) types at (p = 0.036). Neither pairing of
the Sensing (S) and Intuitive (N) types (p = 0.725) nor the Thinking (T) and Feeling (F) types was
significantly different.
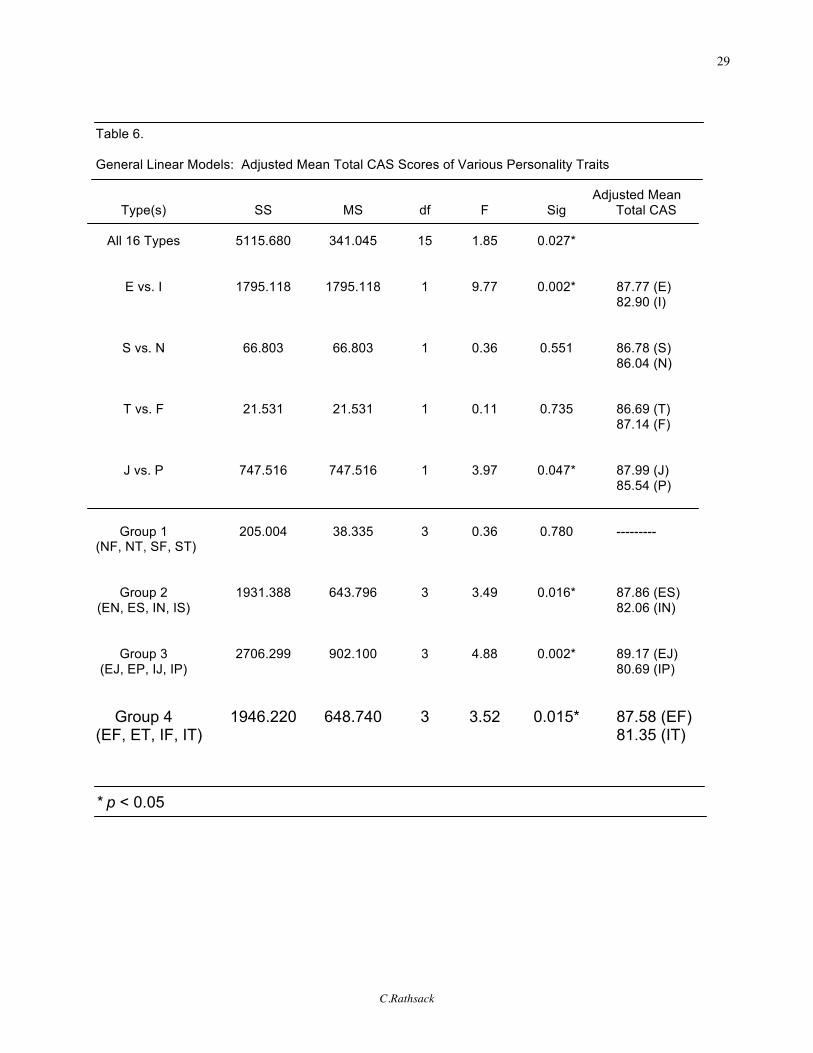
For the final analysis, extraneous variables such as age, gender, computer experience, home
computer availability, and parental computer use were included in a general linear models examination to
determine if significance exists or continues to exist after adjusting for these variables. Table 6 outlines
the findings, indicating that all significant findings using the analysis of variance or t-test procedures
remained significant when adjusting for the given extraneous variables of age, gender, computer
experience, home computer availability, and parental computer use. In addition, one group of personality
types, Group 4 (EF, ET, IF, IT) becomes significant when adjusting for these variables (p = 0.015),
indicating that the EF type adjusted mean Total CAS score of 87.58 is significantly higher than the
adjusted mean score, 81.35, of type IT.
17
C.Rathsack
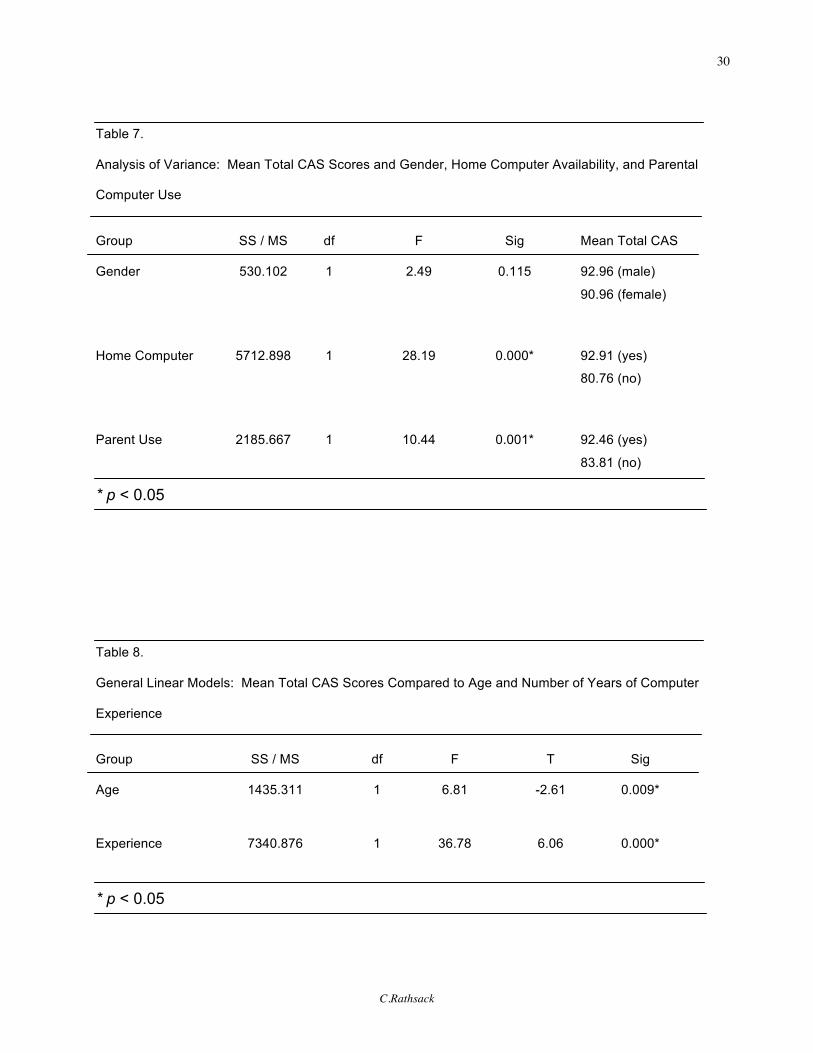
Further analysis of variance was conducted to determine if differences in Total CAS mean scores
exist between students of differing gender, home computer availability, and parental computer use. Table
7 summarizes these findings, showing that there is not a significant difference between mean Total CAS
scores (p = 0.115) among females and males, with females scoring 90.96 and males 92.96 out of 120
possible. Conversely, students that had computers at home showed a significantly higher mean score of
92.91 versus a mean of 80.76 for those students without a computer at home (p = 0.000). In addition,
students who reported parent or guardian use of computers at home or work also reported significantly
higher mean Total CAS score (92.46) than did the students whose parents did not use a computer
(83.81), (p = 0.001).
In order to determine if a relationship exists between a student’s age and their mean Total CAS
score, as well as between the number of years of computer experience and Total CAS score, the general
linear models procedure was incorporated. Both age and experience showed a significant relationship,
as shown in Table 8. Between the mean Total CAS score and age there is a negative relationship (T = -
2.61; p = 0.009), and a positive relationship exists between the number of years using computers and the
mean Total CAS score (T = 6.06; p = 0.000). For every additional year of age, the mean Total CAS
score decreased by an average of 2.61, where as the scores for students with more experience rose on
average 6.06 for every additional year of experience.
18
C.Rathsack
Discussion
Over 500 high school students from Northwest Ohio were utilized in order to examine
relationships between an individual’s personality type and his or her attitude toward computers. Mean
Total scores of the Computer Attitude Scale were compared to each of the 16 Myers-Briggs personality
types, along with individual personality traits (E, I, S, N, T, F, J, P) that comprise the overall type.
Extraneous variables such as gender, age, computer experience, parental use, and home computer
availability were also considered and examined.
The results showed that two personality traits, Extroverted (E) and Judging (J), had more positive
attitudes towards computers. When combining two different sets of traits, the Extroverted – Judging (EJ)
type reported the highest Total CAS mean score, followed by Extroverted – Thinking (ET), Extroverted –
Sensing (ES), Extroverted – Feeling (EF), and Extroverted – Intuitive (EN) types. These groupings were
compared in order to determine if only one or two traits out of the eight total caused the significant
differences. Apparently, the Extroversion characteristic can be a predictor of more positive attitudes
toward computers. Even when adjusting for the effects that the extraneous variables had on the notable
differences, all remained significant, including the addition of Group 4 (EF, ET, IF, IT). In this case, once
again the extroversion trait seemed to be the main predictor of the Total CAS score.
In contrast, the lowest mean Total CAS scores were reported by Introverts (I). As previously
mentioned, significant differences were reported between Introverts (I) and Extroverts (E), but among the
more specific groupings of each of the 16 personality types, no specifically designated type was
determined to be statistically significant. This is primarily due to the small sample sizes of many of the
Introverted types. Of the eight Introverted personality types, the sample sizes ranged from 5 to 27, with a
average of only 11 students in each. The effect of such small sample sizes is demonstrated in the ISTP
and INFP types where the standard deviations for the mean Total CAS score is nearly double or triple
that of the other types. Therefore, any conclusions regarding the statistical significance of these types
could be misleading.
Each of the three mean CAS subscale scores for each personality type displays a unique trend.
In all types, except for the small (N=6) INFP type, the Anxiety mean scores were highest (signifying low
anxiety), followed by Confidence, and finally, Liking. In one of the original studies of adults conducted by
19
C.Rathsack
Loyd & Gressard (1986), Anxiety and Confidence were equal at 29.83, while computer Liking was 32.84.
For this study, the scores were: Anxiety 32.55, Confidence 30.11, and Liking 27.64, representing
students with a low anxiety toward computers, and more confidence in computers than in liking them.
The lower score for computer Liking may be a result of an average 5.79 years of computer
experience, much of which may have been software-driven instruction or keyboarding. In either case, the
student may view the computer as a tool for guided learning, allowing for little, if any, creative exploration,
which many teenagers crave and need during this period of development. Similarly, the high CAS
Anxiety subscale score, demonstrating a low anxiety toward computers, may also be attributable to these
years of experience, possibly to the extent that students have become familiar and comfortable with
computers in their everyday lives. Accompanying the increased use of computers in schools, a larger
contributor to the low anxiety may be that over 92 percent of the students surveyed reported having a
computer at home, again justifying the low anxiety.
When examining the extraneous variables for any significant differences, home computer
availability and parental use of computers were predictors of higher mean Total CAS scores, whereas
gender was not significant. Previous studies (Anderson, 1987; Shashaani, 1997) found that gender was
a significant predictor of mean Computer Attitude scores, by yet others using larger sample sizes found
that gender was not significant (Loyd & Gressard, 1984).
With regard to home computer availability and parental use, specific consideration was not taken
as to whether or not the student actually used the home computer or if parental use of a computer
occurred in the home, rather than work. These factors may affect the accuracy of the significance, but
again, the fact that students are merely exposed to computers may assist them in feeling more
comfortable around them, thus achieving higher CAS scores. Similarly, if a computer is available at
home, the student most likely uses it for more autonomous purposes than would be prescribed in schools,
fostering a more positive attitude toward them. The influence of parental use may also be related to the
availability of a computer at home, or vice versa, since the percentage of students reporting each was
similar, at 92.1% (home computer availability) and 94.2% (parental use). In other words, a parent may be
the only user of the computer at home, which unfortunately, leaves out the student connection in either
case.
20
C.Rathsack
Regarding the effects of age and experience on the mean Total CAS scores, significant
differences were noted in both variables. For every additional year of age, on average, a student’s mean
Total CAS score decreased by 2.61 points. This contradicts earlier studies that showed a positive
relationship between age and mean CAS scores (Anderson, 1987; Loyd & Gressard, 1984). Not
surprisingly, as reported in most computer attitude surveys, as the number of years of computer
experience increases, the overall or total CAS attitude scores also increase. For this study, on average,
the scores increased by 6.06 points for every additional year of experience. Apparently, these two
variables need to be examined further in order to determine the connections between age and
experience, since normally as one’s age increases, so does their experience with computers. The
difference in this study may exist due to the inclusion of older students who just recently began using
computers.
In order to provide a more accurate portrait of the types of students in our schools, so that
appropriate measures can be taken in respect to their education, as well as to determine current trends in
the relationship between students and computers, further research should include:
1) a larger sample size to increase the numbers of the less frequent personality type, providing a
more representative sample Total CAS mean score;
2) a more diverse sample size, perhaps randomly generated, or comparing these results to those
from an urban setting;
3) compare each of the 3 CAS subscales (Anxiety, Confidence, and Liking) to all 16 personality
types, as well as other combinations of individual traits and extraneous variables; and
4) follow high school students into various post-secondary settings (college, occupation, military,
etc.) to determine changes in attitudes towards computers and/or personality types.
21
C.Rathsack
Implications
The results from this study may have limited generalizability because the population sample
selected. The participants were not randomly selected, and they consisted only of approximately 40% of
the student body. In addition, the participants represented a reasonably homogeneous group of white,
middle to upper-middle class students from northwest Ohio.
Nonetheless, the data still provides some trends of which educators, policy-makers, and parents
need to be aware. The strong connection between extroverts and more positive attitudes towards
computers may allow for future leadership in portraying these attitudes to others, both in and out of
school. Apparently society needs to abandon the notion that computers are held in highest regard solely
by the quiet, shy, intelligent males. We need to remember that in addition to computers being a tool for
learning, they can also be a primary means of communication, allowing the extroverts to thrive in multiple
arenas, including visual, verbal, and written form of communication.
For teachers, awareness of each students’ personality type as well as their attitude toward
computers can lead to appropriate groupings based on the student’s personality or attitude toward
computers. Partnering students with opposing computer attitude scores may benefit both parties, both
educationally and socially.
As previously mentioned, the results of the relationship between home computer availability and
overall attitude toward computers needs to be investigated further to determine if other confounding
variables exist, such as primary computer users and the specific types of computer use. The influence of
parental use may be due to coincidence, necessity, or convenience. Similarly, parental use, like student
use, may also need to be more clearly defined in order to determine if parental influence exists or can be
implied. Additionally, clarification would be needed regarding if the students is a primary user of the
home computer. Simply stated, just because there is a computer at home, doesn’t mean it gets used --
by the student or other family members (just like in schools). For now, the research indicates that having
a home computer and a parent that uses a computer are strong predictors of a more positive attitude
toward computers.
When it comes to success in any aspect of life, attitude becomes a likely predictor of our success
or failure. As the use of computers in our schools, offices, and homes continues to rise, we become ever-
22
C.Rathsack
increasingly faced with how to bridge the gap between one’s personal growth (education) and technology,
and create more successes than failures. Perhaps fostering a positive attitude toward computers can be
the connection between who we are and how we relate to the world around us, both with and without
technology. One way to begin to cultivate these positive attitudes toward computers is by becoming
aware of any connections that may exist between personality and computer attitudes, and using that to
guide instruction as well as the curriculum. Once these connections are made, students can become
lifelong users of technology for the purpose of advancing their own personal growth beyond where even
they thought was possible.
23
C.Rathsack
Figure 1. Mean CAS Subscale Scores by Personality Type
Mean CAS Subscale Scores by Personality Type
20
22
24
26
28
30
32
34
36
EN
FJ
EN
FP
EN
TJ
EN
TP
ESFJ
ESFP
ESTJ
ESTP
INFJ
INFP
INTJ
INTP
ISFJ
ISFP
ISTJ
ISTP
****
Personality Type
Mean C
AS S
ubscale
Score
s
(min
=1
0; m
ax=
40
)
A.Mean
C.Mean
L.Mean
24
C.Rathsack
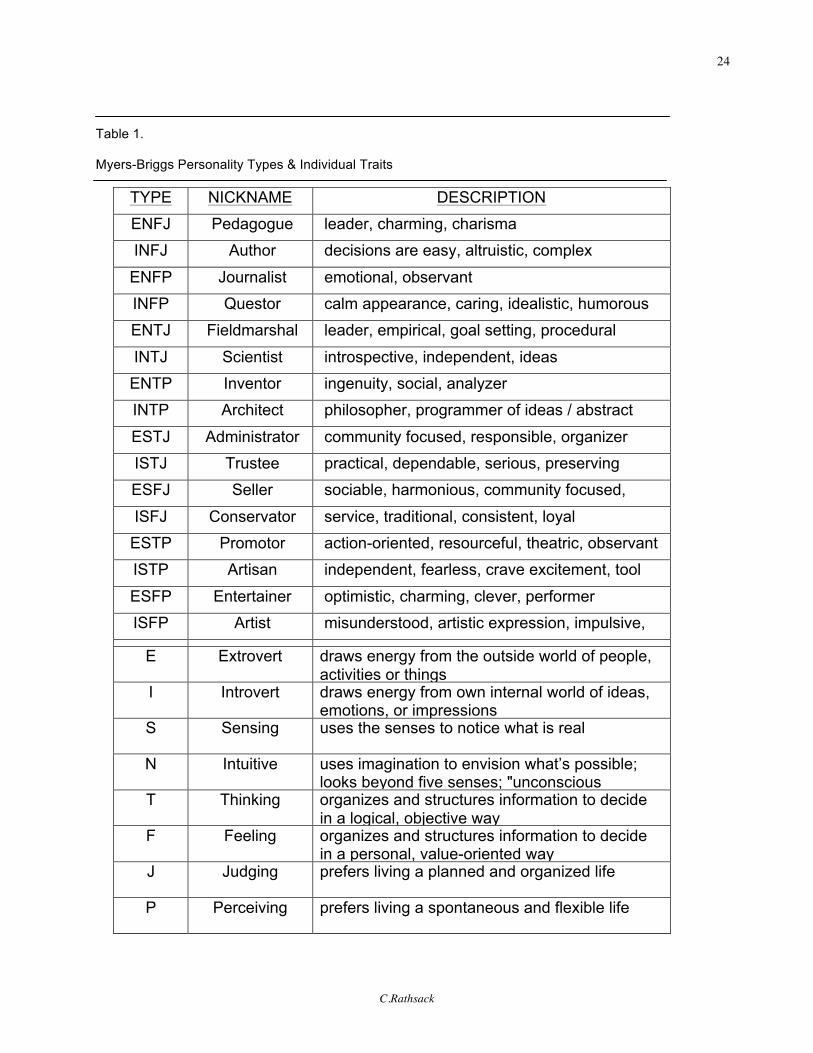
Table 1.
Myers-Briggs Personality Types & Individual Traits
TYPE NICKNAME DESCRIPTION ENFJ Pedagogue leader, charming, charisma INFJ Author decisions are easy, altruistic, complex
ENFP Journalist emotional, observant INFP Questor calm appearance, caring, idealistic, humorous ENTJ Fieldmarshal leader, empirical, goal setting, procedural
INTJ Scientist introspective, independent, ideas ENTP Inventor ingenuity, social, analyzer INTP Architect philosopher, programmer of ideas / abstract
ESTJ Administrator community focused, responsible, organizer ISTJ Trustee practical, dependable, serious, preserving ESFJ Seller sociable, harmonious, community focused,
giving ISFJ Conservator service, traditional, consistent, loyal ESTP Promotor action-oriented, resourceful, theatric, observant ISTP Artisan independent, fearless, crave excitement, tool
use ESFP Entertainer optimistic, charming, clever, performer ISFP Artist misunderstood, artistic expression, impulsive,
kind E Extrovert
draws energy from the outside world of people, activities or things
I Introvert draws energy from own internal world of ideas, emotions, or impressions
S Sensing uses the senses to notice what is real
N Intuitive uses imagination to envision what’s possible; looks beyond five senses; "unconscious perceiving" T Thinking organizes and structures information to decide in a logical, objective way
F Feeling organizes and structures information to decide in a personal, value-oriented way
J Judging prefers living a planned and organized life
P Perceiving prefers living a spontaneous and flexible life
25
C.Rathsack
Table 2.
Personality Type Percentages of Junior (JH) and Senior (SH) High School Females (left) and Males
(right). (Myers & McCaulley, 1985).
ISTJ
4.51(JH)9.59
3.11(SH)9.21
ISFJ
9.11(JH)4.25
6.22(SH)1.97
INFJ
3.35(JH)2.72
2.07(SH)1.32
INTJ
1.25(JH)5.23
1.55(SH)1.32
ISTP
2.26(JH)6.64
3.11(SH)15.13
ISFP
7.78(JH)5.12
6.74(SH)2.63
INFP
9.34(JH)7.52
7.77(SH)5.26
INTP
2.26(JH)6.75
3.11(SH)7.24
ESTP
2.72(JH)8.61
6.22(SH)15.79
ESFP
12.61(JH)7.19
13.99(SH)5.92
ENFP
19.22(JH)10.13
12.95(SH)10.53
ENTP
3.74(JH)8.50
4.66(SH)6.58
ESTJ
5.45(JH)7.95
4.66(SH)7.24
ESFJ
9.65(JH)4.68
14.51(SH)2.63
ENFJ
5.14(JH)1.53
4.66(SH)3.95
ENTJ
1.63(JH)3.59
4.66(SH)3.29
JH (N=2160); SH (N=345)
26
C.Rathsack
Table 3.
Means and Standard Deviations of Computer Attitude Scores (Total, Attitude, Confidence, Liking) for
Each Personality Type (N=532)
Total Anxiety Confidence Liking Type N % Mean SD Mean SD Mean SD Mean SD
ISTJ 21 3.95 87.86 14.91 32.52 5.12 29.57 4.47 25.76 6.28
ISFJ 27 5.08 88.78 16.45 32.26 5.88 29.07 5.72 27.44 5.69
INFJ 10 1.88 95 13.01 33.8 4.59 31.3 4.62 29.7 5.36
INTJ 5 0.94 92.6 13.96 34 4.9 32.6 4.83 26 5.05
ISTP 8 1.50 87.63 20.99 32.63 4.21 28.5 9.3 26.5 8.37
ISFP 6 1.13 86.83 7.88 32 4.38 29.17 2.32 25.67 2.8
INFP 6 1.13 77.83 30.13 26.5 10.31 26.5 10.45 24.83 9.91
INTP 6 1.13 89.67 12.99 32.67 3.56 30 3.95 27 7.04
ESTP 27 5.08 90.67 13.49 32.56 4.69 30.48 4.34 27.63 5.73
ESFP 38 7.14 89.08 12.7 31.76 4.93 29.58 4.34 27.74 5
ENFP 86 16.17 93.66 14.35 33.55 4.51 31.14 5.05 28.98 5.92
ENTP 22 4.14 85.05 15.67 31.59 4.57 27.32 6.53 26.14 5.54
ESTJ 60 11.28 96.27 13.82 33.93 4.38 31.85 5.13 30.15 5.7
ESFJ 97 18.23 93.9 13.58 33.81 4.61 31.12 4.96 28.96 5.38
ENFJ 45 8.46 91.84 15.22 33.27 5.26 30.24 5.42 28.31 5.78
ENTJ 14 2.63 98.57 14.8 34.21 4.17 33.43 5.08 30.93 6.34
**** 54 10.15 90.41 13.19 32.33 4.66 29.96 4.81 28.11 5.04
Means 31.29 5.88 90.33 15.13 32.55 4.98 30.11 5.37 27.64 5.94
27
C.Rathsack
Table 4.
T-Test of Mean Total CAS Scores for Individual Personality Traits
Mean Type N Total CAS Sig
E 420 92.86 0.008*
I 95 88.47
S 305 92.04 0.725
N 212 91.58
T 172 92.23 0.812
F 349 91.9
J 299 93.2 0.036*
P 219 90.46
* p < 0.05
28
C.Rathsack
Table 5.
Analysis of Variance: Personality Types and Mean Total CAS Scores
Group Description SS df MS F Sig
---- All 16 Types 5995.664 15 399.711 1.89 0.022*
1 NF, NT, SF, ST 223.482 3 74.494 0.35 0.079
2 EN, ES, IN, IS 1764.559 3 588.186 2.76 0.042*
3 EJ, EP, IJ, IP 2605.580 3 868.527 4.08 0.007*
4 EF, ET, IF, IT 1358.906 3 452.969 2.13 0.095
* p < 0.05
Table 5.5.
Clarification of Table 5: Comparing Type, Mean & Standard Deviation of Significant Groups
Group Description Mean SD Sig
2 ES 93.20 ? 0.042
2 IS 87.82 ?
3 EJ 94.32 ? 0.007
3 IP 86.17 ?
29
C.Rathsack
Table 6.
General Linear Models: Adjusted Mean Total CAS Scores of Various Personality Traits
Adjusted Mean Type(s) SS MS df F Sig Total CAS
All 16 Types 5115.680 341.045 15 1.85 0.027* E vs. I 1795.118 1795.118 1 9.77 0.002* 87.77 (E) 82.90 (I) S vs. N 66.803 66.803 1 0.36 0.551 86.78 (S) 86.04 (N) T vs. F 21.531 21.531 1 0.11 0.735 86.69 (T) 87.14 (F) J vs. P 747.516 747.516 1 3.97 0.047* 87.99 (J) 85.54 (P) Group 1 205.004 38.335 3 0.36 0.780 --------- (NF, NT, SF, ST) Group 2 1931.388 643.796 3 3.49 0.016* 87.86 (ES) (EN, ES, IN, IS) 82.06 (IN) Group 3 2706.299 902.100 3 4.88 0.002* 89.17 (EJ) (EJ, EP, IJ, IP) 80.69 (IP) Group 4 1946.220 648.740 3 3.52 0.015* 87.58 (EF) (EF, ET, IF, IT) 81.35 (IT)
* p < 0.05
30
C.Rathsack
Table 7.
Analysis of Variance: Mean Total CAS Scores and Gender, Home Computer Availability, and Parental
Computer Use
Group SS / MS df F Sig Mean Total CAS
Gender 530.102 1 2.49 0.115 92.96 (male)
90.96 (female)
Home Computer 5712.898 1 28.19 0.000* 92.91 (yes)
80.76 (no)
Parent Use 2185.667 1 10.44 0.001* 92.46 (yes)
83.81 (no)
* p < 0.05
Table 8.
General Linear Models: Mean Total CAS Scores Compared to Age and Number of Years of Computer
Experience
Group SS / MS df F T Sig
Age 1435.311 1 6.81 -2.61 0.009*
Experience 7340.876 1 36.78 6.06 0.000*
* p < 0.05
31
C.Rathsack
REFERENCES
Anderson, C. W. (1987). The relationship between personality characteristics and attitudes toward
computer technology (technostress). Dissertation Abstracts International, 48 (04), 1176. (University
Microfilms No. AAI8715376)
Gardner, D.G., Dukes, R.L., & Discenza, R. (1993). Computer use, self-confidence, and attitudes: A
causal analysis. Computers in Human Behavior, 9, 427-440.
Katz, Y.J., & Francis, L.J. (1995). Personality, religious and computer oriented attitudes among
trainee teachers in Israel. Computers in Human Behavior, 11, 1-8.
Keirsey, D., & Bates, M. (1984). Please understand me: Character & temperament types (4th ed.).
Del Mar, CA: Prometheus Nemesis Book Company.
Loyd, B.H., & Gressard, C. (1984). Reliability and factorial validity of computer attitude scales.
Educational and Psychological Measurement, 44, 501-505.
Loyd, B.H., & Gressard, C. (1984). The effects of sex, age, and computer experience on computer
attitudes. AEDS Journal, 18, 67-77.
Marshall, J.C., & Bannon, S.H. (1986). Computer attitudes and computer knowledge of students and
educators. AEDS Journal, 18, 270-285.
Moon, Y., & Nass, C. (1996). How “real” are computer personalities: Psychological responses to
personality types in human-computer interaction. Communication Research, 23, 651-674.
Myers, I.B., & McCaulley, M.H. (1985). Manual: A guide to the development and use of the Myers-
Briggs Type Indicator (2nd ed.). Palo Alto, CA: Consulting Psychologists Press.
Myers, I.B., & Myers, P.B. (1980). Gifts differing. Palo Alto, CA: Consulting Psychologists Press.
Shashaani, L. (1997). Gender differences in computer attitudes and use among college students.
Journal of Educational Computing Research, 16, 37-51.
Woodrow, J.E.J. (1991). A comparison of four computer attitude scales. Journal of Educational
Computing Research, 7, 165-187.