Embed Size (px)
Citation preview
Journal of Occupational Accidents, 9 (1987) l-9 Elsevier Science Publishers B.V., Amsterdam - Printed in The Netherlands
The Relationship Between Work Group Size and Occupational Accidents
DENISE DIZADJI GUASTELLO
Loyola University of Chicago, Chicago, IL (U.S.A.)
and STEPHEN J. GUASTELLO*
Marquette University, Milwaukee, WI (U.S.A.)
(Received 30 June 1986; accepted 1 October 1986)
ABSTRACT
Guastello, D.D. and Guastello, S.J., 1987. The relationship between work group size and occupa- tional accidents. Journal of Occupational Accidents, 9: l-9.
Work group size and its effect on industrial accidents was investigated. Previous studies on the topic have been inconclusive. This study also investigated whether group size is correlated with other psychosocial variables that have been shown in the past to relate to accident rate. Subjects were 435 employees in 79 work groups drawn from 9 Midwestern metal foundries and mills.
Results revealed both a linear and curvilinear component of the relationship between group size and group accident rates. A scattergram revealed a breakpoint at a group size of about 15 people above which only large accident rates occurred, but below which disparately high and low rates were observed. Size was not correlated with any of the other psychosocial variables related to accidents. Implications of the findings for accident control are discussed.
INTRODUCTION
Organizational subunit size has been shown to affect various behaviors of employees. In the first review of such effects, subunits were variously defined as departments of a manufacturing company, automobile dealerships, airline locations, mines, stores, or factories within a larger structural framework (Porter and Lawler, 1965 ) . Size was defined as the number of people in the unit. The following is a summary of observations made in that review.
Porter and Lawler noted that six out of seven studies correlating subunit size to job satisfaction found negative relationships; size increased as satisfac-
*All correspondence should be addressed to Stephen J. Guastello, Department of Psychology, Marquette University, Milwaukee, WI 53233, U.S.A.
0376-6349/87/$03.50 0 1987 Elsevier Science Publishers B.V.
2
tion decreased. Ten out of twelve absenteeism studies found positive relation- ships, as size increased absenteeism increased also. Three out of four turnover studies found that turnover increased as size did. Two out of two labor dispute studies found that disputes increased as size did.
Three out of the four studies that did not support favorable satisfaction, attendance or turnover conditions for smaller groups simply found no signifi- cant effects. One curvilinear relationship was discovered, indicating that absenteeism was highest in factory sections of 20-30 persons, compared to larger or smaller units (Argyle et al., 1958).
Results for productivity and accident hypotheses were less concise. Of eight productivity studies reviewed by Porter and Lawler (1965)) three negative cor- relations with size were found, plus one positive and three curvilinear relation- ships, and a report of no significance.
Three out of six studies correlating subunit with accidents found positive relationships, while two others found curvilinear (logarithmic) relationships, and the sixth was negative. All six of the correlations between subunit size and accidents had appeared in an earlier review by Revans (1958). Since that time there has only been one more attempt to study the problem. Guastello (1985a) found no direct relationship between work group size and accident rates in a primary steel environment. However, there was a cusp catastrophe (complex nonlinear) relationship between group size and change in accident rate. For groups of sizes less than 37, accident rates oscillated between two disparate modal values, as opposed to regressing toward a single mean. Accident rates for larger groups showed comparatively little variation.
It was cautioned that any observed group size effect for accidents could be partially attributed to the inherent variability of small group observations. Of the 37% of criterion variance accounted for by the cusp catastrophe model (change in OSHA-reportable accident rates from the first half of 1983 to the first half of 1984)) 30% was accounted for by change between two naturally occurring modal values (dynamics inherent in the accident process itself), 1% by the instability of small group rates only, and 6% was attributed to differ- ences in hazard levels. The partitioning of variance for the 1982-1983 full year data taken from the same site was 34% for inherent dynamics, less than 1% for the instability of small group rates, and 5% for hazard levels. The instability of small group rates was concluded to account for a small but real portion of accident rate change data.
One might also question whether zero accident observations would disap- pear over longer exposure times. Regression to the mean would explain such an occurrence. According to the cusp catastrophe model, however, the two fre- quency modes (0.0 and 10.0 accidents per 100 person years) act as attractor forces, in the sense of two magnets. Dramatic changes in accident rate can be observed between the two modes. In essence, there is regression to two modes rather than regression to one mean.
3
One may tentatively summarize the subunit size problem in terms of three basic points: (1) There appears to be a complex nonlinear relationship between group size and accident rates; (2) Part of that relationship is artifactual and part of it is real; and (3) The real portion of the group size effect should be explicable in terms of other socially-based variables that also explain accidents.
Explanations for subunit size phenomena
Three hypotheses have been proposed in attempts to explain the subunit size findings. They are group cohesiveness, span of control, and division of labor.
Larger groups tend to be less cohesive, more alienating and more heteroge- neous than smaller ones (Chatterjee, 1972; Griffin, 1982; Singh and Moorjani, 1978; Zeitz, 1983). If cohesiveness is also coupled with high performance norms, relatively higher levels of performance are expected (Griffin, 1982).
Span of control is usually defined as the number of persons reporting to one supervisor (Ouchi and Dawling, 1977) ; measures of subunit size and span of control are often equivalent. The position is that small groups may be too closely supervised which can result in stifling individual initiative and autonomy. There must be, therefore, an optimal size which trades off the problems of being too small or too large (Ouchi, 1983).
Size affects job characteristics, usually in the form of more complex and specific division of labor. Complexity of labor division typically results in lim- itations on an individual’s repetoire of job activities (Beyer and Trite, 1979). It is a consistent premise of job design research that productivity is improved when employees have greater task variety and opportunity to use their skills (Griffin, 1982; Hackman, 1980,1984).
Guastello (1986) identified several psychosocial variables that were related to group accident rates in mills and foundries: physical hazards, physical stres- sors, experience, danger level, safety management, and anxiety. As reports of physical hazards, physical stress (noise, heat, shiftwork), anxiety, and danger level increased, accident rates increased. With increaed experience (seniority, age, etc.) and better safety management (adequacy of supervision, training, protective equipment, etc.) accident rates decreased. Beliefs about accident control, personal life stressors, and physical stress were found to contribute to accident rates indirectly through their effects on anxiety. Anxiety increased with reports of personal life stressors, physical stress, and beliefs that acci- dents are not under individual’s control. All variables except accident rates and group size were measured using the Occupational Hazards Survey (first edition; Guastello, 1986). The multiple regression of survey variables with accident rates collected over a 22-month period prior to data collection was 0.45 (p < 0.01, cross-validation r=0.47, p < 0.05). For a lo-month period prior to data collection the multiple correlation was 0.49 (p < .Ol; cross-validation
4
r = 0.58, p < 0.01) . Beliefs and social stressors affected accident rates indirectly through the anxiety variable. Physical stressors had both a direct effect and an indirect effect through the anxiety variable (Guastello, 1986).
Objectives
The first objective of this study was to provide additional information on the relationship between group size and accidents, since studies on this topic are inconclusive. Both linear and nonlinear relationships were tested.
The second objective was to investigate whether or not the work group size is related to other psychosocial variables that have been shown to affect acci- dent rates. Significant relationships wouldprovide some explanation as to why an organizational structure variable such as group size would affect accident rates.
METHOD
Subjects
Subjects were regular employees and supervisors of six foundries and three sheet metal mills. Eight organizations were located in the Milwaukee-Chicago area, and one was located in the Northeast. The sample contained a total of 79 work groups and 435 employees, and was 12% female.
All organizations contained essentially the same levels of risk exposure in terms of processes and equipment used. None of the participating organiza- tions were experiencing abnormal amounts of hiring, turnover, or layoffs. In fact, organizations that were abnormal in those areas declined participation in the study. The industry average rate of OSHA-reportable accidents per 100 person years of exposure is 11.4 (National Safety Council, 1984). The unweighted average accident rate across work groups in the sample was 28.8 per 100 person years. The average log accident rate for the work groups cor- respond to 9.0 accidents per 100 person years of exposure.
Participants worked a variety of schedules. Fifty percent of the subjects worked a straight first shift (8 hours beginning between 07.00 and 09.00)) 18% worked straight second shift (beginning between 15.00 and 18.00)) 9% worked straight third shift (beginning between 22.00 and 24.00)) 2% worked a back- ward rotating schedule (third-second-first), 14% worked an early-bird shift (8 hours beginning between 04.00 and 06.00)) and 7% worked a 4 day-10 hour schedule.
Proced we
All subjects completed the Occupational Hazards Survey (first edition; Guastello, 198513) on company time. The safety manager of each company was
5
responsible for administering the survey to its employees. Safety directors returned surveys by mail along with the group size and accident data.
Variables
Dependent measure Group accident rates (number of accidents per 100 man years) during Jan-
uary 1985-October 1985, were obtained from accident counts listed on the OSHA-200 forms. OSHA-200 forms record every reportable accident, noting the person’s name, location, date, type of injury, and work time lost. OSHA logs are kept by the organization’s safety officer, often with the assistance of a computerized file, and are subject to government monitoring and inspection. A reportable accident is any injury requiring medical attention in excess of on- site first aid, whether or not any work time was lost as a result. Lost time and other accidents were counted together in this study. OSHA records are typi- cally reliable and consistently used across organizations in the study. There may have been a global trend for some minor injuries to go unreported.
Accident rates on these forms were calculated according to Occupational Safety and Health Administration policy. Cohen and Cohen (1975 ) suggest that rate data undergo transformation before correlations are calculated. The log transformation of rate data (which is nonlinear) linearizes the relationship between the independent variables and accident rate thus capitalizing on the power of correlational analysis. Guastello (1986) found that survey variables were more closely associated with base-10 logs of accident rates than with untransformed accident rates.
Survey data The Occupational Hazards Survey contains 75 items and requires about 25
minutes (per person ) to complete. It contributed the following variables: expe- rience, safety management, physical hazards, danger level, physical stressors, social stressors, anxiety, and belief about accident control.
The experience measure consisted of three 5-point items which scored the subject’s age, years of experience with the organization, and years experience with the type of work presently performed. Cronbach’s alpha reliability coef- ficient for this scale was 0.69.
Safety management, danger level, social stressors, anxiety, and beliefs about accident control scales consisted of agree/disagree statements where each item was scored O-l-2 (0 = disagree, 1 = do not know, 2 = agree). Safety manage- ment (15 items; alpha = 0.78) evaluated general attentiveness to and consist- ency of safety regulations, personal protection equipment, reprimands, work pace, and overall effectiveness of the current safety program. Danger level gauged how severely a person could be hurt in an accident in the subject’s work area (6 items; alpha=0.64). Anxiety was measured in terms of behavioral
6
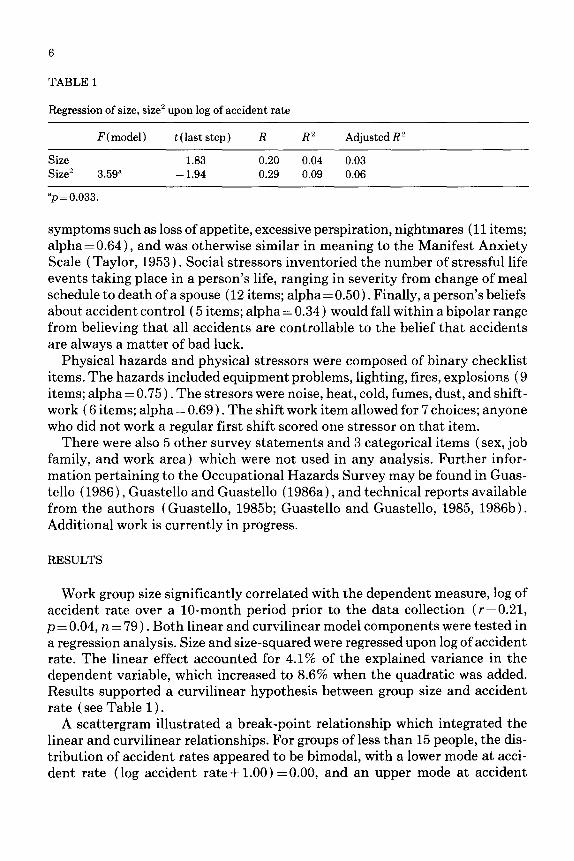
TABLE 1
Regression of size, size* upon log of accident rate
Size Size*
F(mode1)
3.59”
t (last step) R
1.83 0.20 - 1.94 0.29
R2 Adjusted R 2
0.04 0.03 0.09 0.06
“pzO.033.
symptoms such as loss of appetite, excessive perspiration, nightmares (11 items; alpha = 0.64)) and was otherwise similar in meaning to the Manifest Anxiety Scale ( Taylor, 1953 ) . Social stressors inventoried the number of stressful life events taking place in a person’s life, ranging in severity from change of meal schedule to death of a spouse (12 items; alpha = 0.50). Finally, a person’s beliefs about accident control (5 items; alpha = 0.34) would fall within a bipolar range from believing that all accidents are controllable to the belief that accidents are always a matter of bad luck.
Physical hazards and physical stressors were composed of binary checklist items. The hazards included equipment problems, lighting, fires, explosions (9 items; alpha = 0.75). The stresors were noise, heat, cold, fumes, dust, and shift- work ( 6 items; alpha = 0.69). The shift work item allowed for 7 choices; anyone who did not work a regular first shift scored one stressor on that item.
There were also 5 other survey statements and 3 categorical items (sex, job family, and work area) which were not used in any analysis. Further infor- mation pertaining to the Occupational Hazards Survey may be found in Guas- tello (1986)) Guastello and Guastello (1986a), and technical reports available from the authors ( Guastello, 198513; Guastello and Guastello, 1985, 198613). Additional work is currently in progress.
RESULTS
Work group size significantly correlated with the dependent measure, log of accident rate over a lo-month period prior to the data collection (r=0.21, p = 0.04, n = 79 ) . Both linear and curvilinear model components were tested in a regression analysis. Size and size-squared were regressed upon log of accident rate. The linear effect accounted for 4.1% of the explained variance in the dependent variable, which increased to 8.6% when the quadratic was added. Results supported a curvilinear hypothesis between group size and accident rate (see Table 1) .
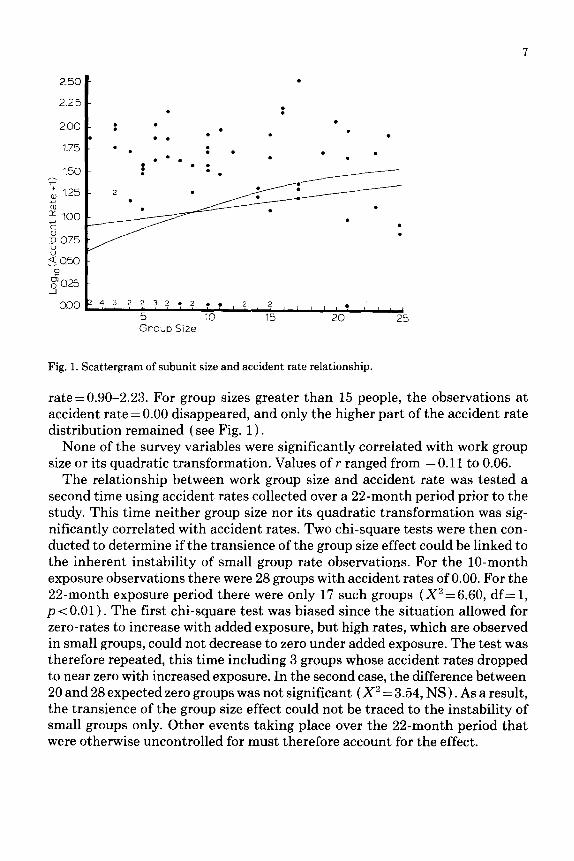
A scattergram illustrated a break-point relationship which integrated the linear and curvilinear relationships. For groups of less than 15 people, the dis- tribution of accident rates appeared to be bimodal, with a lower mode at acci- dent rate (log accident rate + 1.00) =O.OO, and an upper mode at accident
2.50
2.25
1.50
‘; a, 1.25
% ; 1.00
; a75
&50 0
yO25
0.00
Fig. 1. Scattergram of subunit size and accident rate relationship.
rate=0.90-2.23. For group sizes greater than 15 people, the observations at accident rate = 0.00 disappeared, and only the higher part of the accident rate distribution remained ( see Fig. 1) .
None of the survey variables were significantly correlated with work group size or its quadratic transformation. Values of r ranged from - 0.11 to 0.06.
The relationship between work group size and accident rate was tested a second time using accident rates collected over a 22-month period prior to the study. This time neither group size nor its quadratic transformation was sig- nificantly correlated with accident rates. Two chi-square tests were then con- ducted to determine if the transience of the group size effect could be linked to the inherent instability of small group rate observations. For the lo-month exposure observations there were 28 groups with accident rates of 0.00. For the 22-month exposure period there were only 17 such groups (X2=6.60, df= 1, p < 0.01) . The first chi-square test was biased since the situation allowed for zero-rates to increase with added exposure, but high rates, which are observed in small groups, could not decrease to zero under added exposure. The test was therefore repeated, this time including 3 groups whose accident rates dropped to near zero with increased exposure. In the second case, the difference between 20 and 28 expected zero groups was not significant (X2 = 3.54, NS) . As a result, the transience of the group size effect could not be traced to the instability of small groups only. Other events taking place over the 22-month period that were otherwise uncontrolled for must therefore account for the effect.
8
DISCUSSION
The study identified a curvilinear relationship between group size and acci- dent rates. It is possible that the positive linear relationships found in earlier studies were actually fragments of the function shown in Fig. 1. There are now two observations of breakpoint relationships, but the critical points appear to vary widely depending on whether one is observing accident rates in one point in time or observing changes in accident rate.
The group size effect is apparently transient, and easily masked by disturb- ances in the sociotechnical environment. Instability of small group exposures, and significant hiring or lay offs can be ruled out as sole explanations. It was clear that subunit size was not associated with self-report measures of physical hazards or stressors, danger, life stress, anxiety, safety management, experi- ence, or beliefs about accident control, or other psychosocial variables known to influence accident rates. There is another explanation: Division of labor, closeness of supervision, and group cohesion, which appear to explain produc- tivity and subunit size phenomena, may also contribute to the safety of groups. This point of view requires additional investigation.
The curvilinear relationship between subunit size and accident rates has some immediate application for accident control and action research. Persons working in dangerous microenvironments should be organized into teams of 15 persons or less; multiple groups should be used when greater numbers of people are required to carry out a function. An arrangement of this type would not require additional management personnel. Rather, one person within every subunit of 15 would be the safety coordinator, or safety monitor for that group. Perhaps members within a group should take turns with the responsibility. It is hoped that organizations which take advantage of this suggestion will keep records of its effectiveness.
REFERENCES
Argyle, M., Gardner, G. and Cioffi, I., 1958. Supervisory methods related to productivity, absen- teeism, and labor turnover. Hum. Relations, 11: 23-40.
Beyer, J.M. and Trite, H.M., 1979. A reexamination of the relations between size and various components of organizational complexity. Administrative Sci. Q., 24: 48-64.
Chatterjee, A., 1972. The organizational variables of group cohesiveness. Indian J. Psychol. Educ., 3: 43-52.
Cohen, J. and Cohen, P., 1975. Applied multiple regression/correlation analysis for the behavioral sciences. Erlbaum, New Jersey, 490 pp.
Griffin, R.W., 1982. Task design: An integrative approach. Scott Foresman, Glenview, IL, 243 pp. Guastello, D.D., 1986. The psychosocial variables in occupational accidents: A process model.
Doctoral dissertation, Loyola University of Chicago, 85 pp. Guastello, S.J., 1985a. Catastrophe modeling of the accident process: Organizational subunit size.
Paper presented to the American Psychological Association, Toronto, August.
9
Guastello, S.J., 1985b. Employee assessment of occupational hazards: Case report with the safety survey. Technical report available from: Guastello & Guastello, 6260 South Lake Drive no. 1015, Cudahy, WI 53110, U.S.A.
Guastello, S.J. and Guastello, D.D., 1985. Employee assessment of occupational hazards survey: Combined report for nine Milwaukee-Chicago area sheet metal mills and foundries. Technical report available from: Guastello & Guastello, 6260 South Lake Drive no. 1015, Cuday, WI 53110, U.S.A.
Guastello, S.J. and Guastello, D.D., 1986a. The relation between the locus of control construct and involvement in traffic accidents. J. Psychol.: Interdis. Appl., 120: 293-298.
Guastello, S.J. and Guastello, D.D., 198613. The occupational hazards survey. 2nd edn. Technical report available from Guastello & Guastello, 6260 South Lake Drive no. 1015, Cudahy, WI 53110, U.S.A.
Hackman, J.R., 1980. Work redesign and motivation. Prof. Psychol., 11: 445-456. Hackman, J.R., 1984. Designing work for individuals and groups. In: J.R. Hackman et al. (Eds.) ,
Perspectives on behavior in organizations. McGraw-Hill, New York, NY, pp. 242-257. National Safety Council, 1984. Accident facts. Annual report available from: National Safety
Council, 444 North Michigan Avenue, Chicago, IL 60611, U.S.A. Ouchi, W.G., 1983. Invited address. Proceedings of the Annual I/O and OB Graduate Students
Convention, 4: unnumbered. Ouchi, W.G. and Dawling, J.B., 1977. Defining the span of control. Administrative Sci., 22: 357-365. Porter, L.W. and Lawler, E.E., III, 1965. Properties of organizational structure related to job
attitudes and behavior. Psychol. Bull., 64: 23-51. Revans, R., 1958. Human relations, management, and size. In: E.M. Hugh-Jones (Ed.), Human
relations and modern management. North Holland Publishing, Amsterdam, pp. 177-220. Singh, R.B. and Moorjani, J.D., 1978. Morale as a function of communicative interaction in indus-
trial organizations. Psycho-Lingua, 8: 109-114. Taylor, J.A., 1953. A personality scale of manifest anxiety. J. Abnorm. Sot. Psychol., 48: 205-290. Zeitz, G., 1983. Structural and individual determinants of organizational morale and satisfaction.
Sot. Forces, 6: 1088-1108.