Embed Size (px)
Citation preview
ARTICLE
The relationship between surname frequency andY chromosome variation in Spain
Conrado Martinez-Cadenas1,2, Alejandro Blanco-Verea3, Barbara Hernando1, George BJ Busby2,4, Maria Brion3,Angel Carracedo3,5,6, Antonio Salas6 and Cristian Capelli*,2
In most societies, surnames are passed down from fathers to sons, just like the Y chromosome. It follows that, theoretically, men
sharing the same surnames would also be expected to share related Y chromosomes. Previous investigations have explored such
relationships, but so far, the only detailed studies that have been conducted are on samples from the British Isles. In order to
provide additional insights into the correlation between surnames and Y chromosomes, we focused on the Spanish population
by analysing Y chromosomes from 2121 male volunteers representing 37 surnames. The results suggest that the degree of
coancestry within Spanish surnames is highly dependent on surname frequency, in overall agreement with British but not Irish
surname studies. Furthermore, a reanalysis of comparative data for all three populations showed that Irish surnames have much
greater and older surname descent clusters than Spanish and British ones, suggesting that Irish surnames may have considerably
earlier origins than Spanish or British ones. Overall, despite closer geographical ties between Ireland and Britain, our analysis
points to substantial similarities in surname origin and development between Britain and Spain, while possibly hinting at unique
demographic or social events shaping Irish surname foundation and development.
European Journal of Human Genetics (2016) 24, 120–128; doi:10.1038/ejhg.2015.75; published online 22 April 2015
INTRODUCTION
In most human societies, surnames are paternally inherited, that is,they pass from a father to all of his children. The Y chromosome isalso inherited paternally, but it is passed only from father to son. Intheory then, males sharing the same surname should also shareidentical or closely related Y chromosomes.Several studies over the past few years1–6 have investigated the
relationship between surnames and Y chromosomes, and havegenerally concluded that surnames are informative markers that canhelp disentangle hidden population structure and give insight into pasthistorical events.Up until now, all large-scale studies focusing on the relationship
between Y chromosome and surname have been carried out onpopulations from Ireland and Britain.7–9 These studies reported asimilar degree of correlation between surname and Y chromosome,the mean proportion of men belonging to groups of related Ychromosome haplotypes (indicated as descent clusters) being approxi-mately 60% in both studies. However, the striking discrepancy in thecorrelation between Y chromosome sharing and surname frequencysets both works apart. In the British study, surnames with more than5000 or so bearers at the national level showed relatively little or no Ychromosome coancestry, with an overall tendency towards more Ychromosome haplotype sharing as surnames became less frequent.7,9
By contrast, common and extremely common Irish surnamesdisplayed very strong Y chromosome coancestry levels.8 The authorsconcluded that the observed differences may have been caused by
stronger drift in Ireland, perhaps brought about by the predominanceof specific patrilineal clans or lineages, by smaller population sizes orby different demographic and historical events in Ireland andBritain.7–9
Given the reported discrepancy, it is not clear what the patternmight be in populations from other countries. To understand thisfurther, we investigated Y chromosome variation and surnames inSpain, a Southern European population with a different historical,demographic and genetic background to the British Isles. Our resultsmatch the previous observations in British but not Irish surnames,suggesting perhaps that the inverse correlation between surnamefrequency and Y chromosome coancestry is a more general process,and that Irish surnames developed under more unusual and Irish-specific circumstances.
MATERIALS AND METHODS
SamplesA total of 1766 DNA samples from unrelated male volunteers each bearing one
of 37 selected Spanish surnames and 355 Spanish controls were collected. Most
of the samples were obtained by postal requests sent to potential participants
randomly selected from the Spanish telephone directory. Volunteers performed
self-collection of buccal cheek samples with a sterile cytology brush following
the instructions included in the letter. Participants were asked to read and sign
a written informed consent and to fill in a questionnaire with personal details
such as name, place of birth of self, father, mother and paternal grandfather.
Only samples with paternal grandfathers born in Spain were finally used.
1Department of Medicine, Jaume I University of Castellon, Castellon, Spain; 2Human Evolutionary Genetics Group, Department of Zoology, University of Oxford, Oxford, UK;3Instituto de Investigación Sanitaria de Santiago de Compostela, Grupo de Medicina Xenómica, Complexo Hospitalario Universitario de Santiago de Compostela, Santiago deCompostela, Spain; 4Wellcome Trust Centre for Human Genetics, Roosevelt Drive, Oxford, UK; 5Center of Excellence in Genomic Medicine Research, King Abdulaziz University,Jeddah, Saudi Arabia; 6Unidade de Xenética, Departamento de Anatomía Patolóxica e Ciencias Forenses, Instituto de Ciencias Forenses, Facultade de Medicina, Universidade deSantiago de Compostela, Santiago de Compostela, Spain*Correspondence: Dr C Capelli, Department of Zoology, University of Oxford, The Tinbergen Building, South Parks Road, Oxford OX1 3PS, UK. Tel: +44 1865 271261;Fax: +44 1865 310447; E-mail: [email protected] 15 September 2014; revised 28 February 2015; accepted 17 March 2015; published online 22 April 2015
European Journal of Human Genetics (2016) 24, 120–128& 2016 Macmillan Publishers Limited All rights reserved 1018-4813/16
www.nature.com/ejhg
Buccal swabs and documents were sent back to CM-C by using a pre-stampedenvelope.The 37 Spanish surnames were selected to provide a wide geographical
coverage, to represent surnames across the full frequency spectrum and from asample of different surname types. Among the selected surnames, we definedfive frequency classes: extremely frequent (surnames with more than 150 000national bearers), moderately frequent (between 15 000 and 150 000 bearers),medium (between 5000 and 15 000 individuals), rare (between 3000 and 5000bearers) and very rare (between 100 and 3000 bearers). If the medium and therare categories are grouped together, each of these different frequency classesrepresents approximately 25% of the Spanish population. We also chosesurnames with Castilian, Catalan and Basque origin and those that belong todifferent surname types or categories (Table 1). An additional set of 355Spanish control subjects was also collected, genotyped and analysed. Controlswere also recruited mainly via postal request; they all have different surnames,and were chosen randomly from the telephone directories of the sameprovinces where the surname samples were collected. The final number ofcontrols from each province is proportional to the number of subjects used forthe surname-based analysis from the selected provinces. All data regardingsurname frequencies were taken from the Spanish National Statistics Institute(www.ine.es, year 2011).Only five spelling variants for the same surname were sampled and
accounted for in this study: Ansotegui/Ansuategui, Babiloni/Bibiloni, Bengoe-chea/Bengochea, Castell/Castel/Castells and Nortes/Norte. Surname variantsBengochea, Castells, Castel and Norte were extremely uncommon andrepresented only by 3, 2, 1 and 1 samples, respectively.Formal ethical approval for this project was obtained both from the Ethical
Committee of the University of Santiago de Compostela and from the EthicalCommittee of the Department of Health of the Autonomous Community ofGalicia, Spain (‘Xunta de Galicia’).
Laboratory methodsDNA extraction was performed using the ChargeSwitch Forensic DNApurification kit (Invitrogen, Eugene, OR, USA). Y chromosome STR genotyp-ing was conducted using the Yfiler PCR Amplification kit (Applied Biosystems,Foster City, CA, USA),10 which co-amplifies a total of 17 Y chromosome STRs(DYS19, DYS385a,b, DYS389I, DYS389II, DYS390, DYS391, DYS392, DYS393,DYS437, DYS438, DYS439, DYS448, DYS456, DYS458, DYS635 andGATAH4). Further information on the loci can be found on the YHRD andNIST webpages (www.yhrd.org; www.cstl.nist.gov/strbase/y_strs.htm). Twenty-two slowly mutating SNP markers (SRY-1532, M213, M9, M70, 92R7, M22,TAT, M173, P25, M269, M62, M172, M170, M26, M304, M201, M34, M81,M78, M35, M96 and M123) were grouped in three different multiplex sets, aspreviously described,11 and SNP results were used to assign Y chromosomehaplogroups. Multiplex PCR amplification of DNA samples was performedusing the Type-it Microsatellite PCR kit (QIAGEN, Dusseldorf, Germany). PCRreactions were carried out using 1ng of DNA as template, samples were run inan ABI PRISM 3730xl Genetic Analyzer, and the resulting genotypes wereanalysed with GeneMapper v3.2 (Applied Biosystems).All new marker and haplotypic data contained in this study have been
deposited in the YHRD database, reference access number YA004027(www.yhrd.org), and it is also available in an excel table provided assupplementary material.
Statistical analysisBasic descriptive statistics were calculated using the software packageARLEQUIN version 3.5.1.2.12 MDS analysis was based on the RST matrix ofSTR haplotypes using PROXSCAL in SPSS software version 11.5. Theseanalyses were carried out using 15 STRs—DYS385 was not included owingto uncertainty in locus assignation, while DYS389II alleles were estimated aftersubtracting the number of repeats at the DYS389I locus.Match probability scores were estimated for perfectly matching 17-STR
haplotypes (including the DYS385 locus), and they were calculated for eachindividual and then averaged within surnames.Median-joining networks were constructed using NETWORK, version 4.513
(www.fluxus-engineering.com/sharenet). All networks were constructed using
15 STR haplotypes (excluding the DYS385 locus) together with SNP markers.SNP markers were given a weight of 99, to reflect the virtual absence of back-mutations, while the more rapidly mutating STRs were given weights from 1 to5 depending on their variance within haplogroups in our population,as described elsewhere.14
The criteria to identify and characterise descent clusters within surnameswere defined following the exploration of our dataset. Thus, a numerical andneutral approach was used to define the descent clusters criteria, instead ofestablishing ad hoc rules based on the observation of the data as performed inthe previous British and Irish studies.8,9 We calculated the average number ofmutational steps between all pairs of samples belonging to the same haplogroupwithin a surname. Assuming a monophyletic origin for the haplotypes withina surname, such estimates should provide a hint of the maximum number ofmutational steps within a cluster, as well as being indicative of a plausiblenumber for the maximum number of mutational steps without a linkinghaplotype. As R1b is by far the most common haplogroup in Spain (reaching67% of the samples in this study), we considered that non-R1b descent clustersmight better represent ‘natural’ or ‘true’ related groups, as they are probably lessexposed to the introgression of identical by state chromosomes. This isexpected to be even more so in the case of less frequent surnames. Therefore,we reasoned that the average number of mutational steps between haplotypeswithin non-R1b haplogroups in the very rare, rare and medium frequencysurnames could be used as an indication of the maximum continuous numberof steps that could be left ‘empty’ or ‘unfilled’ within a network when defininga descent cluster (the value calculated here was 2.08: a maximum of twomutational steps equalling to one ‘empty’ or ‘unfilled’ spot or haplotype).Following the same logic, we turned again to non-R1b haplogroups in medium,rare and very rare surnames, and considered as the maximum number ofmutational steps between any two members of a cluster the upper 95%confidence interval of the mean number of mutational steps betweenhaplotypes belonging to the same haplogroup within each surname (the valuecalculated here was 5.16). Thus, we decided that five would be the maximumnumber of mutational steps between any two members of a cluster.Additionally, two identical haplotypes were considered to be the minimumnumber of chromosomes to form a cluster. Finally, in cases in which more thanone cluster could be identified or two clusters overlapped, the cluster with thelargest number of total individuals was selected.Times to the most recent common ancestor (TMRCAs) and their 95%
confidence intervals were calculated for all haplotypes included in the differentsurname descent clusters using the Ytime package (available at www.ucl.ac.uk/tcga/software/), based on the ASD statistic (Average Squared Distance).15,16
This approach requires the definition of a founder haplotype, and ASD is thencalculated between all chromosomes in the cluster and the founder one. Thefounder haplotype of each cluster was calculated using the most common alleleof each STR marker. The mutation rate used to estimate all TMRCAs wascalculated by averaging the mutation rate values across the 15 STR markersused, as published in the Y Chromosome Haplotype Reference Database(www.yhrd.org, release 37; 0.002635 per locus per generation). A malegeneration time of 31 years was used,17,18 and the mean age of all DNAsample donors (55 years) was subsequently added to the resulting TMRCA ageestimate. It is also worth mentioning that TMRCA estimates are alwayssubjected to errors inherent to time depth estimates from variable STRmutation rates. Note that Ytime can only be used when more than onedifferent haplotype exists in a cluster. Thus, TMRCAs were only calculated forclusters harbouring more than one haplotype. The age of clusters representedby a single haplotype can be reasonably considered as not older than clusterscomposed by two haplotypes only. We considered the age of the oldest of suchclusters (a total of 12 in the whole 15 STRs Spanish dataset) as being the mostconservative way to provide an approximate estimate of the antiquity of single-haplotype clusters (273 years).
Comparative dataIn order to rigorously compare the results obtained from Spain to publisheddata from other populations, Y chromosome haplotype data on British andIrish surnames were taken from the literature,8,9 and networks as well asdescent clusters were ascertained as explained above. As STR data from the
Y chromosomes and surnames in SpainC Martinez-Cadenas et al
121
European Journal of Human Genetics
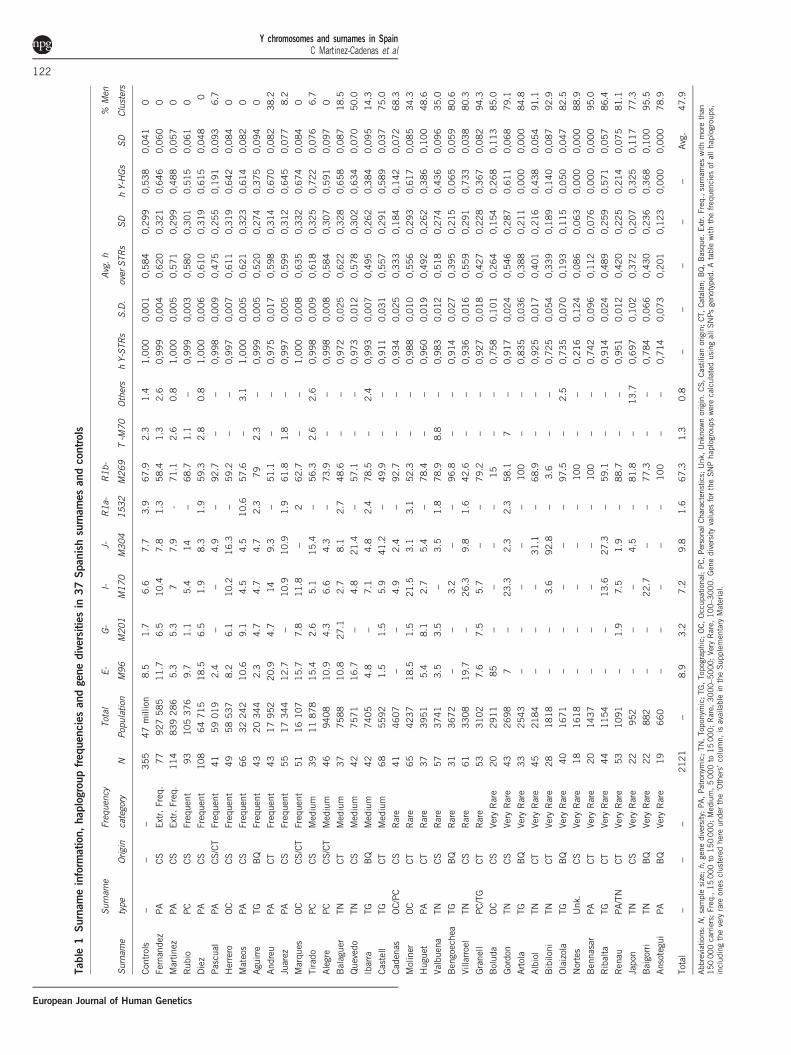
Table
1Surnameinform
ation,haplogroupfrequenciesandgenediversitiesin
37Spanishsurnamesandcontrols
Surnam
e
Surnam
e
type
Orig
in
Freq
uenc
y
category
N
Total
Popu
latio
n
E- M96
G-
M20
1
I-
M17
0
J-
M30
4
R1a
-
1532
R1b
-
M26
9T-M
70Others
hY-ST
Rs
S.D.
Avg.
h
over
STRs
SDhY-HGs
SD
%Men
Clusters
Con
trols
−−
−355
47million
8.5
1.7
6.6
7.7
3.9
67.9
2.3
1.4
1,000
0,001
0,584
0,299
0,538
0,041
0
Fernan
dez
PA
CS
Extr.Freq
.77
927585
11.7
6.5
10.4
7.8
1.3
58.4
1.3
2.6
0,999
0,004
0,620
0,321
0,646
0,060
0
Martin
ezPA
CS
Extr.Freq
.114
839286
5.3
5.3
77.9
-71.1
2.6
0.8
1,000
0,005
0,571
0,299
0,488
0,057
0
Rub
ioPC
CS
Freq
uent
93
105376
9.7
1.1
5.4
14
−68.7
1.1
−0,999
0,003
0,580
0,301
0,515
0,061
0
Diez
PA
CS
Freq
uent
108
64715
18.5
6.5
1.9
8.3
1.9
59.3
2.8
0.8
1,000
0,006
0,610
0,319
0,615
0,048
0
Pascu
alPA
CS/CT
Freq
uent
41
59019
2.4
−−
4.9
−92.7
−−
0,998
0,009
0,475
0,255
0,191
0,093
6.7
Herrero
OC
CS
Freq
uent
49
58537
8.2
6.1
10.2
16.3
−59.2
−−
0,997
0,007
0,611
0,319
0,642
0,084
0
Mateos
PA
CS
Freq
uent
66
32242
10.6
9.1
4.5
4.5
10.6
57.6
−3.1
1,000
0,005
0,621
0,323
0,614
0,082
0
Agu
irre
TGBQ
Freq
uent
43
20344
2.3
4.7
4.7
4.7
2.3
79
2.3
−0,999
0,005
0,520
0,274
0,375
0,094
0
And
reu
PA
CT
Freq
uent
43
17952
20.9
4.7
14
9.3
−51.1
−−
0,975
0,017
0,598
0,314
0,670
0,082
38.2
Juarez
PA
CS
Freq
uent
55
17344
12.7
−10.9
10.9
1.9
61.8
1.8
−0,997
0,005
0,599
0,312
0,645
0,077
8.2
Marqu
esOC
CS/CT
Freq
uent
51
16107
15.7
7.8
11.8
−2
62.7
−−
1,000
0,008
0,635
0,332
0,674
0,084
0
Tirado
PC
CS
Med
ium
39
11878
15.4
2.6
5.1
15.4
−56.3
2.6
2.6
0,998
0,009
0,618
0,325
0,722
0,076
6.7
Alegre
PC
CS/CT
Med
ium
46
9408
10.9
4.3
6.6
4.3
−73.9
−−
0,998
0,008
0,584
0,307
0,591
0,097
0
Balague
rTN
CT
Med
ium
37
7588
10.8
27.1
2.7
8.1
2.7
48.6
−−
0,972
0,025
0,622
0,328
0,658
0,087
18.5
Que
vedo
TNCS
Med
ium
42
7571
16.7
−4.8
21.4
−57.1
−−
0,973
0,012
0,578
0,302
0,634
0,070
50.0
Ibarra
TGBQ
Med
ium
42
7405
4.8
−7.1
4.8
2.4
78.5
−2.4
0,993
0,007
0,495
0,262
0,384
0,095
14.3
Castell
TGCT
Med
ium
68
5592
1.5
1.5
5.9
41.2
−49.9
−−
0,911
0,031
0,557
0,291
0,589
0,037
75.0
Cad
enas
OC/PC
CS
Rare
41
4607
−−
4.9
2.4
−92.7
−−
0,934
0,025
0,333
0,184
0,142
0,072
68.3
Moliner
OC
CT
Rare
65
4237
18.5
1.5
21.5
3.1
3.1
52.3
−−
0,988
0,010
0,556
0,293
0,617
0,085
34.3
Hug
uet
PA
CT
Rare
37
3951
5.4
8.1
2.7
5.4
−78.4
−−
0,960
0,019
0,492
0,262
0,386
0,100
48.6
Valbue
naTN
CS
Rare
57
3741
3.5
3.5
−3.5
1.8
78.9
8.8
−0,983
0,012
0,518
0,274
0,436
0,096
35.0
Ben
goeche
aTG
BQ
Rare
31
3672
−−
3.2
−−
96.8
−−
0,914
0,027
0,395
0,215
0,065
0,059
80.6
Villa
rroel
TNCS
Rare
61
3308
19.7
−26.3
9.8
1.6
42.6
−−
0,936
0,016
0,559
0,291
0,733
0,038
80.3
Grane
llPC/TG
CT
Rare
53
3102
7.6
7.5
5.7
−−
79.2
−−
0,927
0,018
0,427
0,228
0,367
0,082
94.3
Bolud
aOC
CS
Very
Rare
20
2911
85
−−
−−
15
−−
0,758
0,101
0,264
0,154
0,268
0,113
85.0
Gordo
nTN
CS
Very
Rare
43
2698
7−
23.3
2.3
2.3
58.1
7−
0,917
0,024
0,546
0,287
0,611
0,068
79.1
Artola
TGBQ
Very
Rare
33
2543
−−
−−
−100
−−
0,835
0,036
0,388
0,211
0,000
0,000
84.8
Albiol
TNCT
Very
Rare
45
2184
−−
−31.1
−68.9
−−
0,925
0,017
0,401
0,216
0,438
0,054
91.1
Bibilo
niTN
CT
Very
Rare
28
1818
−−
3.6
92.8
−3.6
−−
0,725
0,054
0,339
0,189
0,140
0,087
92.9
Olaizola
TGBQ
Very
Rare
40
1671
−−
−−
−97.5
−2.5
0,735
0,070
0,193
0,115
0,050
0,047
82.5
Nortes
Unk
.CS
Very
Rare
18
1618
−−
−−
−100
−−
0,216
0,124
0,086
0,063
0,000
0,000
88.9
Ben
nasar
PA
CT
Very
Rare
20
1437
−−
−−
−100
−−
0,742
0,096
0,112
0,076
0,000
0,000
95.0
Ribalta
TGCT
Very
Rare
44
1154
−−
13.6
27.3
−59.1
−−
0,914
0,024
0,489
0,259
0,571
0,057
86.4
Ren
auPA/TN
CT
Very
Rare
53
1091
−1.9
7.5
1.9
−88.7
−−
0,951
0,012
0,420
0,225
0,214
0,075
81.1
Japo
nTN
CS
Very
Rare
22
952
−−
−4.5
−81.8
−13.7
0,697
0,102
0,372
0,207
0,325
0,117
77.3
Baigorri
TNBQ
Very
Rare
22
882
−−
22.7
−−
77.3
−−
0,784
0,066
0,430
0,236
0,368
0,100
95.5
Ansotegui
PA
BQ
Very
Rare
19
660
−−
−−
−100
−−
0,714
0,073
0,201
0,123
0,000
0,000
78.9
Total
−−
−2121
−8.9
3.2
7.2
9.8
1.6
67.3
1.3
0.8
−−
−−
−Avg.
47.9
Abb
reviations:N,samplesize;h,
gene
diversity;PA
,Pa
tron
ymic;TN
,To
ponymic;TG
,To
pograp
hic;
OC,Occup
ationa
l;PC,
Persona
lCh
aracteristic
s;Unk
,Unk
nownorigin.CS,
Castilian
origin;CT
,Ca
talan;
BQ,Basqu
e.Extr.Freq
.,surnam
eswith
morethan
15000
0carriers;Freq
.,15000
to15
0000
;Med
ium,500
0to
1500
0;Rare,
3000–
5000
;Ve
ryRare,
100–
300
0.Gen
ediversity
values
fortheSN
Pha
plogroup
swerecalculated
usingallSN
Psgeno
type
d.Atablewith
thefreq
uenc
iesof
allha
plogroup
s,includ
ingthevery
rare
ones
clusteredhe
reun
derthe‘Others’
column,
isavailablein
theSu
pplemen
tary
Material.
Y chromosomes and surnames in SpainC Martinez-Cadenas et al
122
European Journal of Human Genetics

British and Irish study did not completely overlap with the Spanish one, onlySTRs genotyped in the three studies were used for all comparative calculations(DYS19, DYS389I, DYS389II, DYS390, DYS391, DYS392, DYS393, DYS437,DYS438 and DYS439). Owing to the reduced number of STR markers, descentcluster definition criteria for the comparative data were obviously somewhatstricter, and were established, as explained above, for samples belonging to rareor very rare surnames of the three populations (less than 5000 national carriers)and within infrequent haplogroups—R1b-M269 was excluded in all threepopulations, with the addition of I-M170 in Britain. There are only sevensurnames in the Irish study that can be considered rare or very rare, and in thosesurnames there are only nine samples in total that do not belong to haplogroupR1b. For this reason, we removed the Irish data from our calculations. Thecombined estimates for the Spanish (20 rare and very rare surnames in total)and British (32 rare and very rare surnames in total) surnames were 1.73 (SD0.9) average mutational steps between haplotypes belonging to uncommonhaplogroups and 3.61 as the 95% upper distribution of the number ofmutational steps between haplotypes. Following this, and visually inspectingthe various networks in the comparative dataset, we allowed only onemutational step between haplotypes belonging to the same cluster (that is, noempty or unfilled haplotypes were accepted), and considered three as themaximum number of mutational steps between any two members of a cluster.
RESULTS
The controls we used in this study showed haplogroup frequenciessimilar to previous Y chromosome studies in Spain,19–21 and most ofthe frequent and very frequent surnames showed haplogroup dis-tributions similar to this control set (Table 1). For other less frequentsurnames, in many cases, haplogroup composition was biased towardsone or two haplogroups, indicating that sampling men with the samesurname is far from random. This was the case for rare or very raresurnames, the most extreme cases being the very rare surnamesBennasar, Boluda, Bibiloni, Nortes, Artola, Ansotegui, Renau orBengoechea (Table 1).Both STR- and SNP-based gene diversity estimates were positively
associated with surname frequency (Table 1; Spearman’s r= 0.896;Po0.0001 for STR haplotypes and r= 0.749; Po0.0001 forhaplogroups).
We used MDS analysis to explore Y-STR haplotype relationshipsamong the different surnames and the control group (Figure 1).Surname frequency correlated with proximity to the centre of the plotand the Spanish controls (Figure 1). Indeed, except for two mediumfrequency surnames—Castell and Quevedo—all very frequent, fre-quent and medium frequency surnames were not significantlydifferent from the control group (Fisher’s exact test; Po0.05).On the other hand, many very rare surnames were not close to theother surnames or the controls, some of the rare and very raresurnames being outliers dominated entirely by one or two clusters ofvery similar haplotypes belonging to only one haplogroup (Figure 1).The match probability score determines the probability that two
random men chosen from the same group (same surname in our case)will share an identical Y chromosome (17-STR haplotype; Figure 2).Although the probability scores were markedly different acrosssurnames, the more frequent surnames tended to have low matchprobabilities, while the rare and very rare surnames tended to havehigher match probability values (Spearman’s Rank Correlation,r= 0.906; Po0.0001).We identified clusters of related haplotypes using median-joining
networks in the less frequent surnames, while networks of common orvery common surnames show less haplotype clustering (Figure 3;Supplementary Material).The haplotype network for the Spanish control group is almost
entirely made up of different haplotypes occurring only once(singletons). Most of the frequent and very frequent surnames behavein quite a similar manner, showing remarkably high haplotypediversity, as well as a few of the less common ones (SupplementaryMaterial), reflecting the low degree of coancestry intrinsic to thesesurnames. For example, surnames such as Fernandez, Martinez,Rubio, Diez, Herrero or Pascual are also almost entirely composedof singletons. Even less common surnames such as Marques, Aguirre,Ibarra, Juarez or Tirado are almost exclusively represented by uniquehaplotypes, and thus show a complete lack of descent clusters. It isworth underlining here that the proportion of the population
Figure 1 Multidimensional scaling plot based on Y-STR haplotypes. MDS analysis was based on an RST matrix of all surnames and controls.
Y chromosomes and surnames in SpainC Martinez-Cadenas et al
123
European Journal of Human Genetics

represented by the most frequent surnames is extremely large in Spain,much larger than in Ireland or Britain.8,9 For example, the 10commonest surnames account for approximately 20% of the Spanishpopulation (National Statistics Institute, www.ine.es), whereas theserepresent only 6.4 and 8.5% in Britain and Ireland, respectively.7,22
Less common surnames display networks different from the controlsor the frequent surnames, with most of their chromosomes beinggrouped in or around one single cluster of haplotypes. However, insome of the very rare surnames and in most, but not all, of the raresurnames, multiple clusters can be seen (usually three, four or moreclusters) showing that, often, there is more than one ancestor to mensharing the same surname, even for rare ones (Supplementary Material).
Descent clusters and time depthsWe defined a total of 84 descent clusters in the 37 surnames analysedin this study (Supplementary Material). Out of these 84 clusters, 40contained more than one different haplotype, with the remaining onesbeing composed solely of identical haplotypes.The average percentage of men included in descent clusters taking
into account all sampled surnames was 47.9%, while the percentagefor the control sample set was 0% (Table 1). The percentage of men ina descent cluster was also zero in 11 of the 13 most common surnamesof the study, whereas a large fraction of the men belonging to rare orvery rare surnames were included in descent clusters, with an averageof 78% (Table 1). A strong correlation between surname frequencyand the fraction of men included in descent clusters was observed(Spearman’s Rank Correlation, r= 0.859; Po0.0001).
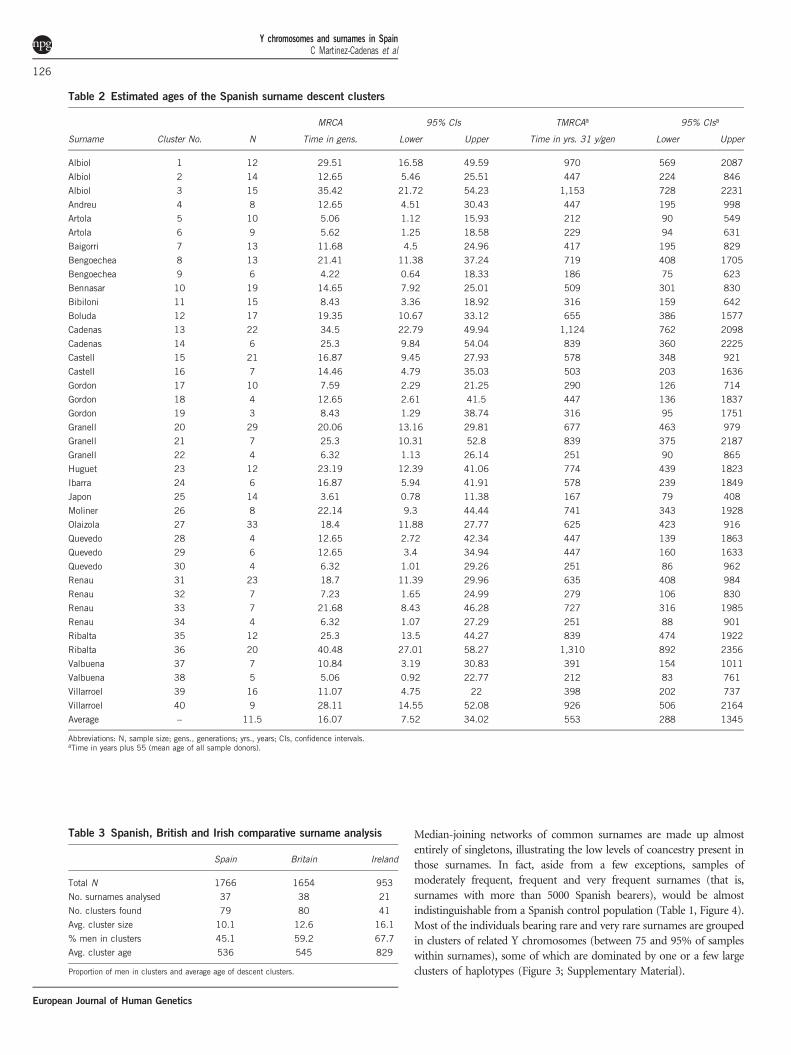
TMRCAs for surname descent clustersAges of Spanish descent clusters ranged from 167 years for the Japoncluster to 1310 years for one of the Ribalta descent cluster. Only 8clusters out of the 84 total descent clusters (9.5%) were estimated tobe older than 800 years (Table 2), the earliest possible limit forhereditary surname establishment in Spain. We noted that 20 of the 40
descent clusters (50%) where the TMRCA was estimated—andpotentially all of the 44 single-haplotype clusters—were younger than450 years of age.
Comparative analysis of Spanish, British and Irish surnamesWe constructed comparative median-joining networks and descentclusters for Spanish, British and Irish populations and estimatedTMRCAs for surnames from all three populations with the 10 sharedgenotyped Y-STRs. These analyses were performed only for surnameswith 15 or more samples (37 Spanish, 38 British and 21 Irishsurnames; Table 3; Supplementary Material).Table 3 summarises the results obtained for all three populations
using exactly the same conditions—Y chromosome STR markers, STRmutation rate, cluster definition criteria, TMRCA estimation (ASD)and male generation time (31 years). Irish surnames display muchbigger descent clusters, with a greater number of individuals percluster (average cluster size of 16.1) than Spanish (10.1) or British(12.6) surnames. Likewise, Irish surnames also show higher percen-tages of men within descent clusters (67.7%), as well as older clusters(829 years) than both the Spanish (45.1% and 536 years) and Britishsurnames (59.2% and 545 years), even though the number of totaldescent clusters in Ireland is not larger than the one estimated forSpain or Britain (Table 3). Overall, British surnames adopt anintermediate position between the Irish—who have a higher percen-tage of men included in larger and older clusters—and the Spanish—who have lower percentages of men included in smaller and youngerdescent clusters—surnames, although as a whole they seem to becloser to the Spanish than to the Irish surnames in all the analysesperformed. Tukey range test values after one-way ANOVA testsamong all three populations for cluster size, proportion of men inclusters and cluster ages were all significant between Ireland and theother two populations (P values of 0.003, 0.007 and 0.009, respectively,between Ireland and Spain; and P values of 0.017, 0.037 and 0.011,respectively, between Ireland and Britain), whereas they were not
Figure 2 Match probability. Match probability scores plotted against surnames ranked by decreasing frequencies. A trend line and the R2 value arealso shown.
Y chromosomes and surnames in SpainC Martinez-Cadenas et al
124
European Journal of Human Genetics

significant between Britain and Spain (except for the proportion ofmen in clusters, P= 0.043).
DISCUSSION
The study of 37 surnames in the Spanish population reported here hasshown that there is a remarkable correlation between Y chromosomehaplotypes and many of the surnames in Spain. This is supported byseveral observations: (i) the gene diversity of men sharing a surname isin general low, lower than the gene diversity of the control popula-tions; (ii) the probability of a man sharing an identical 17 STR Ychromosome haplotype with another man of the same surname
(match probability) is greatly increased with respect to the generalpopulation (Figure 2); and (iii) descent clusters are present in mostsurnames, and absent in the controls, clearly suggesting that there is anassociation between Y chromosomes and surnames in Spain.
Correlation between surname frequency and degree of coancestryOur results also suggest that the degree of coancestry within surnamesdepends, to a large extent, on the frequency of the surname in thepopulation. Frequent and very frequent surnames are characterised byhigh levels of gene diversity, entirely comparable with controls,whereas less common surnames show lower diversity values.
Figure 3 Selected median-joining networks. A selection of median-joining networks representing Y haplogroup and Y STR diversity within surnames plus thecontrol sample set. Each circle represents a distinct haplotype, with circle area proportional to frequency and with the smallest circle in each networkrepresenting n=1. The line length between haplotypes indicates their mutational divergence (SNP and STR mutational steps). The small red dots are medianvectors (hypothesised and often ancestral sequences required to connect existing sequences within the network). Borders of descent clusters are displayed bythe solid-line ellipses.
Y chromosomes and surnames in SpainC Martinez-Cadenas et al
125
European Journal of Human Genetics
Median-joining networks of common surnames are made up almostentirely of singletons, illustrating the low levels of coancestry present inthose surnames. In fact, aside from a few exceptions, samples ofmoderately frequent, frequent and very frequent surnames (that is,surnames with more than 5000 Spanish bearers), would be almostindistinguishable from a Spanish control population (Table 1, Figure 4).Most of the individuals bearing rare and very rare surnames are groupedin clusters of related Y chromosomes (between 75 and 95% of sampleswithin surnames), some of which are dominated by one or a few largeclusters of haplotypes (Figure 3; Supplementary Material).
Table 2 Estimated ages of the Spanish surname descent clusters
MRCA 95% CIs TMRCAa 95% CIsa
Surname Cluster No. N Time in gens. Lower Upper Time in yrs. 31 y/gen Lower Upper
Albiol 1 12 29.51 16.58 49.59 970 569 2087
Albiol 2 14 12.65 5.46 25.51 447 224 846
Albiol 3 15 35.42 21.72 54.23 1,153 728 2231
Andreu 4 8 12.65 4.51 30.43 447 195 998
Artola 5 10 5.06 1.12 15.93 212 90 549
Artola 6 9 5.62 1.25 18.58 229 94 631
Baigorri 7 13 11.68 4.5 24.96 417 195 829
Bengoechea 8 13 21.41 11.38 37.24 719 408 1705
Bengoechea 9 6 4.22 0.64 18.33 186 75 623
Bennasar 10 19 14.65 7.92 25.01 509 301 830
Bibiloni 11 15 8.43 3.36 18.92 316 159 642
Boluda 12 17 19.35 10.67 33.12 655 386 1577
Cadenas 13 22 34.5 22.79 49.94 1,124 762 2098
Cadenas 14 6 25.3 9.84 54.04 839 360 2225
Castell 15 21 16.87 9.45 27.93 578 348 921
Castell 16 7 14.46 4.79 35.03 503 203 1636
Gordon 17 10 7.59 2.29 21.25 290 126 714
Gordon 18 4 12.65 2.61 41.5 447 136 1837
Gordon 19 3 8.43 1.29 38.74 316 95 1751
Granell 20 29 20.06 13.16 29.81 677 463 979
Granell 21 7 25.3 10.31 52.8 839 375 2187
Granell 22 4 6.32 1.13 26.14 251 90 865
Huguet 23 12 23.19 12.39 41.06 774 439 1823
Ibarra 24 6 16.87 5.94 41.91 578 239 1849
Japon 25 14 3.61 0.78 11.38 167 79 408
Moliner 26 8 22.14 9.3 44.44 741 343 1928
Olaizola 27 33 18.4 11.88 27.77 625 423 916
Quevedo 28 4 12.65 2.72 42.34 447 139 1863
Quevedo 29 6 12.65 3.4 34.94 447 160 1633
Quevedo 30 4 6.32 1.01 29.26 251 86 962
Renau 31 23 18.7 11.39 29.96 635 408 984
Renau 32 7 7.23 1.65 24.99 279 106 830
Renau 33 7 21.68 8.43 46.28 727 316 1985
Renau 34 4 6.32 1.07 27.29 251 88 901
Ribalta 35 12 25.3 13.5 44.27 839 474 1922
Ribalta 36 20 40.48 27.01 58.27 1,310 892 2356
Valbuena 37 7 10.84 3.19 30.83 391 154 1011
Valbuena 38 5 5.06 0.92 22.77 212 83 761
Villarroel 39 16 11.07 4.75 22 398 202 737
Villarroel 40 9 28.11 14.55 52.08 926 506 2164
Average − 11.5 16.07 7.52 34.02 553 288 1345
Abbreviations: N, sample size; gens., generations; yrs., years; CIs, confidence intervals.aTime in years plus 55 (mean age of all sample donors).
Table 3 Spanish, British and Irish comparative surname analysis
Spain Britain Ireland
Total N 1766 1654 953
No. surnames analysed 37 38 21
No. clusters found 79 80 41
Avg. cluster size 10.1 12.6 16.1
% men in clusters 45.1 59.2 67.7
Avg. cluster age 536 545 829
Proportion of men in clusters and average age of descent clusters.
Y chromosomes and surnames in SpainC Martinez-Cadenas et al
126
European Journal of Human Genetics
Lack of correlation between surname type or origin and degree ofcoancestrySurname frequency, not surname type, is correlated with Y chromo-some coancestry in Spain. Although a larger number of surnameswould increase power, we can make a few simple comparisonsbetween different types of surnames (patronymic, toponymic, topo-graphic, occupational, etc.). For example, we can clearly see thatfrequent and very frequent patronymic surnames—such as Fernandez,Martinez, Diez, Juarez, Mateos or Pascual—show high values ofhaplotype gene diversity, as well as low proportions of men includedin clusters. However, rare or very rare surnames of patronymic originsuch as Ansotegui, Huguet or Bennasar show low gene diversity values,as well as high proportions of men included in clusters (Table 1).Additionally, rare or very rare surnames of topographic origin—suchas Artola, Ribalta, Olaizola, Bengoechea—or even a medium frequencysurname—like Castell—show higher percentages of men in clustersand lower haplotype gene diversities than more frequent topographicsurnames such as Aguirre or Ibarra. Occupational surnames alsoexhibit the same trend, with rare or very rare occupational surnameslike Moliner and Boluda being less genetically diverse and displayingmore individuals in clusters than frequent occupational names such asHerrero or Marques. Finally, a rare surname derived from a nicknameor personal characteristic—Cadenas—also has higher percentages ofmen in clusters and lower haplotype gene diversity values than thefrequent nickname surnames Alegre or Rubio.Surnames from different provinces behaved accordingly to the
number of bearers with no differences between surnames belonging todifferent regions (Castile, Catalonia or the Basque Country), the onlyobservation being that Catalan and especially Basque surnames simplytend to be less frequent than Castilian ones.All these examples suggest that surname type or surname origin
have no bearing on the correlation between Y chromosome andsurname, and that this association is only affected by surnamefrequency. Nevertheless, larger numbers of surnames belonging toall different surname types and regions are needed to fully test thisrelationship.
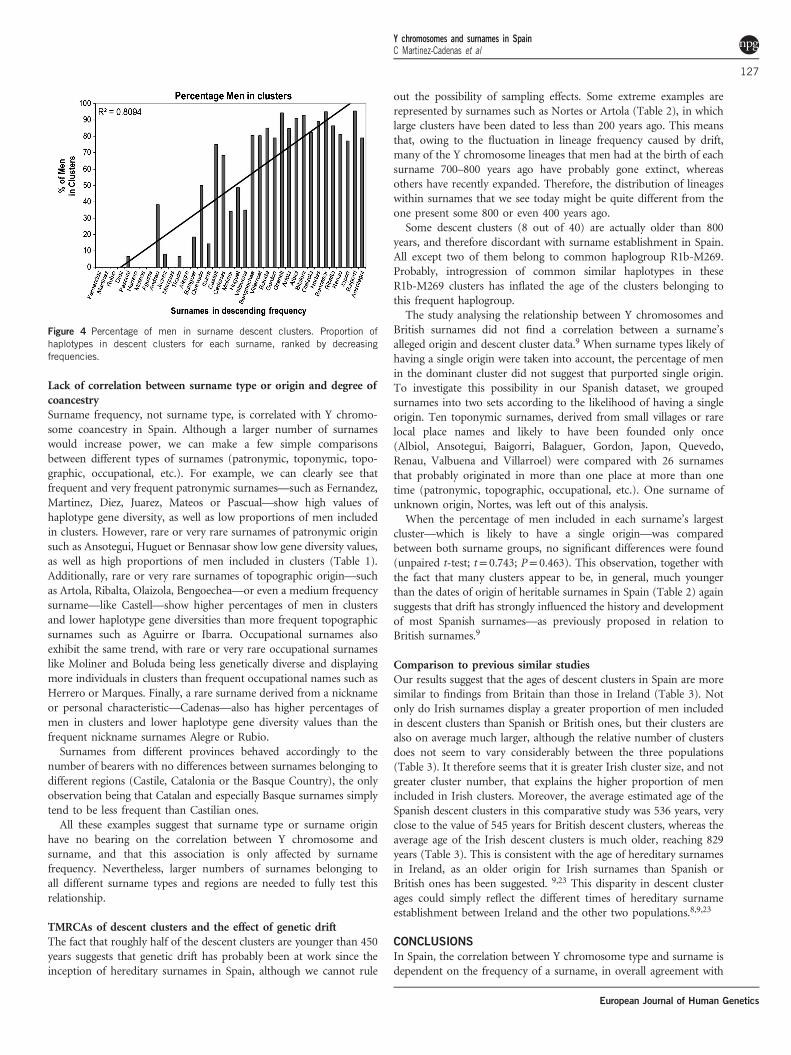
TMRCAs of descent clusters and the effect of genetic driftThe fact that roughly half of the descent clusters are younger than 450years suggests that genetic drift has probably been at work since theinception of hereditary surnames in Spain, although we cannot rule
out the possibility of sampling effects. Some extreme examples arerepresented by surnames such as Nortes or Artola (Table 2), in whichlarge clusters have been dated to less than 200 years ago. This meansthat, owing to the fluctuation in lineage frequency caused by drift,many of the Y chromosome lineages that men had at the birth of eachsurname 700–800 years ago have probably gone extinct, whereasothers have recently expanded. Therefore, the distribution of lineageswithin surnames that we see today might be quite different from theone present some 800 or even 400 years ago.Some descent clusters (8 out of 40) are actually older than 800
years, and therefore discordant with surname establishment in Spain.All except two of them belong to common haplogroup R1b-M269.Probably, introgression of common similar haplotypes in theseR1b-M269 clusters has inflated the age of the clusters belonging tothis frequent haplogroup.The study analysing the relationship between Y chromosomes and
British surnames did not find a correlation between a surname’salleged origin and descent cluster data.9 When surname types likely ofhaving a single origin were taken into account, the percentage of menin the dominant cluster did not suggest that purported single origin.To investigate this possibility in our Spanish dataset, we groupedsurnames into two sets according to the likelihood of having a singleorigin. Ten toponymic surnames, derived from small villages or rarelocal place names and likely to have been founded only once(Albiol, Ansotegui, Baigorri, Balaguer, Gordon, Japon, Quevedo,Renau, Valbuena and Villarroel) were compared with 26 surnamesthat probably originated in more than one place at more than onetime (patronymic, topographic, occupational, etc.). One surname ofunknown origin, Nortes, was left out of this analysis.When the percentage of men included in each surname’s largest
cluster—which is likely to have a single origin—was comparedbetween both surname groups, no significant differences were found(unpaired t-test; t= 0.743; P= 0.463). This observation, together withthe fact that many clusters appear to be, in general, much youngerthan the dates of origin of heritable surnames in Spain (Table 2) againsuggests that drift has strongly influenced the history and developmentof most Spanish surnames—as previously proposed in relation toBritish surnames.9
Comparison to previous similar studiesOur results suggest that the ages of descent clusters in Spain are moresimilar to findings from Britain than those in Ireland (Table 3). Notonly do Irish surnames display a greater proportion of men includedin descent clusters than Spanish or British ones, but their clusters arealso on average much larger, although the relative number of clustersdoes not seem to vary considerably between the three populations(Table 3). It therefore seems that it is greater Irish cluster size, and notgreater cluster number, that explains the higher proportion of menincluded in Irish clusters. Moreover, the average estimated age of theSpanish descent clusters in this comparative study was 536 years, veryclose to the value of 545 years for British descent clusters, whereas theaverage age of the Irish descent clusters is much older, reaching 829years (Table 3). This is consistent with the age of hereditary surnamesin Ireland, as an older origin for Irish surnames than Spanish orBritish ones has been suggested. 9,23 This disparity in descent clusterages could simply reflect the different times of hereditary surnameestablishment between Ireland and the other two populations.8,9,23
CONCLUSIONS
In Spain, the correlation between Y chromosome type and surname isdependent on the frequency of a surname, in overall agreement with
Figure 4 Percentage of men in surname descent clusters. Proportion ofhaplotypes in descent clusters for each surname, ranked by decreasingfrequencies.
Y chromosomes and surnames in SpainC Martinez-Cadenas et al
127
European Journal of Human Genetics

surnames in Britain,9 but not Ireland.8 As a whole, men bearing rareand very rare surnames share high levels of Y chromosome coancestry,whereas men with medium frequency, frequent and very frequentsurnames do not. We also find no correlation between surname typeand either Y chromosome coancestry or descent cluster formation.Drift has probably had a great impact in the history, development andcurrent distribution of most Spanish surnames, as inferred from thenature and age of most descent clusters described in the Spanishsurnames analysed in this study. Finally, as Irish descent clusters seemto be on average much older than British or Spanish ones, this study isin agreement with the historically well attested earlier time of surnameestablishment in Ireland than in Spain or Britain.23
CONFLICT OF INTEREST
The authors declare no conflict of interest.
ACKNOWLEDGEMENTS
We would like to thank all the DNA donors who volunteered to participate in
this study. We would also like to thank Dr Chris Tyler-Smith, Dr Bruce Winney
and especially Prof. Mark A. Jobling, for their extremely knowledgeable help as
well as their comments and ideas. CM-C was supported by a Marie Curie
Training and Mobility Research Fellowship from the European Commission of
the EU. Part of the research leading to these results received funding from the
People Programme (Marie Curie Actions) of the European Union's Seventh
Framework Programme FP7/2007–2013/ under REA grant agreement no.
290344, and the grants from the ‘Ministerio de Ciencia e Innovación’
(SAF2008-02971) and the Plan Galego IDT, Xunta de Galicia (EM 2012/045)
given to AS. GBJB was supported by a BBSRC Doctoral Training Fellowship.
1 Hill EW, Jobling MA, Bradley DG: Y-chromosome variation and Irish origins. Nature2000; 404: 351–352.
2 Moore LT, McEvoy B, Cape E, Simms K, Bradley DG: A Y-chromosome signature ofhegemony in Gaelic Ireland. Am J Hum Genet 2006; 78: 334–338.
3 Bowden GR, Balaresque P, King TE et al: Excavating past population structures bysurname-based sampling: the genetic legacy of the Vikings in northwest England. MolBiol Evol 2008; 25: 301–309.
4 Winney B, Boumertit A, Day T et al: People of the British Isles: preliminary analysis ofgenotypes and surnames in a UK-control population. Eur J Hum Genet 2012; 20:203–210.
5 Martinez-Gonzalez LJ, Martinez-Espin E, Alvarez JC et al: Surname and Y chromosomein Southern Europe: a case study with Colom/Colombo. Eur J Hum Genet 2012; 20:211–216.
6 Larmuseau MH, Vanoverbeke J, Van Geystelen A et al: Low historical rates of cuckoldryin a Western European human population traced by Y-chromosome and genealogicaldata. Proc Biol Sci 2013; 280: 20132400.
7 King TE, Ballereau SJ, Schürer KE, Jobling MA: Genetic signatures of coancestry withinsurnames. Curr Biol 2006; 160: 384–388.
8 McEvoy B, Bradley DG: Y-chromosomes and the extent of patrilineal ancestry in Irishsurnames. Hum Genet 2006; 119: 212–219.
9 King TE, Jobling MA: Founders, drift, and infidelity: the relationship betweenY chromosome diversity and patrilineal surnames. Mol Biol Evol 2009; 26:1093–1102.
10 Mulero JJ, Chang CW, Calandro LM et al: Development and validation of the AmpFlSTRYfiler PCR amplification kit: a male specific, single amplification 17 Y-STRmultiplex system. J Forensic Sci. 2006; 51: 64–75.
11 Brion M, Sobrino B, Blanco-Verea A, Lareu MV, Carracedo A: Hierarchical analysis of30 Y-chromosome SNPs in European populations. Int J Legal Med 2005; 119: 10–15.
12 Excoffier L, Laval G, Schneider S: Arlequin ver. 3.0: An integrated software package forpopulation genetics data analysis. Evol Bioinform Online 2005; 1: 47–50.
13 Bandelt H-J, Forster P, Röhl A: Median-joining networks for inferring intraspecificphylogenies. Mol Biol Evol 1999; 16: 37–48.
14 Qamar R, Ayub Q, Mohyuddin A et al: Ychromosomal DNA variation in Pakistan. Am JHum Genet 2002; 70: 1107–1124.
15 Goldstein DB, Ruiz Linares A, Cavalli-Sforza LL, Feldman MW: An evaluation of geneticdistances for use with microsatellite loci. Genetics 1995; 139: 463–471.
16 Behar DM, Thomas MG, Skorecki K et al: Multiple origins of Ashkenazi Levites:Y chromosome evidence for both Near Eastern and European ancestries. Am J HumGenet 2003; 73: 768–779.
17 Helgason A, Hrafnkelsson B, Gulcher JR, Ward R, Stefánsson K: A populationwidecoalescent analysis of Icelandic matrilineal and patrilineal genealogies: evidence for afaster evolutionary rate of mtDNA lineages than Y chromosomes. Am J Hum Genet2003; 72: 1370–1388.
18 Fenner JN: Cross-cultural estimation of the human generation interval for use ingenetics-based population divergence studies. Am J Phys Anthropol 2005; 128:415–423.
19 Flores C, Maca-Meyer N, González AM et al: Reduced genetic structure of the Iberianpeninsula revealed by Y-chromosome analysis: implications for population demography.Eur J Hum Genet 2004; 12: 855–863.
20 Cruciani F, La Fratta R, Trombetta B et al: Tracing past human male movements innorthern/eastern Africa and western Eurasia: new clues from Y-chromosomal hap-logroups E-M78 and J-M12. Mol Biol Evol 2007; 24: 1300–1311.
21 Adams SM, Bosch E, Balaresque PL et al: The genetic legacy of religious diversity andintolerance: paternal lineages of Christians, Jews, and Muslims in the IberianPeninsula. Am J Hum Genet 2008; 83: 725–736.
22 Telecom Éireann Irish Telephone Directory 1998; Dublin, Ireland.23 MacLysaght E: The Surnames of Ireland. Dublin: Irish Academic Press, 1985.
Supplementary Information accompanies this paper on European Journal of Human Genetics website (http://www.nature.com/ejhg)
Y chromosomes and surnames in SpainC Martinez-Cadenas et al
128
European Journal of Human Genetics