Embed Size (px)
Citation preview
Undergraduate Journal of Mathematical Undergraduate Journal of Mathematical
Modeling: One + Two Modeling: One + Two
Volume 11 | 2020 Fall 2020 Article 7
2020
The Relationship between Suicide Rates and Mental Health The Relationship between Suicide Rates and Mental Health
Provider Ratio Provider Ratio
Christian Bates University of South Florida, [email protected]
Advisors:
Arcadii Grinshpan, Mathematics and Statistics
Adriana Uruena-Agnes, Psychology
Problem Suggested By: Christian Bates
Follow this and additional works at: https://digitalcommons.usf.edu/ujmm
Part of the Mathematics Commons
UJMM is an open access journal, free to authors and readers, and relies on your support:
Donate Now
Recommended Citation Recommended Citation Bates, Christian (2020) "The Relationship between Suicide Rates and Mental Health Provider Ratio," Undergraduate Journal of Mathematical Modeling: One + Two: Vol. 11: Iss. 1, Article 7. DOI: https://doi.org/10.5038/2326-3652.11.1.4926 Available at: https://digitalcommons.usf.edu/ujmm/vol11/iss1/7
The Relationship between Suicide Rates and Mental Health Provider Ratio The Relationship between Suicide Rates and Mental Health Provider Ratio
Abstract Abstract This project is an analysis of the relationship between suicide rates and mental health provider ratio within the United States. Data from 2018 are collected for each state regarding its suicide rate, mental health provider ratio, and percent of population unable to receive treatment for mental health problems. An initial analysis is made using suicide rates and mental health provider ratio, with no correlation being found. A second analysis is conducted, using multiple linear regression with the percent of individuals within each state who were unable to access treatment for their mental health problems being the confounding variable. Controlling for the percent of individuals within each state who were unable to access treatment for their mental health problems provided a significant correlation between suicide rate
and mental health provider ratio (R2 = .961). This allows for further analysis, using integration to determine the average suicide rate using the equation of the trendlines for the graphs of both the unadjusted and adjusted data. The average suicide rate for the unadjusted graph is 16.32 per 100,000. For the adjusted graph, this number is 16.07 per 100,000. Findings imply that access to mental health providers and treatment availability decreases the amount of suicides within the United States.
Keywords Keywords suicide rate, mental health provider ratio, multiple linear regression, matrix operations, average value of a function
Creative Commons License Creative Commons License
This work is licensed under a Creative Commons Attribution-Noncommercial-Share Alike 4.0 License.
This article is available in Undergraduate Journal of Mathematical Modeling: One + Two: https://digitalcommons.usf.edu/ujmm/vol11/iss1/7

1
PROBLEM STATEMENT
The mental health crisis within the United States involving suicide may be correlated with a lack
of mental healthcare workers, so this concept should be analyzed.
MOTIVATION
The mental health crisis in the United States is one of great importance, as rates of mental
illness is relatively high. The effect of having mental health problems can be catastrophic for
individuals, leading to many drastic consequences. Of these consequences is suicide, a major
cause of death within the United States that has been increasing since 1999 (Stone et al., 2018).
The United States struggles with this concept, which has led to a call for an increase in the
amount of mental healthcare providers available (Walker et al., 2015). Access to mental
healthcare providers would in theory, be crucial in reducing the amount of suicides. Thus, this
paper aims to address how access to mental healthcare providers can affect suicide rates, by
providing a mathematical analysis of how the ratio of mental healthcare workers within different
regions affects suicide rates using data from. From this, implications regarding the reason for
high suicide rates can be inferred.
MATHEMATICAL DESCRIPTION AND SOLUTION APPROACH
To begin, data are collected from Mental Health America regarding the mental health
provider ratio within each state in 2018 (Mental Health in America - Access to Care Data 2018,
n.d.). Data are also collected from the CDC regarding the rates of suicide for each state (Stats of
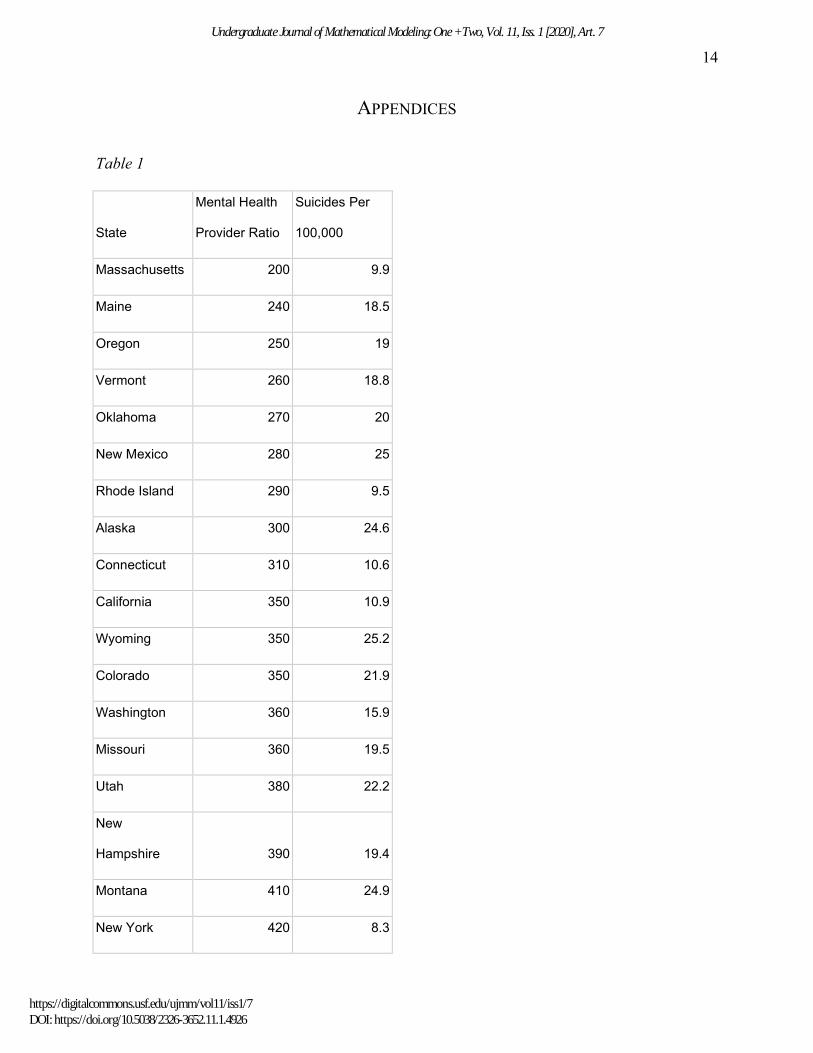
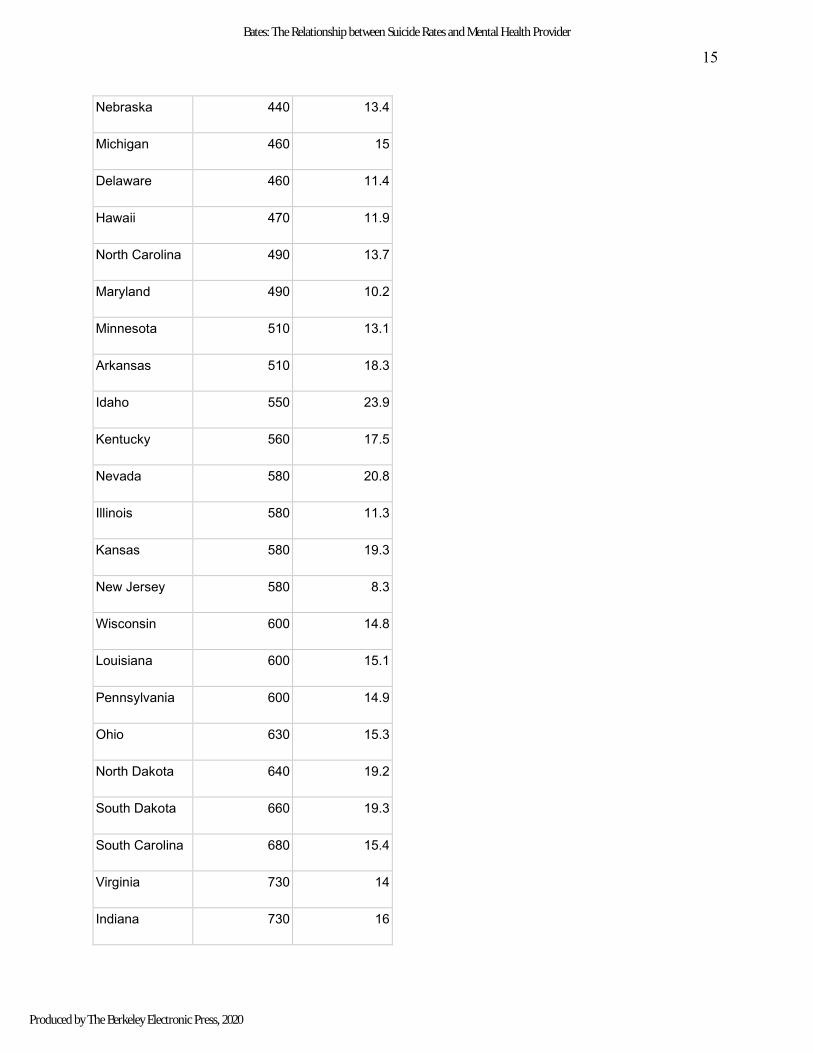
the State - Suicide Mortality, 2020). The mental health provider ratio displays how many people
Bates: The Relationship between Suicide Rates and Mental Health Provider
Produced by The Berkeley Electronic Press, 2020
2
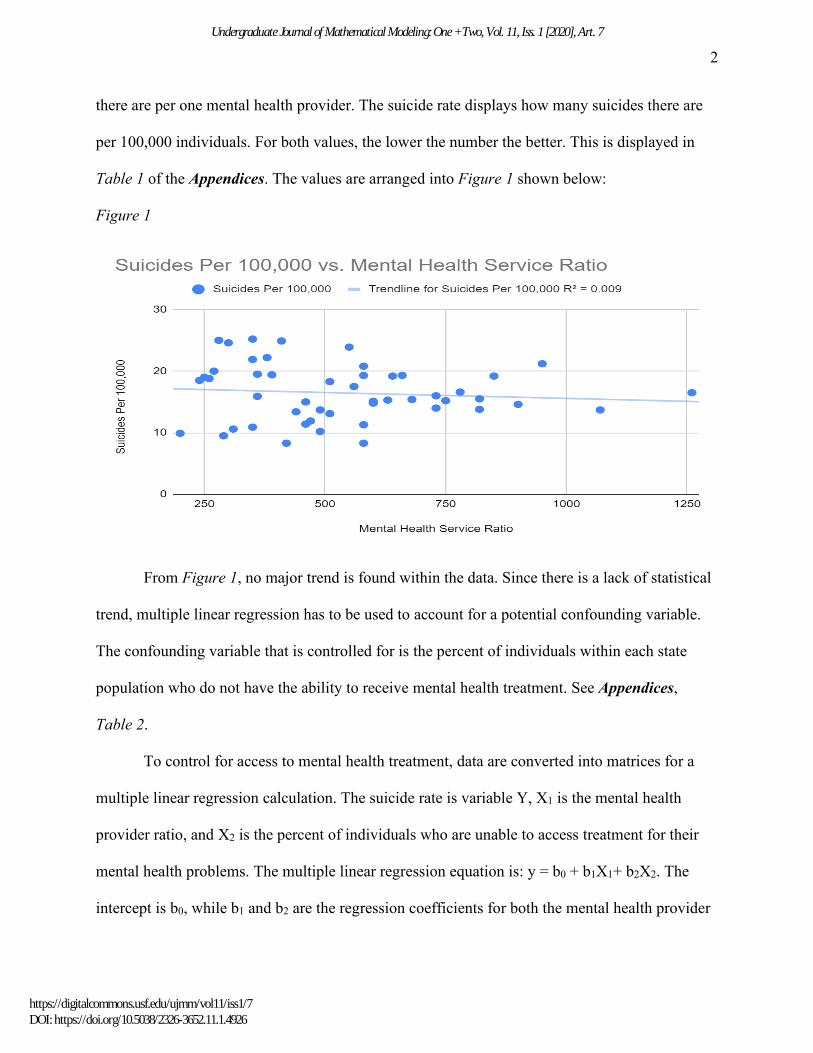
there are per one mental health provider. The suicide rate displays how many suicides there are
per 100,000 individuals. For both values, the lower the number the better. This is displayed in
Table 1 of the Appendices. The values are arranged into Figure 1 shown below:
Figure 1
From Figure 1, no major trend is found within the data. Since there is a lack of statistical
trend, multiple linear regression has to be used to account for a potential confounding variable.
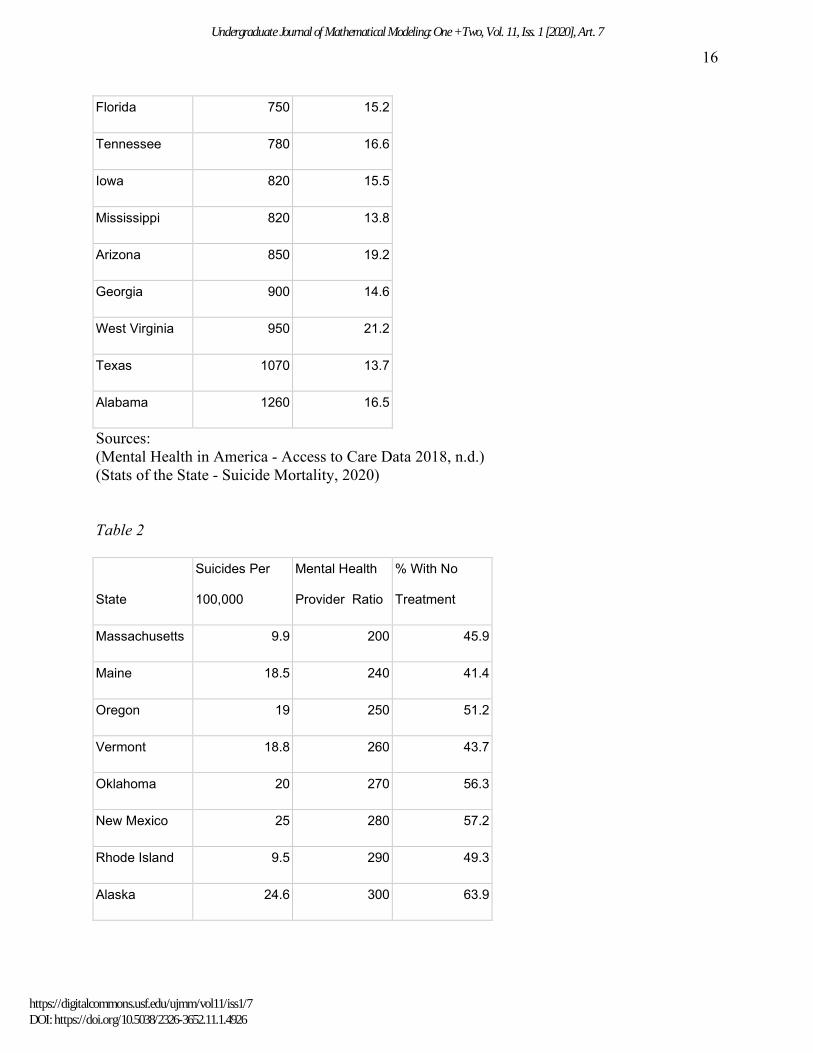
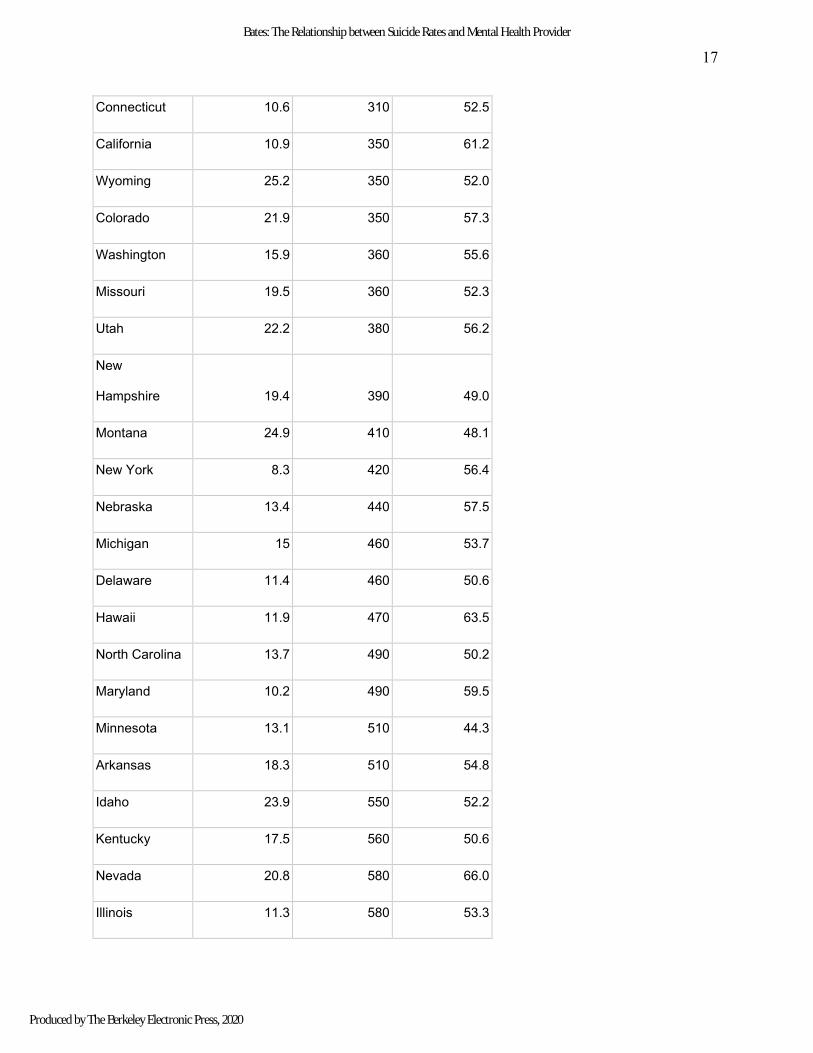
The confounding variable that is controlled for is the percent of individuals within each state
population who do not have the ability to receive mental health treatment. See Appendices,
Table 2.
To control for access to mental health treatment, data are converted into matrices for a
multiple linear regression calculation. The suicide rate is variable Y, X1 is the mental health
provider ratio, and X2 is the percent of individuals who are unable to access treatment for their
mental health problems. The multiple linear regression equation is: y = b0 + b1X1+ b2X2. The
intercept is b0, while b1 and b2 are the regression coefficients for both the mental health provider
Undergraduate Journal of Mathematical Modeling: One + Two, Vol. 11, Iss. 1 [2020], Art. 7
https://digitalcommons.usf.edu/ujmm/vol11/iss1/7DOI: https://doi.org/10.5038/2326-3652.11.1.4926
3
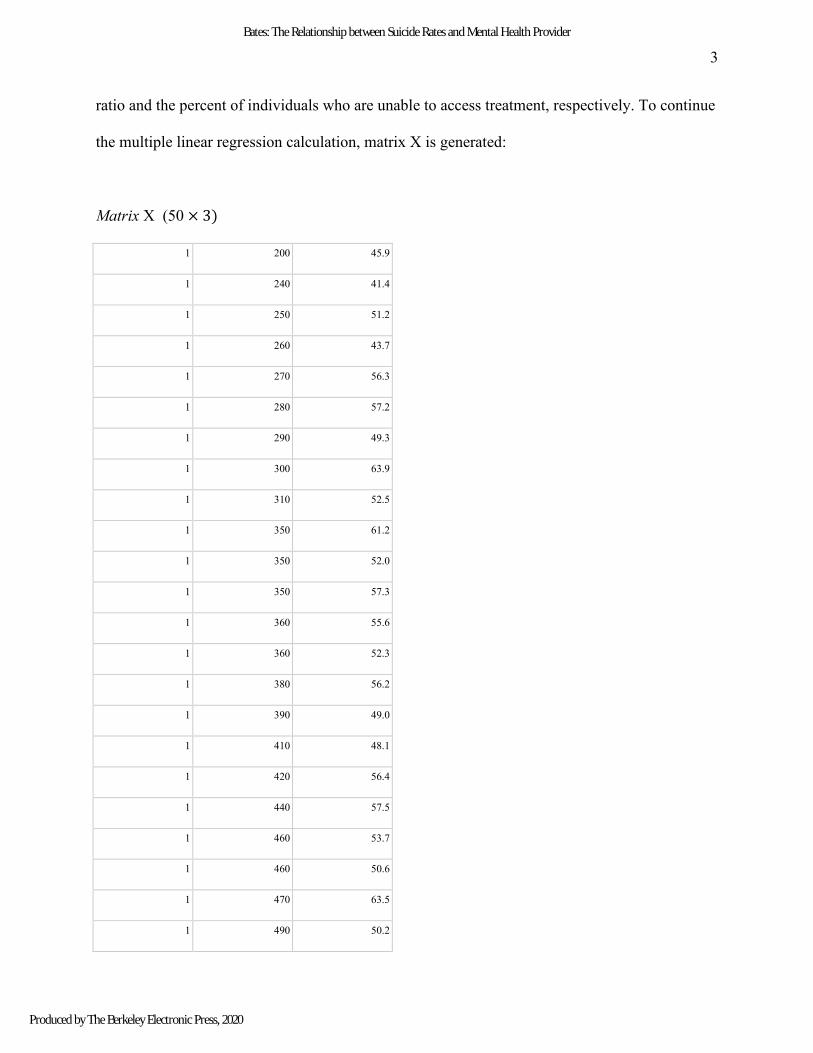
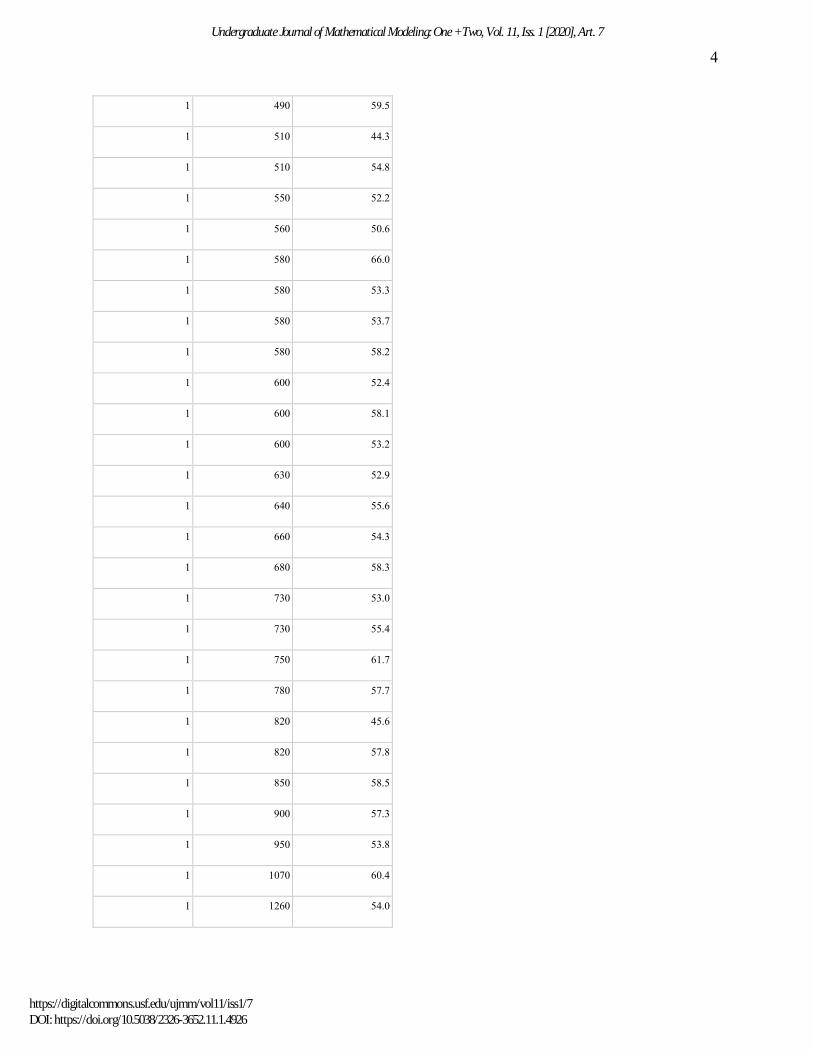
ratio and the percent of individuals who are unable to access treatment, respectively. To continue
the multiple linear regression calculation, matrix X is generated:
Matrix X (50 × 3)
1 200 45.9
1 240 41.4
1 250 51.2
1 260 43.7
1 270 56.3
1 280 57.2
1 290 49.3
1 300 63.9
1 310 52.5
1 350 61.2
1 350 52.0
1 350 57.3
1 360 55.6
1 360 52.3
1 380 56.2
1 390 49.0
1 410 48.1
1 420 56.4
1 440 57.5
1 460 53.7
1 460 50.6
1 470 63.5
1 490 50.2
Bates: The Relationship between Suicide Rates and Mental Health Provider
Produced by The Berkeley Electronic Press, 2020
4
1 490 59.5
1 510 44.3
1 510 54.8
1 550 52.2
1 560 50.6
1 580 66.0
1 580 53.3
1 580 53.7
1 580 58.2
1 600 52.4
1 600 58.1
1 600 53.2
1 630 52.9
1 640 55.6
1 660 54.3
1 680 58.3
1 730 53.0
1 730 55.4
1 750 61.7
1 780 57.7
1 820 45.6
1 820 57.8
1 850 58.5
1 900 57.3
1 950 53.8
1 1070 60.4
1 1260 54.0
Undergraduate Journal of Mathematical Modeling: One + Two, Vol. 11, Iss. 1 [2020], Art. 7
https://digitalcommons.usf.edu/ujmm/vol11/iss1/7DOI: https://doi.org/10.5038/2326-3652.11.1.4926
5
The first column of the matrix represents b0, or the intercept. The second column is the mental
health provider ratio, or X1, and the third column is the percent of individuals who are unable to
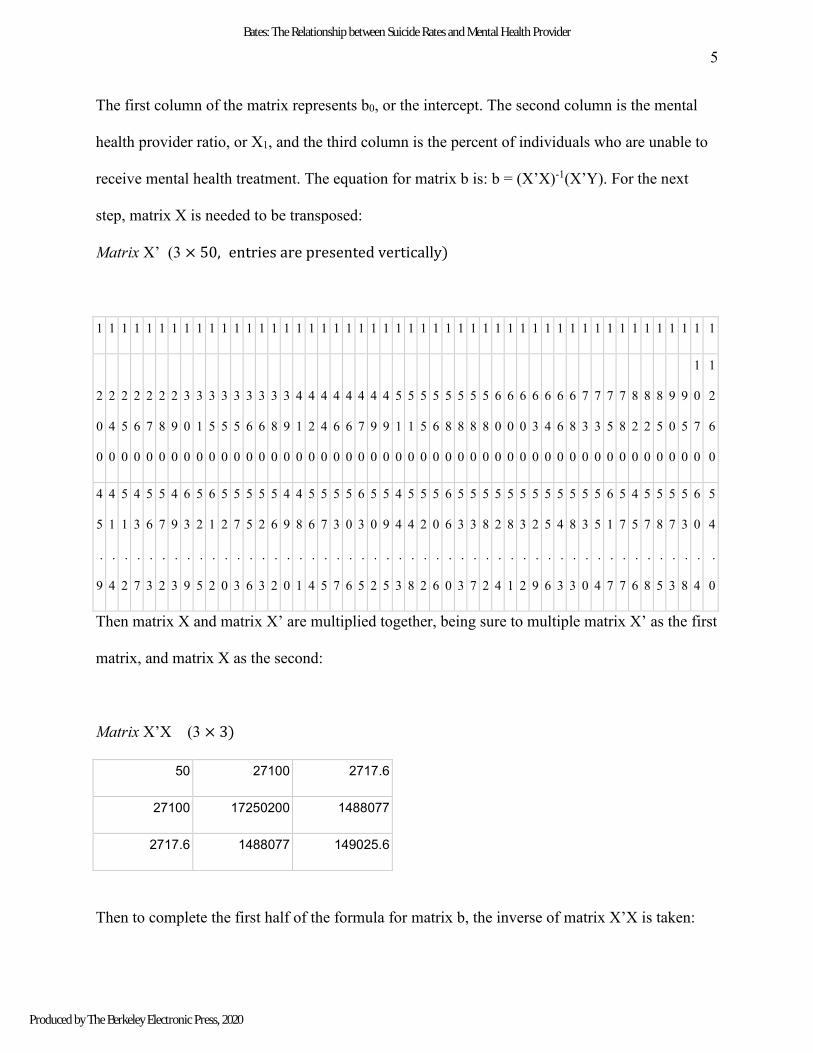
receive mental health treatment. The equation for matrix b is: b = (X’X)-1(X’Y). For the next
step, matrix X is needed to be transposed:
Matrix X’ (3 × 50, entries are presented vertically)
1 1 1 1 1 1 1 1 1 1 1 1 1 1 1 1 1 1 1 1 1 1 1 1 1 1 1 1 1 1 1 1 1 1 1 1 1 1 1 1 1 1 1 1 1 1 1 1 1 1
2
0
0
2
4
0
2
5
0
2
6
0
2
7
0
2
8
0
2
9
0
3
0
0
3
1
0
3
5
0
3
5
0
3
5
0
3
6
0
3
6
0
3
8
0
3
9
0
4
1
0
4
2
0
4
4
0
4
6
0
4
6
0
4
7
0
4
9
0
4
9
0
5
1
0
5
1
0
5
5
0
5
6
0
5
8
0
5
8
0
5
8
0
5
8
0
6
0
0
6
0
0
6
0
0
6
3
0
6
4
0
6
6
0
6
8
0
7
3
0
7
3
0
7
5
0
7
8
0
8
2
0
8
2
0
8
5
0
9
0
0
9
5
0
1
0
7
0
1
2
6
0
4
5
.
9
4
1
.
4
5
1
.
2
4
3
.
7
5
6
.
3
5
7
.
2
4
9
.
3
6
3
.
9
5
2
.
5
6
1
.
2
5
2
.
0
5
7
.
3
5
5
.
6
5
2
.
3
5
6
.
2
4
9
.
0
4
8
.
1
5
6
.
4
5
7
.
5
5
3
.
7
5
0
.
6
6
3
.
5
5
0
.
2
5
9
.
5
4
4
.
3
5
4
.
8
5
2
.
2
5
0
.
6
6
6
.
0
5
3
.
3
5
3
.
7
5
8
.
2
5
2
.
4
5
8
.
1
5
3
.
2
5
2
.
9
5
5
.
6
5
4
.
3
5
8
.
3
5
3
.
0
5
5
.
4
6
1
.
7
5
7
.
7
4
5
.
6
5
7
.
8
5
8
.
5
5
7
.
3
5
3
.
8
6
0
.
4
5
4
.
0
Then matrix X and matrix X’ are multiplied together, being sure to multiple matrix X’ as the first
matrix, and matrix X as the second:
Matrix X’X (3 × 3)
50 27100 2717.6
27100 17250200 1488077
2717.6 1488077 149025.6
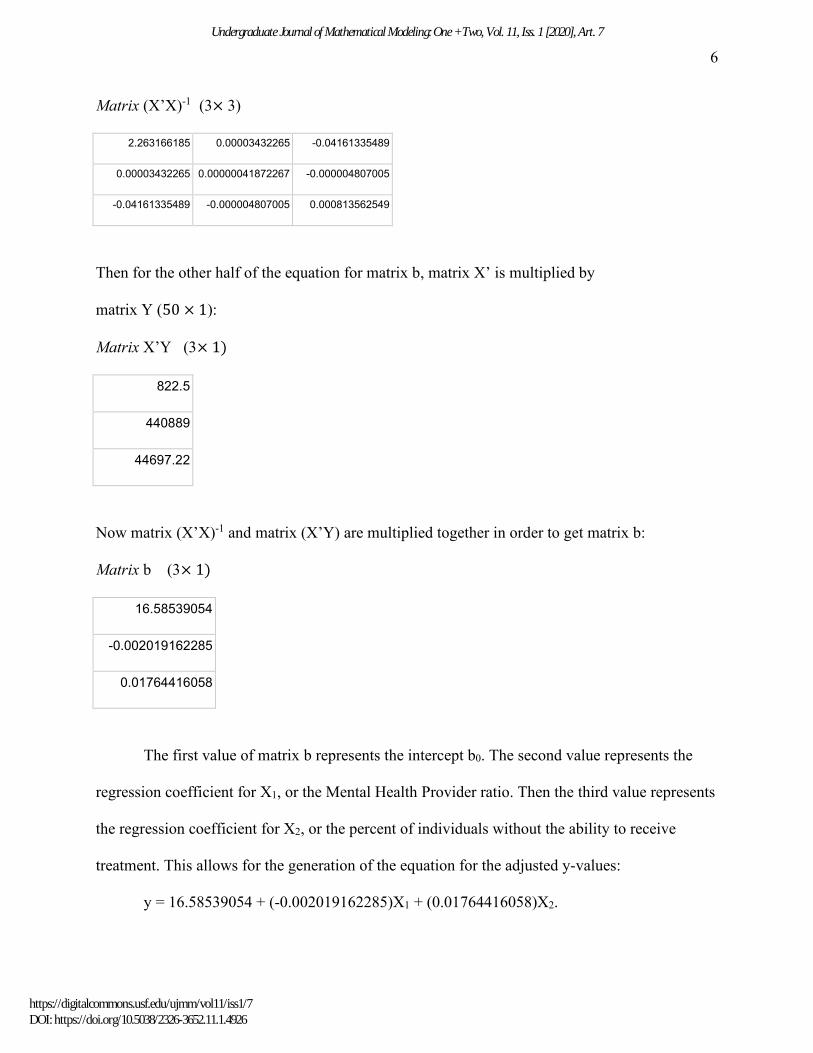
Then to complete the first half of the formula for matrix b, the inverse of matrix X’X is taken:
Bates: The Relationship between Suicide Rates and Mental Health Provider
Produced by The Berkeley Electronic Press, 2020
6
Matrix (X’X)-1 (3× 3)
2.263166185 0.00003432265 -0.04161335489
0.00003432265 0.00000041872267 -0.000004807005
-0.04161335489 -0.000004807005 0.000813562549
Then for the other half of the equation for matrix b, matrix X’ is multiplied by
matrix Y (50 × 1):
Matrix X’Y (3× 1)
822.5
440889
44697.22
Now matrix (X’X)-1 and matrix (X’Y) are multiplied together in order to get matrix b:
Matrix b (3× 1)
16.58539054
-0.002019162285
0.01764416058
The first value of matrix b represents the intercept b0. The second value represents the
regression coefficient for X1, or the Mental Health Provider ratio. Then the third value represents
the regression coefficient for X2, or the percent of individuals without the ability to receive
treatment. This allows for the generation of the equation for the adjusted y-values:
y = 16.58539054 + (-0.002019162285)X1 + (0.01764416058)X2.
Undergraduate Journal of Mathematical Modeling: One + Two, Vol. 11, Iss. 1 [2020], Art. 7
https://digitalcommons.usf.edu/ujmm/vol11/iss1/7DOI: https://doi.org/10.5038/2326-3652.11.1.4926
7
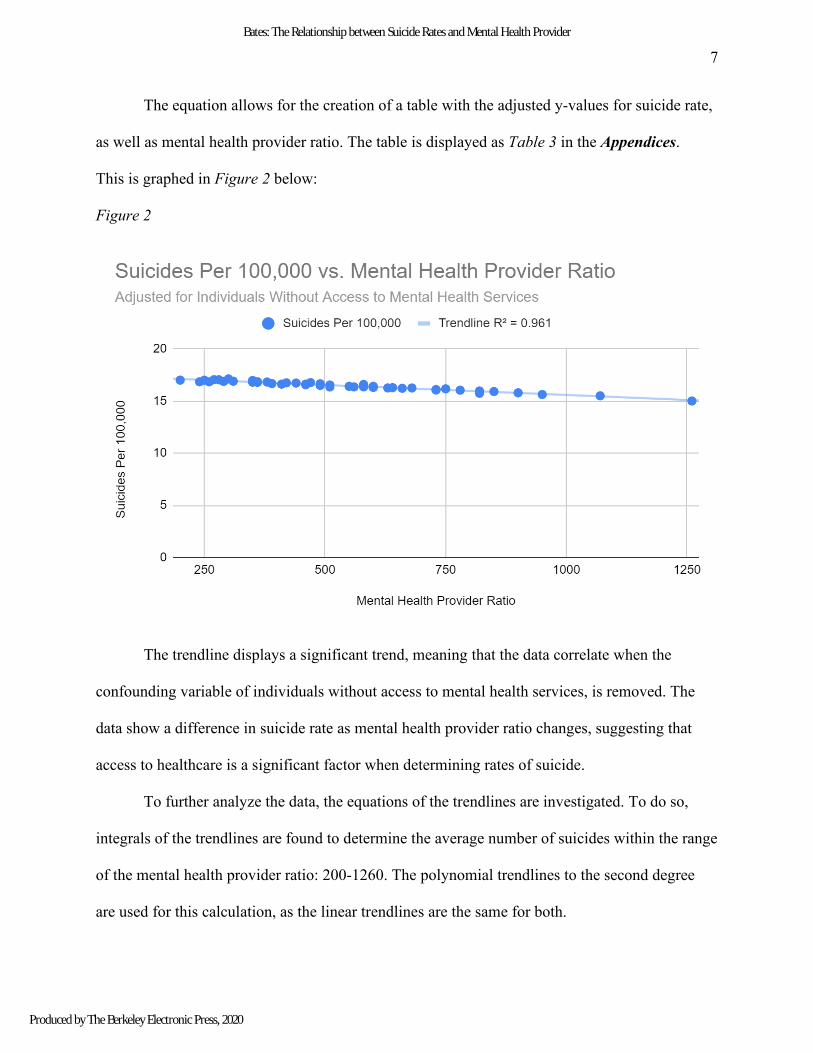
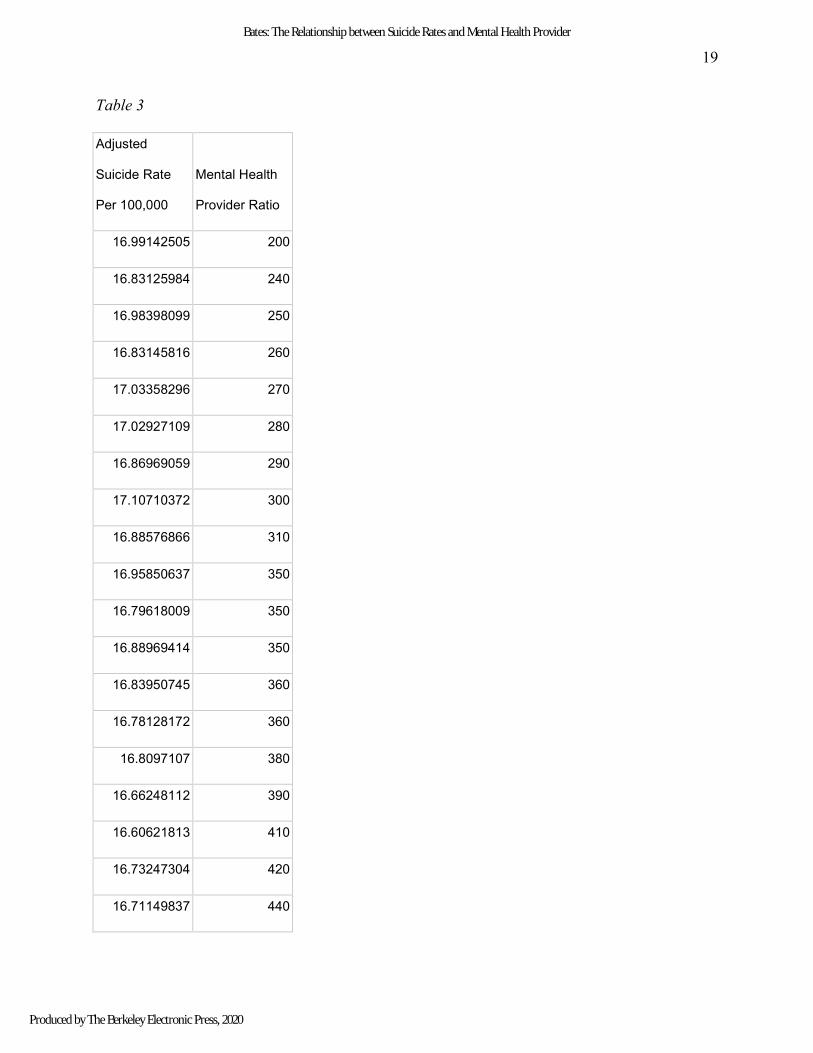
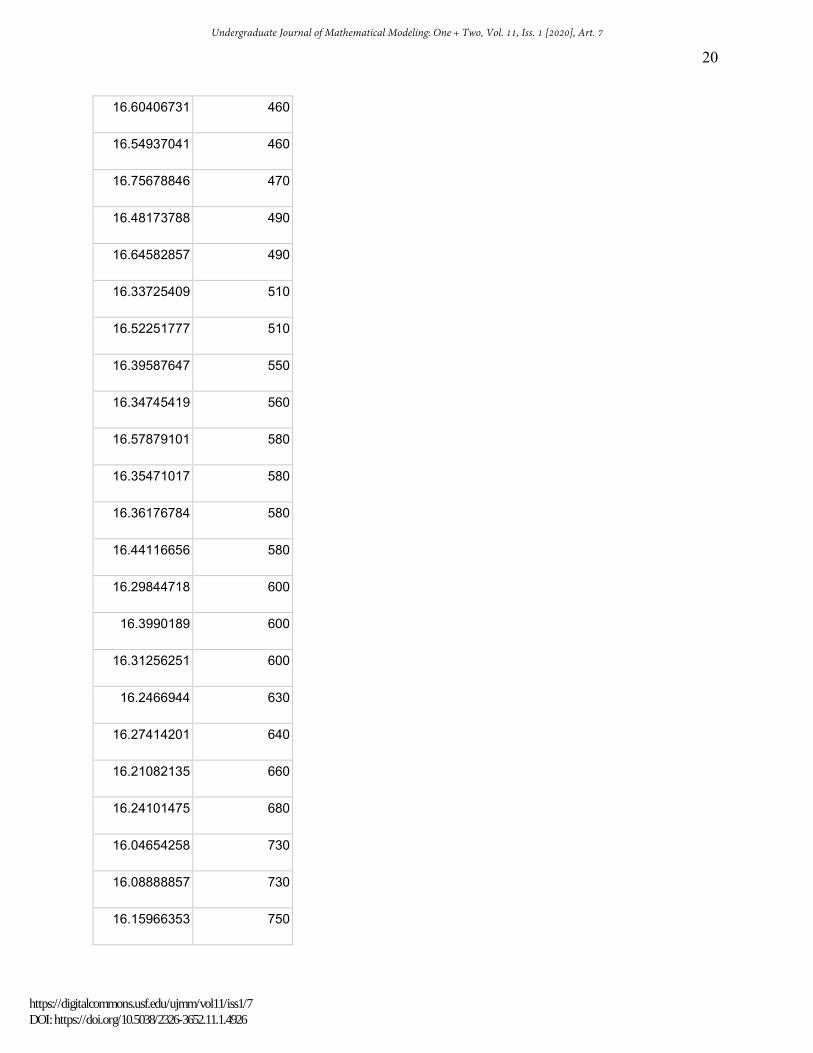
The equation allows for the creation of a table with the adjusted y-values for suicide rate,
as well as mental health provider ratio. The table is displayed as Table 3 in the Appendices.
This is graphed in Figure 2 below:
Figure 2
The trendline displays a significant trend, meaning that the data correlate when the
confounding variable of individuals without access to mental health services, is removed. The
data show a difference in suicide rate as mental health provider ratio changes, suggesting that
access to healthcare is a significant factor when determining rates of suicide.
To further analyze the data, the equations of the trendlines are investigated. To do so,
integrals of the trendlines are found to determine the average number of suicides within the range
of the mental health provider ratio: 200-1260. The polynomial trendlines to the second degree
are used for this calculation, as the linear trendlines are the same for both.
Bates: The Relationship between Suicide Rates and Mental Health Provider
Produced by The Berkeley Electronic Press, 2020

8
Trendline for Suicides Per 100,00 vs. Mental Health Provider Ratio (Without Adjustment):
f(x) = 19.6 - 0.00975x + 0.00000612x2
𝐹𝐹 (x) = ∫ 𝑓𝑓(𝑡𝑡)𝑑𝑑𝑡𝑡 =𝑥𝑥0 19.6x - 0.004875x2 + 0.00000204x3 𝑓𝑓𝑎𝑎𝑎𝑎𝑎𝑎 =
1(1260−200)∫ 𝑓𝑓(𝑥𝑥)𝑑𝑑𝑥𝑥1260
200
𝑓𝑓ave = [1/(1260-200)][ 𝐹𝐹(1260) - 𝐹𝐹(200)] ≈ (21037.2 - 3741.32)/1060 ≈ 16.317
suicides per 100,000
Trendline for Suicides Per 100,000 vs. Mental Health Provider Ratio (With Adjustment):
𝑓𝑓𝐴𝐴(x) = 17.4 - 0.00162x - 0.000000229x2
𝐹𝐹𝐴𝐴(x) = ∫ 𝑓𝑓𝐴𝐴(𝑡𝑡)𝑑𝑑𝑡𝑡 =𝑥𝑥0 17.4x - 0.00081x2 - 0.000000076333x3
𝑓𝑓𝐴𝐴(𝑎𝑎𝑎𝑎𝑎𝑎) = 1(1260−200)∫ 𝑓𝑓𝐴𝐴(𝑥𝑥) 𝑑𝑑𝑥𝑥1260
200
𝑓𝑓𝐴𝐴(𝑎𝑎𝑎𝑎𝑎𝑎) = [1/(1260-200)][ 𝐹𝐹𝐴𝐴(1260) - 𝐹𝐹𝐴𝐴(200)] ≈ (20485.3 – 3446.99)/1060 ≈ 16.074
suicides per 100,000
DISCUSSION
The initial linear regression without any adjustments to the obtained data resulted in
insignificant findings between suicide rates and mental health provider ratio. Multiple linear
regression was required in order to find a correlation between suicide rates and mental health
provider ratio, by accounting for a confounding factor. The confounding factor that was used was
the percent of individuals within each state who were unable to access treatment for their mental
health problems. After accounting for this the percent of individuals within each state who were
unable to access treatment for their mental health problems, a correlation between suicide rates
and mental health provider ratio was found, with an R2 value of .961. From the adjusted data,
Undergraduate Journal of Mathematical Modeling: One + Two, Vol. 11, Iss. 1 [2020], Art. 7
https://digitalcommons.usf.edu/ujmm/vol11/iss1/7DOI: https://doi.org/10.5038/2326-3652.11.1.4926
9
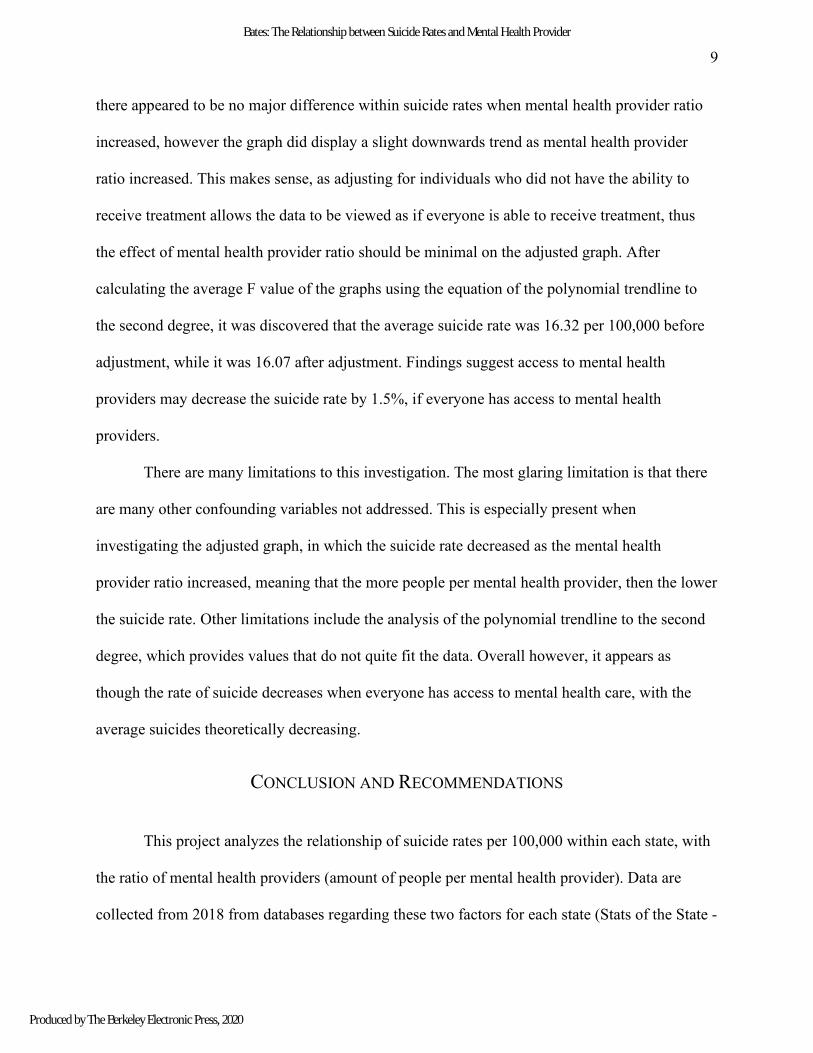
there appeared to be no major difference within suicide rates when mental health provider ratio
increased, however the graph did display a slight downwards trend as mental health provider
ratio increased. This makes sense, as adjusting for individuals who did not have the ability to
receive treatment allows the data to be viewed as if everyone is able to receive treatment, thus
the effect of mental health provider ratio should be minimal on the adjusted graph. After
calculating the average F value of the graphs using the equation of the polynomial trendline to
the second degree, it was discovered that the average suicide rate was 16.32 per 100,000 before
adjustment, while it was 16.07 after adjustment. Findings suggest access to mental health
providers may decrease the suicide rate by 1.5%, if everyone has access to mental health
providers.
There are many limitations to this investigation. The most glaring limitation is that there
are many other confounding variables not addressed. This is especially present when
investigating the adjusted graph, in which the suicide rate decreased as the mental health
provider ratio increased, meaning that the more people per mental health provider, then the lower
the suicide rate. Other limitations include the analysis of the polynomial trendline to the second
degree, which provides values that do not quite fit the data. Overall however, it appears as
though the rate of suicide decreases when everyone has access to mental health care, with the
average suicides theoretically decreasing.
CONCLUSION AND RECOMMENDATIONS
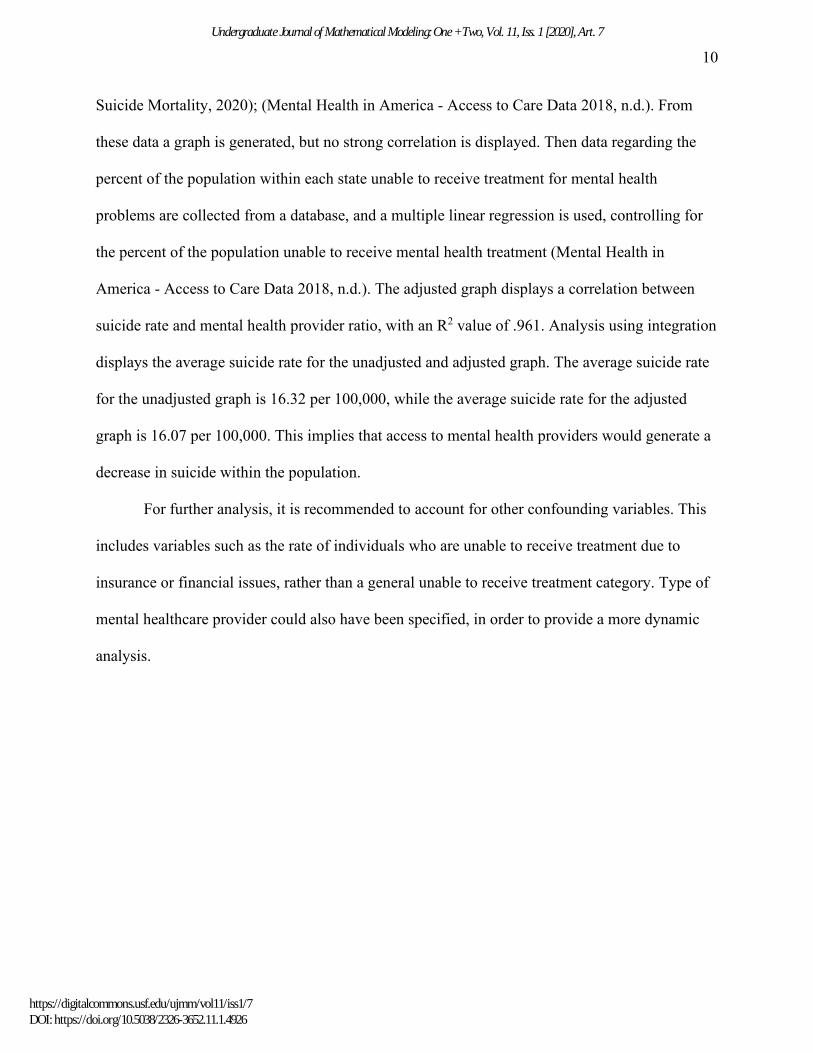
This project analyzes the relationship of suicide rates per 100,000 within each state, with
the ratio of mental health providers (amount of people per mental health provider). Data are
collected from 2018 from databases regarding these two factors for each state (Stats of the State -
Bates: The Relationship between Suicide Rates and Mental Health Provider
Produced by The Berkeley Electronic Press, 2020
10
Suicide Mortality, 2020); (Mental Health in America - Access to Care Data 2018, n.d.). From
these data a graph is generated, but no strong correlation is displayed. Then data regarding the
percent of the population within each state unable to receive treatment for mental health
problems are collected from a database, and a multiple linear regression is used, controlling for
the percent of the population unable to receive mental health treatment (Mental Health in
America - Access to Care Data 2018, n.d.). The adjusted graph displays a correlation between
suicide rate and mental health provider ratio, with an R2 value of .961. Analysis using integration
displays the average suicide rate for the unadjusted and adjusted graph. The average suicide rate
for the unadjusted graph is 16.32 per 100,000, while the average suicide rate for the adjusted
graph is 16.07 per 100,000. This implies that access to mental health providers would generate a
decrease in suicide within the population.
For further analysis, it is recommended to account for other confounding variables. This
includes variables such as the rate of individuals who are unable to receive treatment due to
insurance or financial issues, rather than a general unable to receive treatment category. Type of
mental healthcare provider could also have been specified, in order to provide a more dynamic
analysis.
Undergraduate Journal of Mathematical Modeling: One + Two, Vol. 11, Iss. 1 [2020], Art. 7
https://digitalcommons.usf.edu/ujmm/vol11/iss1/7DOI: https://doi.org/10.5038/2326-3652.11.1.4926
11
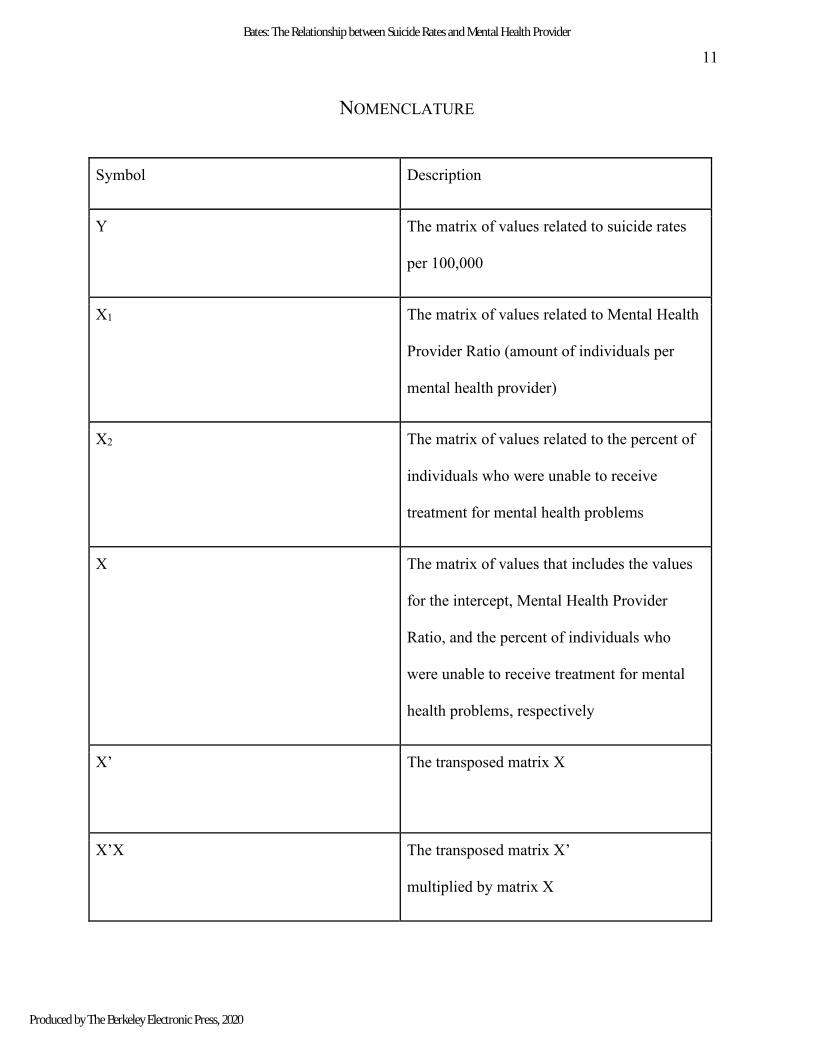
NOMENCLATURE
Symbol Description
Y
The matrix of values related to suicide rates
per 100,000
X1
The matrix of values related to Mental Health
Provider Ratio (amount of individuals per
mental health provider)
X2
The matrix of values related to the percent of
individuals who were unable to receive
treatment for mental health problems
X
The matrix of values that includes the values
for the intercept, Mental Health Provider
Ratio, and the percent of individuals who
were unable to receive treatment for mental
health problems, respectively
X’
The transposed matrix X
X’X
The transposed matrix X’
multiplied by matrix X
Bates: The Relationship between Suicide Rates and Mental Health Provider
Produced by The Berkeley Electronic Press, 2020
12
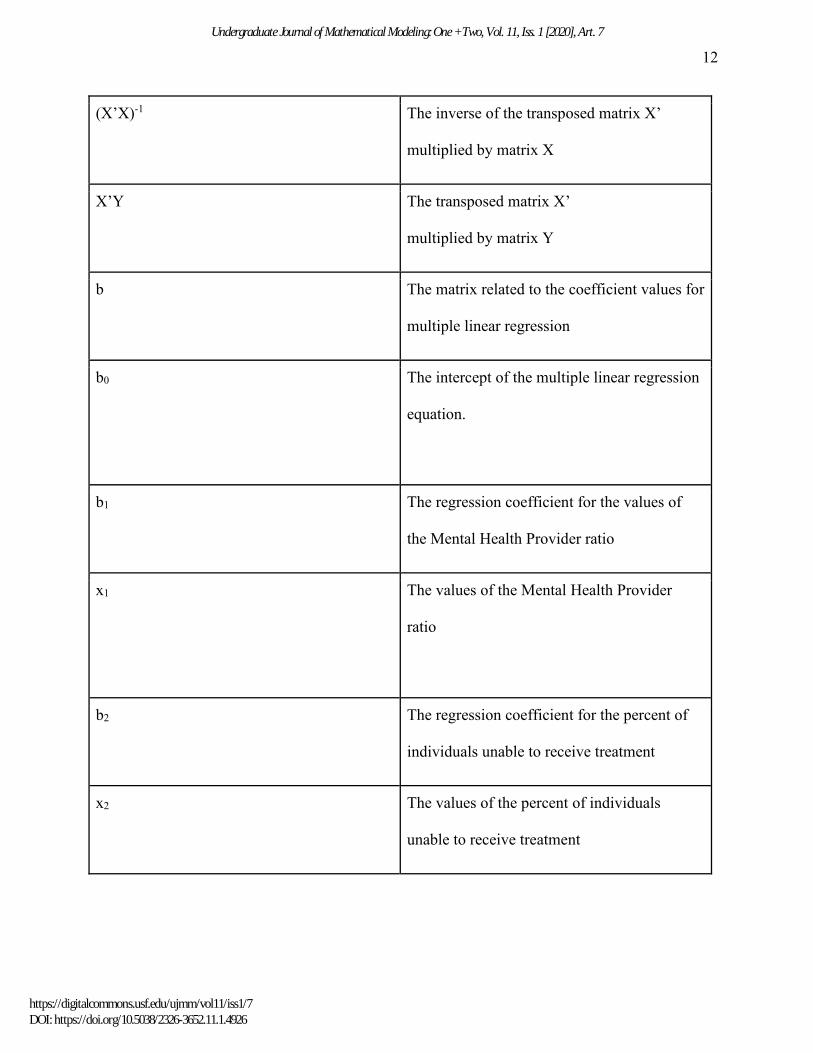
(X’X)-1
The inverse of the transposed matrix X’
multiplied by matrix X
X’Y
The transposed matrix X’
multiplied by matrix Y
b
The matrix related to the coefficient values for
multiple linear regression
b0
The intercept of the multiple linear regression
equation.
b1
The regression coefficient for the values of
the Mental Health Provider ratio
x1
The values of the Mental Health Provider
ratio
b2
The regression coefficient for the percent of
individuals unable to receive treatment
x2
The values of the percent of individuals
unable to receive treatment
Undergraduate Journal of Mathematical Modeling: One + Two, Vol. 11, Iss. 1 [2020], Art. 7
https://digitalcommons.usf.edu/ujmm/vol11/iss1/7DOI: https://doi.org/10.5038/2326-3652.11.1.4926
13
REFERENCES
Mental Health in America - Access to Care Data 2018. (n.d.). Retrieved from https://www.mhanational.org/issues/mental-health-america-access-care-data-2018
Stats of the State - Suicide Mortality. (2020, February 20). Retrieved from
https://www.cdc.gov/nchs/pressroom/sosmap/suicide-mortality/suicide.htm Stone, D. M., Simon, T. R., Fowler, K. A., Kegler, S. R., Yuan, K., Holland, K. M., Ivey-
Stephenson, A. Z., & Crosby, A. E. (2018). Vital Signs: Trends in State Suicide Rates - United States, 1999-2016 and Circumstances Contributing to Suicide - 27 States, 2015. MMWR. Morbidity and mortality weekly report, 67(22), 617–624. https://doi.org/10.15585/mmwr.mm6722a1
Walker, E. R., Berry, F. W., 3rd, Citron, T., Fitzgerald, J., Rapaport, M. H., Stephens, B., &
Druss, B. G. (2015). Psychiatric workforce needs and recommendations for the community mental health system: a state needs assessment. Psychiatric services (Washington, D.C.), 66(2), 115–117. https://doi.org/10.1176/appi.ps.201400530
Bates: The Relationship between Suicide Rates and Mental Health Provider
Produced by The Berkeley Electronic Press, 2020
14
APPENDICES
Table 1
State
Mental Health
Provider Ratio
Suicides Per
100,000
Massachusetts 200 9.9
Maine 240 18.5
Oregon 250 19
Vermont 260 18.8
Oklahoma 270 20
New Mexico 280 25
Rhode Island 290 9.5
Alaska 300 24.6
Connecticut 310 10.6
California 350 10.9
Wyoming 350 25.2
Colorado 350 21.9
Washington 360 15.9
Missouri 360 19.5
Utah 380 22.2
New
Hampshire 390 19.4
Montana 410 24.9
New York 420 8.3
Undergraduate Journal of Mathematical Modeling: One + Two, Vol. 11, Iss. 1 [2020], Art. 7
https://digitalcommons.usf.edu/ujmm/vol11/iss1/7DOI: https://doi.org/10.5038/2326-3652.11.1.4926
15
Nebraska 440 13.4
Michigan 460 15
Delaware 460 11.4
Hawaii 470 11.9
North Carolina 490 13.7
Maryland 490 10.2
Minnesota 510 13.1
Arkansas 510 18.3
Idaho 550 23.9
Kentucky 560 17.5
Nevada 580 20.8
Illinois 580 11.3
Kansas 580 19.3
New Jersey 580 8.3
Wisconsin 600 14.8
Louisiana 600 15.1
Pennsylvania 600 14.9
Ohio 630 15.3
North Dakota 640 19.2
South Dakota 660 19.3
South Carolina 680 15.4
Virginia 730 14
Indiana 730 16
Bates: The Relationship between Suicide Rates and Mental Health Provider
Produced by The Berkeley Electronic Press, 2020
16
Florida 750 15.2
Tennessee 780 16.6
Iowa 820 15.5
Mississippi 820 13.8
Arizona 850 19.2
Georgia 900 14.6
West Virginia 950 21.2
Texas 1070 13.7
Alabama 1260 16.5
Sources: (Mental Health in America - Access to Care Data 2018, n.d.) (Stats of the State - Suicide Mortality, 2020)
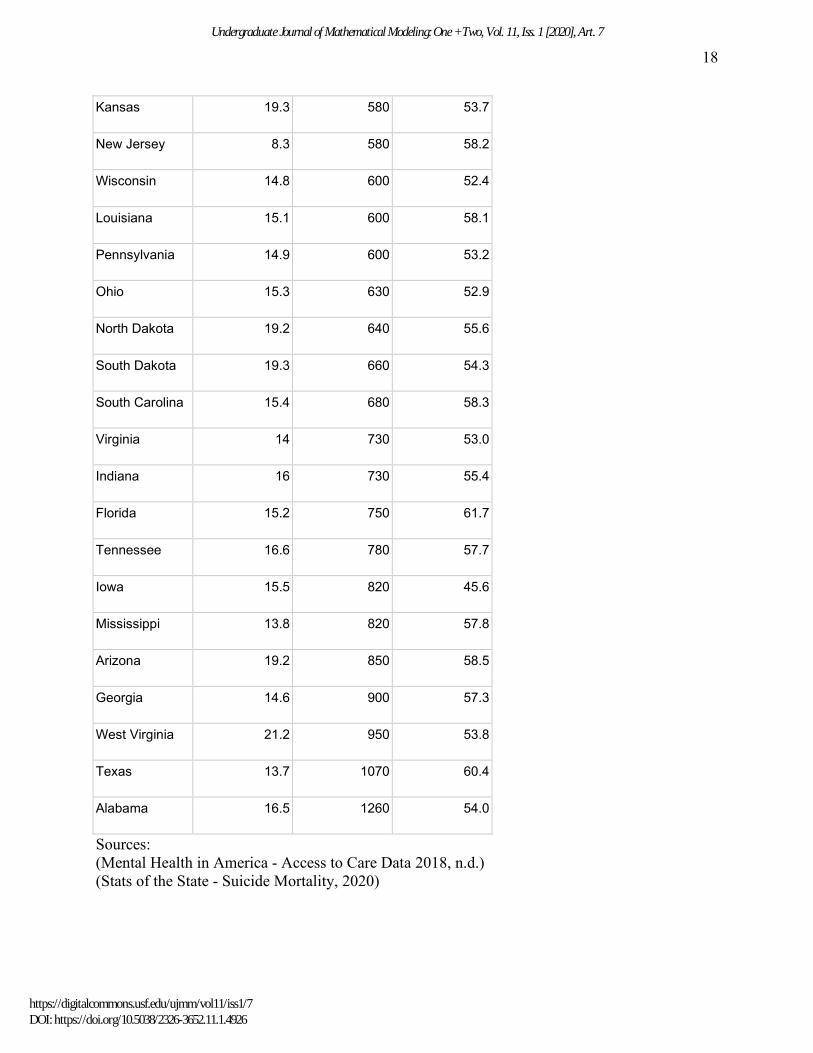
Table 2
State
Suicides Per
100,000
Mental Health
Provider Ratio
% With No
Treatment
Massachusetts 9.9 200 45.9
Maine 18.5 240 41.4
Oregon 19 250 51.2
Vermont 18.8 260 43.7
Oklahoma 20 270 56.3
New Mexico 25 280 57.2
Rhode Island 9.5 290 49.3
Alaska 24.6 300 63.9
Undergraduate Journal of Mathematical Modeling: One + Two, Vol. 11, Iss. 1 [2020], Art. 7
https://digitalcommons.usf.edu/ujmm/vol11/iss1/7DOI: https://doi.org/10.5038/2326-3652.11.1.4926
17
Connecticut 10.6 310 52.5
California 10.9 350 61.2
Wyoming 25.2 350 52.0
Colorado 21.9 350 57.3
Washington 15.9 360 55.6
Missouri 19.5 360 52.3
Utah 22.2 380 56.2
New
Hampshire 19.4 390 49.0
Montana 24.9 410 48.1
New York 8.3 420 56.4
Nebraska 13.4 440 57.5
Michigan 15 460 53.7
Delaware 11.4 460 50.6
Hawaii 11.9 470 63.5
North Carolina 13.7 490 50.2
Maryland 10.2 490 59.5
Minnesota 13.1 510 44.3
Arkansas 18.3 510 54.8
Idaho 23.9 550 52.2
Kentucky 17.5 560 50.6
Nevada 20.8 580 66.0
Illinois 11.3 580 53.3
Bates: The Relationship between Suicide Rates and Mental Health Provider
Produced by The Berkeley Electronic Press, 2020
18
Kansas 19.3 580 53.7
New Jersey 8.3 580 58.2
Wisconsin 14.8 600 52.4
Louisiana 15.1 600 58.1
Pennsylvania 14.9 600 53.2
Ohio 15.3 630 52.9
North Dakota 19.2 640 55.6
South Dakota 19.3 660 54.3
South Carolina 15.4 680 58.3
Virginia 14 730 53.0
Indiana 16 730 55.4
Florida 15.2 750 61.7
Tennessee 16.6 780 57.7
Iowa 15.5 820 45.6
Mississippi 13.8 820 57.8
Arizona 19.2 850 58.5
Georgia 14.6 900 57.3
West Virginia 21.2 950 53.8
Texas 13.7 1070 60.4
Alabama 16.5 1260 54.0
Sources: (Mental Health in America - Access to Care Data 2018, n.d.) (Stats of the State - Suicide Mortality, 2020)
Undergraduate Journal of Mathematical Modeling: One + Two, Vol. 11, Iss. 1 [2020], Art. 7
https://digitalcommons.usf.edu/ujmm/vol11/iss1/7DOI: https://doi.org/10.5038/2326-3652.11.1.4926
19
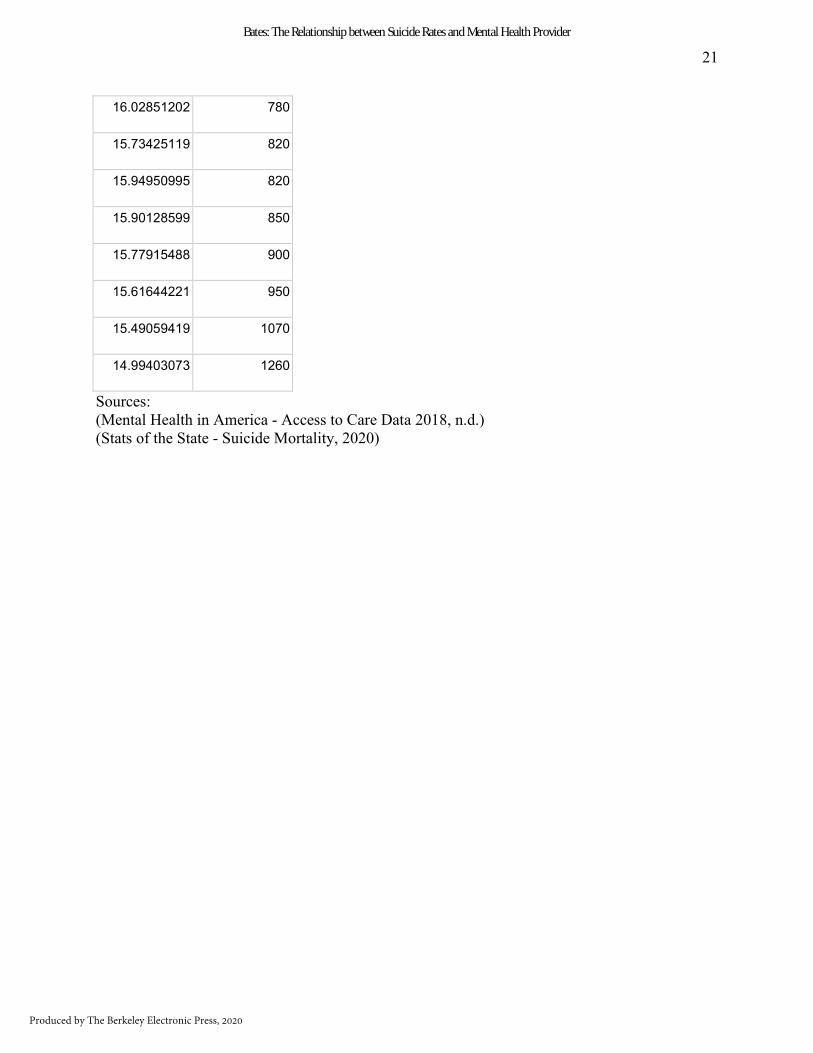
Table 3
Adjusted
Suicide Rate
Per 100,000
Mental Health
Provider Ratio
16.99142505 200
16.83125984 240
16.98398099 250
16.83145816 260
17.03358296 270
17.02927109 280
16.86969059 290
17.10710372 300
16.88576866 310
16.95850637 350
16.79618009 350
16.88969414 350
16.83950745 360
16.78128172 360
16.8097107 380
16.66248112 390
16.60621813 410
16.73247304 420
16.71149837 440
Bates: The Relationship between Suicide Rates and Mental Health Provider
Produced by The Berkeley Electronic Press, 2020
20
16.60406731 460
16.54937041 460
16.75678846 470
16.48173788 490
16.64582857 490
16.33725409 510
16.52251777 510
16.39587647 550
16.34745419 560
16.57879101 580
16.35471017 580
16.36176784 580
16.44116656 580
16.29844718 600
16.3990189 600
16.31256251 600
16.2466944 630
16.27414201 640
16.21082135 660
16.24101475 680
16.04654258 730
16.08888857 730
16.15966353 750
Undergraduate Journal of Mathematical Modeling: One + Two, Vol. 11, Iss. 1 [2020], Art. 7
https://digitalcommons.usf.edu/ujmm/vol11/iss1/7DOI: https://doi.org/10.5038/2326-3652.11.1.4926
21
16.02851202 780
15.73425119 820
15.94950995 820
15.90128599 850
15.77915488 900
15.61644221 950
15.49059419 1070
14.99403073 1260
Sources: (Mental Health in America - Access to Care Data 2018, n.d.) (Stats of the State - Suicide Mortality, 2020)
Bates: The Relationship between Suicide Rates and Mental Health Provider
Produced by The Berkeley Electronic Press, 2020