Embed Size (px)
Citation preview
The relationship between seroatopy andsymptoms of either allergic rhinitis or asthma
Christina M. Abraham, MD,a Dennis R. Ownby, MD,a Edward L. Peterson, PhD,b
Ganesa Wegienka, PhD,b Edward M. Zoratti, MD,c L. Keoki Williams, MD, MPH,c
Christine L. M. Joseph, PhD, MPH,b and Christine Cole Johnson, PhD, MPHb
Augusta, Ga, and Detroit, Mich
Mech
anis
ms
ofast
hm
aand
allerg
icin
flam
mation
Background: Epidemiologic data on allergic rhinitis andasthma are frequently based on self-reported symptoms.
Objective: This cross-sectional study examined the relationship
between self-reported symptoms and histories of allergic
rhinitis or asthma and a marker of allergic sensitization,
allergen-specific IgE.
Methods: We surveyed 702 pregnant women in Michigan.
Blood samples were analyzed for specific IgE to 9 allergens:
dust mites (Dermatophagoides farinae and Dermatophagoides
pteronyssinus), cat, dog, cockroach, ragweed, timothy grass,
egg, and Alternaria alternata. Seratopy was defined as a specific
IgE greater than or equal to 0.35 kU/L to any allergen.
Results: Seroatopy was found in 66.7% of those with hay fever
symptoms, 68.3% with a physician’s diagnosis of asthma, and
72.1% of those with both conditions. These results differed
significantly from asymptomatic subjects, where 49.8% of
patients without hay fever and 50.4% without asthma were
seroatopic. Race and education did not modify the
relationships. Symptoms related to specific exposures were
modest predictors of positive specific IgE to related allergens
(positive predictive values from 26.5% to 50.3%).
Conclusion: Self-reported symptoms of allergic rhinitis or
asthma were significantly associated with allergic sensitization,
but the odds ratios were of relatively low magnitude for this
historical information to be considered evidence of current
allergic sensitization. A 66% to 68% probability existed that
those with symptoms of allergic rhinitis or asthma would
have a positive specific IgE test.
Clinical implications: Self-reported histories of hay fever
or asthma alone are only modest predictors of allergic
sensitization. When knowledge of allergic sensitization is
important, information beyond self-reported symptoms
is necessary. (J Allergy Clin Immunol 2007;119:1099-104.)
Key words: Allergic rhinitis, asthma, self-reported history, seroa-topy, allergen-specific IgE
From athe Section of Allergy and Immunology, Medical College of Georgia;
and the Departments of bBiostatistics and Research Epidemiology andcInternal Medicine, Henry Ford Health System, Detroit.
Supported by the National Institute of Allergy and Infectious Diseases
(AI61774, AI50681, AI51598, AI59415, and AI50594) and by the Fund
for Henry Ford Hospital.
Disclosure of potential conflict of interest: The authors have declared that they
have no conflict of interest.
Received for publication May 16, 2006; revised November 29, 2006; accepted
for publication January 10, 2007.
Available online April 13, 2007.
Reprint requests: Dennis R. Ownby, MD, Medical College of Georgia,
Allergy/Immunology Division, BG 244, Augusta, GA 30912. E-mail:
0091-6749/$32.00
� 2007 American Academy of Allergy, Asthma & Immunology
doi:10.1016/j.jaci.2007.01.024
Many epidemiologic studies of asthma and allergicrhinitis use self-reported symptoms or physician diagno-ses of hay fever, perennial rhinitis, and asthma.1-5 It isclear that both allergic and nonallergic forms of rhinitisand asthma exist, and sole reliance on survey responsesalone as estimates of the presence of allergic sensitizationinduces potential error. In the past decade, when the over-all prevalence of allergic sensitization has increased,few large population-based studies have evaluated bio-logic markers of allergic sensitization in relationship toself-reported histories of allergic disease symptoms.5,6
Detailed information on the relationships between self-reported allergic disease and allergic sensitization wouldallow better estimation of the extent of potential misclas-sification of atopic conditions in studies that rely on surveydata.
Some studies have suggested that rhinitis symptomsare a reliable predictor of allergic rhinitis as defined bysymptoms and positive skin tests or increased allergen-specific IgE.7-10 Others have shown that self-reported orphysician-diagnosed hay fever/rhinitis were not associ-ated with atopic disease specifically.11 Many of these stud-ies have been performed outside the United States, haveinvolved convenience samples, or have been limited to1 racial group (such as European whites).12-14 The aimof this study of a large population-based cohort of adultwomen was to define the relationship between a woman’sself-reported history of symptoms or a diagnosis of aller-gic rhinitis and asthma and allergen-specific IgE. Wealso examined whether these relationships differ by raceand level of education and whether reported nasal orasthma symptoms after specific exposures were associatedwith sensitization to specific allergens.
METHODS
Study population
Data for this study were collected as part of the Wayne Country
Health, Environment, Allergy, and Asthma Longitudinal Study
Abbreviations usedNPV: Negative predictive value
OR: Odds ratio
PVV: Positive predictive value
1099
J ALLERGY CLIN IMMUNOL
MAY 2007
1100 Abraham et al
Mech
anism
sofasth
ma
and
alle
rgic
infl
am
matio
n
(WHEALS). Analyses included pregnant women with due dates from
September 1, 2003 through November 7, 2005, who were in their
second trimester or later, seeing a Henry Ford Health System
practitioner at 1 of 5 clinics, aged 21-49 years, and living in a
predefined geographic area in western Wayne County that included
the western portion of the city of Detroit as well as the suburban areas
immediately west of the city. No medical insurance requirements
existed, but the women were required to comprehend English well
enough to provide written informed consent. All aspects of this
research were approved by the institutional human subjects boards
of review of all participating institutions.
Assessment of symptoms
At the time of recruitment, each woman was interviewed face-
to-face about her asthma and allergy history. The specific questions
were as follows: (1) ‘‘Do you have nasal allergies including hay fever
and allergic rhinitis?’’ Those who said ‘‘yes’’ were then asked: (2)
‘‘Did a doctor ever diagnose you with hay fever, nasal allergies or
allergic rhinitis?’’; (3) ‘‘When you are near animals such as cats, dogs,
or horses, do ever start to cough, wheeze, get a feeling of tightness
in your chest, start to feel short of breath, get a runny or stuffy nose
or start to sneeze?’’; (4) ‘‘When you are in a dusty part of your house,
or near pillows or duvets, do you ever start to cough, wheeze, get a
feeling of tightness in your chest, start to feel short of breath, get a
runny or stuffy nose or start to sneeze?’’; (5) ‘‘When you are near
trees, grass or flowers, or when there is a lot of pollen about, do you
ever start to cough, wheeze, get a feeling of tightness in your chest,
start to feel short of breath, get a runny or stuffy nose or start to
sneeze, get itchy watery eyes?’’; (6) ‘‘Do you have any symptoms
such as coughing, wheezing, tightness in your chest, shortness of
breath, runny stuffy nose or sneezing, itchy, watery eyes when you
are around freshly mowed grass?’’; and (7) ‘‘Have you ever had
asthma?’’ For those who said ‘‘yes’’ we then asked: (8) ‘‘Did a doctor
ever diagnose you with asthma?’’ Additional questions about self-
reported race using the US census categorization and education level
were asked.
Using these questions, we defined self-reported hay fever as a
‘‘yes’’ response to question 1, physician-diagnosed hay fever as a
‘‘yes’’ response to question 2, self-reported asthma as a ‘‘yes’’
response to question 7, and physician-diagnosed asthma as a ‘‘yes’’
response to question 8.
Assessment of allergen-specific IgE
Venous blood was collected at the time of recruitment for
assessment of allergen-specific IgE. After collection, samples were
then stored at 2808C until assayed.
Measurements of allergen-specific IgE were performed following
the standard manufacturer’s protocols using the Pharmacia UniCAP
system (Pharmacia-Upjohn Diagnostic Division, Kalamazoo, Mich).
Allergen-specific IgE was analyzed for Dermatophagoides farinae,
D pteronyssinus, cat, dog, Blatella germanica (German cockroach),
Ambrosia artemisiifolia (ragweed), Phleum pratense (timothy grass),
hens’ egg, and Alternaria alternata. One percent of all assays were
repeated in a different assay run on a different day to provide esti-
mates of interassay reliability. The geometric mean coefficient of
interassay variation was 5.9% for all 9 allergens. We evaluated the
possibility that some women with isolated tree pollen sensitization
were missed by testing with the 9 chosen allergens; however, we
found no evidence for isolated tree pollen sensitization (see data in
this article’s Online Repository at www.jacionline.org.).
Statistical analysis
Seroatopy was defined as 1 or more positive allergen-specific
IgE results (�0.35 kU/L). We used allergen-specific IgE to cat and
dog for data analysis related to symptoms around animals, D
pteronyssinus and D farinae for symptoms in a dusty environment,
and ragweed and timothy for symptoms around pollen and grass.
The symptoms and individual allergens were compared using a x2
test. A P value less than or equal to .05 was considered statistically
significant. The analysis was performed on all subjects and repeated
stratifying by race (black, white) and education (high-school graduate
or less, some education beyond high school) when sample size per-
mitted because we hypothesized that these variables might influence
the relationship between recall of symptoms and sensitization. The
odds ratios (ORs) were estimated directly from the 2-by-2 tables
with standard deviation for the log OR used to compute the 95%
CIs. Sensitivity, specificity, and the 2 predictive values were esti-
mated assuming a full multinomial model as the study was cross-
sectional. Logistic regression models were developed for multiple
variable analyses. In the logistic regression models, the exponentiated
coefficient was used to estimate the OR and the Wald method was
used to estimate the CI.
RESULTS
At the time of this analysis, 1918 study introductionletters had been mailed to potentially eligible women andwe could approach 1422 to discuss participation. Of thesewomen, 127 (8.9%) were ineligible for various reasonsand 79 (5.5%) did not comprehend English well enoughto provide informed consent. Of the remaining 1216,702 (58%) were interviewed and 417 of these womenidentified themselves as black (59%); 201 (29%) as white,non-Hispanic; and 84 (12%) as belonging to other ethnic/racial groups. The average age of the black women was28.6 (SD 5.1) years, and the average age of the whitewomen was 30.7 (SD 4.8) years. Of the black women,94 (23%) reported allergic rhinitis, 62 (15%) reportedphysician-diagnosed allergic rhinitis and 87 (21%) re-ported physician diagnosed asthma. Among white women,60 (30%) reported history of allergic rhinitis, 35 (18%)reported physician-diagnosed allergic rhinitis, and 35(18%) reported physician-diagnosed asthma. Of the 140individuals reporting ever having had asthma only, 7 (2whites, 5 blacks) failed to also state that a physician hadprovided a diagnosis.
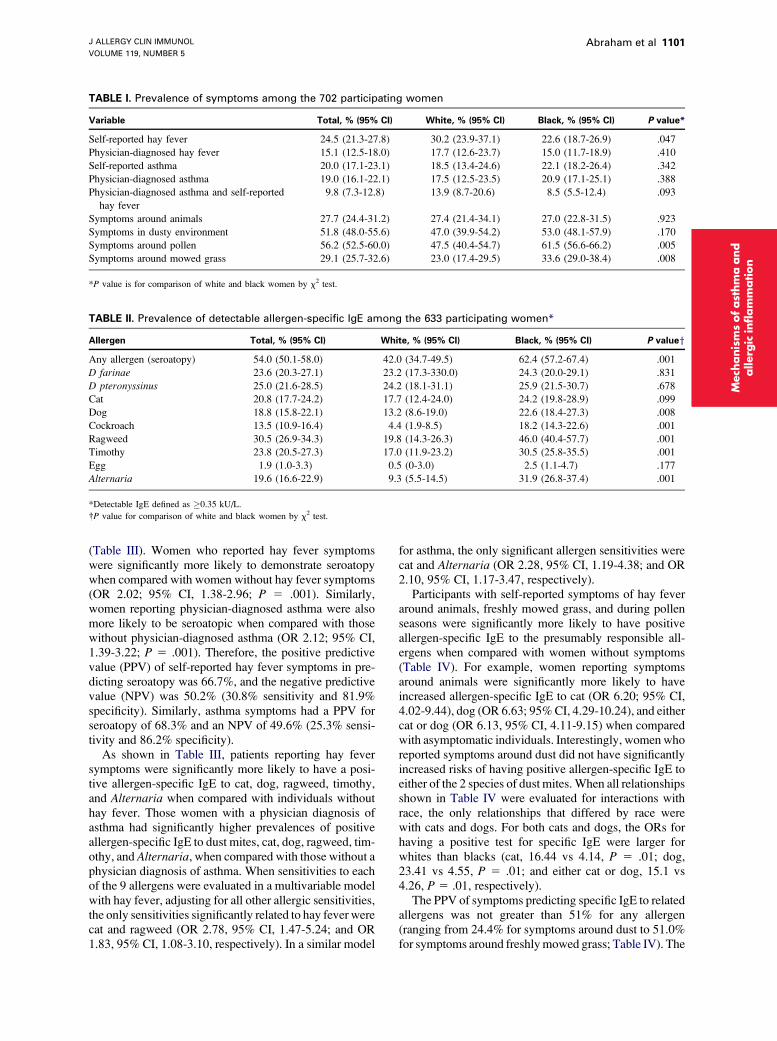
Table I shows the prevalence of symptoms amongparticipants. White women were more likely to reporthay fever symptoms, but the prevalence of reportedphysician-diagnosed hay fever did not differ by race.Black women were more likely to report symptomsaround pollen and freshly mowed grass.
Of the 702 who were interviewed, adequate plasmasamples were obtained for measurement of all studyallergens for 629 (90%) of the women. In 4 additionalwomen, partial testing was completed. Table II shows theprevalence of positive allergen-specific IgE tests by aller-gen. Of the 633 women with allergen-specific IgE infor-mation, 341 (54%) were seroatopic. Black women weremore likely to be seroatopic than white women, and theyhad higher prevalences of positive tests for dog, cock-roach, ragweed, timothy grass, and Alternaria allergens.
Sixty-seven percent of those self-reporting hay feversymptoms and 68.3% of those with physician-diagnosedasthma had a positive specific IgE to at least 1 allergen
J ALLERGY CLIN IMMUNOL
VOLUME 119, NUMBER 5
Abraham et al 1101
TABLE I. Prevalence of symptoms among the 702 participating women
Variable Total, % (95% CI) White, % (95% CI) Black, % (95% CI) P value*
Self-reported hay fever 24.5 (21.3-27.8) 30.2 (23.9-37.1) 22.6 (18.7-26.9) .047
Physician-diagnosed hay fever 15.1 (12.5-18.0) 17.7 (12.6-23.7) 15.0 (11.7-18.9) .410
Self-reported asthma 20.0 (17.1-23.1) 18.5 (13.4-24.6) 22.1 (18.2-26.4) .342
Physician-diagnosed asthma 19.0 (16.1-22.1) 17.5 (12.5-23.5) 20.9 (17.1-25.1) .388
Physician-diagnosed asthma and self-reported
hay fever
9.8 (7.3-12.8) 13.9 (8.7-20.6) 8.5 (5.5-12.4) .093
Symptoms around animals 27.7 (24.4-31.2) 27.4 (21.4-34.1) 27.0 (22.8-31.5) .923
Symptoms in dusty environment 51.8 (48.0-55.6) 47.0 (39.9-54.2) 53.0 (48.1-57.9) .170
Symptoms around pollen 56.2 (52.5-60.0) 47.5 (40.4-54.7) 61.5 (56.6-66.2) .005
Symptoms around mowed grass 29.1 (25.7-32.6) 23.0 (17.4-29.5) 33.6 (29.0-38.4) .008
*P value is for comparison of white and black women by x2 test.
TABLE II. Prevalence of detectable allergen-specific IgE among the 633 participating women*
Allergen Total, % (95% CI) White, % (95% CI) Black, % (95% CI) P valuey
Any allergen (seroatopy) 54.0 (50.1-58.0) 42.0 (34.7-49.5) 62.4 (57.2-67.4) .001
D farinae 23.6 (20.3-27.1) 23.2 (17.3-330.0) 24.3 (20.0-29.1) .831
D pteronyssinus 25.0 (21.6-28.5) 24.2 (18.1-31.1) 25.9 (21.5-30.7) .678
Cat 20.8 (17.7-24.2) 17.7 (12.4-24.0) 24.2 (19.8-28.9) .099
Dog 18.8 (15.8-22.1) 13.2 (8.6-19.0) 22.6 (18.4-27.3) .008
Cockroach 13.5 (10.9-16.4) 4.4 (1.9-8.5) 18.2 (14.3-22.6) .001
Ragweed 30.5 (26.9-34.3) 19.8 (14.3-26.3) 46.0 (40.4-57.7) .001
Timothy 23.8 (20.5-27.3) 17.0 (11.9-23.2) 30.5 (25.8-35.5) .001
Egg 1.9 (1.0-3.3) 0.5 (0-3.0) 2.5 (1.1-4.7) .177
Alternaria 19.6 (16.6-22.9) 9.3 (5.5-14.5) 31.9 (26.8-37.4) .001
*Detectable IgE defined as �0.35 kU/L.
�P value for comparison of white and black women by x2 test.
Mech
anis
ms
ofast
hm
aand
allerg
icin
flam
mation
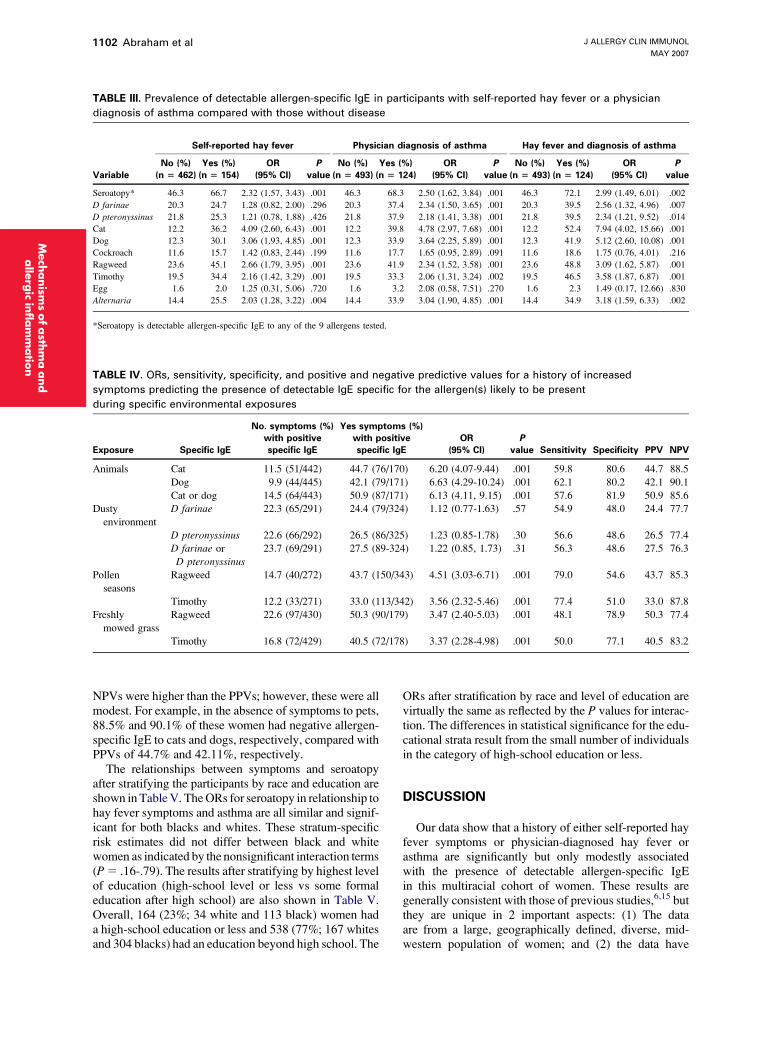
(Table III). Women who reported hay fever symptomswere significantly more likely to demonstrate seroatopywhen compared with women without hay fever symptoms(OR 2.02; 95% CI, 1.38-2.96; P 5 .001). Similarly,women reporting physician-diagnosed asthma were alsomore likely to be seroatopic when compared with thosewithout physician-diagnosed asthma (OR 2.12; 95% CI,1.39-3.22; P 5 .001). Therefore, the positive predictivevalue (PPV) of self-reported hay fever symptoms in pre-dicting seroatopy was 66.7%, and the negative predictivevalue (NPV) was 50.2% (30.8% sensitivity and 81.9%specificity). Similarly, asthma symptoms had a PPV forseroatopy of 68.3% and an NPV of 49.6% (25.3% sensi-tivity and 86.2% specificity).
As shown in Table III, patients reporting hay feversymptoms were significantly more likely to have a posi-tive allergen-specific IgE to cat, dog, ragweed, timothy,and Alternaria when compared with individuals withouthay fever. Those women with a physician diagnosis ofasthma had significantly higher prevalences of positiveallergen-specific IgE to dust mites, cat, dog, ragweed, tim-othy, and Alternaria, when compared with those without aphysician diagnosis of asthma. When sensitivities to eachof the 9 allergens were evaluated in a multivariable modelwith hay fever, adjusting for all other allergic sensitivities,the only sensitivities significantly related to hay fever werecat and ragweed (OR 2.78, 95% CI, 1.47-5.24; and OR1.83, 95% CI, 1.08-3.10, respectively). In a similar model
for asthma, the only significant allergen sensitivities werecat and Alternaria (OR 2.28, 95% CI, 1.19-4.38; and OR2.10, 95% CI, 1.17-3.47, respectively).
Participants with self-reported symptoms of hay feveraround animals, freshly mowed grass, and during pollenseasons were significantly more likely to have positiveallergen-specific IgE to the presumably responsible all-ergens when compared with women without symptoms(Table IV). For example, women reporting symptomsaround animals were significantly more likely to haveincreased allergen-specific IgE to cat (OR 6.20; 95% CI,4.02-9.44), dog (OR 6.63; 95% CI, 4.29-10.24), and eithercat or dog (OR 6.13, 95% CI, 4.11-9.15) when comparedwith asymptomatic individuals. Interestingly, women whoreported symptoms around dust did not have significantlyincreased risks of having positive allergen-specific IgE toeither of the 2 species of dust mites. When all relationshipsshown in Table IV were evaluated for interactions withrace, the only relationships that differed by race werewith cats and dogs. For both cats and dogs, the ORs forhaving a positive test for specific IgE were larger forwhites than blacks (cat, 16.44 vs 4.14, P 5 .01; dog,23.41 vs 4.55, P 5 .01; and either cat or dog, 15.1 vs4.26, P 5 .01, respectively).
The PPV of symptoms predicting specific IgE to relatedallergens was not greater than 51% for any allergen(ranging from 24.4% for symptoms around dust to 51.0%for symptoms around freshly mowed grass; Table IV). The
J ALLERGY CLIN IMMUNOL
MAY 2007
1102 Abraham et al
alle
rgic
infl
am
matio
n
TABLE III. Prevalence of detectable allergen-specific IgE in participants with self-reported hay fever or a physician
diagnosis of asthma compared with those without disease
Self-reported hay fever Physician diagnosis of asthma Hay fever and diagnosis of asthma
Variable
No (%)
(n 5 462)
Yes (%)
(n 5 154)
OR
(95% CI)
P
value
No (%)
(n 5 493)
Yes (%)
(n 5 124)
OR
(95% CI)
P
value
No (%)
(n 5 493)
Yes (%)
(n 5 124)
OR
(95% CI)
P
value
Seroatopy* 46.3 66.7 2.32 (1.57, 3.43) .001 46.3 68.3 2.50 (1.62, 3.84) .001 46.3 72.1 2.99 (1.49, 6.01) .002
D farinae 20.3 24.7 1.28 (0.82, 2.00) .296 20.3 37.4 2.34 (1.50, 3.65) .001 20.3 39.5 2.56 (1.32, 4.96) .007
D pteronyssinus 21.8 25.3 1.21 (0.78, 1.88) .426 21.8 37.9 2.18 (1.41, 3.38) .001 21.8 39.5 2.34 (1.21, 9.52) .014
Cat 12.2 36.2 4.09 (2.60, 6.43) .001 12.2 39.8 4.78 (2.97, 7.68) .001 12.2 52.4 7.94 (4.02, 15.66) .001
Dog 12.3 30.1 3.06 (1.93, 4.85) .001 12.3 33.9 3.64 (2.25, 5.89) .001 12.3 41.9 5.12 (2.60, 10.08) .001
Cockroach 11.6 15.7 1.42 (0.83, 2.44) .199 11.6 17.7 1.65 (0.95, 2.89) .091 11.6 18.6 1.75 (0.76, 4.01) .216
Ragweed 23.6 45.1 2.66 (1.79, 3.95) .001 23.6 41.9 2.34 (1.52, 3.58) .001 23.6 48.8 3.09 (1.62, 5.87) .001
Timothy 19.5 34.4 2.16 (1.42, 3.29) .001 19.5 33.3 2.06 (1.31, 3.24) .002 19.5 46.5 3.58 (1.87, 6.87) .001
Egg 1.6 2.0 1.25 (0.31, 5.06) .720 1.6 3.2 2.08 (0.58, 7.51) .270 1.6 2.3 1.49 (0.17, 12.66) .830
Alternaria 14.4 25.5 2.03 (1.28, 3.22) .004 14.4 33.9 3.04 (1.90, 4.85) .001 14.4 34.9 3.18 (1.59, 6.33) .002
*Seroatopy is detectable allergen-specific IgE to any of the 9 allergens tested.
Mech
anism
sofasth
ma
and
TABLE IV. ORs, sensitivity, specificity, and positive and negative predictive values for a history of increased
symptoms predicting the presence of detectable IgE specific for the allergen(s) likely to be present
during specific environmental exposures
Exposure Specific IgE
No. symptoms (%)
with positive
specific IgE
Yes symptoms (%)
with positive
specific IgE
OR
(95% CI)
P
value Sensitivity Specificity PPV NPV
Animals Cat 11.5 (51/442) 44.7 (76/170) 6.20 (4.07-9.44) .001 59.8 80.6 44.7 88.5
Dog 9.9 (44/445) 42.1 (79/171) 6.63 (4.29-10.24) .001 62.1 80.2 42.1 90.1
Cat or dog 14.5 (64/443) 50.9 (87/171) 6.13 (4.11, 9.15) .001 57.6 81.9 50.9 85.6
Dusty
environment
D farinae 22.3 (65/291) 24.4 (79/324) 1.12 (0.77-1.63) .57 54.9 48.0 24.4 77.7
D pteronyssinus 22.6 (66/292) 26.5 (86/325) 1.23 (0.85-1.78) .30 56.6 48.6 26.5 77.4
D farinae or
D pteronyssinus
23.7 (69/291) 27.5 (89-324) 1.22 (0.85, 1.73) .31 56.3 48.6 27.5 76.3
Pollen
seasons
Ragweed 14.7 (40/272) 43.7 (150/343) 4.51 (3.03-6.71) .001 79.0 54.6 43.7 85.3
Timothy 12.2 (33/271) 33.0 (113/342) 3.56 (2.32-5.46) .001 77.4 51.0 33.0 87.8
Freshly
mowed grass
Ragweed 22.6 (97/430) 50.3 (90/179) 3.47 (2.40-5.03) .001 48.1 78.9 50.3 77.4
Timothy 16.8 (72/429) 40.5 (72/178) 3.37 (2.28-4.98) .001 50.0 77.1 40.5 83.2
NPVs were higher than the PPVs; however, these were allmodest. For example, in the absence of symptoms to pets,88.5% and 90.1% of these women had negative allergen-specific IgE to cats and dogs, respectively, compared withPPVs of 44.7% and 42.11%, respectively.
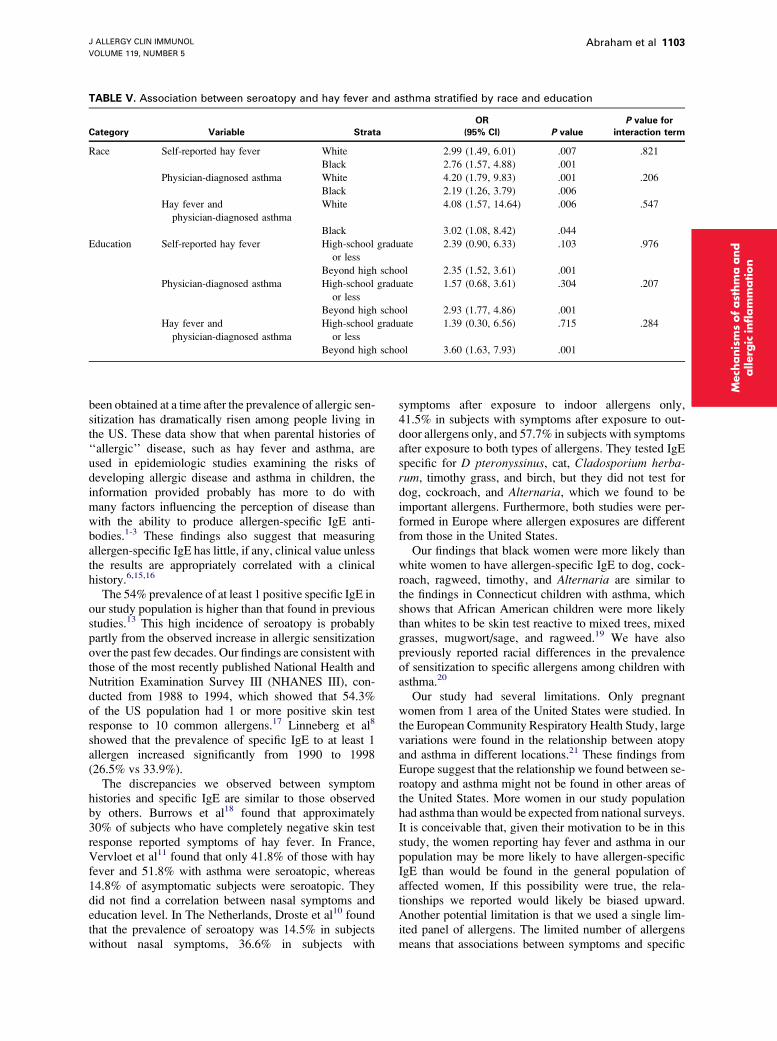
The relationships between symptoms and seroatopyafter stratifying the participants by race and education areshown in Table V. The ORs for seroatopy in relationship tohay fever symptoms and asthma are all similar and signif-icant for both blacks and whites. These stratum-specificrisk estimates did not differ between black and whitewomen as indicated by the nonsignificant interaction terms(P 5 .16-.79). The results after stratifying by highest levelof education (high-school level or less vs some formaleducation after high school) are also shown in Table V.Overall, 164 (23%; 34 white and 113 black) women hada high-school education or less and 538 (77%; 167 whitesand 304 blacks) had an education beyond high school. The
ORs after stratification by race and level of education arevirtually the same as reflected by the P values for interac-tion. The differences in statistical significance for the edu-cational strata result from the small number of individualsin the category of high-school education or less.
DISCUSSION
Our data show that a history of either self-reported hayfever symptoms or physician-diagnosed hay fever orasthma are significantly but only modestly associatedwith the presence of detectable allergen-specific IgEin this multiracial cohort of women. These results aregenerally consistent with those of previous studies,6,15 butthey are unique in 2 important aspects: (1) The dataare from a large, geographically defined, diverse, mid-western population of women; and (2) the data have
J ALLERGY CLIN IMMUNOL
VOLUME 119, NUMBER 5
Abraham et al 1103
TABLE V. Association between seroatopy and hay fever and asthma stratified by race and education
Category Variable Strata
OR
(95% CI) P value
P value for
interaction term
Race Self-reported hay fever White 2.99 (1.49, 6.01) .007 .821
Black 2.76 (1.57, 4.88) .001
Physician-diagnosed asthma White 4.20 (1.79, 9.83) .001 .206
Black 2.19 (1.26, 3.79) .006
Hay fever and
physician-diagnosed asthma
White 4.08 (1.57, 14.64) .006 .547
Black 3.02 (1.08, 8.42) .044
Education Self-reported hay fever High-school graduate
or less
2.39 (0.90, 6.33) .103 .976
Beyond high school 2.35 (1.52, 3.61) .001
Physician-diagnosed asthma High-school graduate
or less
1.57 (0.68, 3.61) .304 .207
Beyond high school 2.93 (1.77, 4.86) .001
Hay fever and
physician-diagnosed asthma
High-school graduate
or less
1.39 (0.30, 6.56) .715 .284
Beyond high school 3.60 (1.63, 7.93) .001
chanis
ms
ofast
hm
aand
allerg
icin
flam
mation
Me
been obtained at a time after the prevalence of allergic sen-sitization has dramatically risen among people living inthe US. These data show that when parental histories of‘‘allergic’’ disease, such as hay fever and asthma, areused in epidemiologic studies examining the risks ofdeveloping allergic disease and asthma in children, theinformation provided probably has more to do withmany factors influencing the perception of disease thanwith the ability to produce allergen-specific IgE anti-bodies.1-3 These findings also suggest that measuringallergen-specific IgE has little, if any, clinical value unlessthe results are appropriately correlated with a clinicalhistory.6,15,16
The 54% prevalence of at least 1 positive specific IgE inour study population is higher than that found in previousstudies.13 This high incidence of seroatopy is probablypartly from the observed increase in allergic sensitizationover the past few decades. Our findings are consistent withthose of the most recently published National Health andNutrition Examination Survey III (NHANES III), con-ducted from 1988 to 1994, which showed that 54.3%of the US population had 1 or more positive skin testresponse to 10 common allergens.17 Linneberg et al8
showed that the prevalence of specific IgE to at least 1allergen increased significantly from 1990 to 1998(26.5% vs 33.9%).
The discrepancies we observed between symptomhistories and specific IgE are similar to those observedby others. Burrows et al18 found that approximately30% of subjects who have completely negative skin testresponse reported symptoms of hay fever. In France,Vervloet et al11 found that only 41.8% of those with hayfever and 51.8% with asthma were seroatopic, whereas14.8% of asymptomatic subjects were seroatopic. Theydid not find a correlation between nasal symptoms andeducation level. In The Netherlands, Droste et al10 foundthat the prevalence of seroatopy was 14.5% in subjectswithout nasal symptoms, 36.6% in subjects with
symptoms after exposure to indoor allergens only,41.5% in subjects with symptoms after exposure to out-door allergens only, and 57.7% in subjects with symptomsafter exposure to both types of allergens. They tested IgEspecific for D pteronyssinus, cat, Cladosporium herba-rum, timothy grass, and birch, but they did not test fordog, cockroach, and Alternaria, which we found to beimportant allergens. Furthermore, both studies were per-formed in Europe where allergen exposures are differentfrom those in the United States.
Our findings that black women were more likely thanwhite women to have allergen-specific IgE to dog, cock-roach, ragweed, timothy, and Alternaria are similar tothe findings in Connecticut children with asthma, whichshows that African American children were more likelythan whites to be skin test reactive to mixed trees, mixedgrasses, mugwort/sage, and ragweed.19 We have alsopreviously reported racial differences in the prevalenceof sensitization to specific allergens among children withasthma.20
Our study had several limitations. Only pregnantwomen from 1 area of the United States were studied. Inthe European Community Respiratory Health Study, largevariations were found in the relationship between atopyand asthma in different locations.21 These findings fromEurope suggest that the relationship we found between se-roatopy and asthma might not be found in other areas ofthe United States. More women in our study populationhad asthma than would be expected from national surveys.It is conceivable that, given their motivation to be in thisstudy, the women reporting hay fever and asthma in ourpopulation may be more likely to have allergen-specificIgE than would be found in the general population ofaffected women, If this possibility were true, the rela-tionships we reported would likely be biased upward.Another potential limitation is that we used a single lim-ited panel of allergens. The limited number of allergensmeans that associations between symptoms and specific
J ALLERGY CLIN IMMUNOL
MAY 2007
1104 Abraham et al
Mech
anism
sofasth
ma
and
alle
rgic
infl
am
matio
n
IgE to other allergens may have been missed. Also, a con-cern exists that pregnant women may report more nonal-lergic rhinitis symptoms than nonpregnant women ormen. Rhinitis of pregnancy would have influenced theself-reported rhinitis symptoms but should not have influ-enced the reports of a physician’s diagnosis of hay fever orasthma. Age of onset of symptoms and treatment informa-tion were not considered. Even though our total samplewas relatively large, when the sample was stratified, themodest numbers of individuals in each group within thestratum provided less than ideal statistical power. Also,we could not collect adequate blood samples on all womenfor IgE testing, but it is unlikely that a relationship existsbetween success in obtaining blood samples and the pres-ence of IgE antibodies.
The question of whether the pregnancy could affecta woman’s atopic status has not been well studied. TheNHANES III study found that 49.2% of all women had atleast 1 positive skin test response, which is very close tothe 54.0% prevalence of seroatopy in our participants,which suggests that pregnancy alone did not dramaticallyalter IgE production.17
Many studies have used parent history of allergicrhinitis or asthma as a marker for atopy.1-4,22,23 However,in this study, we found that self-reported history of hayfever or physician-diagnosed asthma are only modestlyassociated with seroatopy. Race and education did notmodify the relationships between self-reported symptomsnor physician-diagnosed hayfever/asthma and seroatopystatus.
Our data support the finding of Barbee et al14 who stud-ied 1600 white non-Mexican male and female Americans.In their study, 67% of subjects who skin test results werepositive reported symptoms of allergic rhinitis, whereas36% of subjects who skin test results were negativereported symptoms of allergic rhinitis.
In conclusion, we found that self-reported history ofhay fever or physician-diagnosed hay fever and asthmawere only modestly associated with seroatopy. Stratifyingby either highest level of education or race did notappreciably alter the degree of association between historyand seroatopy. If investigators need information concern-ing parental predisposition toward allergen-specific IgEproduction, then it is necessary to directly determine thepresence of allergen-specific IgE by either skin testing orin vitro testing.
REFERENCES
1. Almqvist C, Egmar A-C, van Hage-Hamsten M, Berglind N, Pershagen
G, Nordvall SL, et al. Heredity, pet ownership, and confounding control
in a population-based birth cohort. J Allergy Clin Immunol 2003;111:
800-6.
2. Gern JE, Reardon CL, Hoffjan S, Nicolae D, Li Z, Roberg KA, et al.
Effects of dog ownership and genotype on immune development and
atopy in infancy. J Allergy Clin Immunol 2004;113:307-14.
3. Litonjua AA, Milton DK, Celedon JC, Ryan L, Weiss ST, Gold DR.
A longitudinal analysis of wheezing in young children: the independent
effects of early life exposure to house dust endotoxin, allergens, and pets.
J Allergy Clin Immunol 2002;110:736-42.
4. Crestani E, Guerra S, Wright AL, Halonen M, Martinez FD. Parental
asthma as a risk factor for the development of early skin test sensitization
in children. J Allergy Clin Immunol 2004;113:284-90.
5. Burney P, Malmberg E, Chinn S, Jarvis D, Luczynska C, Lai E. The dis-
tribution of total and specific serum IgE in the European Community
Respiratory Health Survey. J Allergy Clin Immunol 1997;99:314-22.
6. Bodtger U. Prognostic value of asymptomatic skin sensitization to aero-
allergens. Curr Opin Allergy Clin Immunol 2004;4:5-10.
7. Kilpelainen M, Terho EO, Helenius H, Koskenvuo M. Validation of
a new questionnaire on asthma, allergic rhinitis, and conjunctivitis in
young adults. Allergy 2001;56:377-84.
8. Linneberg A, JØrgensen T, Nielsen NH, Madsen F, Frolund L, Dirksen
A. The prevalence of skin-test-positive allergic rhinitis in Danish adults:
two cross-sectional surveys 8 years apart. The Copenhagen Allergy
Study. Allergy 2000;55:767-72.
9. Gargano D, Romano C, Manguso F, Cutajar M, Altucci P, Astarita C.
Relationship between total and allergen-specific IgE serum levels and
presence of symptoms in farm workers sensitized to Tetranychus urticae.
Allergy 2002;57:1044-7.
10. Droste JHJ, Kerkhof M, deMonchy JGR, Schouten JP, Rijcken B, The
Dutch ECRHS Group. Association of skin test reactivity, specific IgE,
total IgE, and eosinophils with nasal symptoms in a community-based
population study. J Allergy Clin Immunol 1996;97:922-32.
11. Vervloet D, Haddi E, Tafforeau M, Lanteaume A, Kulling G, Charpin D.
Reliability of respiratory symptoms to diagnose atopy. Clin Exper
Allergy 1991;21:733-7.
12. Tollerud DJ, O’Conner GT, Sparrow D, Weiss ST. Asthma, hay fever,
and phlegm production associated with distinct patterns of allergy skin
test reactivity, eosinophilia, and serum IgE levels. Am Rev Respir Dis
1991;144:776-81.
13. Brown WG, Halonen MJ, Kaltenborn WT, Barbee RA. The relationship
of respiratory allergy, skin test reactivity, and serum IgE in a community
population sample. J Allergy Clin Immunol 1979;63:328-35.
14. Barbee RA, Halonen M, Kaltenborn W, Burrows B. A longitudinal study of
respiratory symptoms in a community population sample. Correlations with
smoking, allergen skin-test reactivity, and serum IgE. Chest 1991;99:20-6.
15. Bosquet J, Anto JM, Bachert C, Bosquet J, Colombo P, Crameri R, et al.
Factors responsible for differences between asymptomatic subjects and
patients presenting an IgE sensitization to allergens. A GA2LEN Project.
Allergy 2006;61:671-80.
16. Soderstrom L, Kober A, Ahlstedt S, de Groot H, Lange C-E, Paganelli R,
et al. A further evaluation of the clinical use of specific IgE antibody test-
ing in allergic disease. Allergy 2003;58:921-8.
17. Arbes SJ, Gergen PJ, Elliott L, Zeldin DC. Prevalence of positive skin
test responses to 10 common allergens in the US population: Results
from the Third National Health and Nutrition Examination Survey. J Al-
lergy Clin Immunol 2005;116:377-83.
18. Burrows B, Martinez FD, Halonen M, Barbee RA, Cline MG. Associa-
tion of asthma with serum IgE levels and skin-test reactivity to allergens.
N Engl J Med 1989;320:271-7.
19. Celedon JC, Sredl D, Weiss ST, Pisarski M, Wakefield D, Cloutier MM.
Ethnicity and skin test reactivity to aeroallergens among asthmatic chil-
dren in Connecticut. Chest 2004;125:85-92.
20. Joseph CLM, Peterson EL, Johnson CC, Ownby DR. Racial differences
in allergen sensitivity. Chest 2004;126:1004-5.
21. Sunyer J, Jarvis D, Pekkanen J, Chinn S, Janson C, Leynaert B, et al.
Geographic variations in the effect of atopy on asthma in the European
Community Respiratory Health Study. J Allergy Clin Immunol 2004;
114:1033-9.
22. Taussig LM, Wright AL, Holberg CJ, Halonen M, Morgan WJ, Martinez
FD. Tucson Children’s Respiratory Study: 1980 to present. J Allergy
Clin Immunol 2003;111:661-75.
23. Litonjua AA, Carey VJ, Burge HA, Weiss ST, Gold DR. Parental history
and the risk for childhood asthma. Does mother confer more risk than
father? Am J Respir Crit Care Med 1998;158:176-81.