Embed Size (px)
Citation preview

THE RELATIONSHIP BETWEEN REAL EFFECTIVE
FINANCIAL EXCHANGE RATE (REFER) AND
CAPITAL FLOWS: IN THE CASE OF THAILAND
BY
MS. THIPSUDA SUKDAM
ANINDEPENDENT STUDYSUBMITTED IN PARTIAL
FULFILLMENT OF THE REQUIREMENTS FOR
THE DEGREE OF MASTER OF SCIENCE
PROGRAM IN FINANCE (INTERNATIONAL PROGRAM)
FACULTY OF COMMERCE AND ACCOUNTANCY
THAMMASAT UNIVERSITY
ACADEMIC YEAR 2014
COPYRIGHT OF THAMMASAT UNIVERSITY


(1)
Independent Study Title THE RELATIONSHIP BETWEEN REAL
EFFECTIVE FINANCIAL EXCHANGE RATE
(REFER) AND CAPITAL FLOWS: IN THE
CASE OF THAILAND
Author Ms. Thipsuda Sukdam
Degree Master of Science (Finance)
Major Field/Faculty/University Master of Science Program in Finance
(International Program)
Faculty of Commerce and Accountancy
Thammasat University
Independent Study Advisor Assistant Professor Suluck Pattarathammas, DBA.
Academic Years 2014
ABSTRACT
A real exchange rate, being an indicator of monetary policy transmission,
is used measure to country’s international competitiveness. Due to the rapid growth in
international financial transactions, financial market transmission of exchange rate
movement are in interests. Real effective financial exchange rate (REFER) index is
introduced as an indicator of price competitiveness of country’s assets. This research
proposes the REFER index in the case of Thailand and concentrates exchange rate
movement through the valuation channel. Thailand’s REFER index movements are
heterogeneous from REER which is trade-weight real exchange rate index.
Moreover, this paper investigates the relationship between real exchange rate and
international capital flows. The main finding shows the different impact size of any
kind of capital flows on REER and REFER. However, both of real exchange rate
indexes, REER and REFER, benefit policy makers as an intermediate target for
monetary policy operations.
Keywords: Real effective financial exchange rate, Capital flows, Valuation channel

(2)
ACKNOWLEDGEMENTS
I have completed this paper under the best supporting from many
important people. Firstly, I would like to special acknowledge my advisor, Assistant
Professor Suluck Pattarathammas, who always gives me the valuable guidance,
advices and suggestions. I also appreciate my committee, Associate Professor
Kulpatra Sirodom, who help to enhance the analysis framework and improve the
research quality. Moreover, I am so grateful for my parents, all MIF instructors,
administrative staffs and friends who are the background of my successful.
Ms. Thipsuda Sukdam

(3)
TABLE OF CONTENTS
Page
ABSTRACT (1)
ACKNOWLEDGEMENTS (2)
LIST OF TABLES (5)
LIST OF FIGURES (6)
CHAPTER 1 INTRODUCTION 1
CHAPTER 2 STRUCTURE OF THAILAND’S BALANCE OF PAYMENTS 3
CHAPTER 3 REVIEW OF LITERATURE 5
CHAPTER 4 THEORETICAL FRAMEWORK 7
4.1 Real effective exchange rate 7
4.2 Real effective financial exchange rate 8
4.3 Exchange Rate Impacts: Valuation Channel 10
CHAPTER 5 RESEARCH METHODOLOGY 12
5.1 Real effective financial exchange rate 12
5.2 The relationship between real effective financial exchange rate 14
and capital inflows
CHAPTER 6 DATA 17

(4)
CHAPTER 7 RESULTS AND DISCUSSION 21
7.1 Thailand Real Effective Financial Exchange Rate (REFER) 21
7.2 The empirical results of the relationship between real exchange rate 25
and capital flows.
CHAPTER 8 CONCLUSIONS AND RECOMMENDATIONS 30
REFERENCES 32
BIOGRAPHY 34
(5)
LIST OF TABLES
Tables Page
2.1 Thailand balance of payments component from 2005-2014 4
5.1 Thailand’s top trading partner and financial partner countries 13
7.1 The REER and REFER determination model of private capital inflows 26

(6)
LIST OF FIGURES
Figures Page
2.1 Thailand’s balance of payments 3
7.1 The comparison between NEER and NEFER movements 21
7.2 Volatility of REFER and REER 23
7.3 Return of MSCI Thailand versus MSCI Financial Partners Countries 23
7.4 Thailand REER and REFER index 24

(7)

1
CHAPTER 1
INTRODUCTION
Although the world economy continues to recover from the global
financial crisis in 2008, uncertainties from financial risks remain such as capital flows
reversal. Looking ahead, the divergence in monetary policy in G-3 countries due to
the divergent recovery path in each country is also the new challenge to global
financial markets. As a result, global capital markets would likely to be more volatile
in the periods ahead.
Thailand’s financial market, which is a part of global financial
integration, would inevitably face international capital mobility. Thai currency
exchange market would be pressured from international capital reversal and/or capital
inflows due to the high correlation between foreign capital flows and exchange rate.
Thus, it needs to understand the relationship between exchange rate and capital
inflows in case of Thailand.
In Thailand, capital flows are a major share of cross-border transaction
which play an important role to determine the movement in exchange rate under
diminishing current account conditions. The Foreign Direct Investment (FDI) is the
majority of capital flows into Thailand for long time. However, after the global
financial crisis in 2008 there are large portfolio flows from core markets into
emerging markets including Thailand. Therefore, portfolio inflows are one of
exchange rate determinants and becoming more powerful whereas the size of FDI
inflows and trade balance of Thailand tend to slow down. In conformity with the
studies of Lartey (2007) and Combes et al. (2011), portfolio investment has the
highest appreciation effect followed by FDI and loans because FDI and loans are
potentially related to an increase in productive capacity.
Numerous economic research papers studied the relationship between
capital inflows and real effective exchange rate (REER) to describe behavior of the
country trading competitive indices affected by international fund flows. However,
recent researches emphasize that exchange rate movements operate through the
valuation channel, in addition to traditional impact on real variables such as trade

2
balance, in line with the rapid growth in the scale of cross-border financial holding
(Lane and Shambaugh, 2010). Because trade weighted exchange rate index or REER
is insufficient to fully understand the financial impact of currency movement, Gelman
et al. (2013) propose the new integrated approach to investigate the interaction
between asset prices, exchange rate and capital flows. Real Effective Financial
Exchange Rate (REFER), being financial weighted exchange rate index, is introduced
as an indicator of the price competitiveness of country’s assets. Lane and Shambaugh
(2010) show that the trade-weighted exchange rate index and financial-weighted
exchange rate index are heterogeneity. In addition, Gelman et al.’s (2013) study
suggests a better performance of the new financial-weighted index than traditional
real effective exchange rate.
The new approach motivates this paper to construct the REFER in case of
Thailand in order to understand the relationship between exchange rate, capital
inflows and asset prices under global financial market integration. Meanwhile, the
main purpose of this paper is to investigate the relationship between REFER and
different forms of capital flows (FDI, portfolio investment and loans) which are the
main pressure on the exchange rate. This paper also aims to compare the REER and
REFER movements in case of Thailand and then describe the differences among two
indices.
The rest of this paper is organized as follows: Section II shows the
structure of Thailand’s Balance of Payments. Related literatures are reviewed in
section III. Section IV describes the theoretical framework of this study especially the
concept of financial-weighted real exchange rate index under portfolio balance
approach. Section V explains (i) REFER construction procedure and (ii) the
methodology of investigation the relationship between real exchange rate (both REER
and REFER) and capital inflows. Section VI shows the empirical results (i) Thailand
REFER index and the comparison between the movements of REFER and REER (ii)
the relationship between real exchange rate and capital flows. Finally, the conclusion
and implication of overall subsequent is in the section VII.

3
-20,000
-10,000
0
10,000
20,000
30,000
40,000
2005 2006 2007 2008 2009 2010 2011 2012 2013 2014
Mn USD Figure 2.1: Thailand's balance of payments
Current Account Financial Account
CHAPTER 2
STRUCTURE OF THAILAND’S BALANCE OF PAYMENTS
The foreign capital flows into Thailand come from two channels, namely,
the current account and financial account. These two accounts cause exchange rate
movements. The first channel, current account (CA), is the sum of trade balance and
net service incomes and transfers. The CA is composed of high proportion of trade
balance (Export - Import). The second channel, financial account (FA), represents
non-resident claim on transactions in financial instruments. Main components in FA
are composed of direct investment, portfolio investment, loans and others. Changes in
either direction or magnitude of capital flows can influence exchange rate movements.
From the figure 2.1, after the global financial crisis, the current account
tends to decline owing to lower growth in export of goods. Then, financial
transactions such as foreign direct investment (FDI), portfolio investment and loans
become the main source of international capital inflows and affect exchange rate
movements.
Source: Bank of Thailand

4
Table2.1: Thailand Balance of Payment’s component development from 2005-2014
Year 2005 2006 2007 2008 2009 2010 2011 2012 2013 2014
Current Account -7,642 2,315 15,682 2,157 21,896 10,024 8,902 -1,499 -3,881 13,129
Trade Balance 3,402 13,670 26,640 17,348 32,620 29,751 16,989 6,670 6,661 24,582
Net Services Incomes
and Transfers -11,044 -11,354 -10,959 -15,191 -10,724 -19,727 -8,087 -8,169 -10,542 -11,453
Financial Account 6,974 8,106 -1,649 12,633 -2,601 24,809 -8,269 12,790 -4,163 -14,564
Direct Investments 7,545 8,487 8,314 4,449 701 4,495 -4,702 -1,362 2,140 4,869
Portfolio Investments 5,510 4,232 -6,723 -2,080 -5,530 9,828 6,163 3,398 -4,766 -12,072
Financial Derivatives -529 353 -314 -677 1,113 -102 -610 539 -341 308
Other Investments -5,553 -4,966 -2,926 10,941 1,116 10,588 -9,120 10,214 -1,195 -7,668
Net Errors and Omissions 6,090 2,320 3,070 9,902 4,764 -3,753 622 -6,261 2,713 124
Balance of Payments 5,422 12,742 17,102 24,693 24,127 31,324 1,214 5,265 -5,049 -1,210
Note: Thailand’s balance of payment is compiled based on IMF balance of payment edition 6th (BPM6)
Source: Bank of Thailand

5
CHAPTER 3
REVIEW OF LITERATURE
There are various studies about the relationship between exchange rate
and capital flows. The previous study of Zanello and Desruelle (1 9 9 7 ) shows the
cointegration between capital inflows and real exchange rate. At the same time, Fund
inflows have dual effects to host country that is a dilemma for policymakers to
manage capital policy. The pick-up in capital inflows possibly lead to a loss in trade
competitiveness due to host country REER appreciation. Bakardzhieva et al. (2 0 1 0 )
also find that net capital flows have a positive impact on REER, implying that capital
flows could be a factor which leads to REER appreciation and distort country trade
competitiveness. On the contrary, capital inflows could benefit host country due to the
improvement in investment and a current account deficit financing. Moreover, the
impacts of each type of inflows on REER are different. In term of financial markets,
asset price competitiveness and the construction of the real effective financial
exchange rate are concentrated. Net foreign asset position and REFER are
cointegrated and have the long-run relationship (Gelman et al., 2 0 1 3) (Kubelec and
Sa, 2012).
In the case of Thailand, foreign capital inflows and net foreign equity
purchases are found to be the cause of real effective exchange rate movements
according Gyntelberg et al. (2 0 0 9 ) and Chai-Anant et al. (2 0 0 8 ) . Furthermore,
Ananchotikul and Sitthikul (2008) find that an increase in capital flows into Thailand
benefits the country to upgrade macroeconomic fundamentals.
The previous analysis about the correlation of real exchange rate and
international capital flows mostly focuses on traditional impacts on real variables such as
trade balance. Nonetheless, the new wave of financial research proposes another side of
exchange rate movement effect through valuation channel in addition to traditional
impact. The valuation channel refers to capital gains and losses on the international
balance sheet from cross-border financial holding. To understand the financial impact of
change in exchange rate, Land and Shambaugh (2 01 0 ) construct net financial exchange
rate indices that is the combination of asset- and liability-weighted exchange rate indices.

6
Moreover, the proposition of real effective exchange rate that is not only financially
weighted but also deflated by financial asset price is used to emphasize causes and
consequences of exchange rate movement in international capital market transaction.
The net financial index captures the exposure of a country’s international
balance sheet to exchange rate movements. The comparison result of Lane and
Shambaugh (2 0 1 0 ) shows tremendous heterogeneity in the co-movement between
conventional trade-weight exchange rate index and net financial index. Moreover,
they observe that the trade-weighted rate indices are insufficient to provide a full
understand about financial impacts of currency movements. Their analysis also shows
that many developing countries have a negative position in foreign currencies such
that depreciation in domestic currency leads to negative wealth effects due to funding
foreign liability in foreign currencies. In addition, they find that the wealth effects
associated with exchange rate are substantial and can explain a sizable share of the
overall valuation shocks that hit the net foreign asset position.
The previous empirical study of Lane and Shambaugh (2 0 1 0 ) , Tille
(2003) and Lane and Milesi-Ferretti (2007) find that the financial weighted indices for
United States are quite different from trade weighted indices.
Recently, Gelman et. al. (2 0 1 3 ) propose new index of exchange rate
adjusted by cross-country asset price ratio which is interpreted as a real effective
financial exchange rate (REFER) based on the standard international capital asset
pricing model. They study a new integrated approach of interaction between asset
price, exchange rates and capital flows. The analysis result shows that country’s real
financial exchange rate cointegrates with international investor’s net foreign asset
holding. The most interest of this paper is the empirical results suggesting a better
performance of the REFER than REER which is applied in many literatures.

7
𝑊𝑖𝑗 = 𝛼𝑖 𝑀 𝑊𝑖𝑗 𝑀 + 𝛼𝑖 𝑃 𝑊𝑖𝑗 𝑃 + 𝛼𝑖 𝑇 𝑊𝑖𝑗 (𝑇)
CHAPTER 4
THEORETICAL FRAMEWORK
4.1 Real Effective Exchange Rate (REER)
Real Effective Exchange Rate (REER) is an indicator used to measure
country’s international trade competitiveness. The index comes from nominal
exchange rate movements adjusted by goods prices ratio of the country to trading
partner’s countries.
The REER index is geometrically weighted average of bilateral exchange
rates. As represented by Loretan (2005), the nominal exchange rate index at time t (𝑰𝒕)
is equal to;
(1)
where 𝐼𝑡−1 is value of index at time t-1, 𝑒𝑗,𝑡 and 𝑒𝑗,𝑡−1 are the price of currency i in
term of currency j at time t and t-1 respectively, 𝑤𝑗,𝑡 is weight of currency j in the
index and N is the number of currencies in the index.
The International Monetary Fund’s Information Notice System (INS) uses the
trade competitiveness weighting scheme and consumption price deflators for the
computation of REER index. The weights are based on trade in manufactures, primary
commodities and tourism services and are derived from;
(2)
where 𝑊𝑖𝑗 𝑀 ,𝑊𝑖𝑗 𝑃 , 𝑊𝑖𝑗 𝑇 are weight for trade in manufactures, primary
commodities, and tourism services respectively (Zanello and Desruelle, 1997).
Moreover, the currency weights designed in the study of Loretan (2005) show that the
weights for each country reflect the importance of respective economies for trade
competition. Competition in traded goods occurs in both domestic and foreign
markets so that weights of currency indices are linear combination of three
components which consist of (1) merchandise imports from country j to country i
(2) merchandise exports from country i to country j (3) fraction of economy k’s
,which is third market, merchandise import from country j.
𝐼𝑡 = 𝐼𝑡−1 ∗ (𝑒𝑗 ,𝑡
𝑒𝑗 ,𝑡−1
)𝑤𝑗 ,𝑡
𝑁
𝑗=1

8
𝑊𝑡𝑖 =
𝑃𝑗 ,𝑡 ∗ 𝐹𝑗 ,𝑡𝑖
𝑆𝑖𝑗 ,𝑡
, j = 1, … , i, … , N
𝑁
𝑗=1
4.2 Real Effective Financial Exchange Rate (REFER)
The concept of REER focuses only on international trade patterns.
Meanwhile, Gelman et al. (2013) and Lane and Shambaugh (2010) consider that
REER is insufficient to investigate the international financial transactions. In order to
capture impacts of real exchange rate movements caused by cross-border financial
transactions, the financial effective exchange rate ( REFER) is generated from
standard portfolio balance approach. REFER follows an exchange rate theory that
represents a function of relative supplies of domestic and foreign bonds (Husted and
Melvin, 2009). The exchange rate movements are determined by investors’ decision
to allocate their portfolio either to domestic or foreign assets which based on expected
returns.
According to REFER concept from Gelman et al. (2013), the model of
REFER explicitly concentrates on short-run portfolio dynamics allocation and assume
constant in real supply in domestic and foreign assets. There are N investors, one
investor for each country, allocating their wealth into the financial assets of N
countries. The nominal wealth of the country i investor in term of domestic currency
(𝑊𝑡𝑖 is;
(3)
where 𝑃𝑗,𝑡 is foreign currency price of foreign assets, 𝐹𝑗,𝑡𝑖 is N-1 real foreign assets in
terms of foreign currency and 𝑆𝑖𝑗,𝑡 is the spot exchange rate that can be defined as the
price of domestic currency in units of foreign currency.
Moreover, there is more assumed that investor i can buy foreign assets by
selling domestic assets for short-run and they hold these positions of portfolio for one
period. At the end of the period, investor i will totally unwind their foreign assets and
the investor then holds only domestic assets. This transaction influences the exchange
rate to realize.
Total nominal stock of country’s i asset in terms of domestic currency will
be 𝑃𝑖,𝑡 ∗ 𝐹𝑖 where 𝐹𝑖 is country i assets and 𝑃𝑖,𝑡 is the domestic currency price of the
domestic assets.

9
Because assets 𝐹𝑖 are either obtained by domestic investor i or the foreign
investors, nominal stock of country’s i asset then follows as
𝑃𝑖,𝑡 ∗ 𝐹𝑖 = ∑ 𝑃𝑖,𝑡 ∗ 𝐹𝑖,𝑡
𝑗𝑁𝑖=1 , j = 1, … , i, … , N (4)
Under the condition that investors can take foreign assets by selling domestic assets,
the domestic assets that are hold by foreign investors equate the foreign assets that are
hold by domestic investors.
∑ 𝑃𝑖,𝑡 ∗ 𝐹𝑖,𝑡𝑗
= ∑𝑃𝑗,𝑡∗𝐹𝑗,𝑡
𝑖
𝑆𝑖𝑗,𝑡
𝑁𝑗=1
𝑁𝑖=1 ,∀𝑗 ≠ 𝑖 (5)
Then, the equilibrium condition form will be
𝑃𝑗,𝑡∗𝐹𝑗,𝑡
𝑖
𝑆𝑖𝑗,𝑡= 𝜔𝑗,𝑡
𝑖 𝑊𝑡𝑖 , ∀𝑖, 𝑗 (6)
Where 𝜔𝑗,𝑡𝑖 is the efficient share of country j’s asset in investor i’s portfolio and
∑ 𝜔𝑗,𝑡𝑖𝑁
𝑗=1 = 1 , ∀𝑖
From eq.6 it can be rewritten into
𝑃𝑗,𝑡
𝑆𝑖𝑗,𝑡=
𝜔𝑗,𝑡𝑖 𝑊𝑡
𝑖
𝐹𝑗,𝑡𝑖 , ∀𝑖, 𝑗(7)
According to 𝑆𝑖𝑗,𝑡 =1
𝑆𝑗𝑖,𝑡 and N-1 ratios of cross-countries holding denominated in
country j currency for each portfolio, the equilibrium of investment is
𝑃𝑖,𝑡∗𝑆𝑖𝑗,𝑡
𝑃𝑗,𝑡=
{𝜔𝑖,𝑡𝑗
𝑊𝑡𝑗𝑆𝑗𝑖,𝑡}/𝐹𝑖,𝑡
𝑗
{𝜔𝑗,𝑡𝑖 𝑊𝑡
𝑖}/𝐹𝑗,𝑡𝑖
(8)
In the equilibrium, the asset price ratio in terms of country-j currency is
equal to the ratio of nominal demand per a unit of real assets. The left-hand side term
in eq. 8 can be approximated to currency i’s real bilateral exchange rate relative to
currency j. When this term goes up, it means that real exchange rate of country i
appreciates. The asset price ratio will be interpreted as currency i’s real bilateral
exchange rate versus currency j. Hence, the formula of currency i’s real effective
financial exchange rate is following;
∏ 𝑃𝑖,𝑡𝑆𝑖𝑗,𝑡
𝑃𝑗,𝑡 𝜃𝑗
𝑖𝑁𝐽=1 = ∏
{𝜔𝑖,𝑡𝑗
𝑊𝑡𝑗𝑆𝑗𝑖,𝑡}/𝐹𝑖,𝑡
𝑗
{𝜔𝑗,𝑡𝑖 𝑊𝑡
𝑖}/𝐹𝑗,𝑡𝑖
𝜃𝑗𝑖
𝑁𝐽=1 ,∀𝑗 ≠ 𝑖 (9)
10
where 𝜃𝑗𝑖 are constant weights derived from the cross-country holding of investor i
and j (both assets and liabilities side) so that ∑ 𝜃𝑗𝑖𝑁
𝑖=1 = 1 , ∀𝑖.
From the equilibrium equation in eq.(9), the left-hand side term will be
interpreted as REFER or real exchange rate of currency i against currency j while the
right-hand side term represents the weighted average of net foreign holdings i’s assets
in the portfolios of foreign investors. In other words, it shows the importance of
market capitalization in the domestic market as well as in the foreign market. When
investors change the proportion in their portfolio by increasing share of domestic asset
and decreasing foreign investment position, foreign asset price should be lower and
REFER will appreciate.
4.3 Exchange Rate Impacts: Valuation Channel
Impacts of exchange rate movements on international balance sheet
through valuation channel can be expressed in following framework. The change in
the net foreign asset position (NFA) coming from current account surplus and net
capital gain can be written as
𝑁𝐹𝐴𝑡 − 𝑁𝐹𝐴𝑡−1 = 𝐶𝐴𝑡 + 𝑉𝐴𝐿𝑡 (10)
where 𝐶𝐴𝑡 is the current account surplus and 𝑉𝐴𝐿𝑡 is net capital gain on existing
holding foreign assets and liabilities. Under currency denomination of foreign assets
and liabilities conservation, the net foreign asset position can be replaced with
𝑁𝐹𝐴𝑡 − 𝑁𝐹𝐴𝑡−1 = 𝑇𝐵𝑡 + 𝐹𝐶𝑡 = 𝑇𝐵𝑡 + 𝑁𝐸𝑇𝐼𝑁𝑉𝐼𝑁𝐶𝑡 + 𝑉𝐴𝐿𝑡𝑀𝑉 + 𝑉𝐴𝐿𝑡
𝑋𝑅 (11)
where 𝑇𝐵𝑡 is the trade balance and 𝐹𝐶𝑡 is the aggregate net financial return on
external investment position. The financial return on external investment position is
sum of investment incomes 𝑁𝐸𝑇𝐼𝑁𝑉𝐼𝑁𝐶𝑡), net capital gains from shifting in local-
currency asset prices (𝑉𝐴𝐿𝑡𝑀𝑉) and net capital gains from currency movement
(𝑉𝐴𝐿𝑡𝑋𝑅). According to the financial-weight exchange rate concept, international
investors allocate their portfolios by considering the net capital gain from investment.
The REFER would operates through the valuation channel, while the trade-weighted
index influences net exports.

11
There are generally evidences suggesting that currency movements do
matter for investor-currency returns (Lane and Milesi-Ferretti, 2005). The local
country’s currency depreciation causes improvement in export value and could
increase the local currency returns on holding equity (both form of portfolio
investment in equity and foreign direct investment) of export-oriented firms. In the
other way, the currency depreciation may be caused by weak economy. It would be
negative effects to the local currency returns on domestically-oriented firms. Then,
the relationship between exchange rate movements and local currency returns on
foreign portfolio investment in equity and FDI could be weak correlation. Meanwhile,
loans and deposits have no price valuation effects.
The valuation effects depend on the net foreign position of the country.
The country receives valuation gains if net financial-weighted effective exchange rate
index (REFER) increases. On the contrary, the country gets valuation loss if financial-
weighted effective exchange rate index falls. The results of Lane and Milesi-Ferretti
(2005) show that many developing countries have negative net position in foreign
currencies and depreciations in domestic currency generate negative wealth effects.
However, many countries could balance their foreign position by increasing net
foreign asset position to absorb wealth shocks from currency movements.

12
CHAPTER 5
RESEARCH METHODOLOGY
5.1 Real Effective Financial Exchange rate
From equation (9),
∏ (𝑃𝑖,𝑡𝑆𝑖𝑗,𝑡
𝑃𝑗,𝑡)𝜃𝑗𝑖
𝑁𝐽=1 = ∏
(
{𝜔𝑖,𝑡𝑗
𝑊𝑡𝑗𝑆𝑗𝑖,𝑡}
𝐹𝑖,𝑡𝑗
{𝜔𝑗,𝑡𝑖 𝑊𝑡
𝑖 }
𝐹𝑗,𝑡𝑖
)
𝜃𝑗𝑖
𝑁𝐽=1 for∀𝑗 ≠ 𝑖
The currency i’s real bilateral exchange rate versus currency j can be calculated from
geometric financial-weighted aggregate exchange rate under financial asset price
deflator. The left hand side term is REFER.
There are three steps to compute REFER. Firstly, the financial market
weight (𝜃𝑗𝑖) is derived from the cross-country holdings of investors i and j that
incorporate both asset-side and liability-side position. These weights indicate the
direction of the valuation impact of a movement in currency j against currency i. In
this study, the author uses the Bank of Thailand International Investment Position
(IIP) dataset that is the balance sheet of the country vis-à-vis the rest of the world and
comprising of financial claims on nonresidents and liabilities to nonresidents
provides. The IIP dataset provides direct investment and portfolio investment of
Thailand classified by country in both asset and liabilities side. Furthermore, the
dataset shows financial transactions between residents and nonresidents, reflecting
changes of ownership over financial assets and liabilities, which may be categorized
as direct investment, portfolio investment, financial derivatives, and other investment.
According to the annually financial weight from IIP, the author assumes that these
weights are constant over 12 months in each year, and the weights will change every
year following the latest foreign assets position survey.
Weight of REFER would be different from REER due to distinction of
partner countries between trading transitions and financial transactions. The

13
following table shows the share of Thailand Top 10 trading partner and financial
partner countries in 2014.
Table5.1: Thailand’s Top trading partner and financial partner countries
Rank
Trading partners Financial partners
Country % Share to trade volume Country % Share to International
Investment Position
1 China 13.6 Japan 17.6
2 Japan 13.2 United Kingdom 13.3
3 USA 7.8 Singapore 12.0
4 Malaysia 5.5 USA 11.4
5 UAE 4.3 HongKong 5.9
6 Singapore 4.1 Netherland 3.4
7 Indonesia 4.0 Cayman Islands 3.4
8 Australia 3.3 Belgium 3.3
9 Hong Kong 3.1 Mauritius 2.2
10 Korea 2.9 British virgin 2.1
Source: Bank of Thailand and calculated by author.
The second step is to collect the daily bilateral exchange rate data in form
of closing rate from Reuter’s database. Then, the daily exchange rate data is
transformed to monthly dataset by using average method. After that, the nominal
financial market bilateral exchange rates are constructed by geometric aggregating the
bilateral exchange rate of financial partner countries with financial-weighted in the
first step.
Third, the nominal financial market bilateral exchange rates are deflated
by the ratio of Thailand’s financial asset prices to foreign financial asset prices. The

14
author uses MSCI Thailand stock market index and financial partner’s weighted
average MSCI stock market index to be proxies of financial asset prices. MSCI stock
market indices are constructed by MSCI Global Investable Market Indices (GIMI)
method which is representative of foreign asset price.
5.2 The relationship between real effective financial exchange rate and capital
inflows
A number of studies look at the impact of capital flows on Real Effective
Exchange Rate (REER). The REER determination model of private capital inflows
are given as:
𝑅𝐸𝐸𝑅𝑡 = 𝛼0 + 𝛼1𝑇𝑂𝑇𝑡 + 𝛼2𝑇𝑂𝑇𝑡−1 + 𝛼3𝐶𝐴𝑡 + 𝛼4𝐶𝐴𝑡−1 + 𝛼5𝐹𝐷𝐼𝑡 + 𝛼6𝐹𝐷𝐼𝑡−1 +
𝛼7𝑃𝑜𝑟𝑡𝑡 + 𝛼8𝑃𝑜𝑟𝑡𝑡−1 + 𝛼9𝐿𝑜𝑎𝑛𝑡 + 𝛼10𝐿𝑜𝑎𝑛𝑡−1 + 𝜀𝑡
(12)
where 𝑅𝐸𝐸𝑅𝑡 is the real effective exchange rate; 𝑇𝑂𝑇𝑡 is the term of trade; 𝐶𝐴𝑡 is
the ratio of current account balance to GDP which shows the value of trade balance of
goods, net service incomes and transfers; 𝐹𝐷𝐼𝑡 is the ratio of net foreign direct
investment inflows to GDP; 𝑃𝑜𝑟𝑡𝑡 is the ratio of net foreign portfolio investment
inflows, both in bond market and equity market, to GDP; 𝐿𝑜𝑎𝑛𝑡 is the ratio of net
foreign loan inflows to GDP.
To understand the relationship between REFER and capital inflows, the
author thus follows the determination model to investigate the relationship between
real effective financial exchange rate and macroeconomic fundamentals.
𝑅𝐸𝐹𝐸𝑅𝑡 = 𝛽0 + 𝛽1𝑇𝑂𝑇𝑡 + 𝛽2𝑇𝑂𝑇𝑡−1 + 𝛽3𝐶𝐴𝑡 + 𝛽4𝐶𝐴𝑡−1 + 𝛽5𝐹𝐷𝐼𝑡 + 𝛽6𝐹𝐷𝐼𝑡−1 +
𝛽7𝑃𝑜𝑟𝑡𝑡 + 𝛽8𝑃𝑜𝑟𝑡𝑡−1 + 𝛽9𝐿𝑜𝑎𝑛𝑡 + 𝛽10𝐿𝑜𝑎𝑛𝑡−1 + 𝜀𝑡
(13)
where 𝑅𝐸𝐹𝐸𝑅𝑡 is real effective financial exchange rate which uses financial-weighted
regime and asset price deflators.
Terms of trade (TOT) use to measure the country’s international trading
gain. A rise in terms of trade is expected to cause the real exchange rate appreciation

15
through income effects rather than substitution effects. Better terms of trade can also
improve trade balance and the country will receive more income from exports.
Current account balance (CA) is the summation of net income from
exporting goods and services to foreign countries and foreign investment incomes.
Higher country’s competitiveness in global market generates more income to the
country and real exchange rate should be appreciated. However, demand of foreign
goods and services would increase from wealth effects and lead to high degree of
import value. The real exchange rate equilibrium is adjusted following trade activities.
Capital flows affect real exchange rate in different results depending on
the composition of capital flows. Foreign direct investment (FDI) moves into target
countries for market expansion, resource seeking and risk diversification objectives.
The large amount of capital flows is the nature of FDI which pressure on real
exchange rate. However, FDI flows could be related to investment in imported
machinery and equipments, and FDI may improve local productivity through
knowledge transfers. Hence, the pressure of FDI on real exchange rate would be
reduced. Foreign portfolio investment (PORT) is another kind of international fund
flows. PORT is relatively liquid due to short term investment position of foreign
investors. The investors want to take a position in profitability of firms and have no
management authority. Furthermore, foreign loan is a loan issued by non-resident
lenders. The foreign loan inflows are uncertain depending on the demand for loan of
local firms. Appreciation in real exchange rate due to portfolio investments and loans
inflows are more volatile. These flows do not necessarily improve productivity
capacity.
The Ordinary Least Square (OLS) is applied to estimate the relationship
between real exchange rate indices, both REER and REFER, and capital inflows. The
time-series variables used in all regression models in this paper are quarterly data
from 1st quarter of2006 to 4th quarter of2014. Before choosing an appropriate model,
the author tests a unit root by employing the Augmented Dicky –Fuller test whether
a unit root is presented in an autoregressive model.
∆𝑅𝐸𝐹𝐸𝑅𝑡 = 𝜇 + 𝛾𝑅𝐸𝐹𝐸𝑅𝑡−1 + ∑ ∅𝑖∆𝑅𝐸𝐹𝐸𝑅𝑡−1 + 𝜀𝑖𝑝𝑖=2 (14)
16
where ∆ is the first difference operator. This model can be estimated and test for a
unit root under null hypothesis of 𝛾 = 0. The optimal number of lags (p) is justified
by using Schwarz’s Bayesian information criterion (SBIC). The test-statistic is
compared to Dickey–Fuller table.
One of assumptions underlying ordinary least square (OLS) estimation is
that the errors are uncorrelated. This assumption can easily be violated for time series
data. Durbin-Watson test is highly parametric test for autocorrelation. It is assumed
that there are no autocorrelation:
𝐻0: 𝜀𝑖 ∽ 𝑁 0, 𝜎2 𝑓𝑜𝑟 𝑎𝑙𝑙 𝑖 𝑎𝑛𝑑 𝑐𝑜𝑟𝑟(𝜀𝑖, 𝜀𝑗) = 0 𝑓𝑜𝑟 𝑖 ≠ 𝑗
The Durbin-Watson test is simply
DW = ∑ εi − εi−1
2ni=1
∑ εi2n
i=1
where 𝜀𝑖 is the 𝑖𝑡ℎ residual. Small values of DW indicate of positive autocorrelation,
while large values indicate negative autocorrelation.
The cointegration test for real exchange rate model is also important
because it is usually believed to near-cointegrated or cointegrated time series.
Spurious regression problem would occur when the variables are cointegrated. Thus,
Johansen’s maximum eigenvalue and trace tests are used to determine the number of
cointergrating vectors in the system.
17
CHAPTER 6
DATA
Throughout this paper, the author focuses on foreign assets and liabilities
of Thailand that are classified based on IMF Balance of Payments and International
Investment Position manual 6th edition. Balance of Payments is a summary of
economic transactions between residents and nonresidents that occurs at specific time
period. Balance of payments consists of three accounts, namely, current account,
capital account and financial account. Bank of Thailand is complier and publisher
Thailand Balance of payments.
The definition of nonresident investors1 consists of (1) cooperation,
institutions, funds, financial institutions or juristic person located outside Thailand;
(2) entities of foreign governments located outside Thailand (3) branches and agents
of domestic juristic persons located outside Thailand; and (5) natural person not of
Thai nationalities who do not have alien identity or residence permits.
According to the study of foreign assets and liabilities position of
Thailand, the author focuses on financial transaction between resident and non-
resident in financial account which reflect the change of ownership over financial
assets and liabilities. The assets and liabilities are categorized as direct investment,
portfolio investment, financial derivatives, and other investment.
- Direct Investment2refers to the claims on resident assets of non-
resident. A direct investor may invest in firm’s equity of capital,
lending to branch enterprise, reinvested earnings, buying debt
securities and giving trade credit to business affiliates. Investment of
nonresident in equity is indicated as a direct investment when the direct
investors have own claim equal and over than 10 percent of the
ordinary shares for an entity.
- Portfolio Investment refers to the activities among resident and
nonresidents that involves buying and selling of equity securities, debt
securities in terms of bonds, notes, money market instruments which
1 The definition from Bank of Thailand based on BPM manual edition 6. 2 Source: Bank of Thailand Meta data.

18
are not include the securities classified as direct investment and reserve
assets. The values of investments are recorded in market price basis.
- Financial Derivatives refers to the financial transactions in financial
derivatives. The financial derivative value is recorded only realized
gains and losses.
- Other Investment refers to the transaction between resident and non-
residents that includes loans, trade credits, deposits, other account
receivables and account payables.
This study provides the new approach index “Real effective financial
exchange rate (REFER)”. The index creation uses the geometric method to aggregate
bilateral exchange rate with financial weight. Aggregated weights from assets and
liabilities position in any countries are used to identify the important of these
countries to Thailand. Monthly REFER index of Thailand is presented from January
2006toDecember 2014.
However, financial weights rely on Thailand international position in
direct investments and portfolio investments and foreign investors’ investment
position in Thailand. The data of Thailand International Investment Position (IIP) are
surveyed by Bank of Thailand. Annually data are available from 2006 to 2014. The
related reports of data are following:
(1) Report EC_XT_063 represents foreign direct investment outstanding
classified by country.
(2) Report EC_XT_064 represents Thai direct investment abroad
outstanding classified by country.
(3) Report EC_XT_065 represents foreign portfolio investment
outstanding classified by country.
(4) Report EC_XT_066 represents Thai portfolio investment abroad
outstanding classified by country.
The weights of REFER vary in each year from international investment
position rebalancing and are assumed to be a constant in every month.

19
The daily closing rate of bilateral exchanges are collected from Reuter’s
database, then author averages into monthly time series data to aggregating the
nominal financial-weighted exchange rate by geometric method. The nominal rates
are deflated by Thailand financial asset prices relative to global financial asset prices.
The MSCI Thailand Index is representative of Thailand financial asset price. This
index is designed to measure the performance of the large and mid capital segments of
the Thailand market with 32 components that can cover about 85% of the Thailand
equity market. Thailand MSCI would compare to the weighted average MSCI of
financial partners which captures large and mid capital segments in any financial
markets. Finally, the index REFER is created in monthly data from January 2006 -
December 2014.
In second session of this paper, the author would investigate the
relationship between real effective financial exchange rate (REFER) and the capital
flows which be separated into Foreign Direct Investment, Portfolio Investment and
Loans. Because of scaling problem avoidance, all private capital flows value was
transformed into the ratio of capital flow to GDP. REFER was also transformed to
quarterly data by arithmetic mean in order to estimation the relationship with the
different types of capital flows to GDP.
Moreover, the author examines the relationship of traditional real
exchange rate or REER in the same model to compare the results. The quarterly data
of net capital flows are provided by Bank of Thailand. Report EC_XT_051 represents
the component of capital flows in financial account classified by sectors and
instruments from 1st quarter of 2006 to the 4th quarter of 2014.
Thai Baht Real Effective Exchange Rate (REER) is represented in
report table EC_EI_007: Nominal Effective Exchange Rate (NEER) and Real
Effective Exchange Rate (REER) by Bank of Thailand.
Current account balance (CA) which is net export of goods and
services of Thailand is quarterly data from Bank of Thailand. Its value is sum of trade
balance, net service incomes and transfers. Table EC_XT_049 shows all components
of Balance of Payments.

20
Terms of Trade are the ratio of average export prices to import prices.
Bureau of Trade and Economic Indices (BTEI), Ministry of Commerce (MOC) is the
provider and they publish the data every month since January 2000.

21
CHAPTER 7
RESULTS AND DISCUSSION
7.1 Thailand Real Effective Financial Exchange Rate (REFER)
Thailand’s REFER index represents Thai Baht currency (THB) movement
against the currencies movement of financial/investment partners which are both
outward and inward fund flow. The index is deflated by domestic financial asset
prices relative to financial asset prices in financial-partner countries. The
interpretation of REFER movements is similar to the trade-weight real exchange rate,
REER, that is higher REFER reflects more appreciated THB than financial partner
currencies. REFER appreciation could be a cause of loosing financial asset prices
competitiveness in foreign investor perspectives. On the contrary, a fall in REFER
means that THB is more depreciated than financial partners which could improve
financial asset prices competitiveness. Thus, the benefit of tracking REFER is to help
evaluate the asset price competition and the impact of international fund flow through
exchange rate channel.
Figure 7.1: The comparison between NEER and NEFER movements
Source: Bank of Thailand and the author calculation
80
85
90
95
100
105
110
115
120
Jan-
06
Jul-0
6
Jan-
07
Jul-0
7
Jan-
08
Jul-0
8
Jan-
09
Jul-0
9
Jan-
10
Jul-1
0
Jan-
11
Jul-1
1
Jan-
12
Jul-1
2
Jan-
13
Jul-1
3
Jan-
14
Jul-1
4index
2012 = 100
The NEER and NEFER
NEER NEFER

22
Figure 7.1 shows the comparison between the movements of trade-
weighted exchange rate index, called nominal effective exchange rate (NEER), and
financial-weighted scheme index which is called nominal effective financial exchange
rate (NEFER). The graph represents highly correlation of both weighed scheme
indices movements. The co-movement between NEER and NEFER implicates that
weighted bilateral exchange rate of trading partners and financial partners are not the
main cause of divergence between REER and REFER. However, there are conflicts in
some periods such as January 2009 and January - April 2012.
In January 2009, NEFER was more appreciated than NEER because of
sharp depreciations in Euro (EUR) and Singapore dollar (SGD) which are major
financial partners of Thailand. At the same time, Japanese Yen (JPY) India Rupee
(INR) and Chinese Renminbi (CNY), turned appreciate against Thai baht due to their
strong economic fundamental. The fact that Japan and India are the main trading
partners of Thailand; therefore it was the main factor to support NEER more
depreciated than NEFER.
In the first half of 2012, NEER suddenly shrank resulted from the
appreciation of Malaysian Ringgit (MYR), Indian Rupee (INR) and Philippine Peso
(PHP), which are minor countries in term of financial corporation.
Recently, Thai baht tends to continuously appreciate against both financial
and trading partners since the second half of 2014. As a result NEER and NEFER
move together in appreciation trend.
23
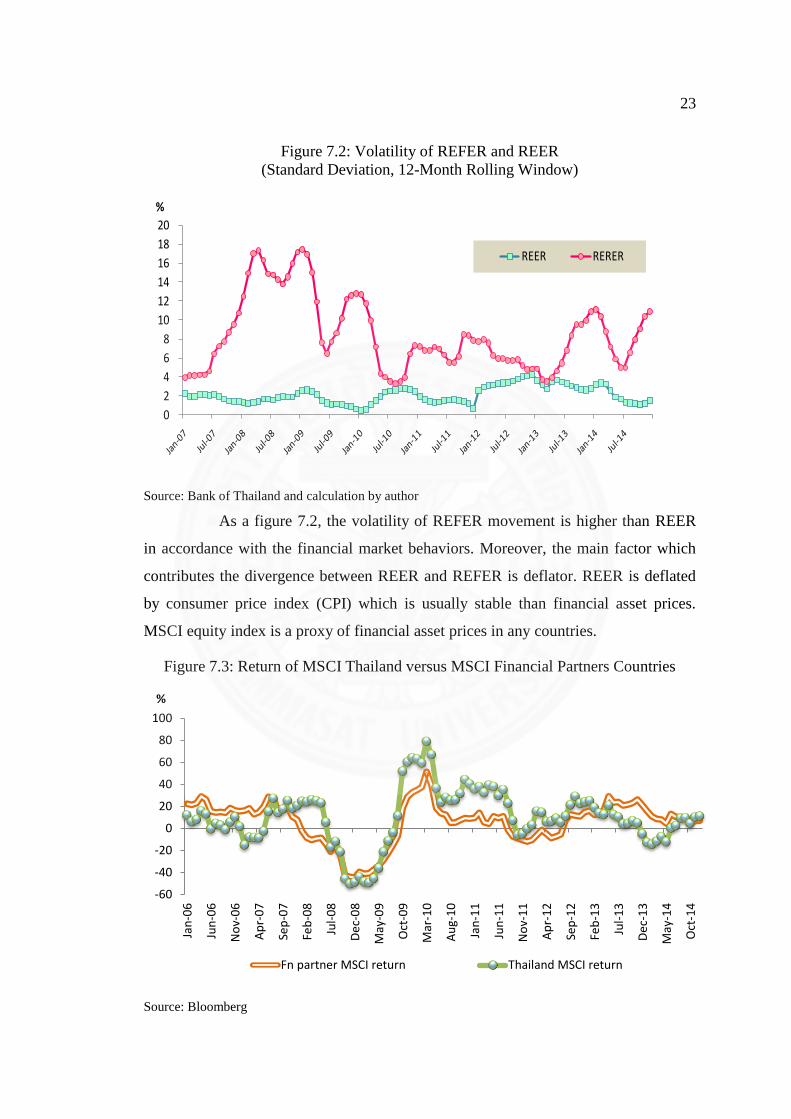
Figure 7.2: Volatility of REFER and REER
(Standard Deviation, 12-Month Rolling Window)
Source: Bank of Thailand and calculation by author
As a figure 7.2, the volatility of REFER movement is higher than REER
in accordance with the financial market behaviors. Moreover, the main factor which
contributes the divergence between REER and REFER is deflator. REER is deflated
by consumer price index (CPI) which is usually stable than financial asset prices.
MSCI equity index is a proxy of financial asset prices in any countries.
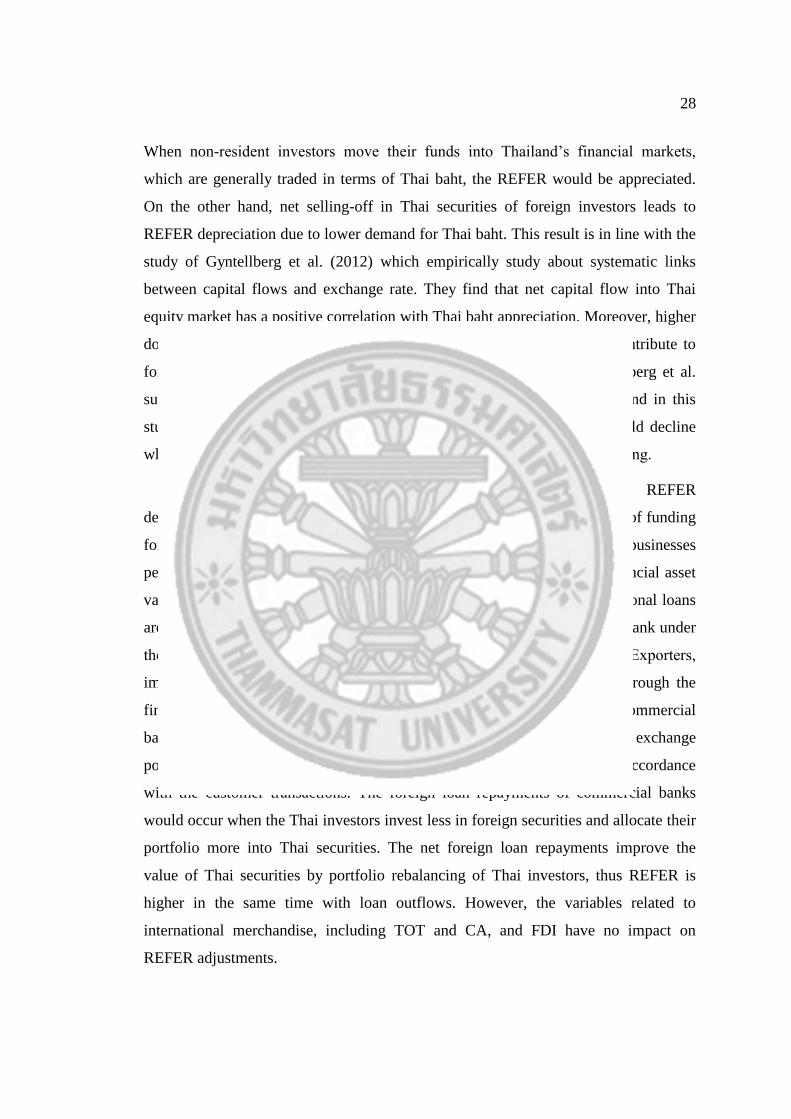
Figure 7.3: Return of MSCI Thailand versus MSCI Financial Partners Countries
Source: Bloomberg
0
2
4
6
8
10
12
14
16
18
20
% 12-Month Rolling Window of REER and REFER Standard Deviation
REER RERER
-60
-40
-20
0
20
40
60
80
100
Jan
-06
Jun
-06
No
v-0
6
Ap
r-0
7
Sep
-07
Feb
-08
Jul-
08
De
c-0
8
May
-09
Oct
-09
Mar
-10
Au
g-1
0
Jan
-11
Jun
-11
No
v-1
1
Ap
r-1
2
Sep
-12
Feb
-13
Jul-
13
De
c-1
3
May
-14
Oct
-14
% MSCI Thailand vs MSCI Financial Partners Return
Fn partner MSCI return Thailand MSCI return

24
The REER and REFER indices are heterogeneity. The financial asset
prices competitiveness index, REFER, is quite volatile more than the index measuring
trade competiveness or REER due to the flexibility of investment fund flows and
financial asset prices volatility. The figure 7.3 shows the development of MSCI stock
index return from 2006 – 2014. Though Thailand’s equity return moves together with
the financial partner markets for a long time, there are the divergent points due to the
different domestic economy environments. The equity returns difference between
Thailand and financial partner countries are the cause of REFER movement
fluctuation.
Figure 7.4: Thailand REER and REFER index
Source: Bank of Thailand and the author calculation
The figure 7.4 shows the comparison movements of REER compare to
REFER index. An increase in REFER means an appreciation of Thailand securities
relative to financial partner countries. Before the global financial crisis (GFC), Thai
REFER continued to appreciate as global financial market boom and international
funds flow into Thailand as a resulted of economy flourish. In 2008, Thailand’s
financial securities unavoidably depreciated because of global financial market
crunch. Since March 2009, REFER turned to be an upward trend reflecting increased
financial asset prices as a result of strong economic fundamental in Thailand.
Subsequently, Thai financial markets are become an attractive investment destination.
70
75
80
85
90
95
100
105
110
115
50
60
70
80
90
100
110
120
130
index REERindex REFER
The REER and REFER index
REFER REER

25
However, the return of Thailand financial market is slightly decreased from January
2013 - January 2014 because of geopolitical problem and economic slowdown. In
other words, negative impacts from domestic problem contribute to the drop in
REFER on this time. The lower REFER reflecting better asset price competitiveness
is an impulsive factor to foreign investors turn to allocate their funds into Thai
financial market after geopolitical problem relaxation. Recently, REFER is sharply
appreciation caused by strong value of Thai baht relative to core financial partners,
which make Thailand would lose financial asset prices competitiveness.
7.2 The empirical results of the relationship between real exchange rate and
capital flows.
The relationship between the real exchange rate, both measured by trade-
weighted and financial-weighted regime, and external sector indicators is estimated
by OLS method in the period ofQ1 2006 – Q4 2014. The explanatory variables of real
exchange rate consist of both international merchandise and capital flow variables.
For the first step, Augmented Dicky-fuller unit root testis applied to the level of all
variables. The test finds that REER, REFER and term of trade (TOT) are I(1),
meaning that these variables are non-stationary at level but become stationary in first-
difference form. Meanwhile, other explanatory variables, including current account to
GDP ratio (CA), foreign direct investment to GDP ratio (FDI), foreign portfolio
investment to GDP ratio (PORT) and foreign loans to GDP ratio (LOANS),
are stationary at level form or I(0). Moreover, this study considers the reverse
causality bias of the relationship between real exchange rate and capital flows.
However, according to Gyntelberg et al. (2012), the Thai baht movement was not a
driver of non-resident investors’ equity investment on stock exchange of Thailand
(SET). Thus, the OLS estimation could be an appropriate method. Moreover, the
model does not face the autocorrelation problem as reflected from Durbin-Watson
values which are close to 2. The estimation result of the relationship between REER
and private capital flows is shown in table 3.

26
Table 7.1: The REER and REFER determination model of private capital inflows
Estimation method: OLS
Determinant variables: DLOG(REER) DLOG(REFER)
C -0.006007
(-0.7845)
-0.043346
(-0.9923)
DLOG(TOT) 0.616653**
(2.5954)
-0.845284
(-0.5561)
CA -0.001059
(-1.2185)
0.003376
(0.8833)
FDI 0.001730**
(1.9176)
0.009295
(0.9082)
PORT 0.001350
(0.8420)
0.015049**
(2.6441)
PORT(-1) 0.004822***
(3.0207)
0.012122***
(3.9228)
LOAN -0.001126
(-1.0849)
-0.002361
(-0.3895)
LOAN(-1) 0.001276
(0.6544)
-0.010543**
(-2.1760)
R2 0.4202 0.4372
Adj. R2 0.2698 0.2913
Note: ***, ** and * denote level of significance at 1%, 5% and 10%, respectively.
Value in parenthesis is t-statistics.
The regression results show that REER adjustments were associated with
changes in term of trade (TOT), foreign direct investment (FDI)and lagged of foreign
portfolio investments (PORT(-1)). Term of trade is the main determinant of REER
movement with direct variation. An increase in export prices which relative to import
prices represents the better international trade competitiveness and encourage the
REER move to appreciation. An increase in term of trade by 1% leads to an
appreciation of the REER by 0.62%. Price competitiveness of goods is the important
factor of Thailand’s exports. The higher export prices lead to export revenue increase
that is income effects. On the contrary, higher export prices could destroy the price
competitiveness because of low-technology and low-value added goods and this
situation is called substitution effect. As the empirical result shows that better term of
trade benefits to Thai economy from larger income effects than substitution effect.

27
Private capital inflows in terms of FDI and lagged foreign portfolio
investment (PORT(-1)) significantly influence on current REER appreciation. Along
the time, FDI continued to flow into Thailand especially manufacturing sectors thanks
to the strong economic fundamental and supportive resources such as low wages.
Recently, FDI has remained flow not only into Thailand’s manufacturing sectors but
also financial service sectors as a result of financial market development and regional
integration from ASEAN Economics Community (AEC).Changes in foreign direct
investment (FDI) inflows suddenly contribute to the REER appreciation. An increase
in FDI to GDP ratio by 1% makes the REER appreciate by 0.002%. Impacts of FDI
on REER are smaller than TOT because FDI inflows are more stable. Add up with,
FDI inflows could be related to investment through imports of machinery and
equipments, and also FDI may improve local productivity through knowledge
transfers. Hence, the pressure on real exchange rate from FDI would be reduced.
Another determinant factor of REER is the lagged foreign portfolio
investment. Changes in lagged PORT significantly influence on current REER
movements. An increase of foreign portfolio investment to GDP ratio by 1% leads to
an appreciation of REER by only 0.004% in the next quarter. The capital inflows in
terms of portfolio investment area source of funding of listed companies that
encourage the REER appreciation. However, the lag of PORT has the lower effect on
REER appreciation due to the high capital mobility.
In the case of REFER, the OLS regression is employed to estimate as
same as the REER model. The result of the relationship between REFER and private
capital flows is also presented in table 3.
Since REFER is measured Thailand’s financial asset prices
competitiveness against financial partner countries, the capital flows related with
foreign portfolio investments (PORT) and foreign loans (LOAN) are the significant
determinant of REFER movements. The foreign portfolio investments, which are net
foreign purchases in financial assets, have highly impacts on REFER. An increase of
portfolio investment to GDP ratio by 1% suddenly influence the REFER appreciate by
0.015%. Add up with, 1% of lagged PORT cause the REFER appreciate by 0.012%.
28
When non-resident investors move their funds into Thailand’s financial markets,
which are generally traded in terms of Thai baht, the REFER would be appreciated.
On the other hand, net selling-off in Thai securities of foreign investors leads to
REFER depreciation due to lower demand for Thai baht. This result is in line with the
study of Gyntellberg et al. (2012) which empirically study about systematic links
between capital flows and exchange rate. They find that net capital flow into Thai
equity market has a positive correlation with Thai baht appreciation. Moreover, higher
dollar-denominated SET returns relative to S&P equity market returns contribute to
foreign investors’ sell-off in Thai equity. Therefore, the result of Gyntellberg et al.
supports the positive relationship between REFER and PORT that is found in this
study. It also confirms that the financial asset prices competitiveness would decline
when REFER is appreciated from non-resident investors’ portfolio rebalancing.
Lagged foreign loan (LOAN(-1)) is another significant REFER
determinant with negative correlation. Because the foreign loan is a source of funding
for Thai businesses, the net foreign loan inflows can occur when Thai businesses
perform badly and need the extra working capital. Subsequently, Thai financial asset
values would decrease and REFER would be lower. Additionally, international loans
are used to be foreign asset-liabilities position management of commercial bank under
the central banks’ regulations to limit their foreign exchange exposure. Exporters,
importers and investors would hedge their foreign exchange rate risks through the
financial derivative products such as forwards, swaps and options with commercial
banks. Based on the regulation, commercial banks are limited their foreign exchange
position, and then they must manage their foreign assets and liabilities in accordance
with the customer transactions. The foreign loan repayments of commercial banks
would occur when the Thai investors invest less in foreign securities and allocate their
portfolio more into Thai securities. The net foreign loan repayments improve the
value of Thai securities by portfolio rebalancing of Thai investors, thus REFER is
higher in the same time with loan outflows. However, the variables related to
international merchandise, including TOT and CA, and FDI have no impact on
REFER adjustments.

29
The result from REER determination model is quite different from
REFER. These results confirm the hypothesis that the trade-weighted exchange rate
index, REER, and financial-weighted exchange rate index, REFER, are heterogeneity.
The REFER is another real effective exchange rate index that helps to capture the
impact of international financial fund flow through the exchange rate channel in
financial markets.

30
CHAPTER 8
CONCLUSIONS AND IMPLICATIONS
Real exchange rate indexes are constructed for many purposes; (1) to
measure country’s international competitiveness (2) to access the financial conditions
indexes and (3) to be an indicator of monetary policy transmission and financial
stability. Therefore, real exchange rate indexes are important for policy makers and
market participants. Although the REER index is widely used to measure the
country’s international competitiveness and monitor exchange rate stability, it only
concentrates on international merchandise transactions which ignore the international
relationships in terms of financial transactions. As a result, REFER index is proposed
to explain the impact of exchange rate movements on international balance sheet
through valuation channel.
This paper introduces the real effective financial exchange rate (REFER)
which measure the country’s financial asset price competitiveness in the case of
Thailand. The REFER is generated based on the standard portfolio balance approach.
The comparison between REER, which is traditional real exchange rate index, and
REFER movements shows that they are heterogeneity. Thailand’s financial-weight
real exchange rate, REFER, is more volatile than REER because of the flexibility of
financial asset price differential among the financial partners. In the case of Thailand,
REFER was largely appreciated before the global financial crisis (GFC) in 2008.
Although REFER suddenly depreciated due to the global turmoil in the GFC period,
REFER turned to improve quickly since the second half of 2009. Since January 2014,
the steep REFER movement has shown stronger Thai baht than other financial partner
countries which could be a cause of loss in financial asset prices competitiveness.
This paper also investigates the relationship between real exchange rate,
both REER and REFER, and the ratio of capital flows to GDP. The estimation results
show the different impact size of capital flows on REER and REFER. The REER
appreciation due to term of trade improvement is statistically higher than capital
inflows. Moreover, FDI inflows have a positive relationship with REER appreciation,
influencing more than portfolio investment inflows. Meanwhile, the foreign loan also
has impacts on the REFER movement in opposite direction. In the case of REFER,

31
the portfolio investment and foreign loans are the main contribution of REFER
appreciation. Meanwhile, the variables related to international merchandise, including
TOT and CA, and FDI have no impact on REFER adjustments.
In the case of Thailand, this research finds that the REER and REFER
indexes are heterogeneity due to discrepancy of theoretical concepts. The REFER
movements are more sensitive to financial asset return changes because of wealth
effects. Because of international investment expansion, the REER index is not enough
to indicate the impacts of exchange rate movements to economy. The policy makers,
who monitor the external stability through exchange rate channel, should also concern
the financial impacts. Therefore, both of real exchange rate indexes, REER and
REFER, should be used together as a measure of country’s competitiveness, an
intermediate target for monetary policy or exchange rate intervention.

32
REFERENCES
1. Ananchotikul and Sitthikul, 2008, Capital flows in Thailand: Trends,
Determinants, and Implications for Central Bank Policies, Bank of Thailand
Discussion Paper, April, 3-41.
2. Arteta, C., Eichengreen, B. and Wyplosz, C., 2003, When Does Capital
Account Liberalization Help More than it Hurts?, Economic Policy in the
International Economy,177–206.
3. Bakardzhieva, Ben Naceur, and Kamar, 2010, The Impact of Capital and
Foreign Exchange Flows on the Competitiveness of Developing Countries, IMF
Working Paper, WP 06/266.
4. Balakrishnan, Nowak, Panth and Wu, 2012, Surging Capital Flows to
Emerging Asia: Facts, Impacts, and Responses, IMF Working Paper, WP 12/130.
5. Bonizzi, 2013, Capital Flows to Emerging Markets: An alternative Theoretical
Framework, SOAS Department of Economics Working Paper Series, No. 186, The
School of Oriental and African Studies.
6. Chai-Anant and Ho, 2008, Understanding Asian Equity Flows, Market
Returns and Exchange Rates, Bank for International Settlements, Paper No. 245.
7. Devereux and Saito, 2006, A Portfolio Theory of International Capital Flows,
IIIS Discussion Paper, No.124.
8. Gelman, Jochem, Reitz and taylor, 2013, Real Financial Market Exchange
Rates and Capital Flows, QBER Discussion Paper, No.3.
9. Gyntelberg, Loretan, and Subhanij (2012), “Private Information, Capital
Flows, and Exchange Rates,” IMF Working Paper WP/12/213.
10. Husted and Melvin, 2010, Exchange rate theories, International Economics,
451-468.
11. Jongwanich, 2010, Capital Flows and Real Exchange Rates in Emerging Asian
Countries, ADB Economic Working Paper Series, No.210.
12. Kubelec, C., and F. Sa, 2012, The Geographical Composition of National
External Balance Sheets: 1980–2005, International Journal of Central Banking 8:
143–189.

33
13. Lane and Milesi-Ferretti, 2007, The external wealth of nations mark II:
Revised and extended estimates of foreign assets and liabilities 1997-2004, Journal of
International Economics, 73.
14. Lane and Shaugh, 2010, Financial exchange rates and International Currency
Exposures, American Economic Review, 100(1).
15. Louis Combes, Kinda, and Plane, 2011, Capital Flows, Exchange Rate
Flexibility, and the Real Exchange Rate, IMF Working paper, WP/11/9.
16. Zanello, Alessandro, and Dominique Desruelle, 1997, A Primer on the IMF’s
Information Notice System, IMF Working paper, WP97/71.
34
BIOGRAPHY
Name Ms.Thipsuda Sukdam
Date of Birth July 2, 1987
Educational Attainment
2014: Master in Finance (MIF) Program,
Thammasart University
2010: Bachelor of Art (Economics) with first class
honours, Thammasart University
Work Position Senior Economist
Bank of Thailand
Work Experiences 2010-2013: Economist
Bank of Thailand