Embed Size (px)
Citation preview
1
THE RELATIONSHIP BETWEEN QUALITY AND LOYALTY IN MULTI-CHANNEL E-SERVICES: AN EMPIRICAL INVESTIGATION
Rui Sousa
Catholic University of Portugal (Porto), [email protected]
Abstract
Research in traditional (bricks-and-mortar) services has broadly supported the link between service
quality and customer loyalty. Given the significance of customer loyalty for the profitability of e-
services, it is important to ascertain whether the established role of service quality as a driver of
loyalty in traditional services translates to e-service settings. An important feature which
differentiates e-services from traditional services is the fact that e-services are typically offered as
part of a broader multi-channel service package, combining the internet with other channels of
service delivery, such as the phone and physical facilities. As a result, customers frequently engage
in multi-channel behavior, using both online and traditional channels, and thus will exhibit different
degrees of focus on the internet channel relative to other traditional channels. We argue that existing
research examining the quality-loyalty relationship in e-services has not adequately recognized the
multi-channel nature of these services. As such, the objective of this study is to increase our
understanding of the relationship between quality and loyalty in multi-channel e-service settings. In
this connection, we empirically test the quality-loyalty relationship in a multi-channel e-service; and
examine whether a customer’s degree of focus on the internet (DFI) channel moderates this
relationship.
The study consisted of an online survey of customers registered with a commercial e-banking
service which is part of a broader multi-channel service. Employing structural equation modelling,
we found a strong and significant link between e-service (web site) quality and loyalty intentions,
suggesting that this relationship also holds in e-services. In addition, we found that a customer’s
DFI – defined as the proportion of the total number of transactions that were performed by a
customer through the internet channel relative to the other available channels - moderated this
relationship. Specifically, we found that the relationship between e-service quality and loyalty was
weaker for customers with a higher DFI. The implications for the research and management of
multi-channel e-services are discussed.
Keywords: E-Services, Quality, Loyalty, Internet.

2
Introduction
There has been substantial research examining the links between service quality and customer
loyalty in traditional services, that is, bricks-and-mortar services primarily provided by people (e.g.,
Boulding et al, 1993; Cronin and Taylor, 1992; Cronin et al., 2000; Zeithaml et al, 1996). In
general, this research has validated service quality as a lever that managers of service operations can
employ to drive customer loyalty and, ultimately, profitability.
In recent years, we have witnessed a strong growth of e-services. We define e-services as services
produced by customers by interacting with a web site, excluding any interactions with service
employees (Sousa and Voss, 2006; Fassnacht and Koese, 2006). Customer loyalty is a key issue for
the profitability of e-services (Reichheld and Schefter, 2000) and a number of researchers have
identified the need to better understand how to retain customers in e-services (e.g., Bolton et al,
2004; Reichheld and Schefter, 2000; Zeithaml et al, 2002).
Given the key role of service quality as a driver of loyalty in traditional services, it is important to
understand whether this role translates to e-service settings. Two important features differentiate e-
services from traditional services. First, the nature of service encounters in e-services, notably the
absence of human contact, is very different from traditional services (Bitner et al, 2000; Olson and
Boyer, 2005). Some authors have questioned whether in the absence of human contact the relational
aspects of the exchange over the internet may continue to drive customer loyalty (Parasuraman and
Grewal, 2000; Yen and Gwinner, 2003).
Second, e-services are typically offered as part of a broader multi-channel service package,
combining the internet with other channels of service delivery, such as the phone and physical
facilities (Sousa and Voss, 2006). This situation results from the realization that companies that
complement internet-based channels with traditional channels tend to be more successful than
single-channel companies (e.g., Gulati and Garino 2000; Vishwanath and Mulvin 2001). As a
consequence, customers of such e-services will frequently engage in multi-channel behavior, using
both online and traditional channels, and thus will exhibit different degrees of focus on the internet
channel relative to other traditional channels.
E-service quality and its impact must be considered in this context. We argue that existing research
examining the quality-loyalty relationship in e-services has not adequately recognized the multi-
channel nature of these services. For example, such research has typically made a binary distinction
3
between online and offline customers. In reality, customers frequently engage in multi-channel
behavior and they are more adequately characterized as being positioned along a continuum of the
degree of focus on the internet channel relative to traditional channels. In such a context, it is
important to examine whether the quality-loyalty relationship differs between more traditional
customers (less focus on the internet channel and stronger reliance on traditional channels) and web-
oriented customers. The existence of differences would mean that the importance of e-service
quality as a driver of loyalty would vary across different types of customers and this would have
implications for devising loyalty strategies for multi-channel e-services.
The objective of this study is to increase our understanding of the relationship between quality and
loyalty in multi-channel e-services. In this connection, we empirically test the quality-loyalty
relationship in a multi-channel information-based e-service (e-banking); and examine whether a
customer’s degree of focus on the internet channel moderates this relationship.
The structure of the paper is as follows. First, we review the literature in traditional services and e-
services and develop research hypotheses related to the study’s research objectives. Second, we
describe the employed methodology, an online survey study of customers of a multi-channel e-
banking service. Third, we present the data analysis and results. Finally, we discuss the results,
identify limitations and avenues for future research and summarize the study’s main contributions.
Literature Review and Research Hypotheses
In developing the research hypotheses, our default stance has been to apply theory from traditional
services to e-service settings. There has been a lot of research examining the links between service
quality and customer loyalty behavior in traditional service operations. Zeithaml (2000) provides an
excellent review of the numerous academic studies which have provided evidence of this
association. Effects of service quality include loyalty behaviors such as willingness to recommend
the company (e.g., Zeithaml et al, 1996) and purchase intentions (e.g., Boulding et al, 1993; Cronin
and Taylor, 1992).
Underlying such research is the notion that loyalty behaviors are influenced by customer
perceptions of service quality (or experience). Such perceptions have been conceptualized around
the SERVQUAL dimensions, which mainly apply to face-to-face service provided by a firm’s
employees (Parasuraman et al, 1985, 1988). Taking the stance that theory from traditional services
will find replication in e-services, one would expect that the relationship would hold in e-services if
4
SERVQUAL is replaced by an adequate instrument for measuring quality perceptions in e-service
settings. In e-services, e-service quality equates to web site quality (Sousa and Voss, 2006),
including dimensions such as information quality, ease of use, privacy/security, graphic style and
fulfillment (Zeithaml et al, 2002). Therefore, we put forward the following hypothesis:
H1. Perceptions of e-service quality are positively related to e-service loyalty behavior.
An important difference between e-service settings and traditional services which has a relevant
bearing on the quality-loyalty relationship is the nature of the service encounter. In particular, some
authors have questioned whether, in the absence of human contact, the relational aspects of the
exchange over the internet may continue to drive customer loyalty (Parasuraman and Grewal, 2000;
Yen and Gwinner, 2003). It is largely an empirical question whether this difference will affect the
verification of the proposed hypothesis.
Several studies have empirically examined the quality-loyalty relationship in e-services. Overall,
they lend support for H1, and fall in two categories. The first comprises studies developing
instruments for measuring e-service quality. These assert the nomological validity of the developed
scales by finding an association between e-service quality (as measured by the scales in question)
and loyalty intentions, based on data from surveys. Examples include surveys of students (Loiacono
et al, 2001; Yoo and Donthu, 2001, Janda et al, 2002; Lee and Lin, 2005; Collier and Bienstock,
2006), a survey of consumers from an online panel (Wolfinbarger and Gilly, 2003) and a survey of
users with shopping experience at two online stores (Parasuraman et al, 2005).
The second category includes detailed surveys of actual customers of existing e-service businesses.
Olson and Boyer (2005) found that a measure of web site functionality in internet ticketing was
positively associated with a measure of e-loyalty. Boyer and Hult (2005a, 2005b) found that
measures of web site quality related to ease of use were positively associated with loyalty behavior
in the online grocery industry. In this same industry, Heim and Sinha (2001) also found evidence of
a relationship between e-service quality dimensions (web site navigation and information quality)
and loyalty intentions. Harris and Goode (2004) found an indirect relationship (through satisfaction)
between an overall service quality construct and several loyalty dimensions in the online book
sector.
5
Few of these studies have had the examination of the quality-loyalty relationship as their main
objective, a view that is shared with other researchers (e.g., Fassnacht and Koese, 2006).
Accordingly, they exhibit some limitations for the purpose of rigorously examining this
relationship. The first type of studies tend to draw on convenience samples (mainly students), rather
than samples taken from the actual customer base of a service provider. This may reduce the
external validity of the results (Fassnacht and Koese, 2006). The second type of studies have not
employed full-fledged scales for measuring e-service quality. Some of the employed scales leave
out several important dimensions of web site quality, such as the security and reliability of the web
site (Olson and Boyer, 2005; Boyer and Hult, 2005a, 2005b; Heim and Sinha, 2001), while others
mix both online and offline features (Harris and Goode, 2004). In addition, both types of studies
have largely focused on a limited set of e-service settings, namely, online shopping e-services
involving physical products. In these contexts, important features besides the web site, notably, the
logistics of the product delivery, have a strong impact on loyalty. Hence, it may be argued that these
settings may not be ideal for testing the relationship between e-service (web site) quality and
loyalty.
Therefore, we submit that, although the overall evidence lends support for H1, further testing of this
relationship is required. Our study attempts to fill this gap by: i) employing a more complete set of
web site quality dimensions; ii) examining registered customers in the context of an actual
commercial e-service, arguably, a type of setting for which service quality matters the most, as
customers naturally expect to receive high service quality (Fassnacht and Koese, 2006); iii)
examining a service sector – e-banking – which is not associated with online shopping and may be
seen as a representative of a pure (information-based) e-service setting, in which the web site plays
a major role in service provision.
Moderating effect of the Degree of Focus on the Internet Channel
Research in the quality-loyalty relationship in traditional services has moved beyond its original
focus on testing the direct relationship to a deeper understanding of factors moderating this
relationship. Such research has found that customer segments vary in respect to how their loyalty
intentions change in response to changes in perceived service quality (e.g., Garbarino and Johnson,
1999; Mittal and Kamakura, 2000). In this study we answer calls to do the same in an e-service
context (Anderson and Mittal, 2000) by examining the moderating effect of a customer’s Degree of
Focus on the Internet channel (DFI), relative to other channels. The variable DFI may be seen as
representing the relative attractiveness to a customer of the internet channel compared with
6
competing channels. This attractiveness may in turn be dictated by convenience, price, etc.,
provided by the channel (Tse and Yim, 2001).
Based on the general existence of moderating effects in traditional services, we test the following
hypothesis:
H2. A customer’s DFI moderates the relationship between quality and loyalty in e-services.
Our interest in DFI as a moderating variable is in recognition of the multi-channel nature of most e-
services and aims at providing a better understanding of the quality-loyalty relationship in such
settings. Specifically, examining H2 provides insights on what changes in the quality-loyalty
relationship between more traditional customers (less focus on the internet channel and stronger
reliance on traditional channels) and web-oriented customers.
We are not aware of research addressing the moderating effects of DFI. However, some studies
have investigated differences between customers of traditional services and online services.
Generally, they have found that customers of online services are different from customers of
traditional bricks-and-mortar services and that they have differentiated needs (e.g., Iqbal et al, 2003;
Muthitacharoen et al, 2006). This suggests that DFI may be a relevant moderating variable between
quality and loyalty in e-service settings. However, such research has had two limitations. First, it
has typically compared customers who shop online to those who don’t, ignoring the fact that in e-
services customers frequently engage in multi-channel behavior, using both online and traditional
channels. Second, it has treated online customers as homogeneous, while other research has shown
that even within online customers there may be high levels of heterogeneity (Boyer and Frohlich,
2006). Our study attempts to address these shortcomings by characterizing customers by a
continuous DFI variable in the context of a multi-channel service, avoiding the use of a simple
dichotomy of online vs. offline users.
Methodology
The study consisted in the administration of an online questionnaire to a sample of the customers of
a major retail e-banking service, which was part of a broader multi-channel banking service. Our
single-industry focus is in keeping with similar industry-specific research in e-services (e.g., Boyer
and Hult 2005; Verma et al, 2004). E-banking was chosen for several reasons. First, it is a mature
and one of the most widespread types of e-services, with high adoption levels among both service
7
providers (e.g., the majority of banks now offer such a service) and users (according to Forrester
Research, it is predicted that 35% of US households with internet connections will bank through the
web by 2008). Second, it is an almost ideal representative of a multi-channel service setting in
which customers can receive service via several channels in complement to the internet. Third, it is
a pure service, a context which, as mentioned in the literature review, has not received much
attention by research on the quality-loyalty relationship. Fourth, in e-banking the web site plays a
major role in service provision. Finally, the range of services offered at e-banking sites tends to be
similar across different service providers and countries, enhancing the generalizability of our
findings.
The chosen service, located in Portugal, had about 600,000 customers at the time of the study and is
considered a “best practice” service, being ISO9001 certified and having won, among other awards,
the “Best Consumer Internet Bank 2003” award by the Global Finance magazine. The study was
based on triangulation of data collected from multiple sources in this e-service setting. The next
sections discuss the measurement of the research variables and data collection.
Measurement
The study’s main research variables are e-service quality, loyalty and DFI. The measures are
presented in Appendix 1 and are explained next.
E-service quality
In e-services, service quality equates to web site quality (Sousa and Voss, 2006). Several
instruments have been developed with the reported objective of assessing the quality of web sites
(e.g., Collier and Bienstock, 2006; Fassnacht and Koese, 2006; Loiacono et al., 2001; Parasuraman
et al, 2005; Wolfinbarger and Gilly, 2003; Yoo and Donthu, 2001). There is significant variation in
the number and meaning of the quality dimensions proposed by these studies and a widely accepted
scale is yet to emerge. However, there is substantial commonality among studies as to the overall
content of the proposed dimensions, which generally match the five broad criteria that Zeithaml et
al’s (2002) comprehensive review of the e-service quality literature has proposed: i) information
availability and content (information quality); ii) ease of use; iii) privacy/security; iv) graphic style;
and v) fulfillment. Therefore, our starting point was an aggregate web site quality construct made
up of these five dimensions.
As such, we compiled a list of items from existing instruments that would capture these dimensions.
Using this base list of items, we held several iterative focus group discussions with managers from
8
the bank’s quality and marketing departments with the objective of choosing one item to adequately
represent each of the main quality dimensions in the context of an e-banking service. The procedure
of selecting items from a broader set and associate them with hypothesized dimensions is a standard
procedure for developing measures (Churchill, 1979) and has been generally used in quality
management research (e.g., Samson and Terziovski, 1999). Our choice of selecting only one item
per dimension ensured that we arrived at a parsimonious set of items, a key requirement to ensure
appropriate response behavior in online questionnaires (Drolet and Morrison, 2001; Fram and
Grady, 1995).
During these discussions, it was considered important to break the fulfillment dimension into two
separate dimensions - reliability and responsiveness – because deficiencies in these two areas
require corrective actions of different nature. For example, responsiveness problems may require an
improvement in the processing capacity of back office systems, while reliability problems may
indicate the need to revise back office processing procedures. Thus, we considered six main
dimensions of web site quality in total, namely information quality, ease of use, privacy/security,
graphic style, reliability and responsiveness.
During this process, the wording of the items was also adapted to an e-banking context, a
recommended method in empirical research (e.g., Boyer and Pagell, 2000), which has been
performed extensively to study service quality (e.g., Kettinger and Lee, 1994). The result of this
process is presented in Appendix 1 which shows the six dimensions of web site quality, their
general descriptions, and the items that were chosen to measure them (Q1-Q6).
Customer loyalty
Several studies have conceptualized the customer loyalty construct (e.g., Zeithaml et al, 1996; Dick
and Basu, 1994; Oliver, 1999; Reichheld and Schefter, 2000; Parasuraman and Grewal, 2000).
Consistent with this research, we measured loyalty towards an e-service (web site) by two items
related to behavioural intentions: L1) The intention to re-use the e-service (web site); and L2) Word
of mouth recommendation. Such a scale has been commonly used in service quality research (e.g.,
Boulding et al, 1993).
Degree of focus on the internet (DFI)
The DFI variable was measured by the proportion of the total number of transactions that were
performed by a customer through the internet channel relative to the other available channels
(physical counter, phone and ATM) during the month immediately after the questionnaire was
removed from the web site.
9
Data collection
The data for the DFI variable were extracted from the bank’s customer database and the bank’s IT
systems, which record all the transactions of a customer with the bank across the different available
channels. This was performed by the bank’s staff according to the researchers’ instructions.
The data for the other variables were collected via the administration of an online questionnaire to a
sample of the service’s customers. In this process, we drew on the overall customer database to
exclusively target customers fulfilling the following criteria: active customers (customers having
made at least two logins to the service in the previous three months), age over 18 years old,
excluding bank employees. This screening resulted in a pool of 51,125 eligible customers. The
actual target sample for our study consisted of a subset of 70% of this pool, generated through
random extraction from the pool. This resulted in a final target sample of 35,781 customers.
The questionnaire was posted on the e-banking service web site, right past the login stage. After the
targeted customers logged in, they were asked whether they would like to fill in the questionnaire,
in which case they were directed to the respective web page. The questionnaire software application
kept track of the identification of all targeted customers, recorded respondents and non-respondents
and, for the respondents, recorded their actual responses to the questionnaire. The software also
ensured that customers who declined to fill in the questionnaire as well as those who did fill in the
questionnaire were not asked again. The questionnaire was active on the site for one month,
resulting in 5,942 valid responses, yielding a 16.6% response rate. The testing of hypothesis H2
required the overall sample to be split into two subgroups based on the median of the DFI variable,
at 54.55%: High DFI customers and Low DFI customers (see data analysis section). The final
sample and the two subgroups are characterized in Table 1. The table shows that the predominant
demographic profile in the sample was that of a male, young and educated customer. This pattern is
in line with the patterns observed for general internet users in the European Union and the US, as
well as for e-banking users (e.g., Eurostat, 2003; SIBIS, 2003). The table also shows that the two
subgroups have similar demographic profiles, but that they exhibit high heterogeneity in terms of
DFI (average levels of 75.1% and 33.0%). We conducted a non-respondent bias analysis employing
t-tests to compare the profiles of respondents and non-respondents in terms of age, gender,
education level and DFI. The analysis showed no significant differences, indicating the absence of
non-respondent bias.

10
Table 1. Characterization of the final sample (n=5,942).
Variable Total Sample n=5942
High DFI n=2971
Low DFI n=2971
Degree of Focus on the Internet (DFI) 54.0 % 75.1 % 33.0 %
Age
[18-25[
9.4 %
7.9 %
10.9 % [25-35[ 44.8 % 46.1 % 43.5 % [35-45[ 22.1 % 21.7 % 22.5 % [45-55[ 14.2 % 14.5 % 13.9 % 55+ 9.5 % 9.8% 9.2 %
Gender Male Female
72.0 %
28.0 %
74.0 %
26.0 %
70.0 %
30.0 %
Education Primary education Secondary education Higher Education (Bachelor’s degree and above)
3.4 % 37.9 % 58.7 %
3.4 % 36.8 % 59.8 %
3.4 % 38.9 % 57.7 %
Analysis and results
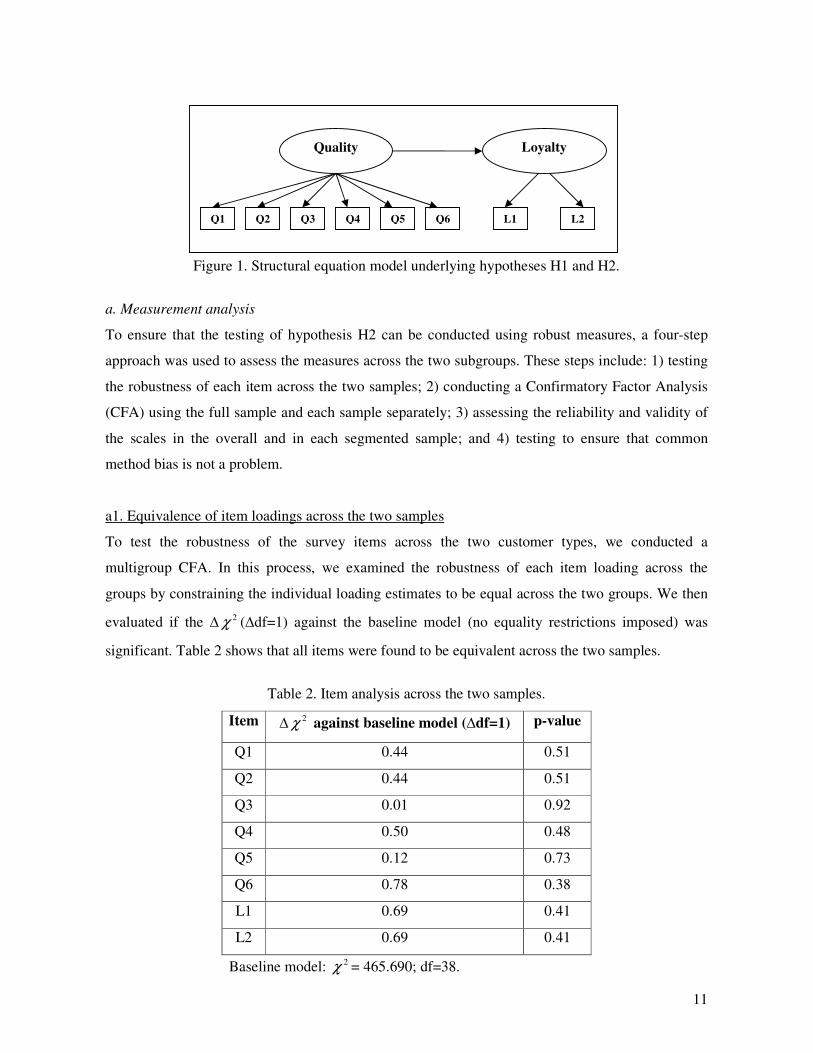
The analysis employed Structural Equation Modeling (SEM) to test the model depicted in Figure 1,
which underlies hypotheses H1 and H2. Normality plots did not show strong deviation from
normality. Due to the large sample size, even severe non-normality would have negligible effects
on the interpretation of SEM analyses (Lei and Lomax, 2005). Missing data was handled via the
EM method (Little and Rubin, 1987). All the analyses were performed with the SPSS-Amos 6.0
software, employing Maximum Likelihood Estimation. We followed Anderson and Gerbing’s
(1982, 1988) two-step paradigm on testing models in which the measurement model is tested first,
followed by the testing of the structural model. In order to test the moderating effect of DFI which
underlies hypothesis H2 we employed multiple group analysis (Ping, 1996). This required the
overall sample to be split into two subgroups based on the median of the DFI variable at 54.55%:
High DFI customers and Low DFI customers.
11
Figure 1. Structural equation model underlying hypotheses H1 and H2.
a. Measurement analysis
To ensure that the testing of hypothesis H2 can be conducted using robust measures, a four-step
approach was used to assess the measures across the two subgroups. These steps include: 1) testing
the robustness of each item across the two samples; 2) conducting a Confirmatory Factor Analysis
(CFA) using the full sample and each sample separately; 3) assessing the reliability and validity of
the scales in the overall and in each segmented sample; and 4) testing to ensure that common
method bias is not a problem.
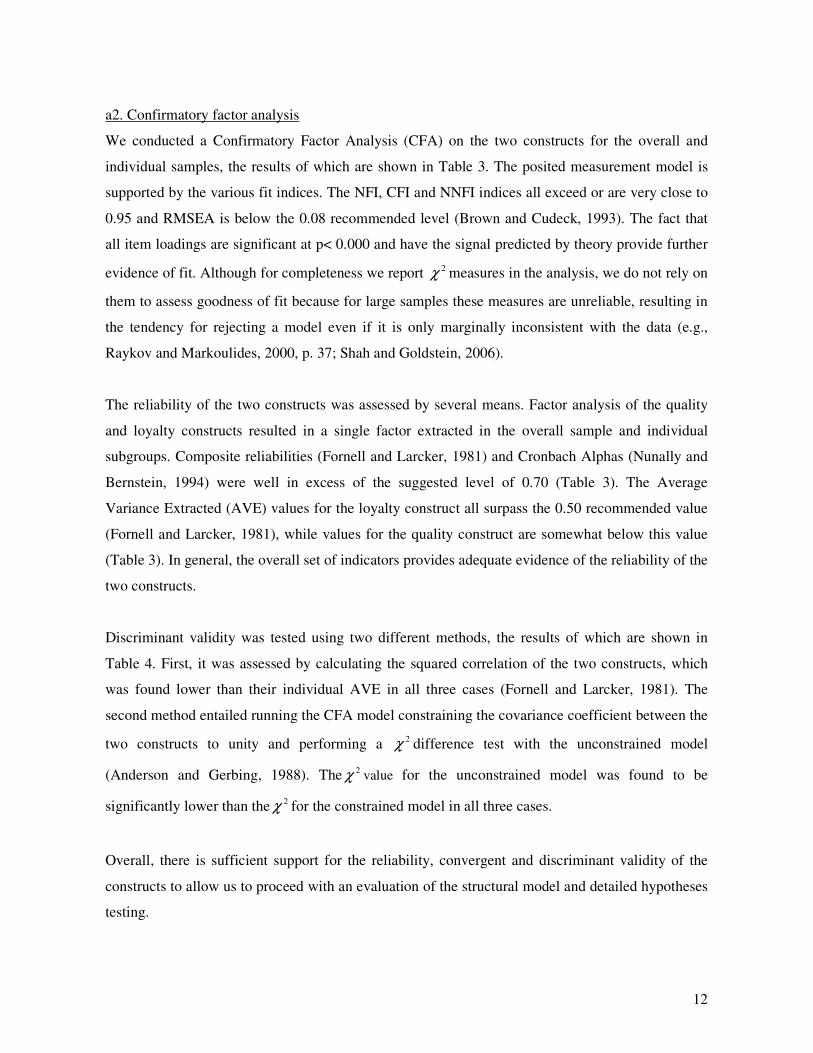
a1. Equivalence of item loadings across the two samples
To test the robustness of the survey items across the two customer types, we conducted a
multigroup CFA. In this process, we examined the robustness of each item loading across the
groups by constraining the individual loading estimates to be equal across the two groups. We then
evaluated if the � 2χ (�df=1) against the baseline model (no equality restrictions imposed) was
significant. Table 2 shows that all items were found to be equivalent across the two samples.
Table 2. Item analysis across the two samples.
Item �2χ against baseline model (�df=1) p-value
Q1 0.44 0.51
Q2 0.44 0.51
Q3 0.01 0.92
Q4 0.50 0.48
Q5 0.12 0.73
Q6 0.78 0.38
L1 0.69 0.41
L2 0.69 0.41
Baseline model: 2χ = 465.690; df=38.
Loyalty Quality
Q2 Q3 Q4 Q5 Q6 L1 L2 Q1
12
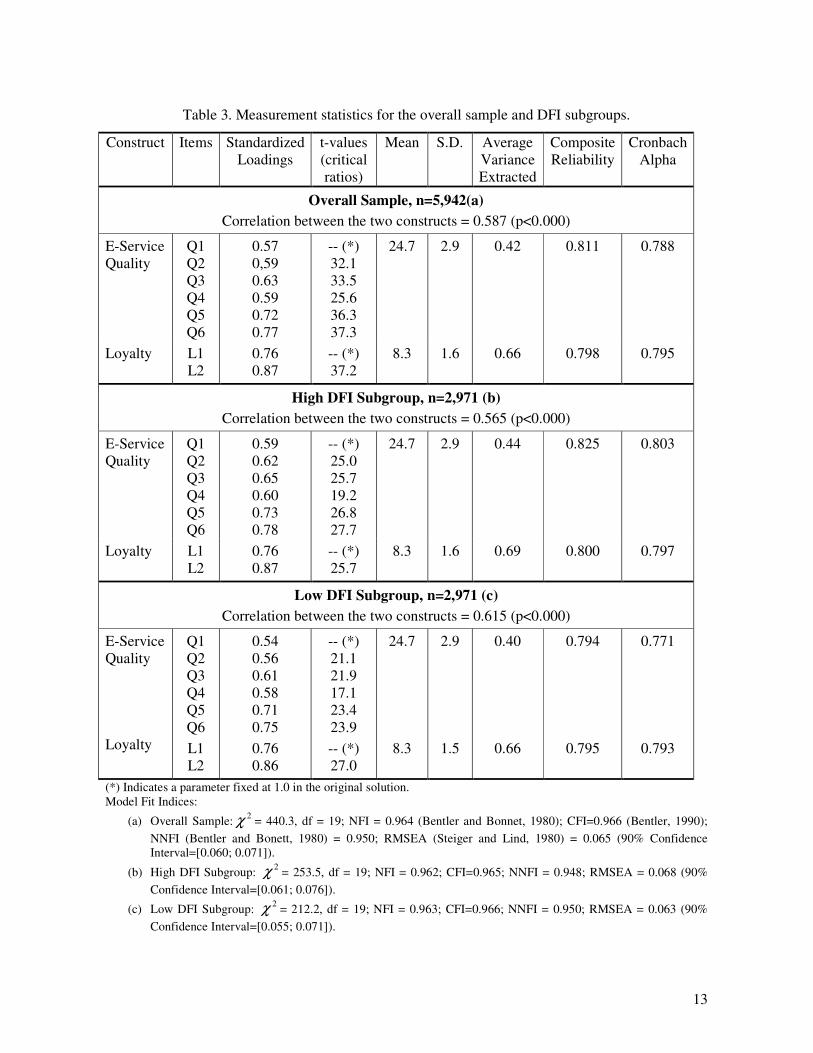
a2. Confirmatory factor analysis
We conducted a Confirmatory Factor Analysis (CFA) on the two constructs for the overall and
individual samples, the results of which are shown in Table 3. The posited measurement model is
supported by the various fit indices. The NFI, CFI and NNFI indices all exceed or are very close to
0.95 and RMSEA is below the 0.08 recommended level (Brown and Cudeck, 1993). The fact that
all item loadings are significant at p< 0.000 and have the signal predicted by theory provide further
evidence of fit. Although for completeness we report 2χ measures in the analysis, we do not rely on
them to assess goodness of fit because for large samples these measures are unreliable, resulting in
the tendency for rejecting a model even if it is only marginally inconsistent with the data (e.g.,
Raykov and Markoulides, 2000, p. 37; Shah and Goldstein, 2006).
The reliability of the two constructs was assessed by several means. Factor analysis of the quality
and loyalty constructs resulted in a single factor extracted in the overall sample and individual
subgroups. Composite reliabilities (Fornell and Larcker, 1981) and Cronbach Alphas (Nunally and
Bernstein, 1994) were well in excess of the suggested level of 0.70 (Table 3). The Average
Variance Extracted (AVE) values for the loyalty construct all surpass the 0.50 recommended value
(Fornell and Larcker, 1981), while values for the quality construct are somewhat below this value
(Table 3). In general, the overall set of indicators provides adequate evidence of the reliability of the
two constructs.
Discriminant validity was tested using two different methods, the results of which are shown in
Table 4. First, it was assessed by calculating the squared correlation of the two constructs, which
was found lower than their individual AVE in all three cases (Fornell and Larcker, 1981). The
second method entailed running the CFA model constraining the covariance coefficient between the
two constructs to unity and performing a 2χ difference test with the unconstrained model
(Anderson and Gerbing, 1988). The 2χ value for the unconstrained model was found to be
significantly lower than the 2χ for the constrained model in all three cases.
Overall, there is sufficient support for the reliability, convergent and discriminant validity of the
constructs to allow us to proceed with an evaluation of the structural model and detailed hypotheses
testing.
13
Table 3. Measurement statistics for the overall sample and DFI subgroups.
Construct Items Standardized Loadings
t-values (critical ratios)
Mean S.D. Average Variance Extracted
Composite Reliability
Cronbach Alpha
Overall Sample, n=5,942(a) Correlation between the two constructs = 0.587 (p<0.000)
E-Service Quality
Q1 Q2 Q3 Q4 Q5 Q6
0.57 0,59 0.63 0.59 0.72 0.77
-- (*) 32.1 33.5 25.6 36.3 37.3
24.7 2.9 0.42 0.811 0.788
Loyalty L1 L2
0.76 0.87
-- (*) 37.2
8.3 1.6 0.66 0.798 0.795
High DFI Subgroup, n=2,971 (b) Correlation between the two constructs = 0.565 (p<0.000)
E-Service Quality
Q1 Q2 Q3 Q4 Q5 Q6
0.59 0.62 0.65 0.60 0.73 0.78
-- (*) 25.0 25.7 19.2 26.8 27.7
24.7 2.9 0.44 0.825 0.803
Loyalty L1 L2
0.76 0.87
-- (*) 25.7
8.3 1.6 0.69 0.800 0.797
Low DFI Subgroup, n=2,971 (c) Correlation between the two constructs = 0.615 (p<0.000)
E-Service Quality
Q1 Q2 Q3 Q4 Q5 Q6
0.54 0.56 0.61 0.58 0.71 0.75
-- (*) 21.1 21.9 17.1 23.4 23.9
24.7 2.9 0.40 0.794 0.771
Loyalty L1 L2
0.76 0.86
-- (*) 27.0
8.3 1.5 0.66 0.795 0.793
(*) Indicates a parameter fixed at 1.0 in the original solution. Model Fit Indices:
(a) Overall Sample: 2χ = 440.3, df = 19; NFI = 0.964 (Bentler and Bonnet, 1980); CFI=0.966 (Bentler, 1990); NNFI (Bentler and Bonett, 1980) = 0.950; RMSEA (Steiger and Lind, 1980) = 0.065 (90% Confidence Interval=[0.060; 0.071]).
(b) High DFI Subgroup: 2χ = 253.5, df = 19; NFI = 0.962; CFI=0.965; NNFI = 0.948; RMSEA = 0.068 (90% Confidence Interval=[0.061; 0.076]).
(c) Low DFI Subgroup: 2χ = 212.2, df = 19; NFI = 0.963; CFI=0.966; NNFI = 0.950; RMSEA = 0.063 (90% Confidence Interval=[0.055; 0.071]).

14
Table 4. Assessment of discriminant validity.
Method 1: Comparison of the squared correlation of the two constructs and their individual Average Variance Extracted (AVE).
Overall Sample High DFI Subgroup Low DFI Subgroup
Sq. correlation 0.34 0.32 0.38
AVE Quality 0.42 0.44 0.40
AVE Loyalty 0.66 0.69 0.66
Method 2: Running the CFA model constraining the covariance coefficient between the two constructs to unity and performing a 2χ difference test with the unconstrained model.
Overall Sample High DFI Subgroup Low DFI Subgroup
2χ unconstrained model 440.3 253.5 212.2
2χ constrained model 3437.6 1746.2 1716.2
�2χ , �(df) = 1 2997.3 1492.7 1504.0
p-value p< 0.000 p< 0.000 p< 0.000
a3. Testing for potential common method bias
A Harman single factor test was conducted to check for common method variance (McFarlin and
Sweeney, 1992). The rationale for this test is that if common method bias poses a serious threat to
the analysis and interpretation of the data, a single latent factor would account for all manifest
variables (Podsakoff and Organ, 1986). For the overall sample, the one-factor model yielded a 2χ =
2213.2 (df=20), compared with the 2χ = 440.3 (df=19) for the measurement model. Thus, the fit is
considerably worse (p<0.000) for the uni-dimensional model than for the measurement model.
Corresponding results were found for the High DFI subgroup ( 2χ one-factor = 1220.1,
2χ measurement model = 253.5) and the Low DFI subgroup ( 2χ one-factor = 1004.1, 2χ measurement
model = 212.2). Collectively, these results indicate that common method variance does not pose a
threat.
b. Structural model analysis
In order to test hypothesis H1 we estimated the SEM model shown in Figure 1. This model is
similar to the CFA model addressed earlier, except that the correlation between the two constructs is
replaced by a unidirectional path from Quality to Loyalty. Because of this similarity, all the data in
Table 3 pertaining to the overall sample also applies to the structural model, which therefore
15
exhibits good levels of fit. The standardized regression weight between the two constructs has a
value of 0.587, significant at p<0.000. Thus, there is strong support for hypothesis H1.
In order to test hypothesis H2 we employed multiple group analysis. The work of Koufteros and
Marcoulides (2006) provides a methodological template for conducting multiple group analysis
using SEM. The procedure was as follows:
1) We estimated the model for each subgroup separately and assessed the quality of fit. Again,
because of the similarity between these models and the earlier corresponding CFA models,
the data in Table 3 pertaining to the two subgroups also applies to the structural models,
which therefore exhibit good levels of fit. The regression weights between the two
constructs are 0.565 for the High DFI subgroup and 0.615 for the Low DFI subgroup, both
significant at p<0.000.
2) We also assessed the quality of fit of a joint model allowing for an entirely different set of
parameters for each of the two subgroups (baseline model M1). The first row in Table 5
shows that this model exhibits a good fit.
3) We systematically tested for subgroup invariance across all components of the model, in the
following sequence:
a) the factor loadings for the independent variable (e-service quality). We estimated a
model (M2) obtained from the baseline model by restricting these factor loadings to
be equal between the two subgroups. We then compared it with the baseline model
(M1), resulting in a decision to accept M2 or to keep M1.
b) the factor loadings for the dependent variable (loyalty). We estimated a model (M3)
obtained by adding to the model resulting from a) the restrictions on the equality of
factor loadings for loyalty between the two subgroups. We then compared it with the
model kept in a), resulting in a decision to accept M3 or to keep the model from a).
c) the structural coefficient between web site quality and loyalty. We estimated a model
(M4) obtained by adding to the model resulting from b) the restrictions on the
equality of the structural path between the two subgroups. We then compared it with
the model kept in b), resulting in a decision to accept M4 or to keep the model from
b).
The comparisons between competing models were based on the significance level of
differences in chi-square (Anderson and Gerbing, 1988). The results are presented in
Table 5. This table shows that M2 and M3 do not represent a significant deterioration of
fit over the preceding models, supporting the invariance of factor loadings across the two

16
subgroups. However, M4 is rejected providing evidence of a difference in the path
coefficient for the two subgroups.
4) Finally, we tested for differences in latent means for the Quality and Loyalty constructs
across the two subgroups in order to rule out confounding effects of these eventual
differences. We followed the approach outlined by Sörbom (1974), which required the
modification of the CFA baseline model as follows:
a) The factor loadings were constrained to be equal across the groups ensuring
measurement model invariance.
b) The means of the two constructs were left unconstrained for the High DFI group and
were fixed to zero in the Low DFI group, which thus acted as the reference for the
construct means (identical results would be observed if we had chosen to set the
means to zero in the High DFI group).
c) The error means were all fixed to zero in both groups.
d) The intercept terms of the observed variables were constrained to be equal in the two
groups.
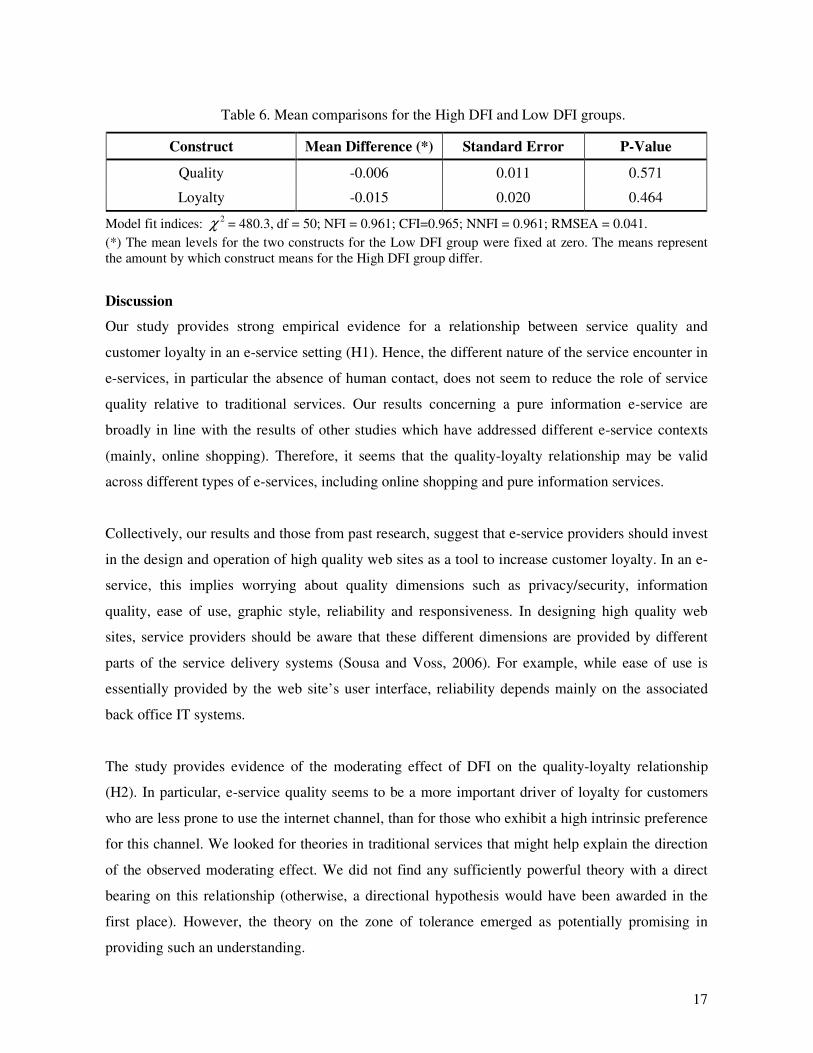
The results of the analysis are shown in Table 6. The fit indices indicate an excellent model
fit. The mean differences were found not to be significant for both constructs indicating that
average perceptions of quality and loyalty intentions are the same across the groups.
Collectively, the results provide strong support for hypothesis H2. Specifically, the relationship
between quality and loyalty is significantly stronger in the Low DFI group (0.615) than in the High
DFI group (0.565).
Table 5. Invariance tests across DFI subgroups.
Model NFI CFI NNFI RMSEA 2χ df �2χ �(df) P-value Reject?
M1 - Baseline .963 .965 .949 .047 465,690 38
M2 – Equal loadings for Q
.962 .966 .955 .044 469,106 43 3.416 5 0.636 No
M3 - Equal loadings for L
.962 .966 .956 .043 469,812 44 0.706 1 0.401 No
M4 – Equal loadings (Q, L), equal structural coefficient
.962 .965 .957 .043 474,881 45 5.069 1 0.024 Yes
17
Table 6. Mean comparisons for the High DFI and Low DFI groups.
Construct Mean Difference (*) Standard Error P-Value
Quality -0.006 0.011 0.571
Loyalty -0.015 0.020 0.464
Model fit indices: 2χ = 480.3, df = 50; NFI = 0.961; CFI=0.965; NNFI = 0.961; RMSEA = 0.041. (*) The mean levels for the two constructs for the Low DFI group were fixed at zero. The means represent the amount by which construct means for the High DFI group differ.
Discussion
Our study provides strong empirical evidence for a relationship between service quality and
customer loyalty in an e-service setting (H1). Hence, the different nature of the service encounter in
e-services, in particular the absence of human contact, does not seem to reduce the role of service
quality relative to traditional services. Our results concerning a pure information e-service are
broadly in line with the results of other studies which have addressed different e-service contexts
(mainly, online shopping). Therefore, it seems that the quality-loyalty relationship may be valid
across different types of e-services, including online shopping and pure information services.
Collectively, our results and those from past research, suggest that e-service providers should invest
in the design and operation of high quality web sites as a tool to increase customer loyalty. In an e-
service, this implies worrying about quality dimensions such as privacy/security, information
quality, ease of use, graphic style, reliability and responsiveness. In designing high quality web
sites, service providers should be aware that these different dimensions are provided by different
parts of the service delivery systems (Sousa and Voss, 2006). For example, while ease of use is
essentially provided by the web site’s user interface, reliability depends mainly on the associated
back office IT systems.
The study provides evidence of the moderating effect of DFI on the quality-loyalty relationship
(H2). In particular, e-service quality seems to be a more important driver of loyalty for customers
who are less prone to use the internet channel, than for those who exhibit a high intrinsic preference
for this channel. We looked for theories in traditional services that might help explain the direction
of the observed moderating effect. We did not find any sufficiently powerful theory with a direct
bearing on this relationship (otherwise, a directional hypothesis would have been awarded in the
first place). However, the theory on the zone of tolerance emerged as potentially promising in
providing such an understanding.
18
The zone of tolerance separates desired service level (the level of service the customer hopes to
receive) from the adequate service level (the level of service the customer will accept) (Zeithaml et
al, 1993). The associated theory posits that customers may accept variation in performance within
this zone, and any increase or decrease in performance within this area will only have a marginal
effect on perceptions and behavior - only when performance moves outside of this range will it have
any real effect (Johnston, 1995). Overall, it may be that customers with a high DFI exhibit narrower
zones of tolerance, thus explaining the observed moderating effect. Two reasons may account for
this.
First, customers with a high DFI may be seen as having a higher intrinsic preference for the internet
channel relative to other channels, for example, due to the afforded convenience and time savings
(e.g., Bhatnagar et al, 2000; Donthu and Garcia, 1999). Hence, it may be that they consider the
other channels as less adequate alternatives. Parasuraman et al (1991) suggest that when customers
perceive that they have alternative suppliers, their zone of tolerance is smaller.
Second, it may be that customers with a high DFI are less involved with the service (involvement
can be defined as a customer’s perceived importance of a purchase situation; Johnston, 1995).
Prud’homme et al (2005) found that as individuals become more comfortable and familiar with the
internet they begin to take the technology for granted and it plays less of a role in impacting their
satisfaction. Johnston (1995) has proposed that the width of the zone of tolerance is inversely
proportional to a customer’s level of involvement with the service. For example, a person with little
previous experience of flying and envisaging a high risk factor is expected to have very narrow
bands of tolerance (Johnston, 1995).
The observed moderating effect of DFI may be extrapolated to gauge the importance of web site
quality as a tool to drive e-service loyalty in multi-channel services with different degrees of
scalability (Hallowell, 2001) within the same service sector. For example, in the banking sector we
find services which are narrowly focused on the internet channel, possibly combining it with the
phone channel and none or very limited physical presence (“online” banks, high scalability). At the
other extreme, we find services that offer customers a wide range of channels, including the
internet, phone and strong physical presence (“multi-channel” banks, low scalability). One might
argue that customers who favor the former services may be similar to the high DFI group of
customers in our study, while those who favor the latter may resemble the low DFI group. For

19
“multi-channel” customers, we found that web site quality plays a key role in e-service customer
retention. For customers of internet-focused services, our findings suggest that e-service retention
can be achieved through web site quality as well, but strength is reduced. Thus, our results suggest
that these businesses may have to devise e-service retention mechanisms other than web site
quality. This may be especially important for these services because barriers to entry and customer
switching costs are arguably lower.
Our results hint at a possible paradox which multi-channel service providers may face. By
developing excellent capabilities associated with the internet channel, namely, those associated with
offering a high quality web site, service providers are able to increase customer loyalty for their e-
services. However, the web-oriented (High DFI) customers who possibly value the internet channel
more than the more traditional (Low DFI) customers, are also those for whom such web-based
capabilities are less effective in driving loyalty. On the contrary, customers who value the internet
channel less than traditional channels, may be induced loyalty behavior more strongly precisely via
the development of internet-based capabilities.
Limitations and future research
Our findings open a number of directions for future research. The validation of the quality-loyalty
relationship in an e-service setting suggests that offering high quality web sites is an important
strategy for driving customer loyalty. However, our study does not address the issue of whether it is
cost-effective to employ these strategies. The bulk of research in traditional services supports the
link between service quality and profitability. In addition, Reichheld and Schefter (2000) have
argued that loyalty may be more important in e-services than for comparable, traditional bricks-and-
mortar services because: i) attracting new customers has been found to be considerably more
expensive in e-services; ii) the profitability of individual customers accelerates much faster on the
web; and iii) the cost of serving a customer decreases much faster on the web. This suggests that
more overall investment in service quality may be awarded in e-services than in traditional services.
Nevertheless, future research should investigate the impact of quality on profitability in e-service
settings.
We put forward the theory on the zone of tolerance as a promising explanation for the observed
direction of the moderating effect of DFI. Future research should empirically test this, for example,
by attempting to measure the zone of tolerance for customers with different levels of DFI.
20
In this study, we do not delve into what drives DFI, but rather, focus on this variable as a readily
observable customer trait and thus a possible customer segmentation variable. It would be important
for future research to examine the antecedents of DFI.
The study is not without its limitations, which themselves provide opportunities for future research.
The investigation is based on one service industry, e-banking, a very important type of service in
today’s e-service landscape. We believe that the findings can be generalized to other task-oriented
e-services, but caution must be exercised in extending the conclusions of this study to other
services. It may be important for future research to test the developed hypotheses in other types of
e-services, in particular, types of e-services which are more strongly associated with
experiential/hedonic use (e.g., entertainment services).
We believe that the fact that our study has been limited to one country does not pose serious threats
to generalizability. On the one hand, the country in question (Portugal) can be seen as
representative of the international internet context, exhibiting an internet penetration ratio equal to
the average ratio of the European Union EU-15 countries, i.e., 36 internet users per 100 inhabitants
(Eurostat, 2003). On the other hand, the work of Tsikriktsis (2002) showed that, on the internet,
culture has a minor impact on service quality evaluations compared to traditional services. Despite
this, a test of our hypotheses in various country contexts could be worthwhile.
Finally, we have focused on loyalty behavioral intentions, what Oliver (1999) called conative
loyalty. Although previous research has provided empirical support for the causal link between
intentions and actual actions (Venkatesh and Davis, 2000), future research may examine if loyalty
behavior is linked to loyalty actions (what Oliver (1999) calls action loyalty).
Conclusions
This study contributes to research in e-services in several ways. First, it provides empirical evidence
into the effects of service quality on loyalty in an information-based service, a context which has
been relatively unexplored to date. In doing so, the study investigated actual customers in a real e-
service setting, increasing the external validity of the results. Such an approach has been lacking in
existing e-service research which tends to employ convenience samples (mainly students), rather
than samples taken from the actual customer base of service providers. Overall, these results
complement existing research in supporting the key role of service quality in driving customer
21
loyalty in e-services. Hence, the different nature of the service encounter in e-services, in particular
the absence of human contact, does not seem to reduce the role of service quality relative to
traditional services. This is an important result, given that loyalty has been considered harder to
achieve in e-services than in traditional services.
Second, the study provides a better understanding of the quality-loyalty relationship in multi-
channel e-services, a context which, although being pervasive in today’s business environment, has
not received much attention from previous studies. In particular, the study found that a customer’s
DFI moderates the relationship between quality and loyalty. This variable may be seen as
distinguishing between more traditional customers (low DFI) and web-oriented customers (high
DFI). Our data showed that these groups were similar in terms of demographics (age, gender and
education level). This suggests that DFI per se may be a relevant customer segmentation variable in
multi-channel e-service contexts for devising loyalty strategies based on service quality.
Specifically, the importance of web site quality in driving loyalty, while still strong, is reduced for
more traditional customers. This work answers calls for more research investigating relevant
factors moderating the quality-loyalty relationship in e-services (Parasuraman and Grewal, 2000).
Third, the study contributes to the research stream investigating customer heterogeneity on the web
(e.g., Boyer et al, 2002; Sousa and Yeung, 2004; Boyer and Frohlich, 2006). This has been an
important area of research because one of the challenges that e-services face when compared to
traditional services is their typical exposure to a large number of customers with different profiles
and requirements (Boyer et al, 2002). Research to date has typically distinguished between online
and offline customers, ignoring the fact that in the e-services prevalent in today’s business
landscape customers frequently engage in multi-channel behavior, using both online and traditional
channels. Such research has also treated customers of an e-service as homogeneous in terms of DFI.
The reality, though, as the sample examined by our study revealed, is that there can be a high
variability in DFI among customers of a given e-service, even though demographics are similar.
Future research in this area should recognize this source of heterogeneity among customers.
Finally, the research hypotheses, largely based on theory from traditional services, were broadly
supported. This further extends the generalizeability of research in traditional services into the
context of online service. Thus, the study provides general support in defense of theories that draw
parallels between online and offline services.

22
Acknowledgements
This study was kindly funded by FCT (Foundation for Science and Technology, Portugal) and
POCTI (“Programa Operacional Ciência, Tecnologia, Inovação do Quadro Comunitário de Apoio
III”) under grant number POCTI/GES/49074/2002.

23
Appendix 1. Measures of Research Variables and Data Sources
E-Service Quality (source: online questionnaire)
Measurement Dimensions (a) General Description (a) Measurement Items (b) 1. Privacy/ Security Protection of personal
information, risk of fraud and financial loss.
Q1. Safety in performing transactions.
2. Information Quality The suitability of the information to the user’s purposes.
Q2. Correct and up to date information about the bank's products and services.
3. Ease of Use Effort of the end users in using the web site.
Q3. Ease of performing banking operations and accessing information.
4. Graphic Style Presentation of graphics and text on the web site.
Q4. Visual attractiveness of web site.
5. Reliability Ability to perform the promised service dependably and accurately.
Q5. Requests/ instructions correctly processed.
6. Responsiveness Speed of response. Q6. Speed in delivering the services. (a) Adapted from Zeithaml et al (2002). Consistent with existing instruments, we employed the
SERVPERF logic (e.g., Cronin and Taylor, 1992) to measure web site quality. (b) The wording of these items was adapted to the context of an e-banking service. Items used a 5-point
Likert-type scale ranging from “1 - Strongly disagree” to “5 - Strongly agree”.
Customer Loyalty (source: online questionnaire)
L1. Intention to re-use the [name of e-banking service] service (web site).
L2. Intention to recommend the [name of e-banking service] service (web site) to a friend or relative.
Both items used a 5-point Likert-type scale ranging from “1 - Strongly disagree” to “5 - Strongly agree”.
Degree of Focus on the Internet (DFI) (source: bank’s back office IT systems)
DFI. The proportion of the total number of transactions that were performed by a customer through the internet channel relative to the other available channels (physical counter, phone and ATM) during the month immediately after the questionnaire was removed from the web site.

24
References
Anderson, E., Mittal, V. (2000), “Strengthening the satisfaction-profit chain”, Journal of Service
Research, 3(2), 107-120.
Anderson, J., Gerbing, D. (1982), “Some methods for respecifying measurement models to obtain
unidimensional construct measurement”, Journal of Marketing Research, 19(Nov), 453-460.
Anderson, J., Gerbing, D. (1988), “Structural equation modeling in practice: A review and
recommended two-step approach”, Psychological Bulletin, 103(3), 453-460.
Bentler, P. (1990), “Comparative fit indexes in structural models”, Psychological Bulletin, 107,
238-246.
Bentler, P., Bonnet, D. (1980), “Significance tests and goodness of fit in the analysis of covariance
structures”, Psychological Bulletin, 88, 588-606.
Bhatnagar, A., Misra, S., Rao, H. (2000), “On risk, convenience and internet shopping behavior”,
Communications of the Association for Computing Machinery, 42(12), 32-38.
Bitner, M., Brown, S. and Meuter, M. (2000), “Technology infusion in service encounters”, Journal
of the Academy of Marketing Science, 28(1), 138-149.
Bolton, R., Lemon, K., Verhoef, P. (2004), ”The theoretical underpinnings of customer asset
management: A framework and propositions for future research”, Journal of the Academy of
Marketing Science, 32(3), 271-292.
Boulding, W., Kalra, A., Staelin, R., Zeithaml, V. (1993), “A dynamic process model of service
quality: From expectations to behavioral intentions”, Journal of Marketing Research,
30(February), 7-27.
Boyer, K., Frohlich, M. (2006), “Analysis of effects of operational execution on repeat purchasing
for heterogeneous customer segments”, Production and Operations Management, 15(2), 229-
242.
Boyer, K., Hallowell, R., Roth, A. (2002), “E-services: Operating strategy – a case study and a
method for analyzing operational benefits”, Journal of Operations Management, 20(2), 175-
188.
Boyer, K., Hult, G. (2005a), “Extending the supply chain: Integrating operations and marketing in
the online grocery industry”, Journal of Operations Management, 23(6), 642-661.
Boyer, K., Hult, G. (2005b), “Customer behavior in an online ordering application: A decision
scoring model”, Decision Sciences, 36(4), 569-598.
Boyer, K., Pagell, M. (2000), “Measurement issues in empirical research: Improving measures of
operations strategy and advanced manufacturing technology”, Journal of Operations
Management, 18(3), 361-374.
25
Brown, M., Cudeck, R. (1993), “Alternative Ways of Assessing Model Fit.” In K.A. Bollen and J.S.
Long (Eds.), Testing Structural Models (pp. 136-162). Newbury Park, CA: Sage Publications,
Inc.
Churchill, G. (1979), “A paradigm for developing better measures of marketing constructs”,
Journal of Marketing Research, 16(February), 64-73.
Collier, J., Bienstock, C. (2006), “Measuring service quality in e-retailing”, Journal of Service
Research, 8(3), 260-275.
Cronin J., Taylor, S. (1992), “Measuring service quality: a re-examination and extension”, Journal
of Marketing, 56(3), 55-68.
Cronin, J., Brady, M., Hult, G. (2000), “Assessing the effects of quality, value, and customer
satisfaction on consumer behavioural intentions in service environments”, Journal of Retailing,
76(2), 193-218.
Dick, A., Basu, K. (1994), “Customer loyalty: toward an integrated conceptual framework”,
Journal of Marketing Research, 27(4), 485-93.
Donthu, N., Garcia, A. (1999), “The internet shopper”, Journal of Advertising Research, 39(3), 52-
58.
Drolet, A., Morrison, D. (2001), “Do we really need multiple-item measures in service research?”,
Journal of Service Research, 3(3), 196-204.
Eurostat (2003), Statistics on the information society in Europe, report available at
http://europa.eu.int/comm/enterprise/ict/studies/is-stat-96-02.pdf.
Fassnacht, M., Koese, I. (2006), “Quality of electronic services – Conceptualizing and testing a
hierarchical model”, Journal of Service Research, 9(1), 19-37.
Fornell, C., Larcker, D. (1981), “Evaluating structural equation models with unobservable variables
and measurement error”, Journal of Marketing Research, 18(February), 39-50.
Fram, E., Grady, D. (1995), “Internet buyers: Will the surfers become buyers?”, Direct Marketing,
58(6), 63-65.
Garbarino, E., Johnson, M. (1999), “The different roles of satisfaction, trust, and commitment in
customer relationships”, Journal of Marketing, 63(April), 70-87.
Gulati, R., Garino, J. (2000), “Get the Right Mix of Bricks and Clicks”, Harvard Business Review,
78(3), 107-114.
Hallowell, R. (2001), “’Scalability’: The paradox of human resources in e-commerce”,
International Journal of Service Industry Management, 12(1), 34-43.
Harris, L., Goode, M. (2004), “The four levels of loyalty and the pivotal role of trust: A study of
online service dynamics”, Journal of Retailing, 80(2), 139-158.
26
Heim, G., Sinha, K. (2001), “Operational drivers of customer loyalty in electronic retailing: An
empirical analysis of electronic food retailers”, Manufacturing & Service Operations
Management, 3(3), 264-271.
Iqbal, Z., Verma, R., Baran, R. (2003), “Understanding consumer choices and preferences in
transaction-based e-services”, Journal of Service Research, 6(1), 51-65.
Janda, S., Trocchia, P., Gwinner, K. (2002), “Consumer perceptions of internet retail service
quality”, International Journal of Service Industry Management, 13(5), 412-431
Johnston, R. (1995), “The zone of tolerance: Exploring the relationship between service
transactions and satisfaction with the overall service”, International Journal of Service Industry
Management, 6(2), 46-61.
Kettinger, W., Lee, C. (1994), “Perceived service quality and user satisfaction with the information
services function”, Decision Sciences, 25(5), 737-766.
Koufteros, X., Marcoulides, G. (2006), “Product development practices and performance: A
structural equation modelling-based multi-group analysis”, International Journal of Production
Economics, 103(1), 286-307.
Lee, G., Lin, H. (2005), “Customer perceptions of e-service quality in online shopping”,
International Journal of Retail & Distribution Management, 33(2), 161-176.
Lei, M., Lomax, R. (2005), “The effect of varying degrees of nonnormality of data in structural
equation modeling”, Structural Equation Modeling, 12(1), 1-27.
Little, R., Rubin, D. (1987), Statistical analysis with missing data, New York: Wiley.
Loiacono, E., Watson, R., Goodhue, D. (2001), “WebQual: A web site quality instrument”,
Working Paper, University of Georgia.
McFarlin, D., Sweeney, P. (1992), “Distributive and procedural justice as predictors of satisfaction
with personal and organizational outcomes”, Academy of Management Journal, 35(3), 626-627.
Miller, J., Craighead, C., Karwan, K. (2000), “Service recovery: A framework and empirical
investigation”, Journal of Operations Management, 18(4), 387-400.
Mittal, V., Kamakura, W. (2000), “Satisfaction, repurchase intention, and repurchase behavior:
Investigating the moderating effect of customer characteristics”, Journal of Marketing
Research, 38(1), 131-142.
Muthitacharoen, A., Gillenson, M., Suwan, N. (2006), “Segmenting online customers to manage
business resources : A study of the impacts of sales channel strategies on consumer
preferences”, Information & Management, 43(5), 678-695.
Nunally, J., Bernstein, I. (1994), Psychometric Theory, 3rd Edition, McGraw-Hill Series in
Psychology, New York.

27
Oliver, R. (1999), “Whence consumer loyalty?”, Journal of Marketing, 63(4), 33-44.
Olson, J., Boyer, K. (2005), “Internet ticketing in a not-for-profit, service organization: Building
customer loyalty”, International Journal of Operations & Production Management, 25(1), 74-
92.
Parasuraman, A., Berry, L., Zeithaml, V. (1991), “Understanding customer expectations of
service”, Sloan Management Review, 32(3), 39-48.
Parasuraman, A., Grewal, D. (2000), “The impact of technology on the quality – value – loyalty
chain: A research agenda”, Journal of the Academy of Marketing Science, 28(1), 168-170.
Parasuraman, A., Zeithaml, V., Malhotra, A. (2005), “E-S-QUAL: A multiple-item scale for
assessing electronic service quality”, Journal of Service Research, 7(3), 213-233.
Parasuraman, A., Zeithaml, V., Berry, L. (1985), “A conceptual model of service quality and its
implications for future research”, Journal of Marketing, 49(Fall), 41-50.
Parasuraman, A., Zeithaml, V., Berry, L. (1988), “SERVQUAL: A multiple-item scale for
measuring consumer perceptions of service quality”, Journal of Retailing, 64(1), 12-40.
Ping, R. (1996), “Estimating latent variable interactions and quadratics: The state of this art”,
Journal of Management, 22(1), 163-183.
Podsakoff, P., Organ, D. (1986), “Self-reports in organizational research: Problems and prospects”,
Journal of Management, 12(4), 531-544.
Prud’homme, A., Boyer, K., Calantone, R. (2005), “TAM, TCA and SERVQUAL compared:
Measuring online customer satisfaction & preference across regions”, Proceedings of the
Academy of Management Annual Meeting, Hawaii.
Raykov, T., Markoulides, G. (2000), A first course in structural equation modeling, Laurence
Erlbaum Associates, NJ.
Reichheld, F., Schefter, P. (2000), “E-loyalty: your secret weapon on the web”, Harvard Business
Review, 78(July-August), 105-114.
Roos, I. (1999), “Switching processes in customer relationships”, Journal of Service Research,
1(August), 68-85.
Samson, D., Terziovski, M. (1999), “The relationship between total quality management practices
and operational performance”, Journal of Operations Management, 17(4), 393-409.
Shah, R., Goldstein, S. (2006). “Use of structural equation modeling in operations management
research: Looking back and forward”, Journal of Operations Management, 24(2), 148-169.
SIBIS (2003), “Measuring the information society in the EU, the EU accession countries,
Switzerland and the US”, Project IST-2000-26276 SIBIS Statistical Indicators Benchmarking

28
the Information Society, report available at http://www.sibis-
eu.org/sibis/publications/pocketbook.htm.
Sörbom, D. (1974), “A general method for studying differences in factor means and factor
structures between groups”, British Journal of Mathematical and Statistical Psychology, 27,
229-239.
Sousa, R., Voss, C. (2006), "Service quality in multi-channel services employing virtual channels",
Journal of Service Research, 8(4), 356-371.
Sousa, R., Yeung, A. (2004), “Customer demographics, usage patterns and website quality
dimensions: Evidence from e-banking”, Proceedings of the Decision Sciences Institute Annual
Meeting, Boston, US.
Steiger, J., Lind, J. (1980), “Statistically based tests for the number of common factors”, Paper
presented at the Annual Meeting of the Psychometric Society, Iona City, IA.
Tse, A. Yim, F. (2001), “Factors affecting the choice of channels: Online vs. conventional”, Journal
of International Consumer Marketing, 14(2/3), 137-152.
Tsikriktsis, N. (2002), “Does culture influence web site quality expectations?”, Journal of Service
Research, 5(2), 101-112.
Venkatesh, V., Davis, F. (2000), “A theoretical extension of the technology acceptance model: Four
longitudinal field studies”, Management Science, 46(2), 106-204.
Verma, R., Iqbal, Z., Plaschka, G. (2004), “Understanding customer choices in e-financial
services”, California Management Review, 46(4), 43-67.
Vishwanath, V., Mulvin, G. (2001), “Multi-channels: The real winners in the B2C internet wars”,
Business Strategy Review, 12(1), 25-33.
Wolfinbarger, M., Gilly, M. (2003), “eTailQ: Dimensionalizing, measuring, and predicting e-tail
quality”, Journal of Retailing, 79(3), 183-198.
Yen, H., Gwinner, K. (2003), “Internet retail customer loyalty: The mediating role of relational
benefits”, International Journal of Service Industry Management, 14(5), 483-500.
Yoo, B., Donthu, N. (2001), “Developing a scale to measure the perceived quality of an internet
shopping site (SITEQUAL)”, Quarterly Journal of Electronic Commerce, 2(1), 31-46.
Zeithaml, V. (2000), “Service quality, profitability, and the economic worth of customers: What we
know and what we need to learn”, Academy of Marketing Science Journal, 28(1), 67-85.
Zeithaml, V., Berry, L., Parasuraman, A. (1993), “The nature and determinants of customer
expectations of service”, Journal of the Academy of Marketing Science, 21(1), 1-12.
Zeithaml, V., Berry, L., Parasuraman, A. (1996), “The behavioral consequences of service quality”,
Journal of Marketing, 60(2), 31-46.

29
Zeithaml, V., Parasuraman, A., Malhotra, A. (2002). “Service quality delivery through web sites: A
critical review of extant knowledge”, Journal of the Academy of Marketing Science, 30(4), 362-
375.


![Interactive Multi-Task Relationship Learning · interactive Multi-Task Relationship Learning iMTRL Framework. MTRL – revisit 9 Multi-Task Relationship Learning[1] ... ACKNOWLEDGEMENT:](https://img.pdfslide.us/doc/110x75/5f07de5e7e708231d41f2841/interactive-multi-task-relationship-learning-interactive-multi-task-relationship.jpg)