Embed Size (px)
Citation preview
International Journal of Academic Research in Business and Social Sciences 2016, Vol. 6, No. 8
ISSN: 2222-6990
182 www.hrmars.com
The Relationship between Green Practices and Innovation Performance in Malaysian Automotive SMEs
Nurul Fadly Habidin1, Baharudin Omar2, Juriah Conding3, Sariyati Abdul Hadji4, Nursyazwani Mohd Fuzi5, and Sharon Yong Yee Ong6
1*, 2, 4, 6 Department of Management and Leadership, Faculty of Management and Economics, Universiti Pendidikan Sultan Idris, 35900 Tanjung Malim, Perak, Malaysia
3, 5Department of Accounting and Finance, Faculty of Management and Economics, Universiti Pendidikan Sultan Idris, 35900 Tanjung Malim, Perak, Malaysia
DOI: 10.6007/IJARBSS/v6-i8/2419 URL: http://dx.doi.org/10.6007/IJARBSS/v6-i8/2419
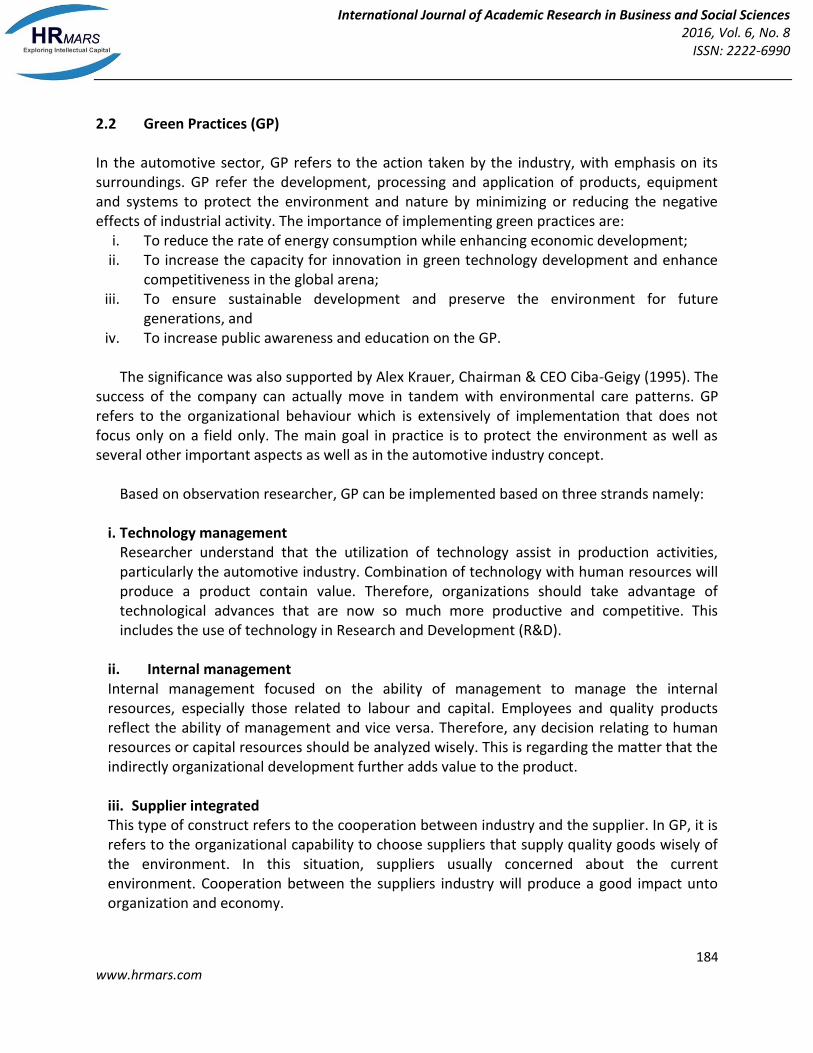
Abstract Government now encourage that each of industry, including the automotive industry implementing green practices are involved in each process. These practices not only boost the national economy but profitable to the industry. Their impacts are a green practices implementation with a mediating on innovation performance. Thus, the aim of this study is to determine the relationship between green practices in innovation performance in Malaysian Automotive Industry. This study conducts an industry-wide survey, with 80 completed responses received that form the analysis of this research. The researcher use reliability analysis and Exploratory Factor Analysis (EFA) was conducted ensure that the research used for this study is valid and reliable. The result shows that green practices and innovation performance has a significant relationship. Keywords: Green Practices, Innovation Performance, Automotive Industry 1. Introduction The automotive sector is a main industry in the Malaysian economy. The economic contribution of this sector is immense, with significant linkages to the manufacturing and services sectors. Against a backdrop of steady economic growth, highly developed infrastructure and pro-business government policies, Malaysia provides a conducive environment for manufacturing activities. Nunes and Bennett (2010) stated much organization evolved in terms of knowledge and practice, but nonetheless pursuing environmental leadership continues to be daunting and complex task. Focus to develop high value-added manufacturing activities in niche areas (MITI, 2010), can help the automotive sector to produce products that comply with government standards as well as nature of eco-friendly. The table below shows the summary of the risk factors in PROTON for the Year Ended 2011:
International Journal of Academic Research in Business and Social Sciences 2016, Vol. 6, No. 8
ISSN: 2222-6990
183 www.hrmars.com
Table 1 The summary of risk factor in PROTON for the year ended 2011
Risk factor Highlight issue
Political, Regulatory and Legal Risks 1. Various laws and government regulations including vehicle safety and environment pressure; 2. Government policy namely new tariffs, trade barriers, taxes and levies, enact price and exchange control and local protection; and 3. Global issues and events such as political instability, natural calamities, epidemics, terrorism and country sentiments.
Source: Annual Report PROTON (2011)
To solving the risk, this research is focusing on the design of automotive management as practiced in Malaysia to maintain its journey towards green practices other than to identify innovative performance to assist organizations in and outside to maintain their performance. 2. Literature Review 2.1 Automotive Overview Automotive industry is a heavy industry as well as cement and steel industry that developed through changes in industrial policy implemented by the government starting in the early 1980's. It is one of the most important industries in the Malaysian manufacturing sector (Habidin, Salleh, Latip, Azman, & Fuzi, 2015).The Heavy Industries Corporation of Malaysia Berhad (HICOM) is one of them. HICOM is a company that involved in leading corporations, involved in the automotive manufacturing, assembly and distribution industry. HICOM entered to joint venture agreement with Mitsubishi Motors Corporation and Mitsubishi Corporation for the project of National Car Production Holdings Berhad (PROTON) that was established in 1983. The Perusahaan Otomobil Kedua Sendirian Berhad (PERODUA) is the second national car that is a joint venture between several companies with Daihatsu of Japan (Ragayah, 2007). This shows the automotive industry in Malaysia has been established since of 90's. There are four main objectives outlined by the government in the establishment of the national car project to bring advantages for local automotive industry (Habidin, Zubir, Fuzi, Latip, & Azman, 2015). The objectives are including to restructuring of the automotive industry in Malaysia, promoting the growth of downstream industries and support, to achieve the transfer of technology and increase participation in the automotive industry. ASEAN Economic Community (AEC) also outlines a strategic framework for balanced regional economic development through increased and strengthening SME competitiveness (ASEAN Policy Blueprint for SME Development – APBSD, 2004-2014).
International Journal of Academic Research in Business and Social Sciences 2016, Vol. 6, No. 8
ISSN: 2222-6990
184 www.hrmars.com
2.2 Green Practices (GP) In the automotive sector, GP refers to the action taken by the industry, with emphasis on its surroundings. GP refer the development, processing and application of products, equipment and systems to protect the environment and nature by minimizing or reducing the negative effects of industrial activity. The importance of implementing green practices are:
i. To reduce the rate of energy consumption while enhancing economic development; ii. To increase the capacity for innovation in green technology development and enhance
competitiveness in the global arena; iii. To ensure sustainable development and preserve the environment for future
generations, and iv. To increase public awareness and education on the GP.
The significance was also supported by Alex Krauer, Chairman & CEO Ciba-Geigy (1995). The success of the company can actually move in tandem with environmental care patterns. GP refers to the organizational behaviour which is extensively of implementation that does not focus only on a field only. The main goal in practice is to protect the environment as well as several other important aspects as well as in the automotive industry concept. Based on observation researcher, GP can be implemented based on three strands namely:
i. Technology management Researcher understand that the utilization of technology assist in production activities, particularly the automotive industry. Combination of technology with human resources will produce a product contain value. Therefore, organizations should take advantage of technological advances that are now so much more productive and competitive. This includes the use of technology in Research and Development (R&D).
ii. Internal management Internal management focused on the ability of management to manage the internal resources, especially those related to labour and capital. Employees and quality products reflect the ability of management and vice versa. Therefore, any decision relating to human resources or capital resources should be analyzed wisely. This is regarding the matter that the indirectly organizational development further adds value to the product.
iii. Supplier integrated This type of construct refers to the cooperation between industry and the supplier. In GP, it is refers to the organizational capability to choose suppliers that supply quality goods wisely of the environment. In this situation, suppliers usually concerned about the current environment. Cooperation between the suppliers industry will produce a good impact unto organization and economy.
International Journal of Academic Research in Business and Social Sciences 2016, Vol. 6, No. 8
ISSN: 2222-6990
185 www.hrmars.com
2.3 Innovation Performance (IP) Innovation is a measure that is intended to make similar improvements in management, production, products, or technologies used. Assink (2006), stated innovation has a connotation of newness, success and change. Damanpour (1996) can be defined respectively as the generation, development and adoption of an idea or behaviour, new to adopting organization. Innovation too is the first successful application of a product or process (Cumming, 1998). Johne (1999), distinguishes categorizes innovations into three types which are namely product innovation, process innovation, and market innovation. Product and process innovation are distinguished from market innovation. According to Leonard Barton (1995), innovation processes involve the integration of external knowledge with the existing organization. Mullen and Lyles (1993), suggest that continuous organizational learning improves the efficiency and effectiveness of a firm’s innovation. 3. Research Methodology 3.1 Research Design In order to understand the reality of the automotive performance towards quality management, research in automotive manufacturing SMEs was conducted through a structured questionnaire approach. A questionnaire was developed and formatted in such a way to obtain information and answer questions related to the perception and management practices-linking GP implementation, how the implementation was carried out, and the results and benefits of the factors that contribute to the success of GP in IP in the Malaysian automotive industry. In addition, the hypothesis of the study will be carried out to examine the relationship between variables using Statistical Package for the Social Sciences (SPSS). 3.2 Overall Research Methodology This research was divided into three phases. For the first phase, the critical literature review on quality initiatives in Malaysian automotive industry, GP were conducted. The researcher has also was conducted a critical review on GP constructs, IP measures and work done by other researchers in this research area and related. Then, it proceeds with developing the research hypotheses, and survey instrument. Finally, initial procedures undertaken to determine the population and samples selection, build and modify the instrument, SMEs selection for pilot study and full survey, as well as the procedure for obtaining, and permission to engage the research undertaken were determined in this phase. For the second phase, the research activities focused on the data collection. The questionnaire was and conducting as a pilot study. In relation to previous activities, the researcher had also to improve the questionnaire, if necessary and, finally implement the full survey to the Malaysian automotive industry.
International Journal of Academic Research in Business and Social Sciences 2016, Vol. 6, No. 8
ISSN: 2222-6990
186 www.hrmars.com
In the third phase, data screening and analysis have done by using the Statistical Package for the Social Sciences (SPSS) software. Next, discussions and implications of the survey results were presented. Finally, the researcher gives some conclusion and recommendation for future research. 3.3 Questionnaire Development The questionnaire was divided into three sections, starting with some general information like type of product, quality award and then focuses on success factors for strategic factor of GP in second section. In the third section is the perception on IP for Malaysian automotive. The questionnaire was modified based on their comments. Meanwhile, it is used the seven-likert scale, representative a range from very low = 1 to very high = 7 which has been used by management researchers before (Adler & Reid, 2008; Habidin et al., 2015; Habidin, Salleh, Latip, Azman, & Fuzi, 2016). In order to test the internal reliability, the researcher evaluated the common measure of construct reliability of the questionnaire through Cronbach’s alpha measure.The value of Cronbach’s alpha for all constructs in this research was more than 0.900, indicating an acceptable level of reliability of the constructs. The result of reliability analysis of pilot data showed that the construct are sufficient as reliable measure to automotive industry. 3.3.1 Population and Sampling of the Study The research on GP constructs and IP measures is going to use quantitative survey in the Malaysian automotive industry. Population of this research was chosen in automotive industry in Malaysia and samples were selected from the list of Proton Vendor Association (PVA) and Kelab Vendor Perodua (KVP). Both of suppliers consist of electrical, electronic, metal, plastic, rubber, and other automotive part. All the information about the company was obtained via PVA and KVP website, (e.g. classification of company, mailing and email address, and office and fax number). Respondents’ position such as Executive Manager, Director of Operations/Manufacturing or the person with the equivalent position in the organization was selected for answered the questionnaire. Questionnaire would be mailed to the right person who is most likely to have understanding, knowledgeable, practical experience about sustainable practices, lean manufacturing practice and performance of the company. 3.3.2 Data Collection All the data in this research was collected through questionnaire. The questionnaire was administered simultaneously in each PROTON and PERODUA vendor by researcher. The questionnaire was mailed to the Executive Manager, Director of Operations/Manufacturing or the person with the equivalent position in the company. The Executive Manager and Director of
International Journal of Academic Research in Business and Social Sciences 2016, Vol. 6, No. 8
ISSN: 2222-6990
187 www.hrmars.com
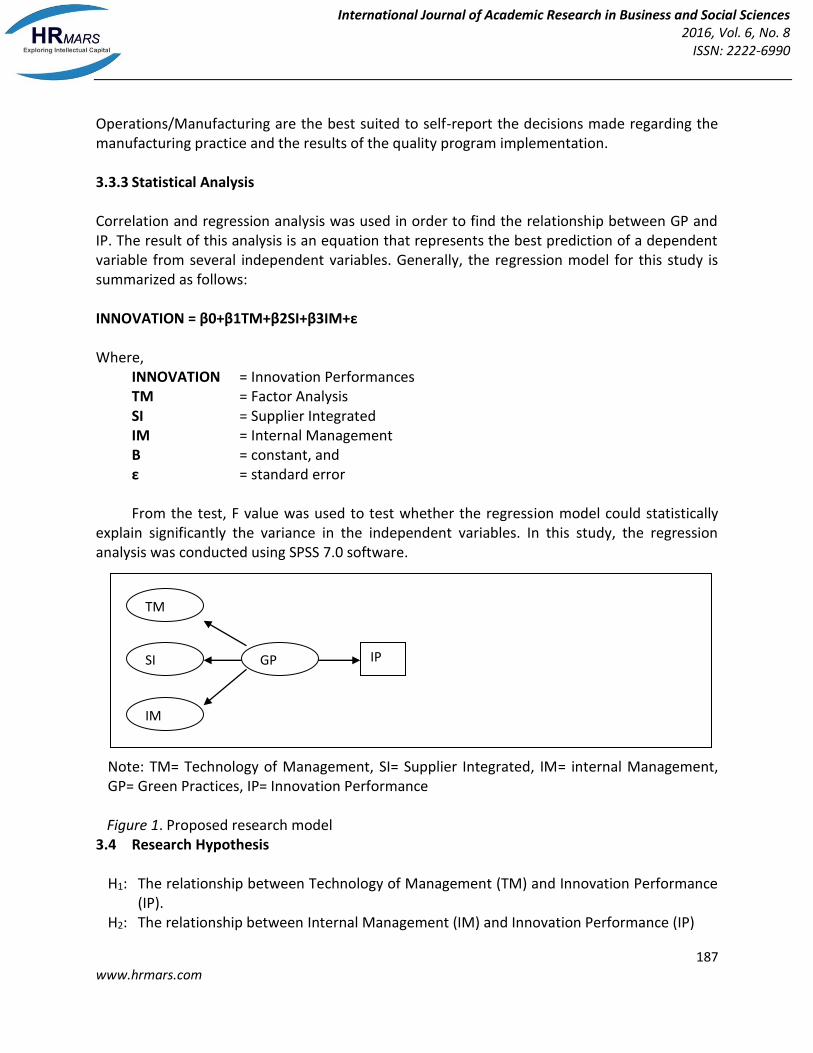
Operations/Manufacturing are the best suited to self-report the decisions made regarding the manufacturing practice and the results of the quality program implementation. 3.3.3 Statistical Analysis Correlation and regression analysis was used in order to find the relationship between GP and IP. The result of this analysis is an equation that represents the best prediction of a dependent variable from several independent variables. Generally, the regression model for this study is summarized as follows: INNOVATION = β0+β1TM+β2SI+β3IM+ε Where, INNOVATION = Innovation Performances TM = Factor Analysis SI = Supplier Integrated IM = Internal Management Β = constant, and ε = standard error From the test, F value was used to test whether the regression model could statistically explain significantly the variance in the independent variables. In this study, the regression analysis was conducted using SPSS 7.0 software.
Note: TM= Technology of Management, SI= Supplier Integrated, IM= internal Management, GP= Green Practices, IP= Innovation Performance
Figure 1. Proposed research model 3.4 Research Hypothesis
H1: The relationship between Technology of Management (TM) and Innovation Performance (IP).
H2: The relationship between Internal Management (IM) and Innovation Performance (IP)
TM
SI
IM
GP IP
International Journal of Academic Research in Business and Social Sciences 2016, Vol. 6, No. 8
ISSN: 2222-6990
188 www.hrmars.com
H3: The relationship between Supplier Integrated (SI) and Innovation Performance (IP). H4: There is a positive and significant relationship between GP and IP in Malaysian
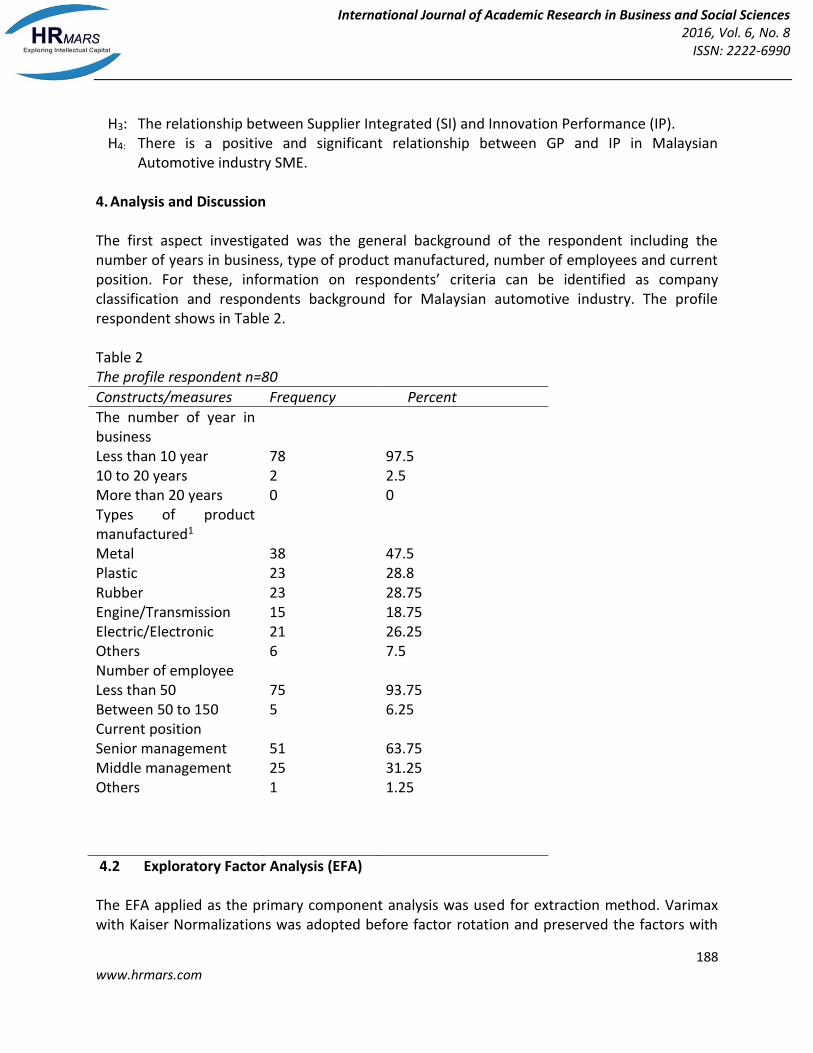
Automotive industry SME. 4. Analysis and Discussion The first aspect investigated was the general background of the respondent including the number of years in business, type of product manufactured, number of employees and current position. For these, information on respondents’ criteria can be identified as company classification and respondents background for Malaysian automotive industry. The profile respondent shows in Table 2. Table 2 The profile respondent n=80
Constructs/measures Frequency Percent
The number of year in business
Less than 10 year 78 97.5 10 to 20 years 2 2.5 More than 20 years 0 0 Types of product manufactured1
Metal 38 47.5 Plastic 23 28.8 Rubber 23 28.75 Engine/Transmission 15 18.75 Electric/Electronic 21 26.25 Others Number of employee
6 7.5
Less than 50 75 93.75 Between 50 to 150 5 6.25 Current position Senior management 51 63.75 Middle management 25 31.25 Others 1 1.25
4.2 Exploratory Factor Analysis (EFA) The EFA applied as the primary component analysis was used for extraction method. Varimax with Kaiser Normalizations was adopted before factor rotation and preserved the factors with
International Journal of Academic Research in Business and Social Sciences 2016, Vol. 6, No. 8
ISSN: 2222-6990
189 www.hrmars.com
eigen value of one or greater. This procedure was chosen to eliminate error variance as suggested by Tinsley and Tinsley (1987). In this study, EFA was conducted in variables to perform EFA to determine the underlying details (items) of GP constructs.
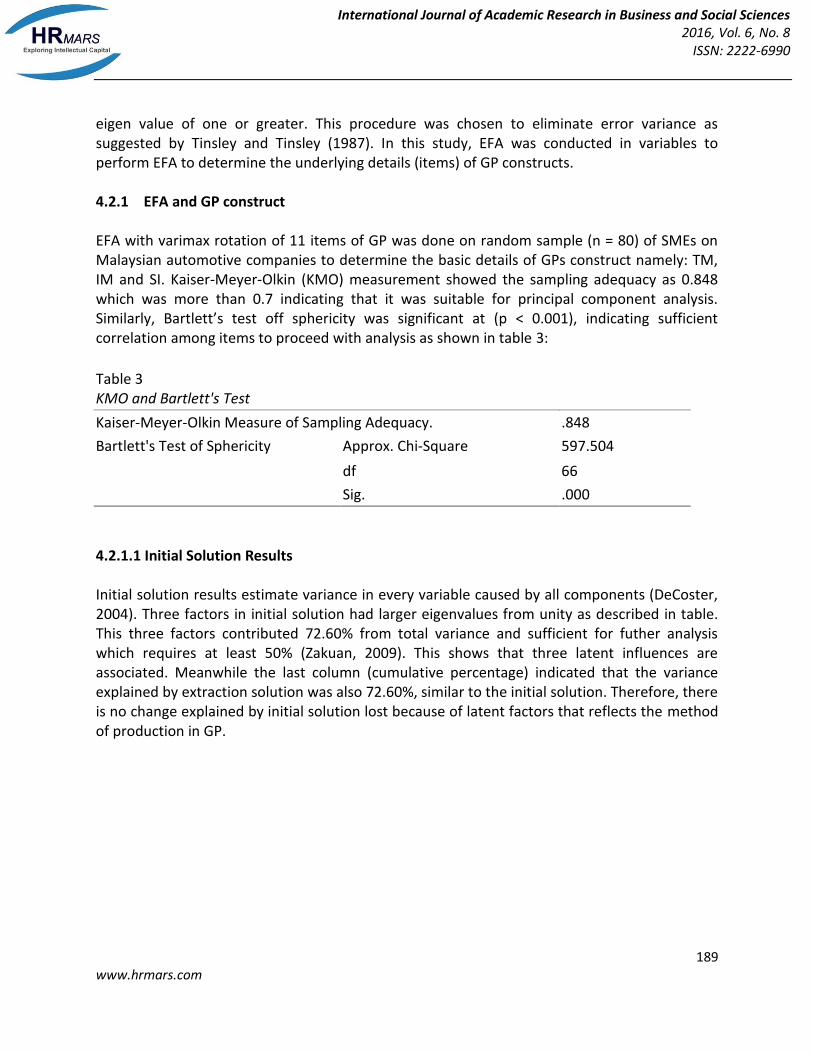
4.2.1 EFA and GP construct EFA with varimax rotation of 11 items of GP was done on random sample (n = 80) of SMEs on Malaysian automotive companies to determine the basic details of GPs construct namely: TM, IM and SI. Kaiser-Meyer-Olkin (KMO) measurement showed the sampling adequacy as 0.848 which was more than 0.7 indicating that it was suitable for principal component analysis. Similarly, Bartlett’s test off sphericity was significant at (p < 0.001), indicating sufficient correlation among items to proceed with analysis as shown in table 3:
Table 3 KMO and Bartlett's Test
Kaiser-Meyer-Olkin Measure of Sampling Adequacy. .848
Bartlett's Test of Sphericity Approx. Chi-Square 597.504
df 66
Sig. .000
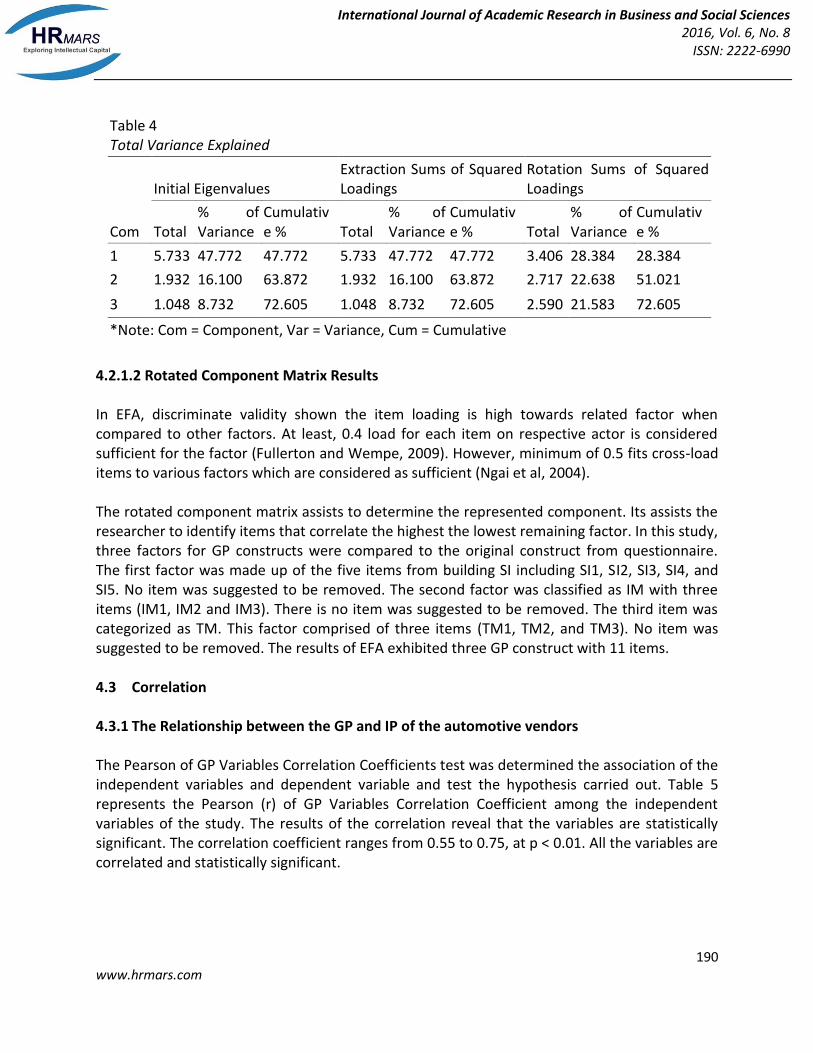
4.2.1.1 Initial Solution Results Initial solution results estimate variance in every variable caused by all components (DeCoster, 2004). Three factors in initial solution had larger eigenvalues from unity as described in table. This three factors contributed 72.60% from total variance and sufficient for futher analysis which requires at least 50% (Zakuan, 2009). This shows that three latent influences are associated. Meanwhile the last column (cumulative percentage) indicated that the variance explained by extraction solution was also 72.60%, similar to the initial solution. Therefore, there is no change explained by initial solution lost because of latent factors that reflects the method of production in GP.
International Journal of Academic Research in Business and Social Sciences 2016, Vol. 6, No. 8
ISSN: 2222-6990
190 www.hrmars.com
Table 4 Total Variance Explained
Com
Initial Eigenvalues Extraction Sums of Squared Loadings
Rotation Sums of Squared Loadings
Total % of Variance
Cumulative % Total
% of Variance
Cumulative % Total
% of Variance
Cumulative %
1 5.733 47.772 47.772 5.733 47.772 47.772 3.406 28.384 28.384
2 1.932 16.100 63.872 1.932 16.100 63.872 2.717 22.638 51.021
3 1.048 8.732 72.605 1.048 8.732 72.605 2.590 21.583 72.605
*Note: Com = Component, Var = Variance, Cum = Cumulative
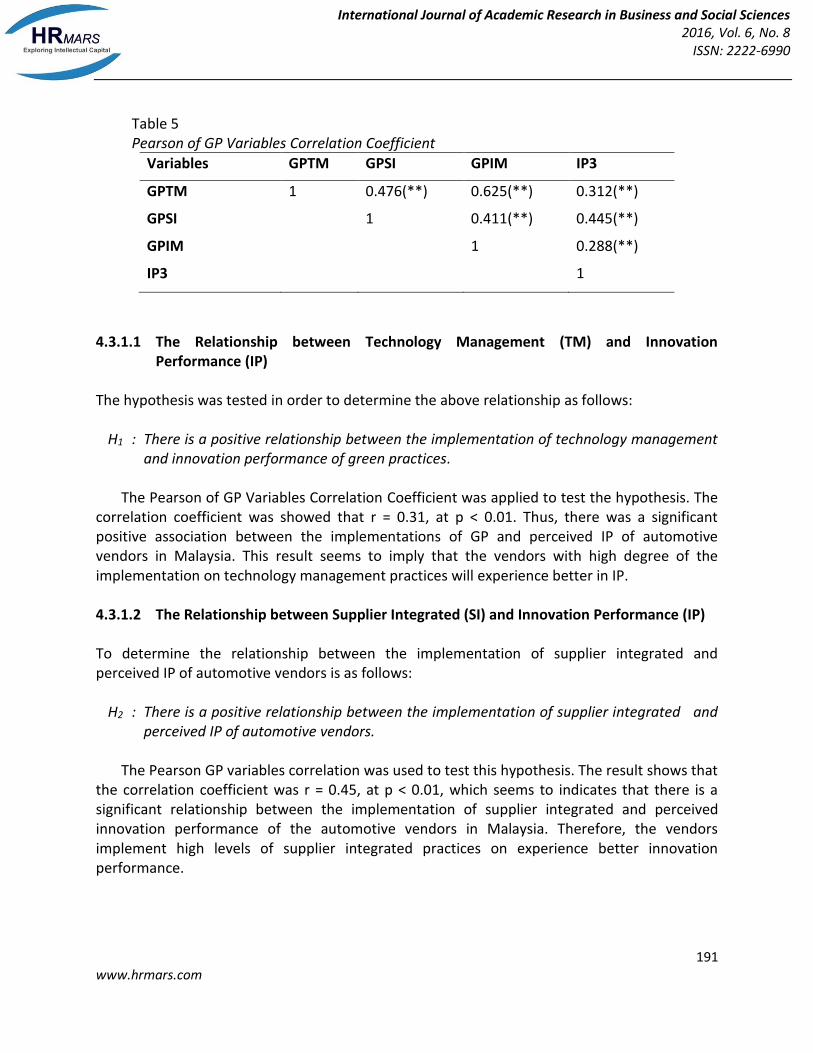
4.2.1.2 Rotated Component Matrix Results In EFA, discriminate validity shown the item loading is high towards related factor when compared to other factors. At least, 0.4 load for each item on respective actor is considered sufficient for the factor (Fullerton and Wempe, 2009). However, minimum of 0.5 fits cross-load items to various factors which are considered as sufficient (Ngai et al, 2004). The rotated component matrix assists to determine the represented component. Its assists the researcher to identify items that correlate the highest the lowest remaining factor. In this study, three factors for GP constructs were compared to the original construct from questionnaire. The first factor was made up of the five items from building SI including SI1, SI2, SI3, SI4, and SI5. No item was suggested to be removed. The second factor was classified as IM with three items (IM1, IM2 and IM3). There is no item was suggested to be removed. The third item was categorized as TM. This factor comprised of three items (TM1, TM2, and TM3). No item was suggested to be removed. The results of EFA exhibited three GP construct with 11 items. 4.3 Correlation 4.3.1 The Relationship between the GP and IP of the automotive vendors The Pearson of GP Variables Correlation Coefficients test was determined the association of the independent variables and dependent variable and test the hypothesis carried out. Table 5 represents the Pearson (r) of GP Variables Correlation Coefficient among the independent variables of the study. The results of the correlation reveal that the variables are statistically significant. The correlation coefficient ranges from 0.55 to 0.75, at p < 0.01. All the variables are correlated and statistically significant.
International Journal of Academic Research in Business and Social Sciences 2016, Vol. 6, No. 8
ISSN: 2222-6990
191 www.hrmars.com
Table 5 Pearson of GP Variables Correlation Coefficient
Variables GPTM GPSI GPIM IP3
GPTM 1 0.476(**) 0.625(**) 0.312(**)
GPSI 1 0.411(**) 0.445(**)
GPIM 1 0.288(**)
IP3 1
4.3.1.1 The Relationship between Technology Management (TM) and Innovation
Performance (IP) The hypothesis was tested in order to determine the above relationship as follows:
H1 : There is a positive relationship between the implementation of technology management and innovation performance of green practices.
The Pearson of GP Variables Correlation Coefficient was applied to test the hypothesis. The correlation coefficient was showed that r = 0.31, at p < 0.01. Thus, there was a significant positive association between the implementations of GP and perceived IP of automotive vendors in Malaysia. This result seems to imply that the vendors with high degree of the implementation on technology management practices will experience better in IP. 4.3.1.2 The Relationship between Supplier Integrated (SI) and Innovation Performance (IP) To determine the relationship between the implementation of supplier integrated and perceived IP of automotive vendors is as follows:
H2 : There is a positive relationship between the implementation of supplier integrated and perceived IP of automotive vendors.
The Pearson GP variables correlation was used to test this hypothesis. The result shows that the correlation coefficient was r = 0.45, at p < 0.01, which seems to indicates that there is a significant relationship between the implementation of supplier integrated and perceived innovation performance of the automotive vendors in Malaysia. Therefore, the vendors implement high levels of supplier integrated practices on experience better innovation performance.
International Journal of Academic Research in Business and Social Sciences 2016, Vol. 6, No. 8
ISSN: 2222-6990
192 www.hrmars.com
4.3.1.3 The Relationship between Internal Management (IM) and Innovation Performance (IP)
The hypothesis that follows is to determine the existence of a relationship between the implementation of IM and perceived IP of automotive vendors in Malaysia:
H3 : There is a positive relationship between the implementation of internal managemen and perceived innovation performance of automotive vendors.
Using the Pearson GPs variables correlation to determine the existence of the above relationship, the correlation coefficient was found that r = 0.29, at p < 0.01. The results revealed that there is a significant relationship between the implementation of IM of the vendors. Thus, the result suggests that the automotive vendors with high levels of the implementation of IM practices experience better IP. 4.4 Regression Analysis This section attempts to answer the research objective and the hypothesis (H4). This objective is to determine the aggregate effect of the independent variables (TM, SI and IM) and perceived IP of the automotive vendors in Malaysia. The formulated hypothesis is as follows: H4 : The implementation of GP (TM, SI and IM) is significantly and positively related to the
perceived business performance of the contractors. To test the hypothesis, multiple regression analysis was employed. Based on this method, a regression model was developed in determining the relationship of the variables. The model as follows: INNOVATION = β0 + β1TM + β2SI + β3IM + ԑ Where,
INNOVATION = Innovation Performance TM = Technology Management SI = Supplier Integrated IM = Internal Management β = constant, and ԑ = standard error.
Table 6 and table 7 exhibit the results of the multiple regression analysis.
International Journal of Academic Research in Business and Social Sciences 2016, Vol. 6, No. 8
ISSN: 2222-6990
193 www.hrmars.com
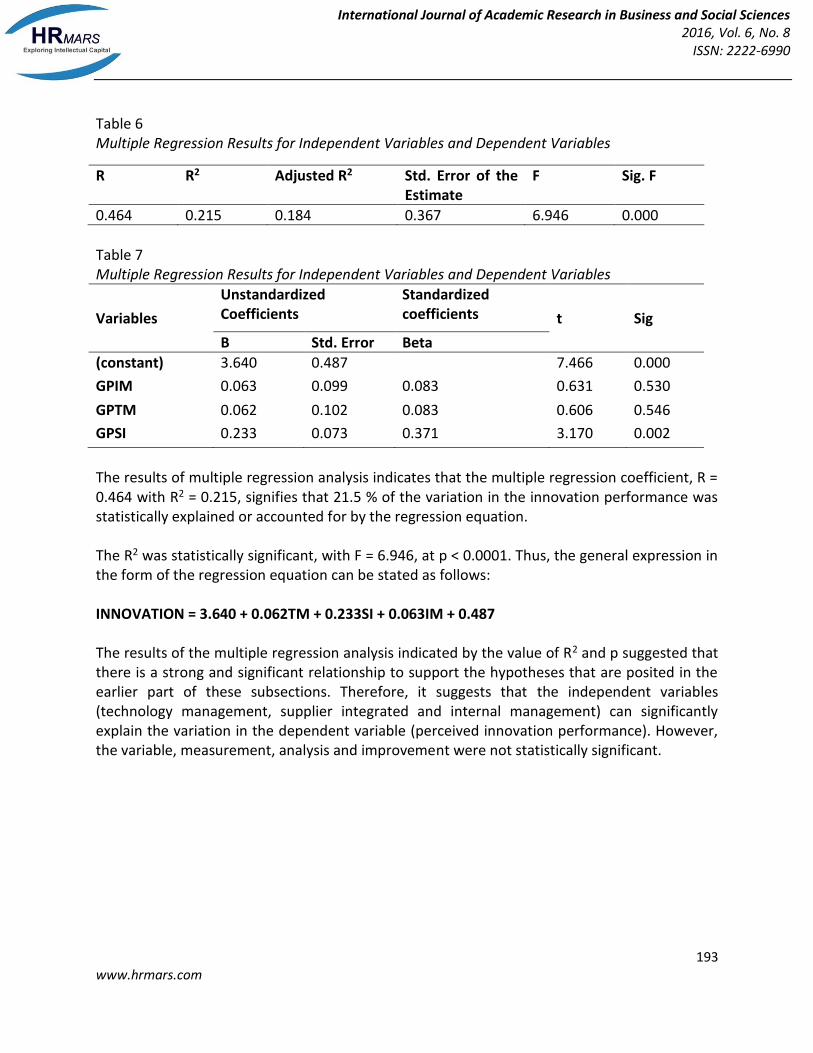
Table 6 Multiple Regression Results for Independent Variables and Dependent Variables
Table 7 Multiple Regression Results for Independent Variables and Dependent Variables
Variables
Unstandardized Coefficients
Standardized coefficients t Sig
B Std. Error Beta
(constant) 3.640 0.487 7.466 0.000
GPIM 0.063 0.099 0.083 0.631 0.530
GPTM 0.062 0.102 0.083 0.606 0.546
GPSI 0.233 0.073 0.371 3.170 0.002
The results of multiple regression analysis indicates that the multiple regression coefficient, R = 0.464 with R2 = 0.215, signifies that 21.5 % of the variation in the innovation performance was statistically explained or accounted for by the regression equation. The R2 was statistically significant, with F = 6.946, at p < 0.0001. Thus, the general expression in the form of the regression equation can be stated as follows: INNOVATION = 3.640 + 0.062TM + 0.233SI + 0.063IM + 0.487 The results of the multiple regression analysis indicated by the value of R2 and p suggested that there is a strong and significant relationship to support the hypotheses that are posited in the earlier part of these subsections. Therefore, it suggests that the independent variables (technology management, supplier integrated and internal management) can significantly explain the variation in the dependent variable (perceived innovation performance). However, the variable, measurement, analysis and improvement were not statistically significant.
R R2 Adjusted R2 Std. Error of the Estimate
F Sig. F
0.464 0.215 0.184 0.367 6.946 0.000
International Journal of Academic Research in Business and Social Sciences 2016, Vol. 6, No. 8
ISSN: 2222-6990
194 www.hrmars.com
4.5 Discussion In relation to the objective to identify the GP constructs and IP measures for Malaysian automotive industry, this study found that there is a significant relationship between implementation of TM, SI, and IM with the IP of SMEs on automotive industry in Malaysia. This can be seen from the results of a significant correlation of the independent variables (SI), where p <0.01 and p <0.05 except for the independent variable (IM, TM) which respectively p = 0.530 and p = 0546, p> 0.05. This study also found that there were positive associations between the implementation of TM, SI, IM and IP of SMEs on automotive industry in Malaysia with the R square = .215. These further strengthen the independent variable on the dependent variable of innovation performance. 5. Recommendation Since this study involved only SMEs, which represent the automotive industry, the results should be interpreted with regard to the limitations involved. With the existence of limitations in this study, the expected improvements can be made for the benefit and use in future studies. This includes in terms of data collection. A seven point scale was used in the questionnaire. All respondents were required to answer their perceptions to questions and statements in the questionnaire. Problems might encounter due to different perceptions and interpretations of statements and feeling among respondents. However, the reliability and validity test during pilot study helped to harmonies these problems, though it seems impossible to ensure all respondents answered and interpreted, using same definition of scales. Besides, this study adopted a quantitative approach in study design and analysis of data. Though this approach might not able to translate human’s feeling or perceptions into numbers, this approach is still acceptable in subjective measurement. Furthermore, the reliability test results revealed that each construct in this study had an acceptable value. Therefore the researcher suggests that in future research qualitative approach seems appropriate. A combination of both qualitative and quantitative approach, such as in-depth interview may have a good methodology and findings of the study. 6. Conclusions Although focused on a specific activity such as green manufacturing, and green building, past findings shows that GP have been implemented in the industry. Therefore, this study was undertaken to identify the relationship between the GP and IP in the Malaysian automotive industry. Hypotheses and research model is also constructed based on observations from previous studies. Researchers, providing questionnaire design quality to ensure the objectives of the study can be used to achieve as well as further study in the automotive industry.
International Journal of Academic Research in Business and Social Sciences 2016, Vol. 6, No. 8
ISSN: 2222-6990
195 www.hrmars.com
References Adler, R. W., & Reid, J. (2008). The effect of leadership styles and budget participation on job
satisfaction and job performance. Asia-Pacific Management Accounting Journal, 3(1), 21-45. Alex Krauer, Chairman & CEO Ciba-Geigy, Switzerland, cited in Milmo (1995:22). ASEAN Policy Blueprint for SME Development – APBSD, 2004-2014, Retrieved from
http://www.asean.org/archive/pdf/sme_blueprint.pdf Assink, M. (2006), Inhibitors of disruptive innovation capability: a conceptual model, European
Journal of Innovation Management, 9(2), 215-233. Breno Nunes & David Bennett (2010), Green operations initiatives in the automotive industry,
Benchmarking: An International Journal, Vol 17. No 3, 396-420. Cumming B. S. (1998), Innovation overview and future challenges. European Journal of
Innovation Management, 1(1), 21-30. Damanpour, F., (1996), Organizational complexity and innovation: developing and testing
multiple contingency models, Management Science, 42(5), 693-716. DeCoster, J. (2004). Data Analysis in SPSS. Retrieved from http://www.stat-
help.com/notes.html Fullerton, R. R., & Wempe, W. F. (2009). Lean Manufacturing, non-financial performance
measures, and financial performance. International Journal of Operations and Production Management, 29 (3), 214-240.
Habidin, N. F., Salleh, M. I., Latip, N. A. M., Azman, M. N. A., & Fuzi, N. M. (2015). Confirmatory factor analysis of flexibility supply chain for Malaysian automotive suppliers. Sains Humanika, 7(1), 1-7.
Habidin, N. F., Salleh, M. I., Latip, N. A. M., Azman, M. N. A., & Fuzi, N. M. (2016). Lean six sigma performance improvement tool for automotive suppliers. Journal of Industrial and Production Engineering, 33(4), 215-235.
Habidin, N. F., Zubir, A. F. M., Fuzi, N. M., Latip, N. A. M., & Azman, M. N. A. (2015). Sustainable Performance Measures for Malaysian Automotive Industry. World Applied Sciences Journal, 33(6), 1017-1024.
Johne, A., (1999), Successful market innovation, European Journal of Innovation, 2(1), pp. 6-10. Leonard-Barton, D., (1995), Wellsprings of Knowledge: Building and Sustaining the Sources of
Innovation, Harvard Business School Press, Boston, MA. Ministry of International Trade and Industry, (MITI), (2009), Review of National Automotive
Policy. Retrieved from http://www.miti.gov.my/ Mullen, T. P., & Lyles, M.A., (1993). Toward improving management development’s
contribution to organizational learning, Human Resource Planning, 16(2), 35-49 Ngai, E. W. T., Cheng, T. C. E. & Ho, S. S. M. (2004). Critical success factors of web-based supply
chan management system using exploratory factor analysis. Production, Planning and Control, 5(6), 622-639.
Ragayah Haji Mat Zin (2007). Heavy Industry, dlm H. Osman Rani (pnyt.), The Encyclopedia of Malaysia: The Economy. Singapore: Editions Didier Millet.
International Journal of Academic Research in Business and Social Sciences 2016, Vol. 6, No. 8
ISSN: 2222-6990
196 www.hrmars.com
Tinsley, H. E. A., & Tinsley, D. J. (1987). Use of Factor Analysis in counseling psychology research. Journal of Counseling Psychology, 34, 414-424.
Zakuan, N., Yusof, S. M., & Shaharoun, A. M, (2009). The Link Between Total Quality Management and Organizational Performance in Malaysian Automotive Industry: The mediating role of ISO/TS16949 efforts. Proceeding of the IEEE IEEM, Hong Kong, 439-443.
1*Corresponding Author: Nurul Fadly Habidin E-mail: [email protected]