Embed Size (px)
Citation preview

THE RELATIONSHIP BETWEEN CRASH SEVERITY AND
INCOMPATIBILITY IN FRONTAL CRASHES
A CIREN CENTERTHE WILLIAM LEHMAN INJURY RESEARCH CENTER
Jeffrey S. Augenstein, Kennerly Digges, George Bahouth., James Stratton, Elana Perdeck, Jerry Phillips, Jeffrey Mackinnon, and Luis
Labiste, M.D.Professor of Surgery
Director, WLIRC

Incompatibility IssuesIncompatibility Issues
• Mass difference is a well known incompatibility
• Other incompatibilities - Stiffness & Geometry
• Regulations to control stiffness and geometry under consideration
• What role does stiffness and geometry play in real world crashes?
• Would control of stiffness and geometry in barrier crashes provide real world benefits?

Past NHTSA ResearchPast NHTSA Research
• Analysis of FARS car to truck crashes showed passenger cars occupants at disadvantage
• Barrier crash data shows light trucks are stiffer and have higher center of force
• Analysis of FARS car to truck crashes showed passenger cars occupants at disadvantage
• Barrier crash data shows light trucks are stiffer and have higher center of force

NCAP Test into Load Cell Barrier

NHTSA’s Load Cell Barrier Face
NHTSA’s Load Cell Barrier Face
2108 mm
984 mm
Height : 66 mm
Group 4 Group 5 Group 6
Group 1 Group 2 Group 3
D1 D2 D3 D4 D5 D6 D7 D8 D9
C1 C2 C3 C4 C5 C6 C7 C8 C9 B1 B2 B3 B4 B5 B6 B7 B8 B9
A1 A2 A3 A4 A5 A6 A7 A8 A9
2108 mm
984 mm
Height : 66 mm
Group 4 Group 5 Group 6
Group 1 Group 2 Group 3
D1 D2 D3 D4 D5 D6 D7 D8 D9
C1 C2 C3 C4 C5 C6 C7 C8 C9 B1 B2 B3 B4 B5 B6 B7 B8 B9
A1 A2 A3 A4 A5 A6 A7 A8 A9

Barrier Force Data
250 mm Crush
Barrier Force Data
250 mm Crush
1L 2L 3L 4C 5C 6C 7R 8R 9R
A LoB Lo
C HiD Hi
0
10
20
30
40
50
60B
arri
er F
orce
, Kn
1L 2L 3L 4C 5C 6C 7R 8R 9R
A LoB Lo
C HiD Hi
0
10
20
30
40
50
60
Bar
rier
For
ce, K
n
DodgeNeon
GrandCherokee

Barrier Footprint - 250 mm CrushBarrier Footprint - 250 mm Crush
GrandCheroke
e
Dodge Neon
GrandCheroke
e
Dodge Neon
1L 2L 3L 4C 5C 6C 7R 8R 9RA Lo
B Lo
C Hi
D Hi
0.0%-5.0% 5.0%-10.0% 10.0%-15.0%
1L 2L 3L 4C 5C 6C 7R 8R 9RA Lo
B Lo
C Hi
D Hi
0%-5% 5%-10% 10%-15% 15%-20% 20%-25%

Definition of Force Center
Definition of Force Center
F is “Resultant Force”
H is “ Force Center”
F is “Resultant Force”
H is “ Force Center”HH
F
Barrier Face
Fn
Ground

Stiffness and Center of Force from NCAP Barrier
Force Measurements
Stiffness and Center of Force from NCAP Barrier
Force Measurements
500
750
1000
1250
1500
1750
2000
2250
400 500 600 700 800
Center of Force, mm
Sti
ffn
es
s N
/mm
Car SUV PU Van
Comparison Of Load Cell Barrier Forces for Typical Car and LTV
2108 mm
984 mm
Height : 66mm
Group 4 Group 5 Group 6
Group 1 Group 2 Group 3
D1 D2 D3 D4 D5 D6 D7 D8 D9
C1 C2 C3 C4 C5 C6 C7 C8 C9
B1 B2 B3 B4 B5 B6 B7 B8 B9
A1 A2 A3 A4 A5 A6 A7 A8 A9
Examination of Barrier Force Compatibility in the “B” Row
B Row
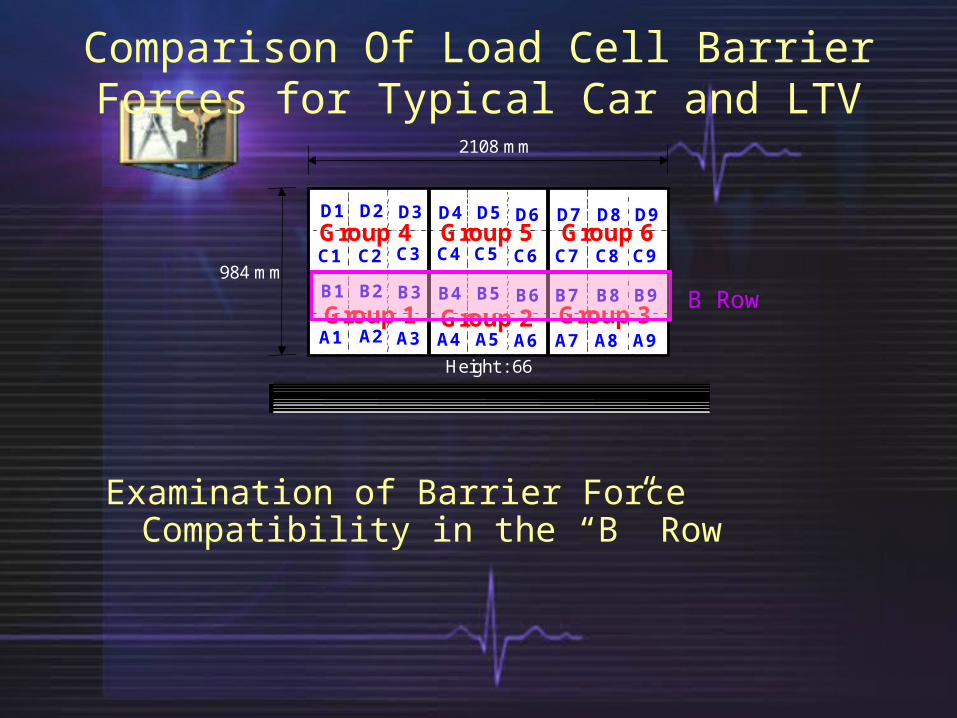
Barrier Force -Neon
1 2 3 4 56
78
9 A B
CD
0
100
200
300
400
500
600
Barrier Force, Kn
Columns
Rows
A B C D

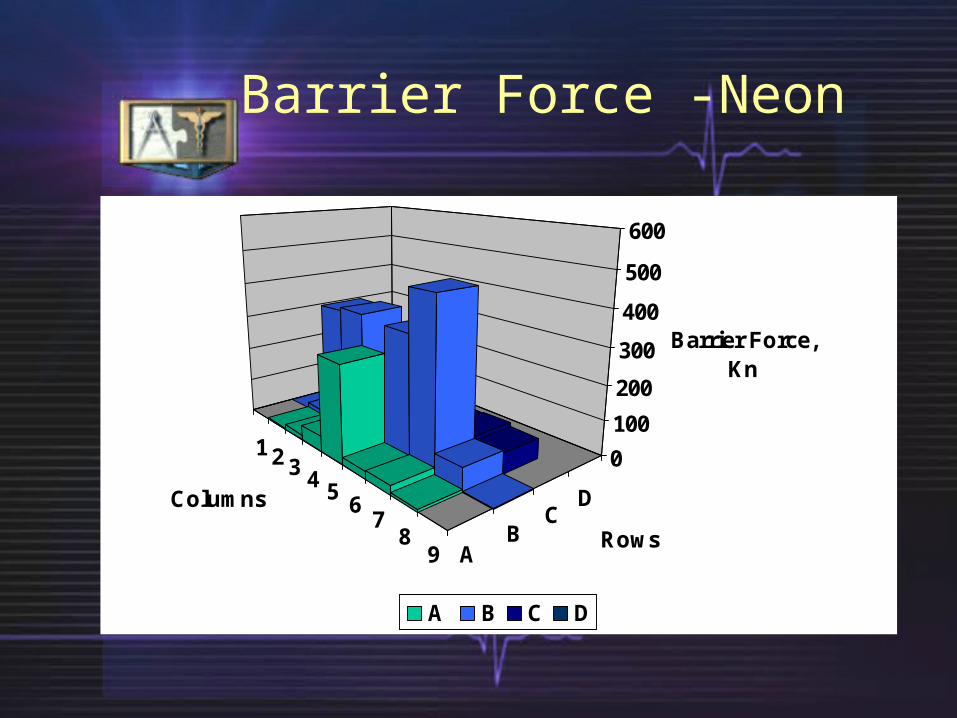
Barrier Force - Cherokee
1 2 3 4 56
78
9 A B
CD
0
100
200
300
400
500
600
Barrier Force, Kn
Columns
Rows
A B C D

Barrier Force vs. Vehicle Crush
All Load Cell Rows
Barrier Force vs. Vehicle Crush
All Load Cell Rows
0
100
200
300
400
500
0 100 200 300 400
Vehicle Crush, mm.
Barr
ier
Fo
rce,
Kn
Neon
Cherokee
0
100
200
300
400
500
0 100 200 300 400
Vehicle Crush, mm.
Barr
ier
Fo
rce,
Kn
Neon
Cherokee
Barrier Force vs. Vehicle Crush
Only ‘B’ Load Cell Row
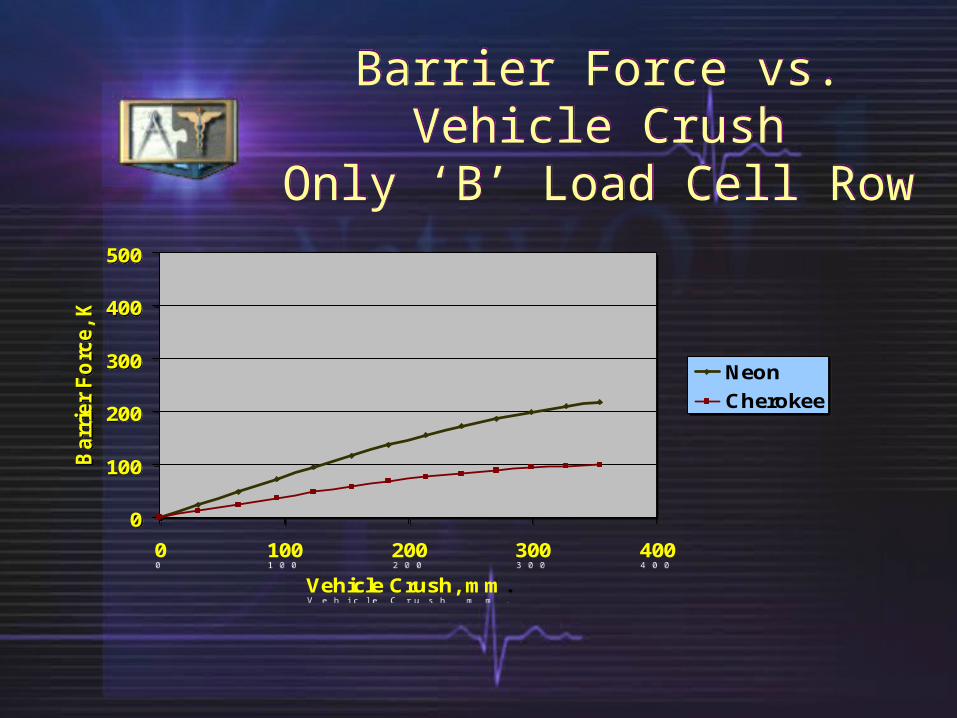
Barrier Force vs. Vehicle Crush
Only ‘B’ Load Cell Row
0
100
200
300
400
500
0 100 200 300 400
Vehicle Crush, mm.
Barr
ier
Fo
rce,
Kn
Neon
Cherokee
0
100
200
300
400
500
0 100 200 300 400
Vehicle Crush, mm.
Barr
ier
Fo
rce,
Kn
Neon
Cherokee

Observation
• Max force of most cars in “B” row• May produce forces of greater magnitude
than SUV forces in the “B” row• Mismatch may reduce stiffness mismatch
in lower severity crashes – until occupant compartment intrusion occurs
• Injuries will be intrusion related rather than acceleration related
• Lower limbs most vulnerable

Research Questions
Does the higher center-of-force on light trucks lead to reduced injury risk in cars when the crash severity is low?
What happens to the injury risk in high severity car-to-LTV crashes?
What is the role of intrusion vs. acceleration in car-to-LTV crashes?

Data for NASS/CDS StudySAE 2001
1997 & 1998 Car to LTV Frontal CrashesCrush Measurements on Both VehiclesPictures of Both VehiclesDelta-V Known for Both VehiclesInjury Data for Occupants Available44 Cases23 with MAIS 3+ Injuries to Car Drivers

NASS Case Study of Car Drivers
23 Cases with MAIS 3+
9 injuries with no compatibility influence
5 cases with injuries explained by mass5 cases in which geometry or stiffness
were influential factors increasing injuries
4 cases in which geometric incompatibility may have decreased or prevented injuries
All MAIS 3+ injuries at lower Delta-V were lower limb injuries

Examination of Frontal Crashes in NASS 1997-
2000• Distribution• Injury risk
• Car-to-car• Car-to-LTV
• Above 20 mph• Below 20 mph

Distribution of Crashes Above and Below 20 mph
Car-Car %
52%
48% < 20 MPH
> 20 MPH
Car-LTV %
17%
83%
< 20 MPH
> 20 MPH

Injury Rate for Car-to-Car and Car-to-LTV Frontal
Crashes
-5
10152025
< 20 MPH > 20 MPH
Crash Severity
Rat
e of
MA
IS 3
+ In
jurie
s/10
0 Ex
pose
d
Car-Car
Car-LTV

Crash Investigation to Examine Effect of
Geometric and Stiffness Compatibility
To evaluate the effect of stiffness and geometry
• Need to collect data on POV• Need to document underride/override• Need to evaluate frequency of intrusion vs
acceleration injuries• Need to document frame deformation
modes

Ramrod Effect of Frame
Ramrod Effect of Frame

Vehicle OverrideVehicle Override

Lehman Center Cases to Examine LTV’s
in Frontal Collisions with Passenger Cars
Lehman Center Cases to Examine LTV’s
in Frontal Collisions with Passenger Cars

MODERATE SEVERITY CRASH
1998 Chrysler SebringVS
2001 Ford F-250

CASE SUBJECT
• Passenger
• Belted
• Air bag deployed
• Female
• 54 years old
• 185lbs
• 5’5”
Case subject was traveling with spouse when crash occurred

SCENE
Chrysler Sebring south approach

EXTERIOR CHRYSLER SEBRING DAMAGE
Left front quarter view
Right sideReduction in
wheelbase 6.7”

Exterior Chrysler Sebring Comparison

Interior Chrysler Sebring Damage
Left front overview
Passenger area with “Leg”Passenger toepan intrusion 13”

Interior Chrysler Sebring Comparison

Injuries

Glove box door
Left femur fracture
AIS 3

ToepanLeft tib/fib fracture
AIS 2

ToepanRight ankle fracture
AIS 2

CONTACTS SUMMARY
• Fracture, Right Midshaft Femur AIS 3
Glove Box Door• Fracture, Left Distal Tibia AIS 2
Right Toe pan• Fracture, Left Distal Fibula AIS 2
Right Toe Pan• Fracture, Right Ankle AIS 1
Right Toe Pan• Contusion, Right Knee AIS 1
Glove Box Door• Fracture, Left Rib AIS 1
Belt Restraint• Contusion, Left Breast AIS 1
Belt Restraint

Comparison of Vehicle Dimensions
1998 Chrysler Sebring 2001 Ford F-250
Bumper Height: 25” Bumper Height: 31.25”
Frame Rail Upper: 20.25” Frame Rail Upper: 29”
Frame Rail Lower: 16.5” Frame Rail Lower: 23.5”
Mass: 2908lb Mass: 5635lb
Stiffness: Moderate Stiffness: Very High

Case Significance
• 25 mph crash with – 13” of pass toepan intrusion– 0” of driver toepan intrusion
• Driver OK – low intrusion
• Passenger with lower extremity injuries due to intrusion
• No head or chest injuries
• Incompatibility increased intrusion
• Incompatibility may have prevented head and chest injuries to driver and passenger

Moderate Severity Crash
2000 Nissan MaximaVS
1996 Ford Aerostar

Case Subject
• Driver
• Male
• Unbelted
•Air bag deployed
• 45 years old
• 185lbs
• 5’11”
Case subject was under the influence of alcohol when this
late night crash occurred

Scene
Nissan Maxima
north approach

Exterior Nissan Maxima Damage
Frontal view
DeltaV: 25.6mph
Max crush:18.1”
Position: C6
PDOF: 1 o’clock
WheelbasePre: 108.1” Post: 101.9”
Reduction:6.4”

Exterior Nissan Maxima Damage
Lateral view from rightLeft front quarter view

Exterior Nissan Maxima Comparison
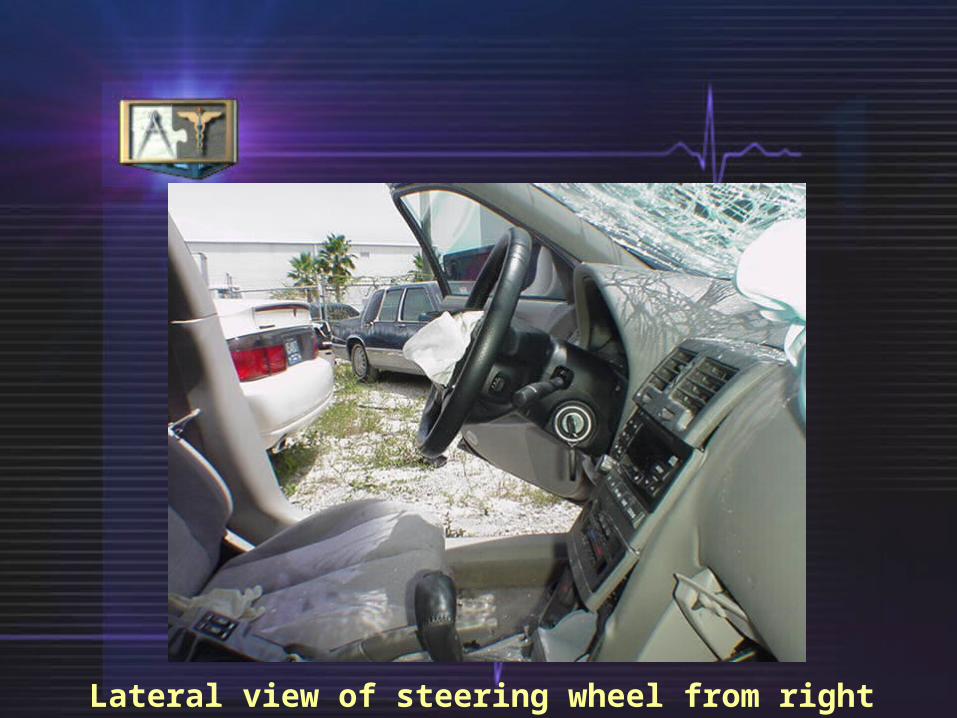
Lateral view of steering wheel from right

Interior Nissan Maxima Comparison
No driver toepan intrusion!

Injuries

Injury Overview

Contacts Summary
Fracture, Left & right femursAIS 3
Knee bolsterFracture, Left 5th & 6th RibAIS 2
Driver air bagAbrasion, Forehead AIS 1
WindshieldAbrasion, Right elbowAIS 1
WindshieldAbrasion, Left & right shin AIS 1
Left instrument panel and below

Contacts Summary
Fracture, Left & right femursAIS 3
Knee bolsterFracture, Left 5th & 6th RibAIS 2
Driver air bagAbrasion, Forehead AIS 1
WindshieldAbrasion, Right elbowAIS 1
WindshieldAbrasion, Left & right shin AIS 1
Left instrument panel and below

Comparison of Vehicle Dimensions
2000 Nissan Maxima 1996 Ford Aerostar
Bumper Height:28.25” Bumper Height: 23”
Frame Rail Upper: 21.5” Frame Rail Upper: 21.5”
Frame Rail Lower: 15.5” Frame Rail Lower: 15.75”
Mass: 3294lb Mass:3500lb
Stiffness: Moderate Stiffness: High
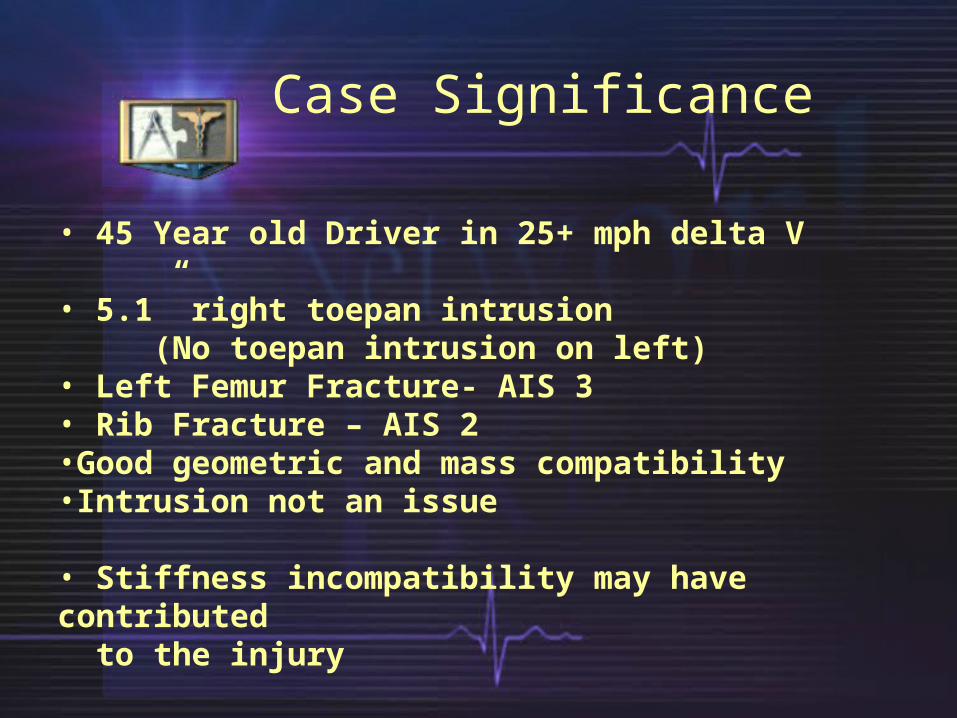
Case Significance
• 45 Year old Driver in 25+ mph delta V
• 5.1” right toepan intrusion (No toepan intrusion on left)
• Left Femur Fracture- AIS 3• Rib Fracture – AIS 2•Good geometric and mass compatibility•Intrusion not an issue
• Stiffness incompatibility may have contributed to the injury

HIGH SEVERITY CRASH
1996 Hyundai AccentVS
1997 Kia Sportage
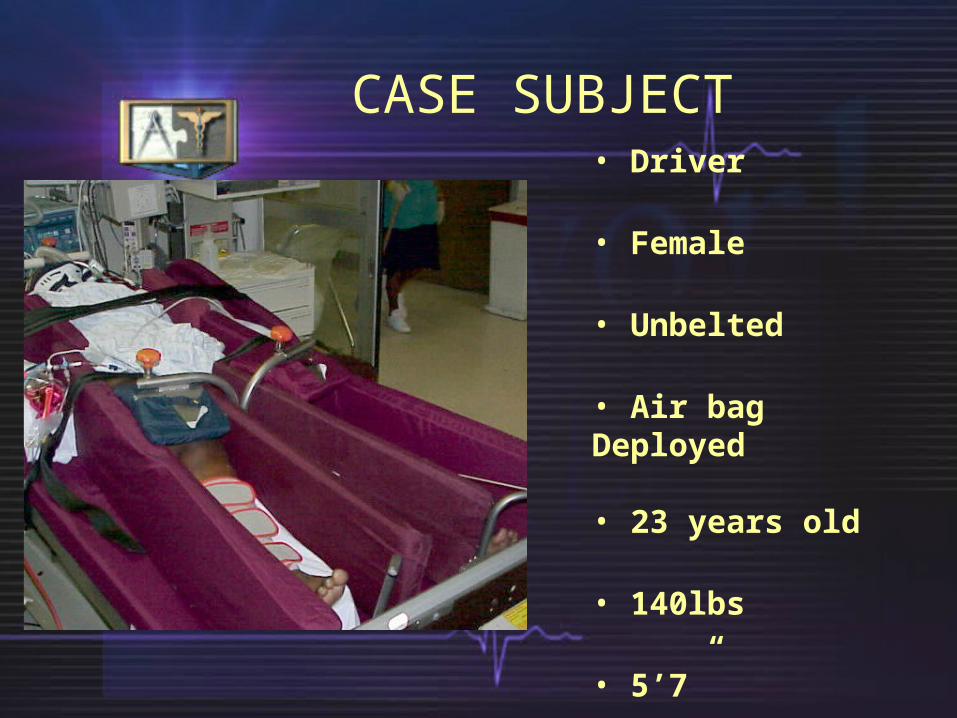
CASE SUBJECT• Driver
• Female
• Unbelted
• Air bag Deployed
• 23 years old
• 140lbs
• 5’7”

Scene

EXTERIOR HYUNDAI ACCENT DAMAGE
Frontal view
DeltaV: 35mph
Max crush: 33”
Position: C1
PDOF: 12 o’clock
WheelbasePre: 95.4” Post: 71”
Reduction: 24.4”

EXTERIOR HYUNDAI ACCENT COMPARISON

HYUNDAI ACCENT EXTERIOR DAMAGE
Frontal view
DeltaV: 24mph
Max crush: 27”
Position: C1
PDOF: 12 o’clock
WheelbasePre: 104.3 Post: 87”
Reduction: 17”

Comparison of Vehicles
POV – Kia SportageCase Vehicle -Hyundai Accent

INTERIOR HYUNDAI ACCENT COMPARISON

INTERIOR HYUNDAI ACCENT DAMAGE
Right front overview

INTERIOR HYUNDAI ACCENT DAMAGE
Instrument panel

INTERIOR HYUNDAI ACCENT DAMAGE
Left instrument panel intrusion 15”
INTERIOR HYUNDAI ACCENT DAMAGE
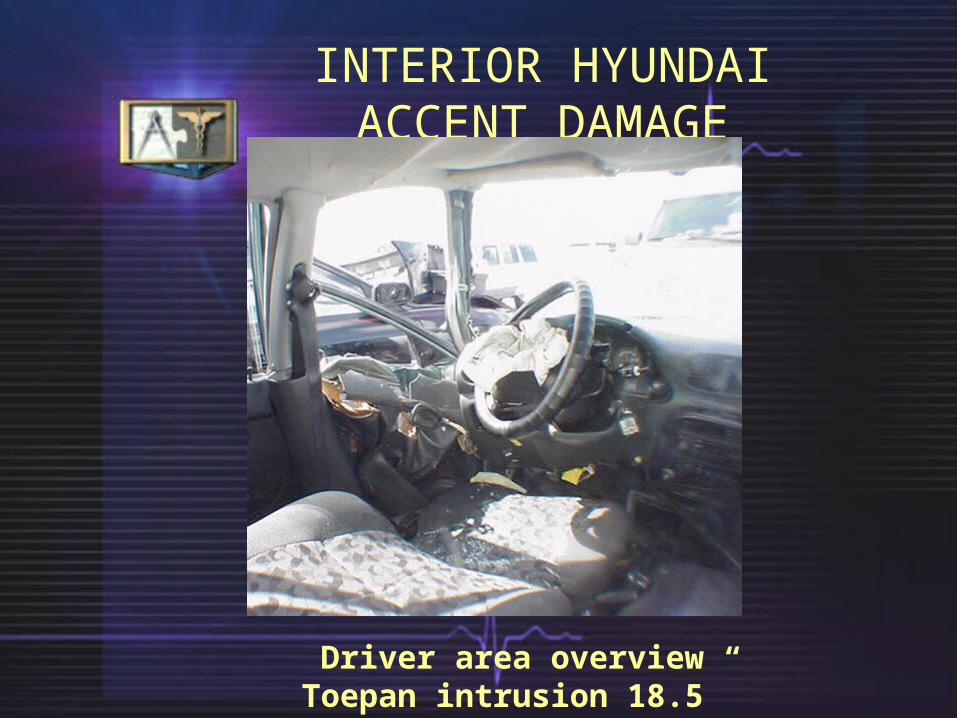
Driver area overviewToepan intrusion 18.5”

INTERIOR HYUNDAI ACCENT DAMAGE
Knee bolster

INTERIOR HYUNDAI ACCENT DAMAGE
Driver air bag
INTERIOR HYUNDAI ACCENT DAMAGE
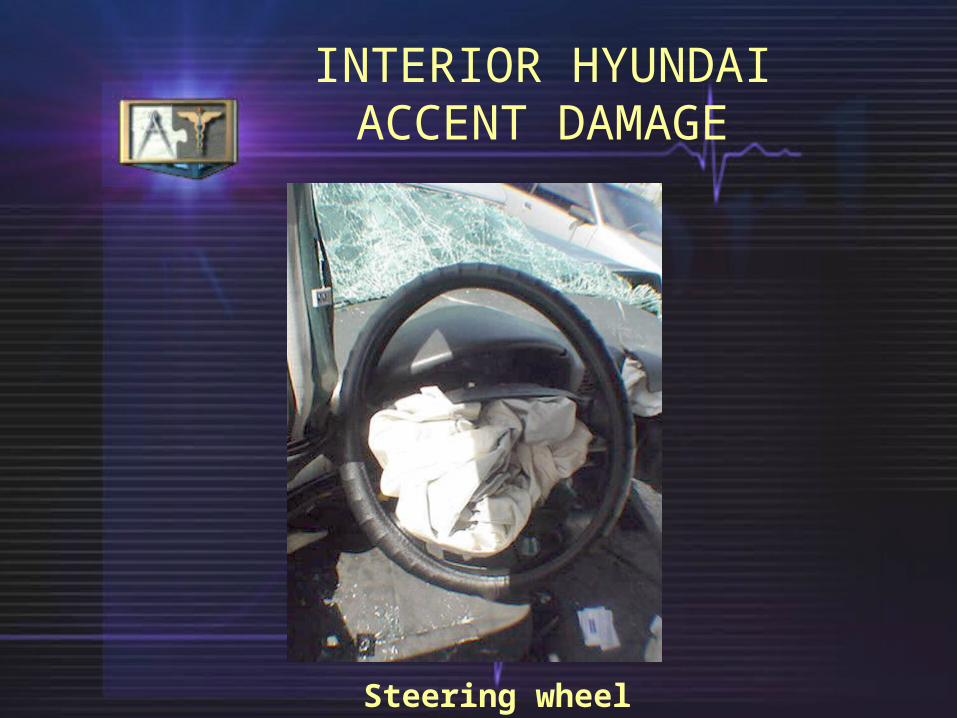
Steering wheel

INTERIOR HYUNDAI ACCENT DAMAGE
Driver area overview

Injuries

Injury Overview

A pillar
Left radius & ulnar fx
AIS 3

Knee bolsterLeft femur fx
AIS 3

Left side interior surface
Bilateral inferior pubis rami fx
AIS 2

Left side interior surfaceLeft radius & ulnar fx
AIS 3

Contacts Summary
Fracture, Left femur AIS 3Knee bolster
Fracture, Left ulna AIS 3Left A pillar
Fracture, Left radius AIS 3Left A pillar
Fracture, Third cervical vertebra AIS 3Left A pillar
Hemorrhage, Subarachnoid space AIS 3Left A pillar
Contusion, Frontal Lobe AIS 3Left A pillar

Contacts Summary
Fracture, Anterior maxillaAIS 2
Left A pillar
Fracture, Fourth cervical vertebraAIS 2
Left A pillar
Laceration, Spleen AIS 2
Left side hardware & armrest
Fracture, Bilateral pubis rami AIS 2
Left side interior surface excluding hardware & armrest

Comparison of Vehicle Dimensions
1996 Hyundai Accent 1997 Kia Sportage
Bumper Height: 21” Bumper Height: 25.5”
Frame Rail Upper: 19.75” Frame Rail Upper: 19”
Frame Rail Lower: 15 Frame Rail Lower: 15.25”
Mass: 2105lb Mass: 3280lb
Stiffness: Moderate Stiffness: Moderate

Case Significance
•Two vehicles with good geometric and stiffness compatibility
•Differences in vehicle masses 2100 vs 3300
•Lesson: Matching geometry and stiffness may not compensate for mass differences

Conclusions
• Low and moderate severity cases with poor geometric compatibility have primarily lower limb injuries
• Intrusion of the toepan is frequently, but not always a factor in lower extremity injuries
• High severity case had good geometric compatibility – mass difference was a primary factor for extensive intrusion - injuries
Observations
Control of stiffness and geometry may not offset mass differences
Geometric mis-match may be beneficial at lower DeltaV – Until intrusion occurs
Stiffness and geometry control need to consider load in the “B” row
Further analysis of CIREN cases would be beneficial to understanding compatibility

Lehman Incompatibility Investigation ProceduresLehman Incompatibility Investigation Procedures
• Developed methods of documenting structural interaction in front-to-front crashes between cars and light trucks– Underride and override– Ram-rod damage the stiff frame– Bending vs. compression of frame
elements– Crashes that are unlike barrier
crashes– Unexpected outcomes
• Developed methods of documenting structural interaction in front-to-front crashes between cars and light trucks– Underride and override– Ram-rod damage the stiff frame– Bending vs. compression of frame
elements– Crashes that are unlike barrier
crashes– Unexpected outcomes

RecommendationsRecommendations
• Analysis of CIREN cases needed to understand the role of stiffness and geometry in real world crashes
• Enhanced case documentation required
• POV capture and documentation necessary
• Incorporate NCAP data on stiffness and geometry
• Analysis of CIREN cases needed to understand the role of stiffness and geometry in real world crashes
• Enhanced case documentation required
• POV capture and documentation necessary
• Incorporate NCAP data on stiffness and geometry