Embed Size (px)
Citation preview
University of New MexicoUNM Digital Repository
Health, Exercise, and Sports Sciences ETDs Education ETDs
Fall 12-15-2018
THE RELATIONSHIP BETWEENCHALLENGE COURSES AND THEChristopher LunaUniversity of New Mexico - Main Campus
Follow this and additional works at: https://digitalrepository.unm.edu/educ_hess_etds
Part of the Curriculum and Instruction Commons, Educational Psychology Commons, and theHealth and Physical Education Commons
This Dissertation is brought to you for free and open access by the Education ETDs at UNM Digital Repository. It has been accepted for inclusion inHealth, Exercise, and Sports Sciences ETDs by an authorized administrator of UNM Digital Repository. For more information, please [email protected].
Recommended CitationLuna, Christopher. "THE RELATIONSHIP BETWEEN CHALLENGE COURSES AND THE." (2018).https://digitalrepository.unm.edu/educ_hess_etds/102

Christopher Luna Candidate
Health, Exercise, & Sports Sciences
Department
This dissertation is approved, and it is acceptable in quality and form for publication
Approved by the Dissertation Committee:
Gloria Napper-Owen, Chairperson
Renee Delgado-Riley
Carolyn Hushman
Glenn Hushman
THE RELATIONSHIP BETWEEN CHALLENGE COURSES AND THE
SELF-CONCEPT OF FIRST-GENERATION COLLEGE STUDENTS
By
CHRISTOPHER L. LUNA
B.S., Physical Education, University of New Mexico, 2008
M.S., Physical Education, University of New Mexico, 2010
DISSERTATION
Submitted in Partial Fulfillment of the
Requirements for the Degree of
Doctor of Philosophy
Physical Education, Sport and Exercise Sciences
The University of New Mexico
Albuquerque, New Mexico
December 2018
iii
ACKNOWLEDGEMENTS
I owe the completion of this dissertation to the persistence and care of my
dedicated committee. Dr. Napper-Owen, thank you for believing in me; thank you for
investing in me. Your mentorship has meant a lifetime of opportunity for me and has
opened the doors for me to reach students in ways I would never have imagined. Dr.
Carolyn Hushman, thank you for being my guiding light when I could not see ahead. I
will never have the words to thank you; I will do so with intentional actions. Dr. Glenn
Hushman, thank you for your calming reassurance that hard work would be the way to
enlightenment. Dr. Delgado-Riley, your perspective among all of my confusion was the
soothing voice that I needed. A special thank you to Dr. Ulrike Kerstges who taught me
the reflective practices that have served as a foundation for all that I do in education and
life.
I would not have the courage to face this challenge without the work ethic and
confidence taught by my mother Leona. My father David taught me to play catch with
every ball thrown my way. I hope I have made both of my parents proud. I understand the
sacrifices made for me to bring this one back home.
My wife and my children have endured the dissertation process and all of the
agony that has accompanied my growth. Crystal, thank you for always making me feel
like I was one-step away and believing in my work. For my children Bella, Jacob, and
Adam this one will always be yours. Generations of our ancestors were born with a
shovel in their hands. We are born of indentured slaves and servants, and their suffering
was not in loss. They knew that one day there would be a generation of kids in our family

iv
whose only job would be to go to school. We are those kids! We will honor their sacrifice
by dedicating ourselves to the enlightened disciplines of higher education.

v
THE RELATIONSHIP BETWEEN CHALLENGE COURSES AND THE SELF-
CONCEPT OF FIRST-GENERATION COLLEGE STUDENTS
By
CHRISTOPHER LUNA
B.S., Physical Education, University of New Mexico, 2008
M.S., Physical Education, University of New Mexico, 2010
Ph.D., Physical Education, University of New Mexico, 2018
ABSTRACT
There has been an increasing demand among education agencies to utilize
challenge courses, also known as ropes courses, for personal growth opportunities among
students of all ages. Teachers often tell students how they want students to work as a
“team” and “get along” without providing the experiences for them to practice such
behaviors. A low ropes experience allows students to practice cooperative skills. The
focus of garnering participants for this study was to identify a specific target of first-
generation college students from two separate classroom settings. The research focused
on identifying the relationship between first-generation college students and low ropes
course experiences regarding the views of self-concept. Self-Concept was measured
using nine sub-scales from the Tennessee Self-Concept Scale 2 (TSCS:2). The data
revealed that the main effect of time was significant, F(1,89) = 10.28, p = 0.002. This
valuable finding suggests that time on a ropes course increases Total self-concept. The
interaction between time of TSCS:2 survey administration and condition was significant,
F(1,89) = 6.71, p = 0.01. The implication of findings suggests that when these students
were exposed to low ropes course experiences positive change in self-concept occurred.

vi
Table of Contents
ACKNOWLEDGEMENTS ............................................................................................... iii
ABSTRACT ........................................................................................................................ v
CHAPTER I Introduction ................................................................................................... 1
Ropes Course Background .................................................................................. 1
First-Generation College Students ...................................................................... 5
Statement of the Problem .................................................................................... 6
Purpose of the Study ........................................................................................... 7
Research Questions ............................................................................................. 8
Assumptions ...................................................................................................... 10
Significance of the Study .................................................................................. 10
Limitations ........................................................................................................ 12
Delimitations ..................................................................................................... 13
Definition of Terms ........................................................................................... 13
CHAPTER II Literature Review ....................................................................................... 16
Self-Concept ..................................................................................................... 22
First-Generation Students ................................................................................. 23
CHAPTER III Methods .................................................................................................... 26
Power Analysis.................................................................................................. 26
Participants ........................................................................................................ 27

vii
Design ............................................................................................................... 28
Approval Process .............................................................................................. 28
Instrument ......................................................................................................... 29
Survey ........................................................................................................... 29
Reliability ...................................................................................................... 35
Procedures ......................................................................................................... 36
Positionality ...................................................................................................... 38
Analysis............................................................................................................. 40
CHAPTER IV Results ...................................................................................................... 43
Analysis of Treatment ....................................................................................... 43
Description of Study Participants ..................................................................... 44
Demographic Information ................................................................................. 45
Statistical Findings ............................................................................................ 45
Assumptions .................................................................................................. 45
Primary Analysis ............................................................................................... 46
CHAPTER V Discussion ................................................................................................. 52
Study Overview ................................................................................................ 52
Limitations ........................................................................................................ 56
Recommendations for Future Research ............................................................ 59
Conclusion ........................................................................................................ 60
viii
Appendix A Analysis of the Test for Normality ................................................................ 63
Appendix B Test for Homogeneity of Variance ................................................................ 81
Appendix C Tests of Within-Subjects Effects ................................................................... 82
Appendix D Tests of Between Subjects Effects ................................................................ 84
Appendix E Demographic Information ............................................................................ 86
Appendix H IRB Consent Form ....................................................................................... 91
Appendix I IRB Approved Assent Form ........................................................................... 93
Appendix J IRB Project Information Form ...................................................................... 94
Appendix K Department Review ...................................................................................... 97
Appendix L IRB Project Closure ...................................................................................... 98
References ......................................................................................................................... 99

ix
List of Tables
Table 1 Scales on the Tennessee Self-Concept Scale-Second Edition .............................. 31
Table 2 Means for all conditions LRC on self-concept outcome measures……....…….45
Table 3 Demographics by group and level of grade ....................................................... 44
Table 4 Gender frequency distribution of participants by research group ....................... 44
Table 5 Ethnic distribution ............................................................................................... 45

x
List of Figures
Figure 1. Low Ropes Group Research Schedule .............................................................. 37
Figure 2. No-Low Ropes Research Schedule ................................................................... 37
Figure 3. Estimated marginal means for DV Total ........................................................... 51

1
CHAPTER I
Introduction
Ropes Course Background
For several decades, there has been an increasing demand by organizations to get
its stakeholders involved in challenge courses, also known as ropes courses, or outdoor
adventure activities. Organizational leaders continually look at challenge courses to
develop human capital, which is evidenced by nearly 15,000 courses operating today in
the United States alone (Attarian, 2001). The earliest forms of challenge courses centered
on the self-efficacious domain of participants (Hahn, 1970). Like many kinesthetic
disciplines, challenge courses were inspired out of military practice. Outward Bound
opened the first organized challenge courses in the United States that were inspired by the
British Military and modified for civilian use with a mission to build confidence through
the completion of a series of complex team and individual challenges. These activities
were designed to test the minds and bodies of participants and encourage them to take
risks and trust in a team concept (Hogan, 1968). Subsequently, the modern era of
challenge courses was pioneered by an organization called Project Adventure.
Project Adventure was established to produce school-based cooperative adventure
learning activities inspired by Outward Bound curriculum (Prouty, 1990). Challenge
courses were used as learning tools for student development, giving way to the modern
era of challenge courses beginning in the early 90’s. By this time, a sequence of
strategically aligned activities were codified to deliver enjoyable experiential educational
training activities applicable in a variety of situations. Project Adventure activities were
founded upon the theory of “challenge-by-choice,” in which participants were

2
empowered with the choice to attempt or complete any activity (Prouty, 1990). This was
a stark contrast to the philosophy of assertively testing participants initially grounded in
Outward Bound curricula. With little evidence to confirm the impact of such courses, it
was hard to prove whether the course experience actually upheld stated goals, such as
team building or improved self-concept. In spite of the fast expansion of challenge course
curriculum and groups served over the last few decades, an absence of consensus
between research and the scientific community remains regarding the countless assertions
of the psychosocial benefits of challenge courses.
The first modern courses appeared in the United States in the 1960’s through the
Colorado Outward Bound School. Since then, challenge courses have become widely
used by organizations working with at-risk youth, hospitals, therapeutic settings, schools,
camps, and businesses (Gillis & Speelman, 2008). Challenge courses are categorized as
either high ropes or low ropes. In addition to the course itself, there are a series of
icebreakers and cooperative games that each course facilitator uses as an additional
resource to meet group objectives, which are developed through goal-setting group
activities. The main goals of adventure activities are to improve communication and
personal/group growth, improve self-efficacy, and become more connected with one’s
own thought process.
The process in which the group converges to create a set of goals and ground rules
is referred to as the Full Value Contract; it may be verbal, written or symbolic (Rohnke,
1991). The group comes to an agreement prior to beginning challenge course obstacles.
Each member has an influence in the contract creation, as it ultimately is used to outline
the mission of each activity. Low ropes activities include balancing and traversing on

3
elevated (1-3ft) cable ropes, activities such as rope swinging, the Trust Fall, and partner
balancing, to name a few. High ropes courses involve high angle activity, which requires
a full harness suit and helmet. These activities range from repelling, rock walls, zip-line,
and high angle partner puzzles (Gillis & Speelman, 2008). Lead-up activities,
icebreakers, and cooperative games include strategies such as human knot, group
juggling, and group-based problem solving.
There are many testimonials regarding the value in all of these activities and
courses, but little research gives evidence toward connections that are made in areas such
as team building or communication. Some studies have examined the effects, perceptions,
and assumptions about the value of the activities and courses (need some references
here). Whether the challenge course is low ropes, high ropes, or a series of adventure
activities, the goal remains the same: to reach awareness regarding self-fulfilling
limitations and artificial outside barriers, while exploring new possibilities by cross
referencing the challenge course experiences to realities that exist in the lives of the
participants. The application to self is one of the primary tenants of the challenge course
experience (Goldenberg, Klenosky, O’Leary, & Templin, 2000). Another chief tenant
that derives from the challenge course is that participants will seamlessly transition what
was learned into other situations and environments. Therefore, it is rational for challenge
course facilitators to assume that participants can connect abstract learning goals from
concepts in experiential education (Goldenberg, Klenosky, O’Leary, & Templin, 2000).
Abstract learning goals and taking risk along with the self – application of the experience
are just as important as the completion of the task. It is in the challenge course experience

4
that participants gain repetition in doing things that they did not think they could do,
which has been proven to improve self-concept (Beard & Wilson, 2002).
Research in self-concept and challenge courses has developed sub-groups of
inquiry in approximately 30 years of study. A number of groups and situations have
combined to create a portfolio of research. These subgroups are varied and include some
of the following:
• College student organizations (Hatch, 2005)
• At-risk high school students (Conley, 2007)
• College men and women (Finkenberg, Shows, & DiNucci, 1994)
• Working adults (Wolfe & Datillo, 2006)
• Individuals with disabilities (Anderson, Schleien, McAvoy, Lais, &
Seligmann, 1997)
• Substance abusers (Gass & McPhee, 1990)
• LGBTQ (Bradish, 1995)
• Girls (Mitten, 1992)
• Urban Youth (Dent, 2006)
Currently, very little research exists to document the benefits of challenge course
experiences in relation to the population of low-income and first-generation college
students. In fact, the only correlating research with this group that was found includes: (a)
urban youth (Dent, 2006); (b) at-risk college students (Steffen & Cross, 1994); (c)
adolescents in treatment programs (Witman, 1987), and (d) low-income minority youth
(Green, Kleiber, & Tarrant, 2000). Research connected to adventure activities suggests a
positive relationship between youth groups and self-concept. However, there is very little

5
research found that solely examines first-generation college students and adventure
activities.
First-Generation College Students
In the absence of a unified definition, “first-generation college student” is a term
that describes a student for which neither parent has obtained a bachelor’s degree from a
four-year institution of higher learning (Supiano, 2014). This population may fall into
two categories: (a) the student group finishing high school, and (b) students that acquire
this title once enrolled in college for the first time (Supiano, 2014). Identifying first-
generation students recently gained attention in the “Chronicle of Higher Education”
(Mangan, 2015), where it was stated that the title for this student group was given in an
effort to shift attention away from only counting those whose parents enrolled in college.
First-generation students have always been part of the educational landscape, but in
recent decades this sub-group has been a topic of attraction for stakeholders trying to
create the diversity that is representative in the real world in higher education. Regardless
of the definition application, first-generation college students as a cohort share some very
distinct commonalities (Nunez, 1998):
• Lack group skills originating from home and community
• Belong to a racial or ethnic minority group
• Originate from low-income families
• Score lower on college entrance exams
Once first-generation students are on campus, they tend to have lower Grade
Point Averages (GPA) during the first semester, are more likely to drop out during their
first year, and often have work commitments equal to and even in excess of class/study

6
time (Somers, Woodhouse, & Cofer, 2004). These descriptive attributes place first-
generation students at an exceptional disadvantage as they prepare for and pioneer their
way through high school into their didactic collegiate careers. This population is most
affected by changes in the U.S. Dept. of Education financial assistance, tuition costs,
minimum credit hour enrollment, and GPA requirements that are tied to sources of
financial aid, scholarships, and grant aid.
Without question, first-generation students need additional support measures to
enroll in college, stay enrolled, and graduate. Across the nation, colleges and stakeholders
have a deep interest in identifying the most vulnerable student population so support
measures leading toward graduation are provided. Colleges rely on first-generation
students to diversify the campus community and create an environment that resembles the
nation’s workforce. Although this student population is not new to the college landscape,
it is important to find alternative classroom support measures to provide them the
experiences needed to flourish.
Statement of the Problem
There is a lack of research on first-generation college students and a measurement
of their self-concept after a comprehensive low ropes challenge course experience.
Numerous studies have revealed clues about the self-concept of first-generation students
under a variety of conditions and situations. Separately, the body of research on challenge
courses has revealed mostly positive correlations as an intervention with several types of
groups that may relate to first-generation students. However informative each study is
alone, there has yet to be research conducted on the relationship of a low ropes course
program and the self-concept of first-generation college students. It is imperative for

7
institutions of formal learning to understand what types of interventions are appropriate
for student success. With this information at hand, educators and teachers will have a
targeted classroom tool at their disposal to learn about their students and engage them in
activities that may develop their self-concept. This has the potential to positively
influence their confidence and other executive functions that are applicable for success in
a classroom setting.
Purpose of the Study
The purpose of this study was to examine the relationship of participation in a low
ropes challenge course program and the self-concept of first-generation college students.
Through quantitative research, this study observed the relationship between the course
experience and the self-concept of first-generation college students. In addition, a
demographic survey was used to gain participant group specific data. The survey
instrument that used was the TSCS:2 Adult Form (Fitts & Warren, 1996). The TSCS:2’s
82- question survey spreading across several scoring subscales.
Components of Self-Concept include:
• Self-Criticism
• Behavior
• Academic/Work
• Moral
• Personal
• Family
• Social
• Total-Self-Concept

8
Summary and total scores were provided for each domain with the total score
being the most valued in interpreting overall perception. A low total score was suggestive
of a participant who may have a lower self-concept, may be indecisive, may have a
harder time dealing with life struggles, and may doubt their own abilities. A high total
score was suggestive of an individual who values themselves and their ability to
contribute to society. Participants in this study completed the TSCS:2 on the first day of
scheduled activity approximately 30 minutes prior to receiving low ropes course
activities; completion of the survey was estimated to be around 10 minutes. Participants
completed a post TSCS:2 three weeks later on the last day of activity, after the final
scheduled session.
Self-Concept is the foundation for how humans interact and behave (Rosenberg,
1979). Specific attention was paid to disposition, sense of belonging, teamwork, conflict
resolution, and confidence. These elements were selected because they aligned with
critical objectives and the perceived benefits associated with challenge course programs
(Hattie, Marsh, Neil, & Richards, 1997).
Research Questions
1. RQ: Was there an effect on self-concept, as measured by the TSCS:2 Self-Concept
subscale, between students who participated in a short term low ropes course
program and those who did not?
a. H10: There is no effect on self-concept pre/post Self-Criticism sub scores
2. RQ: Was there an effect on self-concept, as measured by the TSCS:2 Social
subscale, between students who participated in a short term low ropes course
program and those who did not?

9
a. H10: There is no effect on self-concept pre/post Social sub scor
3. RQ: Was there an effect on self-concept, as measured by the TSCS:2 Family
subscale, between students who participated in a short term low ropes course
program and those who did not?
a. H10: There is no effect on self-concept pre/post Family sub scores
4. RQ: Was there an effect on self-concept, as measured by the TSCS:2
Academic/Work subscale, between students who participated in a short term low
ropes course program and those who did not?
a. H10: There is no effect on self-concept pre/post Academic/Work sub
scores
5. RQ: Was there an effect on self-concept, as measured by the TSCS:2 Moral
subscale, between students who participated in a short term low ropes course
program and those who did not?
a. H10: There is no effect on self-concept pre/post Moral sub scores.
6. RQ: Was there an effect on self-concept, as measured by the TSCS:2 Personal
subscale, between students who participated in a short term low ropes course
program and those who did not?
a. H10: There is no effect on self-concept pre/post Personal sub scores
7. RQ: Was there an effect on self-concept, as measured by the TSCS:2 Total
subscale, between students who participated in a short term low ropes course
program and those who did not?
a. H10: There is no effect on self-concept pre/post Total sub scores

10
8. RQ: Was there an effect on self-concept, as measured by the TSCS:2 Behavior
subscale, between students who participated in a short term low ropes course
program and those who did not?
a. H10: There is no effect on self-concept pre/post Behavior sub scores
9. RQ: Was there an effect on self-concept, as measured by the TSCS:2 Physical
subscale, between students who participated in a short term low ropes course
program and those who did not?
a. H10: There is no effect on self-concept pre/post Physical sub scores.
Assumptions
This study was based on the following assumptions:
1. The researcher assumed that the survey (TSCS:2) instrument measured
self-concept with validity and reliability.
2. The researcher assumed that the participants clearly understood each item
presented in the survey.
3. The participants answered the survey questions honestly.
4. Participants brought a unique educational history and journey to the study.
Significance of the Study
As members of institutions of higher learning make it a goal to prepare students to
emerge as leaders of the people they represent, not exclusive of the racial and ethnic
lines, it is vital for institutions of higher learning to cultivate campuses reflecting the
country’s population (Supiano, 2014). The term first-generation has created a way to
identify and open a dialogue regarding campus class diversity. The children of blue-collar
laborers, truck drivers, food servicers, wait staff, and beauticians may not have been

11
raised with enriching summer getaways, exposure to the arts, luxury comforts, and prep
school, yet they remain coveted applicants for selective and elite colleges. First-
generation students cross racial and ethnic lines. The majority of them are poor, and
socio-economic gaps are great at elite and selective colleges.
Although there is not one sole definition of a first-generation college student,
they are summarized as the first in their family to graduate from a formal school. As a
result, the educational attainment of a student’s parents can influence a student’s risk of
dropping out (Hardwick, 2014). This group often faces challenges while in school not
akin to their second generation and beyond peers, such as working 30+ hours per week,
lack of financial support, lack of educational support, and coping with minority status
typecasts. First-generation students are most affected by changes on college campuses
such as rising tuition costs, availability of student support services, and changes in the
Federal Pell Grant Program. Research on this population reveals that most high-
achieving, low-income students do not reach their full potential without guidance from
parents who have had a college experience. These students are oblivious to the fact that
affluently endowed private and highly selective colleges may often be the most
affordable of their college options. Yet, capable first-generation applicants rarely envision
appropriately placing themselves into an elite college (Hoxby & Turner, 2013). The rising
cost of attendance, coupled with the national trend away from federal grants to loans and
the push by public institutions to draw more students paying full tuition rates, has put
full-time status at a four-year institution way out of the realm of possibility for first-
generation students (Mortenson, 2000).

12
As a result, first-generation students are concentrated at two-year community
colleges because such institutions are within their financial reach. Unfortunately, the
national trend shows that states have reduced funding to public institutions by a margin of
35-50% over the past few decades (Mortenson, 2003). Consequently, the funding needs
are placed onto the students in the form of higher tuition and fees. Considering the
growing numbers of first-generation students enrolling in colleges, the obligation then
leans towards individual states to protect and increase post-secondary educational
investments. The changing landscape of college education will make identifying best
practices for students a priority. The practice of experiential education through a
challenge course program has proven itself worthy by evidence of the number of courses
existing on campuses nationwide. Challenge courses have shown to enhance both
individual and group self-efficacy (Eatough, Chang, & Hall, 2015).
Limitations
The following limitations are facets in this study over which the researcher did
not have control:
1. Student attendance during low ropes course sessions.
2. The local weather is a limiting factor in the progression of challenge
course activities since about 2/3 of the activities were conducted on the
course which was permanently affixed outdoors.
3. Erosion in the facilitator’s performance/commitment over a six-week
period.
4. Facilitator performance deviation due to participant disposition toward
activities.
13
Delimitations
1. 120 first-generation college students who qualified to participate in the
University of New Mexico Low Ropes group.
2. Three separate three-hour sessions of facilitated low ropes and adventure
activities with a self-concept focus.
3. The Low Ropes group school site and the University of New Mexico Low
Ropes Course.
Definition of Terms
The realm of experiential education has a language all its own; therefore, it is
imperative to describe a few of the definitions applicable to this study.
Experiential learning – a process of learning that allows students to actively and
kinesthetically participate in the lesson.
Low Ropes Course (LRC) – the foundation of any experiential education
experience (Priest, Gass, & Gillis, 2000). The low ropes course is a collection of
cooperative activities assembled on the ground or 1ft-2ft off ground surface. Activities
are developed for small cooperative group solutions. Low ropes activities are meant to
develop confidence, communication, trust, problem solving and leadership.
Processing – a debriefing discussion following a cooperative activity involving
the entire group. Here, participants are encouraged to revisit experiences and draw upon
reflection and analysis to communicate their experience. Groups are guided to consider
application to their larger common connection such as school or work-environment in
order to create future change.
14
Facilitator – the leading instructor for the group participating in the experiential
learning activities. This person is the authority for maintaining the physical and mental
safety of the group. The facilitator guides the group through each activity while
maintaining structure, goals, and the integrity of the lesson.
Challenge by Choice – a concept as simple as its title, in which participants may
choose to participant in activities or stop participating at any point in an activity. All
participants are introduced to this concept at the beginning of the session.
Full Value Contract (FVC) – to help create a group culture, which genuinely
respects the right of an individual to choose with regard to degree of participation in any
activity. Challenge by Choice can be used to help reinforce the message that an individual
is to exert and take personal responsibility, choosing his/her behaviors and actions.
Further, the principle recognizes that individuals potentially stand to learn and grow more
by refusing to participate on occasions than unthinkingly and/or resentfully always
participating.
First-Generation College Student – although no unified term exists, it describes
a student for whom neither parent has obtained a bachelor’s degree from a four-year
institution of higher learning (Supiano, 2014). Sometimes this population may fall into
two categories; (a) the student group finishing high school, and (b) students who acquire
this title once enrolled in college for the first time (Supiano, 2014). For the purposes of
this study, research participants were defined as category (a), the student group finishing
high school.

15
Self-Concept – a theory of self-reflection, self-assessment, and self-schemas
which focuses on disposition, ability, physical attributes, skills, occupation, and interests
(Gerrig & Zimbardo, 2002).

16
CHAPTER II
Literature Review
Origins of the modern challenge course date back to the early 1970s (Prouty, 1990)
and were developed out of military practices that aimed at developing the self-concept of
individual and cohort participants. Going back further, ancient cultures often provided their
children opportunities to engage in challenging risk-based tasks to learn the skills necessary
to thrive in society (Miles & Priest, 1990). Challenge courses provide groups unexpected
settings and sets of circumstances that they would not normally experience. Challenge
course curriculum uniquely blend physical and mental challenges with the exposure to a
distinct environment where participants negotiate between independence and trust to reach
group teambuilding goals (Marsh, Richards, & Barnes, 1986).
One of the frequently shared psychological benefits resulting from challenge
course activities for aberrant youth are in the areas of self-concept (Teaf & Kablach,
1987). Teaf and Kablach reported the ability to do completely new tasks, a variety of
tasks, while having independence to complete a task without interruption. An intervention
group was compared to a control group that did not participate in challenge course
activities and who scored lower in independence. The independence of completing tasks
is a cornerstone of challenge course curriculum, once parameters are established a group
has the creativity to get to the solution a number of ways and without interruption.
Seminal research in challenge course activities by Clifford and Clifford (1967)
suggested that the experience improved self-concept in participants. A baseline survey of
self-concept was collected, and a post experience survey was given. The result showed
that the experiences had a significant effect on self-concept. What is interesting to note is

17
that individuals with the lower baseline self-concept scores showed the largest gains of all
participants. This has relevance to the purpose of this dissertation because the student
participants in the study were first-generation college students. The first-generation
population of students experience feelings of inadequacy in school, which result in lower
feelings of self-concept when compared to their college heritage peers who are not first-
generation or low-income (Bradbury & Mather, 2009).
A study of short-term challenge course participation was conducted using both the
Tennessee Self-Concept Scale (TSCS) and the Coopersmith Self-Esteem Inventory
(Gillet, Thomas, Skok, & McLaughlin, 1991). A pre and post measure was conducted
over a six-day period and showed gains in Total self-concept, as well as two other
subscales of the TSCS. Total self-concept is the most important measure of the Tennessee
Self-Concept Scale (Fitts & Warren, 1996). Finkenberg, Shows, and DiNucci (1994)
studied challenge course activities and the self-concept of college students using the
TSCS and found that one group showed significant gains in three subscales and the
second group showed significant gains in two subscales.
A meta-analysis of challenge course activities focusing on adolescents has shown
evidence that self-concept was improved after their experience. Over 60 studies were
reviewed in the area of self-concept, adolescents, and challenge course experiences
(Cason & Gillis, 1994). Larger gains in self-concept occurred when the challenge course
experience was over an extended timeframe. In addition, lower effect sizes were linked to
quasi-experimental and experimental studies. A second meta-analysis focused on
adolescents and self-concept showed that changes in self-concept were evident (Hattie,

18
Marsh, Neil, & Richards, 1997). Additionally, the meta-analysis results suggested that
longer timeframes of activities aligned with greater change in self-concept.
Measuring the effects of a challenge course experience in a group of individuals
with a wide variety of individual characteristics involves targeting specific group
attributes. Most strive for outcomes such as teamwork, cohesion, communication, and
cooperation. Although these traits can appear immeasurable, they are qualitative
observations of positive human emotion. Positive experiences were found to increase
self-esteem and heighten internalized locus of control (Rohnke, 1977). Locus of control
refers to one’s belief about what causes the good or bad events in their life. Those with a
high internal locus of control believe that events result primarily from their own behavior
and actions (Rotter, 1954). If a challenge course experience can be consistently
associated with positive experiences, it is likely to build self-esteem and locus of control
within participants. One’s own behavior and actions are closely tied one’s self-esteem
and disposition.
Research in challenge courses has been conducted in a variety of domains.
Goldenberg, Klenosky, O’Leary, and Templin (2000) examined outcomes related to
socialization and individual growth among an expansive range of individuals aged 15-50,
suggesting that group dynamics and personal gain were related to a challenge course
experience. It also revealed a number of specific challenge course effects, such as
building relationships as well as developing understanding, enjoyment, and feelings of
accomplishment. This study revealed the possibility of primary and specific positive
effects gained from the challenge course over a population age range that encompasses
the majority of the adult population.

19
More recently, interesting findings in challenge course experiences were revealed
with at-risk student groups. Students within one group said they could apply teamwork
skills learned, because it made it easier to work with individuals with whom they became
acquainted (Conley, 2007). Additional sentiments from participants included friendship
development and trust. Some students commented that they could not really apply
anything they had learned at a low ropes challenge course, because in class they worked
as individuals to solve problems and not as team (Conley, Caldarella, & Young, 2007).
Although an individual benefit was not conceptualized in this case, teambuilding was
admittedly seen. Reaching half of the students positively is a sizable gain for at-risk
adolescents and proved the value of the experience.
Depending on the needs of the group and factors such as time, group size, and
facilitator experience, low ropes course goals can vary greatly (Haras, Bunting, & Witt,
2005). A group that is only intact for a short time, such as a summer camp, will reach
their goals more easily in the challenge course. Current research has shown evidence that
short-term gains and goals are seen over short periods and especially within the first six-
weeks of the experience (Hatch, 2005).
If intact groups are to continue to learn from challenge course experiences, they
will need more learning activities using principles of active learning (Bonwell & Eison,
1991). Active learning suggests that participants need to be actively involved in the
material being covered. One method presented to reach this is cooperative learning
(Bonwell & Eison, 1991). In challenge courses, cooperative learning involves group
members converging to explore strategy and become active problem solvers. This
20
variable will remain a factor in every experience because each facilitator has a unique
style and curricular attributes.
The principles taught in a challenge course-setting offer several dimensions from
L. Dee Fink’s Taxonomy of Significant Learning (2003). Specifically, they address
principles in the Caring, Human, and Application dimensions. Caring and Humanistic
aspects are addressed through full-value contracts, which outline group objectives and
responsibility for the safety of team members. Application can be achieved through a
wide variety of activities on the Challenge Course. One communication activity, called
Logjam, asks participants to maneuver sequentially in tight spaces without talking. They
may use symbols and non-verbal cues as tools to assist in completing the activity.
Additionally, low ropes challenge courses promote some aspects of Bloom’s Taxonomy
of Educational Objectives (Bloom, 1956). The affective domain relates to the attitudes
and feelings that result from the activity or learning process. This domain is reached at
the end of an activity where students are able to process and share their emotion. The
cognitive domain is promoted during the activity itself when group participants must
display the ability to process and utilize information in a meaningful way so that they can
complete the task. Developing a student’s ability to access a variety of higher order
functions will lead to the ability to solve complex problems that they will encounter in all
realms of life. This will build confidence, therefore enhancing self-concept.
Positive findings in experiential education are symbolic, but so is skepticism. One
such paradox is the debate over the lasting effects of challenge course experiences. Hatch
(2005) revealed that, despite data indicating short-term gains in cohesion, individual and
group effectiveness was not maintained over a two-month period. Finkenberg, Shows,

21
and DiNucci (1994) showed that challenge course experiences increased individual’s
self-efficacy, resiliency, and optimism, but left questions regarding the individual’s ability
to transfer what they had learned to other settings.
Doug Eadie’s 2009 research supports this enigma of eroding positive findings.
Eadie’s findings reveal that positive outcomes reached by a school board that experienced
a challenge course retreat had diminished just a few months after training. Board
members described how they had made personal connections and communicated well in
establishing working guidelines; yet, all was quickly forgotten when the school board
members faced their workplace reality. Board members eventually returned to their old
ways of bickering and creating tension. Similarly, participants in low ropes challenge
courses had concerns in using it as a tool in becoming effective communicators. Some
participants felt that there were too many people allowed to speak and make decisions at
one time (Wolfe & Dattilo, 2006).
The literature indicates that challenge courses offer immediate team building
benefits such as, socialization, cohesion, and communication. Contradicting research
suggests that effects diminish over time and differences exist in individual perception.
There are some additional limitations in the literature, which deserve mention. Such
limitations include group size, facilitator experience, and motivation of students. Lack of
a control group during challenge course research makes it complicated when trying to
qualify the short-term or even long-term gains from the experience. Despite this
limitation, many of the studies allowed for comparison in a pre/post-test reporting over
time. Another limitation in this literature review is that there were several types of group
organizations referenced. Even if the various groups had common goals of cohesion and

22
communication, they differed in terms of dynamics, such as experience, size, or
organization. For example, some groups were well acquainted, and others had yet to meet
each other. Another important limitation is the experience of the facilitators used in the
challenge courses. The literature presented very little information regarding the role of
the facilitator in the production of group goals. This is a very important issue to consider
as the experience and organization of the facilitator may be the single most influential
aspect in reaching outcomes (Henderson, 2009).
Overall, challenge courses offer immediate and noticeable effects toward team
building goals. However, future research should be conducted to examine specific aspects
that fall under team building. Such tenants include making social connections, developing
communication and unity, and easing comfort levels.
Self-Concept
The term “self-concept” describes one’s overall view of him or herself
(Rosenberg, 1979). This may include several universal character traits found in terms
such as “self-esteem,” “self-efficacy,” and “self-confidence.” Self-concept encompasses
seven unique traits that include the following descriptive categories: developmental,
organized, evaluative, multifaceted, differentiable, and hierarchical (Shavelson, Hubner,
& Stanton, 1976). Self-concept is not a tangible artifact within one’s self (Rosenberg,
1979). Rosenberg argues that self-concept is the basic paradigm for explaining and
forecasting the potential for how one will behave. Simply put, self-concept includes how
we perceive ourselves, feel about ourselves, and behave in social settings. Social
acceptance is a component in self-efficacy and self-esteem, which closely relates to self-

23
concept (Leary, 2004). Self-concept is something that is useful and drawn upon by
teachers, counselors, facilitators and a wide variety of social scientists.
Viewing one’s self in a social construct has multiple aspects, just as one has many
social roles such as student, son/daughter, parent, employee, friend, or life-mate (James,
1983). With so many roles, individuals choose which are important to them and which are
not. Individuals have the freedom to delineate who they are and who they want to become
based upon how they prioritize the roles in their lives. Of the many roles that one plays,
individuals will seek out success in the roles that are indispensable to them and care little
if they fail in roles that they do not value. According to James, if one fails in a role that
they value, their coinciding self-concept will be low. It is essential for one to identify
goals for the roles they value in a realistic manner. Coincidently, it is just as important to
vacate roles that one may not value because it can provide a great deal of emancipation
for the individual to move forward (James, 1983). Self-concept may be the single most
important factor for student success in evaluating students.
What makes self-concept relevant to this study is that participation in experiential
education via challenge course aims to build many of the component traits that define
self-concept. Experiential education may be transformative and allows individuals an
authentic setting in which to engage with their own apprehensions, fear, confidence,
feelings, sociability, and success.
First-Generation Students
Although no one definition of first-generation college students exists, first-
generation students are typically described as the students of parents who did not
graduate from a four-year university (Gibbons & Woodside, 2014). One element that is

24
clear regarding first-generation students is that they have the highest dropout rates of any
subgroup in college (Arnett, 2015). Several factors influence first-generation college
students during their educational acquisition process. These students do not have parents
that they can call upon for advice in college, which is an obvious disadvantage for first-
generation students in reaching their full academic potential. In addition, first-generation
students tend to have a lower academic self-concept, identify more barriers in going to
college, and have fewer repetitions and courses in STEM subjects (Gibbons & Woodside,
2014).
First-generation students are identified by other differences once they set foot on
campus. These students are more likely to take remedial courses, have employment
obligations, earn lower grades, and are more likely to attend school part-time, when
compared to non-first-generation students. It is worth noting that there are even
differences among first-generation students, depending on the type of college they attend
and the environment that surrounds those (Housel & Harvey, 2011). For example, a first-
generation student on scholarship at a private college or residential college can have a
much different experience than a student attending a state sponsored college full-time
who is also working part or full-time.
The majority of first-generation college students originate from low
socioeconomic (SES) backgrounds and homes. Socioeconomics plays a large part in the
graduation rates of all students. Longitudinal data from the 2008 cohort of high school
graduates who fell within the top 80th percentile in SES went on to graduate college with
a bachelor’s degree at a staggering rate of 84% (National Center for Education Statistics,
2009). Conversely, the 2008 cohort of high school graduates who fell in the bottom 20th

25
percentile in SES went on to graduate college with a bachelor’s degree at a mere rate of
39%.
First-generation students are the population of college students that are
responsible for helping out their own families with childcare, financial support, and other
household duties while in school (Ishitani, 2003). This pressure, given the multi-
disciplinary rigor needed to finish a bachelor’s program, is listed as one of the chief
reasons for low graduation rates among first-generation college students (Ishitani, 2006).
Families of first-generation college students depend on them for financial support. This
situation often causes a ripple effect in their educational development, as a large number
of these students only enroll half-time while working nearly or completely full-time
(Bradbury & Mather, 2009). Making the transition into campus life may be difficult for
these students due to the burden placed upon them by families and their increasing
responsibilities. Families with an annual income of $50,000 or more produce college
students that prove to have higher persistence and graduation rates. Students from homes
with an income less than $50,000 are on average 50% less likely to graduate (Ishitani,
2006). A clear division of persistence and graduation rates is evident based upon the
socioeconomic status of students who enter the collegiate ranks.

26
CHAPTER III
Methods
The purpose of this study was to examine the relationship between a challenge
course program and the self-concept of first-generation college students. This chapter will
be separated into several sections to describe the sample size and participants, research
design, procedures, instruments, and data analysis.
Power Analysis
The sample size was determined through the use of a power analysis. The power
analysis identifies the appropriate number of participants needed to find an effect (Cohen,
1988). Power is a vital concept because underpowered studies have a decreased chance of
finding significance. The results for the power analysis revealed that the appropriate
number of participants in this study was approximately 126, with 63 as part of the Low
Ropes group participants receiving the LRC. The number of participants included in this
study was 94.
The parameters set for the power analysis were set as follows:
ANOVA
Independent groups (one receiving treatment and one group is not)
One tail (.05)
Significance level = 0.05
Power = 0
Power analysis is critical in experimental design. It identifies the requisite sample
size needed to identify an effect/change through a determined degree of confidence. It
also offers guidance for sample size when full power or requisite number of participants

27
are not obtained. For example, if the main effect/interaction is significant, acceptance of
study findings have a higher degree of confidence (Cohen, 1988).
Participants
The participants in this study were students from the UNM College Enrichment
and Outreach Programs (CEOP), which encompass about a dozen youth outreach
programs for college and college-bound students. To meet the effect size requirements for
this study, students were recruited from two very similar programs: Upward Bound and
College Prep. Both These two college matriculation programs assist first-generation and
low-income college students in the post-secondary school entrance process via dual
enrollment and other strategies. In this study, Upward Bound is the Low Ropes Group
and College Prep is the No-Low Ropes Group. Participants in both groups were
secondary students in local public high schools. Students attended their respective
program services at UNM in the summer, weekends, and after school weekday hours.
This study occurred during the summer phase of programming of each program.
Traditionally these groups stay intact from high school to college matriculation. Students
join each of the programs at various points during their high school years, usually as
underclassmen. Year of joining is determined by recruiting availability and is driven by
student interest during school visits by each program. Services delivered to students
includes; UNM concurrent enrollment, tutoring, cultural events, ACT test prep, essay
development, FAFSA/scholarship services, and other college matriculation processes. All
student participants in this study were first-generation college students. Students in the
two programs were admitted based upon the eligibility standard of being a first-
generation college student and/or originating from low – income homes as outlined by

28
the federal income guidelines or the state’s free and reduced lunch program. Information
identifying first generation status was obtained from the demographic survey. Student
participants chose to apply to the program and to attend Saturday workshops.
Design
A repeated measures analysis of variance (ANOVA) was conducted to examine
the change in self-concept sub-category scores of the TSCS:2 instrument. Assumptions
associated with ANOVA and repeated –measures ANOVA’s were tested prior to analysis.
Analysis of the data collected from the survey was conducted using SPSS software.
Condition and treatment of the experiment and subscales of the TSCS:2 were analyzed
using a one-way ANOVA with the treatment as the between-subject factor and the
subscale as the dependent variable.
Approval Process
As approved by the UNM Office of the Institutional Review Board, this research
met the definition of minimal risk. The low ropes activity coupled with the surveys that
asked students to reflect upon their experiences, classroom lessons, and other
programming were part of the participants’ normal curriculum in their dual credit No-
Low Ropes group course. The only intervention was the TSCS:2 survey. Therefore,
according to federal regulations §46.102(i), minimal risk was met because the probability
and magnitude of harm or discomfort anticipated in the research was not greater than
those ordinarily encountered in daily life or during the performance of routine physical or
psychological examinations or tests. Again, self-reflective surveys were a part of normal
programming and the only intervention was a more developed survey.

29
The following procedures were implemented to provide informed consent to the
students. A copy of the consent form was placed in the same folder as the survey and was
reviewed with potential participants as part of the research introduction. The consent
form was for the potential participants to keep, and they had it to follow along as it is was
reviewed with them.
Once the participants provided consent to participate, the researcher measured
self-concept as perceived by first-generation students via survey titled the Tennessee Self-
Concept Survey 2 (TSCS:2). In addition, the researcher collected descriptive data via the
survey. The final data collection included participants who completed the surveys and
who participated in the low ropes course experience. Every participant took a pre and
post survey. For research plan, approval, and supporting documents see Appendices B, E,
F, G, H, I, J, K, and L.
Instrument
Survey
There was one codified survey instrument used to collect data for this study. The
quantitative psychometric instrument used for this study was the Tennessee Self-Concept
Scale:2 also known as the TSCS:2. The TSCS:2 measures multiple domains that included
perception of self, attitudes, and feelings. When combined, all of these domains identified
the self-concept of an individual on the TSCS:2 surveys. Each individual has some
concept of self that they can share if willing and one of the simplest ways to obtain this is
to ask them to describe their self-concept. Currently, the best way to assess self-concept is
through a strategically designed self-report measure (Fitts, 1971). The TSCS:2 was
modified in 1996 into its current form and has been used in a wide variety of clinical and

30
traditional research settings (Foundoulaki & Alexopoulos, 2004). This survey has been
used in many settings and works well in measuring the relationship between self-concept
and human behavior along with the use of a common implement such as a Low Ropes
Course (Brown, 1998).
The TSCS:2 is available in two forms that are tailored for either adult or child.
This study utilized the Adult Form which had been standardized with individuals aged
13-90 years, who read at or above a third grade level. The adult form is derived from five
domains of responses consisting of 82 self-descriptive statements/questions. The
responses available are “always true, mostly true, partly true, always false, mostly false,
and partly false.” Statements given by participants were scored positively and negatively.
The estimated survey completion time was 10-20 minutes, and scoring of the TSCS:2
took about ten minutes using the provided Auto-Score Form. Each copy/survey of the
TSCS:2 costs two dollars, and the administration manual costs $100. The TSCS:2 and its
82 question survey were spread across nine scoring subscales which included:
Academic/Work, Identity, Satisfaction, Behavior, Moral, Personal, Family, Social, and
Physical (see Table 1). A summary and total score were provided for each domain, with
the total score being the most valued in interpreting overall perception. A low total score
was suggestive of a survey participant who may have a lower self-concept, may have
been indecisive, may have had a harder time dealing with life struggles, and may have
doubted their own abilities. A high total score was suggestive of an individual who valued
themselves and their ability to contribute to society.

31
Table 1
Scales on the Tennessee Self-Concept Scale -- Second Edition
Self-Concept Subscales
Physical Academic/Work
Moral Behavior
Personal Self-Criticism
Family Total Self-Concept
Social
The Self-Criticism subscale presents statements that are somewhat derogative
about oneself, they are considered common character weaknesses that most would admit
to having (Fitts & Warren, 1996). High Self-Criticism scores suggest a participant with a
fit ability to reflect and aptitude for self-criticism. Lower Self-Criticism scores suggest a
participant who is deliberately defensive and trying to present themselves in a positive
light by denying common human shortcomings. This subscale encompasses 14
statements; examples of a Self-Criticism statement includes “I get angry sometimes” and
“I gossip a little at times” (Fitts & Warren, 1996).
The Moral subscale observes a participant’s ethical reflection (Fitts & Warren,
1996). High scores suggest an individual who is satisfied with his or her behavior as
being virtuous and treating others with respect. A low score suggests intentions and
instincts that supersede the individual’s own moral values. The Moral subscale includes
12 questions such as “I am a morally weak person” and “I shouldn’t tell so many lies”.
Moral is a subscale that is reflective in a variety of questions that range from personal,
societal, and religious.

32
The subscale Personal is a measure of one’s interactions with others (Fitts &
Warren, 1996). High Personal scores suggest positive assimilation within social structures
and a balanced lifestyle. Lower Personal scores suggest an individual whose self-concept
is dependent upon outside circumstances and as a result, their positions are ever
changing. The Personal subscale includes 12 questions such as, “I am nobody”, “I’m not
the person I would like to be”, and “I do things without thing about them first”. Very low
Personal scores suggest internal strife and may signal disturbing behaviors.
The subscale Family refers to one’s own view relative to their immediate families
and households. It is worth noting that, for children, relationships with teachers can
heavily influence their concept of family and the subscale Family (Fitts & Warren, 1996).
This subscale may also suggest how participants view their personal conduct, educational
ability, and performance. High Family scores suggest someone who is content with the
level of care that he or she shares with their family structure and closest relatives. Lower
Family scores suggest individuals who may be disconnected and detached from any sense
of family. Examples of Family statements include, “I have a happy family” and “I should
love my family more”.
The Social subscale is similar to the Family subscale but inserts friends and
regular acquaintances. The Social subscale represents an overall sense of belonging and
how an individual interacts within social structures and with others (Fitts & Warren,
1996). High Social scores suggest individuals who are cordial, mannered, and smile. Low
Social subscale scores indicate hostility toward social spaces and interacting with others.
The Social subscale includes 14 questions such as, “I’m mad at the whole world” and
“Most people are good”. It is noteworthy that children include their school and home

33
community along with their group of friends within their development of social self-
concept (Fitts & Warren, 1996).
The subscale Academic/Work is a self-reflection and a view of how others view
an individual in a school or work setting. Academic/Work consists of 10 questions,
example questions include, “Other people think I’m smart” and “I’m not as smart as the
people around me” (Fitts & Warren, 1996). This subscale is the most correlated of all of
the TSCS:2, scores to tangible school grades. High Academic/Work scores suggest
individuals who are adept and confident in school and work settings. These individuals
are likely to seek the advice of others and turn every situation into a positive opportunity.
Low Academic/Work scores suggest and individuals who struggle in changing
environments and situations where progress is routinely measured.
The Behavior subscale is considered a supplementary score and pools together all
of the other subscales to create a summative score. The value of Behavior is the ability to
distinguish patterns due to the inclusion the most important statements from all of the
other subscales. It aims to answer, “This is what I do, this is how I behave” (Fitts &
Warren, 1996). Low Behavior scores suggest an individual who is impulsive and reactive.
High Behavior scores suggest a well-tempered individual who includes logic and reason
into their thought process.
The TSCS:2 is equipped with a summative measure titled Total. According to
Fitts and Warren (1996), the summary score Total contains the greatest significance of all
of the scores derived by the TSCS:2, as it is a composite representation of all of the
subscales. It is a representation of how an individual view themselves in relation to all
other measures of the TSCS:2. Individuals with high Total scores tend to have a positive

34
view of themselves and view themselves as positive contributors of society (Fitts &
Warren, 1996). Those with very high Total scores may be uneasy when others do not
confirm their own view of self in their social circles. They also are complicit to take on
improbable expectations and place blame/negativity on others they depend on for
support. Low Total scores indicate an individual who has a hard time dealing with the
dynamics of life and has a low self-worth. Consequently, this often leads to a catalog of
other problems for an individual.
Validity
Validity determines whether the test, or in this case survey, actually measures
what it claims to measure. The TSCS-2 developed by Fitts and Warren (1996) is one of
the most universally adopted self-report measures of self-concept. The Tennessee Self-
Concept Survey has proven to produce valid scoring inferences. Scoring inferences for
the TSCS:2 has been evaluated in four domains which includes content, construct,
concurrent, and discriminant.
Content Validity
The TSCS:2 was standardized on 3,000 subjects, ages 7–90 years, and may be
administered to individuals or groups in about 10 to 20 minutes (Fitts & Warren 1996).
Fitts and Warren reported acceptable levels of score validity for the TSCS:2. Two strands
of independent research were used to determine content validity for the TSCS:2, Levin,
Karnie, and Frankel (1978) endorsed the TSCS:2 to be acceptable between content and
dimension (as cited in Fitts & Warren, 1996, p. 62). The original self-description
questions were a derivative from the works of seven clinical psychologists (Fitts &
Warren, 1996). Over the past several decades there have been many analytical factor

35
studies which have analyzed the TSCS:2. According to Fitts and Warren (1996), nearly a
dozen studies have all confirmed that the multi-dimensional domains of self-concept are
appropriate and exemplified.
Construct Validity
The TSCS:2 subscales earn high scores in being able to test and quantify what it
claims to measure. When compared to other metrics that would be expected to relate to
the paradigm of overall self-concept, the TSCS:2 has proven to be related to self-concept.
The TSCS:2 has correlation of r=.45 with the Jackson Personality Inventory; r=.68 with
the Janis-Field Feelings of Inadequacy Scale; r=.68 with the Self-Rating Positive Affect
Scale; and r = .71 with the Minnesota Multiphasic Personality Inventory (Fitts & Warren,
1996). The comparative numbers listed above reveal that construct validity scoring is
high when compared to other commonly used self-concept measures.
Reliability
Reliability determines whether the results can be repeated consistently over the
long term. The TSCS:2 shows the ability to correlate reliable scores in two domains
which are internal consistency and test-retest stability. According to Fitts and Warren
(1996), reliability for the TSCS:2 is adequate, with lower internal consistencies on
subscales than Total Self-Concept, ranging from α = 0.73 to 0.93. Test-retest reliability
scores ranged from r = 0.47 to r = 0.83. These numbers/scores suggest an acceptable scale
of internal consistency. The test-retest reliability revealed a correlation of 0.82 which
indicates a high correlation and assurance in the TSCS:2 in its ability to measure
individual differences. Explicit data were gathered to deliver basic information about the
general features regarding the participant sample. Explicit statistics include information
36
for confounding variables such as: age, gender, race, first-generation, social
commitments, and housing status.
Procedures
There were two participant groups: Low Ropes group and No-Low Ropes group.
Low Ropes group participated in a low ropes course experience from beginning, with a
pre and post survey before and after the experiences. The No-Low Ropes group
participated in their normal No-Low Ropes group curriculum, with a pre and post survey
at week one and week three. Both participant groups took the TSCS:2 pre-survey on the
same day, approximately 30 minutes prior to the first low ropes course experience for
Low Ropes group. No-Low Ropes group also took a post-survey on the last day of the
first Low Ropes group low ropes course experience. The Low Ropes group took an
additional survey at the completion of their low ropes course experience.
Data were gathered from the surveys that were completed from the pre and post
survey periods. Both groups participated in a 12 hour low ropes course program that
extended over a six-week period per group, four hours per session, and once per week
alternating weeks with one week on and one week off. It took six weeks to complete each
group and twelve weeks overall. This survey period took place in a UNM classroom with
all students using a folder as a partition and students either took the survey or not based
upon their desired participation. The final survey for No-Low Ropes group was offered in
the same UNM classroom location as the first previous survey periods. Students were
divided into two groups by separating them in classroom at the time of survey. This is
normally how the students were divided for such activities. Figure 1 and 2 below
summarizes the research process for each group.

37
Figure 1. Low Ropes group Research Schedule
Figure 2. No-Low Ropes group Research Schedule
Session One: Introduction of research & administration of first TSCS:2 survey. College Prep resumes normal programming w/out low-ropes
Session Two:
College Prep resumes normal programming w/out low-ropes.
Session Three: Administration of the second and final TSCS:2 Survey. College Prep resumes normal programming w/out low-ropes
Session One: Introduction of research & Administration of first TSCS:2 Survey. College Prep resumes normal programming w/out
low-ropes
Session Two: College Prep resumes normal programming
w/out low-ropes.
Session Three: Administration of the
second and final TSCS:2 Survey. College Prep resumes normal programming w/out
low-ropes

38
The site chosen for this study was the UNM low ropes course (LRC). This LRC
facility is housed on Johnson Field and is managed by the Office of Student Affairs. This
location was chosen based upon its proximity to the participants who were on campus.
The course is certified by the Association for Challenge Course Technology (ACCT) to
meet the specific requirements of a low ropes course. Permission to use the course was
granted by the Low Ropes group director who is part of the structure within the UNM
Office of Student Affairs. The study utilized LRC facilitators from the Low Ropes group
who were experienced and trained in facilitation of LRC experiences. The facilitators
utilized practices and facilitation skills that met ACCT facilitation standards. The UNM
LRC facilitators were trained to deliver activities in a 20-hour training session on the low
ropes course. In addition, facilitators were required to complete a summer apprenticeship
in which they shadowed and led participants under the guidance of senior facilitators.
There were a minimum of two facilitators for every group session in this study. The
UNM LRC is a challenge-by-choice facility, which empowers the individual to decide
how and when they will participate in activities. The facilitators were trained to
encourage groups to explore individual risks in challenges while positively promoting the
benefits.
Positionality
The participants were a combination of UNM pre-college programming students
from the Low Ropes group and the No-Low Ropes group. I (the writer and researcher)
served in a traditional school principal’s role for the Low Ropes group students who
participated in the LRC. The No-Low Ropes group students had no previous experiences
with me. I was also the direct supervisor of the low ropes course facilitators (instructors)

39
that presented the activities to the study participants. I trained the facilitators over the
previous 5-7 years and worked closely in a variety of experiential education settings with
these individuals. I invested significant time training dozens of facilitators, working with
students, and developing curriculum for the low ropes course since 2003. I was
responsible for the modification of the traditional low ropes course model from once
serving small group sizes (10-15) to now serving groups of 100+. This modification was
made to meet the needs of large student orientation groups and others that were
frequently denied access to experiential education on the UNM low ropes course due to
group size being so large. My background as a physical education teacher made such
modifications possible, because I incorporated pedagogy and classroom management
theory. Put simply, I grouped students appropriately, trained additional staff, and created a
rotational system that makes usage of unoccupied equipment that normally sits dormant
in a small group setting. In this new system, the entire course was being used at once with
each facilitator running a small group activity simultaneously.
As a result, a sustainable practice of large LRC group facilitation was born. UNM
New Student Orientation along with a host of other programs have continued to
implement low ropes course groups. I positioned myself as an LRC professional who had
a great stake in at least 1/3 of all groups that entered the on an annual basis. In this study,
my position served as both the direct supervisor of some of the participants, as well as the
facilitator of all participants.
Facilitators
The researcher was the direct supervisor for the two facilitators that were part of
the study. Jeff and Ari facilitated groups for several years and had approximately 12 years

40
of combined experience. Jeff was considered a veteran in the low ropes course and went
to annual trainings at the American Challenge Course Technologies certification
conferences. Jeff was employed by Low Ropes group as an Administrative Assistant and
was a UNM student. Ari was an experienced facilitator of about four years and was
exclusively trained by the researcher (Chris Luna) and Jeff. Ari was a UNM student who
worked for Low Ropes group as a Lead Educational Mentor/Tutor. The researcher was
the individual responsible for introducing the low ropes course methods and 11 years.
The researcher was well versed in LRC facilitation, was considered an expert due to his
experience teaching low ropes course in a structured school setting, training of teachers /
staff members, and was trained by three different low ropes course experts in both short
and long-term settings.
Analysis
The Statistical Package for Social Science (SPSS) was used to analyze the data
set. All of the tests for statistical significance were set at an alpha level of .05 and a
confidence level of 95%. The statistical method, multiple one-way ANOVA statistical
analyses was chosen as an appropriate tool to analyze the researcher’s data for
hypotheses and research questions. Preliminary analysis included tests for assumptions
associated with ANOVA and repeated-measures ANOVA. Tests included normality and
homogeneity of variance
1. RQ: Was there an effect on self-concept, as measured by the TSCS:2 Self
Concept subscale, between students who participated in a short term low ropes
course program and those who did not?

41
a. H10: There is no effect on self-concept pre/post Self-Criticism sub
scores
2. RQ: Was there an effect on self-concept, as measured by the TSCS:2 Social
subscale, between students who participated in a short term low ropes course
program and those who did not?
a. H10: There is no effect on self-concept pre/post Social sub scores
3. RQ: Was there an effect on self-concept, as measured by the TSCS:2 Family
subscale, between students who participated in a short term low ropes course
program and those who did not?
a. H10: There is no effect on self-concept pre/post Family sub scores
4. RQ: Was there an effect on self-concept, as measured by the TSCS:2
Academic/Work subscale, between students who participated in a short term
low ropes course program and those who did not?
a. H10: There is no effect on self-concept pre/post Academic/Work sub
scores
5. RQ: Was there an effect on self-concept, as measured by the TSCS:2 Moral
subscale, between students who participated in a short term low ropes course
program and those who did not?
a. H10: There is no effect on self-concept pre/post Moral sub score.
6. RQ: Was there an effect on self-concept, as measured by the TSCS:2 Personal
subscale, between students who participated in a short term low ropes course
program and those who did not?
a. H10: There is no effect on self-concept pre/post Personal sub scores

42
7. RQ: Was there an effect on self-concept, as measured by the TSCS:2 Total
subscale, between students who participated in a short term low ropes course
program and those who did not?
a. H10: There is no effect on self-concept pre/post Total sub scores
8. RQ: Was there an effect on self-concept, as measured by the TSCS:2 Behavior
subscale, between students who participated in a short term low ropes course
program and those who did not?
a. H10: There is no effect on self-concept pre/post Behavior sub scores
9. RQ: Was there an effect on self-concept, as measured by the TSCS:2 Physical
subscale, between students who participated in a short term low ropes course
program and those who did not?
a. H10: There is no effect on self-concept pre/post Physical sub scores

43
CHAPTER IV
Results
The focus of this research project was to observe the relationship between a low
ropes course experience and the self-concept of first-generation college students using the
measure Tennessee Self-Concept Survey:2 (TSCS:2). This chapter will present the
findings for the statistical analyses conducted to address the research hypotheses outlined
at the beginning of the study.
Analysis of Treatment
Control and treatment of the experiment and subscales of the TSCS:2 were
analyzed using a one-way ANOVA with the treatment as the between-subject factor and
the subscale as the dependent variable. Descriptive statistics for time are in Table 2.
Table 2
Means for all conditions low ropes course (LRC) on self-concept outcome measures
(Standard errors in parentheses)
Subscale LRC- Pre No LRC- Pre LRC- Post No LRC- Post
Self-
Criticism
3.13 (0.08) 3.08 (0.133) 3.12 (0.09) 3.27 (0.14)
Behavior 3.71 (0.05) 3.62 (0.08) 3.71 (0.06) 3.53 (0.09)
Physical 3.64 (0.07) 3.55 (0.10) 3.73 (0.07) 3.53 (0.11)
Moral 3.71 (0.06) 3.68 (0.09) 3.89 (0.06) 3.54 (0.10)
Personal 3.96 (0.05) 3.76 (0.13) 4.09 (0.07) 3.77 (0.14)
Family 3.81 (0.08) 3.70 (0.12) 3.77 (0.08) 3.57 (0.13)
Social 4.05 (0.08) 3.82 (0.08) 3.87 (0.07) 3.60 (0.09)
Academic 3.69 (0.09) 3.60 (0.11) 3.85 (0.12) 3.50 (0.10)
Total 3.68 (0.08) 3.81 (0.05) 3.39 (0.16) 3.90 (0.07)

44
Description of Study Participants
The grade levels of the participants in both groups are presented below in Table 3.
This information was self-reported by participants in a demographics survey collected
prior to the TSCS:2.
Table 3
Demographics by group and level of grade
Research Group Freshman Sophomore Junior Senior
Low Ropes
group
11 21 18 12
No-Low Ropes
group
0 15 15 0
Total 11 36 33 12
Note. Two unanswered responses
The gender distribution of participants in both groups is presented in Table 4
below. This information was reported by participants in the demographic survey that was
taken prior to the TSCS:2.
Table 4
Gender Frequency Distribution of Participants by Research Group
Research
Group
Male Female % Male % Female
Low Ropes
group
26 36 41.9% 58.1%
No-Low Ropes
group
10 20 33.3% 66.6%
Total 36 56 39.1% 60.9%
Note. Two unanswered responses

45
Demographic Information
Table 5 displays the self-identified ethnic background of the participants of both groups.
The demographic survey presented six choices for ethnicity. These data were self-
reported by participants in the study.
Table 5
Ethnic Distribution
Ethnicity Group One Group Two Total
Black 3 (.05%) 0 (.0%) 3 (.03%)
Hispanic 56 (90.3%) 28 (100) 84 (91.3%)
Native American 2 (.03) 0 (.0%) 2 (.02)
White 1 (.01) 0 (.0%) 0 (.01%)
Asian 0 (.0%) 0 (.0%) 0 (.0%)
Other 0 (.0%) 0 (.0%) 0 (.0%)
Total 62 (100%) 28 (100%) 92 (100%)
Note. Two unanswered responses
Statistical Findings
Assumptions
Assumptions associated with ANOVA and repeated-measures ANOVA were
tested. Tests included normality and homogeneity of variance. In this study, the group
sizes were unequal and assumption of homogeneity of variance was violated because of
imbalance. This finding means that there is a possibility that the F statistic was biased
and that there could be a higher possibility of a Type II error (not finding a significant
finding when one really exists). The significance level in the data set of this study could
be overestimated, which may cause a decrease in the power of the test. Effects are harder
46
to detect in smaller sample sizes, which may lead to falsely failing to reject the null
hypothesis. However, ANOVA is rather robust to this issue, residual data were within
normal limits, and no adjustment was made. Conversely, Power is established on the
smallest sample size, so while it does not diminish power to garner more observations in
the larger group, it is not of any further benefit either (Keppel, 1991).
For assumptions associated with normality, visual analysis found the data to meet
the assumption of normality. The histograms displayed a normal curve. ANOVA is very
robust in regard to violations of normality and all of the data fell within those guidelines.
All graphs and tables for these analyses can be found in Appendix A.
Primary Analysis
Primary analysis consisted of an independent analysis of each research question.
These included differences in mean scores for Self-Criticism, behavior, moral, physical,
social, academic/work, family, and total self-concept. Source tables can be found in
Appendix C-D. For each analysis, a repeated measures analysis of variance (rm-ANOVA)
was conducted with condition as the between subjects factor and the dependent variable
score of interest as the within subjects factor (subscale scores).
1. Research Question: Was there a change in self-concept, as measured
by the TSCS:2 Self-Criticism subscale, between students who participated in a short
term low ropes course program and those who did not?
The main effect of time was not significant, F(1,89) = 0.11, p = 0.74. At the pre-
test, the mean for Self-Criticism was 3.11 and at the post-test the mean score was 3.17.
Participants did not change significantly in Self-Criticism. The interaction between time
of TSCS:2 survey administration and condition was not significant, F(1,89) = 2.47, p =

47
0 .12. The participants who participated in a low ropes course did not have a greater
change in Self-Criticism (M1=3.13 and M2=3.12) than participants who did not participate
in a low ropes course (M1=3.08 and M2=3.27).
2. Research Question: Was there a change in self-concept, as measured
by the TSCS:2 Behavior subscale, between students who participated in a short
term low ropes course program and those who did not?
The main effect of time was not significant, F(1,89) = 1.97, p = 0.16. At the pre-test, the
mean for Behavior was 3.68 and at the post-test the mean score was 3.65. Participants did
not change significantly in Behavior. The interaction between time of TSCS:2 survey
administration and condition was not significant, F(1,89) = 1.12, p = 0.29. The
participants who participated in a low ropes course did not have a greater change in
Behavior (M1=3.71 and M2= 3.71) than participants who did not participate in a low
ropes course (M1=3.68 and M2=3.53).
3. Research Question: Was there a change in self-concept, as measured
by the TSCS:2 Physical subscale, between students who participated in a short term
low ropes course program and those who did not?
The main effect of time was not significant, F(1,89) = 1.69, p = 0.20. At the pre-
test, the mean for Physical was 3.64 and at the post-test the mean DV score was 3.66.
Participants did not change significantly on Physical. The interaction between time of
TSCS:2 survey administration and condition was not significant, F(1,89) = 1.31, p =
0.26. The participants who participated in a low ropes course did not have a greater
change in Physical (M1=3.64 and M2= 3.73) than participants who did not participate in a
low ropes course (M1=3.55 and M2=3.53).

48
4. Research Question: Was there a change in self-concept, as measured
by the TSCS:2 Moral subscale, between students who participated in a short term
low ropes course program and those who did not?
The main effect of time was significant, F(1,89) = 3.74, p = 0.06. At the pre-test,
the mean score for Moral was 3.70 and at the post-test the mean score was 3.77.
Participants did not change significantly in Moral. The interaction between time of
TSCS:2 survey administration and condition was significant, F(1,89) = 11.14, p = 0.001.
The participants who participated in a low ropes course did not have a greater change in
Moral (M1=3.71 and M2=3.89) than participants who did not participate in a low ropes
course (M1=3.68 and M2=3.54).
5. Research Question: Was there a change in self-concept, as measured
by the TSCS:2 Personal subscale, between students who participated in a short term
low ropes course program and those who did not?
The main effect of time was significant, F(1,89) = 4.74, p = 0.03. At the pre-test,
the mean for Personal was 3.89 and at the post-test the mean DV score was 3.98.
Participants did not change significantly in Personal. The interaction between time of
TSCS:2 survey administration and condition was not significant, F(1,89) = 1.53, p =
0.22. The participants who participated in a low ropes course did not have a greater
change in Personal (M1=3.96 and M2=4.09) than participants who did not participate in a
low ropes course (M1=3.89 and M2=3.77).
6. Research Question: Was there a change in self-concept, as measured
by the TSCS:2 Family subscale, between students who participated in a short term
low ropes course program and those who did not?
49
The main effect of time was not significant, F(1,89) = 1.50, p = 0.22. At the pre-
test, the mean for Family was 3.77 and at the post-test the mean DV score was 3.71.
Participants did not change significantly in Family. The interaction between time of
TSCS:2 survey administration and condition was not significant, F(1,89) = 0.99, p =
0 .32. The participants who participated in a low ropes course did not have a greater
change in Family (M1=3.81 and M2=3.77) than participants who did not participate in a
low ropes course (M1=3.70 and M2=3.57).
7. Research Question: Was there a change in self-concept, as measured
by the TSCS:2 Social subscale, between students who participated in a short term
low ropes course program and those who did not?
The main effect of time was significant, F(1,89) = 4.87, p = 0.03 At the pre-test,
the mean for Social was 4.04 and at the post-test the mean DV score was 3.87.
Participants did not change significantly in Social. The interaction between time of
TSCS:2 survey administration and condition was not significant, F(1,89) = 0.12, p =
0 .72. the participants who participated in a low ropes course did not have a greater
change in Social (M1= 4.05 and M2=3.87) than participants who did not participate in a
low ropes course (M1= 3.82 and M2 = 3.60).
8. Research Question: Was there a change in self-concept, as measured
by the TSCS:2 Academic/Work subscale, between students who participated in a
short term low ropes course program and those who did not?
The main effect of time was not significant, F(1,89) = 2.69, p = 0.11. At the pre-
test, the mean for Academic/Work was 3.66 and at the post-test the mean DV score was
3.73. Participants did not change significantly in Academic/Work. The interaction

50
between time of TSCS:2 survey administration and condition was not significant, F(1,89)
= 2.41, p = 0.12. The participants who participated in a low ropes course did not have a
greater change in Academic/Work (M1=3.69 and M2=3.85) than participants who did not
participate in a low ropes course (M1=3.60 and M2=3.49).
9. Research Question: Was there a change in self-concept, as measured
by the TSCS:2 Total subscale, between students who participated in a short term
low ropes course program and those who did not?
The main effect of time was significant, F(1,89) = 10.28, p = 0.002. At the pre-
test, the mean for Total self-concept was 3.76 and at the post-test the mean DV score was
3.74. Participants changed significantly in Total self-concept. The interaction between
time of TSCS:2 survey administration and condition was significant, F(1,89) = 6.71, p =
0.01. The participants who participated in a low ropes course had a greater change in
Total self-concept (M1=3.81 and M2= 3.90) than participants who did not participate in a
low ropes course (M1=3.68 and M2=3.39). See Figure 3.
A post-hoc analysis for effect size using an Eta squared was conducted. The effect
size for eta squared (η2) is measured to be small at 0.02, a medium effect at 0.13, and
large if the effect size is above 0.26 (Cohen, Cohen, West, & Aiken, 2003). Effect size is
a significant outcome of empirical studies such as this, and it can highlight the
significance of the results (Lakens, 2013). The interaction between time of TSCS:2
survey administration and condition was significant, F(1,89) = 6.71, p = 0.01, with an
effect size of η2=0.36. This means that 36% of the total variance could be accounted for
by being in either one of the groups. This means that the likelihood that study results

51
could be replicated in other research is high according to effect size ranges (Cohen,
Cohen, West, & Aiken, 2003).
Figure 3. Estimated marginal means for DV Total
3
3.5
4
1 2
Esti
mat
ed M
argi
nal
Mea
ns
Time
Low Ropes
No Low Ropes

52
CHAPTER V
Discussion
Study Overview
The focus of this research was to examine if participation in a low ropes course
(LRC) experience revealed a relationship between a LRC experience and the self-concept
of first-generation colleges students enrolled in a University of New Mexico College Prep
program for secondary school students. A convenience sample of 94 study participants
registered into a yearlong dual credit course at the University of New Mexico was used to
capture study participants. Participants completed two surveys (pre/post), during week
one and week three of a three-week period. There were two participant groups: 1) Low
Ropes group, received a 12-hour LRC experience divided equally into three sessions
during the survey period; 2) No-Low Ropes group, did not receive an LRC experience
during the survey period and remained in the classroom setting. Both participant groups
took the TSCS:2 pre-survey approximately 30 minutes prior to the first LRC experience
for Low Ropes group and the first classroom session for No-Low Ropes group. Both
groups also took a post- experience survey on the last day of the Low Ropes group’s third
and final LRC experience and No-Low Ropes’ third classroom session. Data were
collected from the surveys that were completed from the pre and post survey periods. The
Low Ropes group participated in a 12-hour LRC program that extended over a three-
week period, four hours per session, and once per week. It took three weeks to complete
the data collection period.
For first-generation college students, self-concept and personal confidence has as
much to do with the success as academic performance. This may consist of the ability to

53
adhere to and create an academic plan, navigate campus life, social structures, and the
intrinsic qualities that motivate daily action. How well a student feels about their ability
to complete the aforementioned tasks is referred to as self-concept.
The data revealed that the Low Ropes group students benefited from the low
ropes course. Overall, Self-Concept survey scores improved after the LRC experience
and significance in Total self-concept was present. This may have a profound impact on
the classroom setting. If the curriculum includes low ropes course or similar experiences,
teachers may have an easier time creating a warm learning environment based upon
students having had the opportunity to engage with one another in authentic experiences.
This study found significance in the two focus areas of the metric, which were time and
group. The main effect of time was significant, F(1,89) = 10.28, p = 0.002. This valuable
finding suggests that time spent on a ropes course positively changed total self-concept.
The interaction between time of TSCS:2 survey administration and condition was
significant, F(1,89) = 6.71, p = 0.01. These data demonstrated that there was a
significant improvement in self-concept of the sample of Low Ropes Group compared to
the No-Low Ropes, who did not receive the LRC experience. This valuable finding
strongly suggests that a group who receives an LRC experience will improve self-concept
comparted to a group that does not. This change shows a Total score that indicates
students were able to maintain and continue building their self-concept during each LRC
session. The use of the Total score as the measurement in each hypothesis is correct since
it is considered by the authors to be the representation summary of all of the subscale
scores (Fitts & Warren, 1996). The data presented indicated that the group that received
the LRC improved Total self-concept and the group that did not showed a decrease in

54
self-concept. These data met significance in the most important summative score
established by the survey. As a result, the research data supported with significance that a
low ropes course experience increased the self-concept of first-generation college
students.
Positive findings in experiential education are symbolic, but so is skepticism.
Hatch (2005) revealed that despite data indicating short-term gains in cohesion,
individual and group effectiveness was not maintained over a two-month period. This
short-term control is what this research had explored. Finkenberg, Shows, and DiNucci
(1994) exposed that challenge course experiences increased individual’s self-efficacy,
resiliency, and optimism, but left questions regarding the individual’s ability to transfer
what was learned to other settings. Eadie (2009) revealed that positive outcomes attained
by a school board that experienced a challenge course retreat had diminished just months
after training. Board members described how they had made personal connections and
communicated well in establishing working guidelines; yet, all was quickly forgotten
when the school board members faced their workplace reality. Board members eventually
returned to their old ways of bickering and creating tension. Similarly, participants in low
ropes challenge courses had concerns in using the experience as a tool in becoming
effective communicators. Some participants felt that there were too many people allowed
to speak and make decisions at one time.
Results from this study have theoretic positions to add to our identification of how
experiential education curriculum impacts self-concept and the learning environment and
in its relationship to first-generation college students. The results will be discussed in
relationship to the research question; was there an effect of self-concept as measured by

55
the TSCS:2 between students who participated in a short term low ropes course program
and those who did not. The relationship of the main hypotheses tested for Self-Concept
were also evaluated.
The hypotheses proposed an effect on Self-concept after students participated in a
LRC experience. It was expected that students who received the LRC experience would
change in self-concept as measured by the survey compared with those students that did
not receive the LRC experience. This hypothesis was supported by these results. As the
most important measure, Total revealed change for the Low Ropes group. There were
group differences suggesting that the LRC experience improved Self-concept as
measured by the TSCS:2. Specifically, the LRC experience had a greater change in Total
self-concept (M1=3.81 and M2= 3.90) compared with participants who did not participate
in a low ropes course (M1=3.68 and M2=3.39). The lack of change in Low Ropes group
and No-Low Ropes group in the other sub-categories of self-concept came as a surprise.
There are potential reasons for why this finding was absent in the data set. First, the
unbalanced division of the participant groups, which was 2:1. Second, small sample size
reduced the power of the study in finding significant group differences. Third, there could
be no differences among the two groups of study participants. Finally, the No-Low Ropes
group curriculum and instruction could be similarly prominent in the subscale context.
The unbalanced nature of the groups presented a 2:1 ratio in which all of the No-Low
Ropes group were garnered for the study and only about half of the Low Ropes Group
were garnered. The No-Low Ropes group displayed a rapport that showed a closer bond
from the very beginning, which was evident in the first survey as they assisted one
another in translating some of the survey questions from Spanish to English in a

56
noticeably friendly way. In contrast, Low Ropes Group would ask their teacher supports
who were near if they needed translation rather than their peers. This is an observation is
worth noting because the No-Low Ropes group was a closer group to start and the Low
Ropes group needed hours of team building experiences to form a similar dynamic.
Total Self-concept is the single most important measure of the TSCS:2. It is one’s
reflection of whole self-concept and accompanying degree of self-esteem (Fitts &
Warren, 1996). In addition, self-concept might be the single most important factor for
student success (James, 1983). Compared to the other survey subscales, Total Self-
Concept scores displayed the strongest correlations. Participants in the LRC experience
had greater change in Total Self-Concept, and the participants who did not participate in
the low ropes course experience during this period showed a clear decrease in Total Self-
Concept.
Limitations
This research study had limitations that should be discussed. First, the groups
were not completely randomized. The No-Low Ropes group included all participants
within the program, and all students chose to participate in the study. In this case,
students were part of an intact group that was gathering for the first time. The fact that all
students chose to participate is notable. Grouping for the Low Ropes Group included 60
students, which represented about half of the students in the program. The Low Ropes
group and the No-Low Ropes group were pooled from the students who both decided to
come to programming on Saturday and chose to be part of the study. The fact that the
sample was not randomly selected nor randomly assigned into groups is of importance.
Random assignment confirms that participants in a cause and effect study are equitable.

57
Random assignment inhibits one’s history from triggering an irrelevant variable within
the experiment and the only time it should be negotiated is for ethical reasons (Ong-
Dean, Huie Hofstetter, & Strick (2011). In this study, both consenting programs wanted
all students to have a chance to participate and remain in their respective cohorts.
Ethically speaking, the research did not want to exclude students from the experience.
The second limitation to the study is that it was underpowered. The power for this
study was set at N=126, and the actually power achieved for this study was N=94. The
fact that this study only met 75% of Power is mentionable, because the sample size was
32 participants short of reaching full power. Since smaller samples produce reduced
power, a small sample size may not be able to detect an important difference. In addition,
small samples destabilize external and internal validity. However, at 75% power, it has
not been determined that this is a very small sample size.
The ability for students to fully understand the survey questions may have been a
limitation. For example, at least 30 of the participants were individuals with whose
primary or first language was not English, and many participants were consulting one
another to clarify items. This happened at many points during the survey completion even
though participants had the option to ask the researcher for clarification. In addition, the
wording of some questions seemed to confuse some participants. For example, one
question asked, “I quarrel with my family”, in this case many students did not understand
what the word “quarrel” meant. This was known when students asked what the word
meant and they commented that the word argue would’ve made more sense to them This
was discovered after the survey when students began to talk about survey items and asked
what the word “quarrel” meant. This scenario of consulting friends and being briefed on

58
the study participation may have caused some to be influenced by what is called the
Hawthorne effect. The Hawthorne effect is when a participant’s behavior is altered
because they know they are being studied. The first-generation students in this study were
briefed on the study, and this may have had an effect on responses and, therefore, may
have affected results (Gay, 1996).
The experience and skill level of the low ropes course facilitator may be
considered a limiting factor. The development and socialization of a facilitator is unique,
and no two individuals are alike. The training, skills, experiences, and approaches can
produce a wide range of individuals from courses all over the country. It is worth
recalling from the literature discussion that the ability of the facilitator could have as
much to do with the success of a LRC group as the group itself (Schoel, Prouty, &
Radcliff, 1988). The facilitator may have added to Procedural Bias as the structure added
undue pressure. This information is of considerable importance to this research. The
facilitators’ natural flow and delivery were impacted by the protocol of the study. The
formal organization and structured approach at times seemed like the laboratory
adherence to protocol overran the facilitator delivery rather than the typical relaxed
approach, which is filled with much more discovery and overall free will. The
participants knew they were part of a study and had the overtone to match. The same was
true about the facilitators. They had the aura as if they had to be more serious or
intentional in delivery, which was observed during each session.
Of the limitations, two stood out as influential to this research: facilitator
performance and the TSCS:2 survey. The TSCS:2 survey and the accompanying protocol
made for a more structured environment. Participants normally receive the LRC

59
experience in a relaxed setting without rigid protocol. For example, adhering to time
constraints was part of the experience when normally time is much more flexible in the
absence of IRB protocol. In this study, facilitator ability was hindered. LRC facilitators
are not trained to be part of such a formal process being attached to experiential
education. In general, the environment was intentional, and the best way to pronounce it
is with a description being compulsory or forced.
Recommendations for Future Research
It would be beneficial to replicate this study, since the population of participants
was previously unexamined. It is strongly recommended that the study groups be chosen
in a more random manner and from one large pool of students rather than students with
similar characteristics from two separate groups. Efforts should be made for a replicated
study to reach full power, so that the strength of the findings is more substantial. The time
span of the study may also be of importance for future research. Based on similar short-
term studies, there is a significant body of literature that suggests the longer the
intervention the more significant the results. It is recommended that a duplication of this
study be carried out over several months rather than several weeks. Increasing the amount
of intervention time may be the most efficient way to study the relationship between self-
concept, the low ropes course, and first-generation student populations.
The practical significance of this study’s findings may have implications for the
classroom and/or group setting. Teachers often tell their class that they want them to work
together as a cooperative team without providing a framework or example of requisite
behaviors. It would be valuable for teachers to offer students authentic experiences to
practice cooperation, teamwork, and collaboration with their peers prior to engaging in

60
traditional classroom interactions. The low ropes course and accompanying cooperative
activities should be used as one of many classroom or group building tools. Students
innately will have a wide variety of learning styles it would make sense to use an array of
teaching tools to reach the as many students as possible. low ropes course activities may
very well provide the tacit learning situations that are becoming more and more absent in
the today’s education landscape.
Conclusion
The purpose of this research was to examine the relationship between challenge
courses and the self-efficacy of first-generation college students. The findings revealed
that students who participated in the LRC during the survey period experienced
significant change in the most important measurable sub-category (Total), as identified by
the survey authors (Fitts & Warren, 1996) compared to the students who did not
participate in the low ropes course. The change that occurred may serve as a marker for
enriching curriculum design and instructional techniques in pre-No-Low Ropes groups.
LRC instructional tools and strategies may be used to support the population of pre-
college students who are not officially enrolled in a program, such as students in
secondary school who may have an LRC or similar experience as part of their high
school curriculum. The consideration of low ropes courses and other experiential
education experiences as a part of the overall classroom curriculum could have positive
impact not only for individual students, but also for the entire institution. Teachers and
Administrators tend to recite phrases such as “I want you all to get along” or “You all
should work as a team,” yet they fail to provide the space and setting for students to learn
how to practice cooperation, respect, and teamwork. The practice of LRC as part of the
61
curricula allows students the opportunity and time to get to know their peers and learn
more about how to work effectively with them. The LRC also provides the learning space
for individuals to learn about themselves and how they can effectively work with others
and how to engage in school. Students and teachers stand to gain the most from the
learning outcomes provided by low ropes activities. The LRC provides an appropriate
platform for students to practice the principles that teachers ask the class to model in a
flexible setting among their peers.

62
List of Appendices
Appendix A Analysis of the Test for Normality ................................................................ 63
Appendix B Test for Homogeneity of Variance ................................................................ 81
Appendix C Tests of Within-Subjects Effects ................................................................... 82
Appendix D Tests of Between Subjects Effects ................................................................ 84
Appendix E Demographic Information ............................................................................ 86
Appendix H IRB Consent Form ....................................................................................... 91
Appendix I IRB Approved Assent Form ........................................................................... 93
Appendix J IRB Project Information Form ...................................................................... 94
Appendix K Department Review ...................................................................................... 97
Appendix L IRB Project Closure ...................................................................................... 98

63
Appendix A
Analysis of the Test for Normality
Figure A1. Self-Criticism Pre Survey: Analysis of the Test for Normality

64
Figure A2. Self-Criticism Post Survey: Analysis of the Test for Normality

65
Figure A3. Behavior Pre Survey: Analysis of the Test for Normality
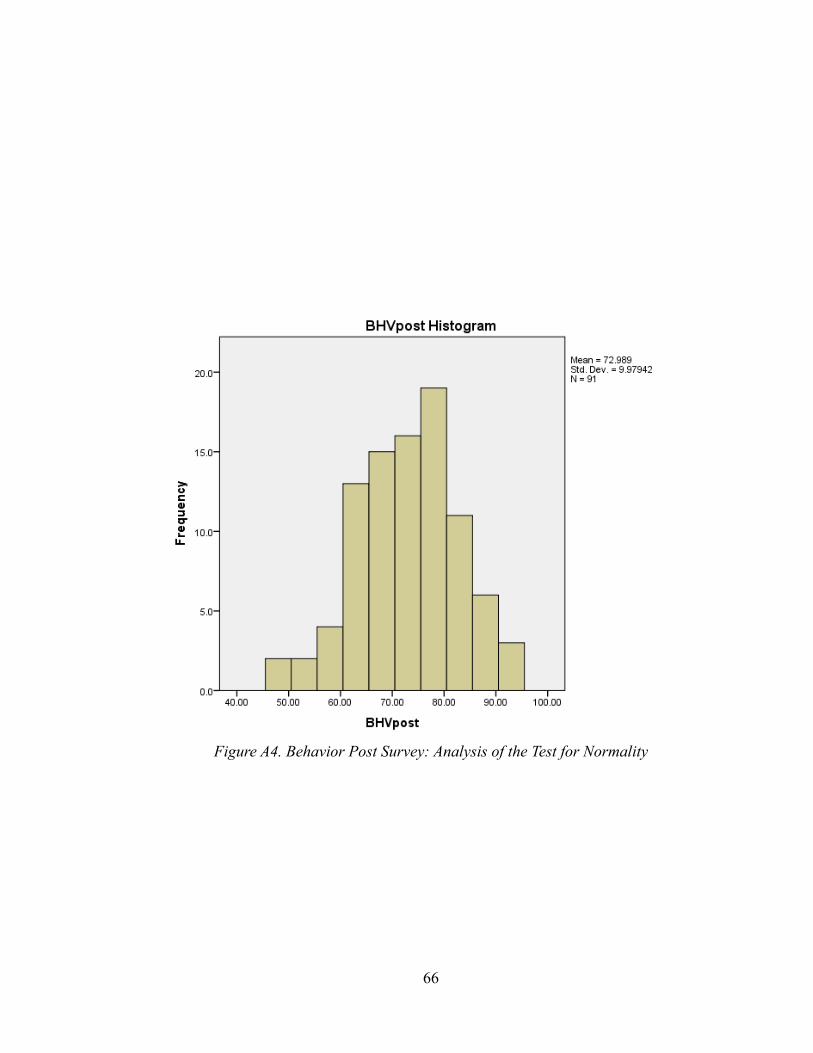
66
Figure A4. Behavior Post Survey: Analysis of the Test for Normality

67
Figure A6. Physical Pre Survey: Analysis of the Test for Normality
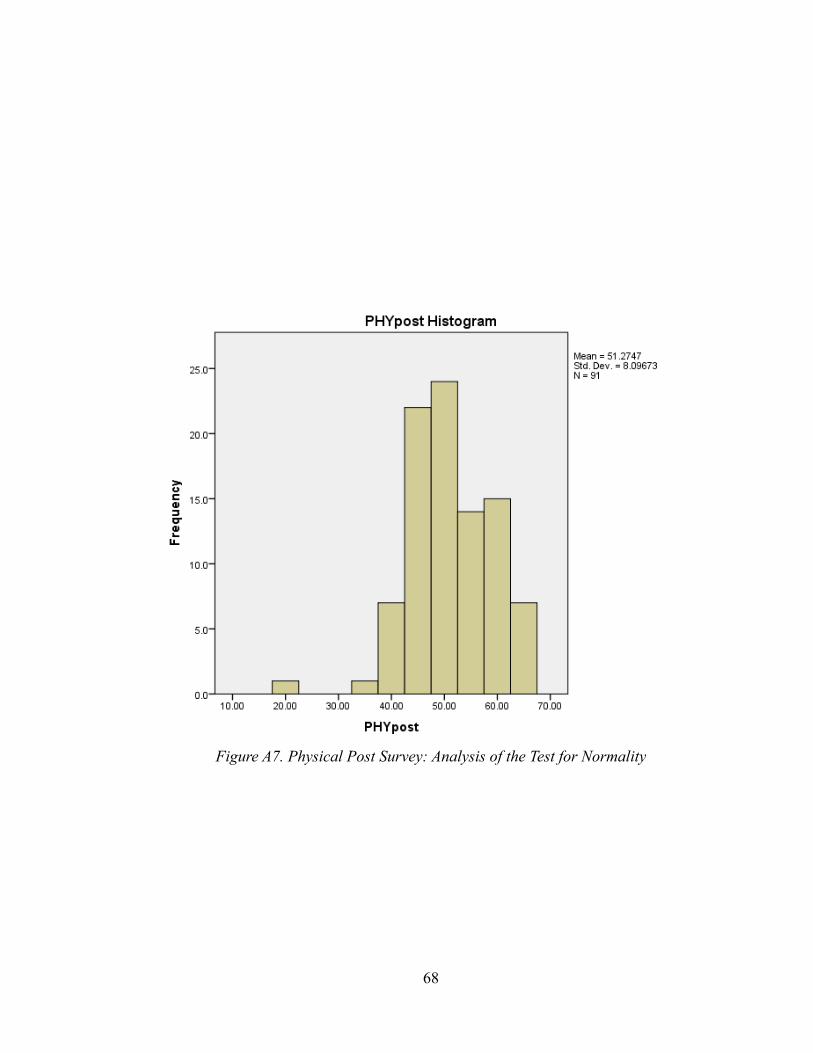
68
Figure A7. Physical Post Survey: Analysis of the Test for Normality

69
Figure A8. Moral Pre Survey: Analysis of the Test for Normality

70
Figure A9. Moral Post Survey: Analysis of the Test for Normality

71
Figure A10. Personal Pre Survey: Analysis of the Test for Normality

72
Figure A11. Personal Post Survey: Analysis of the Test for Normality

73
Figure A12.Family Pre Survey: Analysis of the Test for Normality

74
Figure A13. Family Post Survey: Analysis of the Test for Normality

75
Figure A14. Social Pre Survey: Analysis of the Test for Normality

76
Figure A15. Social Post Survey: Analysis of the Test for Normality

77
Figure A16. Academic Pre Survey: Analysis of the Test for Normality
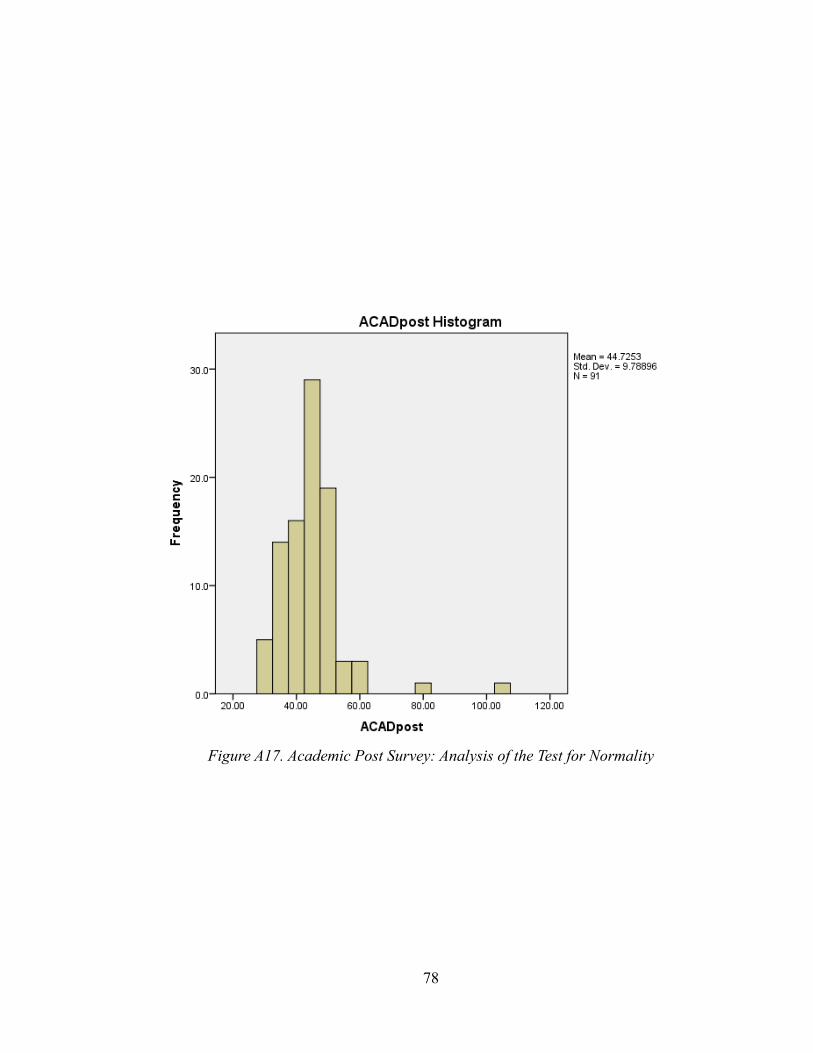
78
Figure A17. Academic Post Survey: Analysis of the Test for Normality

79
Figure A18. Total Pre Survey: Analysis of the Test for Normality
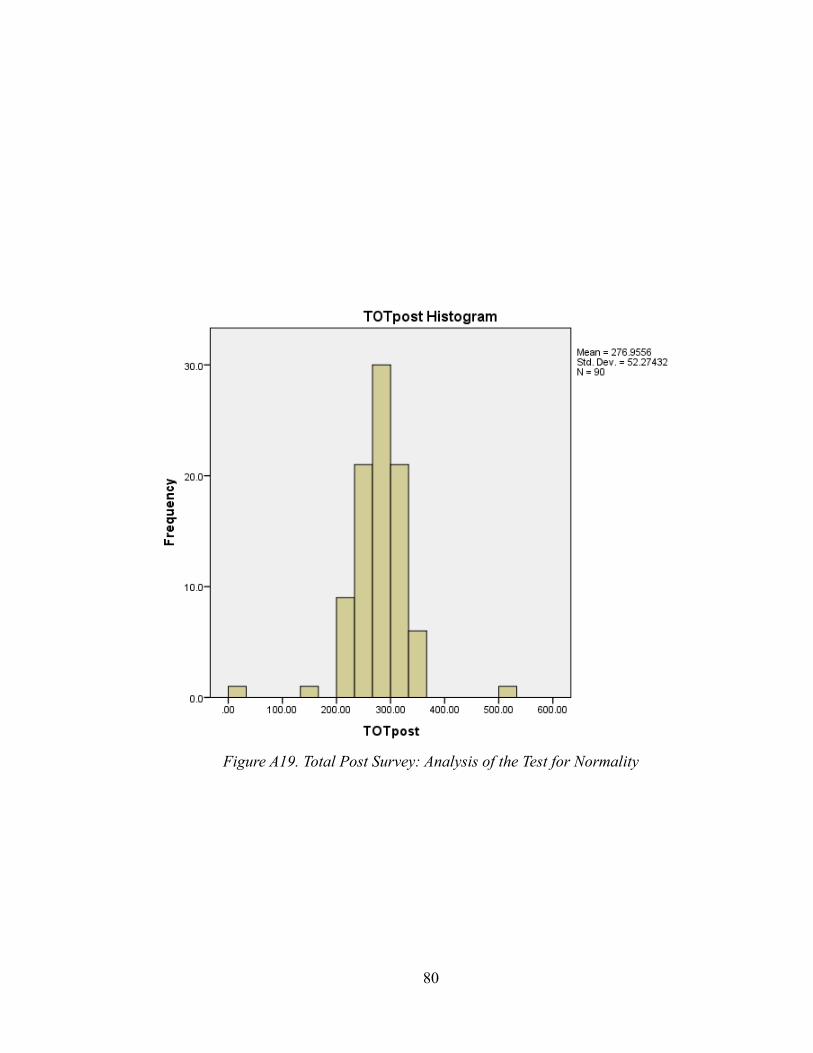
80
Figure A19. Total Post Survey: Analysis of the Test for Normality
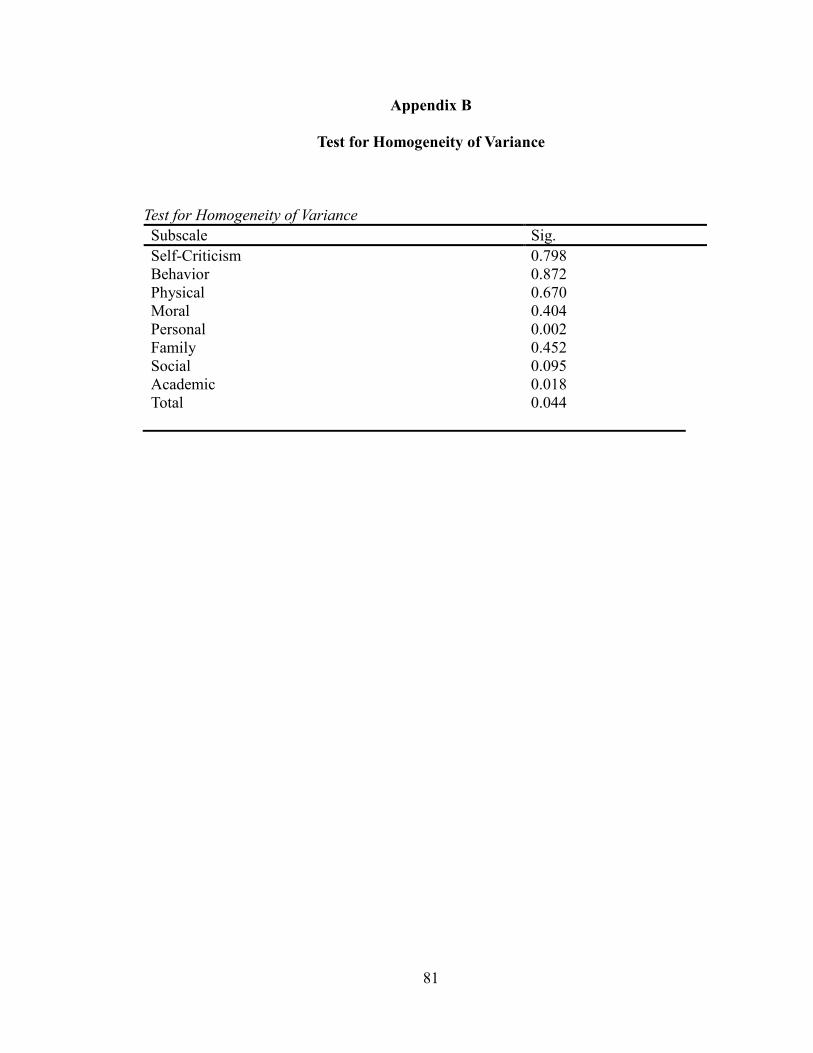
81
Appendix B
Test for Homogeneity of Variance
Test for Homogeneity of Variance
Subscale Sig.
Self-Criticism 0.798
Behavior 0.872
Physical 0.670
Moral 0.404
Personal 0.002
Family 0.452
Social 0.095
Academic 0.018
Total 0.044

82
Appendix C
Tests of Within-Subjects Effects
Tests of Within-Subjects Effects
Dependent Variable: Self-Criticism
Source Type III Sum of
Squares
df Mean Square F Sig.
Self-Criticism .309 1 .309 1.756 .189
Condition .435 1 .435 2.474 .119
Error (Self
Criticism)
15.660 89 .176
Tests of Within-Subjects Effects
Dependent Variable: Behavior
Source Type III Sum of Squares df Mean Square F Sig.
Behavior .086 1 .086 1.460 .230
Condition .066 1 .066 1.120 .293
Error(Behavior) 5.235 89 .059
Tests of Within-Subjects Effects
Dependent Variable: Physical
Source Type III Sum of Squares df Mean Square F Sig.
Physical .038 1 .038 .384 .537
Condition .131 1 .131 1.314 .255
Error(Physical) 8.851 89 .099
Tests of Within-Subjects Effects
Dependent Variable: Moral
Source Type III Sum of Squares df Mean Square F Sig.
Moral .020 1 .020 .226 .636
Condition .972 1 .972 11.143 .001
Error(Moral) 7.764 89 .087
Tests of Within-Subjects Effects
Dependent Variable: Personal
Source Type III Sum of
Squares
df Mean Square F Sig.
Personal .208 1 .208 2.357 .128
Condition .135 1 .135 1.534 .219
Error(Personal) 7.838 89 .088

83
Tests of Within-Subjects Effects
Dependent Variable: Family
Source Type III Sum of Squares df Mean Square F Sig.
Family 1.520 1 .264 2.625 .109
Condition .569 1 .099 .983 .324
Error(Family) 51.514 89 .100
Tests of Within-Subjects Effects
Dependent Variable: Social
Source Type III Sum of Squares df Mean Square F Sig.
Social 1.607 1 1.607 12.576 .001
Condition .015 1 .015 .120 .729
Error(Social) 11.373 89 .128
Tests of Within-Subjects Effects
Dependent Variable: Academic/Work
Source Type III Sum of
Squares
df Mean Square F Sig.
Academic Work .017 1 .017 .057 .811
Condition .694 1 .694 2.406 .124
Error(Academic
Work)
25.679 89 .289
Tests of Within-Subjects Effects
Dependent Variable: Total
Source Type III Sum of Squares df Mean Square F Sig.
Total .361 1 .361 1.700 .196
Condition 1.424 1 1.424 6.716 .011
Error(Behavior) 18.452 87 .212

84
Appendix D
Tests of Between Subjects Effects
Between Subjects Effect
Dependent Variable: Self-Criticism
Source Type III Sum of Squares df Mean Square F Sig.
Intercept 1594.212 1 1594.212 2033.311 .000
Condition .084 1 .084 .108 .743
Error 69.780 89 .784
Between Subjects Effect
Dependent Variable: Behavior
Source Type III Sum of Squares df Mean Square F Sig.
Intercept 2134.657 1 2134.657 5710.652 .000
Condition .736 1 .736 1.968 .164
Error 33.268 89 .374
Between Subjects Effect
Dependent Variable: Physical
Source Type III Sum of Squares df Mean Square F Sig.
Intercept 2099.430 1 2099.430 4118.042 .000
Condition .861 1 .861 1.689 .197
Error 45.373 89 .510
Between Subjects Effect
Dependent Variable: Moral
Source Type III Sum of Squares df Mean Square F Sig.
Intercept 2207.751 1 2207.751 5889.580 .000
Condition 1.402 1 1.402 3.740 .056
Error 33.362 89 .375
Between Subjects Effect
Dependent Variable: Personal
Source Type III Sum of Squares df Mean Square F Sig.
Intercept 2207.751 1 2207.751 5889.580 .000
Condition 1.402 1 1.402 3.740 .056
Error 33.362 89 .375
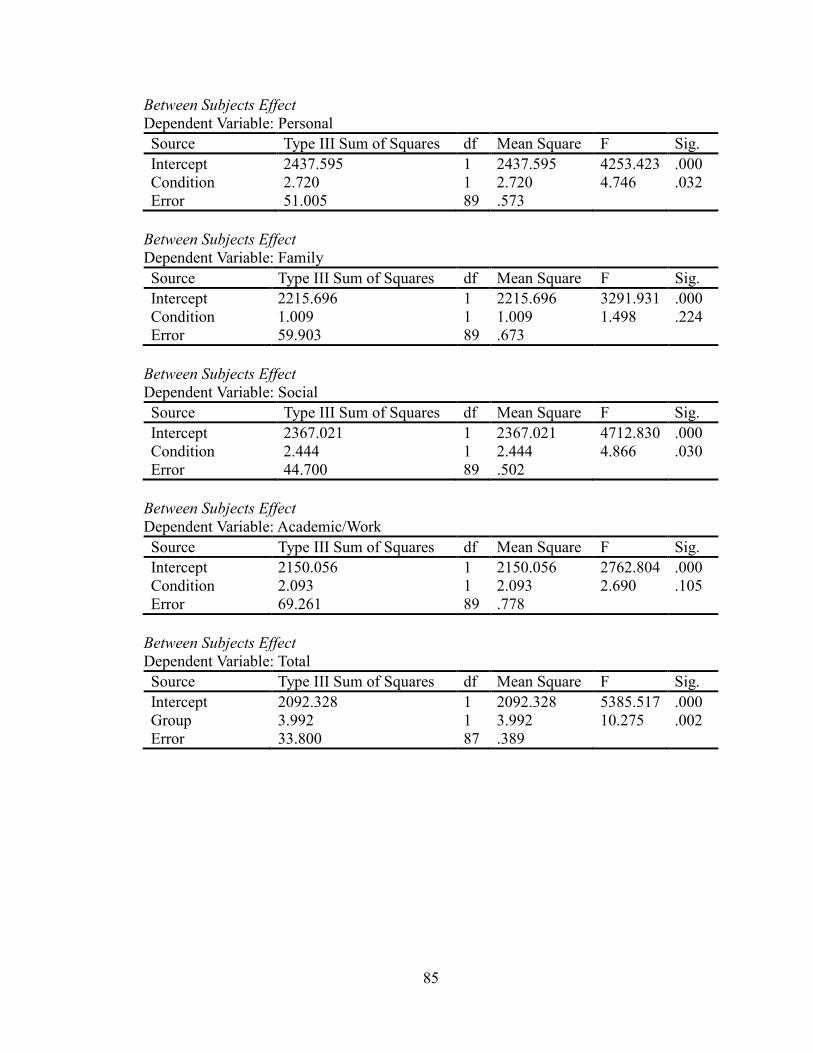
85
Between Subjects Effect
Dependent Variable: Personal
Source Type III Sum of Squares df Mean Square F Sig.
Intercept 2437.595 1 2437.595 4253.423 .000
Condition 2.720 1 2.720 4.746 .032
Error 51.005 89 .573
Between Subjects Effect
Dependent Variable: Family
Source Type III Sum of Squares df Mean Square F Sig.
Intercept 2215.696 1 2215.696 3291.931 .000
Condition 1.009 1 1.009 1.498 .224
Error 59.903 89 .673
Between Subjects Effect
Dependent Variable: Social
Source Type III Sum of Squares df Mean Square F Sig.
Intercept 2367.021 1 2367.021 4712.830 .000
Condition 2.444 1 2.444 4.866 .030
Error 44.700 89 .502
Between Subjects Effect
Dependent Variable: Academic/Work
Source Type III Sum of Squares df Mean Square F Sig.
Intercept 2150.056 1 2150.056 2762.804 .000
Condition 2.093 1 2.093 2.690 .105
Error 69.261 89 .778
Between Subjects Effect
Dependent Variable: Total
Source Type III Sum of Squares df Mean Square F Sig.
Intercept 2092.328 1 2092.328 5385.517 .000
Group 3.992 1 3.992 10.275 .002
Error 33.800 87 .389

86
Appendix E
Demographic Information
1. Student Status:
a. Freshman
b. Sophomore
c. Junior
d. Senior
2. Age:
a. 14-18yrs
b. 21-24yrs
c. 19 -23yrs
d. 23-28yrs
e. >28yrs
3. Years Enrolled in College:
a. 0yr
b. 1-2yrs
c. 3yrs
d. 4yrs
e. >5yrs
4. Gender:
a. Male
b. Female
5. Ethnicity:
a. Hispanic or Latino
b. Asian
c. Native American
d. Black or African American
e. White
f. Other
6. Housing Status:
a. On campus
b. Off campus w/ Parents
c. Off campus w/out parents
7. Are you currently involved in extra-curricular activities?
a. Social Organization
b. Athletics
c. Academic Organizations
d. Other
e. Not involved
8. Do you either of your parents have at least a bachelor’s degree?
a. Yes
b. No

87
Appendix F
Assumption of Risk Consent
UNIVERSITY OF NEW MEXICO
Low Ropes course ASSUMPTION OF RISK
In return for the acceptance of my participation in the activities of the University of New
Mexico LOW ROPES, herein referred to as "UNM-low ropes course", I the participant
named below agree as follows:
1. The participant is instructed that prior to participating in any UNM-low ropes course
activity and regularly thereafter, that he or she should inspect the facilities and equipment
to be used, and if he or she believes anything is
unsafe, the participant should immediately advise the instructor of such condition and
refuse to participate. Furthermore, the participant should refrain from involvement in any
activity which he or she deems inappropriate for him or herself.
2. Participant shall carefully review and follow all UNM-low ropes course safety
guidelines. Participant understands that his/her personal well-being can best be promoted
by his/her attention to the instructions of the UNM low ropes course staff, and agrees to
maintain an observant and cooperative attitude throughout the course(s).
3. Fully understands and acknowledges that: (a) there are risks and dangers inherent in
participation in climbing/confidence course activities and events, including but not
limited to those of bodily injury, partial and/or total disability, paralysis and death; (b) the
social and economic losses and/or damages,
which could result from those risks and dangers could be severe.
4. I hereby acknowledge the inherent risks and hazards of this activity. I acknowledge
that any claims for damage against the University of New Mexico or its officers or
employees for death, personal injury, or property damage which may occur as a result of
my participation in the above mentioned activity would be governed by the New Mexico
Tort Claims Act, which imposes limitations on the recovery of damages
from state institutions and their public employees.
5. Participant understands that the UNM-low ropes course, its instructors and facilitators,
and the University of New Mexico, STRONGLY recommend that the participant have
some type of medical and or health insurance to cover any possible accidents that might
occur while participating in these events.
THE UNDERSIGNED HAS READ THE ABOVE ASSUMPTION OF RISK AND
RELEASE AND WAIVER OF LIABILITY AND UNDERSTANDS THAT HE/SHE
HAS GIVEN UP SUBSTANTIAL RIGHTS BY SIGNING IT AND HAS SIGNED IT
VOLUNTARILY. PRINTED NAME OF
PARTICIPANT___________________________________
ADDRESS OF PARTICIPANT _____________________________
PHONE NUMBER OF PARTICIPANT ____________________________________
CONTACT PERSON IN CASE OF ACCIDENT
____________________________________________
SIGNATURE OF PARTICIPANT
_________________________DATE______________
SIGNATURE OF PARENT OR GUARDIAN IF PARTICIPANT IS UNDER 18
_________________________DATE_____________

88
Appendix G
Research Plan/Schedule
Research Schedule/Lesson Plan: Low Ropes group (Low-Ropes Group).
Session One 4hrs:
A. Introduction.
B. Explanation of research.
C. Consent forms.
D. Administration of Tennessee Self-Concept Scale:2 in classroom.
E. Description of Challenge Course activities outside.
F. Three hour Administration of Challenge Course activities listed below:
a. Challenge Course Safety briefing.
b. Challenge by choice briefing.
c. Turbine activity.
d. Commonalities.
e. Name Game.
f. Group Juggle.
g. Warp-Speed activity.
h. Human Knot.
i. Stepping Stones.
j. The Wind Is Blowing.
k. Link Tag.
l. Speed Dial.
G. Processing
a. How can this activity be applied in your student life?
b. What worked in this activity?
c. What challenges emerged in this activity?
d. What types of communication worked?
Session Two 4hrs:
A. Challenge Course safety briefing.
B. Four hour administration of Challenge Course activities listed below:
a. Log-Jam.
b. Wild Woozie.
c. Trollies.
d. Rope Spelling.
e. Duck Brigade.
f. Whale Watch.
g. Triangle Traverse.
h. Prouty’s Landing.
C. Processing
a. How can this activity be applied in your student life?
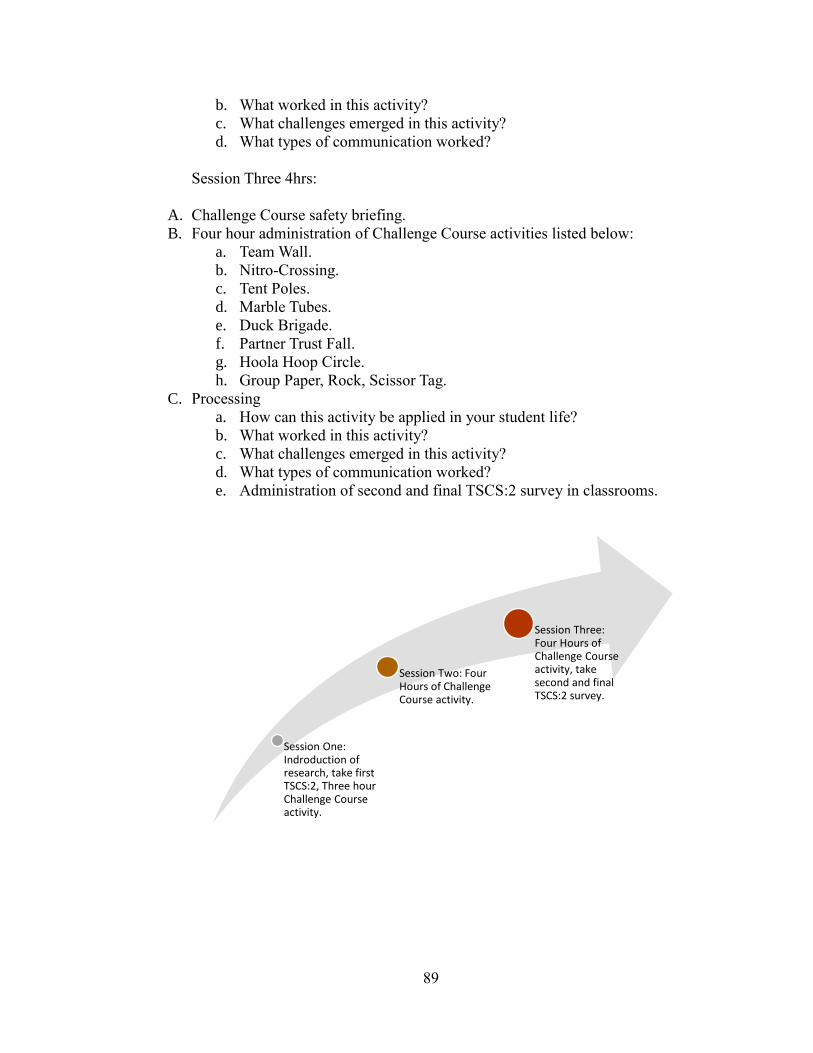
89
b. What worked in this activity?
c. What challenges emerged in this activity?
d. What types of communication worked?
Session Three 4hrs:
A. Challenge Course safety briefing.
B. Four hour administration of Challenge Course activities listed below:
a. Team Wall.
b. Nitro-Crossing.
c. Tent Poles.
d. Marble Tubes.
e. Duck Brigade.
f. Partner Trust Fall.
g. Hoola Hoop Circle.
h. Group Paper, Rock, Scissor Tag.
C. Processing
a. How can this activity be applied in your student life?
b. What worked in this activity?
c. What challenges emerged in this activity?
d. What types of communication worked?
e. Administration of second and final TSCS:2 survey in classrooms.
Session One: Indroduction of research, take first TSCS:2, Three hour Challenge Course activity.
Session Two: Four Hours of Challenge Course activity.
Session Three: Four Hours of Challenge Course activity, take second and final TSCS:2 survey.

90
Research Schedule: No-Low Ropes group (No Low-Ropes).
Session One:
A. Introduction.
B. Explanation of research.
C. Consent forms.
D. Administration of Tennessee Self-Concept Scale:2 in classroom.
E. No-Low Ropes group resumes normal programming without low ropes for three
hours.
Session Two.
A. No-Low Ropes group resumes normal programming without low ropes for four
hours.
Session Three.
A. Administration of second and final TSCS:2 survey
Session One: Introduction of research & administration of first TSCS:2 survey. No-Low Ropes group resumes normal programming w/out low-ropes
Session Two: No-Low Ropes group resumes normal programming w/out low-ropes.
Session Three: Administration of the second and final TSCS:2 survey. No-Low Ropes group resumes normal programming w/out low-ropes

91
Appendix H
IRB Consent Form

92

93
Appendix I
IRB Approved Assent Form

94
Appendix J
IRB Project Information Form

95

96

97
Appendix K
Department Review

98
Appendix L
IRB Project Closure

99
References
Anderson, L., Schleien, S., McAvoy, L., Lais, G., & Seligmann, D. (1997). Positive
Change through an integrated outdoor adventure program. Therapeutic Recreation
Journal, 31, 214-229.
Arnett, A. A. (2015). Educators continue to search for ways to open doors for first-
generation students. Diverse: Issues in Higher Education, 32(20), 6.
Attarian, A. (2001). Trends in outdoor adventure education. Journal of Experiential
Education, 24(3), 141.
Beard, C., & Wilson, J. (2002). The power of experiential learning: A Handbook for
Trainers and Educators. Sterling, VA: Stylus Publishing Inc.
Bloom, B. S., (Ed), (1956). Taxonomy of educational objectives: The Classification of
Educational Goals; Handbook I, Cognitive Domain. New York: David McKay.
Bonwell, C. C., & Eison, J. A. (1991). Active Learning: Creating excitement in the
classroom. ASHE-ERIC Higher Education Report No.1. Washington, DC: George
Washington University.
Bradbury, B. L., & Mather, P. C. (2009). The integration of first-year, first-generation
college students from Ohio Appalachia. NASPA Journal, 46(2), 258-281.
Bradish, C. (1995). Therapeutic programming for gay and lesbian youth: How
experiential education can support an at-risk population. Journal of Experiential
Education, 18, 91-94.
Brown, R. (1998). Review of the Tennessee Self-Concept Scale—Second Edition. In J.
C. Impara & B. S. Plake (Eds.), The thirteenth mental measurements yearbook.
Lincoln, NE: Buros Institute of Mental Measurements.

100
Cason, D. & Gillis, H.L. (1994). A meta-analysis of outdoor adventure programming with
adolescents. The Journal of Experiential Education, 17 (1), 40-47.
Clifford, E., & Clifford, M. (1967). Self-concepts before and after survival training.
British Journal of Social and Clinical Psychology, 6, 241-248.
Cohen, J. (1988). Statistical power analysis for the behavior sciences. (2nd ed.)
Hillsdale, NJ.
Cohen, J., Cohen, P., West, S. G., & Aiken, L.S. (2003). Applied multiple
regression/correlation analysis for the behavioral sciences. Third Edition.
Routledge:New York.
Conley, L. C. (2007). Evaluation of a ropes course experience for At - risk secondary
school students. Journal of Experiential Education, 30(1), 21-35.
Conley, L., Caldarella, P., & Young, E. (2007). Evaluation of a Ropes Course Experience
for At-Risk Secondary School Students. Journal of Experiential Education, 30(1),
21–35. https://doi.org/10.1177/105382590703000103.
Dent, A. (2006). High ropes and hard times: Wilderness and the sublime in adventure-
based education. International Journal of the History of Sport, 23(5), 856-875.
Eadie. D. (2009) The partnership tango. American School Board Journal.
196(3), 42-43.
Eatough, E., Chang, C-H., & Hall, N. (2015). Getting roped in: Group cohesion, trust,
and efficacy following a ropes course intervention. Performance Improvement
Quarterly, 28(2), 65-89.
Fink, L. (2003). Creating significant learning experiences: An Integrated Approach to
Designing College Courses. San Francisco: Jossey-Bass.
101
Finkenberg, M., Shows, D., & DiNucci, J. (1994). Participation in adventure based
activities and self-concepts of college men and women. Perceptual and Motor
Skills, 78, 1119-1122.
Fitts, W. (1971). Self-concept and self-actualization. Nashville, Tennessee: Dade
Wallace Center.
Fitts, W. H., & Warren, W. L. (1996). Tennessee self-concept scale (TSCS-2) manual. Los
Angeles: Western Psychological Services.
Foundoulaki, E. S. & Alexopoulos, D. S (2004). Reliability and concurrent validity of
Tennessee Self-Concept Scale:2 for children. Self-concept, motivation and
identity: where to from here? Proceedings of the 3rd International Biennial SELF
Research Conference, Berlin, 4-7 July, 2004.
Gass, M., & McPhee, P. (1990). Emerging from recovery: A descriptive analysis of
adventure therapy for substance abusers. Journal of Experiential Education, 13,
39-35.
Gay, L. (1996). Educational research (5th edition). Upper Saddle River, NJ: Merrill
Prentice- Hall.
Gerrig, R. J., & Zimbardo, P. G. (2002). Glossary of Psychological Terms. Psychology
and Life. Boston: Allyn and Bacon.
Gibbons, M. M., & Woodside, M. (2014). Addressing the needs of first-generation
college students: Lessons learned from adults from low-education families.
Journal of College Counseling, 17(1), 21-36.

102
Gillett, D., Thomas, P., Skok, R., & McLaughlin, T. (1991). The effects of wilderness
camping and hiking on the self-concept and the environmental knowledge of
twelfth graders. Journal of Environmental Education, 22, 33-44.
Gillis, L.H., & Speelman, E. (2008) Are challenge courses an effective tool? A Meta-
Analysis. Journal of Experiential Education, 31(2), 111-135.
Goldenberg, M.K., Klenosky, D.B., O’Leary, J.T., & Templin, T.J. (2000). A means-end
investigation of ropes course experiences. Journal of Leisure Research, 32(2),
208–224.
Green, G. T., Kleiber, D. A., & Tarrant, M. A. (2000). The effect of an adventure-based
recreation program on development of resiliency in low income minority
Youth. Journal of Park & Recreation Administration, 18(3), 76-97.
Hahn, K. (1970). The Education of Thought. On Kurt Hahn and the Development of
Outward Bound: A compilation of essays. London: Outward Bound.
Haras, K., Bunting, C. J., & Witt, P. A. (2005). Linking outcomes with ropes course
program design and delivery. Journal of Park & Recreation Administration,
23(2), 36-63.
Hardwick, Z. (2014). Colleges differ in first-generation definitions. The
Dartmouth. Retrieved from http://thedartmouth.com/2014/10/15/colleges-differ-
in-first-generation-definitions/First/149289.
Hatch, K. (2005). Exploration of challenge courses' long-term effects on members
of college student organizations. Journal of Experiential Education, 27(3), 245-
264.
Hattie, J., Marsh, H. W., Neil, J.T., & Richards, G.E. (1997). Adventure education and

103
outward bound: Out-of-class experiences that make a difference. Review of
Educational Research, 67(1), 43-87.
Henderson, K. (2009). Teams for a new generation: A facilitator's field guide.
Journal of Experiential Education, 31(3), 460-462.
Hogan, J.M. (1968). Impelled into experiences: The story of the outward bound
schools. Huddersfield: E.P. Publishing Company Ltd.
Housel, T. H., & Harvey, V. L. (2011). Introduction: Shall we gather in the classroom?
New Directions for Teaching & Learning 2011, 127, 5-10.
Hoxby, C., & Turner, S. (2013). Expanding college opportunities. Education Next,
13(4), 2-6.
Ishitani, T. T. (2003). A longitudinal approach to assessing attrition behavior among first-
generation students: Time-varying effects of pre-college characteristics. Research
in Higher Education, 44(4), 433.
Ishitani, T. T. (2006). Studying attrition and degree completion behavior among first-
generation college students in the United States. Journal of Higher Education,
77(5), 861-885.
James, W. (1950, 1983 Rev.) Principles of Psychology. Magnolia, MA: Peter Smith.
Keppel, G. (1991). Design and Analysis: A researcher's handbook (3rd ed.). Englewood
Cliffs, NJ, US: Prentice-Hall, Inc. PsycInfo.
Lakens, D, (2013). Calculating and reporting effect sizes to facilitate cumulative science:
a practical primer for t-tests and ANOVAs. Frontiers in Psychology, 4, 863.

104
Leary, M. (2004). The sociometer, self-esteem, and the regulation of interpersonal
behavior. In R. F. Baumeister & K. D.Vohs (Eds.), Handbook of Self-Regulation:
Research, Theory, and Applications (373–391). New York: Guilford Press.
Levin, J., Karnie, E., & Frankel, Y. (1975). Translating objective personality inventories.
Megamot Behavioral Sciences Quarterly, 22, 81.
Mangan, K. (2015). The challenge of the first-generation student, The Chronicle of
Higher Education, May 18, Retrieved from http://chronicle.com/article/The-
Challenge-of-the/230137.
Marsh, H.W., Richards, G.E., & Barnes, J. (1986). Multidimensional self-concepts: The
effects of participation in an Outward Bound program. Journal of Personality and
Social Psychology, 50 (1), 195-204
Miles, J., & Preist, S. (Eds). (1990). Adventure education. State College, PA: Venture
Publishing, Inc.
Mitten, D. (1992). Empowering girls and women in outdoors. Journal of Physical
Education, Recreation and Dance, 63, 56-60.
Mortenson, T. G. (2000). The crisis of access in higher education. Academe, 86(6), 38.
Mortenson, T. G. (2003). Leading indicator: New England’s higher education economy.
Connection, 17(5), 15.
National Center for Education Statistics. (2009). Quickstats [Chart showing college
entrance rates of students by 2008-2009 SES]. NPSAS:2009 Undergraduate
Students. Retrieved from http://nces.ed.gov/datalab/quickstats/createtable.aspx.

105
Nunez, A. (1998). First-generation students: A longitudinal analysis of educational and
early labor market outcomes. Paper presented at the Annual Meeting of
Association for the Study of Higher Education. Miami, FL.
Ong-Dean, C., Huie Hofstetter, C., & Strick, B. R. (2011). Challenges and dilemmas in
implementing random assignment in educational research. American Journal of
Evaluation, 32(1), 29-49.
Preist, S., Gass, M., & Gillis, L. (2000). The essential elements of facilitations. Bubuque,
IA: Kendall-Hunt Publishing Company.
Prouty, D. (1990). Project adventure: A brief history. In J. Miles, & S. Preiest’s,
adventure education. State College. PA: Venture Publishing, Inc.
Rohnke, K.E. (1977), Cowtails & cobras. Hamilton, Massachusetts: Project Adventure
Rohnke, K. E. (1991). Cowstails & cobras II. Dubquque, IA: Kenall/Holt.
Rosenberg, M. (1979). Conceiving the self. New York: Basic Books.
Rotter, J.B. (1954). Social learning and clinical psychology. Englewood Cliffs, NJ:
Prentice-Hall, Inc., ix, 466 pp. http://dx.doi.org/10.1037/10788-001
Schoel, J., Prouty, D., & Radcliff, P. (1988). Islands of healing: A guide to adventure
based counseling. Hamilton, MA: Project Adventure, Inc.
Shavelson, R.J., Hubner, J.J., & Stanton, G.C. (1976). Self-concept: Validation of
construct interpretations review. Education Resource, 46, 407-441.
Somers, P., Woodhouse, S., & Cofer, J. (2004). Pushing the boulder uphill: The
persistence of first-generation college students. NASPA Journal, 41(3): 418-435.
Steffen, J., & Cross, R. (1994). Adventure education for at-risk college students.
Research Quarterly for Exercise & Sport, 65(1), A-83.

106
Supiano, B. (2014). When is a student ‘first generation’? Words fail us, The Chronicle of
Higher Education, October 9, Retrieved from http://chronicle.com/article/When-
Is-a-Student-First/149289/.
Teaf, J., & Kablach, J. (1987). Psychological benefits of outdoor adventure activities.
Journal of Experiential Education, 10, 43-46.
Witman, J. (1987). The efficacy of adventure programming in the development of
cooperation and trust with adolescents in treatment. Therapeutic Recreation
Journal, 21(3), 22-29.
Wolfe, B.D., & Dattilo, J. (2006). Participants’ perceptions of communication during and
after a one-day challenge course program. Journal of Experiential Education,
29(2), 126.