Embed Size (px)
Citation preview
THE RELATION OP SOCIOMETRIC STATUS, FREQUENCY OF
VERBALIZATIONS, AND A MEASURE OF
SELF-ACTUALIZATION
APPROVED:
Major Professor •of essor
MJmor Proresso
Dean ofthe School of/Education
Deah of the Graduate School
THE RELATION OP SOCIOMETRIC STATUS,
FREQUENCY OP VERBALIZATIONS, AND
A MEASURE OP SELF-ACTUALIZATION
THESIS
Presented to the Graduate Council of the
North Texas State University in Partial
Fulfillment of the Requirements
For the Degree of
MASTER OF SCIENCE
By
Howard 0. Boozer Jr., B. S.
Denton, Texas
August, 1966
TABLE OF CONTENTS
Page
LIST OP TABLES iv
Chapter
I. INTRODUCTION 1 Theoretical Background Significance of the Study Hypotheses
II. RELATED RESEARCH 10
III. METHOD 18
Materials Subjects Procedure
IV. RESULTS AND DISCUSSION 32
Results Discussion
V. SUMMARY 1+2
APPENDIX 1*5
BIBLIOGRAPHY 1*6
ill
LIST OP TABLES
Table Page
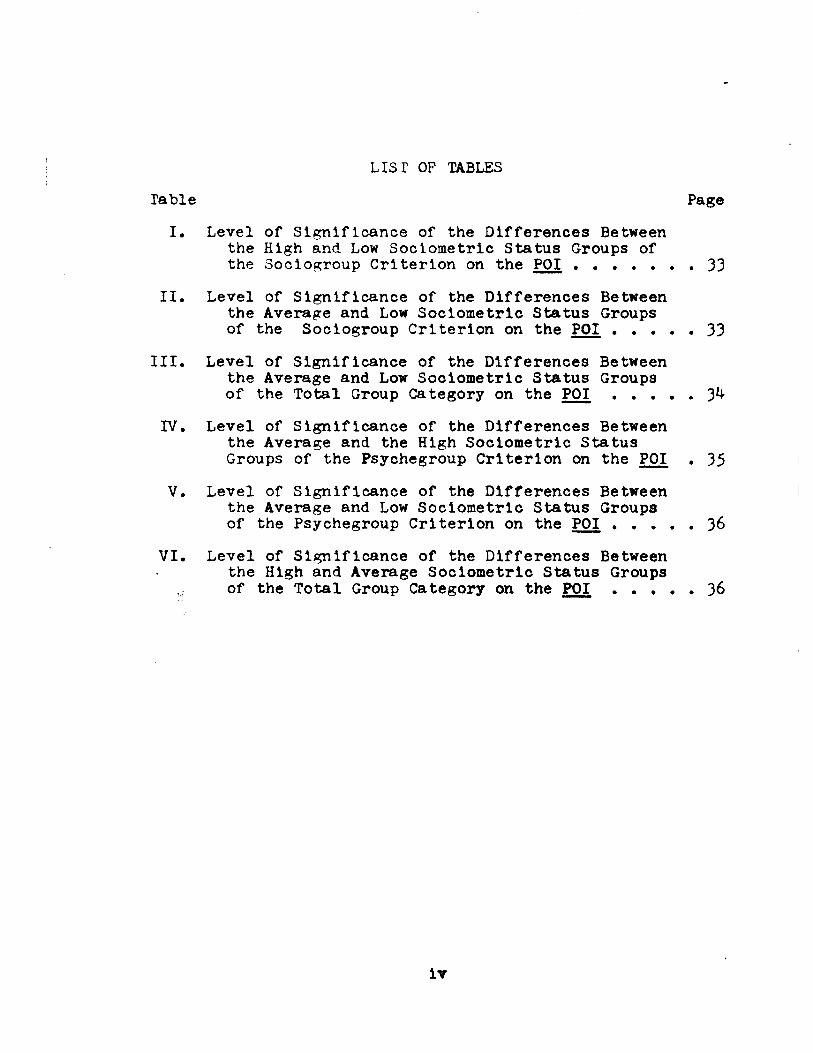
I. Level of Significance of the Differences Between the High and Low Soclometric Status Groups of the Sociogroup Criterion on the POI . 3 3
II. Level of Significance of the Differences Between the Average and Low Soclometric Status Groups of the Sociogroup Criterion on the POI 33
III. Level of Significance of the Differences Between the Average and Low Soclometric Status Groups of the Total Group Category on the POI 3^
IV. Level of Significance of the Differences Between the Average and the High Soclometric Status Groups of the Psychegroup Criterion on the POI . 35
V. Level of Significance of the Differences Between the Average and Low Soclometric Status Groups of the Psychegroup Criterion on the POI 36
VI. Level of Significance of the Differences Between the High and Average Soclometric Status Groups
,4 of the Total Group Category on the POI 36
It
CHAPTER I
INTRODUCTION
Theoretical Background
Among the most valued traits In our society Is socia-
bility. As Northway, Frankel, and Potashln (20, p. 64) have
stated, "Our American culture places a premium on sociability
and all the qualities associated with the extravert. This is
because we are a nation of salesmen and aociablllty pays." In
fact, adequate social participation is even considered an ex-
pression of the healthy personality (21). It must be conceded
that one who is psychologically healthy would, of necessity,
"emit behavior which is on the whole socially desirable, be-
cause the feedback from society if socially inappropriate
behaviors are manifested would soon destroy the individual's
personal equilibrium (3. P» 530)*"
An inspection of the literature reveals how much the
culture's value of sociability has influenced the concept of
psychological adjustment. Kogan, Qulnn, Ax, and Ripley (13)
report a correlation of .89 between a $ sort-based definition
of health-sickness and a § sort-based definition of social
desirability, each definition being a composite derived from
Individual $ sorts by clinicians. Also, Wiener, Blumberg,
Segman, and Cooper (25) found a correlation of .88 between
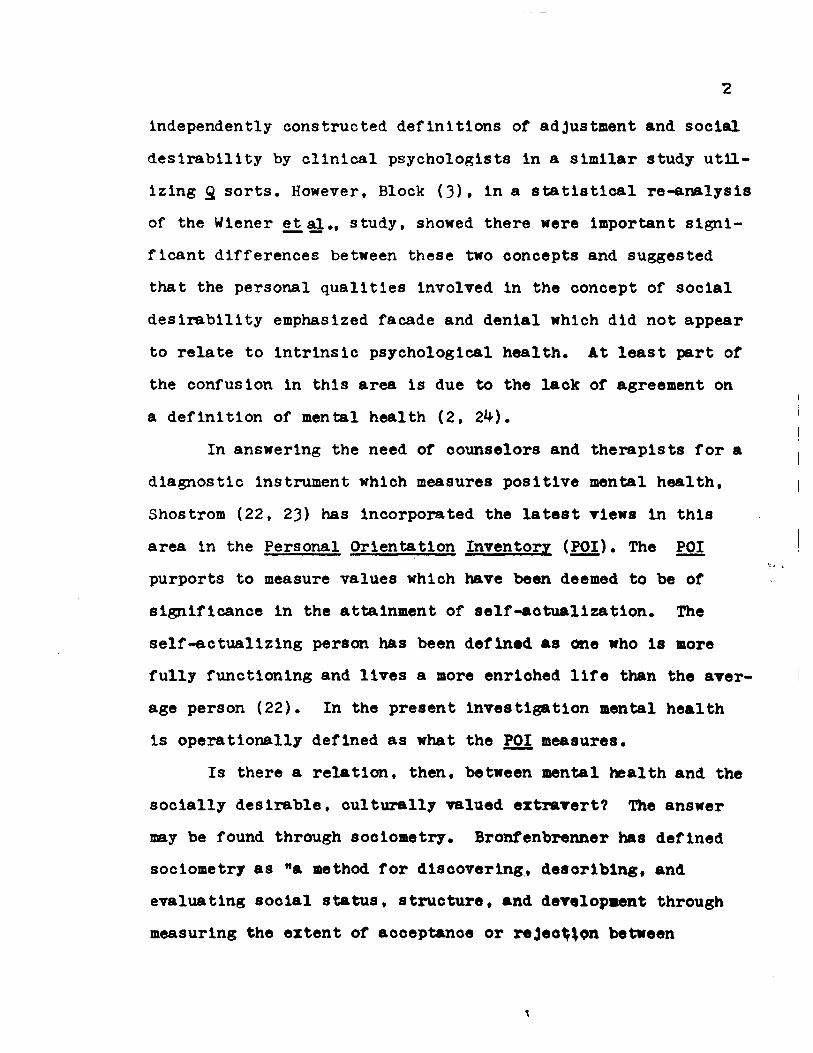
Independently constructed definitions of adjustment and social
desirability by clinical psychologists in a similar study util-
izing £ sorts. However, Block (3). in a statistical re-analysis
of the Wiener et_alstudy, showed there were important signi-
ficant differences between these two concepts and suggested
that the personal qualities involved In the concept of social
desirability emphasized facade and denial which did not appear
to relate to intrinsic psychological health. At least part of
the confusion in this area is due to the lack of agreement on
a definition of mental health (2, 2*0.
In answering the need of counselors and therapists for a
diagnostic Instrument which measures positive mental health,
Shostrom (22, 23) has incorporated the latest views In this
area in the Personal Orientation Inventory (POI). The POI
purports to measure values which have been deemed to be of
significance in the attainment of self-actualization. The
self-actualizing person has been defined as one who is more
fully functioning and lives a more enriched life than the aver-
age person (22). In the present investigation mental health
is operationally defined as what the POI measures.
Is there a relation, then, between mental health and the
socially desirable, culturally valued extxavert? The answer
may be found through soclometry. Bronfenbrenner has defined
soclometry as Na method for discovering, describing, and
evaluating social status, structure, and development through
measuring the extent of acceptance or rejeotflpn between
Individuals In groups (9. p. 4)." Using the basic principles
advanced by Moreno (17), "the founder and promoter of socio-
metry in America (8, p. 62)," numerous studies (4, 6, 8, 11,
12, 16, 19, 20) have found that scoring high sociometrically
is either not related to personality traits considered singly
nor in combination or that those scoring high are not the
best adjusted psychologically. Since it has been shown that
those scoring high sociometrically are significantly more
extraverted than a similar group scoring low (14, 21), it is
unlikely that there is necessarily a relation between mental
health and extraversion. Since this conclusion is contrary
to the cultural value placed on sociability, some explanation
should be offered. Northway (19) hypothesized that the effort
made by the highly chosen to direct energy to the goals of the
group cause them inner stress and result in psychological Im-
balances. Block offers a similar solution in suggesting that
socially desirable behavior "may reflect solely a submission,
at great personal cost, to convention and cllohe' (3. p. 530)."
A number of sociometric studies have also been done on
individuals scoring low sociometrically (5, 12, 18, 20, 21)
with the common finding of many characteristics which would
preclude them from being considered optimally adjusted. Lack
of spontaneity, lack of sensitivity to the environment, and a
distorted interpretation of reality are examples of what is
typically found.
In summary, s t u d i e s have been cited which would seem to
support an assumption t h a t b o t h t h e soclometrlcally high and
soclometrically low a r e lacking In optimal psychological
health. I s I t then the middle, or average, group that evin-
ces the greatest degree of mental health? This is the main
question the present study has attempted to answer. Two pre-
vious studies (1, 21), both utilizing the Rorschach Inkblot
Test and a sociometrlc measure, have found the middle group
to have fewer inner tensions and emotional disturbances. The
subjects for one of these studies (21) were recruited from
the eighth grade and the subjects for the other (1) were
college undergraduates. It Is felt that additional research
concerning the relationship of mental health to sociometrlc
status is needed in view of the fact that Mill (16) concluded
that the Rorschach variables were not sufficiently sensitive
for group comparison. To overcome the subjective element
inherently present in a projective technique, the POI. an
objectively scored test, was selected for the purpose of the
present study.
Since amount of verbalization is an important aspect of
sociability, when, in the review of the literature regarding
sociability and soclometry, a discrepancy was noted in rela-
ting amount of verbalization to sociometrlc status, it was
decided to attempt to reconcile the divergent results. Pour
studies (5, 7, 10, 14) reported that subjects who scored high
in sociometrlc status also had a higher proportion of
of verbalization than those of low soclometric statue, while
one study, Kiel (15)* found that individuals in the high
group varied in amount of verbalization from very little to a
great deal in group discussions. The most important differ-
ence between the conflicting studies seemed to be that while
the oldest subjects in the former studies were only in the
fourth grade, the subjects in the latter investigation were
members of an advanced college class. Therefore, to deter-
mine if the greater age of the latter subjects affected the
results of the Mlel study, a graduate class at North Texas
State University which had a large amount of group discus-
sions was tested sociometrically and observed in regard to
frequency of verbalizations during the spring semester of
1966.
Significance of the Study
It was previously stated that our American culture
places a premium on sociability and all the qualities associ-
ated with the extravert (20). If it could be shown, as this
thesis shall attempt to do, that this value is not necessarily
associated with mental health, additional support would be
furnished to a call for a decrease in the value of sociability
and a corresponding emphasis on an enjoyment value in social
relationships. We would, as Northway, Frankel, and Potashin
state,
no longer attempt to make all children leaders, * goal few pf them can reach, but would fyelp eaoh
child to gain that level of sociability which best satisfies his unique needs. That is, we would formulate our requirements on the basis of the individual's ability to meet them (20, p. 64).
Hypotheses
In consideration of the above discussion, the following
hypotheses are advanced:
1. The average soclometric status group will have sig-
nificantly higher mean scores on the POI than will the high
soclometric status group.
2. There Is a positive relation between individuals who
score high sociometrlcally and those who have a high frequency
of verbalization.
CHAPTER BIBLIOGRAPHY
1. Aber, W. E., "Rorschach Patterns as Related to Soclo-metric Status," unpublished master's thesis, Department of Psychology, North Texas State Univer-sity, Denton, Texas, 1955*
2. Blatt, S. J., "An Attempt to Define Mental Health," Journal of Consulting: Psychology. XXVIII (April, 1964), 1SS-153.
3. Block, J., "Some Differences Between the Concepts of Social Desirability and Adjustment," Journal of Consulting Psychology. XXVI (December, 1962), 527-530.
4. Bonney, M. E., "The Constancy of Sociometrlc Scores and Their Relationship to Teacher Judgments of Social Success and to Personality Self-Ratings," Soclometry. VI (November, 19^3). ^09-^24.
5. , "Personality Traits of Socially Success-ful and Socially Unsuccessful Children," Journal of Educational Psychology, XXXIV (November, 19^3), *^9-
6. , "Popular and Unpopular Children, "Soclo-me try Monographs. No. 9, New York, Beacon House, 19W7
7. , "Social Behavior Differences Between Second Grade Children of High and Low Sociometrlc Status," Journal of Educational Research. XLVIII (March, 1955), 481-^93
8. , and R. S. Hampleman, Personal-Social Evaluation Techniques. Washington, D. C., The Center for Applied Research in Education, Inc., 1962.
9. Bronfenbrenner, U., "The Measurement of Sociometrlc Status, Structure and Development," Soclometry Monographs, No. 6, New York, Beacon House, 19^5.
10. Dunnington, Margaret J., "Behavioral Differences of Sociometrlc Status Groups in a Nursery School," Child Development. XXVIII (March, 1957), 103-111.
a
11. Hllkevitch, Rhea R., "Social Interaction Processes! A Quantitative Study," Psychological Reports, VII (October, 19^0), 195-201.
12. Jennings, Helen H., Leadership and Isolation. 2nd ed., New York, Longmans, Green and Co., 1950*
13. Kogan, W. W., R. Qulnn, A. P. Qulnn and H. S. Ripley, "Some Methodological Problems In the Quantification of Clinical Assessment by £ Array," JouCTial of Con-sulting Psychology, XXI (February, 1957)» 57-^2.
1U. Kuhlen, R. G. and Beatrice J. Lee, "Personality Charac-teristics and Social Acceptability in Adolescence," Journal of Educational Psychology. XXIV (September, W 3 ) , 321-3W:
15. Miel, Alice, "A Group Studies Itself to Improve Itself," Teacher's College Record, XLIX (October, 19^7)t 31-<0.
16. Mill, C. R., "Personality Patterns of Sociometrlcally Selected and Sociometrlcally Rejected Male College Students," Soclometry. LIII (May, 1953)t 151-167.
17. Moreno, J. L., Who Shall Survive? A New Approach to the Problem of Human Inter-Relatlons. New York, Beacon House, 193^.
18. Northway, Mary L., "Outsiders: A Study of the Person-ality Patterns of Children Least Acceptable to Their Age Mates," Soclometry. Ill (February, 19^)* 10-26.
19. , A Primer of Soclometry. Toronto, Canada, University of Toronto Press, 1952.
20. . Ester B. Frankel and Reva Potashin, "Personality and Sociometrlc Status," Soclometry Monographs. No. 11, New York, Beacon House, 19^5.
21. , and Blosson Wlgdor, "Rorschach Patterns Related to the Soelometrlo Status of School Children," Soclometry. X (May, 19^7). 186-199.
22. Shostrom, E. L., "An Inventory for the Measurement of Self-Actualization," Educational and Psychological Measurement. XXIV (Summer, 196*0, 207-218,
23. .• The Personal Orientation In' San Diego, California, Educational and Testiijg Service, 1963*
2k. Veldman, D. J., R. F. Peck, and C. McGuire, "Measuring the Value Systems of Education Professors," Journal of Educational Psychology, LII (December, 1961), 330-33^.
25. Wiener, M. , A. Blumbers:, Sarah Segman, and A. Cooper., "A Judgment of Adjustment by Psychologists, Psychi-atric Social Workers, and College Students, and Its Relationship to Social Desirability," Joumal of Abnormal and Social Psychology. LIX (November, 1959), 315-321.
CHAPTER II
RELATED RESEARCH
Not Ions after the appearance of Moreno's book, Who
Shall Survive? (11), which Is the primary source of sociomet-
rlc theory, techniques, practice, results, and implications
(3). researchers began to try to identify correlates of
sociometric scores. Northway (12), in her review of the lit-
erature in this area, pointed out that attempts had been made
to relate age, mental age, I. Q., academic skills, performance
skills, socio-economic status, proximity of living, and
ratings on personality tests to sociometric status. She
reported that this was done either by correlating scores from
the whole sociometric scale to outside characteristics or by
comparing the individuals grouped into high, middle, and low
sociometric scores on the outside characteristics. She con-
cluded that in most situations "such characteristics do not
correlate highly or even positively with sociometric status
(12, p. 28)" but noted that an exception, where a positive
relation was found, was In the use of personality question-
naire scores when the personality test used Included social
items.
Boney and Pessenden (2), after inspecting a large
number of studies using various methods of personality measure-
ment to relate personality characteristics to socilosatrlc
da ta, conpluded t 10
u
(1) When total croups are studied, the rela-tionships between these various methods and soclometrlc scores are not marked, but (2) when those who are high In choice-status (such as the upper fourth) are contrasted with those who are low, the findings are quite consistent in showing most frequently-chosen Individuals to be reliably superior to the infrequently-chosen ones in some psychologically and/or socially approved types of behavior adjust-ments (2, p. 7).
A longitudinal study which helped formulate the above
conclusion is that of Bonney (1). After an Intensive study
of five "popular" and five "unpopular" children over a five
year period, he concluded that, as a group, the "popular"
children were superior to the "unpopular" ones in all desir-
able traits. He pointed out, however, that it appeared to
him that a person was not liked or disliked because of partic-
ular personality traits but because of the total impression
his whole personality structure made on others.
Another study which reached a similar conclusion, and
also one of the few investigations that has reported charac-
teristics of the middle group in soclometrlc status. Is that
of Northway and Wlgdor (13). The subjects, forty-five
children from three eighth-grade classrooms all of whom were
from homes of the middle socio-economic class, were adminis-
tered the Rorschach Inkblot Test and the soclometrlc test
recommended by the Canadian National Committee for Mental
Hygiene. Bronfenbrenner's method (3) was used to divide the
soclometrlc scores into high, middle, and low groups on the
basis of their deviation from chance expectancy^ Upon an
U2
analysis of the Rorscnach Test records, it was concluded that
(1) the high srroup was more conventional, more sensitive to
the feelings of the group, and had a more conscious striving
for the approval of others, (2) the low group seemed more
seriously disturbed than the high group, (3) the middle group
appeared to possess a greater degree of contentment and inner
ease so that both the high and low groups appeared to contain
more disturbed individuals, (4) the middle group was found to
be able to view situations in a realistic Banner which led to
a degree of acceptance equal to their desires and expectations,
but they were also found to be more shallow and dull and less
Introspective, and (5) there does not appear to be any set
pattern which enables one to achieve high social acceptance:
"social acceptance ... seems rather to depend on effective
use of a variety of personality factors (13, p. 195)."
Mill (10) had similar findings, though he neglected to
investigate the middle sociometrlc group, when he administered
the Minnesota Multiphasic Personality Inventory, the Thematic
Apperception Test, and the Rorschach Inkblot Test to socio-
metrically high and low students In a college men*s dormitory.
His results indicated that neither the soclometrlcally high
group nor the low group were optimally adjusted, but that the
low group suffered greater anxiety. Also, the low group's
method of defense appeard to cause further rejection, and they
retaliated by expressing their hostility through devious
measures while the high group were reported to be pore frank
1*3
and. open In their behavior. The direct and tuiderstandable
reactions in interpersonal relationships of the high group
seemed to a;ive others a sense of security, according to Mill.
His tests did Indicate, however, that some of the high group
had achieved their status by having learned certain behavioral
roles and that their adoption of these roles stemmed from a
neurotic basis.
Jennings (7), in a comprehensive study utilizing over
400 individuals committed to the New York State Training
School for Girls, applied sociometric techniques to divide her
population into high, low, and average groups and made case
studies of the girls appearing in these groups. In this man-
ner she attempted to determine the personality characteristics
related to sociometric status, and she did make a number of
observations about them. However, she made no systematic
attempt to relate personality and status on any level other
than clinical; so the real significance of her investigation
lies in the theory she advanced on the basis of her findings:
The "why" of leadership appears, however, not to reside in any personality trait considered singly, nor even in a constellation of rela-ted traits, but in the inter-personal contri-bution of which the individual becomes capable in a specific setting eliciting such contribu-tion from him. Similarly, isolation appears as but the opposite extreme on this continuum of inter-personal sensitivity between the members of the group and the individual (7, p. 205) .
lfc
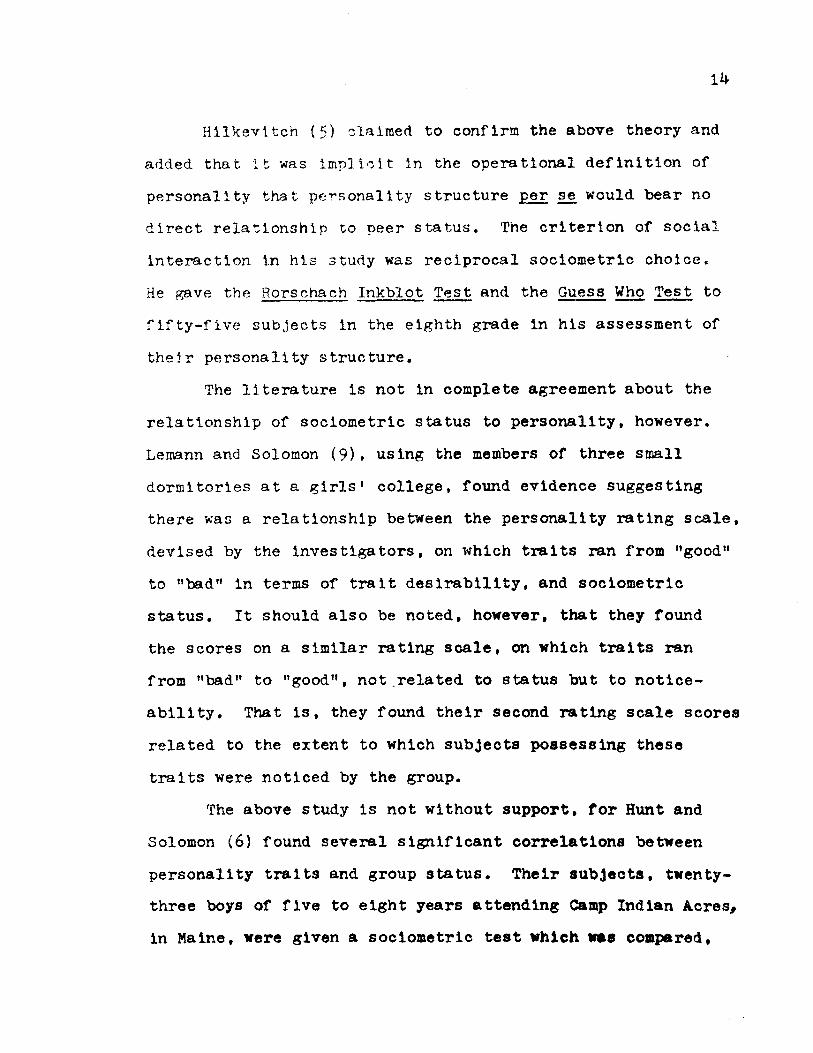
Hllkevltch (5) claimed to confirm the above theory and
added that it was implicit in the operational definition of
personality that personality structure per se would bear no
direct relationship to peer status. The criterion of social
interaction in his study was reciprocal sociometric choice.
He gave the Rorschach Inkblot Test and the Guess Who Test to
fifty-five subjects in the eighth grade in his assessment of
their personality structure.
The literature is not In complete agreement about the
relationship of sociometric status to personality, however.
Lemann and Solomon (9). using the members of three small
dormitories at a girls' college, found evidence suggesting
there was a relationship between the personality rating scale,
devised by the Investigators, on which traits ran from "good"
to "bad" in terms of trait desirability, and sociometric
status. It should also be noted, however, that they found
the scores on a similar rating scale, cm which traits ran
from "bad" to "good", not .related to status but to notice-
ability. That Is, they found their second rating scale scores
related to the extent to which subjects possessing these
traits were noticed by the group.
The above study Is not without support, for Hunt and
Solomon (6) found several significant correlations between
personality traits and group status. Their subjects, twenty-
three boys of five to eight years attending Camp Indian Acres,
in Maine, were given a sociometric test which was coopared.
15
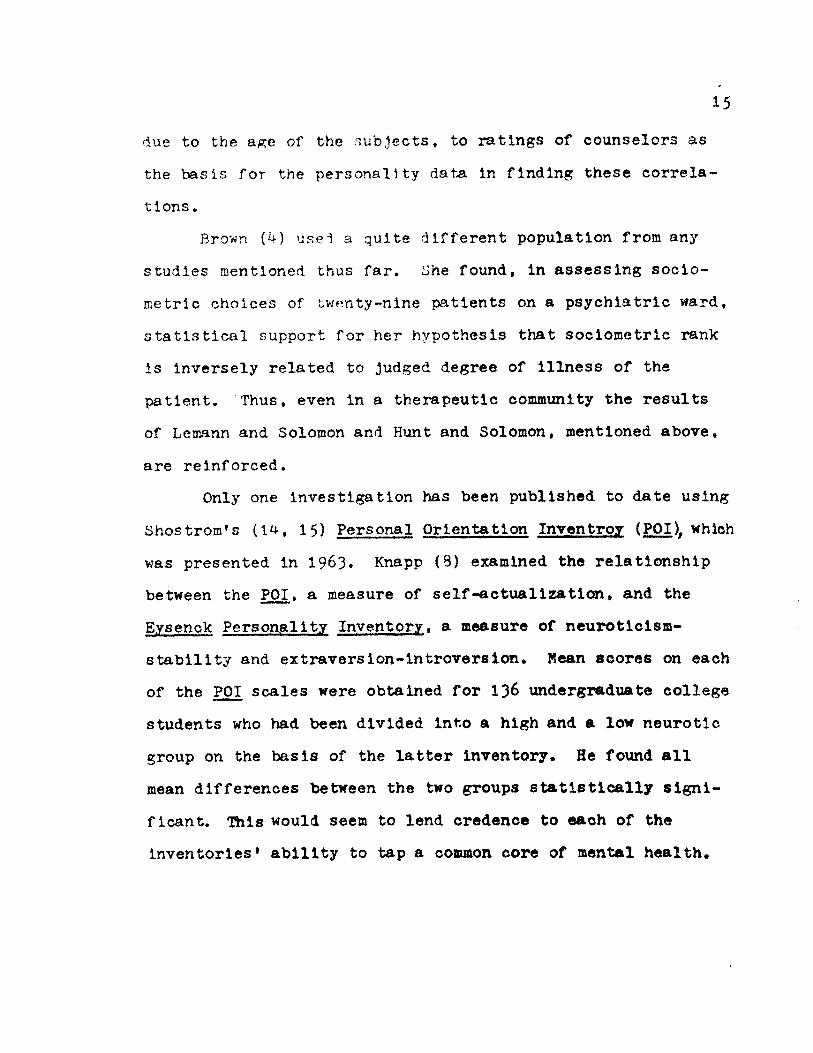
due to the age of the subjects, to ratings of counselors as
the basis for the personality data In finding these correla-
tions.
Brown (k) usei a quite different population from any
studies mentioned thus far. She found, in assessing socio-
metric choices of twenty-nine patients on a psychiatric ward,
statistical support for her hypothesis that sociometric rank
is inversely related to judged degree of illness of the
patient. Thus, even in a therapeutic community the results
of Lemann and Solomon and Hunt and Solomon, mentioned above,
are reinforced.
Only one investigation has been published to date using
Shostrom's (lU, 15) Personal Orientation Inventroy (POI)r which
was presented in 1963. Knapp (8) examined the relationship
between the POI, a measure of self-actualization, and the
Eysenck Personality Inventory. a measure of neuroticlsm-
stabllity and extraversion-introversion. Mean scores on each
of the POI scales were obtained for IJ6 undergraduate college
students who had been divided into a high and a low neurotic
group on the basis of the latter inventory. He found all
mean differences between the two groups statistically signi-
ficant. This would seem to lend credence to each of the
inventories* ability to tap a common core of mental health.
CHAPTER BIBLIOGRAPHY
1. Bonney, M. E., "Popular and Unpopular Children," Socio-metry Monographs, No. 9. New York, Beacon House" 19^7•
2. Bonney, M. E. and S. A. Fessenden, Bonney-Fessenden Soclograph, Los Angeles, California, California Test Bureau, 1955-
3. Bronfenbrenner, U., "The Measurement of Sociometric Status, Structure and Development," Soctometry Monographs, No. 6, New York, Beacon House, 19*+5.
4. Brown, Julia, S., "Sociometric Choices of Patients in a Therapeutic Community," Human Relations. XVIII (August, 1965), 241-251.
5. Hilkevitch, Rhea R., "Social Interaction Processes: A Quantitative Study," Psychological Reports, VII (October, I960), 195-201.
6. Hunt, J. and R. L. Solomon, "The Stability and Some Correlates of Group Status in a Summer-Camp Group of Young Boys," American Journal of Psychology. LV (January, 19^2), 33-^5*
7. Jennings, Helen H., Leadership and Isolation. 2nd ed., New York, Longmans, Green and Co., 1950.
8. Knapp, R. P., "Relationship of a Measure of Self-Actualization to Neuroticism and Extraversion," Journal of Consulting Psychology. XXIX (April, 1965)» 169-172.
9. Lemann, T. B. and R. L. Solomon, "Group Characteristics as Revealed In Sociometric ^Patterns and Personality Ratings," Sociometry Monographs, No, 27. New York, Beacon House, 1952.
10. Mill, C. R., "Personality Patterns of Soclometrlcally Selected and Soclometrlcally Rejected Kale College Students," Sociometry. LIII (May, 1953)# 151-167.
11. Moreno, J. L., Who Shall Survive? A New Approach to the Problem of Human Inter-RelatlonsT New York, Beacon House, 193^.
16
17
12. Northway, Mary L., A Primer of Soclometry. Toronto, Canada, University of Toronto Press, 1952.
13. Northway, Mary L., and 31ossom Wlgdor, "Rorschach Patterns Related to cne Sociometric Status of School Children," Soclometry. X (May, 1947), 186-199.
14. Shostrom, E. L., "An Inventory for the Measurement of Self-Actualination," Educational and Psychological Measurement. XXIV (Summer, 1964), 207-218.
15. , The Personal Orientation Inventory. San Diego, California, Educational and Industrial Testing Service, 1963.
ChAPPER III
KF ™0D
Materials
The sociometric test used, shown in the Appendix, was
devised bv K. E. Bonney of the Department of Psychology at
North Texas State University for the purpose of the present
Investigation. Tt consists of two criteria designed to tap
two quite different types of processes within a group. The
first criterion pertains to uncovering sociogroup processes
and the second to psychegroup processes. Jennings (6, p. 278;
7, p. 3) defines soclogroups as groups characterized by a
sociometric structure based on a criterion which is collective
in nature, such as working in a common work unit, and psyche-
groups as groups having a structure based on a criterion which
is strictly private in nature, such as associating in the time
the individual has at his disposal. Both criteria were tested
concomitantly in accordance with Jennings' finding (6) that if
the population have the opportunity to choose for one criterion
only, they will use the situation for expressing choices to
secure whatever associations they desire regardless of the
designation of the criterion.
Some sociometric tests Include "negative" choices; that
Is, the subject Is also asked to specify which members of the
18
i9
croup he would least to associate with. However, It was
iecided not to include this criterion, in accordance with
N'orthwa.y's su^estion (13) based on her observation that it
was an artificial question and that it caused resentment and
comment in the p;roup. It should not be assumed that there Is
universal agreement on this point, however, because Lemann
and Solomon have stated that "a more accurate picture of group
structure and individual social status should be obtainable
if both choices and rejections are considered (9, p. 9).M
Ascertaining the validity of a sociometrlc test Is
quite different from most psychological tests because, as
Jennings (6, ?) states, it is not an indirect measure of
other behavior but is a sample of the actual behavior studied
and so is valid just as any behavior is valid. Bonney and
Hampleman (3) agree with this "face validity" point of view
but add that they and other writers in the sociometrlc field
feel that if they are measuring an important aspect of human
behavior, it should also be possible to show a relationship
between other methods of assessing personal-social adjustment
and sociometrlc data. After reviewing numerous, relevant
studies in the literature, they concludeds "sociometrlc tests,
in addition to revealing directly the interpersonal aspir-
ations of the members of a group, are also significant
indicators of a wide range of personal assets, especially
those essential to making contributions to successful group
functioning (3. p. 72)."
20
In regard to th»3 reliability of sociometric tests,
Bronfenbrenner (k) has explained that due to changes in
individual social or psychological adjustment and In group
developmental trends, complete status constancy Is not to be
expected; however, in his study of the entire population of
the laboratory elementary school at the University of Michi-
gan, over 125 children from the nursery to the sixth grade
level, he concluded that on the whole, children tend to retain
their same general status and that this tendency increases
with age. More explicityly. Newstetter, Peldstein, and
Newcomb (12) reported an average reliability of .95 for
choices of tent-mates in summer camps, and Zeleny (17) found
reliability coefficients ranging from .93 to .95 testing a
college population on successive days. Also, Jennings (6,
7), who used an eight-month retest interval which is much
longer than the previous two investigations quoted above,
found a reliability coefficient of .65 using over ^00 girls
in a state reformatory.
Bonney and Hampleman reviewed approximately twenty
investigations dealing with the stability of choice-status
and concluded that there was a substantial constancy of
choice-status in school groups over a period of several months,
as evidenced by correlation coefficients falling between .56
and .76 (3, p. 69).
The measure of self-actualization used was the POIr
presented l?y Shostrom in 1963 (15, 16). It It ar\ objectively
2-1
scored, self-administering inventory which consists of 150
paired opposite statements of values which yield measures for
fourteen scales representing a consensus of value areas held
to be of major significance in the development of self-
actualization. The first four scales also yield two ratio
scores, in keeping with the idea that mental health is not
absolute, but relative. There is no time limit and the inven-
tory may be completed in as little as twenty minutes.
To test the validity of the POI. Shostrom administered
the inventory to two groups of "relatively self-actualized"
and "relatively non-self-actualized" adults who were assigned
to their respective groups by a group of clinical psycholo-
gists. The Inventory was shown to significantly discriminate
between the two groups on eleven of the twelve scales
measured.
The only study appearing in the literature which used
the POI was by Knapp (8), cited previously, who examined Its
concurrent validity with the Eysenck Personality Inventory
and concluded that they appeared to be tapping a common core
of mental health.
The frequency of verbalization, recorded for only
twelve of the subjects in a single class, was determined by
a single observer-recorder, investigator, from a very simpli-
fied version of Bales' (1) Interaction analysis. Whereas the
unit scored in Bales' suggested analysis was "the smallest
discriminable segment of verbal or non-verbal behavior" (1,
p. 37)• It was decided for the purpose of tye present study
22
that the unit of interaction scored would be limited to verbal
behavior during class discussions addressed to the group, or
to an individual in the group if the person speaking had the
attention of the majority of the class as determined by the
observer-recorder (hereafter referred to as the observer).
Credit for only one unit of interaction was given regardless
of the length of verbalization as long as the speaker had the
attention of the majority of the class. Thus if there was an
interruption for a question, etc.. from another member of the
class who gained the necessary amount of attention, the inter-
ruptor would receive one unit and the original speaker would
receive another score if he regained the attention of the
class.
The rationale for the scoring system outlined above
lies in the assumption that the individual who ohoses to
deliver an impromptu speech or finds it necessary to give
long explanations during time alloted to class discussion is
really only interacting once. Thus while Bales claims to
score "the single item of thought (1, p. 37)" with his defini-
tion of the unit to be scored, cited above, the present study
calims only to measure frequency of verbalization which is
operationally defined as Interaction.
Subjects
The subjects were drawn from three psychology classes
taught by M. E. Bormey at North Texas State University during
25
the spring semester of 1966. The total population was com-
posed of twenty-eight male and sixteen female students whose
mean age was 26.7 years, with a range of nineteen to sixty-two
years.
Procedure
A copy of the sociometric test (see Appendix), a list
of the names of the members of the respective classes, and an
answer slip from the Bonney-Fessenden Soclograph (2), which
contains a row of numbers from one to forty, were distributed
to each individual in the three classes by M. E. Bonney dur-
ing the third week of May, 1966, after the classes had been
meeting for approximately three months. In each class the
subjects were told to number the names appearing on their
class list and to follow the directions on the sociometric
test. A few of the subjects were absent but were treated
identically upon their return.
The subjects1 choices were transferred from the spe-
cially-designed answer slips provided with the Bonney-
Fessenden Sociograph to the Soclograph proper for each class.
T h e Soclograph was constructed to simplify collection and
interpretation of sociometric data, and represents an improve-
ment over the traditional square graph, or matrix, and the
graphic or pictorial form of sociograph (2), often oalled a
"target diagram" (J*).
24
It should be noted that the basis chosen in the present
study for status indices was number of choices received by a
particular subject rather than number of persons choosing that
individual. This was due to Bronfenbrenner's finding (4) that
although the two methods of scoring were highly correlated,
above .90 in all groups compared, number of choices received
had greater variability and thus was a more sensitive indi-
cator of status. He explained this phenomenon with the
observation that each subject tended to choose the same persons
for more than one criterion.
It should also be noted that although a ranking order of
choices was reqxiested of the subjects, it was not used in the
analysis of the data so that in scoring total choices, each
choice was counted as one point regardless of order given.
Northway, Frankel, and Potashin (14) attempted a weighting
method but this procedure has serious shortcomings (4, 9).
Another alteration was made in the subjects1 expres-
sions of preference other than the one mentioned above.
Although the soclometric test used permitted an unlimited
number of choices by each subject so that he would not feel
restricted, only the first five choices were recorded in the
totals for those subjects who actually made more than five
preferences. This decision was made on the basis of Gron-
lund's finding (5) that although the number of choices made
available to a group was increased, the pattern of
25
distribution tended to remain the same. Also this decision
greatly simplified the statistical analysis of the present
s tudy.
For convenience, the three classes were labeled class
I, II, and III respectively. Class I, a senior level class,
contained twenty-seven students, all of which were used in the
collection of the sociometric choice data; however, only
twelve, six males and six females, were utilized in the pres-
ent research. These twelve were chosen to match the sex and
approximate age of the subjects in class III for another as-
pect of the research not reported in the present paper. It
was necessary to Include all the students in class I in the
collection of the sociometric data because, as Moreno and
Jennings (11) indicate, the sociometric situation has many
characteristics of the Gestalt in that different portions of
the structure are Interdependent with other portions; there-
fore, a change in the structural pattern of a group would
alter the status of the individual.
Class II, a graduate level course, was also composed of
twenty-seven students, nineteen males and eight females.
Seven of these students, three males and four females, however,
were also members of class III. All seTen were, nonetheless,
used as separate individuals in both classes II and III in the
present research. The Justification for this unusual treat-
ment of subjects in an experiment was cited above from Moreno
and Jennings, but Bronfenbrenner has restated tftla Gestalt
26
principle In terras directly applicable to the treatment of
these seven subjects: "Each sociometric setting, then, may
be regarded as representing a unique organizational entity.
When one passes either by Inference or experiment into a
larger social group, the effect is not that of moving up the
scale, but of passing from one frame of reference to another
(k, p. 8)." Therefore, though the actual number of subjects
used in the presept study was forty-four, as stated above,
the theoretical number of subjects used was fifty-one, since
seven were counted twice.
Class III had only twelve members, six males and six
females. It was a graduate level course, and unlike classes
I and II, which were primarily lecture courses, it was devoted
to group discussion. The members were allowed to discuss
anything they wished, and, in keeping with the permissive,
non-competitive atmosphere as an ideal situation for learning,
uniform grades were assigned at the beginning of the semester.
It was in this class that the observer, described above,
recorded the interaction data. This class was chosen for this
purpose due to the greater possibilities for each member to
make verbal contributions in a discussion.
In order to compare the sociometric scores of the three
classes, a constant frame of reference was needed which would
Isolate top and bottom status groups by establishing limits
independent of the sociometric structure Itself (for example,
size of class) and by which that structure coyild be measured.

2?
Bronfenbrenner's (k) concept of deviation from chance expec-
tancy supplies this constant frame of reference and was
utilized in the present study. According to Bronfenbrenner's
method, each raw score on a sociometric test should be
transformed into its probability of chance occurrance thus
defining the score in terms of the probability of obtaining
it if chance alone were operating under the given mathematical
conditions. Bronfenbrenner constructed a table (*4-, p. 71)
based on his method, however, which precludes the necessity
of calculating the probability of chance occurrance for each
Individual's raw score. Therefore, in the present research
this table, which gives critical scores which are at most at
a probability level of .05, was consulted to divide the
subjects into high, average, and low status groups.
Since Bronfenbrenner's method yielded quite small
groups (the average membership in the high and low groups
was only 7.67, with a range of two to thirteen), it was felt
that a more meaningful statistical comparison would be
obtained if the upper and lower quarters of each class were
also considered as members of the high and low groups res-
pectively. This was accomplished by ranking the subjects in
each class according to the number of choices they received
on the respective criteria and dividing then into quarters.
In cases of tied scores, subjects were randomly assigned to
the upper and lower status groups by placing the tied sub-
jects' names on slips of paper and drawl jig the number
Z8
required to complete tYe group. Thus thirteen members each
were obtained for the star and neglectee groups, and twenty-
five for the average ~roup on each criteria. This process
was based on Northway's suggestion that the "method of ranking
and division into quarters is probably all that is necessary
for many practical investigators (13, p. 12)."
The procedures outlined above were followed in deter-
mining each subject's status in regard to the psychegroup and
the sociogroup criteria and also in regard to a combination of
his scores on the two criteria, accomplished by addition,
giving him membership in a third group, called the "total
group".
A copy of the POI and its special answer sheet were
also given to each subject during the third week of May by
M. E. Bonney. He instructed the subjects to read the direc-
tions on the test booklet, so that he could answer any
questions they might have, and to complete the test before
the next class meeting. Absentees were given similar instruc-
tions upon their return. All answer sheets were returned
before June 1, 1966.
Means and standard deviations on each POI scale were
obtained for each of the three status groups, as determined
by both methods described above, within the psychegroup, the
sociogroup, and the "total group". Analysis of variance was
used and the P test was done to determine the level, of signi-
ficance of the differences between the groups, T^ose which
29
were found stpcnlfican* were then treated by the _t test to
determine which groups differed significantly (10).
In regard to the interaction data collected In class
III, the total number of times each subject spoke In the
class discussions during the semester was divided by the total
number of minutes each subject spent in these discussions;
this yielded a frequency of verbalization per minute In dis-
cussion. Since the observer recorded the actual time spent
by the class in group discussion at each meeting and noted
which subjects were absent, a subject was not penalized for
absences. The Pearson Product Moment Coefficient of Corre-
lation, r, was computed between this frequency of verbaill-
zation and the number of choices received by each subject on
the psychegroup and on the sociogroup criterion.
CHAPTER BIBLIOGRAPHY
1. Bales, R. P., Interaction Process Analysis - A Method for the Study of Small Groups, Cambridge, Massachu-setts, Addison-Wesley Press, Inc., 1950.
2. Bonney, M. E. and S. A. Fessenden, Bonney-Fessenden Soclograph, Los Angeles, California, California Test Bureau, 1955*
3. Bonney, M. E., and R. S. Hampleman, Personal-Social Evaluation Techniques. Washington, D. C., The Center for Applied Research In Education, Inc., 1962.
k, Bronfenbrenner, U., "The Measurement of Soclometrlc Status, Structure and Development," Soclometry Monographs. No. 6, New York, Beacon House, 19**5»
5. Gronlund, N. E., Soclometry In the Classroom. New York, Harper and Row, 1959.
6. ^ , Leadership and Isolation. 2nd. ed., New York, Longmans, Green and Co., 1950.
7. Jennings, Helen H., "Soclometry of Leadership,n
Soclometry Monographs. No. 1&, New York, Beacon House,
8. Knapp, R. F., "Relationship of a Measure of Self-Actualization to Neurotlcism and Extraversion," Journal of Consulting Psychology. XXIX (April, 1965), 169-172.
9. Lemann, T. B. and R. L. Solomon, "Group Characteristics as Revealed in Soclometrlc Patterns and Personality Ratings," Soclometry Monographs. No. 27. New York, Beacon House, 1952.
10. McGuigan, F. J., Experimental Psychology. Englewood Cliffs, New Jersey, Prentice-Hall, Inc., 1964.
11. Moreno, J . L. and Helen H. Jennings, "Soclometrlc Measurement of Social Configurations," Soclometry Monographs. No. 3, New York, Beacon House, 1945.
30
31
12. Newjjtetter, W. I., M. J. Peldstein, and T. M. Newcomb, Group Adjustment. Cleveland, Ohio, Western Reserve University Fress, 1938.
13. Northway, Mary L., A Primer of Soclometry. Toronto, Canada, University of Toronto Press, 1952.
14. Northway, Mary L., Ester B. Prankel, and Reva Potashin, "Personality and Sociometrlc Status," Soclometry Monographs, No. 11, New York, Beacon House, 19^5•
15. Shostrom, E. L., "An Inventory for the Measurement of Self-Actualizatlon," Educational and Psychological Measurement. XXIV (Summer, 1964), 207-218.
16. , The Personal Orientation Inventory. San Diego, California, Educational and Industrial Testing Service, 1963.
17. Zeleny, L. D., "Soclometry of Morale," American Sociological Review. IV (December, 1939). 799-808.
CHAPTER TV
'••tSSULTS AND DISCUSSION
Results
The sociometric status groups were formed by the devi-
ation from chance and the division into quarters method. The
difference between the means on each scale of 'the POI of the
high, average, and low sociometric status groups were analyzed
by analysis of variance and then treated by the t test to
determine which groups differed significantly within the
psychegroup, soclogroup, and the "total group" categories.
Since this procedure resulted in analysis of 288 differences,
it was decided for the sake of brevity to present only those
differences which were found to be statistically significant.
The level of significance adopted for the purpose of the
present study was .05.
Significant differences for all three status groups
were reported rather than Just those concerning the first
hypothesis of the present study. This was done for the use
of future researchers in the area of soclometry and/or those
who utilize the POI.
The results of the comparison of the different status
groups determined by the deviation from chance method are
presented in Tables I through III. Those determined by the
32
33
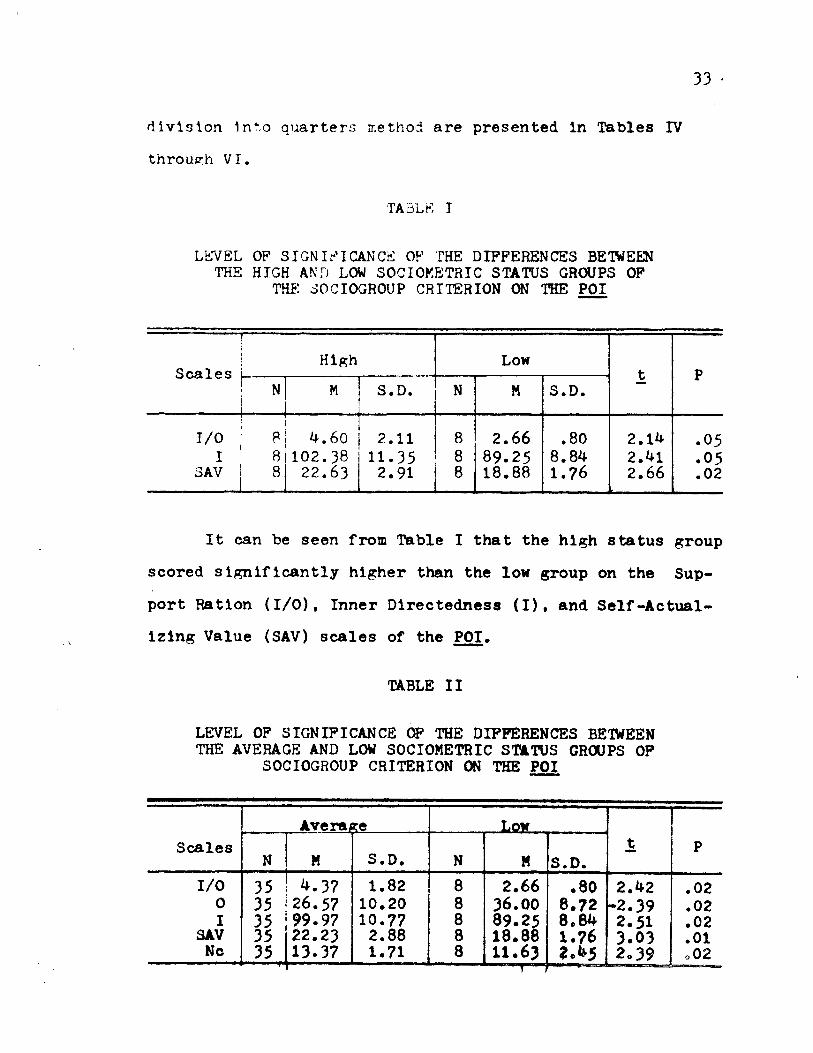
d i v i s i o n i n t o q u a r t e r s method are presented in Tables IV
through VI.
TA3L.fi T
LEVEL OF SIGN If I CAN CIS OF THE DIFFERENCES BE WEEN THE HIGH AND LOW SOCIOKETRIC STATUS GROUPS OF
THE dOCIOGROUP CRITERION ON THE POI
Scales
1 ! High f
Low t P Scales
; N M S.D. N M S.D. t P
SAV
! P 1 8
8
4.60 102.38 22.63
2.11 11.35 2.91
CO 00
00
2.66 89.25 18.88
.80 8.84 1.76
2.14 2.41 2.66
.05
.05
.02
It can be seen from Table I that the high status group
scored significantly higher than the low group on the Sup-
port Ration (I/O), Inner Directedness (I), and Self-Actual-
izing Value (SAV) scales of the POI.
TABLE II
LEVEL OF SIGNIFICANCE OF THE DIFFERENCES BETWEEN THE AVERAGE AND LOW SOCIOMETRIC STATUS GROUPS OF
SOCIOGROUP CRITERION ON THE PO£
Scales
Average LOW
P Scales N M S.D. N M S.D.
P
I/O 35 4 . 3 7 1 .82 8 2 .66 .80 2 . 4 2 .02 0 35 26.57 10 .20 8 36 .00 8 . 7 2 - 2 . 3 9 .02 I 35 99.97 10 .77 8 89 .25 8 . 6 4 2 .51 .02
SAV 35 22 .23 2 .88 8 18 .88 1.76 3 . 0 3 .01 Nc 35 13.37 1.71 8 11 .63 2 . 3 9 o02
3^
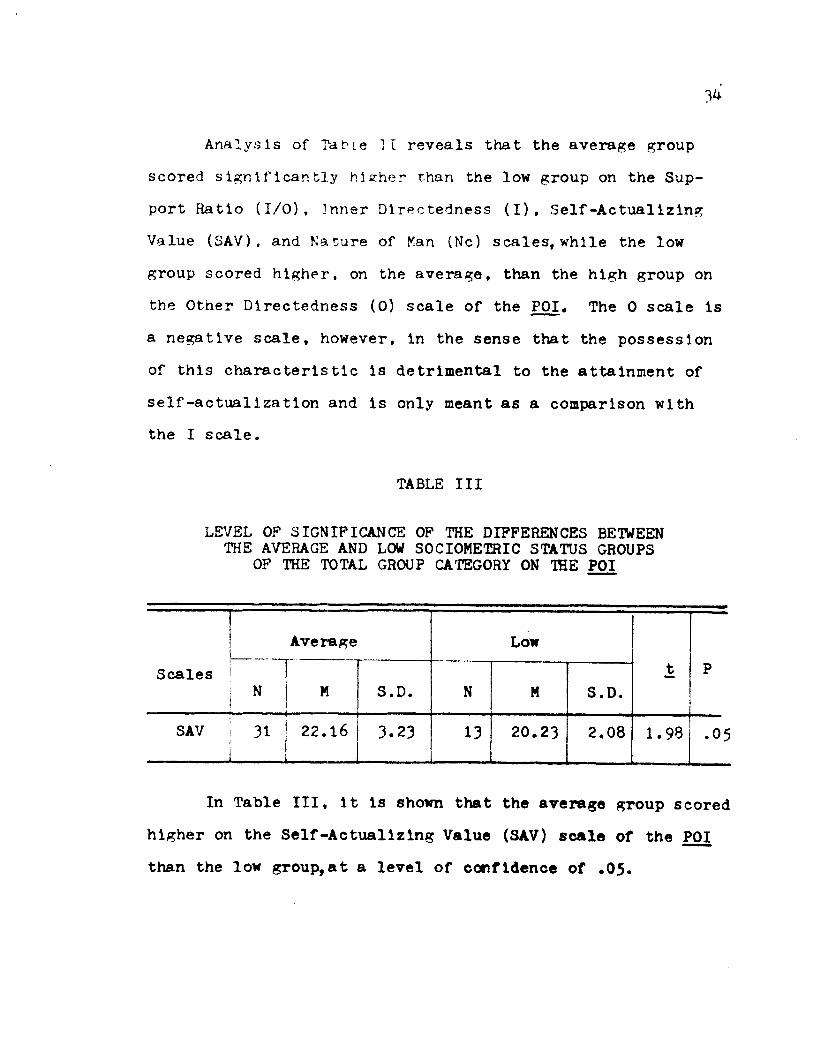
A n a l y s i s of T a m e I I reveals that the average group
scored significantly h i ether t h a n the low group on the Sup-
port R a t i o (I/O), i n n e r D i r e c t e d n e s s (I), Self-Actualizing
Value (SAV), and N a t u r e of Man (Nc) scales, while the low
group scored higher, on the average, than the high group on
the Other Directedness (0) scale of the POI. The 0 scale is
a negative scale, however, in the sense that the possession
of this characteristic is detrimental to the attainment of
self-actualization and is only meant as a comparison with
the I scale.
TABLE III
LEVEL OF SIGNIFICANCE OF THE DIFFERENCES BETWEEN THE AVERAGE AND LOW SOCIOMETRIC STATUS GROUPS
OF THE TOTAL GROUP CATEGORY ON THE POI
Average Low
Scales 1 i I t P
I | N M S.D. N M S.D.
SAV j
i
! 31 22.16 3.23 13 20.23 2.08 1.98 .05
In Table III, it is shown that the average group scored
higher on the Self-Actualizing Value (SAV) scale of the POI
than the low group,at a level of confidence of .05.
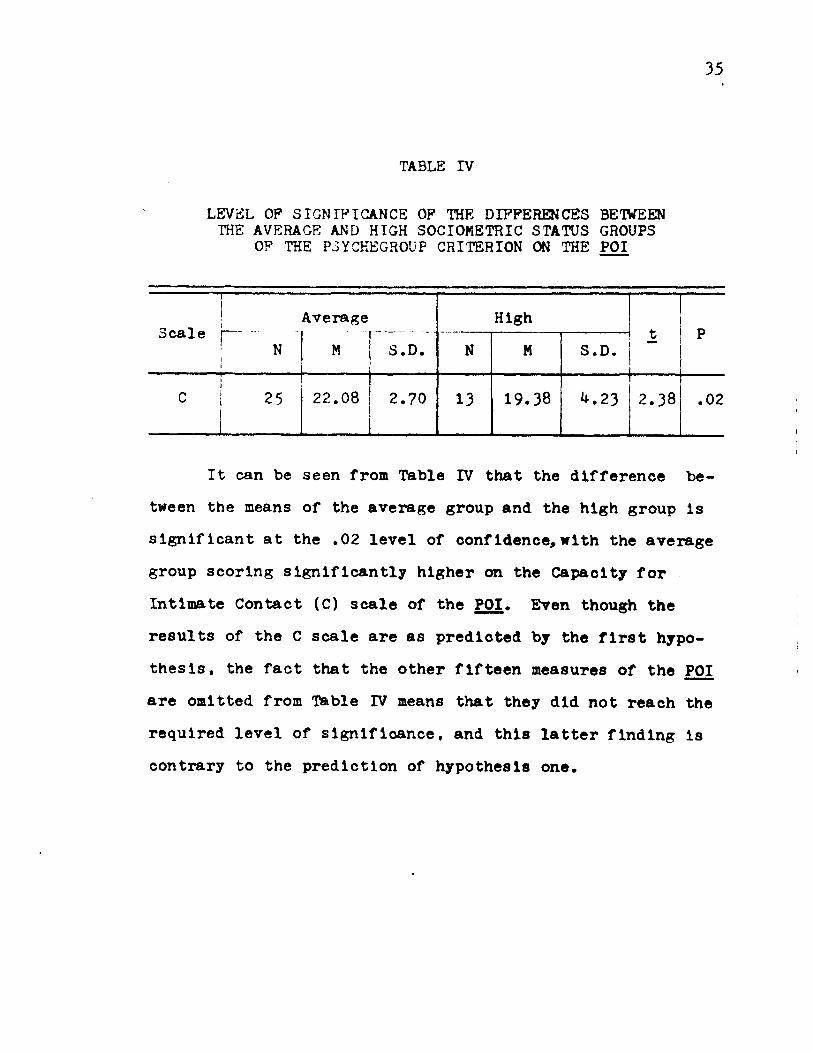
TABLE IV
LEVEL OP SIGNIFICANCE OP THE DIFFERENCES BE WEEN THE AVERAGE AND HIGH SOCIOMETRIC STATUS GROUPS
OP THE P3YCHEGR0UP CRITERION ON THE POI
35
Scale
I
! i
Average High t P Scale r n
i i
M S.D. N M S.D. ; t P
C 25 22.08 2.70 13 19.38 ^.23 2.38 .02
It can be seen from Table IV that the difference be-
tween the means of the average group and the high group is
significant at the .02 level of confidence,with the average
group scoring significantly higher on the Capacity for
Intimate Contact (C) scale of the POI, Even though the
results of the C scale are as predicted by the first hypo-
thesis, the fact that the other fifteen measures of the POI
are omitted from Table IV means that they did not reach J:he
required level of significance, and this latter finding is
contrary to the prediction of hypothesis one.
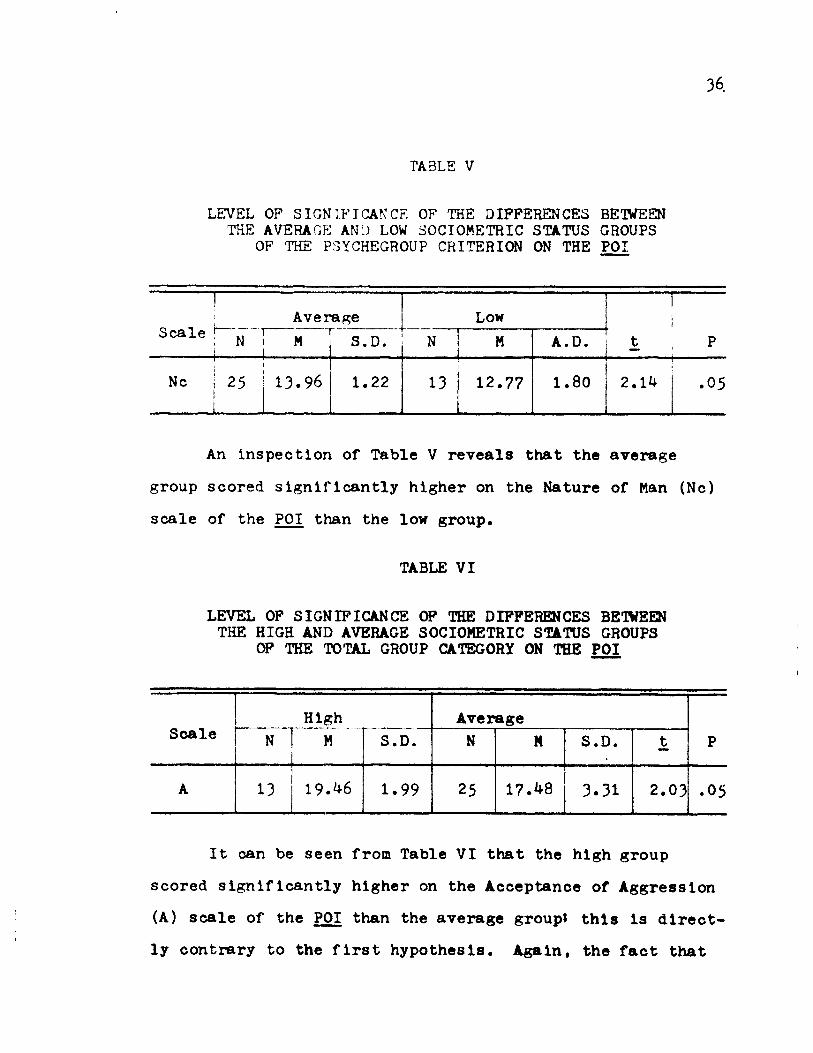
TABLE V
LEVEL OP SIGNIFICANCE OF THE DIFFERENCES BETWEEN THE AVERAGE AN'J LOW 30CI0METRIC STATUS GROUPS
OF THE PSYCHEGROUP CRITERION ON THE POI
36.
1
S c a l e ! t
A v e r a g e Low 1 1 i
1
S c a l e ! t N !
I M S . D . N M A . D . t P
!
Nc I 1 !
I 25 13.96 1.22
..
13 12.77 1 .80 2.14 .05
An inspection of Table V reveals that the average
group scored significantly higher on the Nature of Man (Nc)
scale of the POI than the low group.
TABLE VI
LEVEL OF SIGNIFICANCE OF THE DIFFERENCES BE WEEN THE HIGH AND AVERAGE SOCIOMETRIC STATUS GROUPS
OF THE TOTAL GROUP CATEGORY ON THE POI
Scale High Average
Scale N M S.D. N N S.D. t P
A 13 19.^6 1 .99 25 17.48 3.31 2 .03 .05
It can be seen from Table VI that the high group
scored significantly higher on the Acceptance of Aggression
(A) scale of the POI than the average group! this is direct-
ly contrary to the first hypothesis. Again, the fact that
3?
* t *
the other scales are omitted f rom'this table Beans that they ' *
did not reaoh slgnlf ioancei this was eontradlotory to the
prediction of the first hypothesis. * t
In summary, the finding was that there were no signi-
ficant differences between the high and average sooiometrlo
status groups when the groups were foraed by the deviation
from chance method in any of the three categories. Also,
analysis of Tables IV and VI revealed that when status
groups were determined by the division into quarters method,
one of the sixteen Measures of the POI was significant in
the hypothesized direction, and one was slgnlfleant in a S) direction opposite to that hypothesized. Therefore, the
first null hypothesis, was accepted.
In regard to the interaction data, the Pearson Product
Moment Coefficient of Correlation, r, was ooaputed between
the frequency of verbalizations and the number of ohoioes
received by eaoh subjeot in class III on the psyohegroup
and soclogroup criteria. Correlations of .30 and .41 were
found, respectively. These correlations were tested for
significance by the t test,which resulted in a t of . 9 9 for
the r of .30 and 1.^3 for the r of ,kl. However, t*s of
this size with ten degrees of freedom were not significant
at the .05 level. Therefore, the second null hypothesis
was accepted.
38'
Discussion
The fact that the first hypothesis was rejeoted may
Indicate that either there was no difference between the
level of self-actualization of the high and average soclo-
metric status groups In the population tested, or that the
POI Is not sufficiently sensitive to dlscrlalnate between
them. If the former explanation were true, It would suggest
that there Is no relationship between self-actualization and
the likelihood of being chosen on either psyohegroup or
sociogroup criteria. If the latter explanation were true,
additional research would be needed to perfect the soales
of the POI.
Evidence to support both acoeptanoe and rejection of
hypothesis one can be found in previous studies in the field
of sociometry. The rejection of hypothesis one was contrary
to what would be expected from several studies reviewed in
Chapter I and II. Northway and Wigdor's (7) finding that
the middle sociometrlo status group was less disturbed than
either the high or low groups was most directly contradicted.
They employed the Rorschach Inkblot Test in reaching their
conclusion, however, which would suggest that there is a
need for future investigators to determine the relationship
between the Rors ohftoh and the Pgl*
The views of several investigations were supported by
the rejection of the first hypothesis. Hllkevltob (3), for
39.
example, found no relation between peer status and person-
ality structure with his eighth grade subjects. Also
Jennings (A) concluded that etatus was not related to
personality but to the Interpersonal contribution of the
Individual to the group.
The following recommendations are made to future
Investigators:
1. A larger population should be tested soclometrl-
cally so that the upper status group would be of sufficient
size for meaningful comparisons.
2. More studies should be made of the middle soclo-
metric group to determine the characteristics of Its members
since the majority of people are found In this group.
Relatively few attempts have been made In the past to clarify
the meaning cf membership in this group.
3. Additional validation of the POI on larger groups
Is needed.
4. The normative group of the POI needs to be expanded
from college freshmen to a representative sample of the
general population.
5. The scales of the POI need to be subjected to factor
analysis to determine if they are measuring different aspects
of the self-actualizing person.
Although the second hypothesis concerning the relation
of frequency of verbalization and soclometrlc status was
rejected, the correlations were In the hypothesised direction.
40
However, the attempt to reconcile Miel's (6) finding, cited
in Chapter I, with those of other investigators (1, 2, 5)
failed. Therefore, the results of the present study were
also considered in disagreement with the hypothesis that
there is a significant positive relation between those who
score high soclometrically and those who have a high fre-
quency of verbalizations.
Future investigations in this area should use larger
groups and a more refined method of interaction analysis.
Also, more than one observer would be desirable to permit a
check on the reliability of the data.
CHAPTER BIBLIOGRAPHY
1. Bonney, M. E., "Social Behavior Differences Between Second Grade Children of High and Low Sociometric Status," Journal of Educational Research. XLVIII (March, 1955). ^81-^95.
2. Dunnington, Margaret, J., "Behavioral Differences of Sociometric Status Groups in a Nursery School," Child Development. XXVIII (March, 1 9 5 7 ) . 1 0 3 - 1 1 1 .
3. Hilkevitch, Rhea R., "Social Interaction Processes: A Quantitative Study," Psychological Reports. VII (October, I 9 6 0 ) , 1 9 5 - 2 0 1 .
4. Jennings, Helen H., Leadership and Isolation. 2nd ed., New York, Longmans, Green, and Co., 1950.
5. Kuhlen, R. G. and Beatrice J. Lee, "Personality Characteristics and Social Acceptability in Adoles-cence," Journal of Educational Psychology. XXXIV (September, 19*OT7 3 2 1 - 3 ^ 0 .
6. Miel, Alice, "A Group Studies Itself to Improve Itself," Teacher's College Record, XLIX (October, 1957). 31-^3*
7. Northway, Mary L. and Blossom, Wigdon, "Rorschach Patterns Related to the Sociometric Status of School Children," Sociometry, X (May, 19^7). 186-199.
41
CHAPTER V
SUMMARY
Sociability is one of the most valued traits in our
American culture and is, naturally, reflected in the social-
ization of the young. If this value were sound, then those
who score high on sociometric tests should evidence a greater
degree of mental health than those scoring below them. How-
ever, the results of a number of investigations have cast
doubt on an assumption that either the sociometrically high
or the sociometrically low are optimally adjusted. The pur-
pose of the present study, then, was to attempt to determine
if it were the average, or middle, group which evidenced the
greatest degree of mental health.
The present investigation also attempted to reconcile
the divergent results found regarding the relation of amount
of verbalization, an important aspect of sociability, to
sociometric status.
The sociometric test used, consisting of both psyche-
group and sociogroup criteria, was devised by M. E. Borrney*
of the Department of Psychology at North Texas State Univer-
sity. The measure of mental health seleoted was The Personal
Orientation Inventory (POI).
42
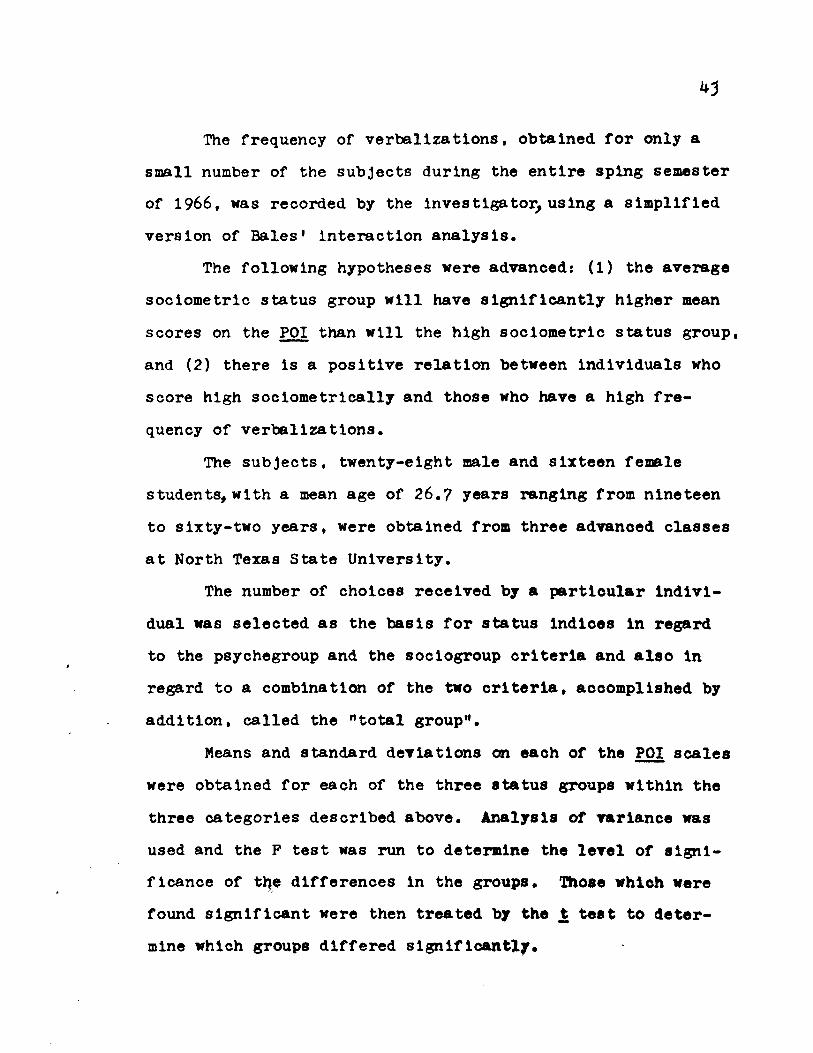
The frequency of verbalizations, obtained, for only a
small number of the subjects during the entire splng semester
of 1966, was recorded, by the investigator, using a simplified,
version of Bales' interaction analysis.
The following hypotheses were advanced: (1) the average
sociometric status group will have significantly higher mean
scores on the POI than will the high sociometric status group,
and (2) there is a positive relation between individuals who
score high sociometrically and those who have a high fre-
quency of verbalizations.
The subjects, twenty-eight male and sixteen female
students, with a mean age of 26.7 years ranging from nineteen
to sixty-two years, were obtained from three advanced classes
at North Texas State University.
The number of choices received by a particular indivi-
dual was selected as the basis for status Indices in regard
to the psychegroup and the sociogroup criteria and also in
regard to a combination of the two criteria, accomplished by
addition, called the "total group".
Means and standard deviations on each of the POI scales
were obtained for each of the three status groups within the
three categories described above. Analysis of variance was
used and the P test was run to determine the level of signi-
ficance of the differences in the groups. Those which were
found significant were then treated by the t test to deter-
mine which groups differed significantly.
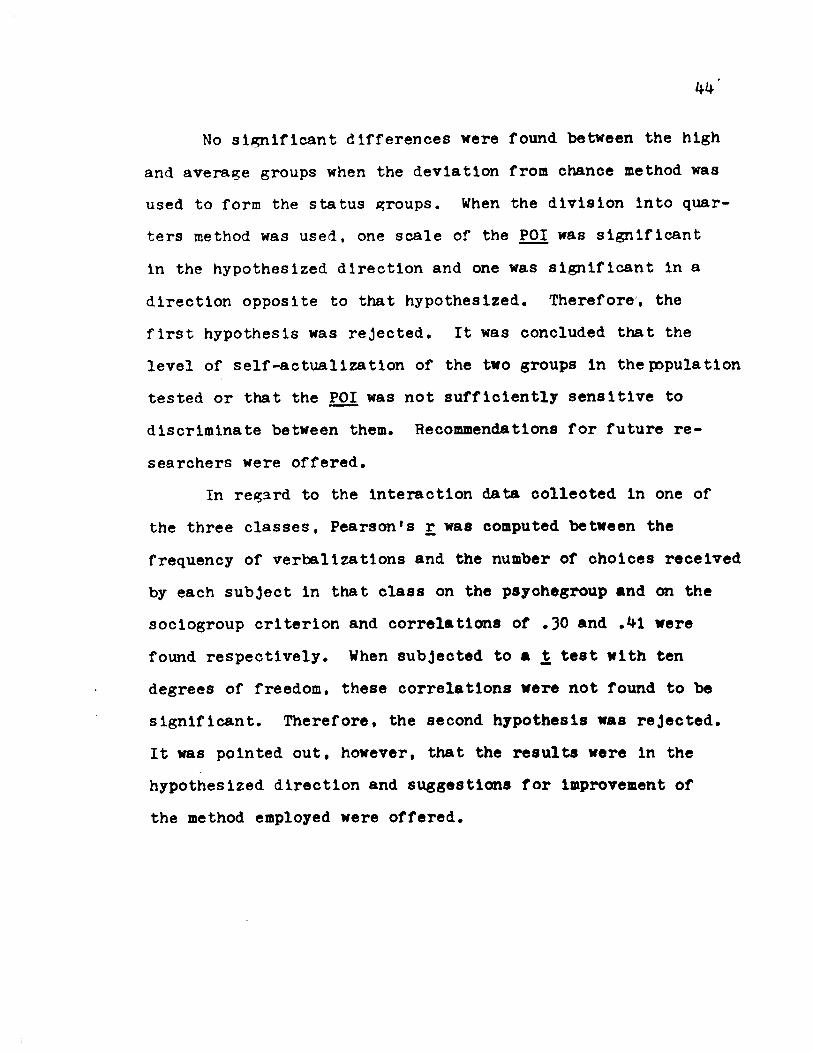
No significant differences were found between the high
and average groups when the deviation from chance method was
used to form the status groups. When the division Into quar-
ters method was used, one scale of the POI was significant
In the hypothesized direction and one was significant In a
direction opposite to that hypothesized. Therefore, the
first hypothesis was rejected. It was concluded that the
level of self-actualization of the two groups in the population
tested or that the POI was not sufficiently sensitive to
discriminate between them. Recommendations for future re-
searchers were offered.
In regard to the interaction data collected in one of
the three classes, Pearson's r was computed between the
frequency of verbalizations and the number of choices received
by each subject in that class on the psychegroup and on the
sociogroup criterion and correlations of .30 and were
found respectively. When subjected to a t test with ten
degrees of freedom, these correlations were not found to be
significant. Therefore, the second hypothesis was rejected.
It was pointed out, however, that the results were In the
hypothesized direction and suggestions for Improvement of
the method employed were offered.
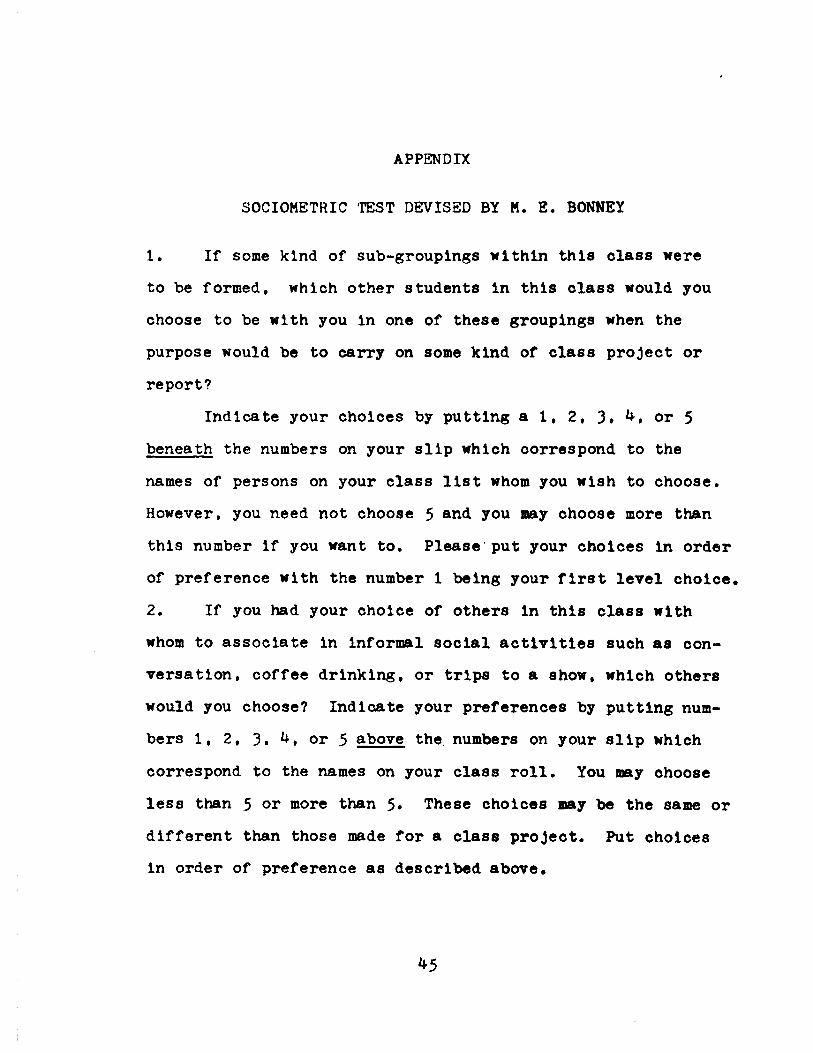
APPENDIX
SOCIOMETRIC TEST DEVISED BY M. E. BONNEY
1. If some kind of sub-groupings within this class were
to be formed, which other students in this class would you
choose to be with you in one of these groupings when the
purpose would be to carry on some kind of class project or
report?
Indicate your choices by putting a 1, 2, 3. or 5
beneath the numbers on your slip which correspond to the
names of persons on your class list whom you wish to choose.
However, you need not choose 5 and you may choose more than
this number if you want to. Please put your choices in order
of preference with the number 1 being your first level choice.
2. If you had your choice of others in this class with
whom to associate in informal social activities such as con-
versation, coffee drinking, or trips to a show, which others
would you choose? Indicate your preferences by putting num-
bers 1, 2, 3# or 5 above the. numbers on your slip which
correspond to the names on your class roll. You may choose
less than 5 or more than 5* These choices may be the same or
different than those made for a class project. Put choices
in order of preference as described above.
^5
BIBLIOGRAPHY
Books
Bales, R. F. , Interaction Process Analysis - A Method for the Study of Small Groups, Cambridge, Massachusetts, Addl-son-Wesley Press, Inc., 1950.
Bonney, M. E., "Popular and Unpopular Children," Soclometry Monographs, No. 9. New York, Beacon House, 19^7.
Bonney, M. S., and S. A. Pessenden, Bonney-Fessenden Soclo-graph, Los Angeles, California, California Test Bureau, 1955.
Bonney, M. E., and R. S. Hampleman, Personal-Social Evaluation Techniques. Washington, D. D., The Center for Applied Research in Education, Inc., 1962.
Bronfenbrenner, U., "The Measurement of Sociometric Status, Structure and Development," Soclometry Monographs, No. 6, New York, Beacon House, 19^5*
Gronlund, N. E., Soclometry In the Classroom, New York, Harper and Row, 1959.
Jennings, Helen H., Leadership and Isolation. 2nd ed., New York, Longmans, Green and Co., 1950.
, "Soclometry of Leadership," Soclometry Monographs. No. 1^, New York, Beacon House, 19^7.
Lemann, T. B. and R. L. Solomon, "Group Characteristics as Revealed In Sociometric Patterns and Personality Rat-ings," Soclometry Monographs, No. 27, New York, Beacon House, 1952.
McGuigan, F. J., Experimental Psychology, Englewood Cliffs, Mew Jersey, Prentice-Hall, Inc., 196^.
Moreno, J. L., Who Shall Survive? A New Approach to the Problem of Human Inter-RelatXons. New York, Beacon House, 193^.
Newstetter, W. I., M. J. Feldstein and T. M. Newcomb, Group Adjustment. Cleveland, Ohio, Western Reserve University Press, 1938.
k6
4?
Northway, Mary L., A Primer of Soolometry. Toronto, Canada, University of~Toronto Press, 1952.
Northway, Mary L., Ester B. Prankel, and Reva Potashln, "Personality and Soclometric Status," Soclometry Monographs. No. 11, New York, Beacon House, 1945.
Shostrom, 5. L., The Personal Orientation Inventory. San Diego, California, Educational and Industrial Testing Service, 1963.
Articles
Blatt, S. J., "An Attempt to Define Mental Health," Journal of Consulting Psychology. XXVIII (April, 1964), 146-153.
Block, J., "Some Differences Between the Concepts of Social Desirability and Adjustment," Journal of Consulting Psychology, XXVI (December, 1962),527-530.
Bonney, M. E., "The Constancy of Soclometric Scores and Their Relationship to Teacher Judgments of Social Suc-cess and to Personality Self-Ratings," Soclometry. VI (November, 1943), 409-424.
, "Personality Traits of Socially Successful and Socially Unsuccessful Children," Journal of Educ-ational Psychology. XXXIV (November, 1943), 449-472.
, "Social Behavior Differences Between Second Grade Children of High and Low Soclometric Status," Journal of Educational Research. XLVIII (March, 1955). 481-495.
Brown, Julia, S., "Soclometric Choices of Patients In a Therapeutic Community," Human Relations. XVIII (August, 1965), 241-251.
Dunnington, Margaret, J., "Behavioral Differences of Soclo-metric Status Groups in a Nursery School," Child nnvwiopmrnt. XXVIII (March, 1957). 103-111.
Hilkevitch, Rhea R., "Social Interaction Processes: A Quan-titative Study," Psychological Reports. VII (October, I960), 195-201.
Hunt, J. and R. L. Solomon, "The Stability and Some Corre-lates of Group Status in a Summer-Camp Group of Young Boys," American Journal of Psychology, LV (January, 1942), 33-45.
Knapp, R. F., "Relationship of a Measure of Self-Actualization to Neurotlclsm arid Ext ravers ion," Journal of Consulting Psychology, XXTX (April, 1965), 169-172.
Kogan, W. 3., R. Quinn, A. P. Ax, and H. 5. Ripley, "Some Methodological Problems in the Quantification of Clinical Assessment by A. Array," Journal of Consulting Psychology, XXI (February, 195?)» 57-62.
Kuhlen, h. 3. and Beatrice J. Lee, "Personality Characteris-tics and Social Acceptability in Adolescence," Journal of Educational Psychology, XXXIV (September, 19^3). 321-3^0.
Kiel, Alice, "A Group Studies Itself to Improve Itself," Teacher1s College Record, XLIX (October, 19^7), 31-^3.
Mill, C. R., "Personality Patterns of Sociometrically Selec-ted and Sociometrically Rejected Male College Students," Soclometry. LIII (Kay, 1953), 151-16?.
Moreno, J. L. and Helen H. Jennings, "Soclometric Measurement of Social Configurations," Soclometry Monographs. No. 3, New York, Beacon House, 19^5»
Northway, Mary L., "Outsiders: A Study of the Personality Patterns, of Children Least Acceptable to Their Age Kates," Soclometry. Ill (February, 19^*0 . 10-26.
Northway, Mary L., and Blossom Wlgdor, "Rorschach Patterns Related to the Soclometric Status of School Children," Soclometry, X (May, 19^7). 186-199.
Shostrom, E. L., "An Inventory for the Measurement of Self-Actualization," Education and Psychological Measurement, XXIV (Summer, 196*0. 207-2157
Veldman, D. J., R. F. Peck, and C. McGulre, "Measuring the Value Systems of Education Professors," Journal of Educational Psychology, LII (December, 196lV# 330-JW.
Wiener, M., A. Blumberg, Sarah Segman and A. Cooper, "A Judgment of Adjustment by Psychologists, Psychiatric Social Workers, and College Students, and Its Rela-tionship to Social Desirability," Journal of Abnormal and Social Psychology, LIX (November, 1959T7 315-321.
Zeleny, L. D. , "Soclometry of Morale," American Sociological Review. IV (December, 1939). 799-^oW.

49
Unpublished Materials
Aber, W. E. , "Rorschach Patterns as Related to Sociometrie Status," unpublished master's thesis, Department of Psychology, North Texas State University, Denton, Texas, 1955.