Embed Size (px)
Citation preview

Institut de Recerca en Economia Aplicada Regional i Pública Document de Treball 2011/22 pàg. 1 Research Institute of Applied Economics Working Paper 2011/22 pag. 1
1
Institut de Recerca en Economia Aplicada Regional i Pública Document de Treball 2011/25 44 pàg Research Institute of Applied Economics Working Paper 2011/25 44 pag.
“The regional distribution of unemployment. What do micro-data tell us?”
Enrique López-Bazo and Elisabet Motellón
Institut de Recerca en Economia Aplicada Regional i Pública Document de Treball 2011/22 pàg. 2 Research Institute of Applied Economics Working Paper 2011/22 pag. 2
2
WEBSITE: www.ub.edu/irea/ • CONTACT: [email protected]
The Research Institute of Applied Economics (IREA) in Barcelona was founded in 2005, as a research institute in applied economics. Three consolidated research groups make up the institute: AQR, RISK and GiM, and a large number of members are involved in the Institute. IREA focuses on four priority lines of investigation: (i) the quantitative study of regional and urban economic activity and analysis of regional and local economic policies, (ii) study of public economic activity in markets, particularly in the fields of empirical evaluation of privatization, the regulation and competition in the markets of public services using state of industrial economy, (iii) risk analysis in finance and insurance, and (iv) the development of micro and macro econometrics applied for the analysis of economic activity, particularly for quantitative evaluation of public policies.
IREA Working Papers often represent preliminary work and are circulated to encourage discussion. Citation of such a paper should account for its provisional character. For that reason, IREA Working Papers may not be reproduced or distributed without the written consent of the author. A revised version may be available directly from the author.
Any opinions expressed here are those of the author(s) and not those of IREA. Research published in this series may include views on policy, but the institute itself takes no institutional policy positions.
1
The regional distribution of unemployment. What do micro-data tell us?
Enrique López-Bazo† �
Elisabet Motellón‡ � † European Commission, Joint Research Centre (JRC), Institute for Prospective
Technological Studies (IPTS). C/ Inca Garcilaso 3, E–41092, Seville, Spain
� AQR—IREA. Universitat de Barcelona Avda Diagonal 690. 08034 Barcelona. Spain Tel: +34 93 4037041 FAX: +34 93 4021821
‡ Universitat Oberta de Catalunya
Avda. Tibidabo 39-43. 08035 Barcelona. Spain Tel: + 34 93 2537501
Email: [email protected]; [email protected]
Abstract: Regional disparities in unemployment rates are large and persistent. The literature provides evidence of their magnitude and evolution, as well as evidence of the role of certain economic, demographic and environmental factors in explaining the gap between regions of low and high unemployment. Most of these studies, however, adopt an aggregate approach and so do not account for the individual characteristics of the unemployed and employed in each region. This paper, by drawing on micro-data from the Spanish wave of the Labour Force Survey, seeks to remedy this shortcoming by analysing regional differentials in unemployment rates. An appropriate decomposition of the regional gap in the average probability of being unemployed enables us to distinguish between the contribution of differences in the regional distribution of individual characteristics from that attributable to a different impact of these characteristics on the probability of unemployment. Our results suggest that the well-documented disparities in regional unemployment are not just the result of regional heterogeneity in the distribution of individual characteristics. Non-negligible differences in the probability of unemployment remain after controlling for this type of heterogeneity, as a result of differences across regions in the impact of the observed characteristics. Among the factors considered in our analysis, regional differences in the endowment and impact of an individual’s education are shown to play a major role. JEL codes: C25, J64, J70, R23 Keywords: Regional labour markets, Regional unemployment, Education, Gap
decomposition for non-linear models.
Acknowledgments: The authors wish to acknowledge financial support from the Spanish Ministry of Science and Technology, National Program of R&D, ECO2008-05314/ECON. EL-B also thanks the European Community’s Seventh Framework Programme (FP7-SSH-2010-2.2-1) for financial support under grant agreement n° 266834, SEARCH Project.
2
1. INTRODUCTION
Disparities in unemployment rates are sizeable and persistent both between and within many
countries (OECD, 1989, 1990, 2000, 2005; Blanchard and Katz, 1992; Decressin and Fatas,
1995; López-Bazo et al., 2002; Overman and Puga, 2002; Cracolici et al., 2007; Bande et al.,
2008; Filiztekin, 2009). In Spain, for example, data from the Labour Force Survey (LFS)
reveal that the unemployment rate in 2010 was 20.2%, the highest among OECD members.
This figure contrasts sharply with the lowest rates recorded in OECD economies, namely in
Norway and Korea (3.7% and 3.8% respectively). A comparison of the unemployment rates
in the various member states of the European Union (EU) - the highest being in Spain and the
lowest in the Netherlands, Austria and Luxembourg (4.5%) - shows marked disparities also
between countries of an economically integrated area with a common currency. However, the
magnitude of disparities is even greater within than it is between countries. Thus, in Spain in
2010 the unemployment rate in Andalusia and the Canary Islands reached 28% and 28.7%
respectively, whereas at a distance of a few hundred kilometres and within a similar
institutional framework, the rate in the Basque Country was 10.5%.
As such, the regional gap in Spain’s unemployment rate is of a similar order of magnitude to
that observed between the country considered as a whole and rates recorded in EU and OECD
economies. Furthermore, the analysis in OECD (2005) suggests that Spain is no anomaly
here, as the degree of regional disparity in unemployment rates within a number of countries
(including Germany, Italy, Mexico, and Turkey) is even higher than that observed in Spain.
These results also point to the increase in regional inequality within countries as being at the
root of the intensification of overall inequality in unemployment rates in Europe.
From a theoretical perspective, in a world characterized by the absence of adjustment costs
and rigidities, disparities in unemployment rates across locations would not be expected to
persist. Situations of excess labour in one area would quickly disappear as workers moved to
areas with higher rates of unemployment. However, the evidence (Lazar, 1997; Evans and
McCormick, 1994; Martin, 1997; Martin and Sunley, 1999; Overman and Puga, 1999; López-
Bazo et al., 2005) indicates just the opposite: regions with high unemployment in a given
decade continue to suffer high unemployment rates in the following decades, while regions
with low unemployment continue to enjoy low rates.
3
The slow wage adjustment rate and the high costs incurred by individuals and firms when
migrating probably explain why idiosyncratic shocks, or contrasting regional responses to
common shocks, might cause unemployment rates to differ markedly across regions for long
periods. Given this explanation, heterogeneity in the spatial distribution of unemployment can
be seen as what Marston (1985) defines as a disequilibrium phenomenon. A second
explanation as to why certain areas have differing unemployment rates is also provided in
Marston (1985), drawing on ideas in Hall (1972) and Rosen (1974). A steady-state
relationship in unemployment rates across regions exists as a function of their factor
endowment and since this endowment differs from one region to another, the spatial
distribution of unemployment is not homogeneous. Moreover, as long as this endowment
remains stable, the distribution of unemployment will not change dramatically. This
equilibrium hypothesis, therefore, is based on the idea that workers have incentives not to
migrate when unemployed because, for one reason or another, they value these endowments.
On the other hand, when selecting their optimal location, firms take into account other
regional endowments in addition to those of wage and unemployment rates (Partridge and
Rickman, 1997). Evidence regarding high wages in areas of high unemployment supports this
view, as does the preference for certain facilities and amenities. Martin (1997) and Partridge
and Rickman (1997) extend the list of factors that might account for unemployment
equilibrium differentials to permanent differences in economic, institutional and labour
market characteristics across regions.
Most previous contributions to the empirical literature (Elhorst, 1995; Partridge and Rickman,
1997; Taylor and Bradley, 1997; López-Bazo et al., 2002, 2005; Filiztekin, 2009) have sought
to analyse the determinants of regional inequalities in unemployment by means of an
aggregate specification in which the unemployment rate in each region, or the deviation from
a benchmark (the nationwide average or the region with the lowest rate), is related to regional
magnitudes proxying for both the disequilibrium and the equilibrium determinants of
unemployment. It should be noted that this aggregate approach imposes the same effect on
each variable in all regions, while only partially (and thus imperfectly) accounting for
regional heterogeneity in individual and household characteristics, i.e., for the sorting of
individuals across regions according to their observed characteristics.
The expected impact of education on unemployment can be used to illustrate our argument. A
rising level of education in a region is assumed to have a negative impact on its rate of
4
unemployment, given that findings at the micro level suggest that education increases the
probability of an individual finding and keeping work (e.g., Mincer, 1991; OECD, 2011).
Accordingly, the effect of the regional endowment of education on the regional
unemployment rate is estimated to be negative and significant in six out of the nine studies
reviewed by Elhorst (2003). Yet, contradictory findings are reported in the remaining three
studies. Furthermore, the effect is reported as being positive, and in some cases even
significant, for the set of Canadian regions in Partridge (2001), while no significance was
found for the Spanish regions in López-Bazo et al. (2002, 2005). Likewise, Filiztekin (2009)
finds no evidence of a robust negative effect for the Turkish provinces. Thus, there would
seem to be some contradiction between the expected effect of education on an individual’s
probability of unemployment and the findings of empirical studies using micro-data, and (at
least part of) those of aggregate studies using regional data.
In this paper, we seek to complement previous evidence of regional unemployment disparities
obtained from studies using aggregate data, with results based on the exploitation of micro-
data. By drawing on information for individuals in each region, we are able to control for the
spatial distribution of the set of characteristics that shape an individual’s probability of being
unemployed and, by aggregation, the unemployment rate at the regional level. To the best of
our knowledge, this represents a novel contribution to the literature that analyses regional
disparities in labour market quantities (unemployment, employment. and participation rates).
In fact, the use of information at the individual level within each region enables us to assess
the contribution of differences in the endowment, and in the impact of the characteristics that
determine an individual’s probability of unemployment, to the regional unemployment rate
gap. It should be stressed that the decomposition of the gap between two groups of workers
(male and female, native and immigrant, etc.) for a magnitude of interest (usually wages) has
been standard practice in the labour economics literature since the seminal proposals made by
Oaxaca (1973) and Blinder (1973). However, the application of this methodology in the
regional economics literature remains scarce and focused primarily on wages (see, for
instance, García and Molina, 2002; López-Bazo and Motellón, 2011; and Pereira and Galego,
2011).
The standard detailed decomposition is only suitable for linear models and, thus, cannot be
applied in decomposing the gap in the probability of unemployment. Thus, here, as an
5
alternative, we apply the generalized decomposition method suggested by Yun (2004), which
provides a detailed decomposition of the effects of each variable (or groups of variables)
under analysis in the case of non-linear models. As far as we are aware, this approach has
only previously been applied in a regional context by Motellón (2008) to analyze regional
gaps in the probability of being hired under temporary contract in Spain. We should stress
that the possibility of obtaining a detailed decomposition of the regional unemployment gap is
crucial to our analysis given our interest in isolating the effects attributable to different sets of
characteristics (individual vs. household) and, in particular, in assessing the role of an
individual’s education in accounting for regional unemployment rate differentials.
A detailed decomposition is reported in this study in order to assess the contribution of a
broad set of individual and household characteristics that might account for regional gaps in
unemployment rates in Spain. Drawing on micro-data for the Spanish regions taken from the
LFS, we obtain results that indicate that only part of the regional gap in unemployment rates
can be explained by the spatial distribution of observed individual and household
characteristics (i.e., spatial sorting linked to observed characteristics). In other words, Spain’s
regions also differ in the impact that these characteristics can have on the probability of being
unemployed in a given region and, in fact, this accounts for a sizable part of the gap. Our
results also suggest that education has a substantial impact, but that this impact is far from
straightforward. Thus, on the one hand, low levels of education in some regions contribute to
higher rates of unemployment; on the other hand, the more marked impact of low levels of
schooling on the probability of being unemployed in regions with high unemployment serves
to reduce what would otherwise be a wider regional gap in unemployment rates. Studies using
aggregate data at the regional level are unable to detect this feature as they assume the same
throughout the regions.
The rest of the paper is structured as follows. The next section introduces the dataset used in
the analysis and describes the main features of the regional distribution of unemployment
rates in Spain. It also defines two groups of regions with markedly contrasting incidences of
unemployment, and shows that the distribution of certain individual and household
characteristics in these two groups is far from equal. The probabilistic model used to estimate
the impact of the observed characteristics on the probability of unemployment in each group
of regions is defined in Section 3. This section also outlines the methodology used to obtain
the detailed decomposition of the gap observed between regions with high and low
6
unemployment rates. Section 4 discusses results concerning the regional heterogeneity in the
impact of the observed characteristics and those concerning the detailed decomposition, with
a particular concern for the effect associated with the number of years of schooling
attributable to an individual. Additional results obtained from using an alternative proxy for
education, and when distinguishing by gender, are discussed in Section 5. Finally, we offer
some concluding comments in Section 6.
2. DATA AND DESCRIPTIVE ANALYSIS
In contrast with previous studies in the literature that draw on statistical information at the
aggregate regional level, our study is based on individual data for each of the regions under
analysis. The data correspond to the second quarter for each of the years 1999 to 2009
contained in the LFS.1 The LFS is produced by the Spanish National Institute for Statistics in
line with the criteria laid down by EUROSTAT for EU Member States. The survey provides
information about the status of individuals in the labor market (non-participant, employed,
unemployed) and the characteristics of individuals and households (gender, nationality, age,
education, number of household members, etc.). The sample used in our analysis comprises
individuals between 16 and 65 years of age in each of the seventeen NUTS 2 regions in
Spain, which correspond to historical and administrative regions with considerable political
and financial autonomy, including responsibility for drafting and implementing specific
labour market policies. Notice that the LFS-sample design ensures that it is representative of
each of these Spanish regions.
The unemployment rates in each of the regions and in the country as a whole at the beginning
(1999), at the mid-point (2004), and at the end of the period under analysis (2009) are shown
in Table 1. The table also includes the average unemployment rate for this period for the
whole of Spain and for each region. These figures confirm that unemployment differentials
across the Spanish regions are sizeable and persistent. If we use the unemployment rate as a
rough measure of the probability of being unemployed, Table 1 indicates that a representative
(average) individual of the active population in Andalusia, or in Extremadura, is between two
to three times more likely to be unemployed than a counterpart in regions at a distance of just
a few hundred kilometres (e.g. La Rioja, Navarra, and Aragon). 1 The LFS is conducted each quarter. However, given the impact of seasonality on Spain’s labour market (being particularly sensitive to tourism and other activities in the service and primary sectors), we present the results using information for the second quarter of each year, as it would seem that this quarter is the one that is least influenced by seasonal variations. Note, nevertheless, that our results are robust to the consideration of data for the other three quarters.
7
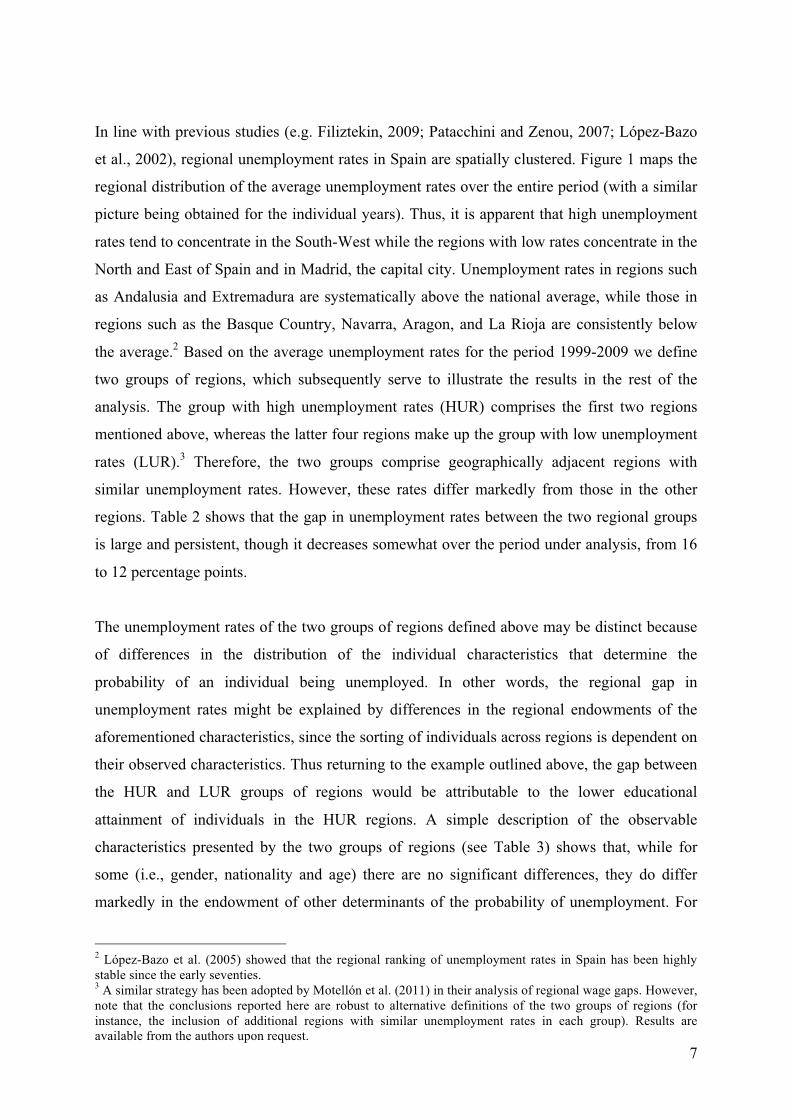
In line with previous studies (e.g. Filiztekin, 2009; Patacchini and Zenou, 2007; López-Bazo
et al., 2002), regional unemployment rates in Spain are spatially clustered. Figure 1 maps the
regional distribution of the average unemployment rates over the entire period (with a similar
picture being obtained for the individual years). Thus, it is apparent that high unemployment
rates tend to concentrate in the South-West while the regions with low rates concentrate in the
North and East of Spain and in Madrid, the capital city. Unemployment rates in regions such
as Andalusia and Extremadura are systematically above the national average, while those in
regions such as the Basque Country, Navarra, Aragon, and La Rioja are consistently below
the average.2 Based on the average unemployment rates for the period 1999-2009 we define
two groups of regions, which subsequently serve to illustrate the results in the rest of the
analysis. The group with high unemployment rates (HUR) comprises the first two regions
mentioned above, whereas the latter four regions make up the group with low unemployment
rates (LUR).3 Therefore, the two groups comprise geographically adjacent regions with
similar unemployment rates. However, these rates differ markedly from those in the other
regions. Table 2 shows that the gap in unemployment rates between the two regional groups
is large and persistent, though it decreases somewhat over the period under analysis, from 16
to 12 percentage points.
The unemployment rates of the two groups of regions defined above may be distinct because
of differences in the distribution of the individual characteristics that determine the
probability of an individual being unemployed. In other words, the regional gap in
unemployment rates might be explained by differences in the regional endowments of the
aforementioned characteristics, since the sorting of individuals across regions is dependent on
their observed characteristics. Thus returning to the example outlined above, the gap between
the HUR and LUR groups of regions would be attributable to the lower educational
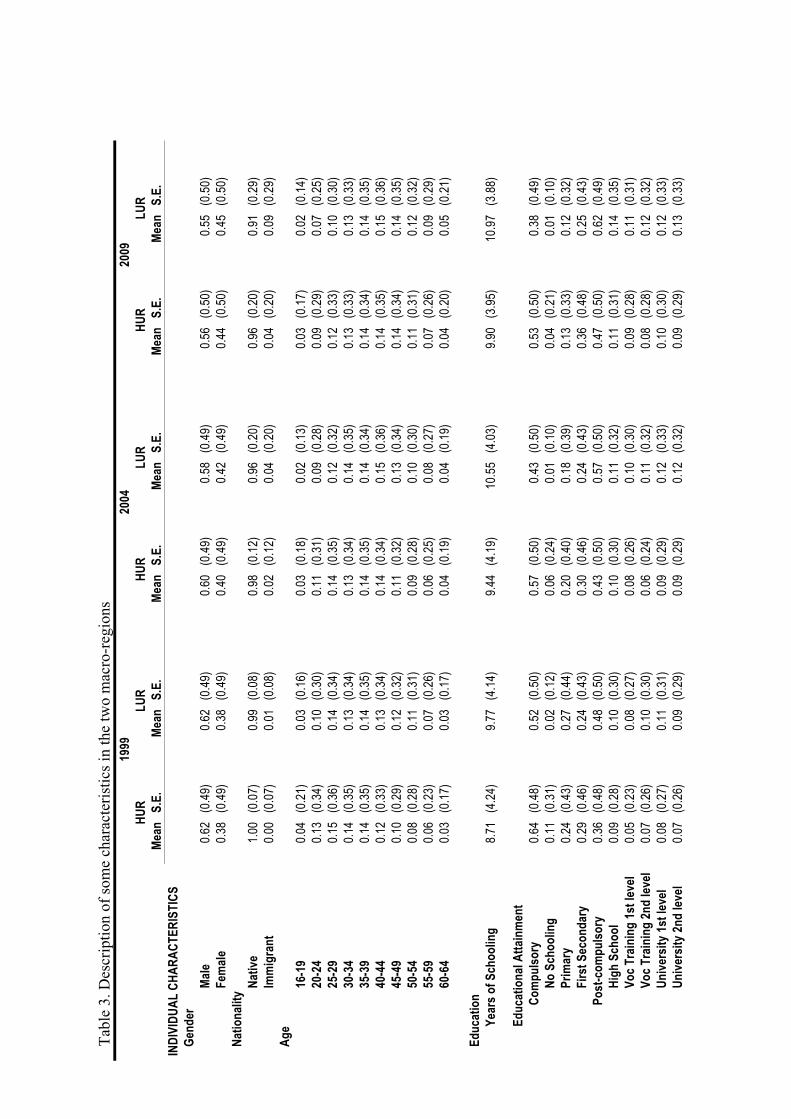
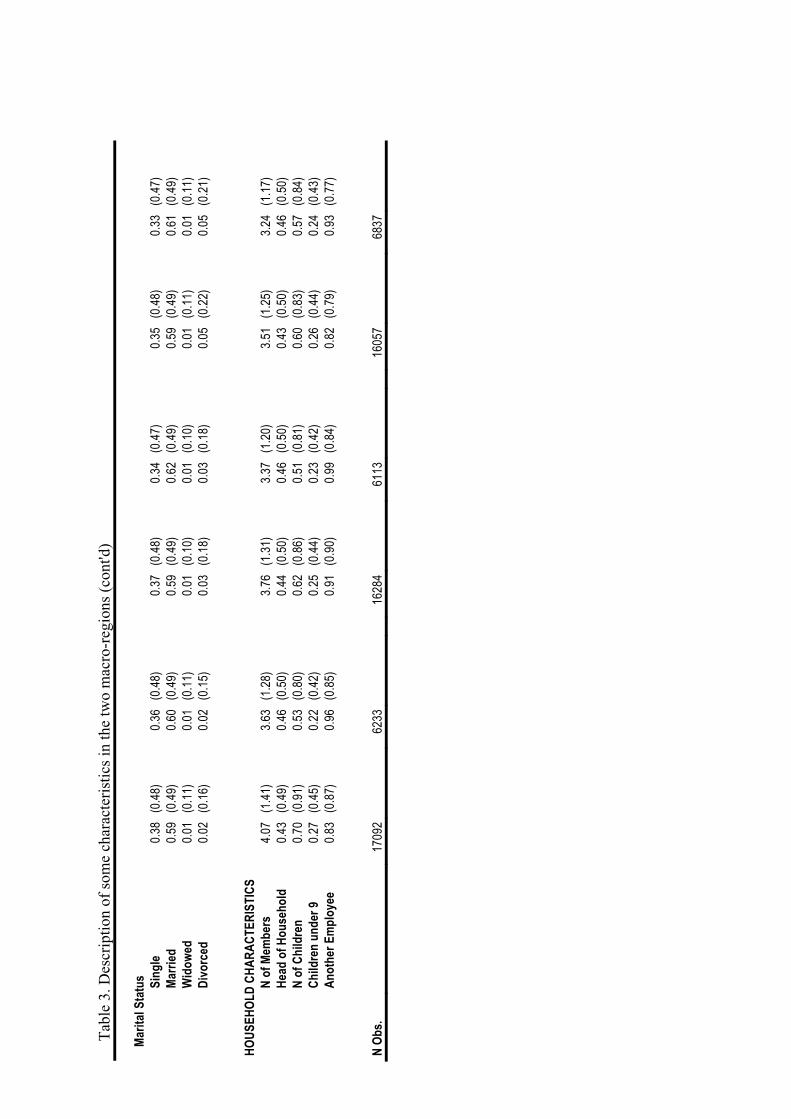
attainment of individuals in the HUR regions. A simple description of the observable
characteristics presented by the two groups of regions (see Table 3) shows that, while for
some (i.e., gender, nationality and age) there are no significant differences, they do differ
markedly in the endowment of other determinants of the probability of unemployment. For
2 López-Bazo et al. (2005) showed that the regional ranking of unemployment rates in Spain has been highly stable since the early seventies. 3 A similar strategy has been adopted by Motellón et al. (2011) in their analysis of regional wage gaps. However, note that the conclusions reported here are robust to alternative definitions of the two groups of regions (for instance, the inclusion of additional regions with similar unemployment rates in each group). Results are available from the authors upon request.
8
example, the two groups of regions differ in terms of family composition and size and,
interestingly, in their respective populations’ skills composition. In addition, the average
number of years of schooling in the LUR group is consistently one year greater than that in
the HUR group over the entire period. This difference reflects the gap between the two groups
of regions in terms of the share of their respective populations with post-compulsory
education (beyond “first secondary”), that is occupying an interval that is 12 to 15 percentage
points higher in the LUR regions.
Thus, it is essential to determine whether the spatial sorting that results in the endowment
disparities in the observed characteristics accounts for most of the observed gap in regional
unemployment rates. To obtain preliminary evidence of such concerns, we computed the
unemployment rate in each region within the categories of the observable characteristics. The
results are summarised in Table 4. Were the differences in the aggregate probability of
unemployment between regions to be explained by the different distribution of endowments,
we would observe far smaller differences in probability within each of the categories. The
figures in Table 4 suggest that this is not in fact the case as the probability of unemployment
is much higher in the HUR group than it is in the LUR group for all categories of the full set
of observed characteristics. The only exception to this general rule is the higher rate of
unemployment among immigrants in the LUR group in 1999, at a time when international
migration was still scarce in Spain.
Disparities between the two types of region in terms of their respective unemployment rates
within levels of schooling are of particular interest. Notice that the absolute magnitude of the
gap for some of the schooling categories is even wider than that for the entire population.
Thus, for instance, the unemployment rates in the HUR regions in 2009 for those with
primary and the first level of secondary education were 33.6% and 30.9% respectively, almost
doubling those in the LUR (17.2% and 17.0% respectively). Absolute and relative differences
were even more marked in previous years, before, that is, the impact of the worldwide
financial crisis was felt in Spain. In 2004, the probability of individuals with only primary
schooling being unemployed was almost 19% in the HUR group and only 5.2% in the LUR
group. Similar gaps can be observed in the case of secondary schooling and vocational
training (unemployment rates between 15% and 20% in the HUR regions and around 5% in
the LUR group). Finally, among those with a university degree, the probability of
unemployment was above 10% in the HUR regions vis-à-vis 5% in the LUR group.
9
Interestingly, our results suggest that the impact of the financial crisis has only led to a
closing of the gap in unemployment rates for individuals with the lowest skills (no schooling),
with almost no effect being recorded in the case of secondary and tertiary education.
In short, our preliminary findings suggest that differences in the impact of the observed
characteristics (i.e., in their return or behavioural responses) may play a role in explaining the
regional gap in unemployment rates. In the remaining sections we estimate these effects in
each group of regions and decompose the gap in unemployment rates in terms of the
contribution of differences in the endowment of characteristics and in terms of that of their
impact.
3. METHODOLOGY
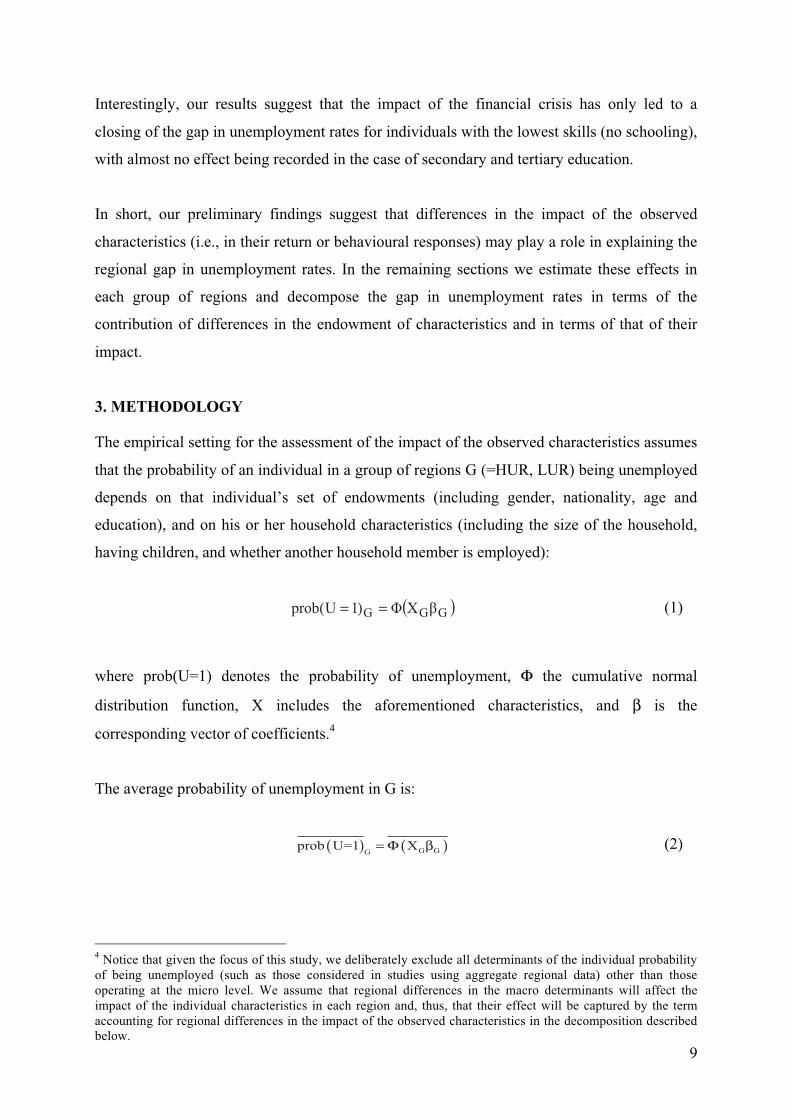
The empirical setting for the assessment of the impact of the observed characteristics assumes
that the probability of an individual in a group of regions G (=HUR, LUR) being unemployed
depends on that individual’s set of endowments (including gender, nationality, age and
education), and on his or her household characteristics (including the size of the household,
having children, and whether another household member is employed):
( )GGG βXΦ)1U(prob == (1)
where prob(U=1) denotes the probability of unemployment, Φ the cumulative normal
distribution function, X includes the aforementioned characteristics, and β is the
corresponding vector of coefficients.4
The average probability of unemployment in G is:
( ) ( )G GGprob U=1 X= Φ β (2)
4 Notice that given the focus of this study, we deliberately exclude all determinants of the individual probability of being unemployed (such as those considered in studies using aggregate regional data) other than those operating at the micro level. We assume that regional differences in the macro determinants will affect the impact of the individual characteristics in each region and, thus, that their effect will be captured by the term accounting for regional differences in the impact of the observed characteristics in the decomposition described below.
10
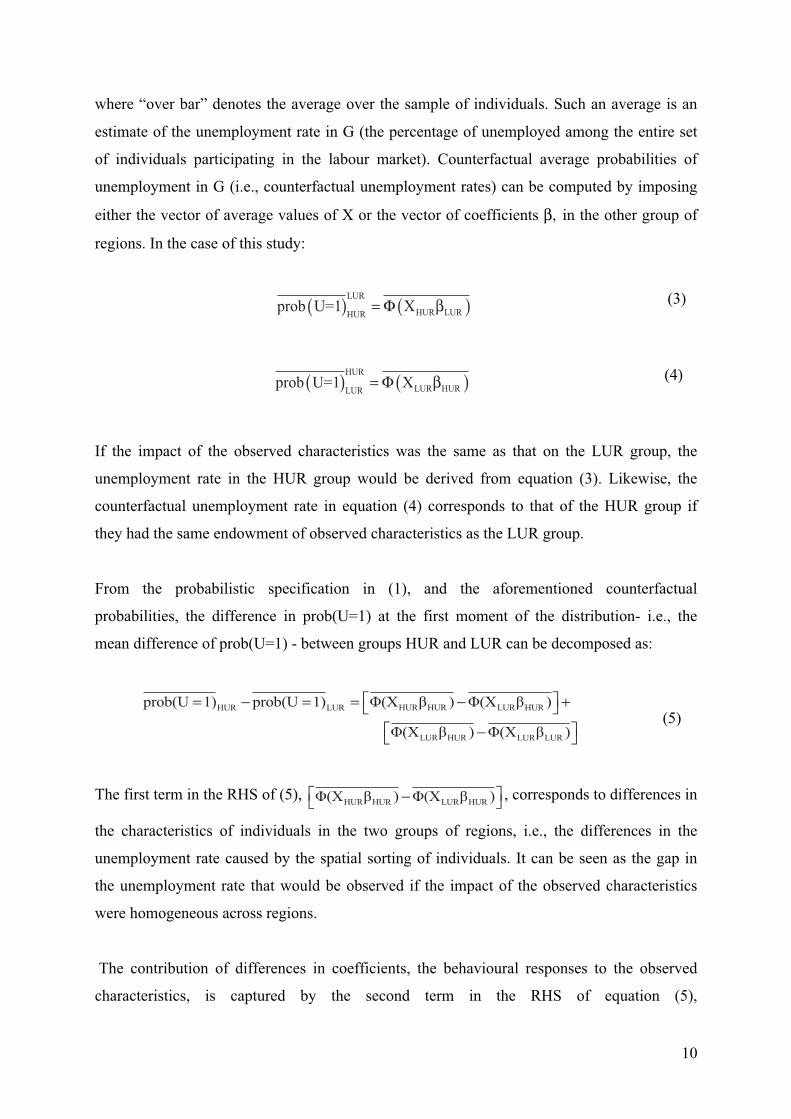
where “over bar” denotes the average over the sample of individuals. Such an average is an
estimate of the unemployment rate in G (the percentage of unemployed among the entire set
of individuals participating in the labour market). Counterfactual average probabilities of
unemployment in G (i.e., counterfactual unemployment rates) can be computed by imposing
either the vector of average values of X or the vector of coefficients β, in the other group of
regions. In the case of this study:
( ) ( )LUR
HUR LURHURprob U=1 X= Φ β (3)
( ) ( )HUR
LUR HURLURprob U=1 X= Φ β (4)
If the impact of the observed characteristics was the same as that on the LUR group, the
unemployment rate in the HUR group would be derived from equation (3). Likewise, the
counterfactual unemployment rate in equation (4) corresponds to that of the HUR group if
they had the same endowment of observed characteristics as the LUR group.
From the probabilistic specification in (1), and the aforementioned counterfactual
probabilities, the difference in prob(U=1) at the first moment of the distribution- i.e., the
mean difference of prob(U=1) - between groups HUR and LUR can be decomposed as:
HUR HUR LUR HURHUR LUR
LUR HUR LUR LUR
prob(U 1) prob(U 1) Φ(X β ) Φ(X β )
Φ(X β ) Φ(X β )
⎡ ⎤= − = = − +⎣ ⎦⎡ ⎤−⎣ ⎦
(5)
The first term in the RHS of (5), HUR HUR LUR HURΦ(X β ) Φ(X β )⎡ ⎤−⎣ ⎦ , corresponds to differences in
the characteristics of individuals in the two groups of regions, i.e., the differences in the
unemployment rate caused by the spatial sorting of individuals. It can be seen as the gap in
the unemployment rate that would be observed if the impact of the observed characteristics
were homogeneous across regions.
The contribution of differences in coefficients, the behavioural responses to the observed
characteristics, is captured by the second term in the RHS of equation (5),
11
LUR HUR LUR LURΦ(X β ) Φ(X β )⎡ ⎤−⎣ ⎦ . This can be seen as the gap in the unemployment rate that
would be observed in the absence of spatial sorting, i.e., if the regions had not differed in their
endowment of individual and household characteristics.
Both terms in the RHS of equation (5) can be either positive or negative. A positive
contribution will be obtained when regional differences in the endowment, or in the impact,
of the characteristics widen the gap in unemployment rates. That is, when it causes higher
unemployment in the HUR group. By contrast, a negative contribution indicates that the
difference in the endowment, or in the impact, favours the group of HUR regions, i.e., results
in a lower unemployment rate in these regions than in their LUR counterparts.
Thus, the overall decomposition in (5) presents the same form as that of the traditional
Blinder (1973) and Oaxaca (1973) decomposition. But the non-linearity in Φ(.) prevents us
from computing the particular contribution of each of the characteristics following the
traditional decomposition. This is a major drawback if, as in this study, we are concerned with
assessing the particular contribution of a characteristic or set of characteristics. In our case,
we are particularly interested in, on the one hand, disentangling the contribution of the
individual and the household characteristics and, on the other, in assessing the role of regional
differences in education (both in its endowment and its impact). For this reason we adopt the
approach suggested by Yun (2004) for obtaining a detailed decomposition of the gap in the
probability between the two groups of regions. In the case of our probabilistic specification,
the detailed decomposition can be obtained from:
k
iΔX HUR HUR LUR HURHUR LUR
i 1k
iΔβ LUR HUR LUR LUR
i 1
prob(U 1) prob(U 1) W Φ(X β ) Φ(X β )
W Φ(X β ) Φ(X β )
=
=
⎡ ⎤= − = = − +⎣ ⎦
⎡ ⎤−⎣ ⎦
∑
∑ (6)
where:
( )( )
( )( )
i i ii i iHUR LUR HUR LUR HUR LURi iΔX Δβ
LURHUR LUR HUR LURHUR
k ki iΔX Δβ
i 1 i 1
X X β X β βW , W
X β βX X β
W W 1= =
− −= =
−−
= =∑ ∑
12
Therefore, iΔXW and i
ΔβW enable us to weight properly the contribution of each variable to the
effects of the characteristics and of the coefficients. They can be computed by using the
sample average of the characteristic of the LUR and HUR groups of regions, and the estimate
of β for the two groups from the probit model in (1).
The contribution of the endowment of a characteristic, or of that of its impact, can be either
positive or negative. The interpretation is similar to that discussed above in the case of the
global decomposition, but now attributable just to the specific characteristic under analysis.
4. RESULTS
4.1. Regional differences in the impact of individual and household characteristics
The first step in our assessment of the role played by differences in endowment and in the
impact (or behavioural response) is to estimate the effect of the observed characteristics on
the probability of unemployment in each group of regions. The estimate of the coefficients β
in the probit models for the HUR and the LUR groups is used to compute the decomposition
in (5) and (6). However, before discussing the results of the decomposition, we show that the
estimated effects of the observed characteristics differ markedly between the two groups of
regions for all the years under analysis.
We base our comparison of the impact of the characteristics on their corresponding marginal
effects (in line with the usual method for interpreting the magnitude of the effects in
probabilistic models). Marginal effects are computed based on an estimation of the
coefficients in the probabilistic model in (1).5 The variables included in this model are those
of individual characteristics: gender, nationality, age, number of years of schooling as the
proxy for education,6 marital status; and those accounting for the characteristics of the
household: number of members, dummy for the head of the household, number of children,
dummy for children under 9, and dummy for another employee.
Table 5 shows the estimated marginal effects (valued in the sample average for each group of
regions) from the estimates of the probit model in the three years under analysis. It can be 5 Note that the decompositions in (5) and (6) can be re-written as a function of marginal effects and sample averages of the observed characteristics. This is an additional reason for showing and discussing here the estimate of the marginal effects as opposed to the estimated coefficients in the probit models. However, the estimates of the coefficients of the probit models are available from the authors upon request. 6 Results obtained when using a set of dummies accounting for different levels of educational attainment are discussed in Section 5.
13
observed that most of the marginal effects for the categories of the individual characteristics
are statistically significant and display the expected sign. Being male reduces the probability
of unemployment in both types of region, although the effect decreases substantially over the
period. Yet, the impact of gender is not homogeneous as this fall in probability for males with
respect to females is much higher in the HUR group of regions. Holding Spanish nationality
also reduces the probability of being unemployed in both types of region, with a more marked
effect at the beginning and the end of the period. Here, also, the impact of nationality differs
considerably in the two groups of region: after controlling for a broad set of individual and
household characteristics, native workers present a much lower probability of being
unemployed than immigrants in the LUR regions. Interestingly, estimates for 1999 and 2004
suggest that during the last economic boom nationality per se did not exert any influence in
the high unemployment regions, which would, in part, account for the foreign immigration
observed to those regions during that period. However, the financial crisis changed this
situation, so that even in the HUR regions immigrants faced greater probabilities of
unemployment than natives (although the marginal effect associated with Spanish nationality
was still higher in the LUR group in 2009).
Our results in Table 5 also confirm that age is inversely related to the probability of
unemployment. They also indicate that most of its effect appears to be concentrated in the
lowest categories (youth unemployment). In other words, there would seem to be a marked
distinction in the probability of unemployment between the youngest groups (under 30 years
old), on the one hand, and the mature active population, on the other. In this case also the
magnitude of the effect of age evolves over time with that of the unemployment rate (falling
from 1999 to 2004 before rising again in 2009). Additionally, it differs markedly between the
two types of region, with the effects for most of the categories in the HUR group doubling
those in the LUR regions.
Regional differences in the behavioural response associated with an individual’s education
are, as mentioned above, of particular interest in the present analysis. As expected, schooling
reduces the probability of unemployment. Each additional year of education reduces the
probability of unemployment in the HUR regions by around 1.5 percentage points in 1999
and in 2004, and by 2.4 points in 2009. This means that, on average in these regions, ten years
of schooling (approximately primary vs. tertiary education) represents a decrease in the
probability of unemployment of between 15 and 24 percentage points, according to the year
14
under consideration. This result has major implications for the HUR regions as it suggests that
increasing the educational attainment of their (active) population would reduce the number of
people affected by episodes of unemployment (and probably their duration), and thus
contribute to a decrease in their unemployment rates.7 But, based on the estimated marginal
effect of schooling, it can also be inferred that, during the period under analysis, individuals
with low educational attainment in the HUR regions faced very high net unemployment rates.
The effect of schooling is also negative in the LUR group, though much more moderate in its
magnitude. In fact, in these regions it is only statistically significant at the 1% level in 2009,
with a magnitude that is less than half that presented by the HUR group. Thus, it would seem
that particularly in periods of economic boom with low rates of unemployment, schooling in
itself (i.e., after controlling for all other individual and household characteristics) has a
negligible effect on the probability of being unemployed in the LUR regions. In sum, these
results confirm that the two groups of regions not only differ in their educational endowment,
but that they also differ markedly in terms of the impact that schooling has on the probability
of being unemployed in the respective regions.
Our results regarding marital status, the last of the individual characteristics to be considered,
indicate that being single increases the probability of being unemployed with respect to the
other statuses in all years. In 2009, positive and significant (at the 5% level) coefficients are
also found for being a widow and being divorced. However, overall, there does not seem to be
a substantial difference across the two groups of regions in the marginal effect of this
characteristic.
The final group of rows in Table 5 corresponds to our estimates of the marginal effects of
household characteristics. In general, there is greater heterogeneity in the significance and
magnitude of these estimated effects, as they differ sharply from one year to another and
between the two groups of regions. However, their impact seems to be greatest in the HUR
group. For instance, household size, proxied by both the number of members and the number
of children, had a significant effect only in the HUR regions (though the impact was not
7 It might be argued that educational attainment also increases participation in the labour market and, hence, the denominator of the unemployment rate. However, our evidence points to a positive effect of schooling on the employment rate, which means that the increase achieved in participation is mostly absorbed by employment and that the net impact of education on the unemployment rate is negative (see for instance OECD, 2011, Indicator A7).
15
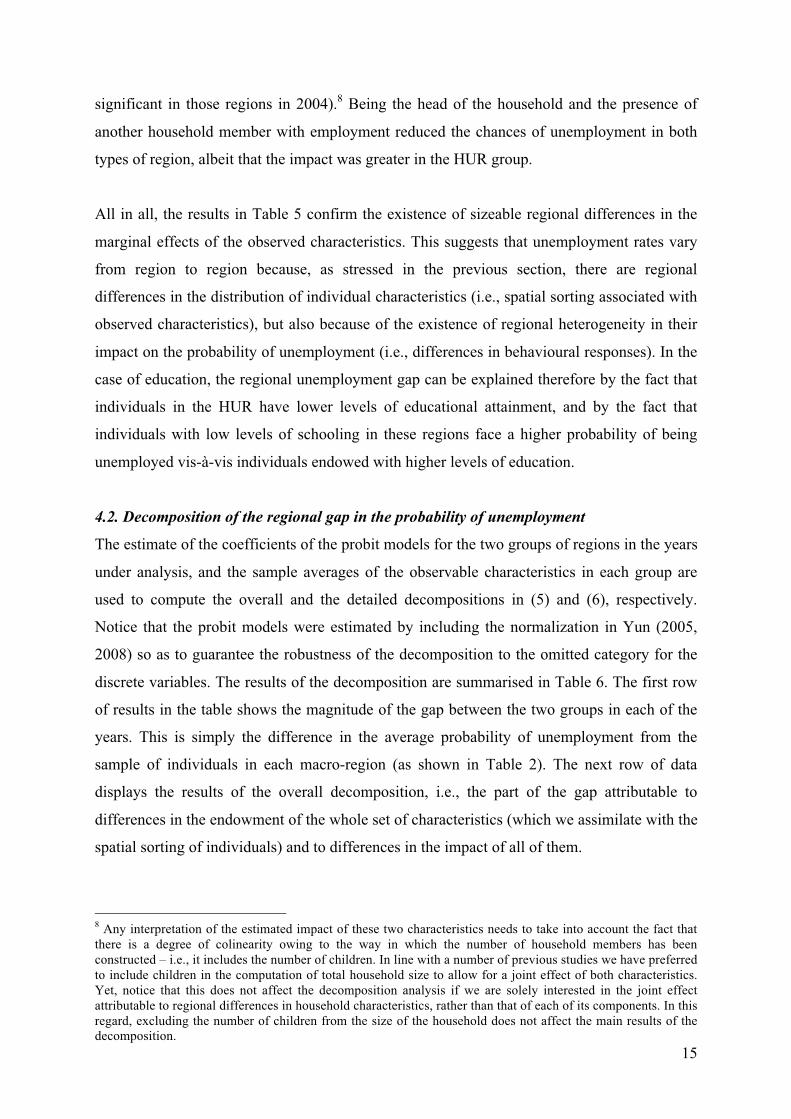
significant in those regions in 2004).8 Being the head of the household and the presence of
another household member with employment reduced the chances of unemployment in both
types of region, albeit that the impact was greater in the HUR group.
All in all, the results in Table 5 confirm the existence of sizeable regional differences in the
marginal effects of the observed characteristics. This suggests that unemployment rates vary
from region to region because, as stressed in the previous section, there are regional
differences in the distribution of individual characteristics (i.e., spatial sorting associated with
observed characteristics), but also because of the existence of regional heterogeneity in their
impact on the probability of unemployment (i.e., differences in behavioural responses). In the
case of education, the regional unemployment gap can be explained therefore by the fact that
individuals in the HUR have lower levels of educational attainment, and by the fact that
individuals with low levels of schooling in these regions face a higher probability of being
unemployed vis-à-vis individuals endowed with higher levels of education.
4.2. Decomposition of the regional gap in the probability of unemployment
The estimate of the coefficients of the probit models for the two groups of regions in the years
under analysis, and the sample averages of the observable characteristics in each group are
used to compute the overall and the detailed decompositions in (5) and (6), respectively.
Notice that the probit models were estimated by including the normalization in Yun (2005,
2008) so as to guarantee the robustness of the decomposition to the omitted category for the
discrete variables. The results of the decomposition are summarised in Table 6. The first row
of results in the table shows the magnitude of the gap between the two groups in each of the
years. This is simply the difference in the average probability of unemployment from the
sample of individuals in each macro-region (as shown in Table 2). The next row of data
displays the results of the overall decomposition, i.e., the part of the gap attributable to
differences in the endowment of the whole set of characteristics (which we assimilate with the
spatial sorting of individuals) and to differences in the impact of all of them.
8 Any interpretation of the estimated impact of these two characteristics needs to take into account the fact that there is a degree of colinearity owing to the way in which the number of household members has been constructed – i.e., it includes the number of children. In line with a number of previous studies we have preferred to include children in the computation of total household size to allow for a joint effect of both characteristics. Yet, notice that this does not affect the decomposition analysis if we are solely interested in the joint effect attributable to regional differences in household characteristics, rather than that of each of its components. In this regard, excluding the number of children from the size of the household does not affect the main results of the decomposition.
16
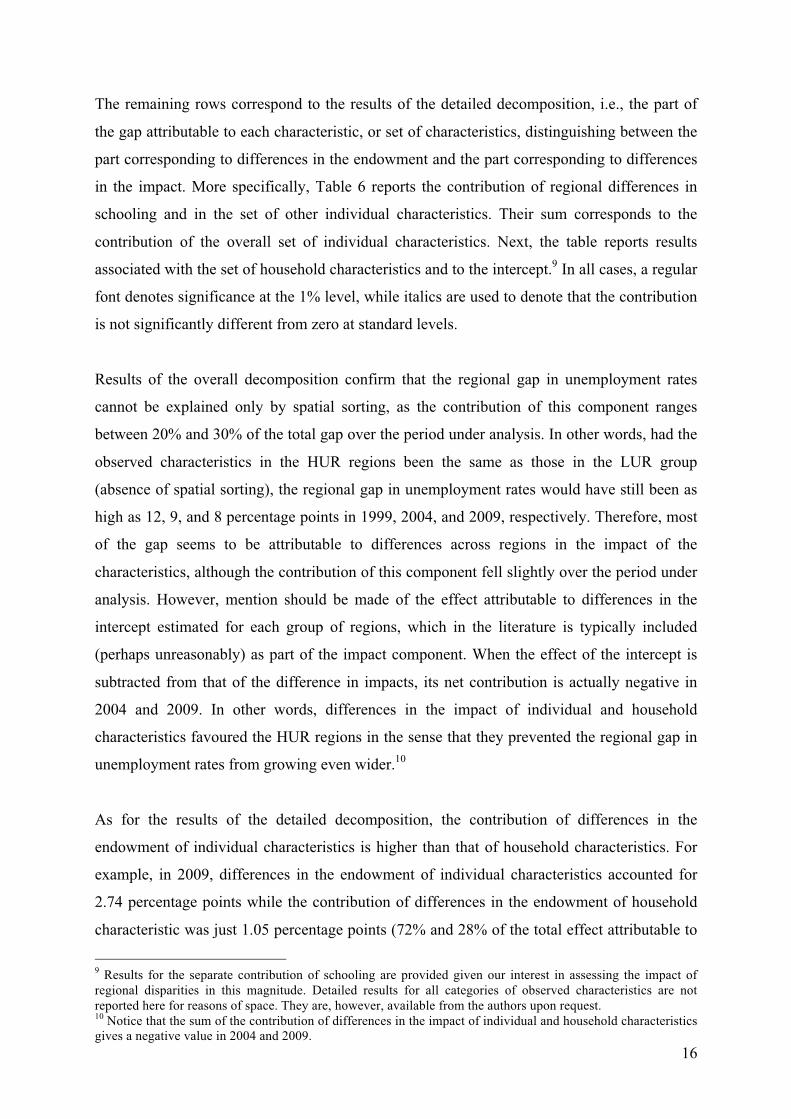
The remaining rows correspond to the results of the detailed decomposition, i.e., the part of
the gap attributable to each characteristic, or set of characteristics, distinguishing between the
part corresponding to differences in the endowment and the part corresponding to differences
in the impact. More specifically, Table 6 reports the contribution of regional differences in
schooling and in the set of other individual characteristics. Their sum corresponds to the
contribution of the overall set of individual characteristics. Next, the table reports results
associated with the set of household characteristics and to the intercept.9 In all cases, a regular
font denotes significance at the 1% level, while italics are used to denote that the contribution
is not significantly different from zero at standard levels.
Results of the overall decomposition confirm that the regional gap in unemployment rates
cannot be explained only by spatial sorting, as the contribution of this component ranges
between 20% and 30% of the total gap over the period under analysis. In other words, had the
observed characteristics in the HUR regions been the same as those in the LUR group
(absence of spatial sorting), the regional gap in unemployment rates would have still been as
high as 12, 9, and 8 percentage points in 1999, 2004, and 2009, respectively. Therefore, most
of the gap seems to be attributable to differences across regions in the impact of the
characteristics, although the contribution of this component fell slightly over the period under
analysis. However, mention should be made of the effect attributable to differences in the
intercept estimated for each group of regions, which in the literature is typically included
(perhaps unreasonably) as part of the impact component. When the effect of the intercept is
subtracted from that of the difference in impacts, its net contribution is actually negative in
2004 and 2009. In other words, differences in the impact of individual and household
characteristics favoured the HUR regions in the sense that they prevented the regional gap in
unemployment rates from growing even wider.10
As for the results of the detailed decomposition, the contribution of differences in the
endowment of individual characteristics is higher than that of household characteristics. For
example, in 2009, differences in the endowment of individual characteristics accounted for
2.74 percentage points while the contribution of differences in the endowment of household
characteristic was just 1.05 percentage points (72% and 28% of the total effect attributable to
9 Results for the separate contribution of schooling are provided given our interest in assessing the impact of regional disparities in this magnitude. Detailed results for all categories of observed characteristics are not reported here for reasons of space. They are, however, available from the authors upon request. 10 Notice that the sum of the contribution of differences in the impact of individual and household characteristics gives a negative value in 2004 and 2009.
17
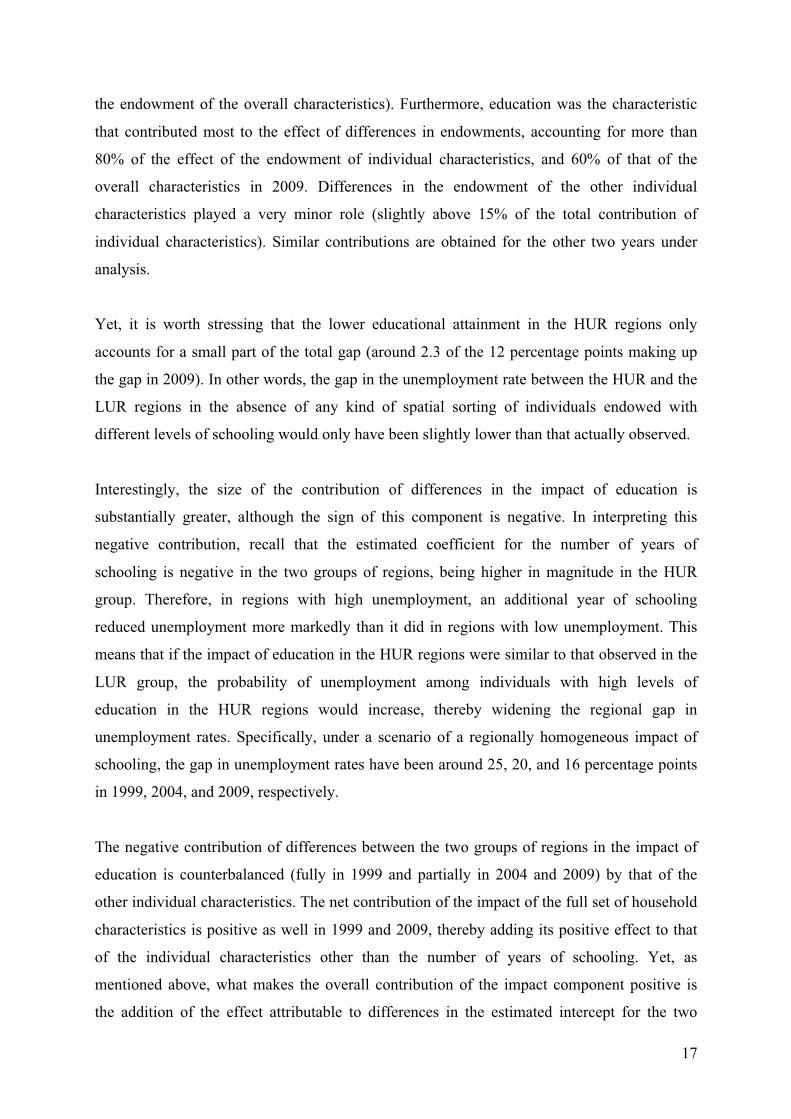
the endowment of the overall characteristics). Furthermore, education was the characteristic
that contributed most to the effect of differences in endowments, accounting for more than
80% of the effect of the endowment of individual characteristics, and 60% of that of the
overall characteristics in 2009. Differences in the endowment of the other individual
characteristics played a very minor role (slightly above 15% of the total contribution of
individual characteristics). Similar contributions are obtained for the other two years under
analysis.
Yet, it is worth stressing that the lower educational attainment in the HUR regions only
accounts for a small part of the total gap (around 2.3 of the 12 percentage points making up
the gap in 2009). In other words, the gap in the unemployment rate between the HUR and the
LUR regions in the absence of any kind of spatial sorting of individuals endowed with
different levels of schooling would only have been slightly lower than that actually observed.
Interestingly, the size of the contribution of differences in the impact of education is
substantially greater, although the sign of this component is negative. In interpreting this
negative contribution, recall that the estimated coefficient for the number of years of
schooling is negative in the two groups of regions, being higher in magnitude in the HUR
group. Therefore, in regions with high unemployment, an additional year of schooling
reduced unemployment more markedly than it did in regions with low unemployment. This
means that if the impact of education in the HUR regions were similar to that observed in the
LUR group, the probability of unemployment among individuals with high levels of
education in the HUR regions would increase, thereby widening the regional gap in
unemployment rates. Specifically, under a scenario of a regionally homogeneous impact of
schooling, the gap in unemployment rates have been around 25, 20, and 16 percentage points
in 1999, 2004, and 2009, respectively.
The negative contribution of differences between the two groups of regions in the impact of
education is counterbalanced (fully in 1999 and partially in 2004 and 2009) by that of the
other individual characteristics. The net contribution of the impact of the full set of household
characteristics is positive as well in 1999 and 2009, thereby adding its positive effect to that
of the individual characteristics other than the number of years of schooling. Yet, as
mentioned above, what makes the overall contribution of the impact component positive is
the addition of the effect attributable to differences in the estimated intercept for the two
18
groups of regions. As the constant term incorporates the effect of factors that do not vary
across individuals within each group of regions, it seems that its contribution to the
unemployment rate gap can be explained in terms of differences in the macroeconomic or
aggregate features within each region. This in turn points to the need to combine the results
obtained from using both micro- (as in this study) and macro-data.
In short, the results of the decomposition confirm the role played by regional differences in
the impact of the observable characteristics. Its contribution is even more intense than that
attributable to differences in endowments. Our results also support the hypothesis that
regional differences in an individual’s education are an essential element in accounting for
regional disparities in unemployment rates. In addition, it would also seem that its effect is far
from straightforward since as well as the effect associated with regional differences in
endowments, there is a sophisticated contribution linked to regional heterogeneity in its
impact on the probability of unemployment.
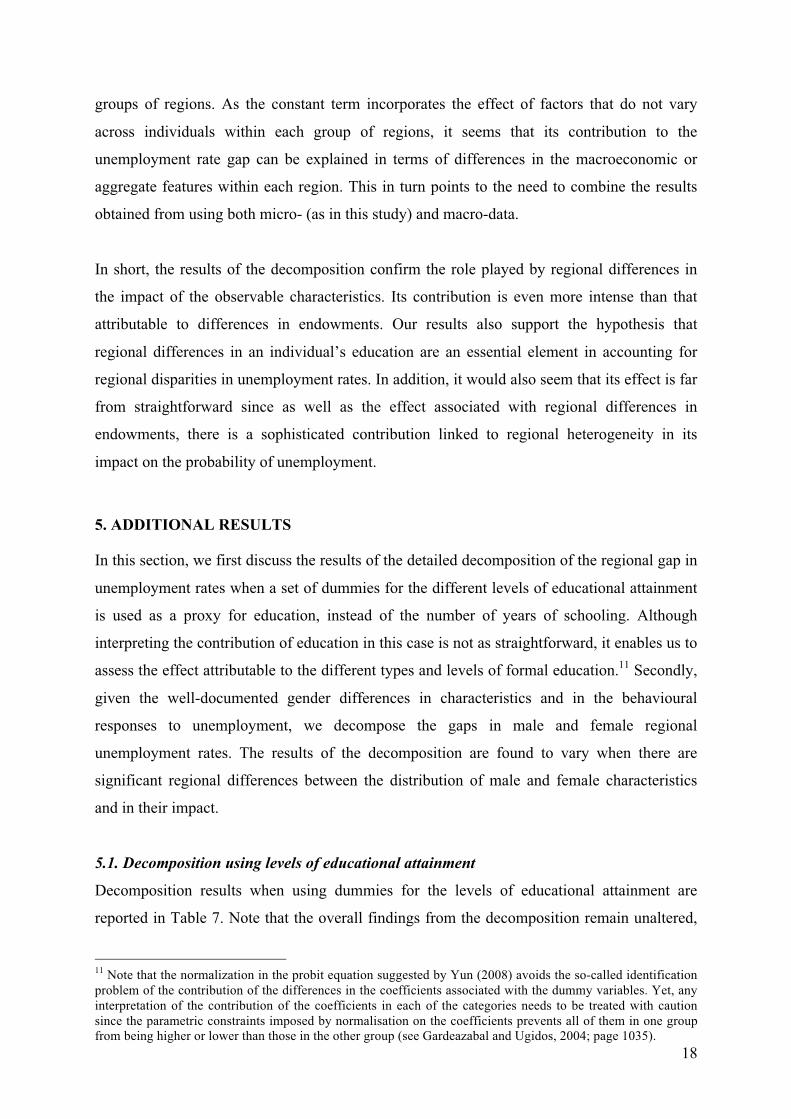
5. ADDITIONAL RESULTS
In this section, we first discuss the results of the detailed decomposition of the regional gap in
unemployment rates when a set of dummies for the different levels of educational attainment
is used as a proxy for education, instead of the number of years of schooling. Although
interpreting the contribution of education in this case is not as straightforward, it enables us to
assess the effect attributable to the different types and levels of formal education.11 Secondly,
given the well-documented gender differences in characteristics and in the behavioural
responses to unemployment, we decompose the gaps in male and female regional
unemployment rates. The results of the decomposition are found to vary when there are
significant regional differences between the distribution of male and female characteristics
and in their impact.
5.1. Decomposition using levels of educational attainment
Decomposition results when using dummies for the levels of educational attainment are
reported in Table 7. Note that the overall findings from the decomposition remain unaltered,
11 Note that the normalization in the probit equation suggested by Yun (2008) avoids the so-called identification problem of the contribution of the differences in the coefficients associated with the dummy variables. Yet, any interpretation of the contribution of the coefficients in each of the categories needs to be treated with caution since the parametric constraints imposed by normalisation on the coefficients prevents all of them in one group from being higher or lower than those in the other group (see Gardeazabal and Ugidos, 2004; page 1035).
19
as the contribution of endowments and impacts, and the detailed contribution of the individual
and household characteristics, are similar to those discussed in the previous section when
using the number of years of schooling as the proxy for education. However, there is a
marked distinction in the effect attributable to the overall difference in the impact of
education. As indicated in the previous section, the higher negative impact of education in the
probit model for the HUR group means this effect is negative when we use the years of
schooling as the proxy for education. Here, however, the aggregate effect attributable to
differences in impacts associated with the dummies for levels of educational attainment is
positive in 1999 and in 2009. Indeed, the effect is only negative in 2004 and then at a much
lower magnitude than that obtained when using the number of years of schooling.
A detailed analysis of the contribution of each of the categories of education reveals that the
positive effect is associated with the lowest levels of education, while a negative effect is
observed in association with both high school and tertiary education. Thus, it would appear
that the highest levels of education had a favourable impact on the HUR group, reducing the
gap in the rate of unemployment. Yet, the contribution of these levels of education was
counterbalanced by that of primary and lower secondary education and vocational training.
The impact of these levels of schooling on the probability of unemployment in the HUR
group was negative but of a lower magnitude than that observed in the LUR group. As a
result, they served to increase the regional gap in the unemployment rate.
Thus, it is the greater response recorded by the probability of unemployment to the higher
levels of education in the HUR regions that account for the negative contribution of education
reported in the previous section. In fact, the reduction in the contribution of this component in
2009 can also be attributed to the reduction in the effect of these categories of education.
Finally, one side-effect of this analysis that specifically considers levels of educational
attainment is the declining role assigned to the difference in the intercepts of the two groups
of regions. Our results suggest that the negative effect assigned to the impact of education in
the previous section was offset by an increase in the positive effect corresponding to the
intercept (perhaps as a reaction to the homogenous effect that was imposed on the number of
years of schooling regardless of the level of education).
20
5.2. Decomposition by gender
The results of the decomposition by gender are summarised in Tables 8 and 9 for males and
females, respectively. Here, the tables include an additional top row showing the
unemployment rate in the HUR and in the LUR groups of regions for the three years under
analysis. These figures show i) a higher female unemployment rate regardless of region, ii)
that a regional gap exists for both males and females, although it is wider in absolute terms in
the latter case (and wider also in relative terms in 2004 and 2009), and iii) a somewhat
different evolution over time in the respective gaps by gender, increasing in the case of males
following the impact of the financial crisis (2009), while it continued to decrease in the case
of females over the entire period under analysis. These disparities in the size of the gap and in
its evolution, together with gender differences in behavioural responses,12 point to the need
for a separate analysis of the gap decomposition, which is what we discuss in this
subsection.13
Our results from the decomposition of the regional gap by gender reveal a general picture that
is quite similar to the one obtained above for the entire population. The overall contribution of
endowments and of impacts is qualitatively analogous to that reported previously when not
accounting for gender differences: the part attributable to regional heterogeneity in the impact
of the observed characteristics is greater than that attributable to endowments for both males
and females. It should be stressed, however, that the contribution of endowments in the case
of males is slightly less than that for females, and thus for the entire population. In fact, in
absolute terms, the contribution of endowments accounts for a sizeable part of the gender
difference in the regional gap. For instance, in the first year under analysis, the gap observed
for males was 14.31 percentage points while that corresponding to females was 20.82. If we
eliminate the contribution of regional differences in endowments then we obtain a gap of
11.87 percentage points for males and 14.05 for females, and thus a narrower gap between the
genders. The same effect is recorded in the other two years under analysis.
The detailed decomposition shows that the lower absolute contribution of endowments in the
case of males is attributable to the smaller effect of their individual and household
characteristics. In other words, regional disparities in the endowment of individual and
12 The full set of estimates of behavioural responses (marginal effects from the probit models) for males and females are not included here for reasons of space, but are available from the authors upon request. 13 An example of separate estimates of responses involving labour market magnitudes by gender can be found in Elhorst and Zeilstra (2007).
21
household characteristics exert a stronger effect for females than it does for males.
Interestingly, this is particularly evident in the case of education, as the contribution of
differences across regions in the number of years of schooling for females is twice that for
males in absolute terms. As for the effects associated with impacts, a number of differences
are recorded between females and males which, moreover, vary depending on the
characteristic and over the years. For instance, in 1999 the contribution of the impact of
individual characteristics other than education is as high as 16.82 percentage points for
females and just 2.38 percentage points for males. But in 2004 and in 2009 the contribution of
this component is largely similar for both genders. As for the effect of the response to
education, we find that it is somewhat more marked (larger in absolute terms) for females in
1999 and in 2004, and for males in 2009. Finally, the magnitude of the effect attributable to
regional differences in the estimate of the intercept for both genders and the difference
between females and males as regards that component confirm the need to combine the
evidence obtained from studies that use micro-data and those that adopt an aggregate
approach.
6. CONCLUDING COMMENTS
In this paper we have shown that by using micro-data we can provide additional insights into
the understanding of regional disparities in unemployment to those previously obtained from
studies based on aggregate regional data. A micro-data approach allows us to implement a
more detailed control over regional differences in the distribution of individual and household
characteristics, without their having the same impact across regions. Furthermore, the
decomposition of the regional gap in unemployment rates enables us to assess regional
differences in terms of both the endowment of the observed characteristics and their impact.
This has proved particularly useful when analyzing the impact of education on regional
unemployment disparities.
Results for Spain confirm that regional disparities in unemployment rates are large and
persistent. They also indicate that differences across regions in terms of their respective
endowments of individual and household (observed) characteristics only account in part for
the gap between the regions with the highest and lowest rates. In fact, the regional
heterogeneity in their impact on the probability of unemployment accounts for as much as the
spatial sorting associated with the observable characteristics. Among the characteristics
considered in this analysis, our results confirm the importance of differences across regions in
22
education, both in terms of endowment and its impact. Indeed, the homogenisation of levels
of education and of its impact would have an effect on the gap in the regional unemployment
rate which, nonetheless, is more complex than was expected a priori. Thus, while it seems that
the homogenisation of the endowment of education across regions reduces disparities in
unemployment rates, the equalization of the behavioural response associated with education is
likely to increase the gap. The reason for what is, a priori, a counterintuitive result seems to be
related to the greater reduction in the chances of unemployment for those with the highest
levels of education in the regions experiencing the highest unemployment rates. Therefore, a
reduction in the magnitude of this effect to a similar level to that found in regions with the
lowest rates of unemployment will tend to increase unemployment rates in the first group of
regions.
In addition to the effect attributable to differences in the impact of the observed
characteristics, the sizeable contribution assigned to the intercept of the probabilistic model
suggests that analyses exploiting micro-data should be combined with studies using aggregate
data (for instance, see the results on the role played by capital accumulation for the Spanish
regions in Bande and Karanassou, 2009). Therefore, it is our belief that neither the earlier
aggregate studies nor studies based solely on micro-data provide a complete explanation of
the reasons underpinning regional disparities in unemployment rates. To obtain a better
understanding as to why unemployment rates are much higher in some regions than in others,
the findings and conclusions from both approaches should be jointly considered. An
integrated analysis for a larger sample of regions is, therefore, on our future research agenda.
23
REFERENCES
Bande R., Fernández M., and Montuenga V. (2008) Regional unemployment in Spain:
Disparities, business cycle and wage setting, Labour Economics 15: 885-914
Bande R. and Karanassou M. (2009) Labour market flexibility and regional unemployment
rate dynamics: Spain 1980–1995, Papers in Regional Science 88: 181-207
Blanchard O.J. and Katz L.F. (1992) Regional evolutions, Brookings Papers on Economic
Activity. Economic Studies Program. The Brookings Institution, 23: 1-76
Blinder A.S. (1973) Wage discrimination: Reduced form and structural estimates, Journal of
Human Resources 8: 436–455
Cracolici M.F., Cuffaro M., and Nijkamp P. (2007) Geographical distribution of
unemployment. An analysis of provincial differences in Italy, Growth and Change 38:
649-670
Decressin J. and Fatás A. (1995) Regional labor market dynamics in Europe, European
Economic Review 39: 1627-1655
Elhorst J.P. (1995) Unemployment disparities between regions in the European Union. In
Convergence and divergence among European Regions edited by H.W. Armstrong and
R.W. Vickerman. London: Pion
Elhorst J.P. (2003) The mystery of regional unemployment differentials: Theoretical and
empirical explanations, Journal of Economic Surveys 17: 709–748
Elhorst J.P. and Zeilstra A.S. (2007) Labour force participation rates at the regional and
national levels of the European Union: An integrated analysis, Papers in Regional Science
86: 525-549
Evans P. and McCormick B. (1994) The new pattern of regional unemployment: causes and
policy significance, Economic Journal 104: 633–647
Filiztekin A. (2009) Regional unemployment in Turkey, Papers in Regional Science 88: 863-
878
García I. and Molina A. (2002) Inter-regional wage differentials in Spain, Applied Economics
Letters 9: 209-215
Gardeazabal J. and Ugidos A. (2004): More on identification in detailed wage
decompositions, The Review of Economics and Statistics 86: 1034-1036
Hall R.E. (1972) Turnover in the labor force, Brookings Papers on Economic Activity 3: 709–
764
Lazar F. (1997) Regional unemployment rate disparities in Canada: some possible
explanations, Canadian Journal of Economics 10: 112–129
24
López-Bazo E., del Barrio T., and Artís M. (2002) The regional distribution of Spanish
unemployment: A spatial analysis, Papers in Regional Science 81: 365-389
López-Bazo E., del Barrio T., and Artís M. (2005) Geographical distribution of
unemployment in Spain, Regional Studies 39: 305-318
López-Bazo E. and Motellón E. (2011) Human capital and regional wage gaps, Regional
Studies, iFirst. DOI: 10.1080/00343404.2011.579092.
Marston S.T. (1985) Two views of the geographic distribution of unemployment, Quarterly
Journal of Economics 100: 57-79
Martin R. (1997) Regional unemployment disparities and their dynamics, Regional Studies
31: 237-252
Martin R. and Sunley P. (1999) Unemployment flow regimes and regional unemployment
disparities, Environmental and Planning A 31: 523–550
Mincer J. (1991) Education and unemployment, NBER Working Paper No. W3838
Motellón E. (2008) Un análisis de las diferencias regionales en el impacto de la contratación
temporal en España, Investigaciones Regionales 12: 107-131
Motellón E., López-Bazo E., and El-Attar M. (2011) Regional heterogeneity in wage
distributions: Evidence from Spain, Journal of Regional Science 51: 558–584
Oaxaca R.L. (1973) Male-female wage differentials in urban labor markets, International
Economic Review 14: 693–709
OECD (1989) Regional unemployment in OECD countries, Employment Outlook. Paris
OECD (1990) Supply and demand in regional labour markets: population growth, migration,
participation, and earnings differentials, Employment Outlook. Paris
OECD (2000) Disparities in regional labour markets, Employment Outlook. Paris
OECD (2005) How persistent are regional disparities in employment? The role of geographic
mobility, Employment Outlook. Paris
OECD (2011) Education at a glance 2011: OECD indicators, Paris.
Overman H.G. and Puga D. (2002) Unemployment clusters across Europe’s regions and
countries, Economic Policy 34: 115-147
Partridge M.D. (2001) Exploring the Canadian-U.S. unemployment and nonemployment rate
gaps: Are there lessons for both countries?, Journal of Regional Science 41: 701-734
Partridge M.D. and Rickman D.S. (1997) The dispersion in US unemployment rates: The role
of market and nonmarket equilibrium factors, Regional Studies 31: 593–606
Patacchini E. and Zenou Y. (2007) Spatial dependence in local unemployment rates, Journal
of Economic Geography 7: 169-191
25
Pereira J. and Galego A. (2011) Regional wage differentials in Portugal: Static and dynamic
approaches, Papers in Regional Science 90: 529–548
Rosen S. (1974) Hedonic prices and implicit prices, Journal of Political Economy 86: 34–53
Taylor J. and Bradley S. (1997) Unemployment in Europe: A comparative analysis of
regional disparities in Germany, Italy and the UK, Kyklos 50: 221–245
Yun M. (2004) Decomposing differences in the first moment, Economics Letters 82: 275-280
Yun M. (2005) A simple solution to the identification problem in detailed wage
decompositions, Economic Inquiry 43: 766-772
Yun M. (2008) Identification problem and detailed Oaxaca decomposition: A general solution
and inference, Journal of Economic and Social Measurement 33: 27-38
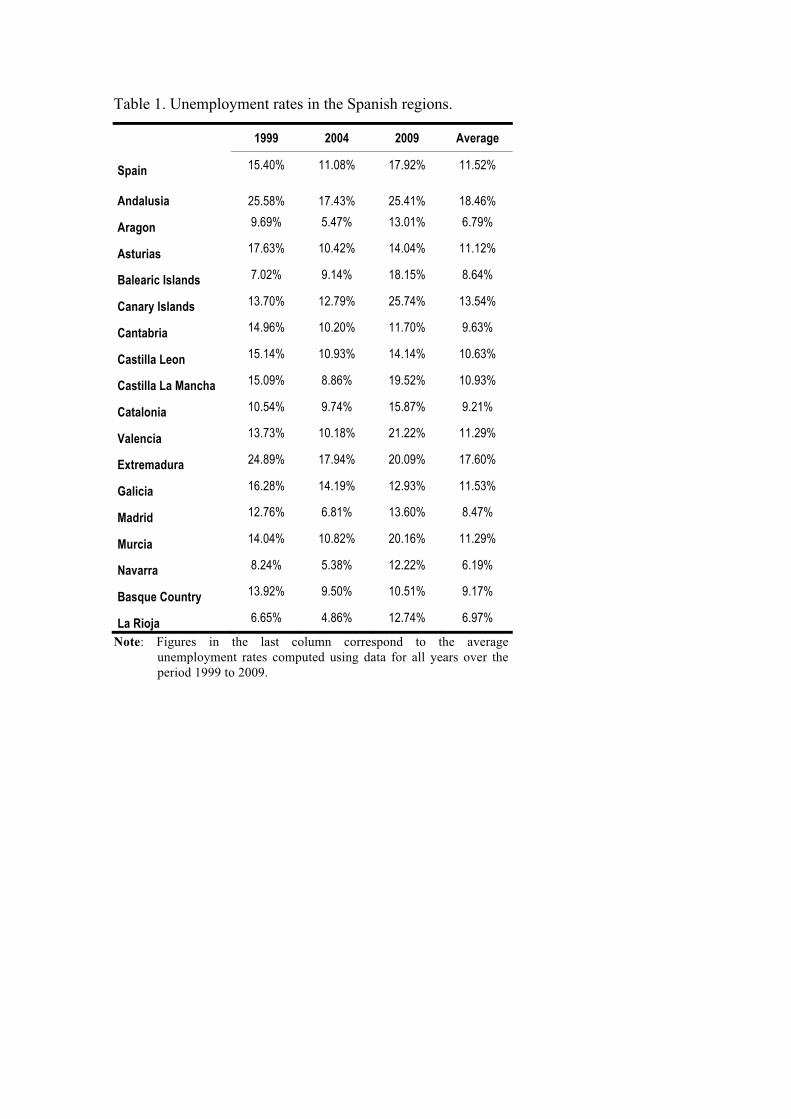
Table 1. Unemployment rates in the Spanish regions.
1999 2004 2009 Average
Spain 15.40% 11.08% 17.92% 11.52%
Andalusia
25.58%
17.43%
25.41%
18.46%
Aragon 9.69% 5.47% 13.01% 6.79%
Asturias 17.63% 10.42% 14.04% 11.12%
Balearic Islands 7.02% 9.14% 18.15% 8.64%
Canary Islands 13.70% 12.79% 25.74% 13.54%
Cantabria 14.96% 10.20% 11.70% 9.63%
Castilla Leon 15.14% 10.93% 14.14% 10.63%
Castilla La Mancha 15.09% 8.86% 19.52% 10.93%
Catalonia 10.54% 9.74% 15.87% 9.21%
Valencia 13.73% 10.18% 21.22% 11.29%
Extremadura 24.89% 17.94% 20.09% 17.60%
Galicia 16.28% 14.19% 12.93% 11.53%
Madrid 12.76% 6.81% 13.60% 8.47%
Murcia 14.04% 10.82% 20.16% 11.29%
Navarra 8.24% 5.38% 12.22% 6.19%
Basque Country 13.92% 9.50% 10.51% 9.17%
La Rioja 6.65% 4.86% 12.74% 6.97%
Note: Figures in the last column correspond to the average unemployment rates computed using data for all years over the period 1999 to 2009.
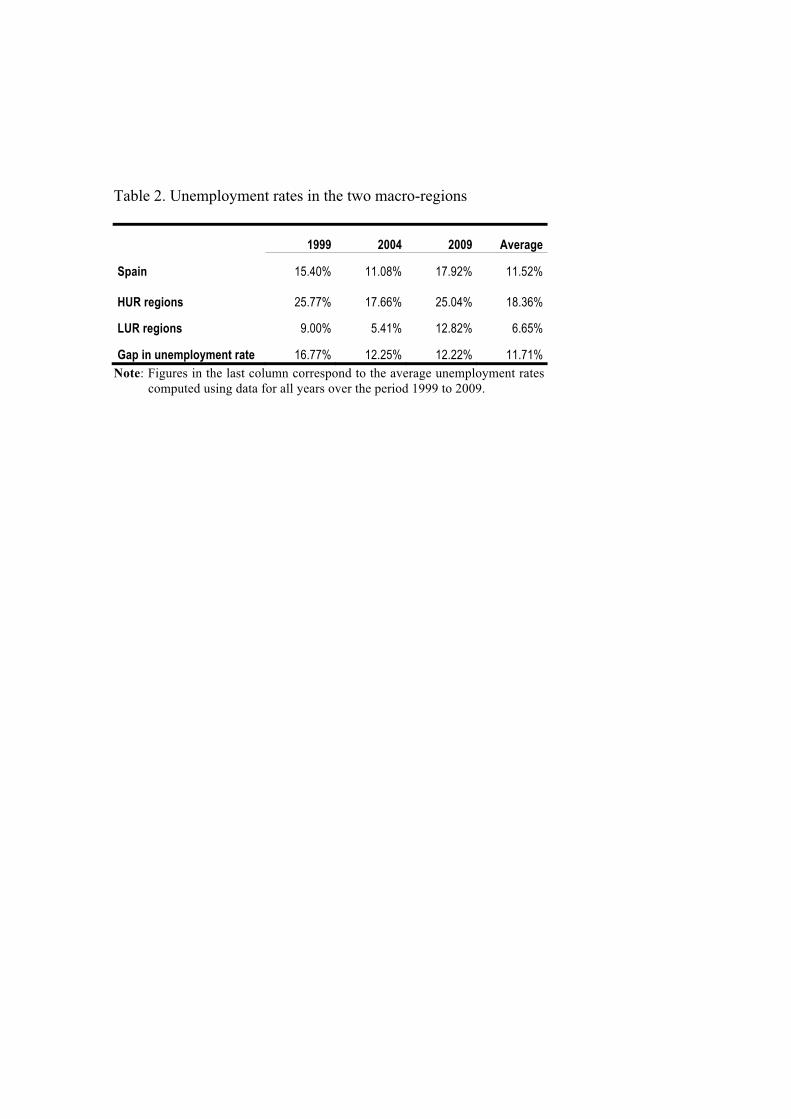
Table 2. Unemployment rates in the two macro-regions
1999 2004 2009 Average
Spain 15.40% 11.08% 17.92% 11.52% HUR regions
25.77% 17.66% 25.04% 18.36%
LUR regions 9.00% 5.41% 12.82% 6.65%
Gap in unemployment rate 16.77% 12.25% 12.22% 11.71% Note: Figures in the last column correspond to the average unemployment rates
computed using data for all years over the period 1999 to 2009.
Tabl
e 3.
Des
crip
tion
of so
me
char
acte
ristic
s in
the
two
mac
ro-r
egio
ns
19
99
20
04
20
09
HU
R LU
R
HUR
LUR
HU
R LU
R
Mean
S.E
. Me
an S
.E.
Me
an S
.E.
Mean
S.E
.
Mean
S.E
. Me
an S
.E.
INDI
VIDU
AL C
HARA
CTER
ISTI
CS
Gen
der
Ma
le 0.
62
(0.4
9)
0.62
(0
.49)
0.60
(0
.49)
0.
58
(0.4
9)
0.
56
(0.5
0)
0.55
(0
.50)
Fe
male
0.
38
(0.4
9)
0.38
(0
.49)
0.40
(0
.49)
0.
42
(0.4
9)
0.
44
(0.5
0)
0.45
(0
.50)
N
atio
nalit
y
Nativ
e 1.
00
(0.0
7)
0.99
(0
.08)
0.98
(0
.12)
0.
96
(0.2
0)
0.
96
(0.2
0)
0.91
(0
.29)
Im
mig
rant
0.
00
(0.0
7)
0.01
(0
.08)
0.02
(0
.12)
0.
04
(0.2
0)
0.
04
(0.2
0)
0.09
(0
.29)
A
ge
16
-19
0.04
(0
.21)
0.
03
(0.1
6)
0.
03
(0.1
8)
0.02
(0
.13)
0.03
(0
.17)
0.
02
(0.1
4)
20-2
4 0.
13
(0.3
4)
0.10
(0
.30)
0.11
(0
.31)
0.
09
(0.2
8)
0.
09
(0.2
9)
0.07
(0
.25)
25
-29
0.15
(0
.36)
0.
14
(0.3
4)
0.
14
(0.3
5)
0.12
(0
.32)
0.12
(0
.33)
0.
10
(0.3
0)
30-3
4 0.
14
(0.3
5)
0.13
(0
.34)
0.13
(0
.34)
0.
14
(0.3
5)
0.
13
(0.3
3)
0.13
(0
.33)
35
-39
0.14
(0
.35)
0.
14
(0.3
5)
0.
14
(0.3
5)
0.14
(0
.34)
0.14
(0
.34)
0.
14
(0.3
5)
40-4
4 0.
12
(0.3
3)
0.13
(0
.34)
0.14
(0
.34)
0.
15
(0.3
6)
0.
14
(0.3
5)
0.15
(0
.36)
45
-49
0.10
(0
.29)
0.
12
(0.3
2)
0.
11
(0.3
2)
0.13
(0
.34)
0.14
(0
.34)
0.
14
(0.3
5)
50-5
4 0.
08
(0.2
8)
0.11
(0
.31)
0.09
(0
.28)
0.
10
(0.3
0)
0.
11
(0.3
1)
0.12
(0
.32)
55
-59
0.06
(0
.23)
0.
07
(0.2
6)
0.
06
(0.2
5)
0.08
(0
.27)
0.07
(0
.26)
0.
09
(0.2
9)
60-6
4 0.
03
(0.1
7)
0.03
(0
.17)
0.04
(0
.19)
0.
04
(0.1
9)
0.
04
(0.2
0)
0.05
(0
.21)
E
duca
tion
Ye
ars o
f Sch
oolin
g 8.
71
(4.2
4)
9.77
(4
.14)
9.44
(4
.19)
10
.55
(4.0
3)
9.
90
(3.9
5)
10.9
7 (3
.88)
Ed
ucat
iona
l Atta
inm
ent
Co
mpu
lsory
0.
64
(0.4
8)
0.52
(0
.50)
0.57
(0
.50)
0.
43
(0.5
0)
0.
53
(0.5
0)
0.38
(0
.49)
No
Sch
oolin
g 0.
11
(0.3
1)
0.02
(0
.12)
0.06
(0
.24)
0.
01
(0.1
0)
0.
04
(0.2
1)
0.01
(0
.10)
Pr
imar
y 0.
24
(0.4
3)
0.27
(0
.44)
0.20
(0
.40)
0.
18
(0.3
9)
0.
13
(0.3
3)
0.12
(0
.32)
Fi
rst S
econ
dary
0.
29
(0.4
6)
0.24
(0
.43)
0.30
(0
.46)
0.
24
(0.4
3)
0.
36
(0.4
8)
0.25
(0
.43)
Post
-com
pulso
ry
0.36
(0
.48)
0.
48
(0.5
0)
0.
43
(0.5
0)
0.57
(0
.50)
0.47
(0
.50)
0.
62
(0.4
9)
High
Sch
ool
0.09
(0
.28)
0.
10
(0.3
0)
0.
10
(0.3
0)
0.11
(0
.32)
0.11
(0
.31)
0.
14
(0.3
5)
Voc T
rain
ing
1st l
evel
0.
05
(0.2
3)
0.08
(0
.27)
0.08
(0
.26)
0.
10
(0.3
0)
0.
09
(0.2
8)
0.11
(0
.31)
Vo
c Tra
inin
g 2n
d lev
el 0.
07
(0.2
6)
0.10
(0
.30)
0.06
(0
.24)
0.
11
(0.3
2)
0.
08
(0.2
8)
0.12
(0
.32)
Un
ivers
ity 1s
t lev
el 0.
08
(0.2
7)
0.11
(0
.31)
0.09
(0
.29)
0.
12
(0.3
3)
0.
10
(0.3
0)
0.12
(0
.33)
Un
ivers
ity 2n
d lev
el 0.
07
(0.2
6)
0.09
(0
.29)
0.09
(0
.29)
0.
12
(0.3
2)
0.
09
(0.2
9)
0.13
(0
.33)
Tabl
e 3.
Des
crip
tion
of so
me
char
acte
ristic
s in
the
two
mac
ro-r
egio
ns (c
ont'd
) M
arita
l Sta
tus
Sing
le 0.
38
(0.4
8)
0.36
(0
.48)
0.37
(0
.48)
0.
34
(0.4
7)
0.
35
(0.4
8)
0.33
(0
.47)
Ma
rried
0.
59
(0.4
9)
0.60
(0
.49)
0.59
(0
.49)
0.
62
(0.4
9)
0.
59
(0.4
9)
0.61
(0
.49)
W
idow
ed
0.01
(0
.11)
0.
01
(0.1
1)
0.
01
(0.1
0)
0.01
(0
.10)
0.01
(0
.11)
0.
01
(0.1
1)
Divo
rced
0.
02
(0.1
6)
0.02
(0
.15)
0.03
(0
.18)
0.
03
(0.1
8)
0.
05
(0.2
2)
0.05
(0
.21)
HOUS
EHOL
D CH
ARAC
TERI
STIC
S
N
of M
embe
rs
4.07
(1
.41)
3.
63
(1.2
8)
3.
76
(1.3
1)
3.37
(1
.20)
3.51
(1
.25)
3.
24
(1.1
7)
Head
of H
ouse
hold
0.
43
(0.4
9)
0.46
(0
.50)
0.44
(0
.50)
0.
46
(0.5
0)
0.
43
(0.5
0)
0.46
(0
.50)
N
of C
hild
ren
0.70
(0
.91)
0.
53
(0.8
0)
0.
62
(0.8
6)
0.51
(0
.81)
0.60
(0
.83)
0.
57
(0.8
4)
Child
ren
unde
r 9
0.27
(0
.45)
0.
22
(0.4
2)
0.
25
(0.4
4)
0.23
(0
.42)
0.26
(0
.44)
0.
24
(0.4
3)
Anot
her E
mpl
oyee
0.
83
(0.8
7)
0.96
(0
.85)
0.91
(0
.90)
0.
99
(0.8
4)
0.
82
(0.7
9)
0.93
(0
.77)
N
Obs.
17
092
62
33
1628
4
6113
16
057
68
37
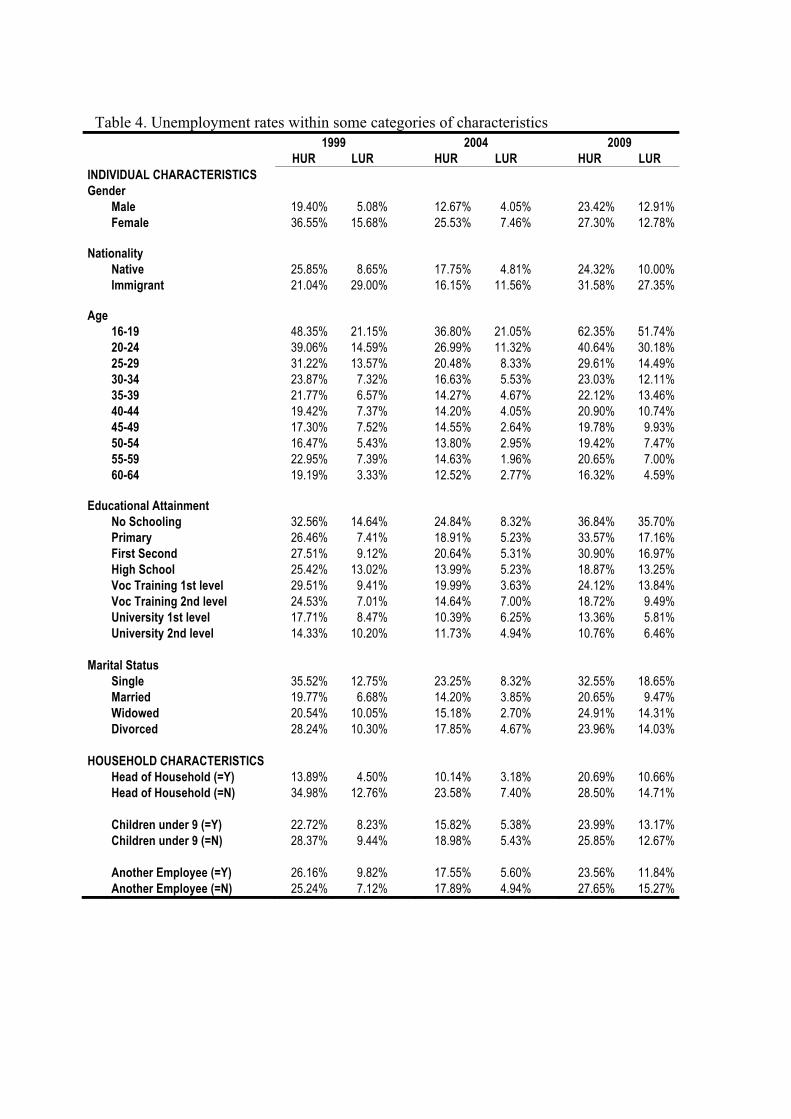
Table 4. Unemployment rates within some categories of characteristics
1999 2004 2009 HUR LUR HUR LUR HUR LUR INDIVIDUAL CHARACTERISTICS Gender Male 19.40% 5.08% 12.67% 4.05% 23.42% 12.91% Female 36.55% 15.68% 25.53% 7.46% 27.30% 12.78% Nationality Native 25.85% 8.65% 17.75% 4.81% 24.32% 10.00% Immigrant 21.04% 29.00% 16.15% 11.56% 31.58% 27.35% Age 16-19 48.35% 21.15% 36.80% 21.05% 62.35% 51.74% 20-24 39.06% 14.59% 26.99% 11.32% 40.64% 30.18% 25-29 31.22% 13.57% 20.48% 8.33% 29.61% 14.49% 30-34 23.87% 7.32% 16.63% 5.53% 23.03% 12.11% 35-39 21.77% 6.57% 14.27% 4.67% 22.12% 13.46% 40-44 19.42% 7.37% 14.20% 4.05% 20.90% 10.74% 45-49 17.30% 7.52% 14.55% 2.64% 19.78% 9.93% 50-54 16.47% 5.43% 13.80% 2.95% 19.42% 7.47% 55-59 22.95% 7.39% 14.63% 1.96% 20.65% 7.00% 60-64 19.19% 3.33% 12.52% 2.77% 16.32% 4.59% Educational Attainment No Schooling 32.56% 14.64% 24.84% 8.32% 36.84% 35.70% Primary 26.46% 7.41% 18.91% 5.23% 33.57% 17.16% First Second 27.51% 9.12% 20.64% 5.31% 30.90% 16.97% High School 25.42% 13.02% 13.99% 5.23% 18.87% 13.25% Voc Training 1st level 29.51% 9.41% 19.99% 3.63% 24.12% 13.84% Voc Training 2nd level 24.53% 7.01% 14.64% 7.00% 18.72% 9.49% University 1st level 17.71% 8.47% 10.39% 6.25% 13.36% 5.81% University 2nd level 14.33% 10.20% 11.73% 4.94% 10.76% 6.46% Marital Status Single 35.52% 12.75% 23.25% 8.32% 32.55% 18.65% Married 19.77% 6.68% 14.20% 3.85% 20.65% 9.47% Widowed 20.54% 10.05% 15.18% 2.70% 24.91% 14.31% Divorced 28.24% 10.30% 17.85% 4.67% 23.96% 14.03% HOUSEHOLD CHARACTERISTICS Head of Household (=Y) 13.89% 4.50% 10.14% 3.18% 20.69% 10.66% Head of Household (=N) 34.98% 12.76% 23.58% 7.40% 28.50% 14.71% Children under 9 (=Y) 22.72% 8.23% 15.82% 5.38% 23.99% 13.17% Children under 9 (=N) 28.37% 9.44% 18.98% 5.43% 25.85% 12.67% Another Employee (=Y) 26.16% 9.82% 17.55% 5.60% 23.56% 11.84% Another Employee (=N) 25.24% 7.12% 17.89% 4.94% 27.65% 15.27%
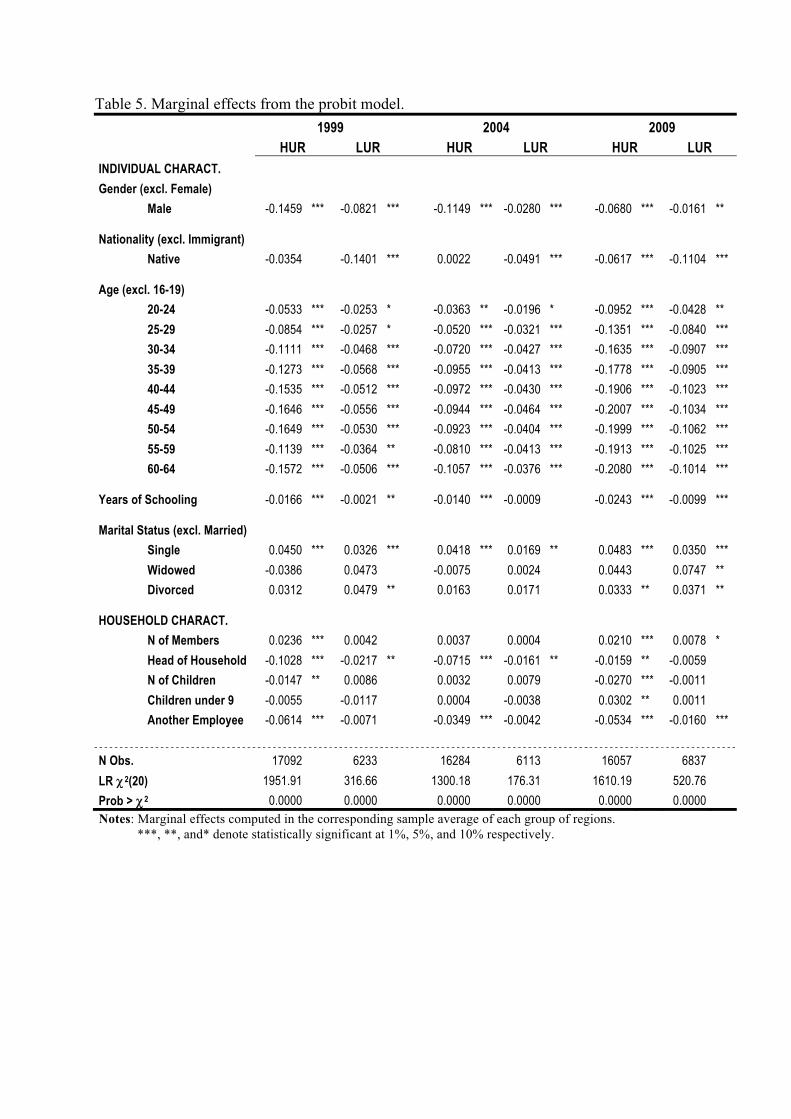
Table 5. Marginal effects from the probit model. 1999 2004 2009 HUR LUR HUR LUR HUR LUR INDIVIDUAL CHARACT.
Gender (excl. Female)
Male -0.1459 *** -0.0821 *** -0.1149 *** -0.0280 *** -0.0680 *** -0.0161 ** Nationality (excl. Immigrant)
Native -0.0354 -0.1401 *** 0.0022 -0.0491 *** -0.0617 *** -0.1104 *** Age (excl. 16-19)
20-24 -0.0533 *** -0.0253 * -0.0363 ** -0.0196 * -0.0952 *** -0.0428 **
25-29 -0.0854 *** -0.0257 * -0.0520 *** -0.0321 *** -0.1351 *** -0.0840 ***
30-34 -0.1111 *** -0.0468 *** -0.0720 *** -0.0427 *** -0.1635 *** -0.0907 ***
35-39 -0.1273 *** -0.0568 *** -0.0955 *** -0.0413 *** -0.1778 *** -0.0905 ***
40-44 -0.1535 *** -0.0512 *** -0.0972 *** -0.0430 *** -0.1906 *** -0.1023 ***
45-49 -0.1646 *** -0.0556 *** -0.0944 *** -0.0464 *** -0.2007 *** -0.1034 ***
50-54 -0.1649 *** -0.0530 *** -0.0923 *** -0.0404 *** -0.1999 *** -0.1062 ***
55-59 -0.1139 *** -0.0364 ** -0.0810 *** -0.0413 *** -0.1913 *** -0.1025 ***
60-64 -0.1572 *** -0.0506 *** -0.1057 *** -0.0376 *** -0.2080 *** -0.1014 *** Years of Schooling -0.0166 *** -0.0021 ** -0.0140 *** -0.0009 -0.0243 *** -0.0099 *** Marital Status (excl. Married)
Single 0.0450 *** 0.0326 *** 0.0418 *** 0.0169 ** 0.0483 *** 0.0350 ***
Widowed -0.0386 0.0473 -0.0075 0.0024 0.0443 0.0747 **
Divorced 0.0312 0.0479 ** 0.0163 0.0171 0.0333 ** 0.0371 ** HOUSEHOLD CHARACT.
N of Members 0.0236 *** 0.0042 0.0037 0.0004 0.0210 *** 0.0078 *
Head of Household -0.1028 *** -0.0217 ** -0.0715 *** -0.0161 ** -0.0159 ** -0.0059
N of Children -0.0147 ** 0.0086 0.0032 0.0079 -0.0270 *** -0.0011
Children under 9 -0.0055 -0.0117 0.0004 -0.0038 0.0302 ** 0.0011
Another Employee -0.0614 *** -0.0071 -0.0349 *** -0.0042 -0.0534 *** -0.0160 ***
N Obs. 17092 6233 16284 6113 16057 6837
LR χχ 2(20) 1951.91 316.66 1300.18 176.31 1610.19 520.76
Prob > χχ 2 0.0000 0.0000 0.0000 0.0000 0.0000 0.0000 Notes: Marginal effects computed in the corresponding sample average of each group of regions. ***, **, and* denote statistically significant at 1%, 5%, and 10% respectively.
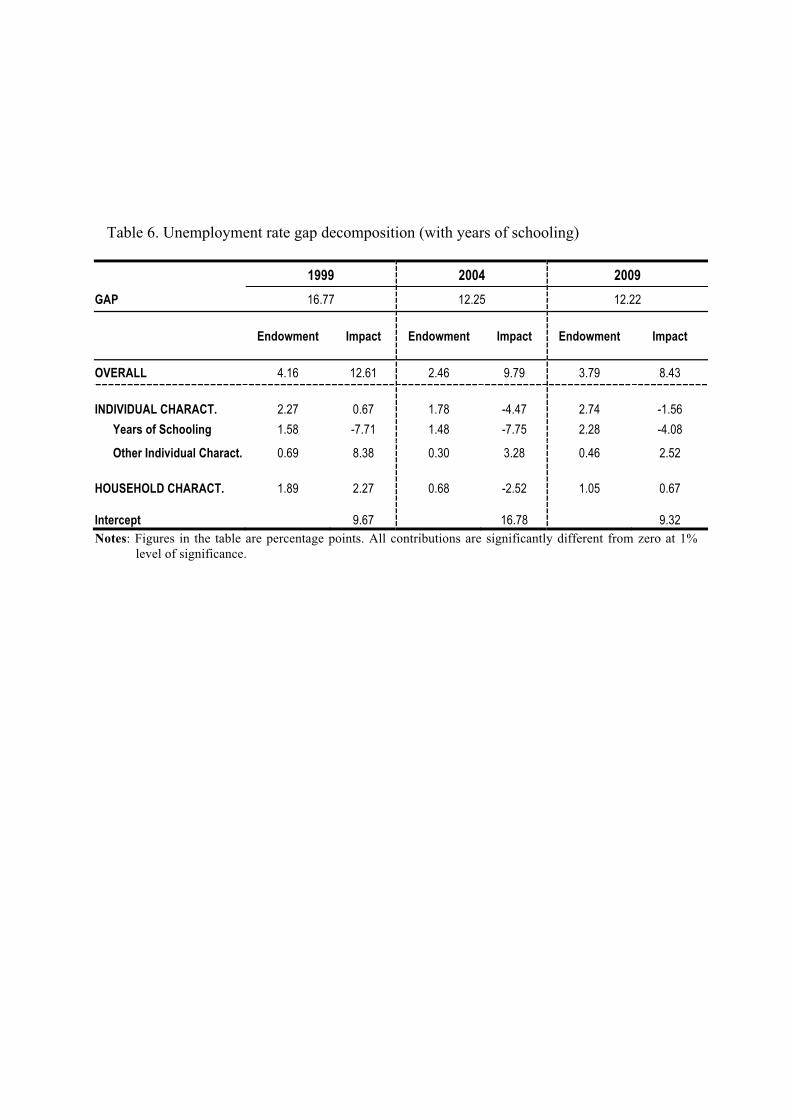
Table 6. Unemployment rate gap decomposition (with years of schooling) 1999 2004 2009 GAP 16.77 12.25 12.22
Endowment Impact Endowment Impact Endowment Impact
OVERALL 4.16 12.61 2.46 9.79 3.79 8.43
INDIVIDUAL CHARACT.
2.27
0.67
1.78
-4.47
2.74
-1.56
Years of Schooling 1.58 -7.71 1.48 -7.75 2.28 -4.08
Other Individual Charact. 0.69 8.38 0.30 3.28 0.46 2.52
HOUSEHOLD CHARACT.
1.89
2.27
0.68
-2.52
1.05
0.67
Intercept
9.67
16.78
9.32
Notes: Figures in the table are percentage points. All contributions are significantly different from zero at 1% level of significance.
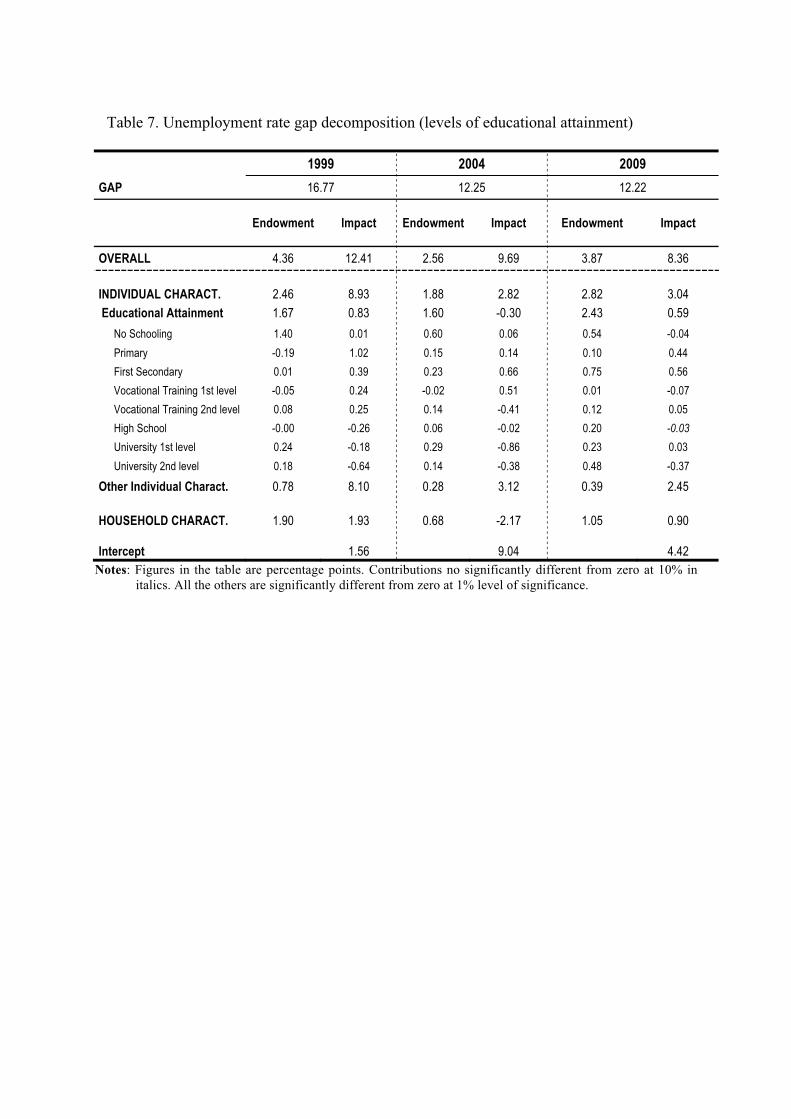
Table 7. Unemployment rate gap decomposition (levels of educational attainment)
1999 2004 2009 GAP 16.77 12.25 12.22
Endowment Impact Endowment Impact Endowment Impact
OVERALL 4.36 12.41 2.56 9.69 3.87 8.36
INDIVIDUAL CHARACT.
2.46
8.93
1.88
2.82
2.82
3.04
Educational Attainment 1.67 0.83 1.60 -0.30 2.43 0.59
No Schooling 1.40 0.01 0.60 0.06 0.54 -0.04
Primary -0.19 1.02 0.15 0.14 0.10 0.44
First Secondary 0.01 0.39 0.23 0.66 0.75 0.56
Vocational Training 1st level -0.05 0.24 -0.02 0.51 0.01 -0.07
Vocational Training 2nd level 0.08 0.25 0.14 -0.41 0.12 0.05
High School -0.00 -0.26 0.06 -0.02 0.20 -0.03 University 1st level 0.24 -0.18 0.29 -0.86 0.23 0.03
University 2nd level 0.18 -0.64 0.14 -0.38 0.48 -0.37
Other Individual Charact. 0.78 8.10 0.28 3.12 0.39 2.45
HOUSEHOLD CHARACT.
1.90
1.93
0.68
-2.17
1.05
0.90
Intercept
1.56
9.04
4.42
Notes: Figures in the table are percentage points. Contributions no significantly different from zero at 10% in italics. All the others are significantly different from zero at 1% level of significance.
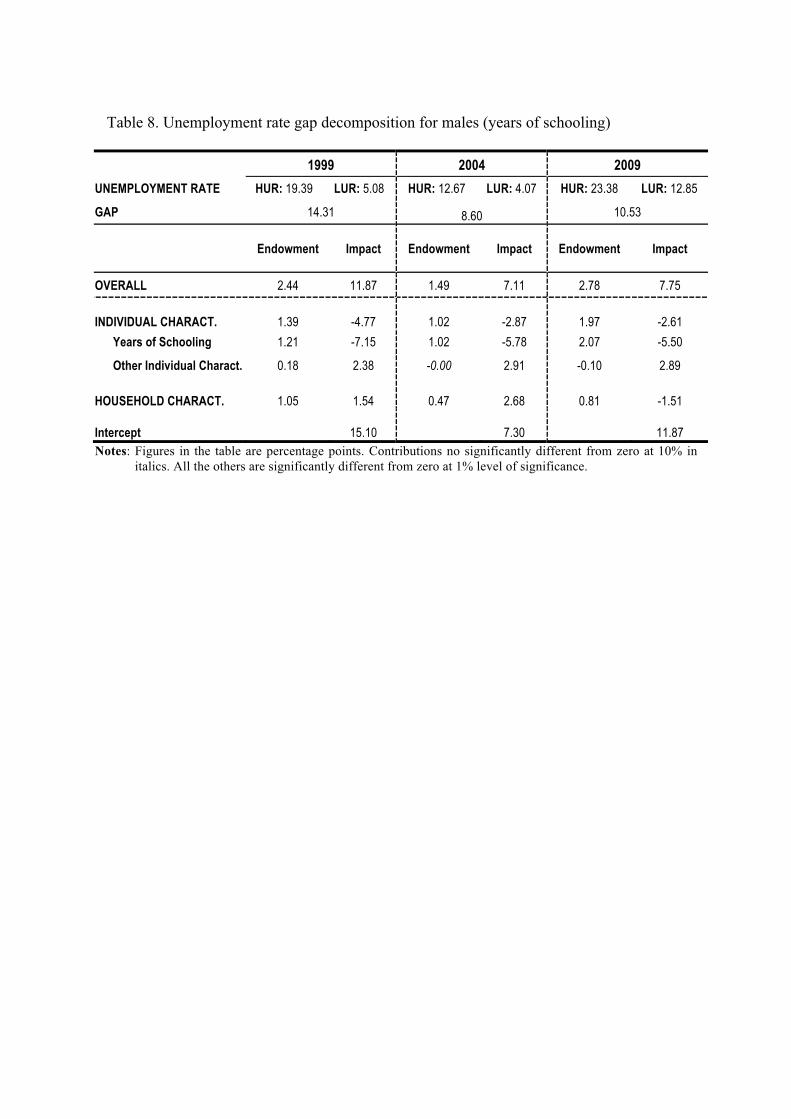
Table 8. Unemployment rate gap decomposition for males (years of schooling)
1999 2004 2009 UNEMPLOYMENT RATE HUR: 19.39 LUR: 5.08 HUR: 12.67 LUR: 4.07 HUR: 23.38 LUR: 12.85
GAP 14.31 8.60 10.53
Endowment Impact Endowment Impact Endowment Impact
OVERALL 2.44 11.87 1.49 7.11 2.78 7.75
INDIVIDUAL CHARACT.
1.39
-4.77
1.02
-2.87
1.97
-2.61
Years of Schooling 1.21 -7.15 1.02 -5.78 2.07 -5.50
Other Individual Charact. 0.18 2.38 -0.00 2.91 -0.10 2.89
HOUSEHOLD CHARACT.
1.05
1.54
0.47
2.68
0.81
-1.51
Intercept
15.10
7.30
11.87
Notes: Figures in the table are percentage points. Contributions no significantly different from zero at 10% in italics. All the others are significantly different from zero at 1% level of significance.
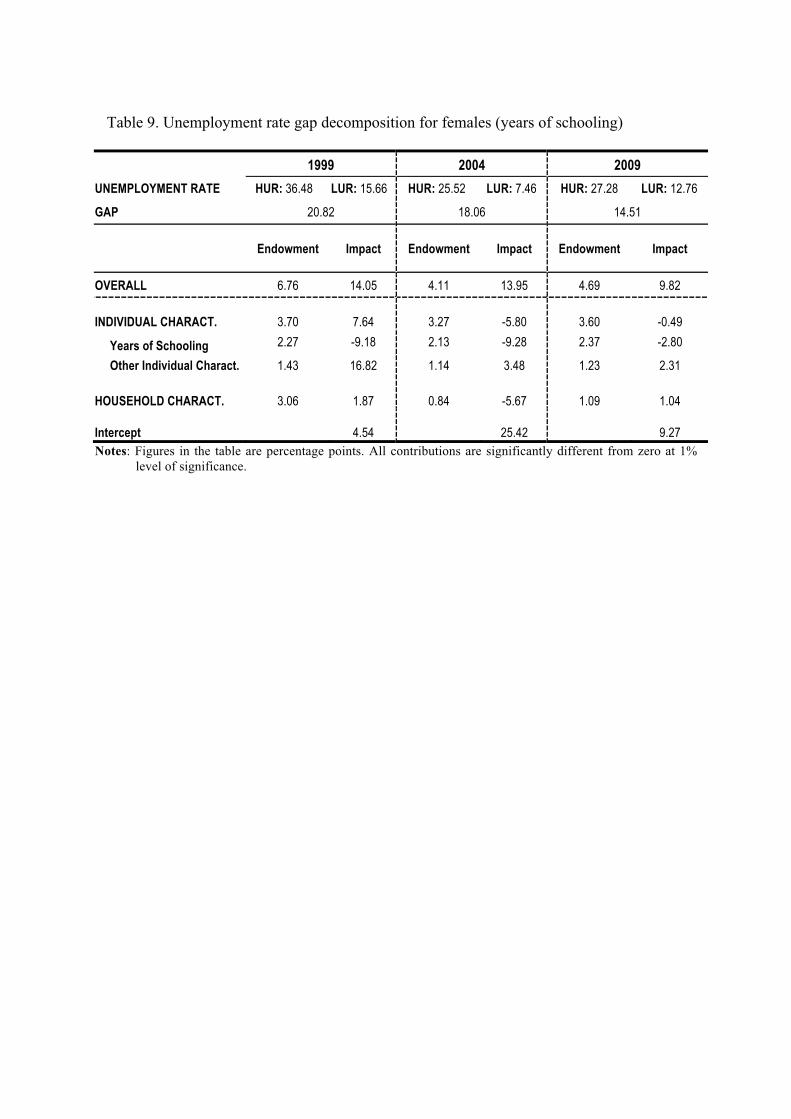
Table 9. Unemployment rate gap decomposition for females (years of schooling)
1999 2004 2009 UNEMPLOYMENT RATE HUR: 36.48 LUR: 15.66 HUR: 25.52 LUR: 7.46 HUR: 27.28 LUR: 12.76
GAP 20.82 18.06 14.51
Endowment Impact Endowment Impact Endowment Impact
OVERALL 6.76 14.05 4.11 13.95 4.69 9.82
INDIVIDUAL CHARACT.
3.70
7.64
3.27
-5.80
3.60
-0.49
Years of Schooling 2.27 -9.18 2.13 -9.28 2.37 -2.80
Other Individual Charact. 1.43 16.82 1.14 3.48 1.23 2.31
HOUSEHOLD CHARACT.
3.06
1.87
0.84
-5.67
1.09
1.04
Intercept
4.54
25.42
9.27
Notes: Figures in the table are percentage points. All contributions are significantly different from zero at 1% level of significance.
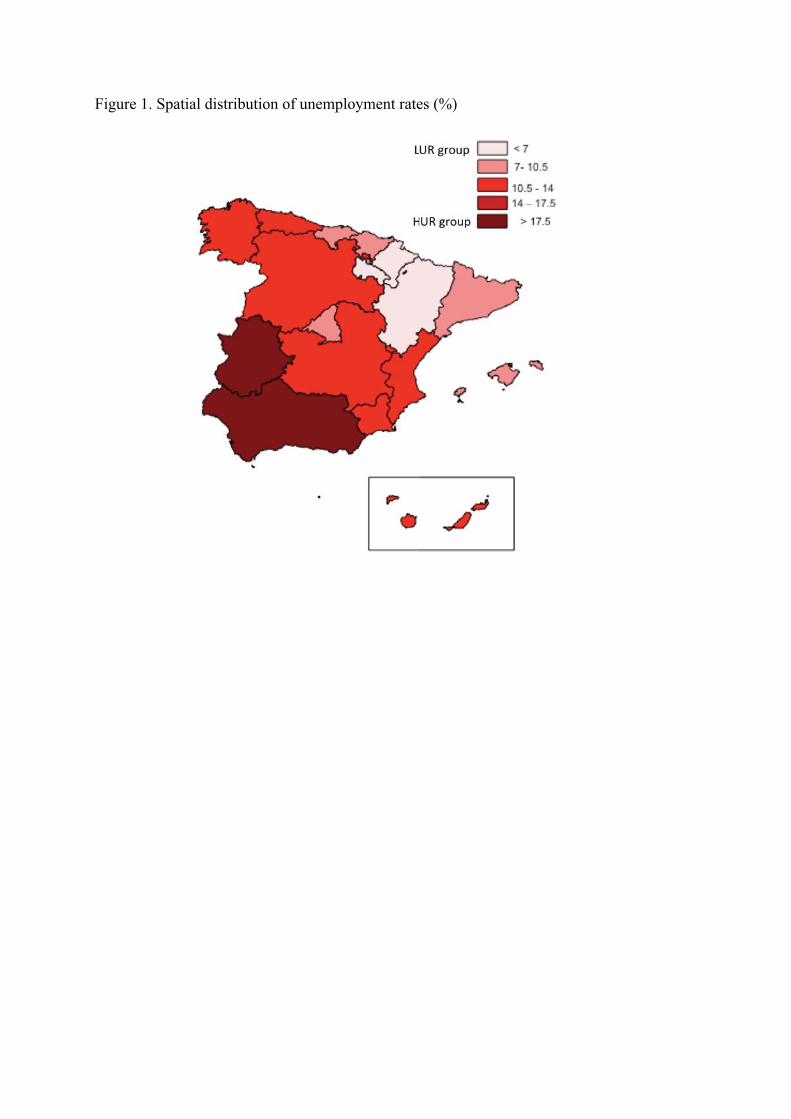
Figure 1. Spatial distribution of unemployment rates (%)
Institut de Recerca en Economia Aplicada Regional i Pública Document de Treball 2011/22 pàg. 39 Research Institute of Applied Economics Working Paper 2011/22 pag. 39
39
Llista Document de Treball
List Working Paper
WP 2011/25 “The regional distribution of unemployment. What do micro-data tell us?” López-Bazo, E. and Motellón, E.
WP 2011/24 “Vertical relations and local competition: an empirical approach” Perdiguero, J.
WP 2011/23 “Air services on thin routes: Regional versus low-cost airlines” Fageda, X. and Flores-Fillol, R.
WP 2011/22 “Measuring early childhood health: a composite index comparing Colombian departments” Osorio, A.M.; Bolancé, C. and Alcañiz, M.
WP 2011/21 “A relational approach to the geography of innovation: a typology of regions” Moreno, R. and Miguélez, E.
WP 2011/20 “Does Rigidity of Prices Hide Collusion?” Jiménez, J.L and Perdiguero, J.
WP 2011/19 “Factors affecting hospital admission and recovery stay duration of in-patient motor victims in Spain” Santolino, M.; Bolancé, C. and Alcañiz, M.
WP 2011/18 “Why do municipalities cooperate to provide local public services? An empirical analysis” Bel, G.; Fageda, X. and Mur, M.
WP 2011/17 “The "farthest" need the best. Human capital composition and development-specific economic growth” Manca, F.
WP 2011/16 “Causality and contagion in peripheral EMU public debt markets: a dynamic approach” Gómez-Puig, M. and Sosvilla-Rivero, S.
WP 2011/15 “The influence of decision-maker effort and case complexity on appealed rulings subject to multi-categorical selection” Santolino, M. and Söderberg, M.
WP 2011/14 “Agglomeration, Inequality and Economic Growth: Cross-section and panel data analysis” Castells, D.
WP 2011/13 “A correlation sensitivity analysis of non-life underwriting risk in solvency capital requirement estimation” Bermúdez, L.; Ferri, A. and Guillén, M.
WP 2011/12 “Assessing agglomeration economies in a spatial framework with endogenous regressors” Artis, M.J.; Miguélez, E. and Moreno, R.
WP 2011/11 “Privatization, cooperation and costs of solid waste services in small towns” Bel, G; Fageda, X. and Mur, M.
WP 2011/10 “Privatization and PPPS in transportation infrastructure: Network effects of increasing user fees” Albalate, D. and Bel, G.
WP 2011/09 “Debating as a classroom tool for adapting learning outcomes to the European higher education area” Jiménez, J.L.; Perdiguero, J. and Suárez, A.
WP 2011/08 “Influence of the claimant’s behavioural features on motor compensation outcomes” Ayuso, M; Bermúdez L. and Santolino, M.
WP 2011/07 “Geography of talent and regional differences in Spain” Karahasan, B.C. and Kerimoglu E.
WP 2011/06 “How Important to a City Are Tourists and Daytrippers? The Economic Impact of Tourism on The City of Barcelona” Murillo, J; Vayá, E; Romaní, J. and Suriñach, J.
WP 2011/05 “Singling out individual inventors from patent data” Miguélez,E. and Gómez-Miguélez, I.
WP 2011/04 “¿La sobreeducación de los padres afecta al rendimiento académico de sus hijos?” Nieto, S; Ramos, R.
Institut de Recerca en Economia Aplicada Regional i Pública Document de Treball 2011/22 pàg. 40 Research Institute of Applied Economics Working Paper 2011/22 pag. 40
40
WP 2011/03 “The Transatlantic Productivity Gap: Is R&D the Main Culprit?” Ortega-Argilés, R.; Piva, M.; and Vivarelli, M.
WP 2011/02 “The Spatial Distribution of Human Capital: Can It Really Be Explained by Regional Differences in Market Access?” Karahasan, B.C. and López-Bazo, E
WP 2011/01 “If you want me to stay, pay” . Claeys, P and Martire, F
WP 2010/16 “Infrastructure and nation building: The regulation and financing of network transportation infrastructures in Spain (1720-2010)”Bel,G
WP 2010/15 “Fiscal policy and economic stability: does PIGS stand for Procyclicality In Government Spending?” Maravalle, A ; Claeys, P.
WP 2010/14 “Economic and social convergence in Colombia” Royuela, V; Adolfo García, G.
WP 2010/13 “Symmetric or asymmetric gasoline prices? A meta-analysis approach” Perdiguero, J.
WP 2010/12 “Ownership, Incentives and Hospitals” Fageda,X and Fiz, E.
WP 2010/11 “Prediction of the economic cost of individual long-term care in the Spanish population” Bolancé, C; Alemany, R ; and Guillén M
WP 2010/10 “On the Dynamics of Exports and FDI: The Spanish Internationalization Process” Martínez-Martín, J.
WP 2010/09 “Urban transport governance reform in Barcelona” Albalate, D ; Bel, G and Calzada, J.
WP 2010/08 “Cómo (no) adaptar una asignatura al EEES: Lecciones desde la experiencia comparada en España” Florido C. ; Jiménez JL. and Perdiguero J.
WP 2010/07 “Price rivalry in airline markets: A study of a successful strategy of a network carrier against a low-cost carrier” Fageda, X ; Jiménez J.L. ; Perdiguero , J.
WP 2010/06 “La reforma de la contratación en el mercado de trabajo: entre la flexibilidad y la seguridad” Royuela V. and Manuel Sanchis M.
WP 2010/05 “Discrete distributions when modeling the disability severity score of motor victims” Boucher, J and Santolino, M
WP 2010/04 “Does privatization spur regulation? Evidence from the regulatory reform of European airports . Bel, G. and Fageda, X.”
WP 2010/03 “High-Speed Rail: Lessons for Policy Makers from Experiences Abroad”. Albalate, D ; and Bel, G.”
WP 2010/02 “Speed limit laws in America: Economics, politics and geography”. Albalate, D ; and Bel, G.”
WP 2010/01 “Research Networks and Inventors’ Mobility as Drivers of Innovation: Evidence from Europe” Miguélez, E. ; Moreno, R. ”
WP 2009/26 ”Social Preferences and Transport Policy: The case of US speed limits” Albalate, D.
WP 2009/25 ”Human Capital Spillovers Productivity and Regional Convergence in Spain” , Ramos, R ; Artis, M.; Suriñach, J.
WP 2009/24 “Human Capital and Regional Wage Gaps” ,López-Bazo,E. Motellón E.
WP 2009/23 “Is Private Production of Public Services Cheaper than Public Production? A meta-regression analysis of solid waste and water services” Bel, G.; Fageda, X.; Warner. M.E.
WP 2009/22 “Institutional Determinants of Military Spending” Bel, G., Elias-Moreno, F.
Institut de Recerca en Economia Aplicada Regional i Pública Document de Treball 2011/22 pàg. 41 Research Institute of Applied Economics Working Paper 2011/22 pag. 41
41
WP 2009/21 “Fiscal Regime Shifts in Portugal” Afonso, A., Claeys, P., Sousa, R.M.
WP 2009/20 “Health care utilization among immigrants and native-born populations in 11 European countries. Results from the Survey of Health, Ageing and Retirement in Europe” Solé-Auró, A., Guillén, M., Crimmins, E.M.
WP 2009/19 “La efectividad de las políticas activas de mercado de trabajo para luchar contra el paro. La experiencia de Cataluña” Ramos, R., Suriñach, J., Artís, M.
WP 2009/18 “Is the Wage Curve Formal or Informal? Evidence for Colombia” Ramos, R., Duque, J.C., Suriñach, J.
WP 2009/17 “General Equilibrium Long-Run Determinants for Spanish FDI: A Spatial Panel Data Approach” Martínez-Martín, J.
WP 2009/16 “Scientists on the move: tracing scientists’ mobility and its spatial distribution” Miguélez, E.; Moreno, R.; Suriñach, J.
WP 2009/15 “The First Privatization Policy in a Democracy: Selling State-Owned Enterprises in 1948-1950 Puerto Rico” Bel, G.
WP 2009/14 “Appropriate IPRs, Human Capital Composition and Economic Growth” Manca, F.
WP 2009/13 “Human Capital Composition and Economic Growth at a Regional Level” Manca, F.
WP 2009/12 “Technology Catching-up and the Role of Institutions” Manca, F.
WP 2009/11 “A missing spatial link in institutional quality” Claeys, P.; Manca, F.
WP 2009/10 “Tourism and Exports as a means of Growth” Cortés-Jiménez, I.; Pulina, M.; Riera i Prunera, C.; Artís, M.
WP 2009/09 “Evidence on the role of ownership structure on firms' innovative performance” Ortega-Argilés, R.; Moreno, R.
WP 2009/08 “¿Por qué se privatizan servicios en los municipios (pequeños)? Evidencia empírica sobre residuos sólidos y agua” Bel, G.; Fageda, X.; Mur, M.
WP 2009/07 “Empirical analysis of solid management waste costs: Some evidence from Galicia, Spain” Bel, G.; Fageda, X.
WP 2009/06 “Intercontinental fligths from European Airports: Towards hub concentration or not?” Bel, G.; Fageda, X.
WP 2009/05 “Factors explaining urban transport systems in large European cities: A cross-sectional approach” Albalate, D.; Bel, G.
WP 2009/04 “Regional economic growth and human capital: the role of overeducation” Ramos, R.; Suriñach, J.; Artís, M.
WP 2009/03 “Regional heterogeneity in wage distributions. Evidence from Spain” Motellón, E.; López-Bazo, E.; El-Attar, M.
WP 2009/02 “Modelling the disability severity score in motor insurance claims: an application to the Spanish case” Santolino, M.; Boucher, J.P.
WP 2009/01 “Quality in work and aggregate productivity” Royuela, V.; Suriñach, J.
WP 2008/16 “Intermunicipal cooperation and privatization of solid waste services among small municipalities in Spain” Bel, G.; Mur, M.
WP 2008/15 “Similar problems, different solutions: Comparing refuse collection in the Netherlands and Spain” Bel, G.; Dijkgraaf, E.; Fageda, X.; Gradus, R.
Institut de Recerca en Economia Aplicada Regional i Pública Document de Treball 2011/22 pàg. 42 Research Institute of Applied Economics Working Paper 2011/22 pag. 42
42
WP 2008/14 “Determinants of the decision to appeal against motor bodily injury settlements awarded by Spanish trial courts” Santolino, M
WP 2008/13 “Does social capital reinforce technological inputs in the creation of knowledge? Evidence from the Spanish regions” Miguélez, E.; Moreno, R.; Artís, M.
WP 2008/12 “Testing the FTPL across government tiers” Claeys, P.; Ramos, R.; Suriñach, J.
WP 2008/11 “Internet Banking in Europe: a comparative analysis” Arnaboldi, F.; Claeys, P.
WP 2008/10 “Fiscal policy and interest rates: the role of financial and economic integration” Claeys, P.; Moreno, R.; Suriñach, J.
WP 2008/09 “Health of Immigrants in European countries” Solé-Auró, A.; M.Crimmins, E.
WP 2008/08 “The Role of Firm Size in Training Provision Decisions: evidence from Spain” Castany, L.
WP 2008/07 “Forecasting the maximum compensation offer in the automobile BI claims negotiation process” Ayuso, M.; Santolino, M.
WP 2008/06 “Prediction of individual automobile RBNS claim reserves in the context of Solvency II” Ayuso, M.; Santolino, M.
WP 2008/05 “Panel Data Stochastic Convergence Analysis of the Mexican Regions” Carrion-i-Silvestre, J.L.; German-Soto, V.
WP 2008/04 “Local privatization, intermunicipal cooperation, transaction costs and political interests: Evidence from Spain” Bel, G.; Fageda, X.
WP 2008/03 “Choosing hybrid organizations for local services delivery: An empirical analysis of partial privatization” Bel, G.; Fageda, X.
WP 2008/02 “Motorways, tolls and road safety. Evidence from European Panel Data” Albalate, D.; Bel, G.
WP 2008/01 “Shaping urban traffic patterns through congestion charging: What factors drive success or failure?” Albalate, D.; Bel, G.
WP 2007/19 “La distribución regional de la temporalidad en España. Análisis de sus determinantes” Motellón, E.
WP 2007/18 “Regional returns to physical capital: are they conditioned by educational attainment?” López-Bazo, E.; Moreno, R.
WP 2007/17 “Does human capital stimulate investment in physical capital? evidence from a cost system framework” López-Bazo, E.; Moreno, R.
WP 2007/16 “Do innovation and human capital explain the productivity gap between small and large firms?” Castany, L.; López-Bazo, E.; Moreno, R.
WP 2007/15 “Estimating the effects of fiscal policy under the budget constraint” Claeys, P.
WP 2007/14 “Fiscal sustainability across government tiers: an assessment of soft budget constraints” Claeys, P.; Ramos, R.; Suriñach, J.
WP 2007/13 “The institutional vs. the academic definition of the quality of work life. What is the focus of the European Commission?” Royuela, V.; López-Tamayo, J.; Suriñach, J.
WP 2007/12 “Cambios en la distribución salarial en españa, 1995-2002. Efectos a través del tipo de contrato” Motellón, E.; López-Bazo, E.; El-Attar, M.
WP 2007/11 “EU-15 sovereign governments’ cost of borrowing after seven years of monetary union” Gómez-Puig, M..
Institut de Recerca en Economia Aplicada Regional i Pública Document de Treball 2011/22 pàg. 43 Research Institute of Applied Economics Working Paper 2011/22 pag. 43
43
WP 2007/10 “Another Look at the Null of Stationary Real Exchange Rates: Panel Data with Structural Breaks and Cross-section Dependence” Syed A. Basher; Carrion-i-Silvestre, J.L.
WP 2007/09 “Multicointegration, polynomial cointegration and I(2) cointegration with structural breaks. An application to the sustainability of the US external deficit” Berenguer-Rico, V.; Carrion-i-Silvestre, J.L.
WP 2007/08 “Has concentration evolved similarly in manufacturing and services? A sensitivity analysis” Ruiz-Valenzuela, J.; Moreno-Serrano, R.; Vaya-Valcarce, E.
WP 2007/07 “Defining housing market areas using commuting and migration algorithms. Catalonia (Spain) as an applied case study” Royuela, C.; Vargas, M.
WP 2007/06 “Regulating Concessions of Toll Motorways, An Empirical Study on Fixed vs. Variable Term Contracts” Albalate, D.; Bel, G.
WP 2007/05 “Decomposing differences in total factor productivity across firm size” Castany, L.; Lopez-Bazo, E.; Moreno, R.
WP 2007/04 “Privatization and Regulation of Toll Motorways in Europe” Albalate, D.; Bel, G.; Fageda, X.
WP 2007/03 “Is the influence of quality of life on urban growth non-stationary in space? A case study of Barcelona” Royuela, V.; Moreno, R.; Vayá, E.
WP 2007/02 “Sustainability of EU fiscal policies. A panel test” Claeys, P.
WP 2007/01 “Research networks and scientific production in Economics: The recent spanish experience” Duque, J.C.; Ramos, R.; Royuela, V.
WP 2006/10 “Term structure of interest rate. European financial integration” Fontanals-Albiol, H.; Ruiz-Dotras, E.; Bolancé-Losilla, C.
WP 2006/09 “Patrones de publicación internacional (ssci) de los autores afiliados a universidades españolas, en el ámbito económico-empresarial (1994-2004)” Suriñach, J.; Duque, J.C.; Royuela, V.
WP 2006/08 “Supervised regionalization methods: A survey” Duque, J.C.; Ramos, R.; Suriñach, J.
WP 2006/07 “Against the mainstream: nazi privatization in 1930s germany” Bel, G.
WP 2006/06 “Economía Urbana y Calidad de Vida. Una revisión del estado del conocimiento en España” Royuela, V.; Lambiri, D.; Biagi, B.
WP 2006/05 “Calculation of the variance in surveys of the economic climate” Alcañiz, M.; Costa, A.; Guillén, M.; Luna, C.; Rovira, C.
WP 2006/04 “Time-varying effects when analysing customer lifetime duration: application to the insurance market” Guillen, M.; Nielsen, J.P.; Scheike, T.; Perez-Marin, A.M.
WP 2006/03 “Lowering blood alcohol content levels to save lives the european experience” Albalate, D.
WP 2006/02 “An analysis of the determinants in economics and business publications by spanish universities between 1994 and 2004” Ramos, R.; Royuela, V.; Suriñach, J.
WP 2006/01 “Job losses, outsourcing and relocation: empirical evidence using microdata” Artís, M.; Ramos, R.; Suriñach, J.

Institut de Recerca en Economia Aplicada Regional i Pública Document de Treball 2011/22 pàg. 44 Research Institute of Applied Economics Working Paper 2011/22 pag. 44
44