Embed Size (px)
Citation preview

UMTRI-2013-22 AUGUST 2013
THE REASONS FOR THE RECENT DECLINE IN YOUNG DRIVER LICENSING IN THE U.S.
BRANDON SCHOETTLE MICHAEL SIVAK
THE REASONS FOR THE RECENT DECLINE
IN YOUNG DRIVER LICENSING IN THE U.S.
Brandon Schoettle Michael Sivak
The University of Michigan Transportation Research Institute
Ann Arbor, Michigan 48109-2150 U.S.A.
Report No. UMTRI-2013-22 August 2013

i
Technical Report Documentation Page 1. Report No.
UMTRI-2013-22 2. Government Accession No.
3. Recipientʼs Catalog No.
4. Title and Subtitle The Reasons for the Recent Decline in Young Driver Licensing in the U.S.
5. Report Date
August 2013 6. Performing Organization Code
383818 7. Author(s)
Brandon Schoettle and Michael Sivak 8. Performing Organization Report No. UMTRI-2013-22
9. Performing Organization Name and Address The University of Michigan Transportation Research Institute 2901 Baxter Road Ann Arbor, Michigan 48109-2150 U.S.A.
10. Work Unit no. (TRAIS)
11. Contract or Grant No.
12. Sponsoring Agency Name and Address The University of Michigan Sustainable Worldwide Transportation
13. Type of Report and Period Covered 14. Sponsoring Agency Code
15. Supplementary Notes Information about Sustainable Worldwide Transportation is available at http://www.umich.edu/~umtriswt. 16. Abstract
This survey examined why a substantial percentage of young adults currently do not have a driver’s license, and the future plans of this group concerning obtaining a license. The survey yielded useable responses from 618 persons aged 18 to 39 without a driver’s license. The top eight reasons (primary or secondary) for not having a driver’s license were as follows: (1) too busy or not enough time to get a driver’s license (37%), (2) owning and maintaining a vehicle is too expensive (32%), (3) able to get transportation from others (31%), (4) prefer to bike or walk (22%), (5) prefer to use public transportation (17%), (6) concerned about how driving impacts the environment (9%), (7) able to communicate and/or conduct business online instead (8%), and (8) disability/medical/vision problems (7%). Of the respondents, 22% indicated that they plan on never getting a driver’s license. On the other hand, 69% expect to get a driver’s license within the next five years. Young adults without a driver’s license—in comparison with the general population of the same age—tend to have less education and higher unemployment. However, the present study was not designed to investigate whether there is a causal relationship, or the direction of the effect if there were such a relationship. 17. Key Words young drivers, driver licensing, delaying licensing, foregoing licensing
18. Distribution Statement Unlimited
19. Security Classification (of this report) None
20. Security Classification (of this page) None
21. No. of Pages 27
22. Price

ii
Contents
Introduction ..........................................................................................................................1
Method .................................................................................................................................2
Survey instrument ...........................................................................................................2
Respondents ....................................................................................................................2
Results ..................................................................................................................................4
Primary reason for not obtaining a driver’s license ........................................................4
Secondary reason(s) for not obtaining a driver’s license ................................................7
Combined summary of all reasons for not obtaining a driver’s license ........................10
Future plans for obtaining a license ..............................................................................13
Additional demographic results ....................................................................................15
Discussion ..........................................................................................................................18
Why do some young adults decide not to obtain a driver’s license? ............................18
What are the long-term plans of young adults without a driver’s license? ...................20
Driver’s license, education, and employment ...............................................................20
Conclusions ........................................................................................................................21
References ..........................................................................................................................22
Appendix ............................................................................................................................23

1
Introduction A recent series of our papers concerning driver-licensing trends (Sivak and
Schoettle, 2011; 2012a; 2012b) have documented the decreasing frequency of obtaining a
driver’s license for younger members of the population (i.e., under 40 years of age), both
in the U.S. and in other countries. However, limited information exists regarding the
underlying causes of this decline.
An analysis of licensing trends in 15 countries (Sivak and Schoettle, 2012a) found
a significant relationship between Internet users per capita and reduced rates of licensing
for younger adults. Other studies have attempted to further describe the source of this
decline, but with limited success (Davis and Dutzik, 2012; Delbosc and Currie, 2013;
Taylor, Ralph, Blumenberg, and Smart, 2013; Williams, 2011). These studies examined
the attitudes of young adults and the potential influence of recent societal changes,
including graduated licensing; changes in transportation and communication
technologies; changes in the social status attached to driving and car ownership; and the
so-called boomerang effect with young adults returning to live with their parents. But the
methods of these studies were often not specifically focused on why individuals chose to
delay getting (or not to get) a license. (One part of the study by Williams [2011] did
attempt to specifically analyze the reasons for delay in licensing, but only for a narrow
sample restricted to 15- to 18-year-olds.) As such, previous studies were not conclusive
on the question of delayed licensing for young adults as a whole.
Therefore, the current study was designed to specifically assess the reasons
younger adults chose to delay (or forego) obtaining a driver’s license. A survey was
administered to young adults, 18 to 39 years old, who do not currently possess a valid
driver’s license, directly asking these individuals to describe the underlying reasons for
not having a license and whether they plan to get a license in the future.

2
Method
Survey instrument
An online survey was conducted using SurveyMonkey (www.surveymonkey.com),
a web-based survey company. A questionnaire was developed to examine several issues
related to an individual’s decision not to obtain a driver’s license. The main issues
addressed were as follows:
Primary reason for not obtaining a driver’s license
Secondary reason(s) for not obtaining a driver’s license
Future plans for obtaining a license
Information related to daily online activity, the availability of other licensed
drivers in the household, and additional demographic information was also collected for
inclusion in the analysis. The full text of the questionnaire is included in the appendix.
Respondents
SurveyMonkey’s Audience tool was used to target and recruit individuals in the
U.S. between the ages of 18 and 39 from SurveyMonkey’s respondent database. The
recruitment resulted in 4,572 replies from potential respondents. Two selection criteria
were then applied:
1) Only individuals who reported not currently having a valid driver’s license were
included.
2) Respondent age was then verified and required to be between 18 and 39.
Additionally, a target quota of approximately 100 responses per age group was
set, leading to the exclusion of otherwise qualified individuals as some age-group
quotas were filled.
Usable surveys were received for 618 respondents. Although 717 were initially
qualified to complete the survey, 99 individuals did not finish after starting the survey,
were excluded during the prescreening process due to their age-group quota being full, or
were excluded due to disqualifying answers given later in the survey.

3
The final response rate (i.e., total completed divided by total eligible, or 618/717)
was 86%. The percentage of individuals not qualified to complete the survey (3,855 out
of 4,572 reported that they do have a valid license) was 84.3%. This value is consistent
with the percentage of individuals 18 to 39 with a driver’s license in the current U.S.
population—84.7% (Sivak and Schoettle, 2012b). Age and gender breakdowns for the
respondents are presented in Table 1.
Table 1 Age and gender breakdowns for the final 618 respondents.
Demographic N %
Age group
18-19 18 99 16.0 19 99 16.0
20-29 20-24 115 18.6 25-29 99 16.0
30-39 30-34 108 17.5 35-39 98 15.9
Gender* Female 386 62.8 Male 229 37.2
* There were 3 cases with unspecified gender.

4
Results
Primary reason for not obtaining a driver’s license
Respondents were asked: (Q4) “What is the MAIN reason you do not currently
have a driver’s license?” Respondents were allowed only one response to this question.
The most common response (see Table 2) was “too busy or not enough time to get a
driver’s license” (26.9% overall). The second most common response related to the cost
of owning and maintaining a vehicle (14.6%), followed by the ability to get
transportation from others (12.1%).
An age effect for this top response is evident in Table 2; more than twice as many
in the youngest age group gave this answer (37.9%) than in the oldest age group (16.5%).
Though less commonly stated as reasons for not obtaining a license, the oldest age group
(30-39 years old) was more likely than the youngest group (18-19 years old) to indicate
that they have a medical problem or disability (11.2% vs. 1.0%), are concerned about the
environment (4.9% vs. 1.0%), have a fear of driving (3.9% vs. 1.0%), or have some legal
issue (4.4% vs. 0.5%).
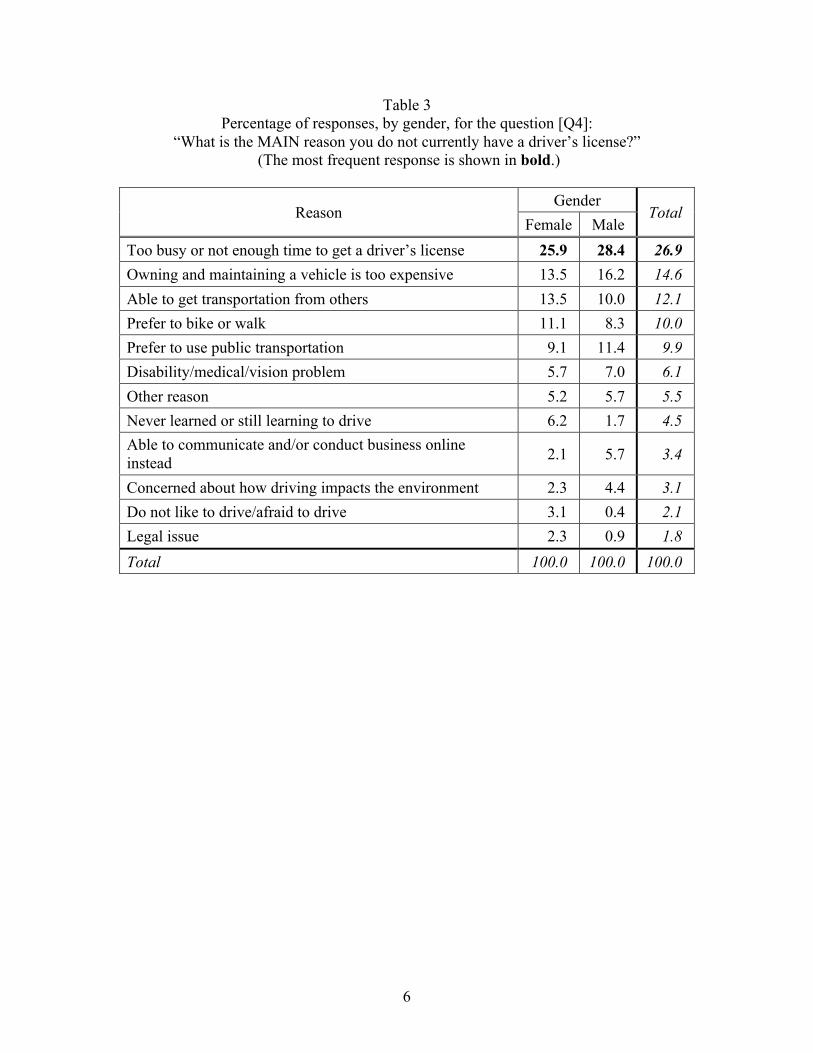
In terms of gender effects (see Table 3), female respondents were more likely than
males to indicate that they have not yet learned to drive (6.2% vs. 1.7%), have a fear of
driving (3.1% vs. 0.4%), or have some legal issue preventing them from obtaining a
license (2.3% vs. 0.9%). Males were more likely to say that they could communicate or
conduct business online (5.7% vs. 2.1%).

5
Table 2 Percentage of responses, by age group, for the question [Q4]:
“What is the MAIN reason you do not currently have a driver’s license?” (The most frequent response is shown in bold.)
Reason Age group
Total 18-19 20-29 30-39
Too busy or not enough time to get a driver’s license 37.9 26.6 16.5 26.9 Owning and maintaining a vehicle is too expensive 16.7 12.1 15.0 14.6 Able to get transportation from others 14.6 10.3 11.7 12.1 Prefer to bike or walk 12.1 8.9 9.2 10.0 Prefer to use public transportation 2.5 13.1 13.6 9.9 Disability/medical/vision problem 1.0 6.1 11.2 6.1 Other reason 5.1 8.4 2.9 5.5 Never learned or still learning to drive 4.5 6.5 2.4 4.5 Able to communicate and/or conduct business online instead 3.0 2.8 4.4 3.4
Concerned about how driving impacts the environment 1.0 3.3 4.9 3.1
Do not like to drive/afraid to drive 1.0 1.4 3.9 2.1 Legal issue 0.5 0.5 4.4 1.8 Total 100.0 100.0 100.0 100.0
6
Table 3 Percentage of responses, by gender, for the question [Q4]:
“What is the MAIN reason you do not currently have a driver’s license?” (The most frequent response is shown in bold.)
Reason Gender
Total Female Male
Too busy or not enough time to get a driver’s license 25.9 28.4 26.9 Owning and maintaining a vehicle is too expensive 13.5 16.2 14.6 Able to get transportation from others 13.5 10.0 12.1 Prefer to bike or walk 11.1 8.3 10.0 Prefer to use public transportation 9.1 11.4 9.9 Disability/medical/vision problem 5.7 7.0 6.1 Other reason 5.2 5.7 5.5 Never learned or still learning to drive 6.2 1.7 4.5 Able to communicate and/or conduct business online instead 2.1 5.7 3.4
Concerned about how driving impacts the environment 2.3 4.4 3.1 Do not like to drive/afraid to drive 3.1 0.4 2.1 Legal issue 2.3 0.9 1.8 Total 100.0 100.0 100.0

7
Secondary reason(s) for not obtaining a driver’s license
Respondents were asked: (Q5) “Are there any ADDITIONAL reasons you do not
currently have a driver’s license?” Respondents were allowed to select multiple
responses to include all additional reasons. The most common response was “no
additional reasons” (40.7%). (Respondents were not allowed to select additional reasons
if this option was selected.) The second most common response related to the ability to
get transportation from others (21.2%), followed by the cost of owning and maintaining a
vehicle (19.7%).
Table 4 shows responses by age. The youngest age group was more likely than
the middle or older groups to indicate that they were able to get transportation from
others (29.5% vs. 16.5% and 18.2%, respectively). They were also more likely to say
that they were too busy or did not have enough time to get a license (21.4% vs. 8.0% and
5.3%). The oldest age group was more likely than the younger or middle age groups to
mention being able to communicate or conduct business online (7.5% vs. 3.5% and
3.2%). The oldest group was also least likely to have a fear of driving (0.0% vs. 2.3%
and 3.7%). An expected age effect was observed for respondents reporting they have not
yet learned to drive, with decreasing frequency as age increased (an inverse relationship).
When the top responses were analyzed by gender (see Table 5), female
respondents were more likely than males to report being able to get transportation from
others (23.0% vs. 17.8%), that they have not yet learned to drive (2.6% vs. 0.5%), or have
a fear of driving (2.9% vs. 0.5%). As with the previous question, male respondents were
more likely than females to report being able to communicate or conduct business online
(7.1% vs. 3.4%).

8
Table 4 Percentage of responses, by age group, for the question [Q5]:
“Are there any ADDITIONAL reasons you do not currently have a driver’s license?” (The most frequent response is shown in bold; percentages sum to more than 100 because
selection of more than one reason was allowed.)
Reason Age group
Total 18-19 20-29 30-39
*No additional reasons* 31.8 43.6 46.0 40.7 Able to get transportation from others 29.5 16.5 18.2 21.2 Owning and maintaining a vehicle is too expensive 15.6 22.3 20.9 19.7 Prefer to bike or walk 13.9 12.2 13.9 13.3 Too busy or not enough time to get a driver’s license 21.4 8.0 5.3 11.3 Prefer to use public transportation 8.1 8.0 8.0 8.0 Concerned about how driving impacts the environment 5.2 5.3 8.0 6.2
Able to communicate and/or conduct business online instead 3.5 3.2 7.5 4.7
Other reason 2.3 3.2 1.1 2.2 Never learned or still learning to drive 3.5 1.6 1.1 2.0 Do not like to drive/afraid to drive 2.3 3.7 0.0 2.0 Disability/medical/vision problem 0.0 2.1 1.6 1.3 Legal issue 0.0 0.0 0.5 0.2

9
Table 5 Percentage of responses, by gender, for the question [Q5]:
“Are there any ADDITIONAL reasons you do not currently have a driver’s license?” (The most frequent response is shown in bold; percentages sum to more than 100 because
selection of more than one reason was allowed.)
Reason Gender
Total Female Male
*No additional reasons* 39.9 41.6 40.7 Able to get transportation from others 23.0 17.8 21.2 Owning and maintaining a vehicle is too expensive 20.7 18.3 19.7 Prefer to bike or walk 13.2 13.7 13.3 Too busy or not enough time to get a driver’s license 12.9 8.6 11.3 Prefer to use public transportation 7.2 9.6 8.0 Concerned about how driving impacts the environment 5.2 8.1 6.2 Able to communicate and/or conduct business online instead 3.4 7.1 4.7
Other reason 3.2 0.5 2.2 Never learned or still learning to drive 2.6 0.5 2.0 Do not like to drive/afraid to drive 2.9 0.5 2.0 Disability/medical/vision problem 1.1 1.5 1.3 Legal issue 0.3 0.0 0.2

10
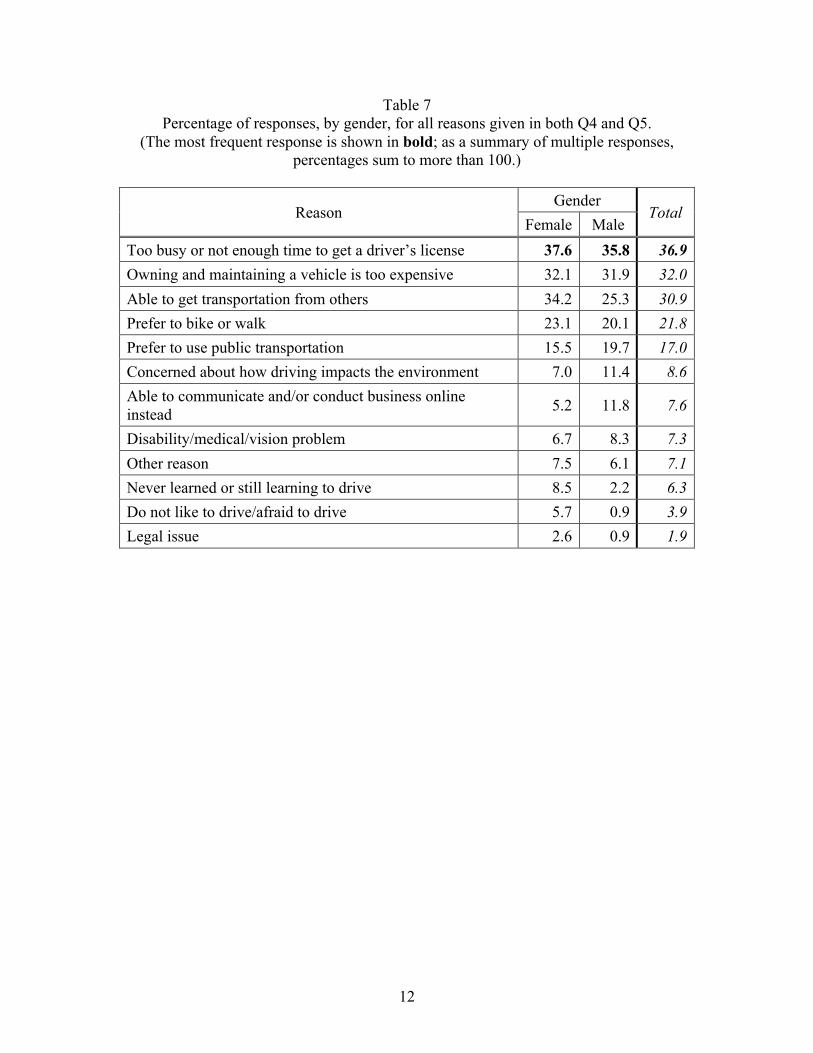
Combined summary of all reasons for not obtaining a driver’s license
Tables 6 and 7 present summaries of all reasons given by respondents for not
obtaining a driver’s license in Q4 (primary reason) and Q5 (all secondary reasons)
combined, by age and by gender, respectively. Because this is a summary of multiple
responses, the percentages add to more than 100. Paralleling the results for the primary
reason for not obtaining a license, the most common response was “too busy or not
enough time to get a driver’s license” (36.9% overall). The second most common
response related to the cost of owning and maintaining a vehicle (32.0%), followed by the
ability to get transportation from others (30.9%).
While “too busy or not enough time to get a driver’s license” was the most
common overall response, it was inversely related to age, with decreasing frequency as
age increased (from 56.6% for the youngest group to 21.4% for the oldest group).
Moreover, the most common response for the oldest age group was that owning and
maintaining a vehicle was too expensive (34.0%). The youngest age group was more
likely than the middle or older groups to say that they were able to get transportation
from others (40.4% vs. 24.8% and 28.2%, respectively). Conversely, the youngest group
was less likely to prefer the use of public transportation (9.6% vs. 20.1% and 20.9%).
Concern about the environment, ability to communicate or conduct business online,
medical problem or disability, and legal issues all increased in frequency as respondent
age increased. The frequency of respondents who had not yet learned to drive decreased
as age increased.
Female respondents were more likely than males to indicate that they were able to
get transportation from others (34.2% vs. 25.3%). Females were also more likely than
males to report that they have not yet learned to drive (8.5% vs. 2.2%), have a fear of
driving (5.7% vs. 0.9%), or have some legal issue preventing them from obtaining a
license (2.6% vs. 0.9%). Male respondents were more likely to report being able to
communicate or conduct business online (11.8% vs. 5.2%).

11
Table 6 Percentage of responses, by age group, for all reasons given in both Q4 and Q5.
(The most frequent response is shown in bold; as a summary of multiple responses, percentages sum to more than 100.)
Reason Age group
Total 18-19 20-29 30-39
Too busy or not enough time to get a driver’s license 56.6 33.6 21.4 36.9 Owning and maintaining a vehicle is too expensive 30.3 31.8 34.0 32.0 Able to get transportation from others 40.4 24.8 28.2 30.9 Prefer to bike or walk 24.2 19.6 21.8 21.8 Prefer to use public transportation 9.6 20.1 20.9 17.0 Concerned about how driving impacts the environment 5.6 7.9 12.1 8.6
Able to communicate and/or conduct business online instead 6.1 5.6 11.2 7.6
Disability/medical/vision problem 1.0 7.9 12.6 7.3 Other reason 7.1 10.7 3.4 7.1 Never learned or still learning to drive 7.6 7.9 3.4 6.3 Do not like to drive/afraid to drive 3.0 4.7 3.9 3.9 Legal issue 0.5 0.5 4.9 1.9
12
Table 7 Percentage of responses, by gender, for all reasons given in both Q4 and Q5.
(The most frequent response is shown in bold; as a summary of multiple responses, percentages sum to more than 100.)
Reason Gender
Total Female Male
Too busy or not enough time to get a driver’s license 37.6 35.8 36.9 Owning and maintaining a vehicle is too expensive 32.1 31.9 32.0 Able to get transportation from others 34.2 25.3 30.9 Prefer to bike or walk 23.1 20.1 21.8 Prefer to use public transportation 15.5 19.7 17.0 Concerned about how driving impacts the environment 7.0 11.4 8.6 Able to communicate and/or conduct business online instead 5.2 11.8 7.6
Disability/medical/vision problem 6.7 8.3 7.3 Other reason 7.5 6.1 7.1 Never learned or still learning to drive 8.5 2.2 6.3 Do not like to drive/afraid to drive 5.7 0.9 3.9 Legal issue 2.6 0.9 1.9

13
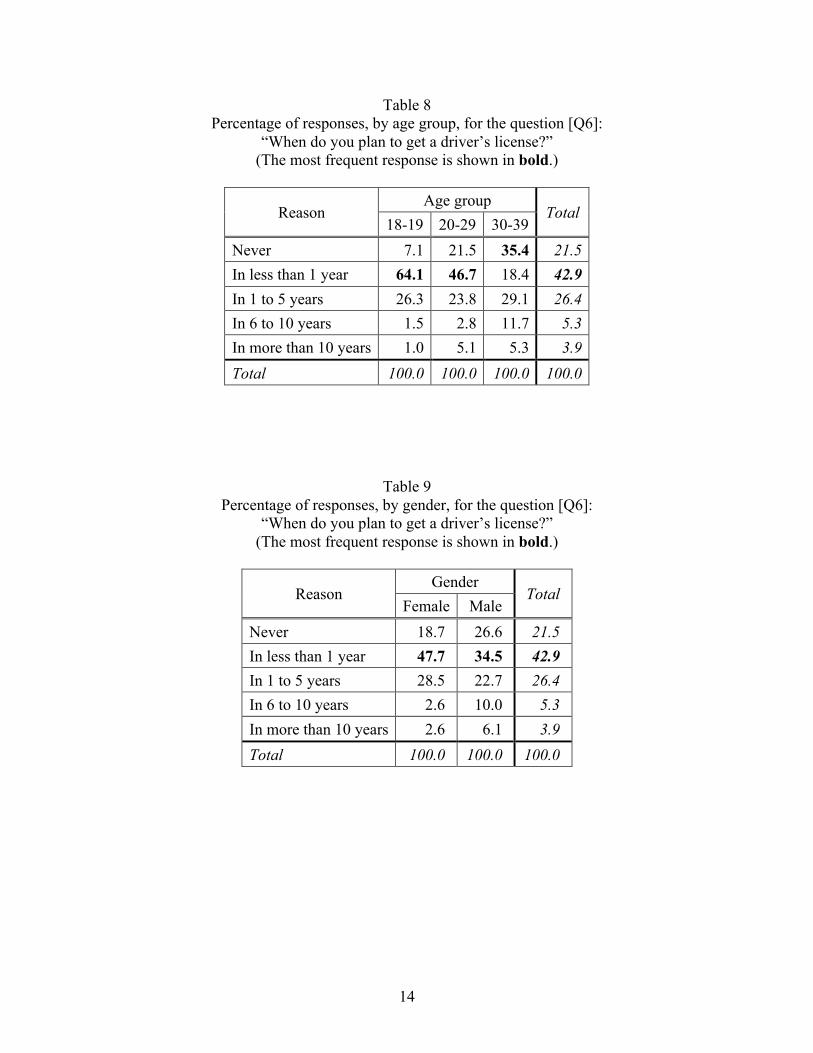
Future plans for obtaining a license
Respondents were asked: (Q6) “When do you plan to get a driver’s license?”
Overall, 21.5% said they plan on never getting a driver’s license. For those saying that
they will never get a driver’s license, the oldest age group was the most likely to give this
response (35.4%), with decreasing frequency as age decreased (21.5% and 7.1%,
respectively). Males were also more likely to say “never” than females (26.6% vs.
18.7%).
The majority of respondents said that they do have future plans for getting a
license (78.5%). For those who do plan to get a license, the youngest age group is the
most likely to say they will get one in the next five years (90.4%), with decreasing
frequency as age increased (70.5% and 47.5%, respectively); females were more likely
than males to respond in this range (76.2% vs. 57.2%). For more long-term plans, the
oldest group was the most likely to say six or more years (17.0%), with decreasing
frequency as age decreased (7.9% and 2.5%, respectively). It was more common for
males to say they planned to get a license in six or more years (16.1%) than it was for
females (5.2%).
14
Table 8 Percentage of responses, by age group, for the question [Q6]:
“When do you plan to get a driver’s license?” (The most frequent response is shown in bold.)
Reason Age group
Total 18-19 20-29 30-39
Never 7.1 21.5 35.4 21.5 In less than 1 year 64.1 46.7 18.4 42.9 In 1 to 5 years 26.3 23.8 29.1 26.4 In 6 to 10 years 1.5 2.8 11.7 5.3 In more than 10 years 1.0 5.1 5.3 3.9 Total 100.0 100.0 100.0 100.0
Table 9 Percentage of responses, by gender, for the question [Q6]:
“When do you plan to get a driver’s license?” (The most frequent response is shown in bold.)
Reason Gender
Total Female Male
Never 18.7 26.6 21.5 In less than 1 year 47.7 34.5 42.9 In 1 to 5 years 28.5 22.7 26.4 In 6 to 10 years 2.6 10.0 5.3 In more than 10 years 2.6 6.1 3.9 Total 100.0 100.0 100.0

15
Additional demographic results
Tables 10 through 14 present summaries of additional demographic information
for the respondents. The most common attributes for the young adults without a driver’s
license in this survey are as follows:
Most have never had a valid driver’s license (84.5%).
Most spouses or partners do have a valid driver’s license (65.9%).
– However, approximately half of respondents (46.4%) currently have no
spouse or partner.
High school graduate was the most frequent education level completed (36.6%).
Nearly half are currently unemployed (45.8%).
– When including full-time students, 66.4% are currently unemployed.
Most respondents spend from 1 to 4 hours per day online (49.0%).
Table 10 Percentage of respondents who have ever had a valid driver’s license.
(The most frequent response is shown in bold.)
Have you ever had a valid driver’s license? Percent
Yes 15.5 No 84.5 Total 100.0

16
Table 11 Percentage of respondents with a spouse, partner, or significant other
having a valid driver’s license. (The most frequent response is shown in bold.)
Does your spouse, partner, or significant other
currently have a valid driver’s license? Percent Applicable percent
Yes 35.3 65.9 No 18.3 34.1 Not applicable 46.4 - Total 100.0 100.0
Table 12 Highest level of education completed.
(The most frequent response is shown in bold.)
What is the highest level of education you have completed? Percent
Some high school 14.9 High school graduate 36.6 Some college 26.5 Associate degree 6.0 Bachelor degree 8.4 Graduate degree 7.6 Total 100.0

17
Table 13 Current level of employment.
(The most frequent response is shown in bold.)
What is your current level of employment? Percent
Full-time employment 18.8 Part-time employment 14.9 Full-time student (and not employed) 20.6 Not currently employed (including retired) 45.8 Total 100.0
Table 14 Hours per day spent online.
(The most frequent response is shown in bold.)
How many hours per day do you spend online communicating with friends and family or conducting business? Percent
0 hours 8.1 1 to 4 hours 49.0 5 to 8 hours 22.3 9 to 12 hours 12.5 13 to 16 hours 2.9 17 or more hours 5.2 Total 100.0

18
Discussion
Why do some young adults decide not to obtain a driver’s license?
Our survey examined both the primary and secondary reasons for not having a
driver’s license among young adults 18 through 39 years of age. Because the patterns of
the two sets of responses were similar, we will combine all reasons given in the
discussion below. The top eight reasons were as follows:
(1) Too busy or not enough time to get a driver’s license (36.9%)
(2) Owning and maintaining a vehicle is too expensive (32.0%)
(3) Able to get transportation from others (30.9%)
(4) Prefer to bike or walk (21.8%)
(5) Prefer to use public transportation (17.0%)
(6) Concerned about how driving impacts the environment (8.6%)
(7) Able to communicate and/or conduct business online instead (7.6%)
(8) Disability/medical/vision problems (7.3%)
Being too busy to obtain a license (#1 reason) is generally determined by an
individual’s personal priorities. The frequency of this response decreased as age
increased (56.6%, 33.6%, and 21.4%, respectively).
The #2 and #3 reasons for not obtaining a license (owning and maintaining a
vehicle is too expensive and able to get transportation from others) are generally
supported by the underlying demographics of the respondents. Specifically, when
compared with the general population 18 to 39 years old, respondents in this survey had
much higher levels of unemployment (45.8%; 66.4% when including full-
time/nonworking students), and a smaller proportion (22.0%) had completed an associate
degree or higher. For comparison, unemployment for the same age group in the U.S.
population is 10.5% (BLS, 2013), and 37.4% have completed an associate degree or
higher (U.S. Census Bureau, 2013a). The ability to get transportation from others is
likely aided by the fact that the majority (65.9%) of spouses or partners have a valid
driver’s license. (Though not measured in this study, it is likely that most parents of
younger adults living at home also possess valid driver’s licenses.)
The #4 and #5 reasons were prefer to bike or walk and prefer to use public
transportation. The importance of these reasons likely reflects the increased urbanization

19
of the U.S. population (U.S. Census Bureau, 2013b) and is indirectly influenced by the #6
reason (concerned about how driving impacts the environment). Overall, 8.6% of the
respondents selected concern about the environment as a reason, with the 30- to 39-year-
olds selecting this reason more frequently than the two younger groups (12.1% vs. 5.2%
and 5.3%). The youngest age group was more likely to be able to get transportation from
others than the other two age groups (40.4% vs. 24.8% and 28.2%), as were females in
comparison with males (34.2% vs. 25.3%).
The #7 reason—able to communicate and/or conduct business online instead—
was selected by 7.6% of all respondents, but by 11.2% of those between 30 and 39 years
of age. Male respondents were more likely to report being able to communicate or
conduct business online (11.8% vs. 5.2%).
In a regression performed on data from 15 countries (Sivak and Schoettle, 2012a),
we found that the number of Internet users per capita was inversely related to the
frequency of obtaining driver’s licenses among young persons. The results from the
current study suggest only a modest association between these two factors, given that
only 7.6% of respondents selected able to communicate and/or conduct business online
instead as a primary or secondary reason. Furthermore, it could be that high Internet
usage may be a consequence of not having a driver’s license and being unable to readily
drive whenever needed. (Daily Internet usage was relatively moderate for the
respondents in this study, with 49.0% reporting one to four hours per day of online
activity. At the two extremes, 20.6% of respondents reported nine or more hours of use
while 8.1% reported no use at all).
The #8 reason—disability/medical/vision problems—was selected by 7.3% of all
respondents, but by 12.6% of those between 30 and 39 years of age.

20
What are the long-term plans of young adults without a driver’s license?
Our results suggest that 21.5% of persons 18 through 39 years of age who
currently do not have a driver’s license plan to never get one. The corresponding
percentages for those aged 18 to 19, 20 to 29, and 30 to 39 are 7.1%, 21.5%, and 35.4%,
respectively. Male respondents were more likely to plan on never getting a license than
females (26.6% vs. 18.7%).
On the other hand, 69.3% of persons between 18 and 39 years of age who
currently do not have a driver’s license plan to get a license within the next five years.
The corresponding percentages for those aged 18 to 29, and 30 to 39 are 90.4%, 70.5%,
and 47.5%, respectively. Females are more likely than males to get a license within the
next five years (76.2% vs. 57.2%).
Driver’s license, education, and employment
This study found that young adults without a driver’s license—in comparison
with the general population of the same age—tend to have less education and higher
unemployment. However, the present study was not designed to investigate whether
there is a causal relationship between having a driver’s license on one hand and education
and employment on the other hand, or the direction of the effect if there were such a
relationship. Focus on these issues in future studies promises to be fruitful.

21
Conclusions
This survey examined why a substantial percentage of young adults currently do
not have a driver’s license, and the future plans of this group concerning obtaining a
license. The survey yielded useable responses from 618 persons aged 18 to 39 without a
driver’s license.
The top eight reasons (primary or secondary) for not having a driver’s license
were as follows: (1) too busy or not enough time to get a driver’s license (37%), (2)
owning and maintaining a vehicle is too expensive (32%), (3) able to get transportation
from others (31%), (4) prefer to bike or walk (22%), (5) prefer to use public
transportation (17%), (6) concerned about how driving impacts the environment (9%), (7)
able to communicate and/or conduct business online instead (8%), and (8)
disability/medical/vision problems (7%).
Of the respondents, 22% indicated that they plan on never getting a driver’s
license. On the other hand, 69% expect to get a driver’s license within the next five
years.
Young adults without a driver’s license—in comparison with the general
population of the same age—tend to have less education and higher unemployment.
However, the present study was not designed to investigate whether there is a causal
relationship, or the direction of the effect if there were such a relationship.

22
References BLS [Bureau of Labor Statistics]. (2013). Labor force statistics from the current
population survey: A-13. Employment status of the civilian noninstitutional
population by age, sex, and race. Available at:
http://www.bls.gov/web/empsit/cpseea13.htm
Davis, B. and Dutzik, T. (2012). Transportation and the New Generation: Why Young
People are Driving Less and What it Means for Transportation Policy. Frontier
Group and U.S. PIRG Education Fund. Available at:
http://www.frontiergroup.org/sites/default/files/reports/Transportation%20&%20t
he%20New%20Generation%20vUS.pdf
Sivak, M. and Schoettle, B. (2011). Recent changes in the age composition of U.S.
drivers: Implications for the extent, safety, and environmental consequences of
personal transportation. Traffic Injury Prevention, 12, 588-592.
Sivak, M. and Schoettle, B. (2012a). Recent changes in the age composition of drivers in
15 countries. Traffic Injury Prevention, 13, 126-132.
Sivak, M. and Schoettle, B. (2012b). Update: Percentage of young persons with a
driver’s license continues to drop. Traffic Injury Prevention, 13, 341.
Taylor, B.D., Ralph, K., Blumenberg, E., and Smart, M. (2013). Who knows about kids
these days? Analyzing the determinants of youth and adult mobility between 1990
and 2009. Paper presented at the 92nd Annual Meeting of the Transportation
Research Board, January 13-17, 2013, Washington, D.C.
U.S. Census Bureau (2013a). Current population survey, 2012 annual social and
economic supplement: Table 1. Educational attainment of the population 18
years and over, by age, sex, race, and Hispanic origin: 2012. Available at:
http://www.census.gov/hhes/socdemo/education/data/cps/2012/tables.html
U.S. Census Bureau. (2013b). Urban, urbanized area, urban cluster, and rural
population, 2010 and 2000: United States. Available at:
http://www.census.gov/geo/reference/ua/urban-rural-2010.html.
Williams, A.F. (2011). Teenagers’ licensing decisions and their views of licensing
policies: A national survey. Traffic Injury Prevention, 12, 312-319.

23
Appendix
Driver’s Licensing Survey (via SurveyMonkey) 1) Do you currently have a valid driver’s license?
Yes (including a suspended license) Thank respondent and exit survey No
2) What is your age?
18 19 20-24 25-29 30-34 35-39
3) Have you ever had a valid driver’s license?
Yes No
4) What is the MAIN reason you do not currently have a driver’s license? Please select ONLY ONE main reason.
Able to communicate and/or conduct business online instead Able to get transportation from others (friends, parents, etc.) Concerned about how driving impacts the environment Disability, medical problem, or vision problem Do not like to drive or afraid to drive Legal issue Never learned or still learning to drive Owning and maintaining a vehicle is too expensive Prefer to bike or walk Prefer to use public transportation (bus, train, taxi, etc.) Too busy or not enough time to get a driver’s license Other (please specify) ____________________

24
5) Are there any ADDITIONAL reasons you do not currently have a driver’s license? Select ALL additional reasons that apply.
No additional reasons Able to communicate and/or conduct business online instead Able to get transportation from others (friends, parents, etc.) Concerned about how driving impacts the environment Disability, medical problem, or vision problem Do not like to drive or afraid to drive Legal issue Never learned or still learning to drive Owning and maintaining a vehicle is too expensive Prefer to bike or walk Prefer to use public transportation (bus, train, taxi, etc.) Too busy or not enough time to get a driver’s license Other (please specify) ____________________
6) When do you plan to get a driver’s license? Please select your best estimate.
Never In less than 1 year In 1 to 5 years In 6 to 10 years In more than 10 years
7) Does your spouse, partner, or significant other currently have a valid driver’s license?
yes (including a suspended license) no not applicable (no spouse, partner, or significant other)
8) What is the highest level of education you have completed?
Some high school High school graduate Some college Associate degree Bachelor degree Graduate degree

25
9) How many hours per day do you spend online communicating with friends and family or conducting business? This includes email, chat, instant messaging, Facebook, Twitter, or any other social media or online communications. Please enter from 0 to 24 hours. 10) What is your current level of employment? Please select only ONE option that best describes you.
Full-time employment Part-time employment Not currently employed Retired Full-time student (and not employed)