Embed Size (px)
Citation preview

This is a repository copy of The real-time measurement of wear using ultrasonic reflectometry.
White Rose Research Online URL for this paper:http://eprints.whiterose.ac.uk/92649/
Version: Accepted Version
Article:
Brunskill, H., Harper, P. and Lewis, R. (2015) The real-time measurement of wear using ultrasonic reflectometry. WEAR, 332. 1129 - 1133. ISSN 0043-1648
https://doi.org/10.1016/j.wear.2015.02.049
Article available under the terms of the CC-BY-NC-ND licence (https://creativecommons.org/licenses/by-nc-nd/4.0/)
[email protected]://eprints.whiterose.ac.uk/
Reuse
Unless indicated otherwise, fulltext items are protected by copyright with all rights reserved. The copyright exception in section 29 of the Copyright, Designs and Patents Act 1988 allows the making of a single copy solely for the purpose of non-commercial research or private study within the limits of fair dealing. The publisher or other rights-holder may allow further reproduction and re-use of this version - refer to the White Rose Research Online record for this item. Where records identify the publisher as the copyright holder, users can verify any specific terms of use on the publisher’s website.
Takedown
If you consider content in White Rose Research Online to be in breach of UK law, please notify us by emailing [email protected] including the URL of the record and the reason for the withdrawal request.

The Real-Time Measurement of Wear using Ultrasonic Reflectometry
Henry Brunskill1)*, P. Harper1) and Roger Lewis2)
1) Tribosonics Ltd. Sheffield, South View Cres, S7 1DH, United Kingdom 2) Department of Mechanical Engineering, The University of Sheffield,
Mappin Street, S1 3JD, Sheffield, United Kingdom *Corresponding author: [email protected]
Abstract Ultrasonic reflectometry is commonly used in the fields of NDT for crack detection, wall thickness monitoring and medical imaging. A sound wave is emitted through the material using a piezoelectric transducer. This waveform travels through the host medium at a constant speed and is either partially or fully reflected at an interface. The reflected wave is picked up by the same sensor; the signal is then amplified and digitized. If the speed that sound travels through a host medium is known as well as the time this takes, the thickness of the material can be established using the speed, distance and time relationship. Previous work has concluded that the ultrasonic method is too inaccurate to measure wear due to the errors caused by temperature, vibration and the experimental arrangement. This body of work looks at methods to minimise these errors, particularly the inaccuracies introduced from the change in temperature caused by change of acoustic velocity and the thermal expansion of the material, which can be significant in many applications. Numerous case studies are presented using the technique in both laboratory and industrial environments using low cost retro-fittable sensors and small form electronics. Keywords: wear measurement; ultrasound 1. Introduction The understanding of wear behaviour is paramount to material selection and machine element design. It is difficult to predict in-situ wear behavior due to the large number of influential parameters. The traditional method of understanding these behaviours is to conduct laboratory based experiments with similar materials and representative contact conditions. The understanding of wear behaviour is paramount to material selection and machine element design. A common method to build up an understanding of wear behaviour is to conduct laboratory based experiments with similar materials and representative contact conditions. Analysis of wear then takes place post experiment. The traditional method of quantifying wear is the mass-loss measurement, the procedure of measuring the mass before and after the test and reporting the overall mass removed. This method has been successfully used for many applications, although not always feasible when material transfer takes place or when testing porous materials in lubricated environments. Another post-test measurement method is surface profilometry. This is the procedure of ‘measuring the surface of a material’, usually using optical or stylus based method. These tools are very useful to characterise surface detail and deep grooves, but cannot measure wear of some geometries such as a cylindrical pin, as the entire contacting face will wear down with no datum point for reference. In some cases, i.e., wear on a ball; it is possible to estimate wear from geometrical wear scars. The drawback is that none of these methods actually give a value for wear rate, only absolute wear post-test. It is possible to intermittently halt the test, remove specimen and take measurements, but

2
this can interfere with the experiment. Eddy current, linear potentiometers and laser displacement sensors are all devices that are used to measure position and displacement. By mounting a sensor on a fixed position measuring the displacement of the moving wearing component, it is possible measure a change in component thickness and thus infer a measurement of wear. Some tribometers have this feature fitted as standard or as an optional extra, for example the Plint TE99 Universal Wear Testing machine has the option of having a transducer to measure the vertical movement of the pin relative to the fixed datum during the test. In the product literature, this is described as ‘giving an indication of wear’, but factors such as to thermal expansion, wear debris and the transfer of material can also result in some displacement. These displacement systems measure the position of the specimens and from which infer the net wear of both components. Ultrasound has been trialed as a tool for measuring thickness change to understand wear evolution. However, as noted by Birring and Kwun, the method is possibly too inaccurate because of errors caused by temperature, vibration and the experimental arrangement [3]. The aim of this work was to investigate ultrasonic measurement of wear in order to develop a methodology able to overcome the previous issues, as potentially ultrasound can provide improvements over other available techniques if these can be remedied. 2. Theory Ultrasonic reflectometry is commonly used in the fields of NDT for crack detection, wall thickness monitoring and medical imaging. A sound wave is emitted through the material using a piezoelectric transducer. This waveform travels through the host medium at a constant speed and is either partially or fully reflected at an interface. The reflected wave is sensed by the same piezo sensor which generates a low voltage electrical signal proportional to the magnitude of the pressure wave. The signal is then amplified and digitised. A typical time domain plot, known as an A-scan, can be seen in Figure 3. The first feature on the time-domain plot is known as the ‘initial bang’. This is the digital signature of the excitation pulse picked up by the receiver. The sound wave then travels through a solid medium at a constant velocity. If it reaches an area of differing density (such as a solid-air interface), the wave is partially reflected and partially transferred according to the acoustic impedance of the material. With a solid-air interface, it can be assumed that 100% of the pressure wave is reflected. The reflected wave is then detected by the same sensor. A result of this is an electrical pulse that can be seen in the time-domain A-scan. If the speed that sound travels through a host medium is known (a material property) as well as the time taken (or time-of-flight), the thickness of the material can be established using the speed, distance and time relationship. This method is commonly used in ultrasonic thickness gauging. Wear is defined as the removal and deformation of a material on a surface from a mechanical action of the opposite surface [1]. Therefore that by accurately measuring the change in thickness of a material, a measurement of wear can be directly inferred. This work investigates the use of ultrasound as a measurement tool to achieve this. This body of work looks at methods to minimise the error in the measurement, particularly the inaccuracies introduced from the change in temperature of the material, which can be significant in many applications. This is more of an issue when continuous measurements are being taken with fluctuating temperature and less of an issue for a single measurement such as those taken using traditional ultrasonic thickness gauges.

A solution is proposed to account for thermal expansion using a reference measurement that changes with temperature. This allows a comparison to be drawn resulting in a more accurate absolute wear measurement. Furthermore, a frequency based method is introduced that allows for the errors from temperatures to be reduced further.
There are numerous ways to extract time information from an A-Scan. The analogue sing-around and pulse-overlap methods have been traditionally used with varying degrees of success; more information can be found in Mason & Thurston [2]. With digitised waveforms, a number of options are available to calculate the time-of-flight. The zero-crossing time-of-flight cross correlation measurement is evaluated as the distance between the zero crossing points of two successive echoes. A few data points either side of the zero crossing point are fitted by a linear function, then the zero crossing point is calculated as the intersection of the linear function and the horizontal zero line. This increases measurement accuracy as it is not as dependent on the digitising clock speed.
With this method, it is important to capture at least two consecutive reflections and use the distance between the two reflections to calculate the time-of-flight. It is important to use the same zero crossing point in each reflection. It is not suitable to use the excitation pulse or ‘initial bang’ because the waveform is not of similar shape. In many ultrasonic applications, the same transducer that generates the sound-wave also receives the signal after it is reflected from an interface, this is known as pulse-echo mode. If this is the case, it is vital to remember that the time-of-flight refers to the path of material in which the ultrasound travels which is twice the thickness of the material so the sound has to travel there and back. 3. Experimental Details It was necessary to create a situation where a component experiences wear in a controlled manner in order to compare the ultrasonic method to other wear measurement methods. In doing so, attempts were made to validate the method and develop an understanding of the strengths, weaknesses, accuracies and errors involved. A simple sliding configuration was used as it is a common dynamic wearing tribosystem. It is one of the most common tribometers used due to its simple geometry and the large amount of control over the testing parameters. The Eyre/BICERI universal wear testing machine, now known as the Cameron Plint GE99, was employed for this series of tests in the pin-on-disk configuration. A photograph of the equipment can be seen in Figure 1.
Figure 1. GE99 pin-on-disk wear tester
Coaxial cable
Thermocouple cable
LVDT
Rotating disk
Instrumented pin

4
The pin specimen was made from 10.8mm diameter 1050A aluminium. This material was chosen as it is particularly effective in transmitting sound waves without creating internal reflections from grain boundaries and voids. A slot was cut in the top of the pins and a 2mm x 7mm 10MHz ultrasonic sensor and thermocouple were bonded to the surface. This was then back filled with a high temperature potting compound to dampen the signal and protect the sensors. A diagram showing the dimensions of the pin specimen and the path of the sound wave can be seen in Figure 2. A notch was cut in the side of the pin that partially covered the path of the ultrasonic wave to introduce a reference reflection into the A-scan which could be used to account for changes in thickness of the pin specimen due to thermal expansion. The reference reflection from the notch and back wall (wear face) reflection have been labelled (a) and (b) in Figure 3 and the features that cause the reflections in the pin have been labelled the same in Figure 2. Both the reference reflection and the wear face reflection will move in time due to temperature effects, but only the wear face reflection will move as a result of material removal.
Figure 2. Instrumented pin specimen
Figure 3. A-scan from the instrumented aluminium pin
The 100mm diameter rotating disk specimen was made from AISI 01 tool steel with a ground surface finish, Ra of 0.4µm. A substantial wear rate would be expected from this material combination. The disk was rotated at 60rpm and 120rpm with the pin in contact at a radius of 40mm resulting in sliding speeds of 0.25 m/s and 0.5m/s respectively. A fixed load of 5kg was applied at the end of the loading arm with a resultant contact pressure of 1.15MPa.
Pin Specimen
Ultrasonic Transducer
Reference notch (a)
(b)
Path of sound wave
Excitation pulse
Reference reflection
Back wall (wear face) reflection
(a)
(b)

Displacement measurements were taken using an LDVT, which measures the combined wear of the pin and the disk, along with deflections in the beam and thermal expansion effects of the assembly. The temperature from the thermocouple in the head of the pin was logged, along with test time and ultrasonic data. Mass and pin length measurements were taken at 30 minute intervals using Sartorius BP 210 D precision scales and a pair of CD-15CPX Mitutoyo digital vernier calipers. The ultrasonic measurements were taken using a Tribosonics Ltd. FMS100 PC based ultrasonic pulser-receiver-digitising system. The sensor was driven with a -100V square wave pulse with a width of 120nS. The pulse repetition rate was 2kHz. The reflected signal was amplified by 6dB. The time of flight (ToF) measurement points were taken from the first downward zero crossing interval after the initial rising edge. The speed of sound, c, in this aluminium is 6404m/s. The time gap, t, between the excitation pulse and the reference reflection is 1.87µs therefore the distance, d, that the sound wave travelled from the sensor to the back wall and back to the sensor can be calculated as follows:
mectd 012.0640487.1 6 (1) As the sound wave travelled both up and down the pin, the distance should be halved to relate to length of the pin, resulting in a distance of 6mm. 4. Experimental Results A 30min 1800 cycle test with a sliding speed of 0.25m/s was run and the temperature and reference reflection time of flight plot can be seen Figure 4 below. The plot also shows the cooling down of the pin after the test.
Figure 4. Temperature and ToF plots for an 1800 cycle test It can be seen that the change in time-of-flight due to thermal effects of the material clearly detectable from the reference ToF plot. Figure 4 shows a maximum change in the time of flight of 12 nS due to temperature effects alone as a combination of thermal expansion and change in acoustic velocity.
6
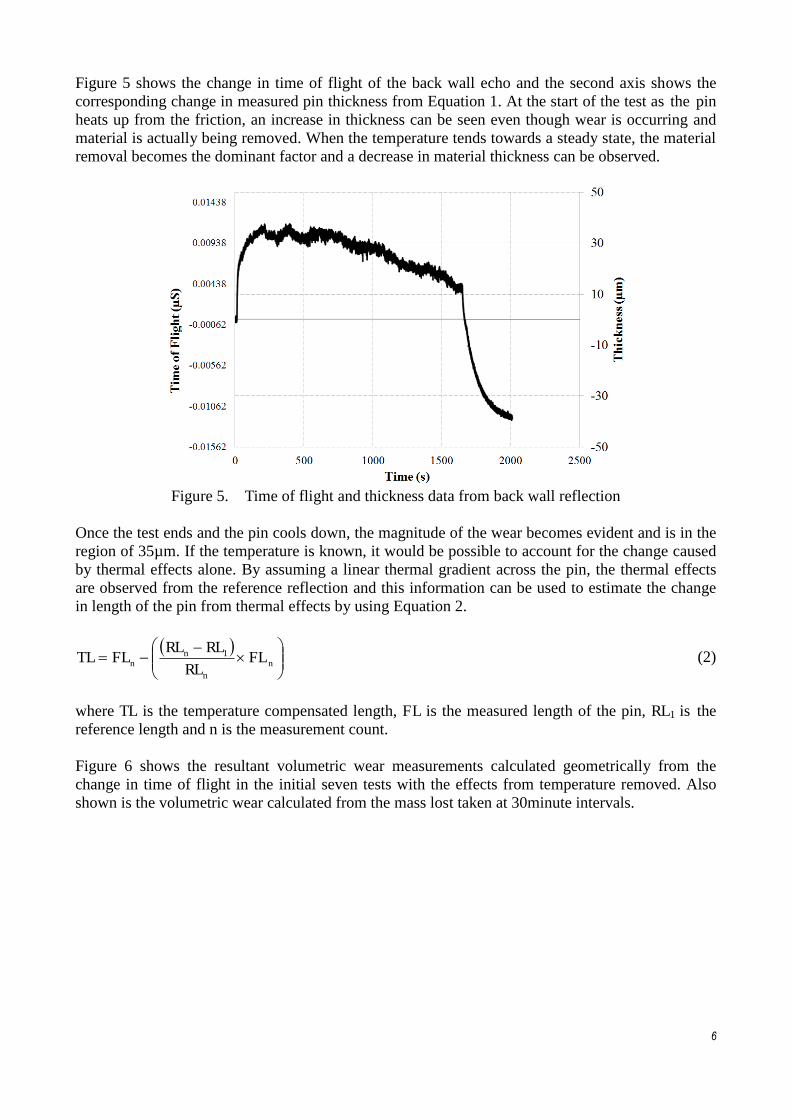
Figure 5 shows the change in time of flight of the back wall echo and the second axis shows the corresponding change in measured pin thickness from Equation 1. At the start of the test as the pin heats up from the friction, an increase in thickness can be seen even though wear is occurring and material is actually being removed. When the temperature tends towards a steady state, the material removal becomes the dominant factor and a decrease in material thickness can be observed.
Figure 5. Time of flight and thickness data from back wall reflection
Once the test ends and the pin cools down, the magnitude of the wear becomes evident and is in the region of 35µm. If the temperature is known, it would be possible to account for the change caused by thermal effects alone. By assuming a linear thermal gradient across the pin, the thermal effects are observed from the reference reflection and this information can be used to estimate the change in length of the pin from thermal effects by using Equation 2.
n
n
nn FL
RL
RLRLFLTL 1 (2)
where TL is the temperature compensated length, FL is the measured length of the pin, RL1 is the reference length and n is the measurement count. Figure 6 shows the resultant volumetric wear measurements calculated geometrically from the change in time of flight in the initial seven tests with the effects from temperature removed. Also shown is the volumetric wear calculated from the mass lost taken at 30minute intervals.

Figure 6. Volumetric wear from the ultrasonic measurements and the mass lost
It was noticed in this test that the pin was not sliding horizontally on the disk, resulting in an angle wedge forming at the wear face. This pin was then re-mounted at 2300m which resulted in no wear being measured due to the requirement of a parallel reflector face. The test was repeated with a sliding speed of 0.5m/s. LVDT and digital caliper measurements were also taken during the test. The results can be seen in figure 7. The LVDT went out of range after 2700m.
Figure 7. Volumetric wear from mass lost, calipers, LVDT and ultrasonic (UT) measurement
8
5. Wear Measurement from Frequency Feature As the back wall reflection tends towards the reference waveform due to material removal, the errors due to thermal expansion reduce considerably. In order to confidently measure small amounts of wear, it was concluded that a reference reflection should be created near the running surface. As the distance between the two waveforms become smaller, i.e., in the order of one wavelength, it becomes impossible to differentiate the two using the zero crossing method. Another method was required to differentiate the two signals. If a fast Fourier transform (FFT) is performed on both reflections, the waveforms constructively and destructively interfere with one another resulting in dips forming in the frequency domain plot at certain frequencies. These dips are a function of the distance between the two waveforms, h, and can be described by Equation 3.
f
cmh
2 (3)
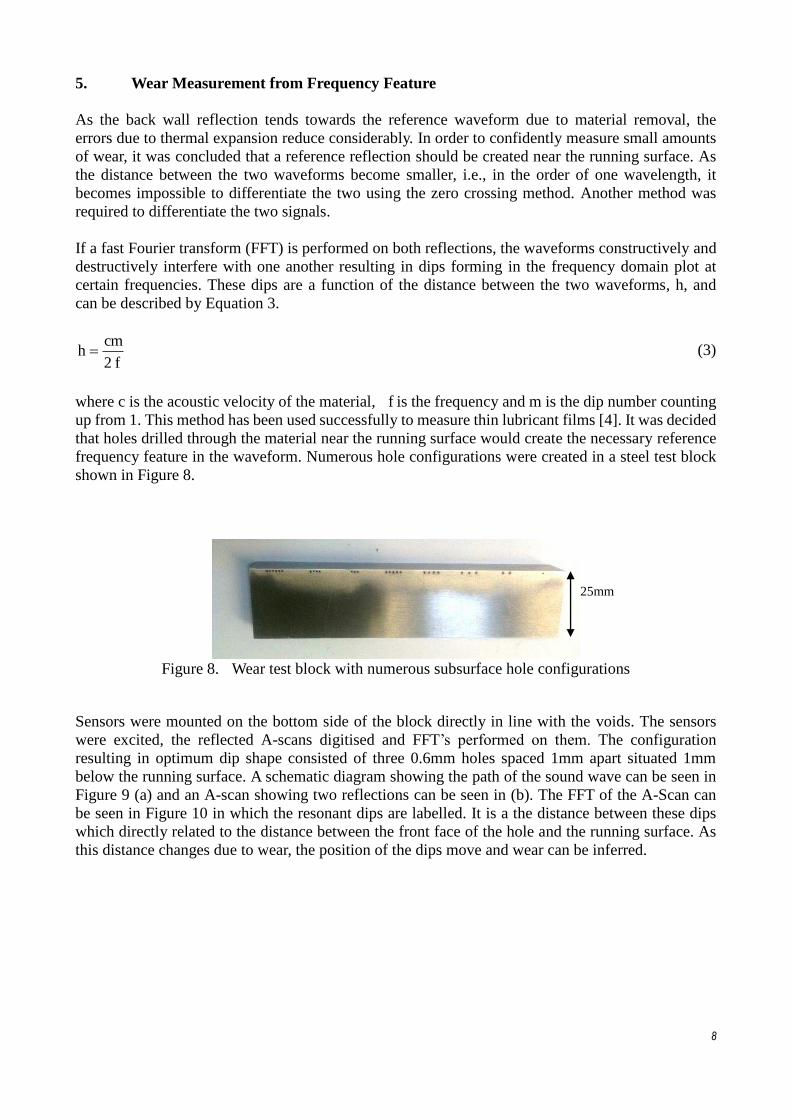
where c is the acoustic velocity of the material, f is the frequency and m is the dip number counting up from 1. This method has been used successfully to measure thin lubricant films [4]. It was decided that holes drilled through the material near the running surface would create the necessary reference frequency feature in the waveform. Numerous hole configurations were created in a steel test block shown in Figure 8.
Figure 8. Wear test block with numerous subsurface hole configurations
Sensors were mounted on the bottom side of the block directly in line with the voids. The sensors were excited, the reflected A-scans digitised and FFT’s performed on them. The configuration resulting in optimum dip shape consisted of three 0.6mm holes spaced 1mm apart situated 1mm below the running surface. A schematic diagram showing the path of the sound wave can be seen in Figure 9 (a) and an A-scan showing two reflections can be seen in (b). The FFT of the A-Scan can be seen in Figure 10 in which the resonant dips are labelled. It is a the distance between these dips which directly related to the distance between the front face of the hole and the running surface. As this distance changes due to wear, the position of the dips move and wear can be inferred.
25mm

Figure 9. A-scan produced from three 0.6mm holes spaced 1mm apart situated 1mm below the running surface
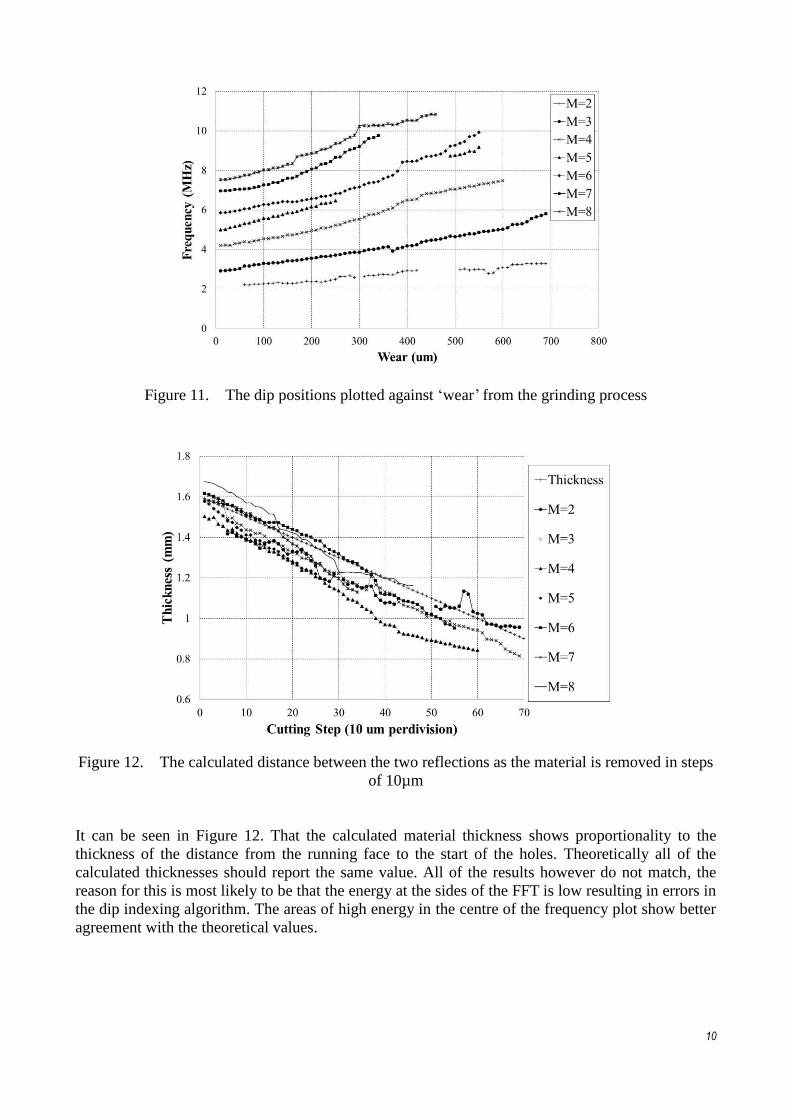
Figure 10. Frequency plot showing the dips resulting from the frequency feature The block was mounted on a surface grinder. A cut of 10µm was applied to the running face and the reflected sound wave recorded. This process was repeated until the holes appeared on the running face. The positions of the dip peaks in terms of frequency have been plotted in Figure 11. Figure 12 shows the distance between the two waveforms calculated from Equation (3) using the dip numbers shown in the legend. From this, wear can be calculated with minimum influence from changes in temperature.
Dips from frequency feature
Sensor
Hole
Solid-Air (Running) Interface
t2 t1
t1
t2
(a) (b)
Time Domain Plot
10
Figure 11. The dip positions plotted against ‘wear’ from the grinding process
Figure 12. The calculated distance between the two reflections as the material is removed in steps
of 10µm It can be seen in Figure 12. That the calculated material thickness shows proportionality to the thickness of the distance from the running face to the start of the holes. Theoretically all of the calculated thicknesses should report the same value. All of the results however do not match, the reason for this is most likely to be that the energy at the sides of the FFT is low resulting in errors in the dip indexing algorithm. The areas of high energy in the centre of the frequency plot show better agreement with the theoretical values.

6. Discussion and Conclusions Drawbacks in the initial measurement method are introduced from temperature effects in the form of thermal expansion and variations in the acoustic velocity of the material. Introducing a reference reflection can reduce this error, but various assumptions have been made such as a linear temperature gradient across the pin. Using a more realistic exponential thermal gradient would yield more accurate results. Variations can be seen between the different measurement techniques. The mass lost measurement does not consider displaced material on the pin, resulting in an under estimation of wear volume. For the aluminium and steel combination, this was a considerable effect. The thickness measurements using the digital calipers measures the thickest part of the pin and the ultrasonic measurements measure the average pin thickness over the sensor aperture. The LVDT is a traditional real-time wear measurement system, but the accuracy of the results is highly dependent on the experimental set-up. During the test, some material was transferred to the disk in which would result in an underestimation of pin wear volume as this would reduce the measured displacement. It is difficult to draw direct comparison as each method is measuring something different. This work has proven that the resonant dip technique can be applied to measure the thickness of a very small part of a wearing component. By placing a reflector feature near the running face, the method can measure the distance between the feature and the wear face. As this distance changes due to the wear, the thickness changes and this can be measured and monitored to provide a real-time measurement. As the part of the component that is measured is so small (>2 mm), the effect that temperature has over the entire component is negligible. The ultrasonic method has been proven to be capable of measuring material thickness in a dynamic wearing environment. If the temperature of the component was known, simple temperature compensation could be applied as the changes in acoustic velocity could be accounted for. If the component was at constant temperature, the measurement would be simplified further. Using modern, low cost, permanently embedded sensors, the measurement becomes very robust with the ability to measure changes in material thickness to sub-micron accuracy with an acquisition speed of up to 100KHz. Modern ultrasonic hardware can be acquired for around $1000 meaning this is a commercially viable method for monitoring material thickness and therefore wear. References [1] Rabinowicz, E. “Friction and Wear of Materials”, 1995, John Wiley and Sons.
[2] Mason, W, P. & Thurston, R, N. (1976) Physical Acoustics (XII). Waltham, MA, USA: Acedemic Press Inc.
[3] A. S, Birring, A. S, and Kwun, H., “Ultrasonic measurement of wear”, Tribology International, Vol. 22, No. 1, 1989, pp33-37.
[4] R.S. Dwyer-Joyce, “The application of ultrasonic NDT techniques in tribology”, Proc. IMechE Part J: J. Engineering Tribology, Vol. 219, 2005, pp 347-366.