Embed Size (px)
Citation preview
NBER WORKING PAPER SERIES
THE REAL EFFECTS OF FINANCIAL CONSTRAINTS:EVIDENCE FROM A FINANCIAL CRISIS
Murillo CampelloJohn Graham
Campbell R. Harvey
Working Paper 15552http://www.nber.org/papers/w15552
NATIONAL BUREAU OF ECONOMIC RESEARCH1050 Massachusetts Avenue
Cambridge, MA 02138December 2009
We thank Steve Kaplan, Jeremy Stein, and Luigi Zingales for suggesting questions that we includedin the survey instrument. Comments from seminar participants at the Chicago/London Conferenceon Financial Markets, SBFin Conference, BG Investments, Northwestern University, and the Universityof Amsterdam are also appreciated. We thank CFO magazine for helping us conduct the survey, thoughwe note that our analysis and conclusions do not necessarily reflect those of CFO. We thank AndrewFrankel for his helpful comments on the first draft of the paper. The views expressed herein are thoseof the author(s) and do not necessarily reflect the views of the National Bureau of Economic Research.
NBER working papers are circulated for discussion and comment purposes. They have not been peer-reviewed or been subject to the review by the NBER Board of Directors that accompanies officialNBER publications.
© 2009 by Murillo Campello, John Graham, and Campbell R. Harvey. All rights reserved. Short sectionsof text, not to exceed two paragraphs, may be quoted without explicit permission provided that fullcredit, including © notice, is given to the source.
The Real Effects of Financial Constraints: Evidence from a Financial CrisisMurillo Campello, John Graham, and Campbell R. HarveyNBER Working Paper No. 15552December 2009JEL No. G01,G31
ABSTRACT
We survey 1,050 CFOs in the U.S., Europe, and Asia to assess whether their firms are credit constrainedduring the global credit crisis of 2008. We study whether corporate spending plans differ conditionalon this measure of financial constraint. Our evidence indicates that constrained firms planned deepercuts in tech spending, employment, and capital spending. Constrained firms also burned through morecash, drew more heavily on lines of credit for fear banks would restrict access in the future, and soldmore assets to fund their operations. We also find that the inability to borrow externally causes manyfirms to bypass attractive investment opportunities, with 86% of constrained U.S. CFOs saying theirinvestment in attractive projects was restricted during the credit crisis of 2008. More than half of therespondents say they will cancel or postpone their planned investment. Our results also hold in Europeand Asia, and in many cases are stronger in those economies.
Murillo CampelloUniversity of Illinois4039 BIF515 East Gregory Drive, MC- 520Champaign, IL 61820and [email protected]
John GrahamDuke UniversityFuqua School of BusinessOne Towerview DriveDurham, NC 27708-0120and [email protected]
Campbell R. HarveyFuqua School of BusinessDuke UniversityDurham, NC 27708-0120and [email protected]
1 Introduction
In the fall of 2008, world �nancial markets were in the midst of a credit crisis of historic breadth
and depth. In this paper, we provide a unique perspective on the impact of the crisis on the real
decisions made by corporations around the world. While the crisis is dramatic and unfortunate, it
provides an opportunity to study how �nancial constraints impact corporate behavior.
We survey 1,050 chief �nancial o¢ cers (CFOs) in 39 countries in North America, Europe, and
Asia in December 2008. The crisis environment allows us to contrast the actions of �rms that are
� or claim to be � �nancially constrained with those that are less constrained. We pursue several
objectives. First, we develop a survey-based measure of �nancial constraint. As do previous papers,
we �nd that constrained �rms in our sample tend so be smaller, private, speculative grade, less
pro�table, less likely to pay dividends, and with slightly lower growth prospects than �rms that are
unconstrained. We then study whether this constraint measure identi�es meaningful cross-sectional
variation in corporate behavior during the crisis. Our analysis starts out by considering how compa-
nies�plans (employment, marketing, technology spending, etc.) are a¤ected by the crisis conditional
on constraint status. We then look at companies��nancial policies (in particular, cash savings and
line of credit management). Finally, we examine corporate spending during the crisis, investigating
circumstances in which �rms� investment policies are altered due to credit constraints (including
outright investment cancellation and asset sales).
Most previous research on �nancial constraints is based on �nancial statement data �led by U.S.
public companies. The existing papers typically investigate the impact of constraints on investment
policy, examining whether investment at constrained �rms is tied more closely to cash �ows.1 With
the exception of Kaplan and Zingales (1997), who look at CEOs�statements about their �rms�access
to credit, papers in this literature customarily proxy for �nancial constraint with characteristics like
small �rm size, nondividend paying status, or poor credit ratings, all of which are gathered from
standard archival sources. One distinguishing feature of our analysis is that we directly ask managers
whether their �rms are �nancially constrained. In particular, preserving the managers�anonymity,
we inquire whether their companies� operations have been a¤ected by the cost or availability of
credit. Our sample includes both public and private companies from around the globe.
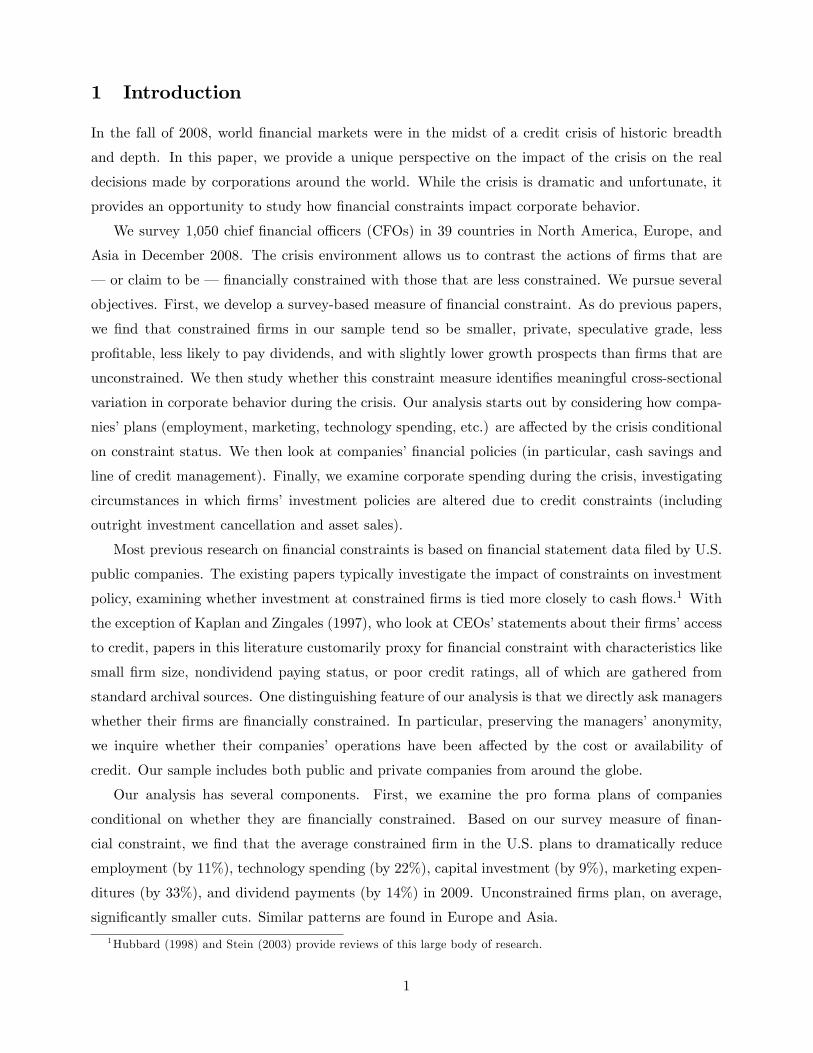
Our analysis has several components. First, we examine the pro forma plans of companies
conditional on whether they are �nancially constrained. Based on our survey measure of �nan-
cial constraint, we �nd that the average constrained �rm in the U.S. plans to dramatically reduce
employment (by 11%), technology spending (by 22%), capital investment (by 9%), marketing expen-
ditures (by 33%), and dividend payments (by 14%) in 2009. Unconstrained �rms plan, on average,
signi�cantly smaller cuts. Similar patterns are found in Europe and Asia.
1Hubbard (1998) and Stein (2003) provide reviews of this large body of research.
1
We recognize that the responses of the �average� constrained and unconstrained �rms in our
survey may confound various factors and conduct our tests using the Abadie and Imbens (2002) and
Dehejia and Wahba (2002) matching estimators. We match �rms based on size, ownership form,
credit rating, pro�tability, dividend payout status, growth prospects, and industry classi�cation, and
then contrast the behavior of �rms that di¤er in the degree to which they say they have access to
credit. Although not bullet-proof, this category-by-category matching approach pushes our tests
closer to a setting in which one compares the impact of the crisis on �rms that face more pronounced
�nancial constraints with that of �counterfactual��rms that are less constrained.
The matching analysis points to signi�cant cross-sectional variation in every corporate policy
we study both prior to and during the 2008 crisis, with di¤erences between constrained and uncon-
strained �rms becoming more signi�cant as the credit crisis unfolds. Traditional constraint measures,
in contrast, fail to identify any economically meaningful cross-sectional or time series patterns in
corporate policies in our sample. Since the ability to identify those �rms most vulnerable to credit
supply shocks is of relevance for researchers and policy-makers, we believe that direct measures of
constraints such as the one we study � similarly to Kaplan and Zingales (1997) � add to the
portfolio of approaches that can be used to understand the impact of credit market imperfections.
Survey-based analyses have limitations that we clarify up front (see also Section 2). One concern
is whether some CFOs simply �perceive�credit to be scarce and invest less anticipating a demand
contraction in the crisis. While we cannot ultimately rule out a �state of mind� story that could
somehow a¤ect some CFOs and not others, we verify that �rms which say they are constrained also
report tangible �nancing di¢ culties. For example, 81% of the CFOs that we categorize as �nancially
constrained say they have experienced credit rationing (quantity constraint) in the capital markets,
59% complain about higher cost of borrowing (price constraint), and 55% cite di¢ culties in initiating
or renewing a credit line. A related concern is that CFOs by themselves may not be able to separate
economic from �nancial e¤ects when responding to a survey. Admittedly, survey-based inferences
will be compromised if CFOs misjudge the economic conditions of their �rms and misunderstand the
way credit markets respond � a possibility that we cannot rule out. In this situation, one can still
observe corporate planning during a crisis; however, it would not be possible to separate the e¤ects
of �nancial constraints from those stemming from the general economic slowdown.
Yet another concern is whether uncontrolled �rm heterogeneity could confound our inferences.
Consider, for example, a �rm that performs poorly even before the crisis. It would not be surprising
to �nd that this �rm might both do worse during the crisis (e.g., invest less) and �nd less available
credit. In our matching estimator approach, we pair-up constrained and unconstrained companies
facing similar economic circumstances (e.g., credit ratings, pro�tability, and industry), making it
less likely that explanations related to �nancial distress or declining economic fundamentals could
2
explain away these �ndings. Unfortunately, however, it is impossible to completely eliminate the
possibility that these stories do a¤ect our results.
Our second area of analysis is related to liquidity management, in particular cash management
and line of credit policy. Recent work by Lins et al. (2009) indicates that CFOs think of choices
about cash and lines of credit as interconnected decisions. We start by documenting that the typ-
ical �rm in the U.S. sample had cash and marketable securities equal to about 15% of total assets
in 2007. Unconstrained �rms are able to maintain this level of cash balances into late fall 2008.
However, constrained �rms burn through about one-�fth of their liquid assets over these months,
ending the year with liquid assets equal to about 12% of asset value. The same pattern of cash burn
for constrained �rms is found in Europe and Asia. The evidence is consistent with the view that
�nancially constrained �rms build cash reserves to insulate themselves from credit supply shocks.
We also study lines of credit. The typical U.S. �rm has a pre-arranged credit line of approxi-
mately 19% (unconstrained �rms) to 26% (constrained �rms) of book asset value. We ask CFOs
what they do with the proceeds they draw from lines of credit. About half of the �rms around the
world use those funds for daily operations or short-term liquidity needs. In addition, 13% of con-
strained U.S. �rms indicate that they draw on their credit line now, in order to have cash for future
needs. Another 17% of constrained U.S. �rms draw their credit down now just in case their banks
might deny them credit in the future, compared to less than 6% of unconstrained who do so. This
result is consistent with the evidence in Ivashina and Scharfstein (2009), who argue that much of the
robust bank borrowing observed in 2008 was due to �just in case�draw downs on credit lines. Our
analysis adds to their �ndings by documenting that constrained �rms are signi�cantly more likely
(than unconstrained �rms) to draw down in anticipation of banks restricting credit in the future.
Our third set of analyses examines the impact of credit conditions on corporate investment de-
cisions. In this investigation, we speci�cally ask �rms if they bypass attractive investment projects
because of �nancial constraints. During the �nancial crisis, 86% of constrained U.S. �rms said that
they bypassed attractive investments due to di¢ culties in raising external �nance, compared to 44%
of unconstrained �rms that say the same. These numbers are mirrored in Europe and Asia.
We also examine how �rms �nance attractive investments when they are unable to borrow. More
than half of U.S. �rms say that they rely on internally generated cash �ows to fund investment under
these circumstances, and about four in ten say that they use cash reserves. Notably, 56% of con-
strained U.S. �rms say that they cancel investment projects when they are unable to obtain external
funds, signi�cantly greater than the 31% of unconstrained �rms that may cancel investment. We
�nd largely similar patterns in Europe and in Asia.
Not only is investment cancelled due to tight credit markets, some �rms sell assets to obtain cash.
We �nd that the vast majority of �nancially constrained �rms sold assets in order to fund operations
3
in 2008, while unconstrained �rms show no signi�cant propensity to sell assets. Asset sales were also
used to obtain funds in Europe and Asia. These �ndings suggest that �nancial constraints may have
signi�cant e¤ects on real asset markets.
Taken literally, one interpretation of our results would be that credit conditions led constrained
�rms to cut investment in suboptimal ways. Another interpretation that one can not rule out, how-
ever, is that the �rms that are cutting investment the most during the crisis are those that were
overinvesting before it. In other words, the reduction in investment that we observe need not be
suboptimal. In fact, the q-theory of investment would suggest that those �rms with worst investment
opportunities during the crisis should cut investment the most. While the di¢ culties of empirically
measuring investment opportunities are well-known, one could argue that �nancially constrained
�rms�investment opportunities are particularly sensitive to aggregate contractions and their spend-
ing should thus fall by more than other �rms during crisis periods. Like previous papers on this
topic, we are unable to rule out this possibility.
Our paper provides a new perspective on the e¤ects of the �nancial crisis that began in 2008.
It is important, however, that we contrast it with previous work on �nancing constraints. A dis-
tinguishing feature of our approach is that we gauge the impact of constraints by privately directly
asking managers about their �rms�access to credit. A related paper by Kaplan and Zingales (1997)
predates ours. These authors also consider managers�views on their �rms�access to credit (gleaned
from managers�public statements �led in corporate 10Ks), and some of our results and theirs are
similar: constrained �rms invest less, grow less, and save less cash. We also highlight that the Kaplan-
Zingales classi�cation scheme is easier to replicate than ours. On the other hand, our study looks
at how �rms behave in response to a sharp credit supply shift. We also have information on policy
dimensions that their work does not cover (e.g., how �rms manage their lines of credit, how much
they plan to spend on employment or technology, how they relate savings and investment decisions,
whether they cancel projects). In addition, we are able to make our �ndings available to researchers
and policy-makers as the crisis unfolds (before numbers are in the books or reported in 10Ks). The
associated cost is that our �ndings are di¢ cult to reproduce without a similar anonymous survey.
While not focused on �nancial crises, related papers have considered other sources of exogenous
variation to gauge the real-side implications of �nancial constraints. Blanchard et al. (1994), for ex-
ample, consider the e¤ects of cash �ow innovations that arise from corporate lawsuits. Lamont (1997)
considers the impact of the 1986 oil price decline on the investment spending of non-oil segments of
oil-based conglomerates. Rauh (2006) looks at discontinuity-like features of corporate pension fund-
ing obligations to establish a link between cash �ows and investment (other related papers include
Paravisini (2008) and Lemmon and Roberts (2008)). Our results add to this literature by looking
at a pronounced shift in the supply of credit brought about the 2008 �nancial crisis.
4
The remainder of the paper is organized as follows. We provide details of our survey data in
Section 2. Section 3 examines the interplay between �rm demographic characteristics and corporate
policies during the 2008 �nancial crisis. Section 4 introduces our measure of �nancial constraint and
examines how it shapes corporate decisions. Section 5 and 6 discuss, respectively, liquidity manage-
ment and investment policies during the crisis. Some conclusions are o¤ered in the �nal section.
2 Data
We gather �rm-level information using a survey of CFOs conducted in the fourth quarter of 2008.
The survey approach provides the opportunity to directly ask managers whether their corporate
decisions have been constrained by the cost or availability of credit. Since we want to understand
the role of �nancial markets in shaping corporate decisions when credit is tight, we investigate the
relation between �rm characteristics (such as size and credit rating) and whether managerial policies
are in�uenced by access to credit. We surveyed CFOs in the U.S., Europe, and Asia (a total of 39
countries). Many of these CFOs are subscribers of CFO magazine, CFO Europe, and CFO Asia;
others are executives who have participated in previous surveys conducted by Duke University.
The U.S. survey was conducted via E-mail invitation on November 25, 2008, and a reminder
E-mail was sent one week later. The survey closed on December 5, 2008. Due to logistical issues, the
European and Asian surveys started and ended about one week earlier.2 Most of those surveyed have
the job title of CFO. Some have the title of Treasurer, Assistant Treasurer, V.P. Finance, Comptroller,
or a similar title. We refer to this group collectively as CFOs. In the U.S., CFO magazine sent out
10,000 E-mail invitations. The approximate failure (�bounce back�) rate of these invitations is 7%.3
We know the distributions of �rm size and industry breakdown of the CFO invitations. Combining
CFO�s invitation �gures with the information from our �nal sample, we can estimate the response
rates in the U.S. Table 1 shows that response rates are roughly between 5 and 8% across di¤erent size
and industry categories. The middle columns imply that 68% of the population of companies that
received the survey have annual sales less than $1billion, compared to 75% of the respondent �rms.
Table 1 About Here
The sample we analyze in the remainder of the paper contains responses from 1,050 non-�nancial
�rms in the U.S. (574), Europe (192), and Asia (284). Table 2 contrasts survey respondents with
Compustat �rms. Since the bulk of research in corporate �nance is based on the Compustat universe,
the comparisons in this table illustrate the representativeness of our sample. To make these compar-
isons appropriate, we restrict attention to non-�nancial public �rms. Our respondents include 130
2The survey questions can be found at http://faculty.fuqua.duke.edu/cfosurvey/09q1/HTML_US/Q4_08_1.htm.3Duke University issued additional invitations which roughly compensated for the initial bounce backs.
5
non-�nancial public �rms. We contrast these �rms with 4,979 non-�nancial Compustat �rms, for
which we gather data on assets, sales, pro�ts, and cash holdings from the fourth quarter of 2008.
Table 2 About Here
Table 2 indicates that 56% of the non-�nancial public �rms in our sample have annual sales of
less than $1 billion. This fraction is somewhat higher (69%) for the comparable Compustat sample.
Conditional on having a rating, �rms in our sample have better ratings than those in Compustat.
Seventy-three percent of the non-�nancial public �rms in our survey have investment-grade ratings,
while for the Compustat sample this fraction is 48%. Comparisons are more problematic, however,
when one does not condition on the existence of a rating. In particular, note that 96 of the 130
public companies in our sample (or 74%) have a credit rating, compared to only 1,333 out of 4,979
(or 27%) in Compustat. Moreover, 70 of the 130 public companies (54%) in our sample have an
investment grade rating compared to 635 of 4,979 �rms in Compustat (13%).
Pro�tability in the two samples appears to be more comparable: approximately four out of �ve
companies in both samples were pro�table in the previous �scal year. Likewise, the propensity to pay
dividends is similar across the two samples: 47% of the �rms in our survey pay dividends, compared
to 40% of those in Compustat. Finally, cash holdings are similar across the two samples. The mean
(median) cash-to-assets ratio is 16.3% (8.0%) for survey �rms and 17.0% (8.3%) for Compustat �rms.
Most of the statistics reported in Table 2 suggest that the survey respondents are roughly com-
parable to those used in prior research in corporate �nance. However, we note the potential for a
selectivity bias with respect to credit ratings. In particular, a large proportion of our survey �rms
have investment grade ratings. This implies that the public �rms in our sample could be of a �better
quality� than the representative public �rm in Compustat. The same problem may arise among
the set of private �rms in our sample (although it is impossible to gauge the degree of private �rm
selectivity). It is di¢ cult to gauge the impact of this potential selectivity issue or to measure its
magnitude, but we later point to how it could a¤ect some of our results.
Our survey allows us to ask unique questions, but we stress that there are potential concerns
related to using surveys to gather data. While we consulted with experts and re�ned the survey
questions, it is still possible that some of the questions were misunderstood or otherwise produce
noisy measures of the desired variables of interest. In addition, when interpreting �eld studies one
needs to consider that market participants do not necessarily have to understand the reason they do
what they do in order to make (close to) optimal decisions. Moreover, given its design and timeli-
ness, the results we get are di¢ cult to replicate (one would need to design and implement a similar
instrument in a similar situation). Finally, our survey was conducted at one point in time, so we
can not exploit advantages that are sometimes available in panel data studies.4 One must bear these4As we discuss shortly, however, we can use previous surveys to better understand some issues. In that analysis,
6
caveats in mind when interpreting our results.
3 Firm Demographics and Corporate Policies during the Crisis
We start by examining corporate plans for 2009, plans that were made in the midst of the credit
crisis of 2008. We are interested in gauging how �rms respond to a contraction in aggregate credit
and, in particular, how characteristics that are usually associated with access to external �nancing
may shape corporate responses.
We study planned changes for the next 12 months (relative to the previous 12 months) in tech-
nology expenditures, capital expenditures, marketing expenditures, hiring (number of domestic em-
ployees), cash holdings, and dividend payments.5 We begin with graphical analyses, conditioning
the responses on �rm demographics. These responses are reported in Figure 1.
Geographical Region Panel A of Figure 1 categorizes corporate policy responses by the geo-
graphical region in which the �rm is headquartered. One salient result in panel A is that, around
the world, �rms are planning major cuts in (almost) all the policy variables that we examine. For
example, American and European companies plan to cut tech spending by over 10% during 2009. In
addition, among the policies we examine, American �rms expect the smallest cuts to occur in capital
expenditures. Also noteworthy, European companies expect to signi�cantly reduce cash holdings
over the next year, while Asian companies will actually increase (albeit only slightly) employment.
Figure 1 About Here
These regional disparities suggest that we should not indiscriminately bundle together data from
di¤erent regions when analyzing the impact of the �nancial crisis on corporate policies. Accordingly,
we study each of the three regions separately.
Size We split the companies into small and large categories according to sales revenue. Firms with
total gross sales amounting to less than $1 billion are categorized as �small,�and those with sales
in excess of $1 billion are �large.�There are 440 small �rms and 134 large �rms in the U.S. sample.
Our results are largely insensitive to cut-o¤s for the size categorization. The same applies to using
the number of employees (in lieu of sales) as a proxy for size. For example, experiments involving
size yield the same inferences if we classify as �small�those companies with less than 500 employees
and as �large�those with more than 5,000 employees.
we work with a �rotating panel�and time series information to draw conclusions.5Respondents are allowed to input numbers between �100% and 500% when answering this question and we observe
some extreme outliers. To minimize the impact of these extreme entries, we winsorize responses in the 1% tails.
7
Panel B of Figure 1 suggests that di¤erences between small and large company policy responses
to the current economic environment are modest in the U.S. Large �rms plan bigger cuts in technol-
ogy expenditures, while small �rms expect to implement larger capital spending cuts. Small �rms
also expect to cut marketing expenses more, and preserve cash. While suggestive, the �gures do not
reveal whether policy di¤erences across small and large �rms are statistically signi�cant. Similar
size-based patterns occur in Europe and Asia (not shown in �gure).
Ownership Form U.S. public �rms are those either traded on the NYSE or NASDAQ/AMEX.
We have 342 private �rms and 130 public �rms. As indicated by panel C of Figure 1, public �rms�
plans for the next 12 months imply, on average, sharper cuts in tech spending compared to private
�rms�plans (16% for public versus 10% for private). On the �ip side, private �rms plan to cut
marketing and capital expenditures by more. Public and private �rms seem to pursue similar �nan-
cial policies (cash holdings and dividend distributions) for 2009. Similar patterns across public and
private �rms exist in Europe and Asia, where the majority of companies are private.
Credit Ratings We categorize �rms as �speculative grade�and �investment grade�if their S&P
credit ratings are, respectively, BB+ or below, and BBB�or above. The sample contains 26 spec-
ulative grade and 70 investment grade �rms in the U.S. The di¤erences between speculative and
investment rated �rms�policies are more pronounced than those based on size and ownership form.
Speculative companies plan signi�cant reductions across all expenditure categories (including em-
ployment). These �rms also expect smaller cash reserves and greater dividend cuts over the next
12 months. Investment grade �rms also plan to cut most real and �nancial policy variables, but the
cuts are smaller by comparison. We �nd similar patterns in non-U.S. markets.
4 Assessing Financial Constraints from a Survey
The survey instrument allows us to group �rms by whether or not they indicate they are �nancially
constrained. In this section we describe and contrast these two groups of companies.
4.1 What Are Financially Constrained Firms Like?
A large literature examines the impact of capital market imperfections on corporate behavior. In
this literature, the standard empirical approach is to gather archival data and use metrics such as
asset size, ownership form, and credit ratings to characterize a �rm as either �nancially constrained
or unconstrained.6 Our instrument, in contrast, asks whether a company�s operations are �not af-
6Other related archival measures include �rm age (Oliner and Rudebush (1992)), dividend payer status (Fazzari et al.(1988)), and a¢ liation to conglomerates (Hoshi et al. (1991)). One exception to the standard identi�cation approachin this area is the work of Kaplan and Zingales (1997). Those authors review statements by �rm managers that were
8
fected,��somewhat a¤ected,�or �very a¤ected�by di¢ culties in accessing the credit markets. For
the survey conducted in the fourth quarter of 2008 in the U.S., we have 244 respondents indicating
that they are una¤ected by credit constraints, 210 indicating that they are somewhat a¤ected, and
115 indicating that they are very a¤ected.7 In what follows, we carefully document the characteristics
of the respondents in each of these categories.
4.1.1 Characterizing Constrained Firms Based on Standard Observables
Table 3 reports relevant characteristics of U.S. �rms that declare themselves as �not a¤ected,��some-
what a¤ected,�or �very a¤ected�by the cost or availability of credit (we denote these answers NotAf-
fected, SomewhatA¤ected, and VeryA¤ected, respectively). The �rst breakdown is based on �rm size,
as measured by sales volume. Row 1 of Table 3 shows that 179 (or 73%) of the �rms in the NotA¤ected
category are small, while 65 (27%) are large. For the SomewhatA¤ected category, 78% of the �rms
are small and 22% are large, while for the VeryA¤ected category the breakdown is 82% small and 18%
large. These numbers point to a very small degree of correlation between size and �rms�propensity to
declare themselves as either constrained or unconstrained. Another way to look at the numbers in row
1 is to consider the proportion of constraint-types by size category. In particular, for the small �rms in
our sample (a total of 436), we �nd that 41% of the �rms are NotA¤ected, 37% are SomewhatA¤ected,
and 22% are VeryA¤ected. For the large �rms (133 �rms), 49% of the observations are NotA¤ected,
35% are SomewhatA¤ected, and 16% are VeryA¤ected. As before, a small correlation between size
and the degree to which �rms say they are constrained is implicit in these relative percentages.8
We also detect only a small degree of correlation between constraint type and ownership form
in our sample. In row 2, among the 337 private �rms in our sample, 42% are NotA¤ected, 36% are
SomewhatA¤ected, and 22% are VeryA¤ected. For public �rms, that same breakdown yields 47%,
35%, and 18%, respectively. There is more correlation between credit ratings and constraints (condi-
tional on the �rm having a rating). For example, row 3 indicates that 46% of speculative grade �rms
are VeryA¤ected, while only 13% of those that have investment ratings fall in this constraint category.
Table 3 About Here
The CFOs also assess the �nancial status and economic prospects of their �rms. Stein (2003)
discusses the importance of this type of information in understanding the e¤ects of �nancing con-
straints. In particular, we ask whether respondent �rms realized (or expected to realize) a positive
pro�t in �scal year 2008. We also inquire whether they pay a dividend. Finally, we ask CFOs to
entered in �rms�public records (e.g., 10-Ks) to gauge the degree of constraint. Kaplan and Zingales then use their ownjudgment to classify �rms in categories of �nancial constraint. See also Whited and Wu (2006) and Cleary (1999).
7 In Europe those numbers are, respectively, 92, 71, and 26. In Asia the same breakdown is 147, 112, and 24.8A formal test of correlation between our measure of constraint and �rm size con�rms the intuition we gather from
the numbers in Table 3 (the test is omitted from this version of the paper).
9
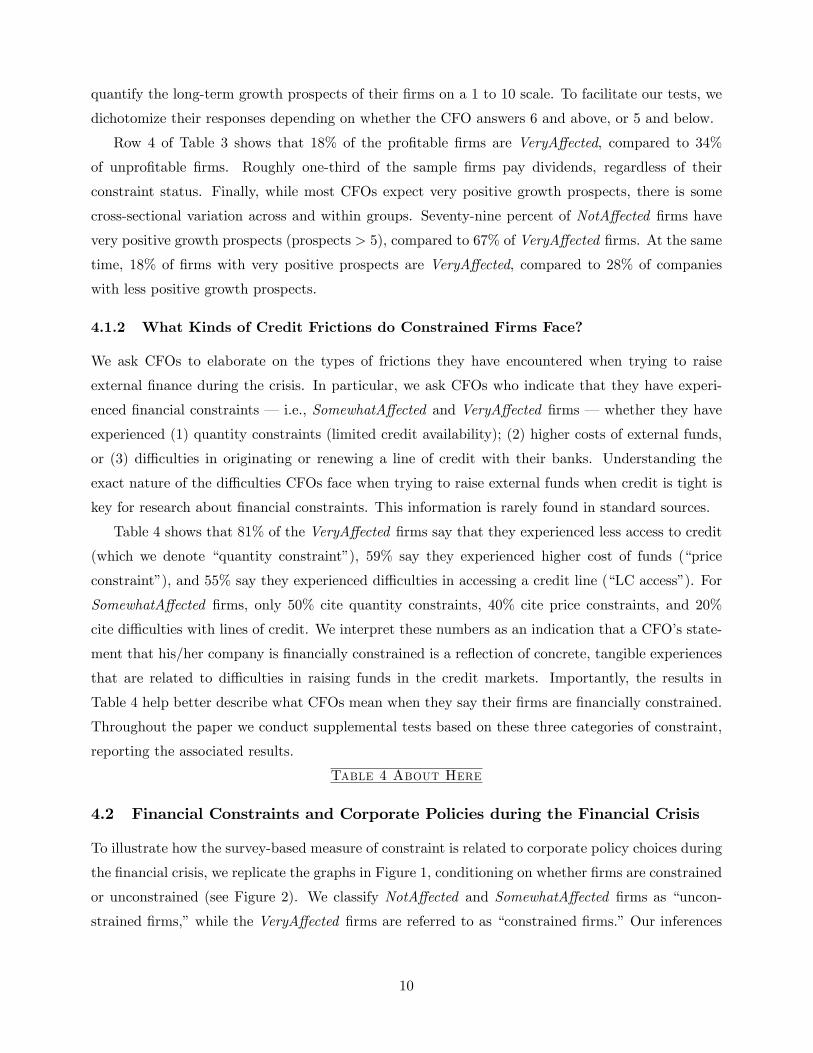
quantify the long-term growth prospects of their �rms on a 1 to 10 scale. To facilitate our tests, we
dichotomize their responses depending on whether the CFO answers 6 and above, or 5 and below.
Row 4 of Table 3 shows that 18% of the pro�table �rms are VeryA¤ected, compared to 34%
of unpro�table �rms. Roughly one-third of the sample �rms pay dividends, regardless of their
constraint status. Finally, while most CFOs expect very positive growth prospects, there is some
cross-sectional variation across and within groups. Seventy-nine percent of NotA¤ected �rms have
very positive growth prospects (prospects > 5), compared to 67% of VeryA¤ected �rms. At the same
time, 18% of �rms with very positive prospects are VeryA¤ected, compared to 28% of companies
with less positive growth prospects.
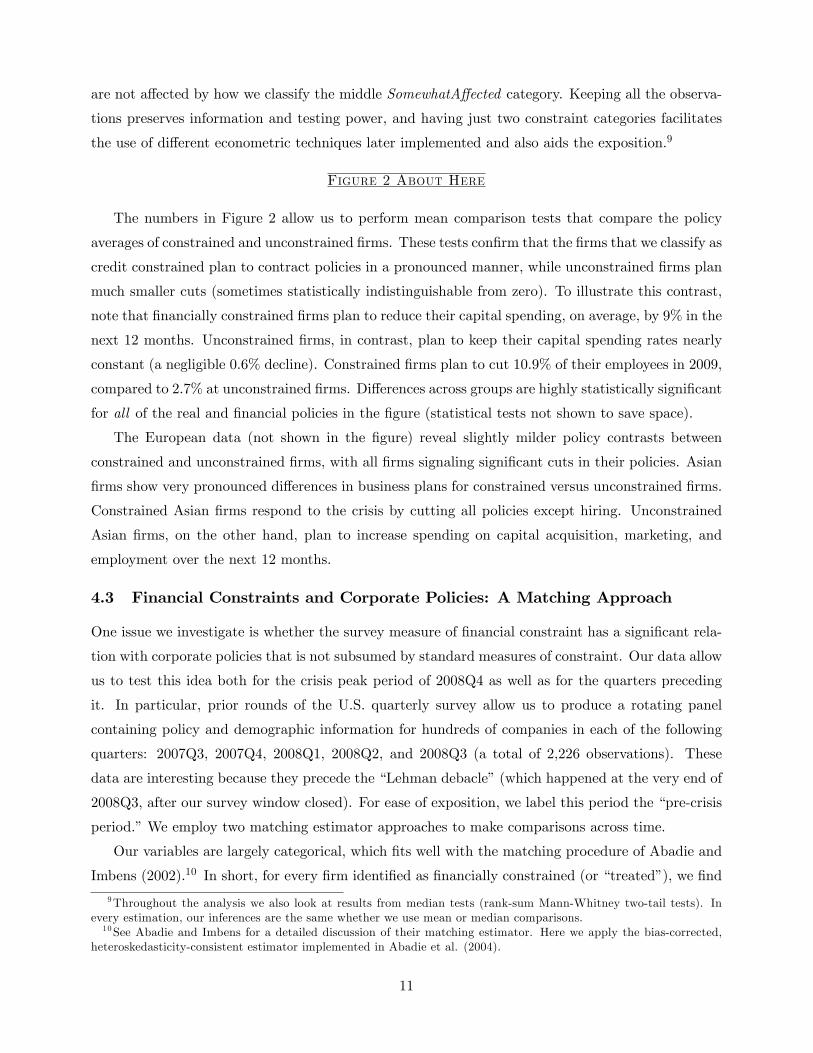
4.1.2 What Kinds of Credit Frictions do Constrained Firms Face?
We ask CFOs to elaborate on the types of frictions they have encountered when trying to raise
external �nance during the crisis. In particular, we ask CFOs who indicate that they have experi-
enced �nancial constraints � i.e., SomewhatA¤ected and VeryA¤ected �rms � whether they have
experienced (1) quantity constraints (limited credit availability); (2) higher costs of external funds,
or (3) di¢ culties in originating or renewing a line of credit with their banks. Understanding the
exact nature of the di¢ culties CFOs face when trying to raise external funds when credit is tight is
key for research about �nancial constraints. This information is rarely found in standard sources.
Table 4 shows that 81% of the VeryA¤ected �rms say that they experienced less access to credit
(which we denote �quantity constraint�), 59% say they experienced higher cost of funds (�price
constraint�), and 55% say they experienced di¢ culties in accessing a credit line (�LC access�). For
SomewhatA¤ected �rms, only 50% cite quantity constraints, 40% cite price constraints, and 20%
cite di¢ culties with lines of credit. We interpret these numbers as an indication that a CFO�s state-
ment that his/her company is �nancially constrained is a re�ection of concrete, tangible experiences
that are related to di¢ culties in raising funds in the credit markets. Importantly, the results in
Table 4 help better describe what CFOs mean when they say their �rms are �nancially constrained.
Throughout the paper we conduct supplemental tests based on these three categories of constraint,
reporting the associated results.
Table 4 About Here
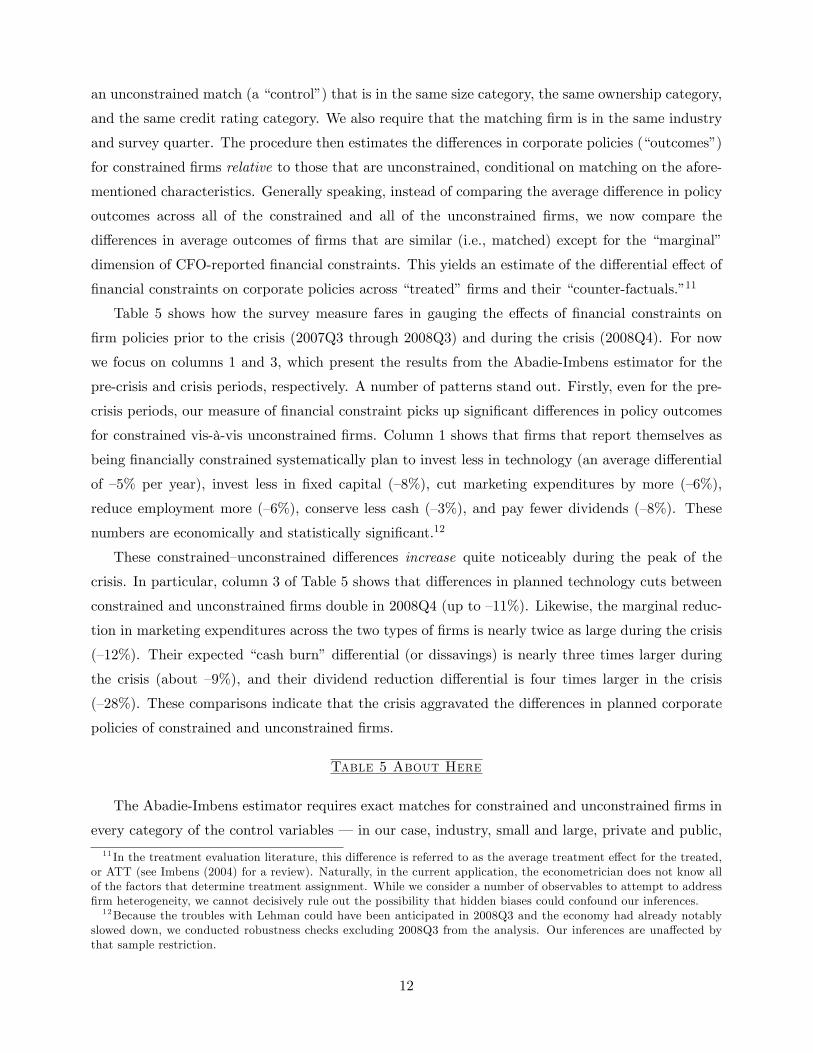
4.2 Financial Constraints and Corporate Policies during the Financial Crisis
To illustrate how the survey-based measure of constraint is related to corporate policy choices during
the �nancial crisis, we replicate the graphs in Figure 1, conditioning on whether �rms are constrained
or unconstrained (see Figure 2). We classify NotA¤ected and SomewhatA¤ected �rms as �uncon-
strained �rms,�while the VeryA¤ected �rms are referred to as �constrained �rms.�Our inferences
10
are not a¤ected by how we classify the middle SomewhatA¤ected category. Keeping all the observa-
tions preserves information and testing power, and having just two constraint categories facilitates
the use of di¤erent econometric techniques later implemented and also aids the exposition.9
Figure 2 About Here
The numbers in Figure 2 allow us to perform mean comparison tests that compare the policy
averages of constrained and unconstrained �rms. These tests con�rm that the �rms that we classify as
credit constrained plan to contract policies in a pronounced manner, while unconstrained �rms plan
much smaller cuts (sometimes statistically indistinguishable from zero). To illustrate this contrast,
note that �nancially constrained �rms plan to reduce their capital spending, on average, by 9% in the
next 12 months. Unconstrained �rms, in contrast, plan to keep their capital spending rates nearly
constant (a negligible 0.6% decline). Constrained �rms plan to cut 10.9% of their employees in 2009,
compared to 2.7% at unconstrained �rms. Di¤erences across groups are highly statistically signi�cant
for all of the real and �nancial policies in the �gure (statistical tests not shown to save space).
The European data (not shown in the �gure) reveal slightly milder policy contrasts between
constrained and unconstrained �rms, with all �rms signaling signi�cant cuts in their policies. Asian
�rms show very pronounced di¤erences in business plans for constrained versus unconstrained �rms.
Constrained Asian �rms respond to the crisis by cutting all policies except hiring. Unconstrained
Asian �rms, on the other hand, plan to increase spending on capital acquisition, marketing, and
employment over the next 12 months.
4.3 Financial Constraints and Corporate Policies: A Matching Approach
One issue we investigate is whether the survey measure of �nancial constraint has a signi�cant rela-
tion with corporate policies that is not subsumed by standard measures of constraint. Our data allow
us to test this idea both for the crisis peak period of 2008Q4 as well as for the quarters preceding
it. In particular, prior rounds of the U.S. quarterly survey allow us to produce a rotating panel
containing policy and demographic information for hundreds of companies in each of the following
quarters: 2007Q3, 2007Q4, 2008Q1, 2008Q2, and 2008Q3 (a total of 2,226 observations). These
data are interesting because they precede the �Lehman debacle�(which happened at the very end of
2008Q3, after our survey window closed). For ease of exposition, we label this period the �pre-crisis
period.�We employ two matching estimator approaches to make comparisons across time.
Our variables are largely categorical, which �ts well with the matching procedure of Abadie and
Imbens (2002).10 In short, for every �rm identi�ed as �nancially constrained (or �treated�), we �nd
9Throughout the analysis we also look at results from median tests (rank-sum Mann-Whitney two-tail tests). Inevery estimation, our inferences are the same whether we use mean or median comparisons.10See Abadie and Imbens for a detailed discussion of their matching estimator. Here we apply the bias-corrected,
heteroskedasticity-consistent estimator implemented in Abadie et al. (2004).
11
an unconstrained match (a �control�) that is in the same size category, the same ownership category,
and the same credit rating category. We also require that the matching �rm is in the same industry
and survey quarter. The procedure then estimates the di¤erences in corporate policies (�outcomes�)
for constrained �rms relative to those that are unconstrained, conditional on matching on the afore-
mentioned characteristics. Generally speaking, instead of comparing the average di¤erence in policy
outcomes across all of the constrained and all of the unconstrained �rms, we now compare the
di¤erences in average outcomes of �rms that are similar (i.e., matched) except for the �marginal�
dimension of CFO-reported �nancial constraints. This yields an estimate of the di¤erential e¤ect of
�nancial constraints on corporate policies across �treated��rms and their �counter-factuals.�11
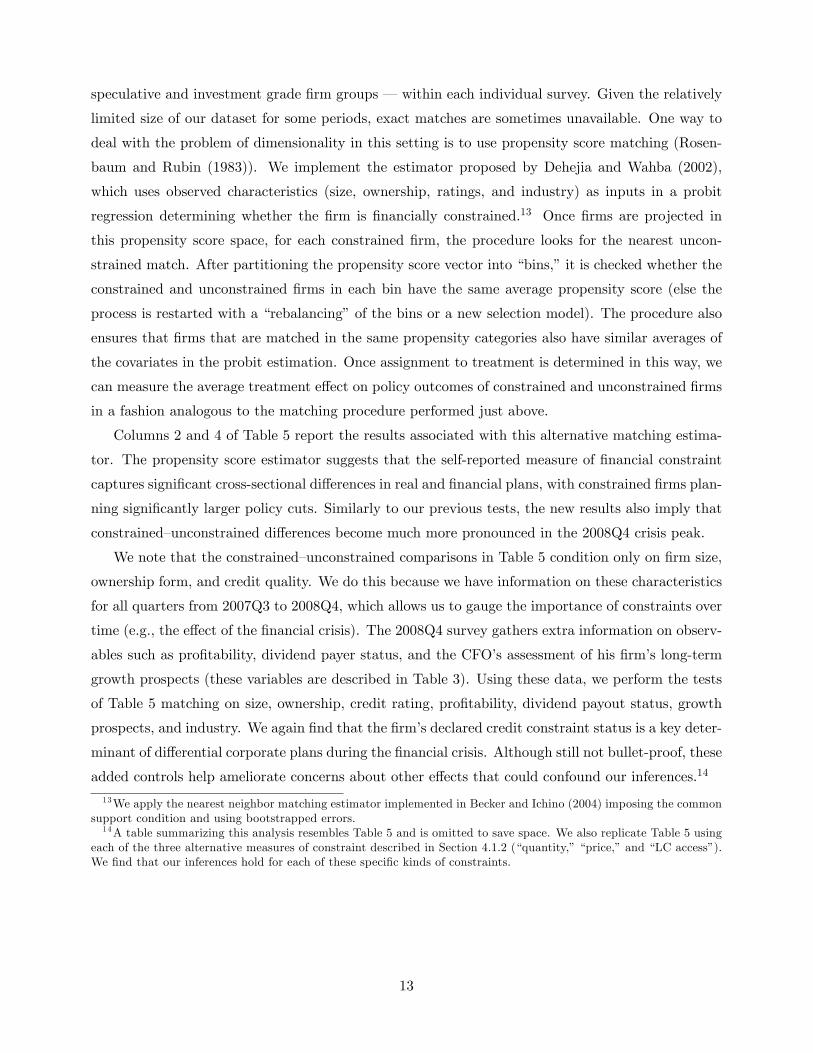
Table 5 shows how the survey measure fares in gauging the e¤ects of �nancial constraints on
�rm policies prior to the crisis (2007Q3 through 2008Q3) and during the crisis (2008Q4). For now
we focus on columns 1 and 3, which present the results from the Abadie-Imbens estimator for the
pre-crisis and crisis periods, respectively. A number of patterns stand out. Firstly, even for the pre-
crisis periods, our measure of �nancial constraint picks up signi�cant di¤erences in policy outcomes
for constrained vis-à-vis unconstrained �rms. Column 1 shows that �rms that report themselves as
being �nancially constrained systematically plan to invest less in technology (an average di¤erential
of �5% per year), invest less in �xed capital (�8%), cut marketing expenditures by more (�6%),
reduce employment more (�6%), conserve less cash (�3%), and pay fewer dividends (�8%). These
numbers are economically and statistically signi�cant.12
These constrained�unconstrained di¤erences increase quite noticeably during the peak of the
crisis. In particular, column 3 of Table 5 shows that di¤erences in planned technology cuts between
constrained and unconstrained �rms double in 2008Q4 (up to �11%). Likewise, the marginal reduc-
tion in marketing expenditures across the two types of �rms is nearly twice as large during the crisis
(�12%). Their expected �cash burn�di¤erential (or dissavings) is nearly three times larger during
the crisis (about �9%), and their dividend reduction di¤erential is four times larger in the crisis
(�28%). These comparisons indicate that the crisis aggravated the di¤erences in planned corporate
policies of constrained and unconstrained �rms.
Table 5 About Here
The Abadie-Imbens estimator requires exact matches for constrained and unconstrained �rms in
every category of the control variables � in our case, industry, small and large, private and public,
11 In the treatment evaluation literature, this di¤erence is referred to as the average treatment e¤ect for the treated,or ATT (see Imbens (2004) for a review). Naturally, in the current application, the econometrician does not know allof the factors that determine treatment assignment. While we consider a number of observables to attempt to address�rm heterogeneity, we cannot decisively rule out the possibility that hidden biases could confound our inferences.12Because the troubles with Lehman could have been anticipated in 2008Q3 and the economy had already notably
slowed down, we conducted robustness checks excluding 2008Q3 from the analysis. Our inferences are una¤ected bythat sample restriction.
12
speculative and investment grade �rm groups � within each individual survey. Given the relatively
limited size of our dataset for some periods, exact matches are sometimes unavailable. One way to
deal with the problem of dimensionality in this setting is to use propensity score matching (Rosen-
baum and Rubin (1983)). We implement the estimator proposed by Dehejia and Wahba (2002),
which uses observed characteristics (size, ownership, ratings, and industry) as inputs in a probit
regression determining whether the �rm is �nancially constrained.13 Once �rms are projected in
this propensity score space, for each constrained �rm, the procedure looks for the nearest uncon-
strained match. After partitioning the propensity score vector into �bins,�it is checked whether the
constrained and unconstrained �rms in each bin have the same average propensity score (else the
process is restarted with a �rebalancing�of the bins or a new selection model). The procedure also
ensures that �rms that are matched in the same propensity categories also have similar averages of
the covariates in the probit estimation. Once assignment to treatment is determined in this way, we
can measure the average treatment e¤ect on policy outcomes of constrained and unconstrained �rms
in a fashion analogous to the matching procedure performed just above.
Columns 2 and 4 of Table 5 report the results associated with this alternative matching estima-
tor. The propensity score estimator suggests that the self-reported measure of �nancial constraint
captures signi�cant cross-sectional di¤erences in real and �nancial plans, with constrained �rms plan-
ning signi�cantly larger policy cuts. Similarly to our previous tests, the new results also imply that
constrained�unconstrained di¤erences become much more pronounced in the 2008Q4 crisis peak.
We note that the constrained�unconstrained comparisons in Table 5 condition only on �rm size,
ownership form, and credit quality. We do this because we have information on these characteristics
for all quarters from 2007Q3 to 2008Q4, which allows us to gauge the importance of constraints over
time (e.g., the e¤ect of the �nancial crisis). The 2008Q4 survey gathers extra information on observ-
ables such as pro�tability, dividend payer status, and the CFO�s assessment of his �rm�s long-term
growth prospects (these variables are described in Table 3). Using these data, we perform the tests
of Table 5 matching on size, ownership, credit rating, pro�tability, dividend payout status, growth
prospects, and industry. We again �nd that the �rm�s declared credit constraint status is a key deter-
minant of di¤erential corporate plans during the �nancial crisis. Although still not bullet-proof, these
added controls help ameliorate concerns about other e¤ects that could confound our inferences.14
13We apply the nearest neighbor matching estimator implemented in Becker and Ichino (2004) imposing the commonsupport condition and using bootstrapped errors.14A table summarizing this analysis resembles Table 5 and is omitted to save space. We also replicate Table 5 using
each of the three alternative measures of constraint described in Section 4.1.2 (�quantity,��price,�and �LC access�).We �nd that our inferences hold for each of these speci�c kinds of constraints.
13
4.4 Comparisons with Standard Proxies for Financial Constraint
To gauge the relative performance of the survey measure we replicate the tests of Table 5 using the
standard measures of constraints (size, ownership, and ratings) as the relevant treatments. For each
of one of the standard measures, we match across the other two plus the survey measure of constraint
and check whether we �nd policy di¤erences across these (newly-assigned) �nancially �constrained�
and �unconstrained��rms. We restrict this analysis to the Abadie-Imbens estimator.
For each of the standard alternative measures of �nancial constraints, Table 6 presents tests for
the period prior to the crisis (columns 1 through 3) and for the crisis period (columns 4 through
6). For the pre-crisis period, size often returns the �wrong�(positive) sign for the e¤ect of �nancial
constraints. The results for ownership are indistinguishable from zero. The credit ratings proxy some-
times returns the expected negative relation between �nancial constraints and corporate policies, but
with low statistical reliability. The estimates for the crisis period are noisy and counterintuitive. We
�nd, for example, that small �rms�dividend payouts increase during the crisis, that private �rms�
capital expenditures are less a¤ected by the crisis, and that speculative grade �rms� technology
spending, capital expenditures, and cash savings surpass that of investment grade �rms in the crisis.
This analysis suggests that the survey measure of constraints subsumes the traditional proxies.15
Table 6 About Here
5 Liquidity Management in the Financial Crisis
The previous section links our survey measure of �nancial constraint to corporate spending plans
during a �nancial crisis. In this section we investigate how �rms manage cash reserves and bank lines
of credit to minimize the impact of the crisis on their business operations.16 We examine data from
many countries, but to streamline exposition we often benchmark on U.S. data. We only examine
the December 2008 survey for the remainder of the paper because the earlier surveys do not have
detailed information about liquidity management or investment behavior.
5.1 Cash Management
Previous research suggests that �rms manage their cash as a way to deal with credit frictions (Almeida
et al. (2004)). We �rst document how much cash companies had on their balance sheets when the
15As discussed in Section 2, one concern about our data is that the public �rms in our sample might be of an�overall better quality.� The weak results we �nd for credit ratings could then be due to the possibility that public�rms in our sample have low cross-sectional variation in their access to credit.16Lins et al. (2009) also use survey data to study how �rms manage cash and lines of credit. Looking at responses
from a 2005 survey, the authors di¤erentiate between various determinants of corporate liquidity choices, such ascredit market development, insurance against pro�t shortfalls, and investment needs. Our �ndings add to those ofLins et al. in that we examine liquidity management during a credit crisis, focusing on the role of �nancial constraints.
14
survey was conducted in December 2008, and how much they had one year prior. We compute the
average cash-to-assets ratio conditioned on our measure of �nancial constraint. Figure 3 depicts the
cash holdings of �rms in the U.S., Europe, and Asia.
Figure 3 About Here
There is a wide degree of variation in the levels of cash holdings of �rms in di¤erent categories
and countries. The �rst panel of Figure 3 presents U.S. data. According to our survey, the cash
holdings of constrained and unconstrained �rms in the U.S. were roughly similar one year prior to
the �nancial crisis. The 2008 crisis did not a¤ect unconstrained �rms�cash levels, but constrained
�rms burned through a substantial fraction of their cash reserves by year-end 2008. Cash reserves
at constrained companies fell by one-�fth, from about 15% to about 12% of book assets. In other
words, there are noticeable di¤erences between the two groups of �rms in changes in cash. Similar
cash burn patterns are observed in Europe and to a lesser extent, in Asia.
To gauge statistical signi�cance, we compute the di¤erence in average change in cash holdings
across constrained and unconstrained �rms. This di¤erence is highly statistically signi�cant. Since
the cash holdings of unconstrained �rms stay constant, our test suggests that �nancially constrained
�rms have been forced to draw down their cash reserves to cope with the �nancial crisis. In partic-
ular, there is a pronounced reduction in cash levels among �nancially constrained �rms over the last
year (3.3% of total assets). This magnitude is startling when combined with our previous result that
constrained �rms expect to burn through another 15% of cash holdings during 2009 (see Figure 2).
One concern is whether constrained �rms performed more poorly in the second half of 2008 and
that poor performance � not di¢ cult access to credit � may have led to lower cash stocks. This
concern is similar to the heterogeneity issue we dealt with in Section 4 via the use of matching esti-
mators. We apply those same estimators here and �nd that inferences are insensitive to controlling
for cash �ows. The Abadie-Imbens estimator suggests that the cash holdings of constrained �rms
are �2.8% lower than that of unconstrained �rms following the crisis (t-statistic of �2.9).
5.2 Managing Lines of Credit
We also investigate how �rms manage their bank lines of credit (LCs). The CFOs report their
available lines of credit at the time of the survey (during the crisis) and also one year prior. As
indicated in panel A of Figure 4, constrained U.S. �rms have, on average, higher LC-to-asset ratios
than their unconstrained counterparts. Despite di¤erences in the levels of LC-to-assets across dif-
ferent categories, �rms do not display pronounced changes in the amount of their outstanding LCs
over the year. These inferences are con�rmed in formal mean comparison tests (output omitted).
We �nd roughly similar patterns in Europe (panel B) and Asia (panel C), with the exception that
constrained �rms in Europe increase the size of their LCs during the crisis. These �ndings seem
15
consistent with theoretical priors that lines of credit work as an insurance policy against liquidity
shortages in bad times (Holmstrom and Tirole (1998)).
Figure 4 About Here
Next, we examine the factors that prompt companies to draw cash from their outstanding LCs
over the period leading up to the crisis. To understand their motivations, we compute the proportion
of respondents that point to any of the following reasons for drawdowns: �to manage immediate liq-
uidity needs,��to fund normal daily operations,��to build cash for the future, as a precaution,�and
�to obtain cash now in case the bank restricts LC access in the future.�Respondents are allowed to
check all options that apply, so that for each available category we use the following code: unchecked
= 0 and checked = 1. The �rst two options capture the link between �rms�regular use of LC facilities
and their business operations, while the last two capture the �strategic�aspect of LC management
in the relationship between �rms and their banks. Table 7 presents mean comparison tests for U.S.
data to help establish which of these considerations (business-related or strategic reasons) determine
corporate line of credit management.
Table 7 About Here
The results in the table point to signi�cant di¤erences in LC management conditional on �nancial
constraint. Constrained companies rely on LCs more heavily for liquidity needs and to fund daily
operations. Constrained �rms also exhibit the highest propensity to draw from their LC accounts
as a way to build cash stocks (precautionary motive) and due to concerns about future access to
their LCs. In particular, a signi�cant fraction of constrained �rms (17%) withdrew funds during the
crisis because of concerns that banks would limit their access to their LC facilities in the near future.
This latter �nding is consistent with recent work of Ivashina and Scharfstein (2008), who document
a �draw now, just in case�phenomenon during 2008. Our analysis adds to those authors��ndings
by tying this behavior to �nancially constrained �rms.
We look overseas to determine whether companies world-wide manage their LCs in ways con-
sistent with their American counterparts. We �nd very similar patterns abroad (not in table).
Companies around the world rely heavily on LCs for their immediate liquidity needs and daily oper-
ations. More interestingly, we �nd that constrained Asian �rms manage their lines of credit with an
eye on building precautionary savings, while constrained European �rms do not. Regarding the issue
of strategic behavior of LC withdrawals, we �nd that, just like in the U.S., constrained European
and Asian �rms draw funds for fear that their banks will restrict access to credit lines in the future.
Finally, we ask managers whether they have voluntarily limited their use of lines of credit, and if so
why. We compute the proportion of respondents checking any of the options: �to avoid paying fees,�
�interest rate is too high,��to preserve reputation amongst bankers and credit markets,� and �to
16
save borrowing capacity.�The �rst two options capture regular business concerns with the cost of LC
facilities. The last two capture strategic aspects of LC management. In untabulated analysis we �nd
that �rms very rarely report concerns about the costs associated with LCs as a main driver for limiting
the use of those facilities. At the same time, they are interested in saving future borrowing capacity
by restricting current usage of available LCs. To a lesser extent, companies also seem concerned with
reputational costs associated with the use of funds from LCs. Firms that are larger and public are sig-
ni�cantly more concerned about damaging their reputations in the credit markets with the use of their
available LCs; that is, these companies limit their use of LCs in order to preserve their reputations.
6 Investment Spending during the Financial Crisis
Researchers and economic policy-makers are generally interested in the real-side implications of
credit market imperfections. In other words, they worry about whether capital market frictions may
trigger adverse e¤ects on corporate investment, revenues, employment, tech spending, asset growth,
and acquisitions. The timing of our survey allows insight into how corporate managers react to
constrained capital markets in terms of how they plan to operate and invest.
6.1 Access to External Financing and Investment
A well-known line of research examines whether constrained access to external funding a¤ects the
optimality of corporate investment decisions. While most researchers agree that capital market im-
perfections can distort corporate investment, there is dispute about the type of evidence used to
support this claim. Much of this research is based on archival �nancial statement data for public
U.S. companies, and the econometrician ultimately has to estimate whether corporate managers
make investment decisions that re�ect di¢ culties in raising external funds. In contrast, we study
whether capital markets a¤ect corporate investment using information gathered directly from those
in charge of making corporate decisions. We do this via a series of survey questions.
We �rst ask CFOs to quantify the degree to which their �rm�s access to external �nancing limits
their ability to fund attractive investment projects. The answer tells us whether the availability of
�nancing � as opposed to the availability of investment opportunities � drives observed invest-
ment. To gain additional insights on the e¤ect of credit shocks, we di¤erentiate between di¢ culties
in accessing external funds when credit markets are �operating normally� versus in the �current
situation,�when credit markets were experiencing a severe crisis.
When indicating the e¤ect of external �nancing on investment spending, managers are allowed
check one of four possible answers: �no e¤ect,��small e¤ect,��moderate e¤ect,�and �large e¤ect.�
We categorize these answers as follows: �no e¤ect�/�small e¤ect�= 0; �moderate e¤ect�/�large ef-
fect�= 1. We average these 0�1 responses across �rms and compare averages across �rms grouped
17
by di¤erent measures of constraint.
The answers from U.S. CFOs are reported in Table 8, where for comparison purposes we consider
breakdowns based on size, ownership, and ratings, and self-declared �nancial constraint. Panel A
shows the answers for �normal times.�The numbers imply very little size and ownership variation
regarding how U.S. �rms normally associate their access to capital markets and their ability to invest
(see rows 1 and 2, respectively). About one-in-four small, large, private, and public �rms state that
in normal times their access to the capital markets a¤ects their ability to pursue pro�table projects.
Things are di¤erent when we consider credit ratings (row 3) and the direct measure of �nancial
constraint (row 4). In particular, we observe that speculative and �nancially constrained companies
report a markedly higher propensity to link the availability of external �nancing to the ability to
pursue attractive projects.
Table 8 About Here
Panel B shows the degree to which credit constraints limit the pursuit of attractive investments
during the credit crisis. More �rms (overall) report di¢ culties in funding pro�table investment dur-
ing the crisis, but as in Panel A, there is limited variation in the answers conditional on size and
ownership classi�cations. In contrast, credit ratings and, especially, the direct measure of �nancial
constraint, are more discriminating. We �nd that speculative-rated �rms and �nancially constrained
�rms report a much higher propensity to link the availability of external �nancing to the ability to
pursue attractive projects. Indeed, 86% of �nancially constrained �rms indicate that their ability
to invest in positive NPV projects in the current period is tied to their ability to raise external
funds in the capital markets. This represents a signi�cant increase from the 46% rate reported in
normal times, suggesting that the �rms we identify as �nancially constrained are the likely �mar-
ginal borrowers�of the economy; i.e., those that su¤er the most from a inward shift in the supply of
credit. Similar �ndings obtain when we classify �rms as constrained or unconstrained based on the
�quantity,� �price,� or �LC access�metrics discussed in Section 4.1.2. Our inferences are further
supported by additional tests based on European and Asian data (tables omitted).17
Our �ndings suggest that the crisis exacerbates the degree to which �rms link the availability of
funds with the ability to pursue attractive opportunities, with di¤erential e¤ects across �rms. Be-
cause a �nancial crisis drains credit from the �nancial markets, we document the unfortunate result
that �nancial markets seem to matter most for corporate investment precisely when they fail.
6.2 The Relation between Investment and Internal Liquidity
A question of much debate in the literature concerns the degree to which �rms are able to use in-
ternal funds to �nance investment when they face credit frictions (see Stein (2003)). Researchers
17Noteworthy, while in the U.S. the credit ratings proxy has some explanatory power over investment decisions, thesame does not apply to non-U.S. markets.
18
have examined this question by looking at empirical correlations between investment and cash �ows,
reporting mixed results. Our survey allows us to investigate this issue from a di¤erent perspec-
tive. We directly ask managers whether they use their �rms�internal resources to �nance pro�table
investment opportunities when access to external credit is limited.
We compute the proportion of respondents checking each of the following answers to our ques-
tion about investing in pro�table projects under credit constraints: �investment funded by cash
�ows,��investment funded by cash holdings,��investment funded by other sources (including part-
nerships),�and �investment is cancelled or postponed.�Respondents are allowed to check all options
that apply, so that for each available category we use the following code: unchecked = 0 and checked
= 1. As in previous analyses, we average these 0�1 responses across the four �rm categorizations
(size, ownership, ratings, and �nancial constraint). Figure 5 describes our �ndings.
Figure 5 About Here
Figure 5 suggests that �rms across all categories are likely to use internal sources of funding for
their investment when access to external capital markets is limited. The �gure supports the notion
that, in the face of a negative credit supply shock, companies consider their internal resources �
both operating income and cash savings � as a way to �nance future investment. Likewise, �rms
across all categories indicate that they are likely to postpone or cancel investment plans when the
capital markets are tight.
Some cross-sectional di¤erences stand out in Figure 5. For instance, large, public, investment-
grade, unconstrained U.S. �rms indicate they are relatively more likely to rely on cash reserves to
�nance future investment. This is in line with our previous �ndings that more constrained �rms
have already burned through a signi�cant fraction of their internal cash reserves in recent months.
The graphs also suggest that �rms with low credit quality and those that are �nancially constrained
show particularly strong propensity to cancel their investments. Indeed, some 56% of constrained
companies in the U.S. indicate that they would cancel investment when external funding is limited,
compared to about 31% of investment rated and unconstrained �rms. In Europe, 69% of �nancially
constrained �rms say they are inclined to cancel their investment.
Assuming that �rms would prefer to draw on their cash reserves before cancelling their planned
investments (which is, presumably, a very costly course of action), we further condition the decision
to cancel investment on whether CFOs indicate they are able to use cash to fund investment if ex-
ternal �nancing sources are inadequate. For those constrained �rms for which using internal cash is
not an option (perhaps because cash stocks are already depleted), the rate of investment cancellation
goes up to 71% in the U.S.; for unconstrained �rms the rate goes up to 39%. In Europe, the cancel-
lation rate of constrained �rms that can not use cash to fund investment is as high as 80% (64% in
Asia). Notice that archival data do not allow for direct insights into whether investment is cancelled
19
when access to credit markets is tightened. In particular, the �nancial statement data used in prior
studies only capture information relative to observed investment spending. That limitation makes it
di¢ cult to fully measure the e¤ective trade-o¤ between investment and constrained �nancing.
We check whether the inferences we gather from Figure 5 are statistically meaningful. Group
means comparison tests show no signi�cant cross-group di¤erences in the propensity to use cash
�ows and cash stocks to fund investment when capital markets tighten (table omitted). The degree
to which �rms that have low credit ratings or are �nancially constrained cancel their investments is
signi�cantly greater than that of other groups of �rms: as reported above, in the U.S. nearly 60%
of these �rms cancel investment when external funding is not available. The statistical signi�cance
and implications of our U.S. results are con�rmed in the European and Asian surveys.
6.3 Asset Sales
Related to the question of whether �rms cancel investment plans due to credit constraints, we in-
quire whether they sell existing assets because of these constraints. In particular, our survey asks
managers whether they are selling more corporate assets during the crisis than in the recent past.
Exactly 70% of the constrained CFOs say that they are selling more assets now than before �
compared to 37% of the unconstrained CFOs � in order to obtain funds. Notably, the traditional
measures of constraint (e.g., size and credit ratings) do not detect economically and statistically
signi�cant cross-sectional variation in the degree to which di¤erent �rms are selling assets to cope
with the �nancial crisis. We �nd similar patterns in non-U.S. economies.
7 Conclusions
While the �nancial crisis of 2008 and the associated recession led to severe hardship, it also provided
an opportunity to learn about the impact of �nancial constraints on corporate policies. We survey
1,050 chief �nancial o¢ cers (CFOs) in 39 countries in December 2008 and gather a number of in-
teresting insights from the answers to our questionnaire. Our survey approach allows us to collect
timely information that cannot be deduced from archival data. At the same time, as we discuss,
that approach has its own limitations (e.g., replicability and selection biases).
We �nd that �nancially constrained �rms plan to cut more investment, technology, marketing,
and employment relative to �nancially unconstrained �rms during the crisis. We also show that
constrained �rms are forced to burn a sizeable portion of their cash savings during the crisis and
to cut more deeply planned dividend distributions. In contrast, unconstrained �rms do not display
this behavior. Among other results, we �nd that constrained �rms accelerate the withdrawal of
funds from their outstanding lines of credit because of concerns that their banks may restrict access
to those lines. Unconstrained �rms rarely engage in this strategic behavior. Nearly 90% percent
20
of constrained companies say that �nancial constraints restrict their pursuit of attractive projects,
and more than half of these �rms are forced to cancel valuable investments. Constrained �rms also
display a much higher propensity to sell o¤ productive assets as a way to generate funds during the
crisis. These results are shown to hold in the U.S., Europe, and Asia.
A large literature has looked at how credit constraints a¤ect �rms in normal times. Our study is
di¤erent in that we gather information on �rms�planned responses to the sharpest credit shortage in
nearly a century. Our results indicate that the current �nancial crisis has been systematically a¤ected
real investment � but unequally across �rms. The bypassing of positive NPV projects reduces the
strength of future economic recovery. In this context, one can better understand why policy-makers
undertook unprecedented actions to unfreeze credit markets. Looking beyond the crisis, our paper
provides evidence that �nancial constraints hamper investment in valuable projects. Relaxing these
constraints would produce additional long-term growth opportunities in the economy.
21
References
Abadie, A., D. Drukker, J. Herr, and G. Imbens, 2004, �Implementing Matching Estimators forAverage Treatment E¤ects in Stata,�Stata Journal 4, 290-311.
Abadie, A., and G. Imbens, 2002, �Simple and Bias-Corrected Matching Estimators for AverageTreatment E¤ects,�Technical Working Paper T0283, NBER.
Almeida, H., M. Campello, and M. Weisbach, 2004, �The Cash Flow Sensitivity of Cash,�Journalof Finance 59, 1777-1804.
Becker, S., and A. Ichino, 2002, �Estimation of Average Treatment E¤ects Based on PropensityScores,�Stata Journal 4, 358-377.
Blanchard, O., F. Lopez-de-Silanes, and A. Shleifer, 1994, �What Do Firms Do with Cash Wind-falls?�Journal of Financial Economics 36, 337-360.
Cleary, S., 1999, �The Relationship Between Firm Investment and Financial Status,� Journal ofFinance 54, 673-692
Dehejia, R., and S. Wahba, 2002, �Propensity Score-Matching Methods for Nonexperimental CausalStudies,�Review of Economics and Statistics 84, 151-161.
Fazzari, S., R. G. Hubbard, and B. Petersen, 1988, �Financing Constraints and Corporate Invest-ment,�Brookings Papers on Economic Activity 1, 141-195.
Holmstrom, B., and J. Tirole, 1998, �Private and Public Supply of Liquidity,�Journal of PoliticalEconomy 106, 1-40.
Hoshi, T., A. Kashyap, and D. Scharfstein, 1991, �Corporate Structure, Liquidity, and Investment:Evidence from Japanese Industrial Groups,�Quarterly Journal of Economics 106, 33-60.
Hubbard, R. G., 1998, �Capital Market Imperfections and Investment,�Journal of Economic Lit-erature 36, 193-227.
Imbens, G., 2004, �Nonparametric Estimation of Average Treatment E¤ects under Exogeneity: AReview,�Review of Economics and Statistics 86, 4-29.
Ivashina, V., and D. Scharfstein, 2008, �Bank Lending During the Financial Crisis of 2008,�WorkingPaper, Harvard Business School.
Kaplan, S., and L. Zingales, 1997, �Do Financing Constraints Explain why Investment is Correlatedwith Cash Flow?�Quarterly Journal of Economics 112, 169-215.
Lamont, O., 1997, �Cash Flow and Investment: Evidence from Internal Capital Markets,��Journalof Finance 52, 83-110.
Lemmon, M., and M. Roberts, 2008, �The Response of Corporate Financing and Investment toChanges in the Supply of Credit,�forthcoming, Journal of Financial and Quantitative Analysis.
Lins, K., H. Servaes, and P. Tufano, 2009, �What Drives Corporate Liquidity? An InternationalSurvey of Cash Holdings and Lines of Credit,�Working Paper, Harvard Business School.
22
Oliner, S., and G. Rudebusch, 1992, �Sources of the Financing Hierarchy for Business Investment,�Review of Economics and Statistics 74, 643-654.
Paravisini, D., 2008, �Local Bank Financial Constraints and Firm Access to External Finance,�Journal of Finance 63, 2161-2193.
Rauh, J., 2006, �Investment and Financing Constraints: Evidence from the Funding of CorporatePension Plans,�Journal of Finance 61, 33-75.
Rosenbaum, P., and D. Rubin, 1983, �The Central Role of the Propensity Score in ObservationalStudies for Causal E¤ects,�Biometrika 70, 41-55.
Stein, J., 2003, �Agency Information and Corporate Investment,�in G. Constantinides, M. Harris,and R. Stulz (eds.), Handbook of the Economics of Finance, Elsevier/North-Holland.
Whited, T., and G. Wu, 2006, �Financial Constraints Risk,�Review of Financial Studies 19, 531-559.
23
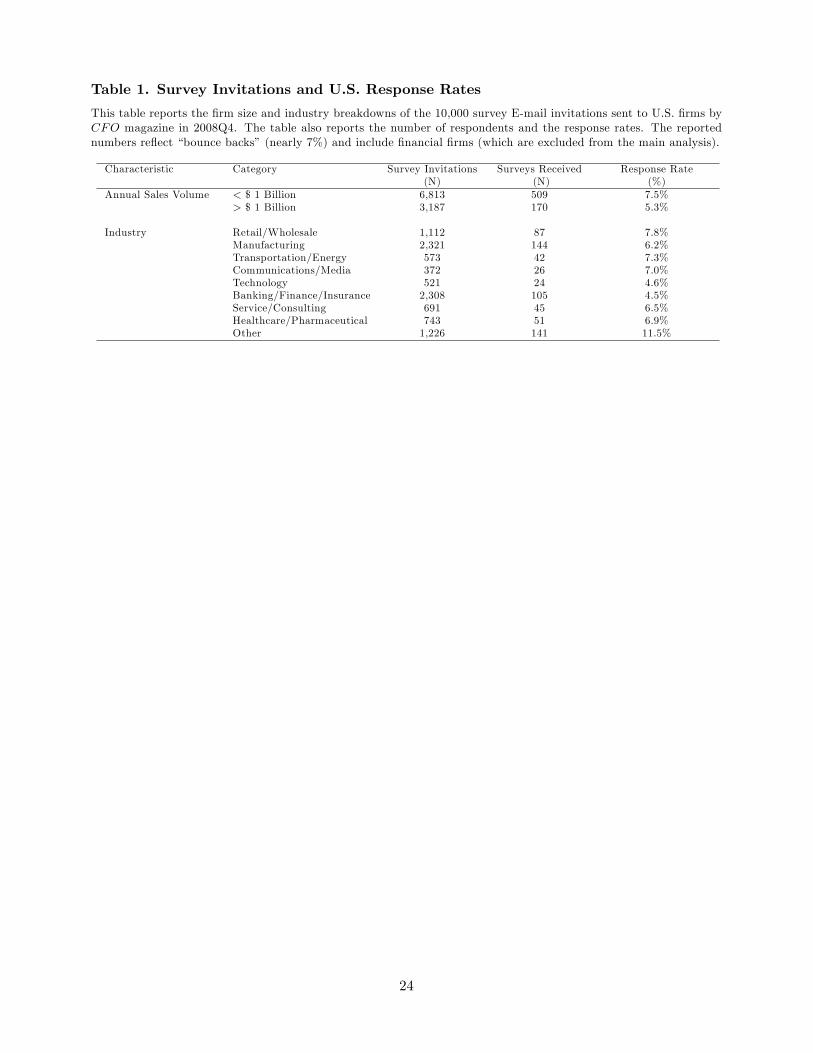
Table 1. Survey Invitations and U.S. Response Rates
This table reports the �rm size and industry breakdowns of the 10,000 survey E-mail invitations sent to U.S. �rms byCFO magazine in 2008Q4. The table also reports the number of respondents and the response rates. The reportednumbers re�ect �bounce backs�(nearly 7%) and include �nancial �rms (which are excluded from the main analysis).
Characteristic Category Survey Invitations Surveys Received Response Rate(N) (N) (%)
Annual Sales Volume < $ 1 Billion 6,813 509 7.5%> $ 1 Billion 3,187 170 5.3%
Industry Retail/Wholesale 1,112 87 7.8%Manufacturing 2,321 144 6.2%Transportation/Energy 573 42 7.3%Communications/Media 372 26 7.0%Technology 521 24 4.6%Banking/Finance/Insurance 2,308 105 4.5%Service/Consulting 691 45 6.5%Healthcare/Pharmaceutical 743 51 6.9%Other 1,226 141 11.5%
24
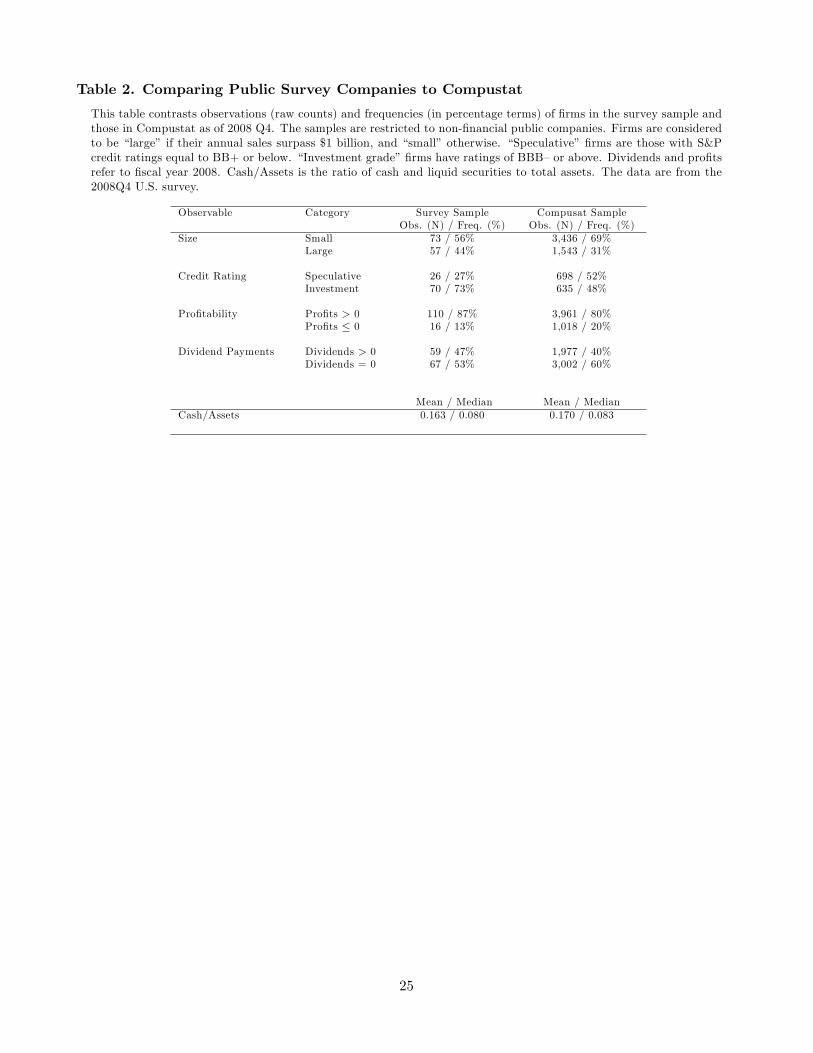
Table 2. Comparing Public Survey Companies to Compustat
This table contrasts observations (raw counts) and frequencies (in percentage terms) of �rms in the survey sample andthose in Compustat as of 2008 Q4. The samples are restricted to non-�nancial public companies. Firms are consideredto be �large� if their annual sales surpass $1 billion, and �small� otherwise. �Speculative��rms are those with S&Pcredit ratings equal to BB+ or below. �Investment grade��rms have ratings of BBB�or above. Dividends and pro�tsrefer to �scal year 2008. Cash/Assets is the ratio of cash and liquid securities to total assets. The data are from the2008Q4 U.S. survey.
Observable Category Survey Sample Compusat SampleObs. (N) / Freq. (%) Obs. (N) / Freq. (%)
Size Small 73 / 56% 3,436 / 69%Large 57 / 44% 1,543 / 31%
Credit Rating Speculative 26 / 27% 698 / 52%Investment 70 / 73% 635 / 48%
Pro�tability Pro�ts > 0 110 / 87% 3,961 / 80%Pro�ts � 0 16 / 13% 1,018 / 20%
Dividend Payments Dividends > 0 59 / 47% 1,977 / 40%Dividends = 0 67 / 53% 3,002 / 60%
Mean / Median Mean / MedianCash/Assets 0.163 / 0.080 0.170 / 0.083
25
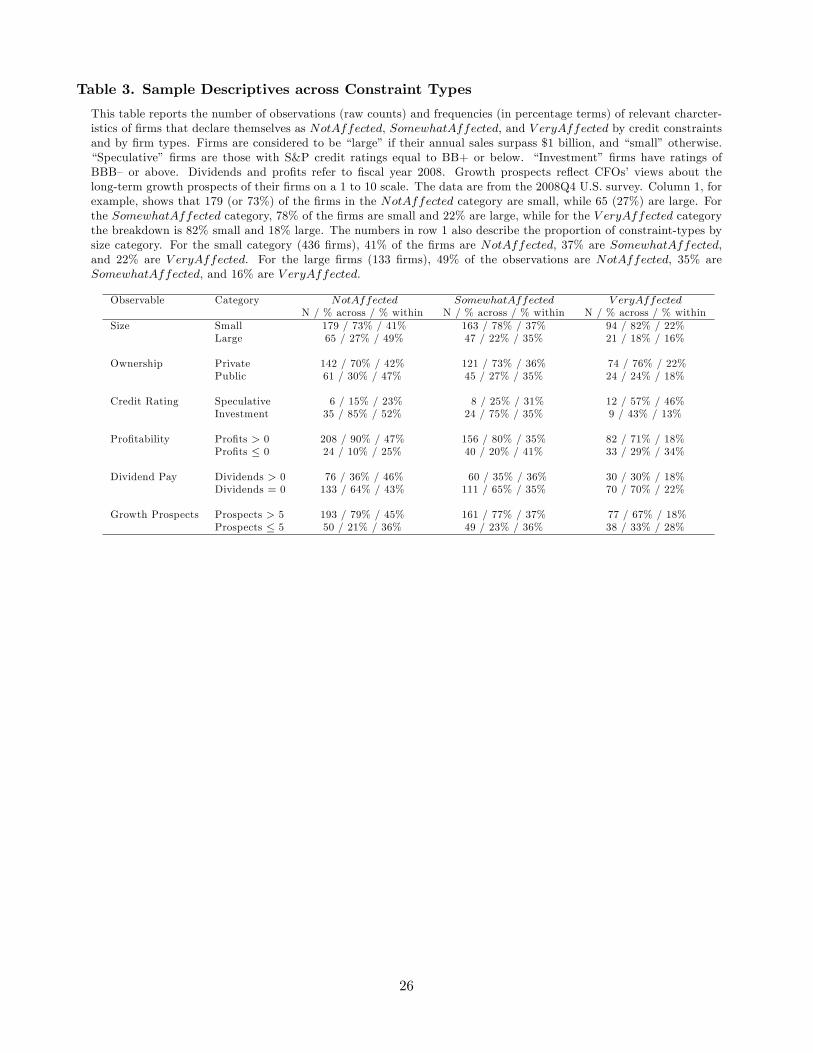
Table 3. Sample Descriptives across Constraint Types
This table reports the number of observations (raw counts) and frequencies (in percentage terms) of relevant charcter-istics of �rms that declare themselves as NotAffected, SomewhatAffected, and V eryAffected by credit constraintsand by �rm types. Firms are considered to be �large� if their annual sales surpass $1 billion, and �small� otherwise.�Speculative� �rms are those with S&P credit ratings equal to BB+ or below. �Investment� �rms have ratings ofBBB� or above. Dividends and pro�ts refer to �scal year 2008. Growth prospects re�ect CFOs� views about thelong-term growth prospects of their �rms on a 1 to 10 scale. The data are from the 2008Q4 U.S. survey. Column 1, forexample, shows that 179 (or 73%) of the �rms in the NotAffected category are small, while 65 (27%) are large. Forthe SomewhatAffected category, 78% of the �rms are small and 22% are large, while for the V eryAffected categorythe breakdown is 82% small and 18% large. The numbers in row 1 also describe the proportion of constraint-types bysize category. For the small category (436 �rms), 41% of the �rms are NotAffected, 37% are SomewhatAffected,and 22% are V eryAffected. For the large �rms (133 �rms), 49% of the observations are NotAffected, 35% areSomewhatAffected, and 16% are V eryAffected.
Observable Category NotAffected SomewhatAffected V eryAffectedN / % across / % within N / % across / % within N / % across / % within
Size Small 179 / 73% / 41% 163 / 78% / 37% 94 / 82% / 22%Large 65 / 27% / 49% 47 / 22% / 35% 21 / 18% / 16%
Ownership Private 142 / 70% / 42% 121 / 73% / 36% 74 / 76% / 22%Public 61 / 30% / 47% 45 / 27% / 35% 24 / 24% / 18%
Credit Rating Speculative 6 / 15% / 23% 8 / 25% / 31% 12 / 57% / 46%Investment 35 / 85% / 52% 24 / 75% / 35% 9 / 43% / 13%
Pro�tability Pro�ts > 0 208 / 90% / 47% 156 / 80% / 35% 82 / 71% / 18%Pro�ts � 0 24 / 10% / 25% 40 / 20% / 41% 33 / 29% / 34%
Dividend Pay Dividends > 0 76 / 36% / 46% 60 / 35% / 36% 30 / 30% / 18%Dividends = 0 133 / 64% / 43% 111 / 65% / 35% 70 / 70% / 22%
Growth Prospects Prospects > 5 193 / 79% / 45% 161 / 77% / 37% 77 / 67% / 18%Prospects � 5 50 / 21% / 36% 49 / 23% / 36% 38 / 33% / 28%
26
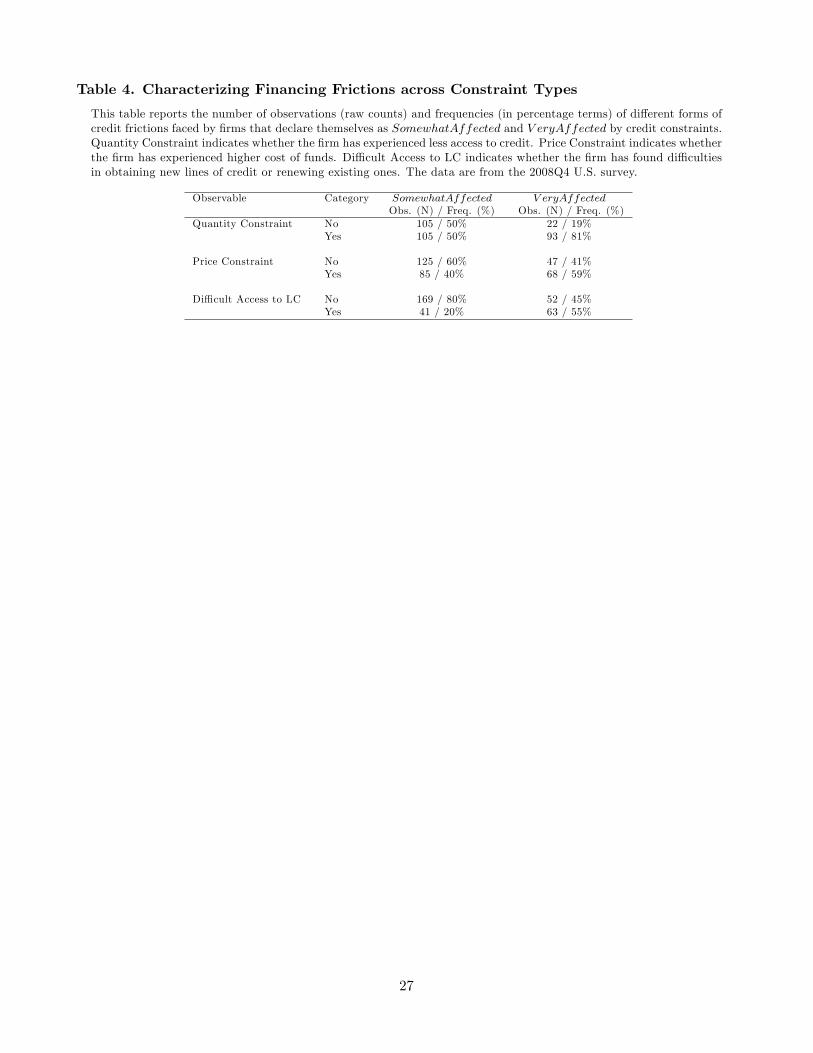
Table 4. Characterizing Financing Frictions across Constraint Types
This table reports the number of observations (raw counts) and frequencies (in percentage terms) of di¤erent forms ofcredit frictions faced by �rms that declare themselves as SomewhatAffected and V eryAffected by credit constraints.Quantity Constraint indicates whether the �rm has experienced less access to credit. Price Constraint indicates whetherthe �rm has experienced higher cost of funds. Di¢ cult Access to LC indicates whether the �rm has found di¢ cultiesin obtaining new lines of credit or renewing existing ones. The data are from the 2008Q4 U.S. survey.
Observable Category SomewhatAffected V eryAffectedObs. (N) / Freq. (%) Obs. (N) / Freq. (%)
Quantity Constraint No 105 / 50% 22 / 19%Yes 105 / 50% 93 / 81%
Price Constraint No 125 / 60% 47 / 41%Yes 85 / 40% 68 / 59%
Di¢ cult Access to LC No 169 / 80% 52 / 45%Yes 41 / 20% 63 / 55%
27
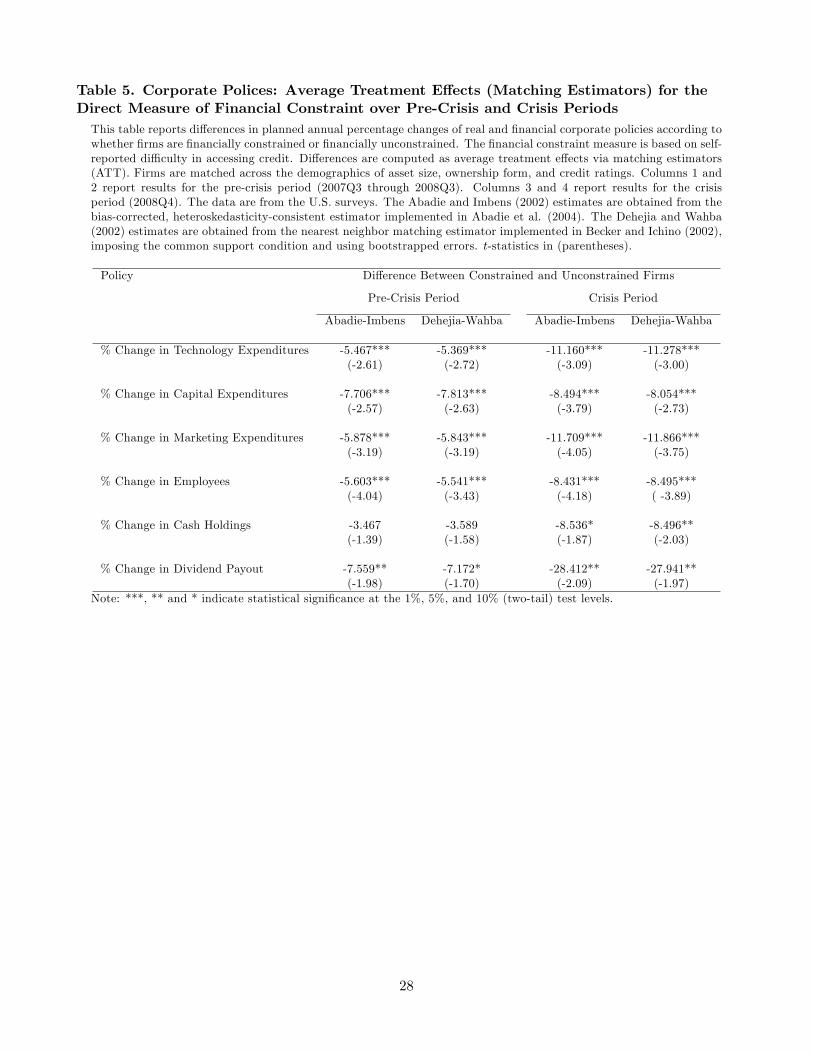
Table 5. Corporate Polices: Average Treatment E¤ects (Matching Estimators) for theDirect Measure of Financial Constraint over Pre-Crisis and Crisis PeriodsThis table reports di¤erences in planned annual percentage changes of real and �nancial corporate policies according towhether �rms are �nancially constrained or �nancially unconstrained. The �nancial constraint measure is based on self-reported di¢ culty in accessing credit. Di¤erences are computed as average treatment e¤ects via matching estimators(ATT). Firms are matched across the demographics of asset size, ownership form, and credit ratings. Columns 1 and2 report results for the pre-crisis period (2007Q3 through 2008Q3). Columns 3 and 4 report results for the crisisperiod (2008Q4). The data are from the U.S. surveys. The Abadie and Imbens (2002) estimates are obtained from thebias-corrected, heteroskedasticity-consistent estimator implemented in Abadie et al. (2004). The Dehejia and Wahba(2002) estimates are obtained from the nearest neighbor matching estimator implemented in Becker and Ichino (2002),imposing the common support condition and using bootstrapped errors. t-statistics in (parentheses).
Policy Di¤erence Between Constrained and Unconstrained Firms
Pre-Crisis Period Crisis Period
Abadie-Imbens Dehejia-Wahba Abadie-Imbens Dehejia-Wahba
% Change in Technology Expenditures -5.467*** -5.369*** -11.160*** -11.278***(-2.61) (-2.72) (-3.09) (-3.00)
% Change in Capital Expenditures -7.706*** -7.813*** -8.494*** -8.054***(-2.57) (-2.63) (-3.79) (-2.73)
% Change in Marketing Expenditures -5.878*** -5.843*** -11.709*** -11.866***(-3.19) (-3.19) (-4.05) (-3.75)
% Change in Employees -5.603*** -5.541*** -8.431*** -8.495***(-4.04) (-3.43) (-4.18) ( -3.89)
% Change in Cash Holdings -3.467 -3.589 -8.536* -8.496**(-1.39) (-1.58) (-1.87) (-2.03)
% Change in Dividend Payout -7.559** -7.172* -28.412** -27.941**(-1.98) (-1.70) (-2.09) (-1.97)
Note: ***, ** and * indicate statistical signi�cance at the 1%, 5%, and 10% (two-tail) test levels.
28
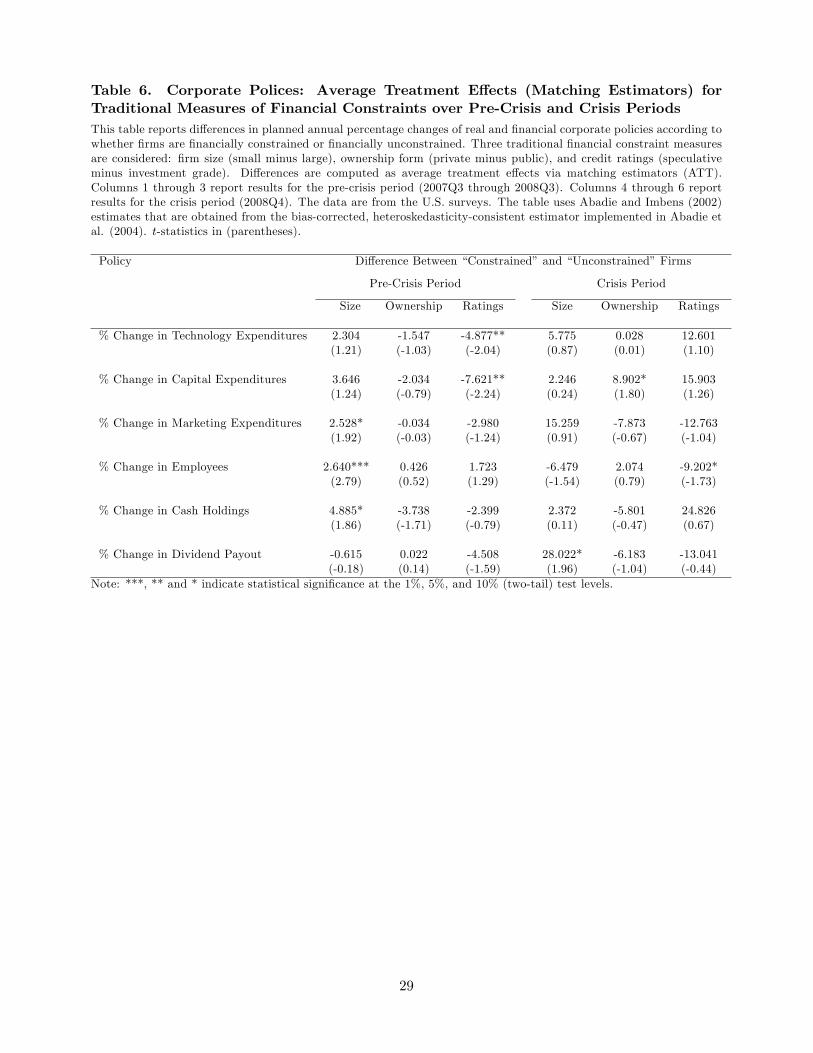
Table 6. Corporate Polices: Average Treatment E¤ects (Matching Estimators) forTraditional Measures of Financial Constraints over Pre-Crisis and Crisis PeriodsThis table reports di¤erences in planned annual percentage changes of real and �nancial corporate policies according towhether �rms are �nancially constrained or �nancially unconstrained. Three traditional �nancial constraint measuresare considered: �rm size (small minus large), ownership form (private minus public), and credit ratings (speculativeminus investment grade). Di¤erences are computed as average treatment e¤ects via matching estimators (ATT).Columns 1 through 3 report results for the pre-crisis period (2007Q3 through 2008Q3). Columns 4 through 6 reportresults for the crisis period (2008Q4). The data are from the U.S. surveys. The table uses Abadie and Imbens (2002)estimates that are obtained from the bias-corrected, heteroskedasticity-consistent estimator implemented in Abadie etal. (2004). t-statistics in (parentheses).
Policy Di¤erence Between �Constrained�and �Unconstrained�Firms
Pre-Crisis Period Crisis Period
Size Ownership Ratings Size Ownership Ratings
% Change in Technology Expenditures 2.304 -1.547 -4.877** 5.775 0.028 12.601(1.21) (-1.03) (-2.04) (0.87) (0.01) (1.10)
% Change in Capital Expenditures 3.646 -2.034 -7.621** 2.246 8.902* 15.903(1.24) (-0.79) (-2.24) (0.24) (1.80) (1.26)
% Change in Marketing Expenditures 2.528* -0.034 -2.980 15.259 -7.873 -12.763(1.92) (-0.03) (-1.24) (0.91) (-0.67) (-1.04)
% Change in Employees 2.640*** 0.426 1.723 -6.479 2.074 -9.202*(2.79) (0.52) (1.29) (-1.54) (0.79) (-1.73)
% Change in Cash Holdings 4.885* -3.738 -2.399 2.372 -5.801 24.826(1.86) (-1.71) (-0.79) (0.11) (-0.47) (0.67)
% Change in Dividend Payout -0.615 0.022 -4.508 28.022* -6.183 -13.041(-0.18) (0.14) (-1.59) (1.96) (-1.04) (-0.44)
Note: ***, ** and * indicate statistical signi�cance at the 1%, 5%, and 10% (two-tail) test levels.
29
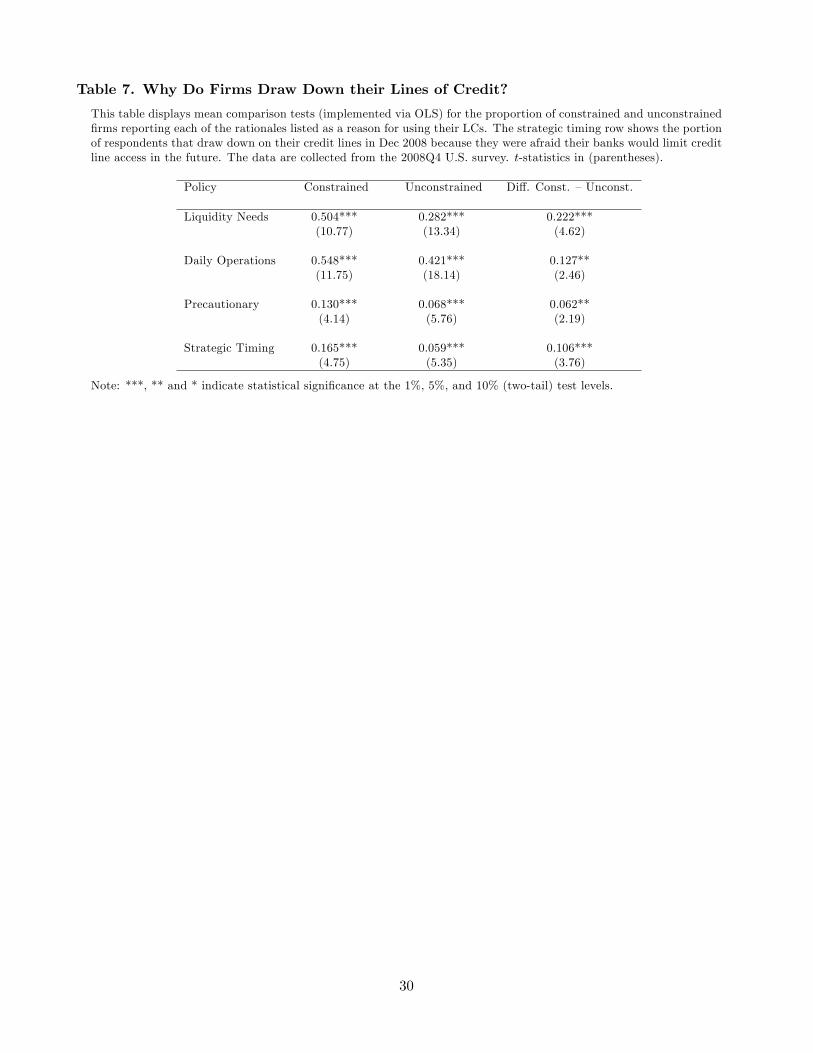
Table 7. Why Do Firms Draw Down their Lines of Credit?
This table displays mean comparison tests (implemented via OLS) for the proportion of constrained and unconstrained�rms reporting each of the rationales listed as a reason for using their LCs. The strategic timing row shows the portionof respondents that draw down on their credit lines in Dec 2008 because they were afraid their banks would limit creditline access in the future. The data are collected from the 2008Q4 U.S. survey. t-statistics in (parentheses).
Policy Constrained Unconstrained Di¤. Const. �Unconst.
Liquidity Needs 0.504*** 0.282*** 0.222***(10.77) (13.34) (4.62)
Daily Operations 0.548*** 0.421*** 0.127**(11.75) (18.14) (2.46)
Precautionary 0.130*** 0.068*** 0.062**(4.14) (5.76) (2.19)
Strategic Timing 0.165*** 0.059*** 0.106***(4.75) (5.35) (3.76)
Note: ***, ** and * indicate statistical signi�cance at the 1%, 5%, and 10% (two-tail) test levels.
30
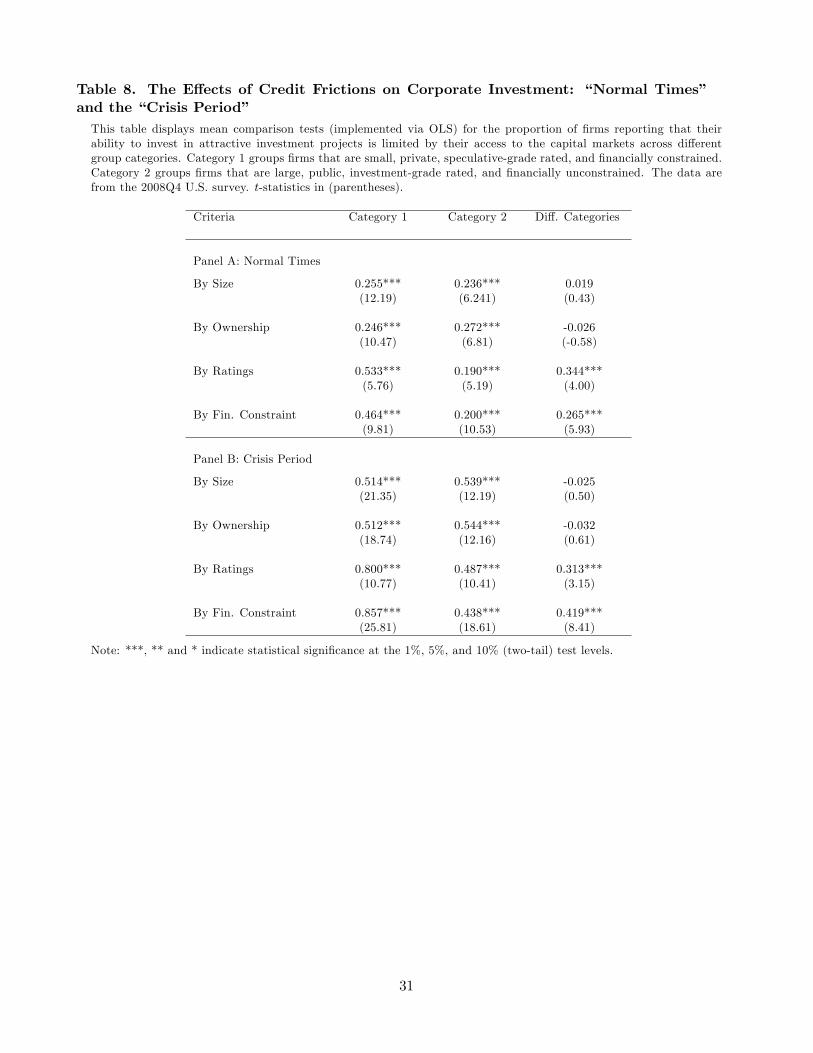
Table 8. The E¤ects of Credit Frictions on Corporate Investment: �Normal Times�and the �Crisis Period�This table displays mean comparison tests (implemented via OLS) for the proportion of �rms reporting that theirability to invest in attractive investment projects is limited by their access to the capital markets across di¤erentgroup categories. Category 1 groups �rms that are small, private, speculative-grade rated, and �nancially constrained.Category 2 groups �rms that are large, public, investment-grade rated, and �nancially unconstrained. The data arefrom the 2008Q4 U.S. survey. t-statistics in (parentheses).
Criteria Category 1 Category 2 Di¤. Categories
Panel A: Normal Times
By Size 0.255*** 0.236*** 0.019(12.19) (6.241) (0.43)
By Ownership 0.246*** 0.272*** -0.026(10.47) (6.81) (-0.58)
By Ratings 0.533*** 0.190*** 0.344***(5.76) (5.19) (4.00)
By Fin. Constraint 0.464*** 0.200*** 0.265***(9.81) (10.53) (5.93)
Panel B: Crisis Period
By Size 0.514*** 0.539*** -0.025(21.35) (12.19) (0.50)
By Ownership 0.512*** 0.544*** -0.032(18.74) (12.16) (0.61)
By Ratings 0.800*** 0.487*** 0.313***(10.77) (10.41) (3.15)
By Fin. Constraint 0.857*** 0.438*** 0.419***(25.81) (18.61) (8.41)
Note: ***, ** and * indicate statistical signi�cance at the 1%, 5%, and 10% (two-tail) test levels.
31
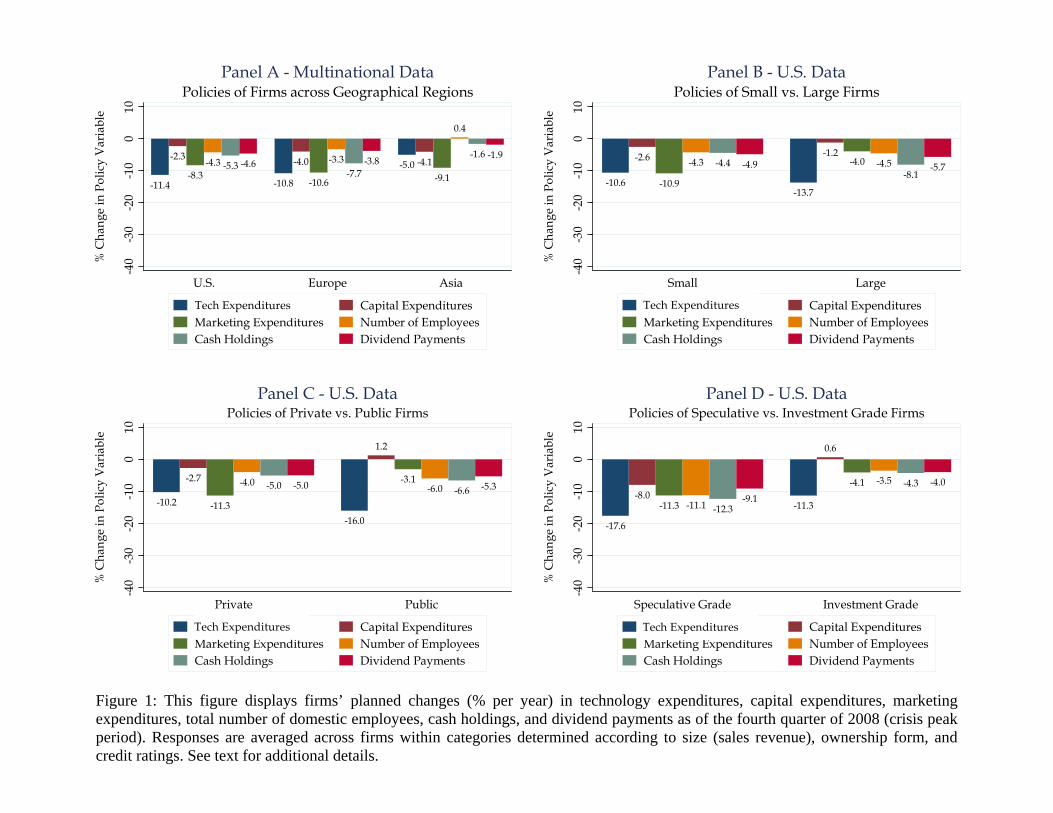
-11.4
-2.3
-8.3-4.3 -5.3 -4.6
-10.8
-4.0
-10.6
-3.3-7.7
-3.8 -5.0 -4.1-9.1
0.4
-1.6 -1.9
-40
-30
-20
-10
010
% C
hang
e in
Pol
icy
Var
iabl
e
U.S. Europe Asia
Policies of Firms across Geographical RegionsPanel A - Multinational Data
R&D Expenditures Capital ExpendituresMarketing Expenditures Number of EmployeesCash Holdings Dividend Payments
-10.6
-2.6
-10.9
-4.3 -4.4 -4.9
-13.7
-1.2-4.0 -4.5
-8.1-5.7
-40
-30
-20
-10
010
% C
hang
e in
Pol
icy
Var
iabl
e
Small Large
Policies of Small vs. Large FirmsPanel B - U.S. Data
R&D Expenditures Capital ExpendituresMarketing Expenditures Number of EmployeesCash Holdings Dividend Payments
-10.2
-2.7
-11.3
-4.0 -5.0 -5.0
-16.0
1.2
-3.1-6.0 -6.6 -5.3
-40
-30
-20
-10
010
% C
hang
e in
Pol
icy
Var
iabl
e
Private Public
Policies of Private vs. Public FirmsPanel C - U.S. Data
R&D Expenditures Capital ExpendituresMarketing Expenditures Number of EmployeesCash Holdings Dividend Payments
-17.6
-8.0-11.3 -11.1 -12.3
-9.1-11.3
0.6
-4.1 -3.5 -4.3 -4.0
-40
-30
-20
-10
010
% C
hang
e in
Pol
icy
Var
iabl
e
Speculative Grade Investment Grade
Policies of Speculative vs. Investment Grade FirmsPanel D - U.S. Data
R&D Expenditures Capital ExpendituresMarketing Expenditures Number of EmployeesCash Holdings Dividend Payments
Figure 1: This figure displays firms’ planned changes (% per year) in technology expenditures, capital expenditures, marketing expenditures, total number of domestic employees, cash holdings, and dividend payments as of the fourth quarter of 2008 (crisis peak period). Responses are averaged across firms within categories determined according to size (sales revenue), ownership form, and credit ratings. See text for additional details.
Tech Expenditures Tech Expenditures
Tech Expenditures Tech Expenditures
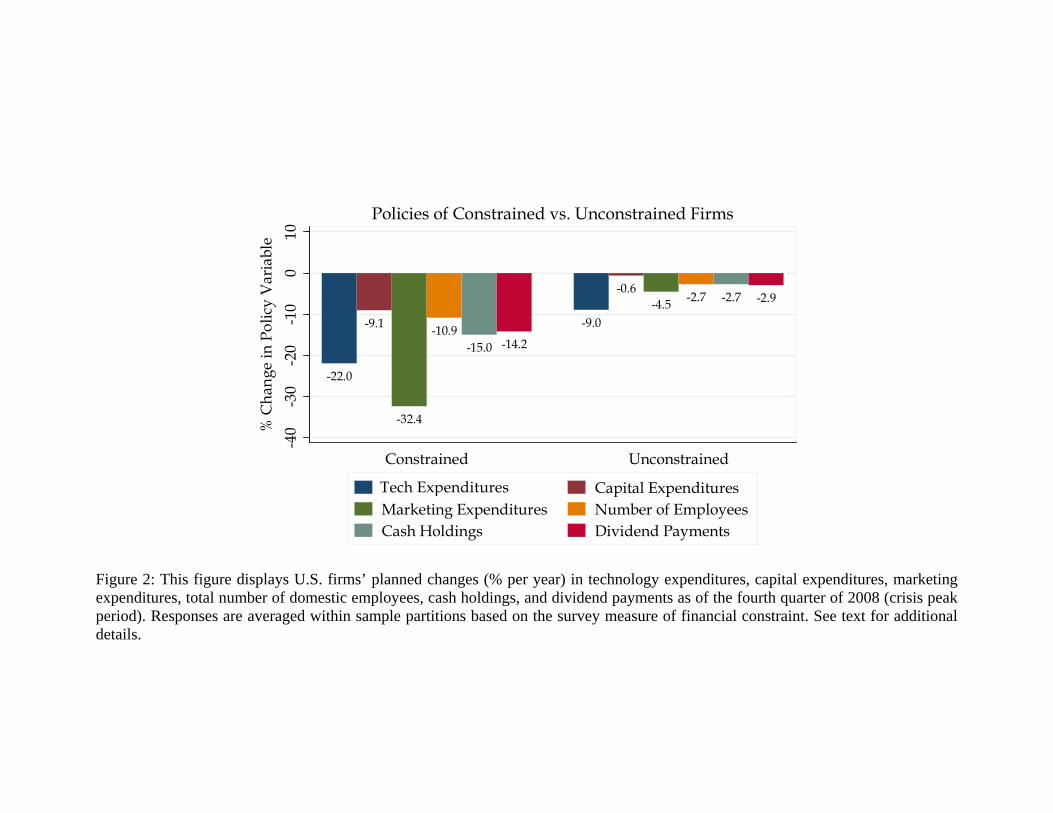
-22.0
-9.1
-32.4
-10.9-15.0 -14.2
-9.0
-0.6-4.5 -2.7 -2.7 -2.9
-40
-30
-20
-10
010
% C
hang
e in
Pol
icy
Var
iabl
e
Constrained Unconstrained
Policies of Constrained vs. Unconstrained FirmsPanel B - Two Constraint Categories
R&D Expenditures Capital ExpendituresMarketing Expenditures Number of EmployeesCash Holdings Dividend Payments
Figure 2: This figure displays U.S. firms’ planned changes (% per year) in technology expenditures, capital expenditures, marketing expenditures, total number of domestic employees, cash holdings, and dividend payments as of the fourth quarter of 2008 (crisis peak period). Responses are averaged within sample partitions based on the survey measure of financial constraint. See text for additional details.
Tech Expenditures
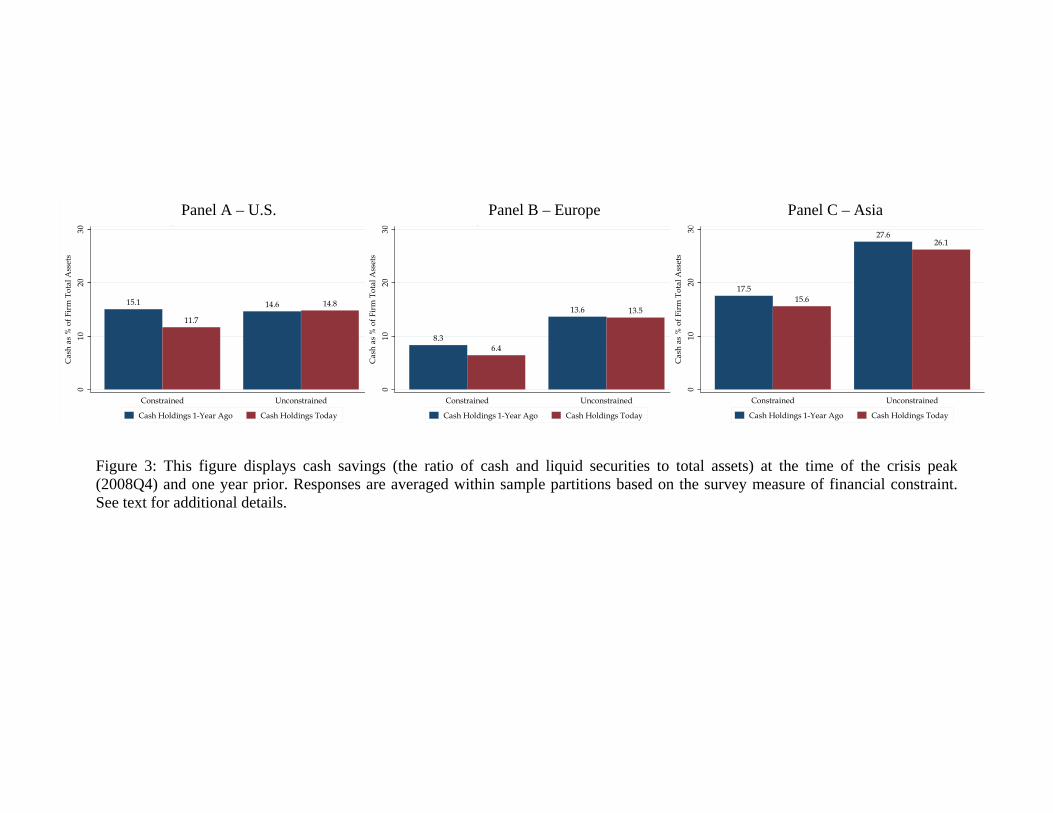
15.1
11.7
14.6 14.8
010
2030
Cas
h as
% o
f Fir
m T
otal
Ass
ets
Constrained Unconstrained
Cash Savings of Constrained vs. Unconstrained FirmsPanel D - U.S.
Cash Holdings 1-Year Ago Cash Holdings Today
8.36.4
13.6 13.5
010
2030
Cas
h as
% o
f Fir
m T
otal
Ass
ets
Constrained Unconstrained
Cash Savings of Constrained vs. Unconstrained FirmsPanel E - Europe
Cash Holdings 1-Year Ago Cash Holdings Today
17.515.6
27.626.1
010
2030
Cas
h as
% o
f Fir
m T
otal
Ass
ets
Constrained Unconstrained
Cash Savings of Constrained vs. Unconstrained FirmsPanel F - Asia
Cash Holdings 1-Year Ago Cash Holdings Today
Figure 3: This figure displays cash savings (the ratio of cash and liquid securities to total assets) at the time of the crisis peak (2008Q4) and one year prior. Responses are averaged within sample partitions based on the survey measure of financial constraint. See text for additional details.
Panel A – U.S. Panel B – Europe Panel C – Asia
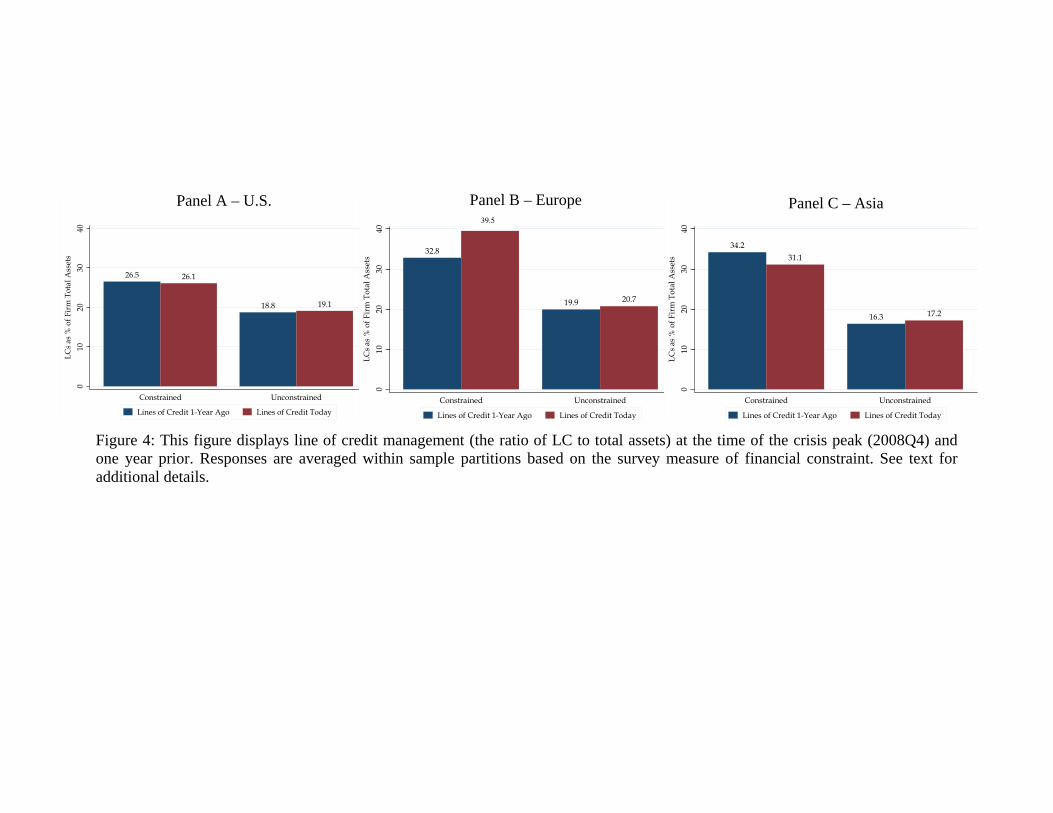
26.5 26.1
18.8 19.1
010
2030
40LC
s as
% o
f Fir
m T
otal
Ass
ets
Constrained Unconstrained
LC Policies of Constrained vs. Unconstrained FirmsPanel D - U.S.
Lines of Credit 1-Year Ago Lines of Credit Today
32.8
39.5
19.9 20.7
010
2030
40LC
s as
% o
f Fir
m T
otal
Ass
ets
Constrained Unconstrained
LC Policies of Constrained vs. Unconstrained FirmsPanel E - Europe
Lines of Credit 1-Year Ago Lines of Credit Today
34.231.1
16.3 17.2
010
2030
40LC
s as
% o
f Fir
m T
otal
Ass
ets
Constrained Unconstrained
LC Policies of Constrained vs. Unconstrained FirmsPanel F - Asia
Lines of Credit 1-Year Ago Lines of Credit Today Figure 4: This figure displays line of credit management (the ratio of LC to total assets) at the time of the crisis peak (2008Q4) and one year prior. Responses are averaged within sample partitions based on the survey measure of financial constraint. See text for additional details.
Panel C – Asia Panel A – U.S. 39.5
Panel B – Europe
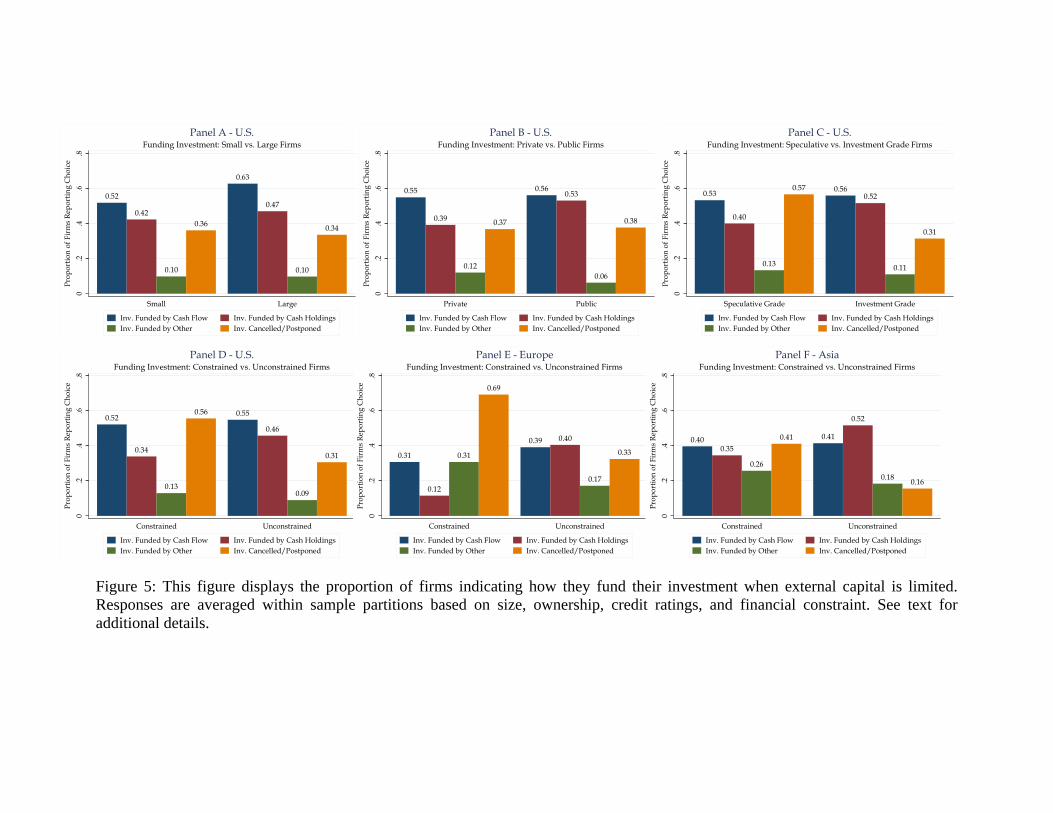
0.52
0.42
0.10
0.36
0.63
0.47
0.10
0.34
0.2
.4.6
.8Pr
opor
tion
of F
irm
s Re
port
ing
Cho
ice
Small Large
Funding Investment: Small vs. Large FirmsPanel A - U.S.
Inv. Funded by Cash Flow Inv. Funded by Cash HoldingsInv. Funded by Other Inv. Cancelled/Postponed
0.55
0.39
0.12
0.37
0.560.53
0.06
0.38
0.2
.4.6
.8Pr
opor
tion
of F
irm
s Re
port
ing
Cho
ice
Private Public
Funding Investment: Private vs. Public FirmsPanel B - U.S.
Inv. Funded by Cash Flow Inv. Funded by Cash HoldingsInv. Funded by Other Inv. Cancelled/Postponed
0.53
0.40
0.13
0.57 0.560.52
0.11
0.31
0.2
.4.6
.8Pr
opor
tion
of F
irm
s Re
port
ing
Cho
ice
Speculative Grade Investment Grade
Funding Investment: Speculative vs. Investment Grade FirmsPanel C - U.S.
Inv. Funded by Cash Flow Inv. Funded by Cash HoldingsInv. Funded by Other Inv. Cancelled/Postponed
0.52
0.34
0.13
0.56 0.55
0.46
0.09
0.31
0.2
.4.6
.8Pr
opor
tion
of F
irm
s Re
port
ing
Cho
ice
Constrained Unconstrained
Funding Investment: Constrained vs. Unconstrained FirmsPanel D - U.S.
Inv. Funded by Cash Flow Inv. Funded by Cash HoldingsInv. Funded by Other Inv. Cancelled/Postponed
0.31
0.12
0.31
0.69
0.39 0.40
0.17
0.33
0.2
.4.6
.8Pr
opor
tion
of F
irm
s Re
port
ing
Cho
ice
Constrained Unconstrained
Funding Investment: Constrained vs. Unconstrained FirmsPanel E - Europe
Inv. Funded by Cash Flow Inv. Funded by Cash HoldingsInv. Funded by Other Inv. Cancelled/Postponed
0.400.35
0.26
0.41 0.41
0.52
0.18 0.16
0.2
.4.6
.8Pr
opor
tion
of F
irm
s Re
port
ing
Cho
ice
Constrained Unconstrained
Funding Investment: Constrained vs. Unconstrained FirmsPanel F - Asia
Inv. Funded by Cash Flow Inv. Funded by Cash HoldingsInv. Funded by Other Inv. Cancelled/Postponed
Figure 5: This figure displays the proportion of firms indicating how they fund their investment when external capital is limited. Responses are averaged within sample partitions based on size, ownership, credit ratings, and financial constraint. See text for additional details.