Embed Size (px)
Citation preview
The real digital divide? Understanding the demographics of non-users
and limited users of the internet:an analysis of Ofcom data
Good Things Foundation & Professor Simeon Yates
Supported by:
June 2017
Page 2The real digital divide? Understanding the demographics of non-users and limited users of the internet: an analysis of Ofcom data
Contents
Foreword 3Good Things Foundation 3
The headlines 4
Introduction 5About this report 5How we’ve defined non-users and limited users of the internet 5A note on age groups used in this report 6
Findings 7The population as a whole 7Segmenting the non-user population 7
The whole population 7Disadvantaged and socially excluded 7Age 8Social class 9Annual household income 10Education 11Disabled people and poor health 11Employment status 12The non-user population with no other digital exclusion indicators 13Regional variations 14Ethnicity 15Gender 16
Segmenting limited-users of the internet 16Age 16Social class 17Annual household income 17Education 18Disabled people and poor health 18Employment status 20Regional variations 20
Gaps in the data and recommendations for further research 22
Page 2 Page 3The real digital divide? Understanding the demographics of non-users and limited users of the internet: an analysis of Ofcom data
Foreword: Good Things Foundation
How much and how often you use the internet is a useful insight into who is digitally excluded. This gives us a way of assessing how the internet is impacting people’s lives - so how they are applying their basic digital skills to their lives or not.
This new research breaks down the demographics of people who are not gaining full benefit from the internet - either because they’re complete non users, or that they’re using the internet in a limited way - be it only using one site or a couple of apps, or going online less than once a week.
The demographics of these people don’t really come as any surprise. 90% of non users are likely to be disadvantaged - which takes into account poor health and disability, social class and those who left school at 16 or under.
I’m thrilled that this new analysis is helping to build a fuller picture of what it means to be digitally excluded. We know basic digital skills is a big issue (18% of people say they aren’t online as they don’t have the skills), but it’s not the only measure of whether people are digitally excluded. Looking at usage helps us to show that digital exclusion is a much more complex issue.
For people to thrive in today’s increasingly digital world, using the internet on a regular basis and using the breadth of what’s on offer is vital. For most people, this means at least every day, if not several times a day. This might be to keep an eye your bank balance, check on the price of your utilities, or to find work. Most people in work are using the internet on a daily basis. If people aren’t using the internet weekly, they’re likely to be excluded in a range of ways - including having less money available, fewer opportunities to find work, and less access to information that might make their lives better - such as health information, information to help their children with their homework, and more. So the way people are using the internet - how much and how often - is vital to understand whether they’re really getting the benefit they could be.
This new analysis will help us to work with government and corporate partners to understand issues of digital exclusion and how together we can support it. We’re delighted BT have supported us to carry out this research, and we enjoyed working with Professor Simeon Yates to get the analysis right. We’re hoping to continue working with BT to take this further, to empower more people to have better lives and realise the opportunities the big wide web has to offer. We’re keen to hear from anyone else who wants to get involved.
Helen MilnerCEO, Good Things Foundation
Page 4The real digital divide? Understanding the demographics of non-users and limited users of the internet: an analysis of Ofcom data
Headline Findings
There are 15.2 million people in the UK who are either non-users, or limited users of the internet
• An estimated 7.8 million people (14.9%) do not currently use the internet in theUK.
• A further 7.4 million people (14.3%) in the UK are ‘limited users’ of the internet,giving a total population of 15.2 million people who are not using the internet toits full potential.
90% of non-users can be classed as disadvantaged• This takes into account the most common indicators - social class DE and being
disabled, as well as leaving education at 16 or under.
Although age is a factor in defining non and limited users, it isn’t the only one: • 18.9% of under 65s are non or limited users of the internet; a population of
approximately 7.5m people.• Nearly half (48.9%) of non or limited users of the internet are under the age of 65.
The most pronounced indicators of non and limited use include age, disability, social class, income and the age at which people leave education:
• 64.4% of non-users are aged 65 or over: 25.3% aged 65-74; and 39.1% aged over75.
• 47.7% of non-users have a disability or long standing health issue.• 49.5% of non-users are in DE social class.• 44.5% of non-users have an annual household income less than £11,500.• 78.3% of non-users left education at aged 16 or under.
There are significant regional hotspots for non-users:• There are estimated non-user populations of approximately 1 million people in
each of the West Midlands, North West and Yorkshire and Humber regions.
Employment status matters for limited and non users• 65.1% of non-users are retired; an estimated population of 5 million people in the
UK.• 19.2% of non-users are not working or looking for work; an estimated population
of 1.5 million people in the UK, and 21.8% of limited users are not working orlooking for work.

Page 4 Page 5The real digital divide? Understanding the demographics of non-users and limited users of the internet: an analysis of Ofcom data
Introduction
About this reportThis report builds on and analyses the 2015 data from Ofcom’s ‘Adults’ Media Use and Attitudes Report’ to establish trends for particular demographic groups in relation to use of the internet. In particular, we focus on the groups of people that do not access the internet at all and those who access the internet in a limited way.
This allows us to build our understanding of these groups, who they are and how we might support them.
How we’ve defined non-users and limited users of the internetThrough his own analysis of data from the Ofcom 2013 Media Literacy survey, Professor Simeon Yates’ published a report ‘Digital media use: differences and inequalities in relation to class and age’, which highlights seven potential groups (or ‘clusters’) of users, including Limited Users. We are focussing on this group, alongside Non Users
A full methodology of how the groups have been defined can be found in Professor Yates’ report.1 These groups are newly identified based on independent analysis of the raw data sets, and as such provides fresh insight into this data.
Who are non-users? Non-users are defined as people that either:
Do not have access to the internet at home or elsewhere; or
Do not currently use the internet even if they have access.
Michael53 year old Michael is from Hull. He doesn’t work due to an accident 10 years ago in his pre-vious job, which means he has a paid carer who visits him in his home.
Michael hasn’t ever used the internet before as his previous job, work-ing in a factory, meant
he wasn’t required to use one. Michael left school at 15, and hasn’t undertaken any learning since then.
Michael claims benefits, including Disability Support Allowance, and due to his low income he doesn’t have a computer or internet access at home. He does need to claim his benefits online, but asks his carer, or his sister, to do this for him.
1 Yates, S., Kirby, J. and Lockley, E., 2015. Digital media use: differences and inequalities in relation to class and age. Sociological Research Online, 20(4), p.12.
Page 6The real digital divide? Understanding the demographics of non-users and limited users of the internet: an analysis of Ofcom data
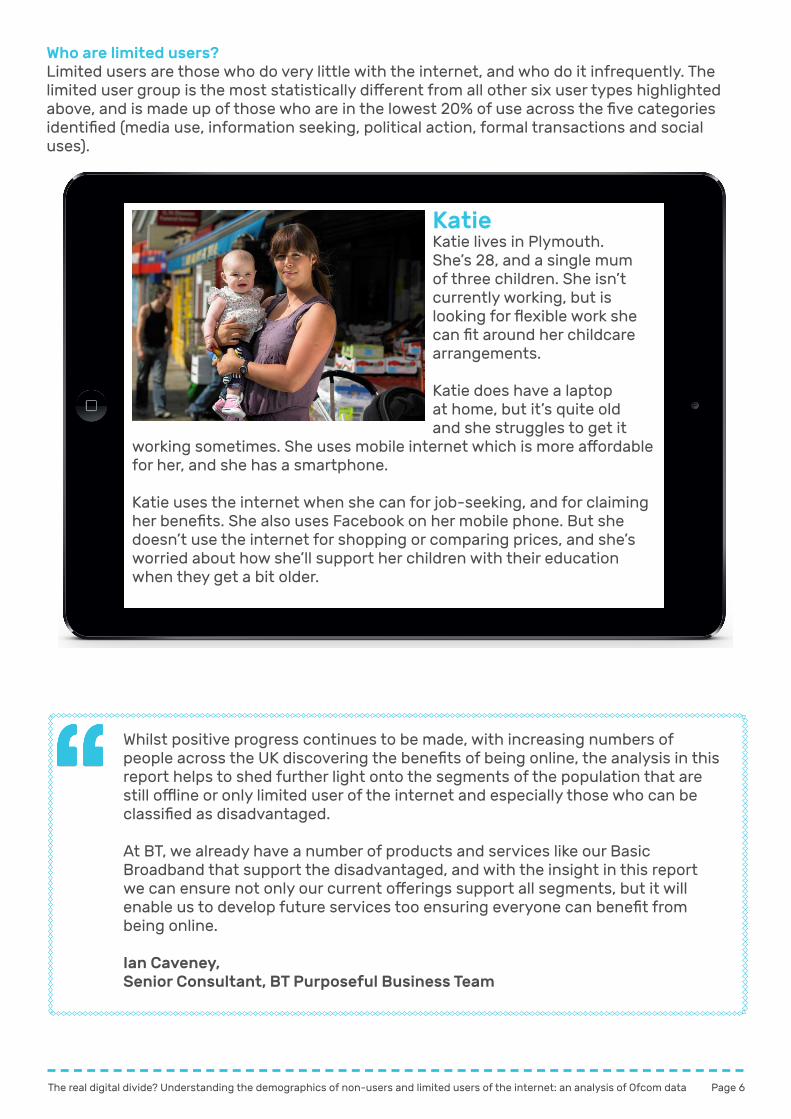
Who are limited users? Limited users are those who do very little with the internet, and who do it infrequently. The limited user group is the most statistically different from all other six user types highlighted above, and is made up of those who are in the lowest 20% of use across the five categories identified (media use, information seeking, political action, formal transactions and social uses).
KatieKatie lives in Plymouth. She’s 28, and a single mum of three children. She isn’t currently working, but is looking for flexible work she can fit around her childcare arrangements.
Katie does have a laptop at home, but it’s quite old and she struggles to get it
working sometimes. She uses mobile internet which is more affordable for her, and she has a smartphone.
Katie uses the internet when she can for job-seeking, and for claiming her benefits. She also uses Facebook on her mobile phone. But she doesn’t use the internet for shopping or comparing prices, and she’s worried about how she’ll support her children with their education when they get a bit older.
Whilst positive progress continues to be made, with increasing numbers of people across the UK discovering the benefits of being online, the analysis in this report helps to shed further light onto the segments of the population that are still offline or only limited user of the internet and especially those who can be classified as disadvantaged.
At BT, we already have a number of products and services like our Basic Broadband that support the disadvantaged, and with the insight in this report we can ensure not only our current offerings support all segments, but it will enable us to develop future services too ensuring everyone can benefit from being online.
Ian Caveney, Senior Consultant, BT Purposeful Business Team
Page 6 Page 7The real digital divide? Understanding the demographics of non-users and limited users of the internet: an analysis of Ofcom data
Findings
The population as a whole
1,890 people responded to the Ofcom 2015 Media Literacy Survey, and of them:
29.2% fall into the category of non or limited users - extrapolated across the UK adult population as a whole, non and limited users represent an estimated 15.2 million people in total.2
14.9% being non-users - an estimated 7.8 million people.
14.3% as limited users - an estimated 7.4 million people.
The 15.2 million identified in this report is likely to include much of the 11.5 million without basic digital skills identified by the Lloyds Consumer Digital Index, as well as those who may have the skills but who do not access the internet of a regular basis.
This report focussed on usage rather than skills, and so can be seen as a supplement to the Basic Digital Skills figures.
We are able to estimate that there are 7.1 million people in the UK who are non or limited users by mapping the Ofcom data across the latest over-65 population estimate from ONS of 11.6m people.3
Segmenting the non user population
Non users are those who do not currently use the internet on any device or connection (281 people or 14.9% of the survey respondents) - estimated as 7.8 million in the UK. This is higher than the 4.8 million figure from an equivalent data set from the ONS on internet use which describes those that have never been online.4 This may be because this data set includes lapsed users, alongside those who have never used the internet before.
83% do not have access to the internet at home or elsewhere and 16% do have access at home but do not use the internet there or anywhere else. Remaining respondents did not know whether they had access at home. This suggests that 6.4 million people in the UK do not have access at all, and can be classified as offline.
Disadvantage and social exclusion
Social exclusion is a complex concept without a clear definition, but is widely recognised as being characterised by situations that lead to the lack or denial of things - goods, services or activities - that are widely accessible to the majority of the population.5 We have focused on responses to Ofcom survey questions that indicate whether someone is likely to be socially excluded and, therefore, disadvantaged in some way. The indicators we have focused on relate to:
2 Latest ONS UK adult population estimate of 52.2m3 Population Estimates for UK, England and Wales, Scotland and Northern Ireland: mid-20154 Internet users in the UK: 20175 PSE - Social Exclusion
Page 8The real digital divide? Understanding the demographics of non-users and limited users of the internet: an analysis of Ofcom data
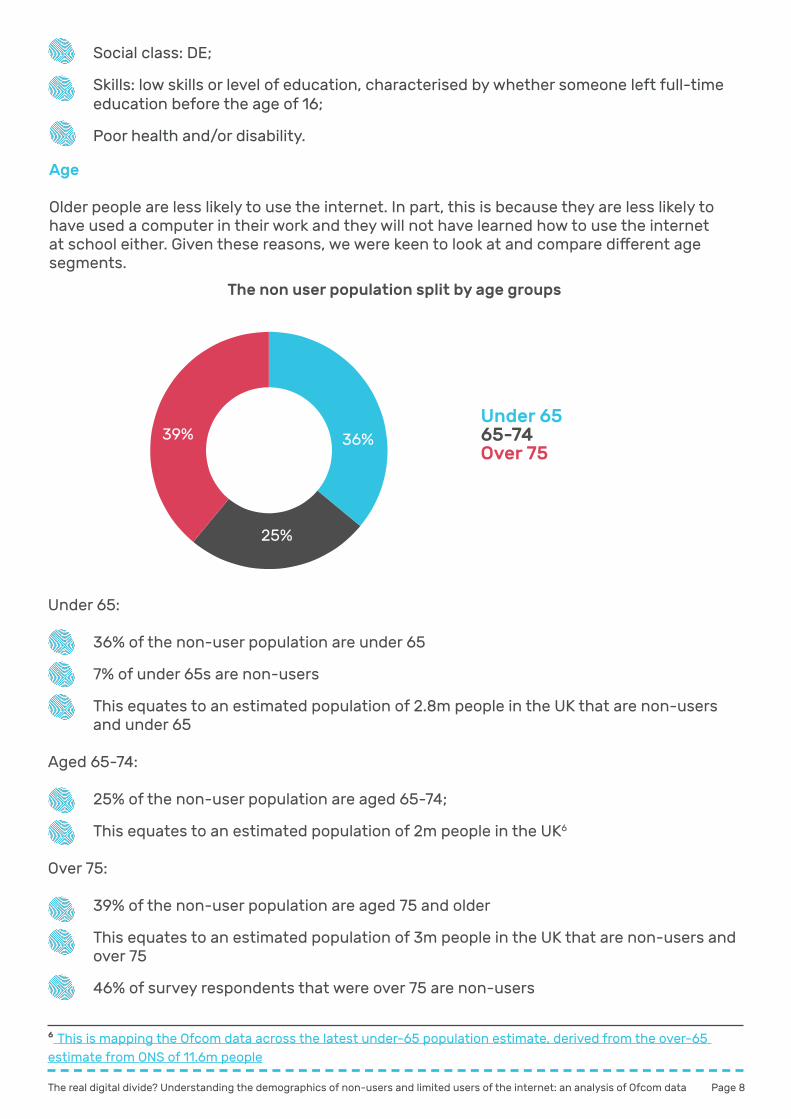
Age Older people are less likely to use the internet. In part, this is because they are less likely to have used a computer in their work and they will not have learned how to use the internet at school either. Given these reasons, we were keen to look at and compare different age segments.
36+25+39+A Under 6565-74Over 75
39% 36%
25%
Under 65:
36% of the non-user population are under 65
7% of under 65s are non-users
This equates to an estimated population of 2.8m people in the UK that are non-users and under 65
Aged 65-74:
25% of the non-user population are aged 65-74;
This equates to an estimated population of 2m people in the UK6
Over 75:
39% of the non-user population are aged 75 and older
This equates to an estimated population of 3m people in the UK that are non-users and over 75
46% of survey respondents that were over 75 are non-users
Social class: DE;
Skills: low skills or level of education, characterised by whether someone left full-time education before the age of 16;
Poor health and/or disability.
6 This is mapping the Ofcom data across the latest under-65 population estimate, derived from the over-65 estimate from ONS of 11.6m people
The non user population split by age groups
Page 8 Page 9The real digital divide? Understanding the demographics of non-users and limited users of the internet: an analysis of Ofcom data
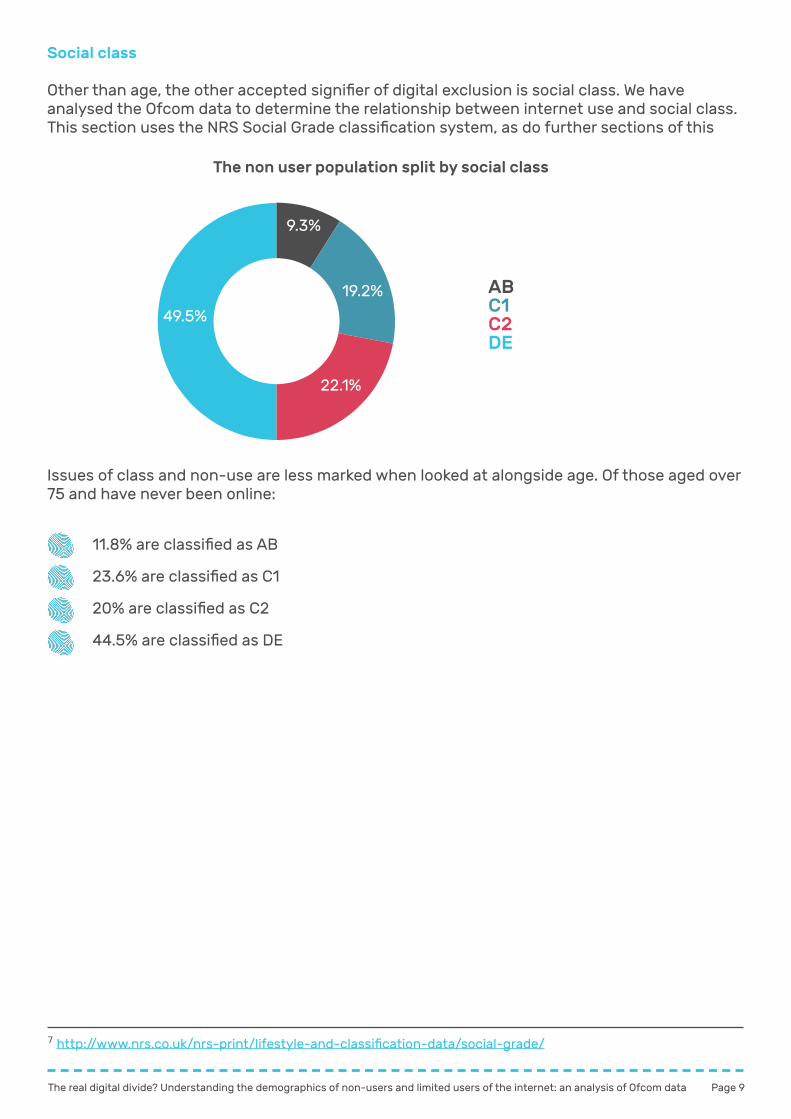
Social class Other than age, the other accepted signifier of digital exclusion is social class. We have analysed the Ofcom data to determine the relationship between internet use and social class. This section uses the NRS Social Grade classification system, as do further sections of this
9+19+22+50+A ABC1C2DE
49.5%
19.2%
9.3%
22.1%
Issues of class and non-use are less marked when looked at alongside age. Of those aged over 75 and have never been online:
11.8% are classified as AB
23.6% are classified as C1
20% are classified as C2
44.5% are classified as DE
7 http://www.nrs.co.uk/nrs-print/lifestyle-and-classification-data/social-grade/
The non user population split by social class
Page 10The real digital divide? Understanding the demographics of non-users and limited users of the internet: an analysis of Ofcom data
45+20+24+12 53+23+16+8Over 75 Under 75
DEC2C1AB
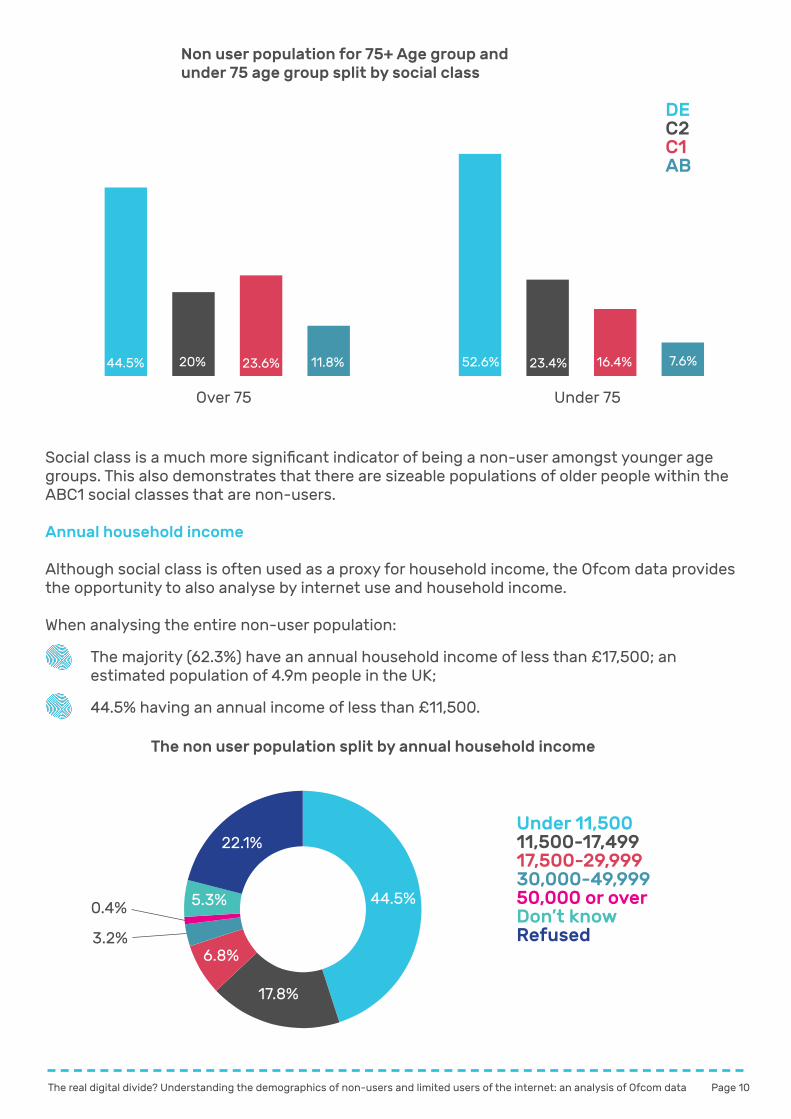
Non user population for 75+ Age group and under 75 age group split by social class
44.5% 20% 23.6% 11.8% 52.6% 23.4% 16.4% 7.6%
Social class is a much more significant indicator of being a non-user amongst younger age groups. This also demonstrates that there are sizeable populations of older people within the ABC1 social classes that are non-users.
Annual household income Although social class is often used as a proxy for household income, the Ofcom data provides the opportunity to also analyse by internet use and household income. When analysing the entire non-user population:
The majority (62.3%) have an annual household income of less than £17,500; an estimated population of 4.9m people in the UK;
44.5% having an annual income of less than £11,500.
45+18+7+3+1+5+21+A Under 11,50011,500-17,49917,500-29,99930,000-49,99950,000 or overDon’t knowRefused
17.8%
44.5%
22.1%
6.8%
5.3%
3.2%
0.4%
The non user population split by annual household income
Page 10 Page 11The real digital divide? Understanding the demographics of non-users and limited users of the internet: an analysis of Ofcom data
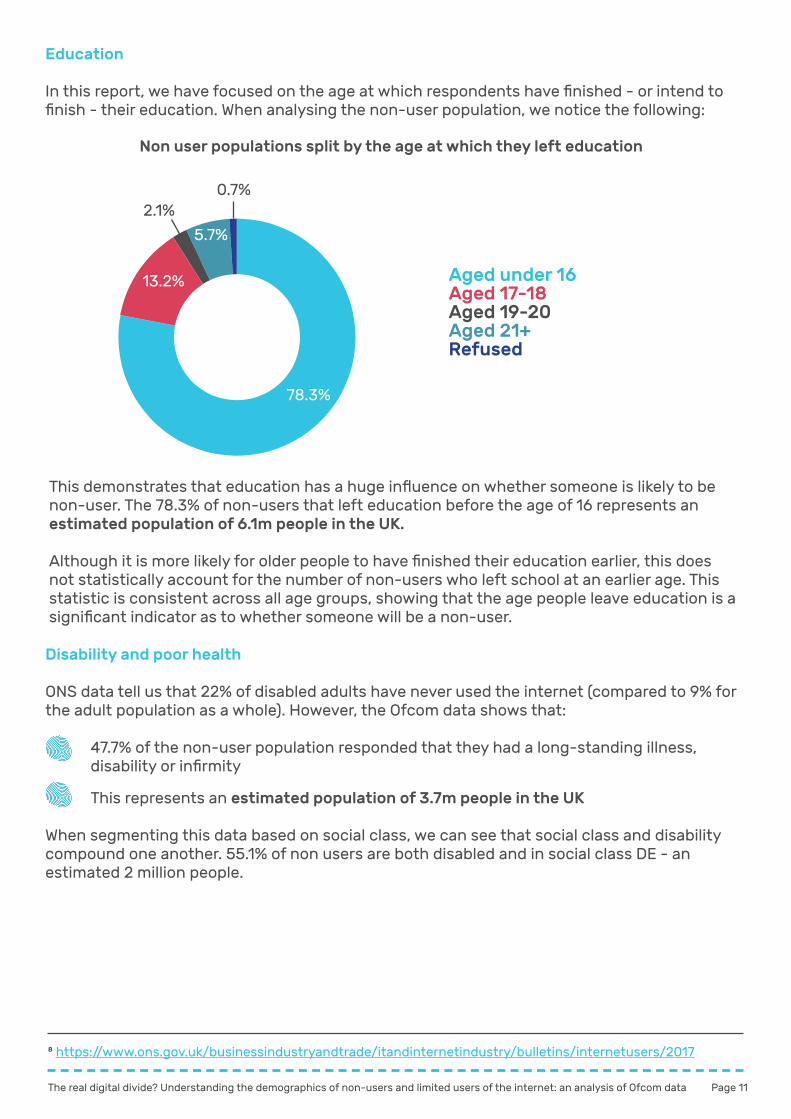
Education In this report, we have focused on the age at which respondents have finished - or intend to finish - their education. When analysing the non-user population, we notice the following:
78+13+2+6+1+A Aged under 16Aged 17-18Aged 19-20Aged 21+Refused
78.3%
5.7%
13.2%
2.1%0.7%
This demonstrates that education has a huge influence on whether someone is likely to be non-user. The 78.3% of non-users that left education before the age of 16 represents an estimated population of 6.1m people in the UK. Although it is more likely for older people to have finished their education earlier, this does not statistically account for the number of non-users who left school at an earlier age. This statistic is consistent across all age groups, showing that the age people leave education is a significant indicator as to whether someone will be a non-user.
Disability and poor health ONS data tell us that 22% of disabled adults have never used the internet (compared to 9% for the adult population as a whole). However, the Ofcom data shows that:
47.7% of the non-user population responded that they had a long-standing illness, disability or infirmity
This represents an estimated population of 3.7m people in the UK When segmenting this data based on social class, we can see that social class and disability compound one another. 55.1% of non users are both disabled and in social class DE - an estimated 2 million people.
8 https://www.ons.gov.uk/businessindustryandtrade/itandinternetindustry/bulletins/internetusers/2017
Non user populations split by the age at which they left education
Page 12The real digital divide? Understanding the demographics of non-users and limited users of the internet: an analysis of Ofcom data
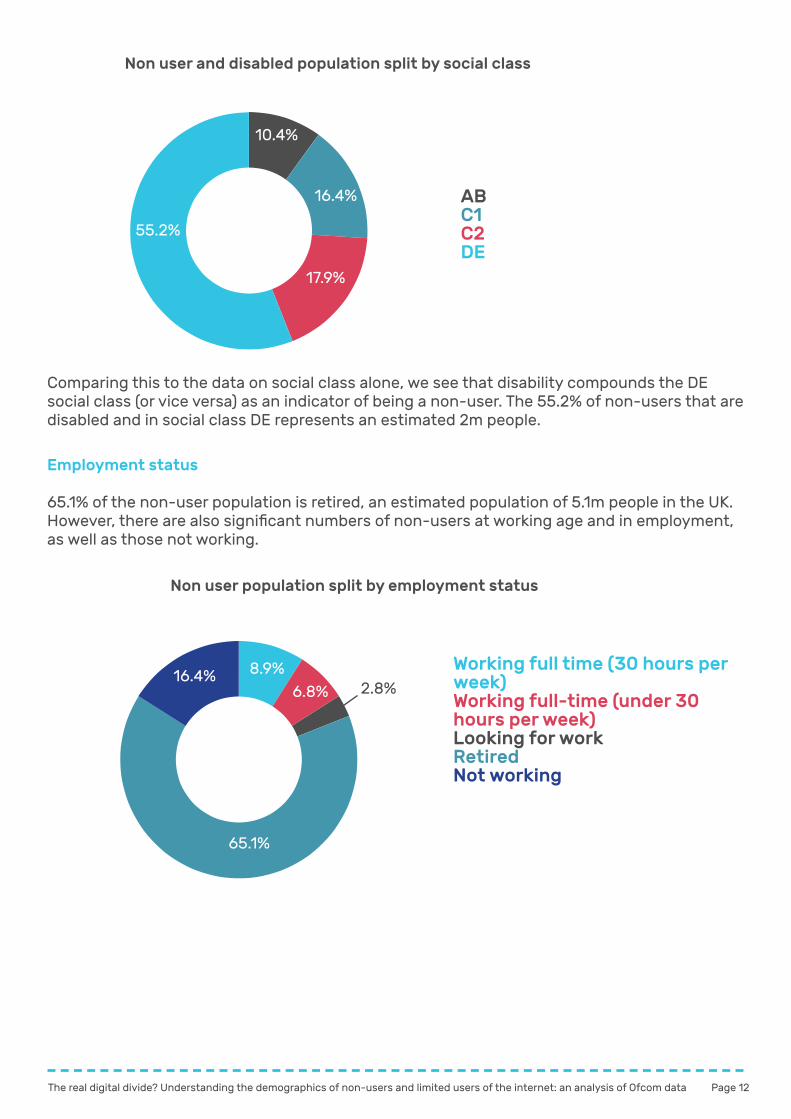
10+16+18+56+A ABC1C2DE
55.2%
16.4%
10.4%
17.9%
Comparing this to the data on social class alone, we see that disability compounds the DE social class (or vice versa) as an indicator of being a non-user. The 55.2% of non-users that are disabled and in social class DE represents an estimated 2m people.
Employment status 65.1% of the non-user population is retired, an estimated population of 5.1m people in the UK. However, there are also significant numbers of non-users at working age and in employment, as well as those not working.
9+7+3+65+16+A8.9%16.4%
65.1%
2.8%6.8%
Working full time (30 hours per week)Working full-time (under 30 hours per week)Looking for workRetiredNot working
Non user and disabled population split by social class
Non user population split by employment status
Page 12 Page 13The real digital divide? Understanding the demographics of non-users and limited users of the internet: an analysis of Ofcom data
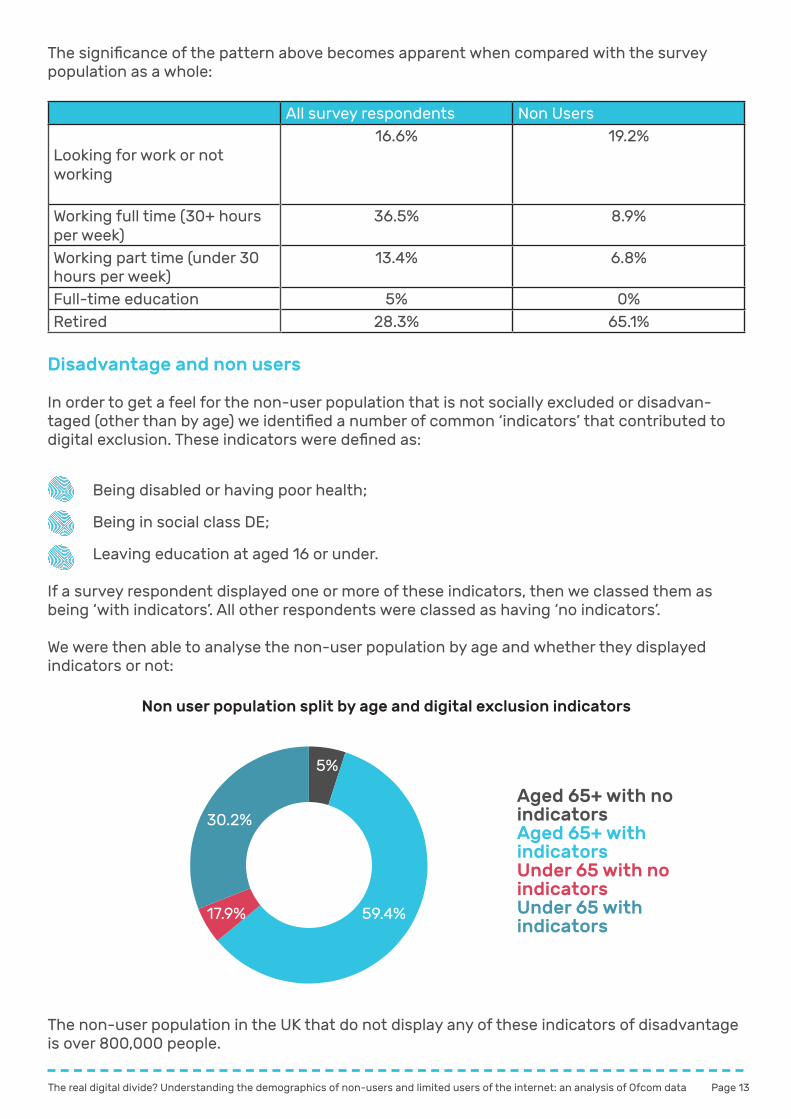
The significance of the pattern above becomes apparent when compared with the survey population as a whole:
All survey respondents Non Users Looking for work or not working
16.6% 19.2%
Working full time (30+ hours per week)
36.5% 8.9%
Working part time (under 30 hours per week)
13.4% 6.8%
Full-time education 5% 0%Retired 28.3% 65.1%
Disadvantage and non users In order to get a feel for the non-user population that is not socially excluded or disadvan-taged (other than by age) we identified a number of common ‘indicators’ that contributed to digital exclusion. These indicators were defined as:
Being disabled or having poor health;
Being in social class DE;
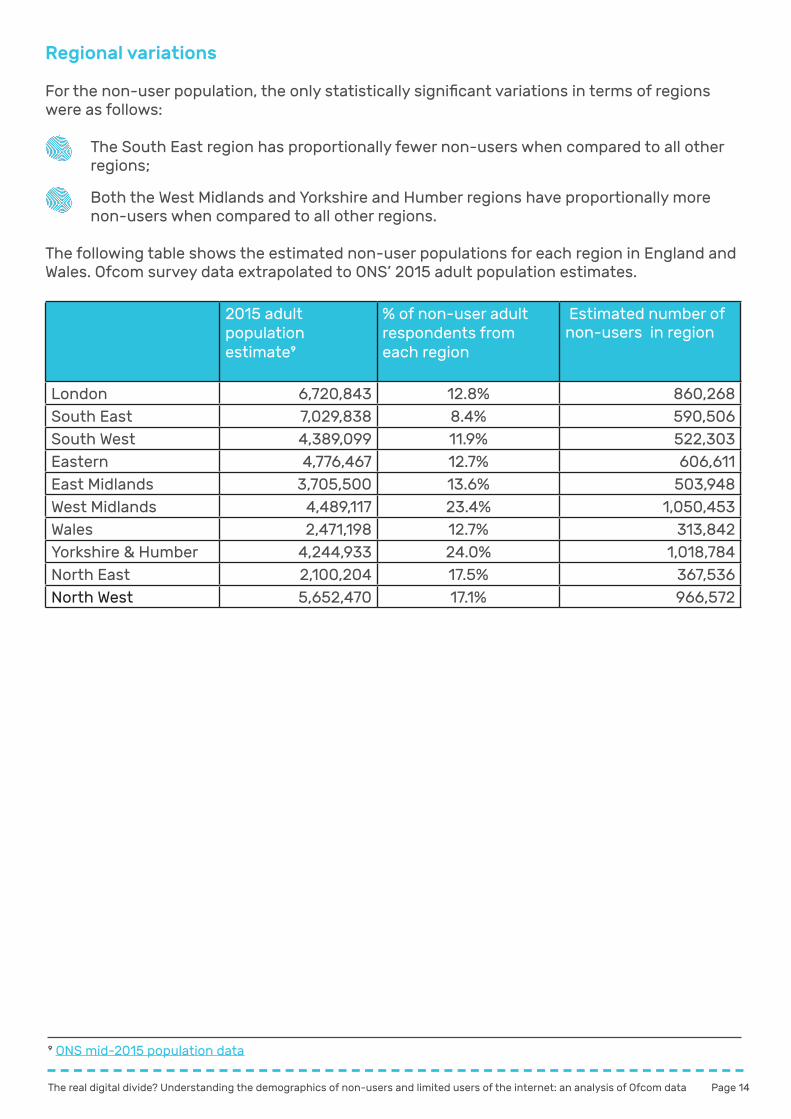
Leaving education at aged 16 or under. If a survey respondent displayed one or more of these indicators, then we classed them as being ‘with indicators’. All other respondents were classed as having ‘no indicators’. We were then able to analyse the non-user population by age and whether they displayed indicators or not:
5+59+5+31+A Aged 65+ with no indicatorsAged 65+ with indicatorsUnder 65 with no indicatorsUnder 65 with indicators
30.2%
59.4%
5%
17.9%
Non user population split by age and digital exclusion indicators
The non-user population in the UK that do not display any of these indicators of disadvantage is over 800,000 people.
Page 14The real digital divide? Understanding the demographics of non-users and limited users of the internet: an analysis of Ofcom data
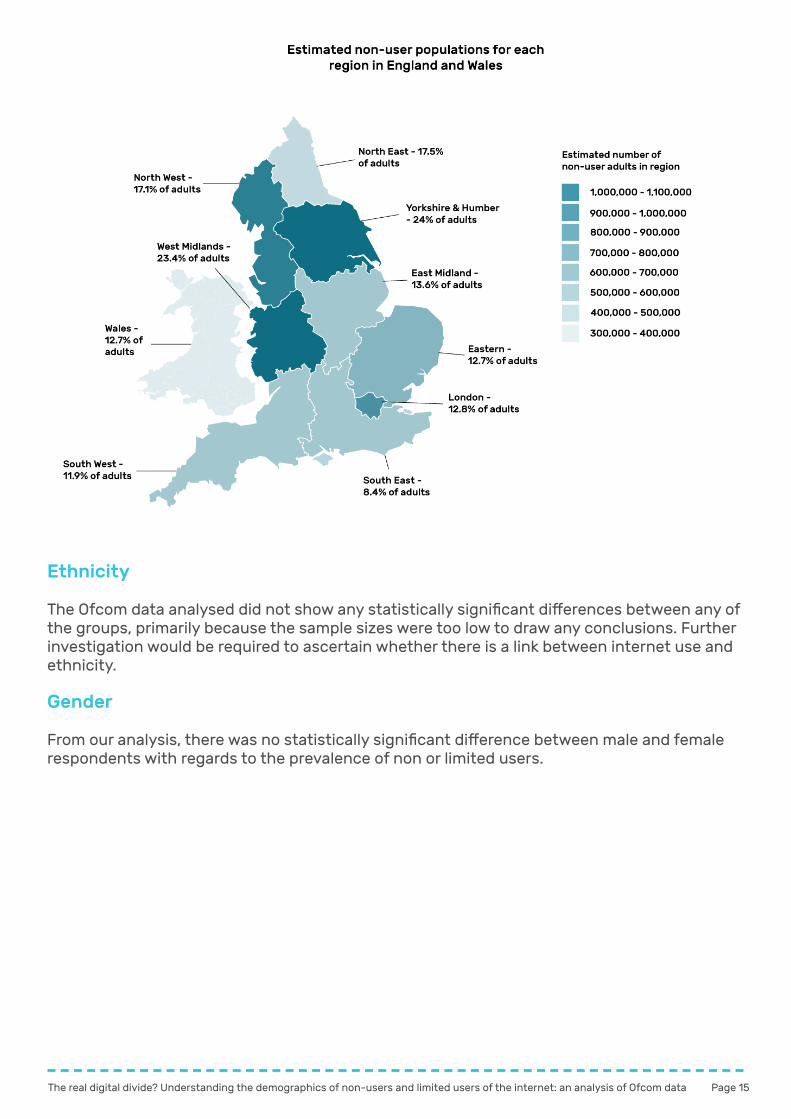
Regional variations For the non-user population, the only statistically significant variations in terms of regions were as follows:
The South East region has proportionally fewer non-users when compared to all other regions;
Both the West Midlands and Yorkshire and Humber regions have proportionally more non-users when compared to all other regions.
The following table shows the estimated non-user populations for each region in England and Wales. Ofcom survey data extrapolated to ONS’ 2015 adult population estimates.
2015 adult population estimate9
% of non-user adult respondents from each region
Estimated number of non-users in region
London 6,720,843 12.8% 860,268South East 7,029,838 8.4% 590,506South West 4,389,099 11.9% 522,303Eastern 4,776,467 12.7% 606,611East Midlands 3,705,500 13.6% 503,948West Midlands 4,489,117 23.4% 1,050,453Wales 2,471,198 12.7% 313,842Yorkshire & Humber 4,244,933 24.0% 1,018,784North East 2,100,204 17.5% 367,536North West 5,652,470 17.1% 966,572
9 ONS mid-2015 population data
Page 14 Page 15The real digital divide? Understanding the demographics of non-users and limited users of the internet: an analysis of Ofcom data
Ethnicity The Ofcom data analysed did not show any statistically significant differences between any of the groups, primarily because the sample sizes were too low to draw any conclusions. Further investigation would be required to ascertain whether there is a link between internet use and ethnicity. Gender From our analysis, there was no statistically significant difference between male and female respondents with regards to the prevalence of non or limited users.
Page 16The real digital divide? Understanding the demographics of non-users and limited users of the internet: an analysis of Ofcom data
10 https://www.thetechpartnership.com/basic-digital-skills/basic-digital-skills-framework/11 https://www.ons.gov.uk/businessindustryandtrade/itandinternetindustry/bulletins/internetusers/2017
Limited users are defined as those who do very little with the internet, and who do it infrequently. This group is made up of those who are in the bottom 20% of internet use. This group of people is likely to be synonymous with those that lack basic digital skills as described by the Tech Partnership10. The data suggests that there are 7.4m limited users of the internet in the UK when mapped against the UK adult population. The following section looks at the segmentation of limited users. The same trends appear for limited users as those for the non-user population, but there are some differences. Age
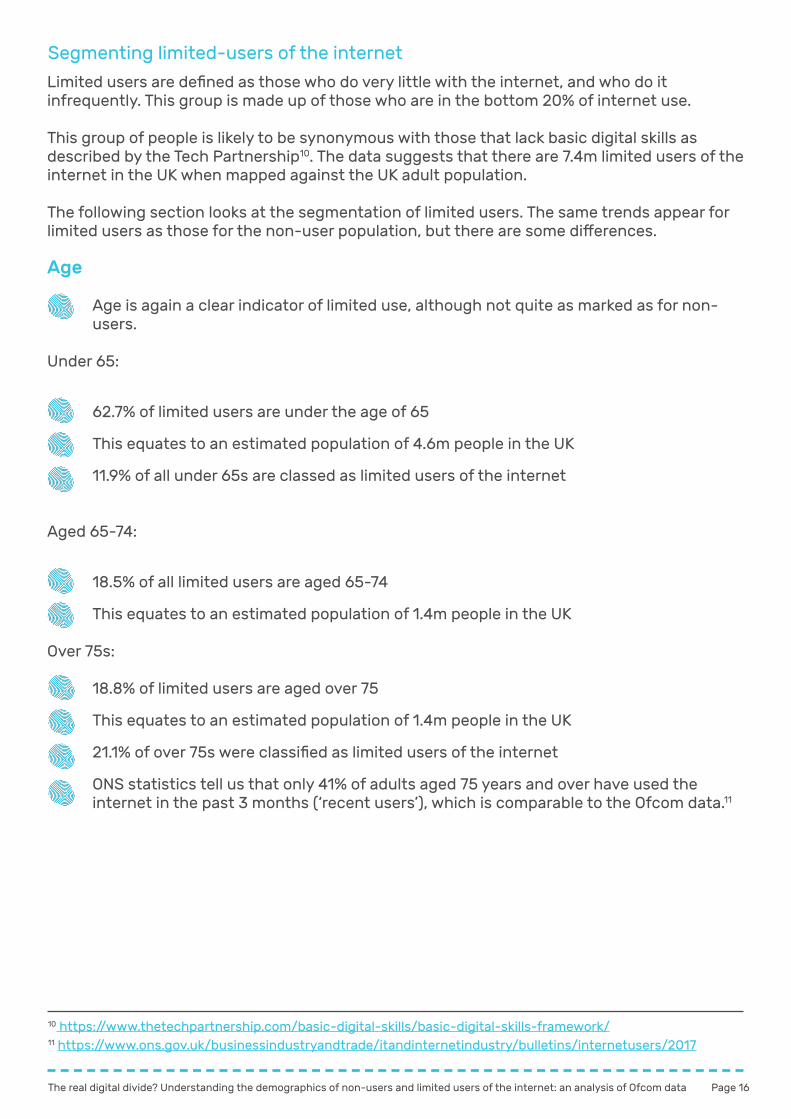
Age is again a clear indicator of limited use, although not quite as marked as for non-users.
Under 65:
62.7% of limited users are under the age of 65
This equates to an estimated population of 4.6m people in the UK
11.9% of all under 65s are classed as limited users of the internet
Aged 65-74:
18.5% of all limited users are aged 65-74
This equates to an estimated population of 1.4m people in the UK Over 75s:
18.8% of limited users are aged over 75
This equates to an estimated population of 1.4m people in the UK
21.1% of over 75s were classified as limited users of the internet
ONS statistics tell us that only 41% of adults aged 75 years and over have used the internet in the past 3 months (‘recent users’), which is comparable to the Ofcom data.11
Segmenting limited-users of the internet
Page 16 Page 17The real digital divide? Understanding the demographics of non-users and limited users of the internet: an analysis of Ofcom data
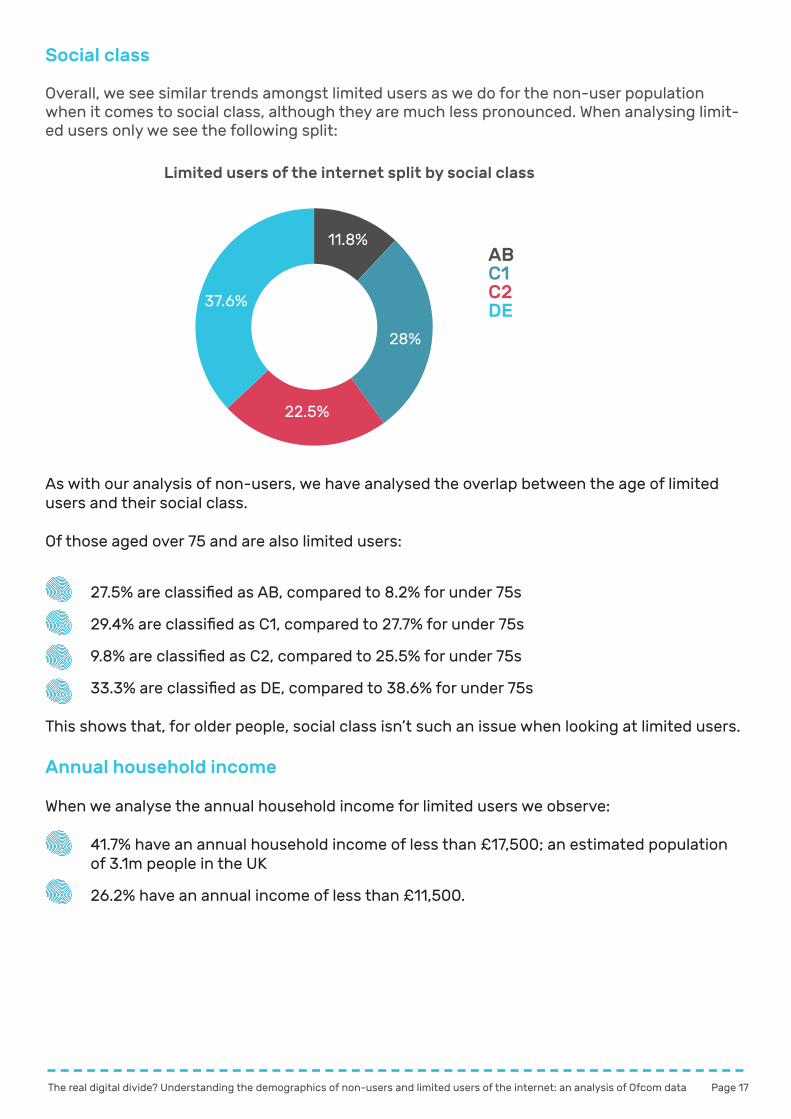
Social class Overall, we see similar trends amongst limited users as we do for the non-user population when it comes to social class, although they are much less pronounced. When analysing limit-ed users only we see the following split:
12+28+23+37+A ABC1C2DE37.6%
28%
11.8%
22.5%
Limited users of the internet split by social class
As with our analysis of non-users, we have analysed the overlap between the age of limited users and their social class. Of those aged over 75 and are also limited users:
27.5% are classified as AB, compared to 8.2% for under 75s
29.4% are classified as C1, compared to 27.7% for under 75s
9.8% are classified as C2, compared to 25.5% for under 75s
33.3% are classified as DE, compared to 38.6% for under 75s This shows that, for older people, social class isn’t such an issue when looking at limited users.
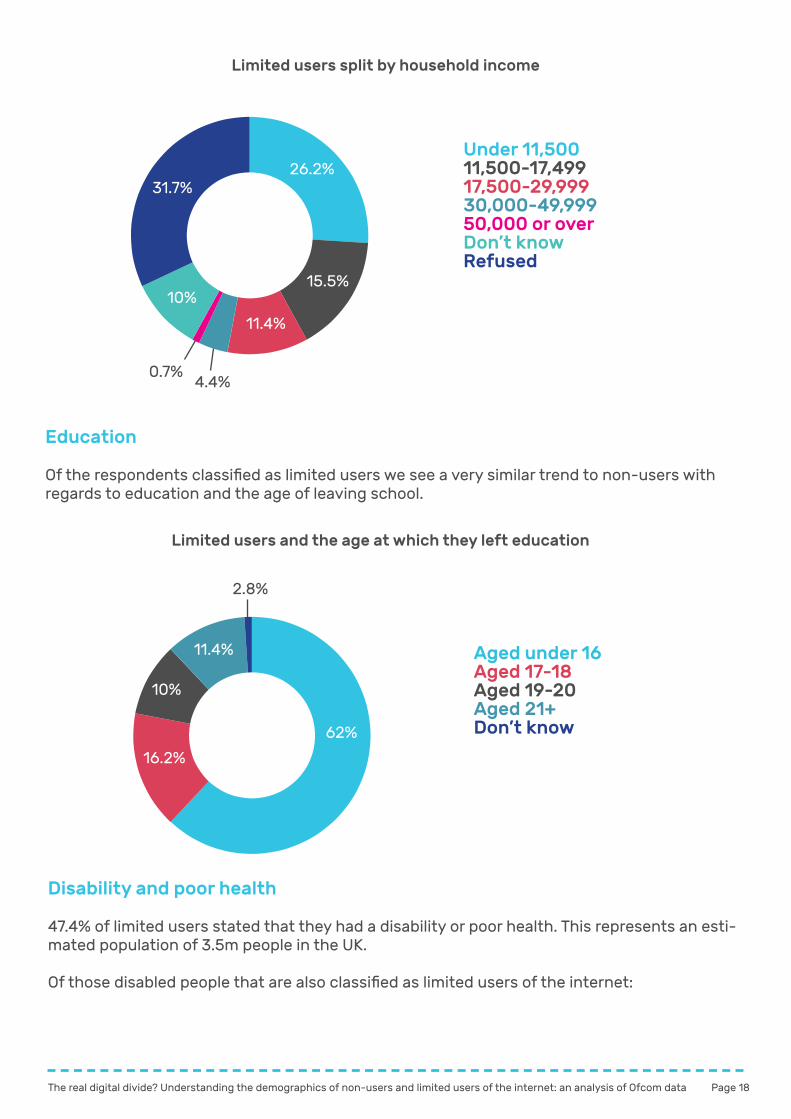
Annual household income When we analyse the annual household income for limited users we observe:
41.7% have an annual household income of less than £17,500; an estimated population of 3.1m people in the UK
26.2% have an annual income of less than £11,500.
Page 18The real digital divide? Understanding the demographics of non-users and limited users of the internet: an analysis of Ofcom data
26+16+11+4+1+10+32+A Under 11,50011,500-17,49917,500-29,99930,000-49,99950,000 or overDon’t knowRefused
15.5%
26.2%31.7%
11.4%
10%
4.4%0.7%
Education Of the respondents classified as limited users we see a very similar trend to non-users with regards to education and the age of leaving school.
62+16+10+11+1+A11.4%
10%
62%
2.8%
16.2%
Aged under 16Aged 17-18Aged 19-20Aged 21+Don’t know
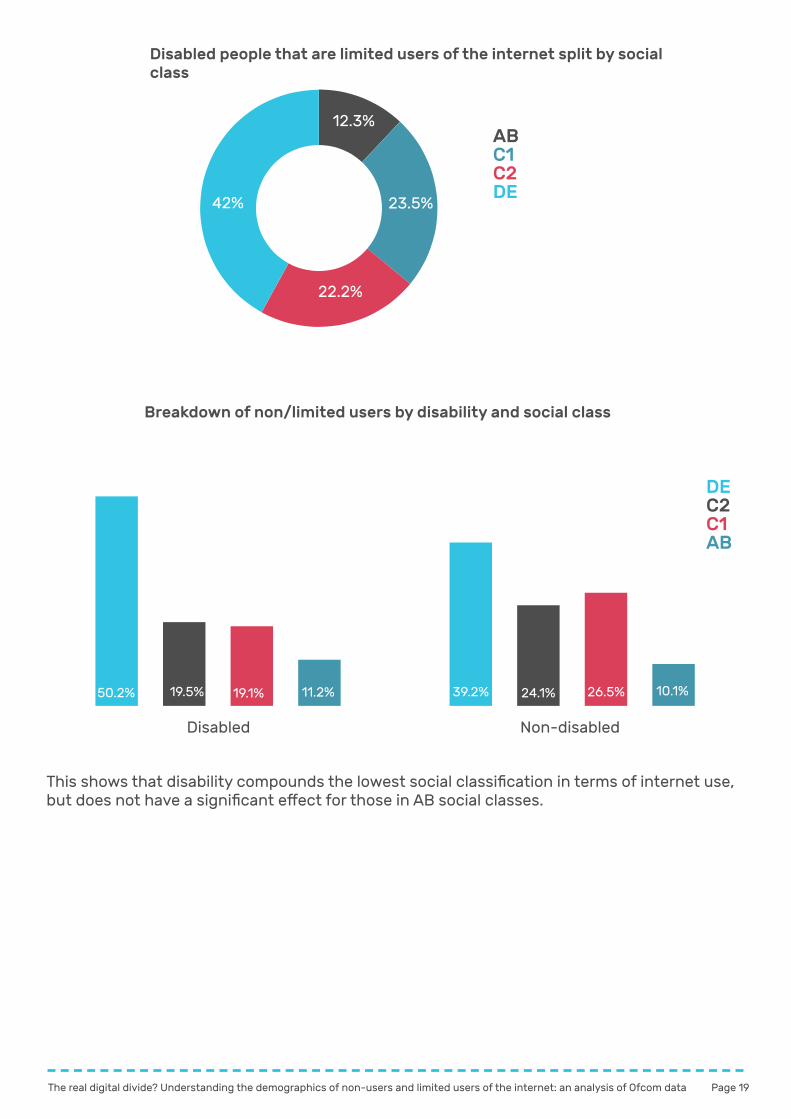
Disability and poor health 47.4% of limited users stated that they had a disability or poor health. This represents an esti-mated population of 3.5m people in the UK. Of those disabled people that are also classified as limited users of the internet:
Limited users split by household income
Limited users and the age at which they left education
Page 18 Page 19The real digital divide? Understanding the demographics of non-users and limited users of the internet: an analysis of Ofcom data
12+24+22+42+A ABC1C2DE
42% 23.5%
12.3%
Disabled people that are limited users of the internet split by social class
22.2%
50+20+19+11 39+24+27+10Disabled Non-disabled
DEC2C1AB
Breakdown of non/limited users by disability and social class
50.2% 19.5% 19.1% 11.2% 39.2% 24.1% 26.5% 10.1%
This shows that disability compounds the lowest social classification in terms of internet use, but does not have a significant effect for those in AB social classes.
Page 20The real digital divide? Understanding the demographics of non-users and limited users of the internet: an analysis of Ofcom data
Employment status Of those respondents classified as limited users:
21.8% were looking for work or not working. This compares to 16.6% of all respondents having this employment status.
26.6% were working full-time (30+ hours per week). This compares to 36.5% of all respondents having this employment status.
8.1% were working part-time (under 30 hours per week). This compares to 13.4% of all respondents having this employment status
1.5% were in full-time education. This compares to 5% of all respondents having this employment status.
41.7% were retired. This compares to 28.3% of all respondents having this employment status.
The proportion of limited users that are retired is much lower than that for the non-user population (41.7% versus 65.1% respectively). Similarly, the proportion of limited users that are in full time employment is much higher than within the non-user population (26.6% versus 8.9% respectively).
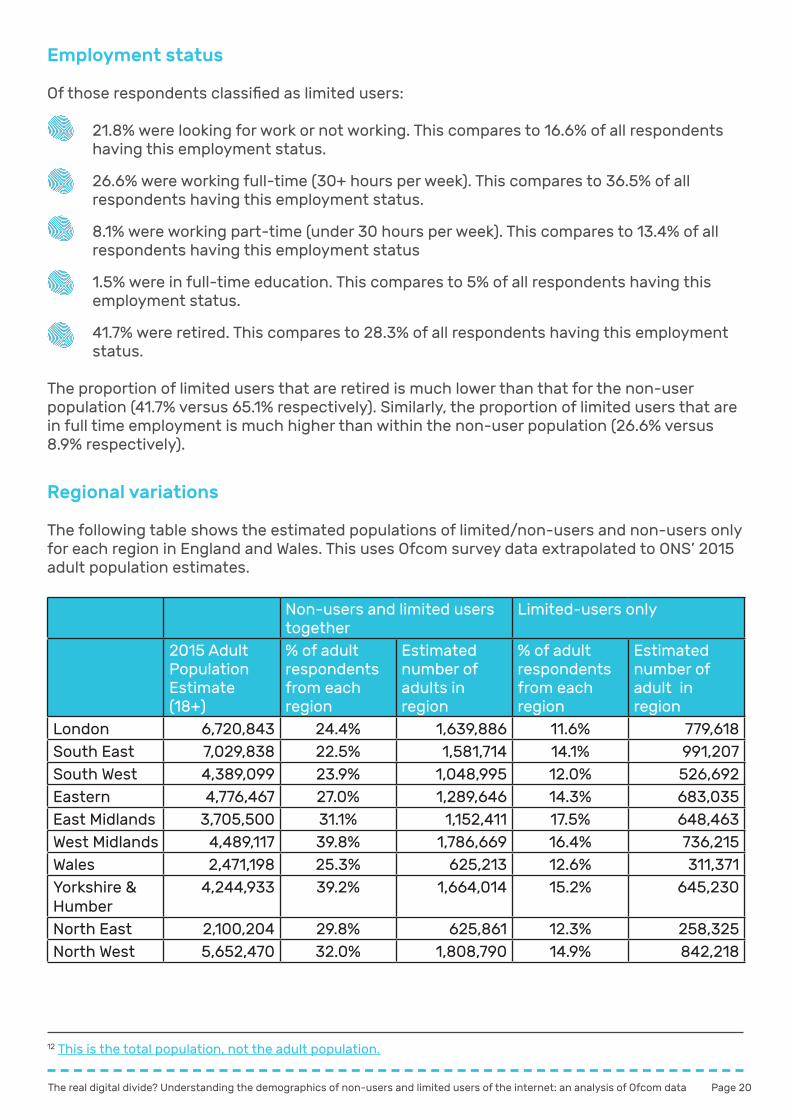
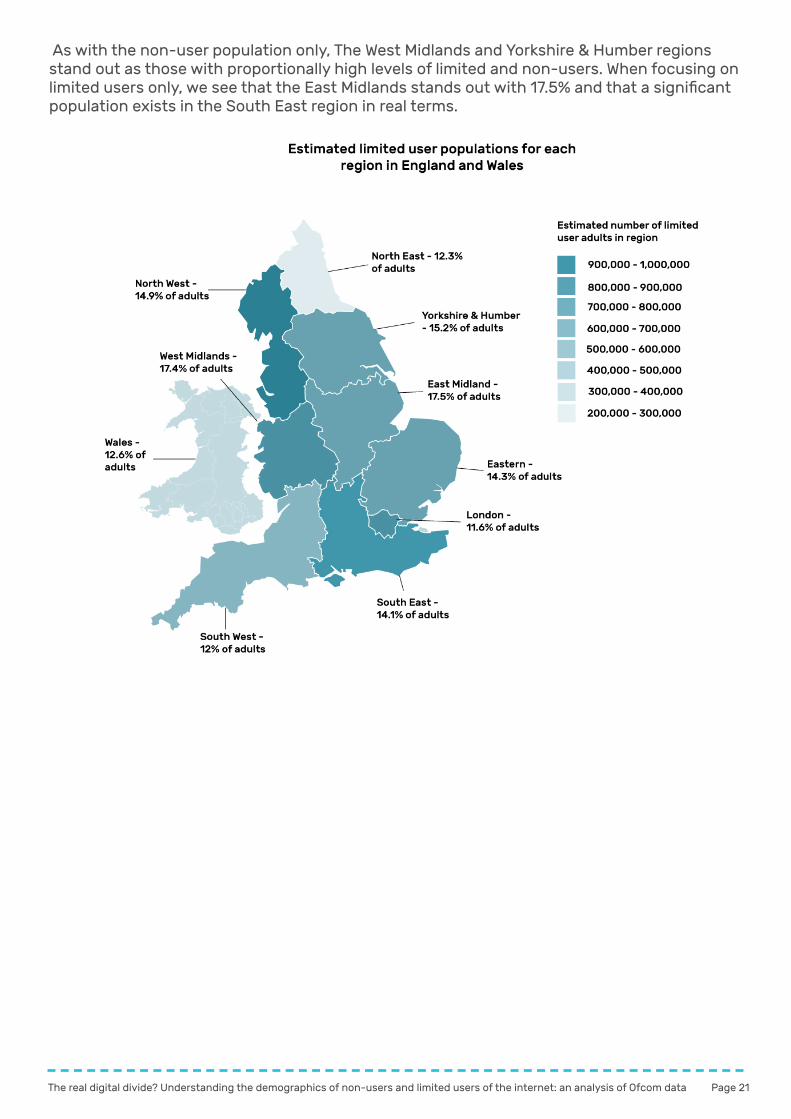
Regional variations The following table shows the estimated populations of limited/non-users and non-users only for each region in England and Wales. This uses Ofcom survey data extrapolated to ONS’ 2015 adult population estimates.
Non-users and limited users together
Limited-users only
2015 Adult Population Estimate (18+)
% of adult respondents from each region
Estimated number of adults in region
% of adult respondents from each region
Estimated number of adult in region
London 6,720,843 24.4% 1,639,886 11.6% 779,618South East 7,029,838 22.5% 1,581,714 14.1% 991,207South West 4,389,099 23.9% 1,048,995 12.0% 526,692Eastern 4,776,467 27.0% 1,289,646 14.3% 683,035East Midlands 3,705,500 31.1% 1,152,411 17.5% 648,463West Midlands 4,489,117 39.8% 1,786,669 16.4% 736,215Wales 2,471,198 25.3% 625,213 12.6% 311,371Yorkshire & Humber
4,244,933 39.2% 1,664,014 15.2% 645,230
North East 2,100,204 29.8% 625,861 12.3% 258,325North West 5,652,470 32.0% 1,808,790 14.9% 842,218
12 This is the total population, not the adult population.
Page 20 Page 21The real digital divide? Understanding the demographics of non-users and limited users of the internet: an analysis of Ofcom data
As with the non-user population only, The West Midlands and Yorkshire & Humber regions stand out as those with proportionally high levels of limited and non-users. When focusing on limited users only, we see that the East Midlands stands out with 17.5% and that a significant population exists in the South East region in real terms.
Page 22The real digital divide? Understanding the demographics of non-users and limited users of the internet: an analysis of Ofcom data
Through analysing this data, we have identified a number of areas where gaps still remain. This may because the data is not being collected, or, in the interests of being nationally representative, the data collected does not allow us to make statistically significant assertions about demographic trends within the non and limited user populations. Areas for potential further research include:
Trends within different ethnic groups and any language barriers that may exist;
Understanding the role of specific disabilities or health conditions - i.e. segmenting the population of disabled people;
Drilling down into the regional data to understanding more localised ‘non-user hotspots’.
It is clear that there are interconnecting factors between non and limited users, as demonstrated by the high levels of limited users in the South East, but the low proportion of those being non-users. To understand these factors fully, further research would be required at the regional or demographic-specific level. This report has focused solely on the demographic information relating to how people use the internet. More research is needed to understand the motivations and barriers behind these trends, as well as how this can be translated into practical actions for Government, digital inclusion organisations, the private sector and the wider community and voluntary sector.
Gaps in the data and recommendations for further research