Embed Size (px)
Citation preview
1
The real cost of obesity:The real cost of obesity:Disparities in diet quality and healthDisparities in diet quality and health
Adam Drewnowski, PhDAdam Drewnowski, PhDDirector, Center for Public Health NutritionDirector, Center for Public Health Nutrition
Director, NIH Roadmap Center for Obesity ResearchDirector, NIH Roadmap Center for Obesity ResearchProfessor of Epidemiology and MedicineProfessor of Epidemiology and Medicine
School of Public Health and Community MedicineSchool of Public Health and Community MedicineUniversity of WashingtonUniversity of Washington
Fruit and vegetables and the prevention of obesity and its assocFruit and vegetables and the prevention of obesity and its associated diseasesiated diseases..EGEA International Conference, 17EGEA International Conference, 17--19 April 2007, Brussels, Belgium19 April 2007, Brussels, Belgium
Disparities in obesity rates Disparities in obesity rates can be seen at local levelcan be seen at local level
“All politics is local”“All politics is local”
2
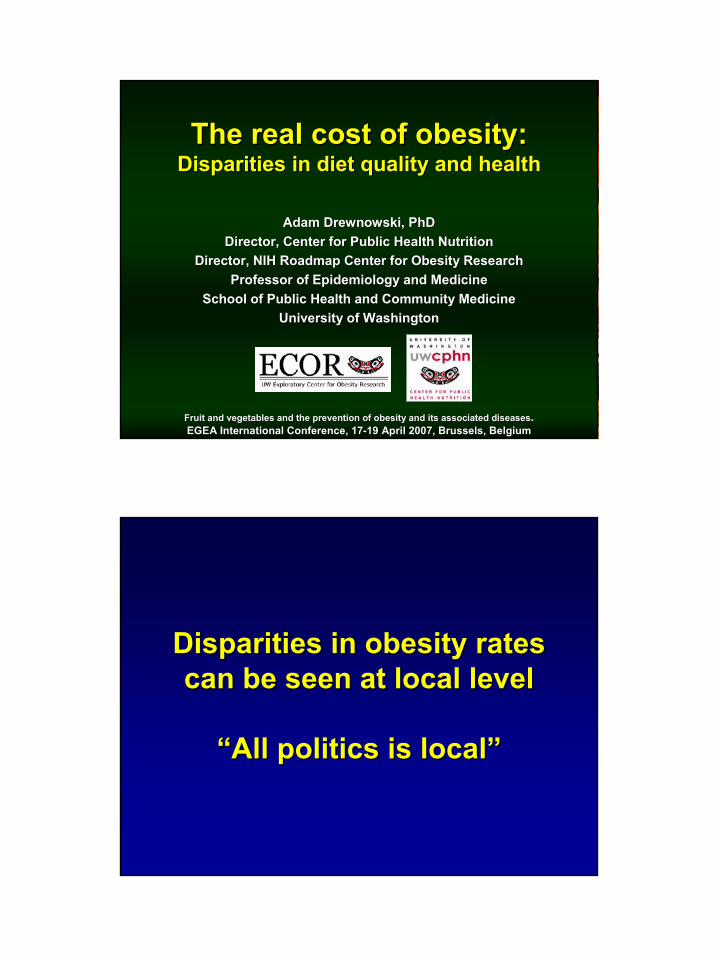
Disparities by county in the USDisparities by county in the US
A necessary question:A necessary question:Is obesity an economic issue?Is obesity an economic issue?
3
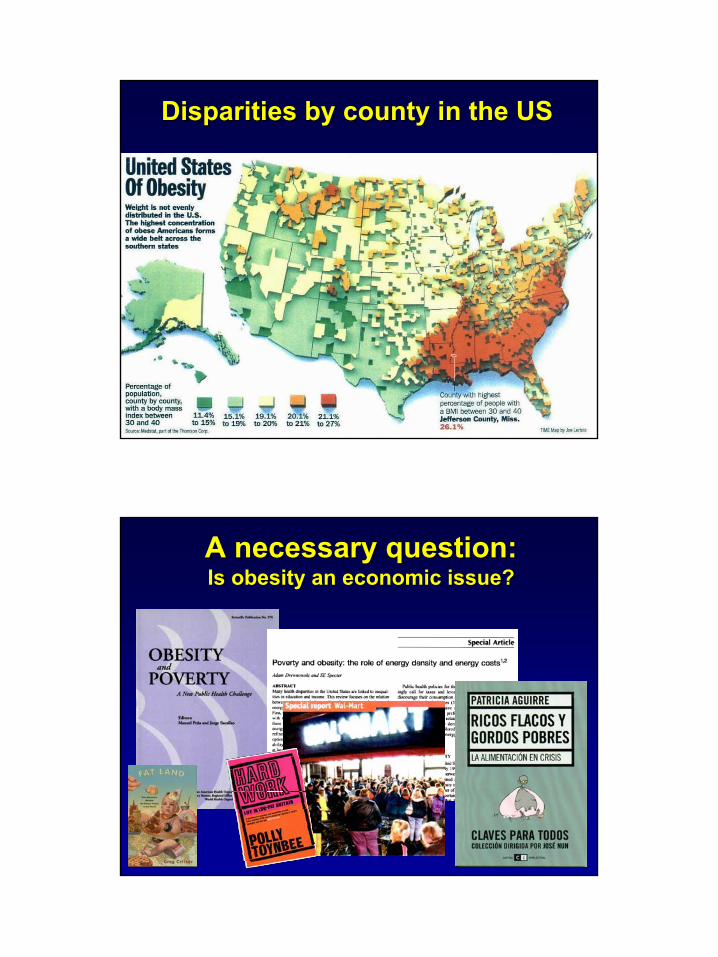
How do people make food choices
Food choices
Energy density
Health
Taste
Cost
Variety
Time/Con-venience
Obesity
Grains,Sugar/fat
Sugar/fatGrains,Sugar/fat
Grains,Sugar/fat
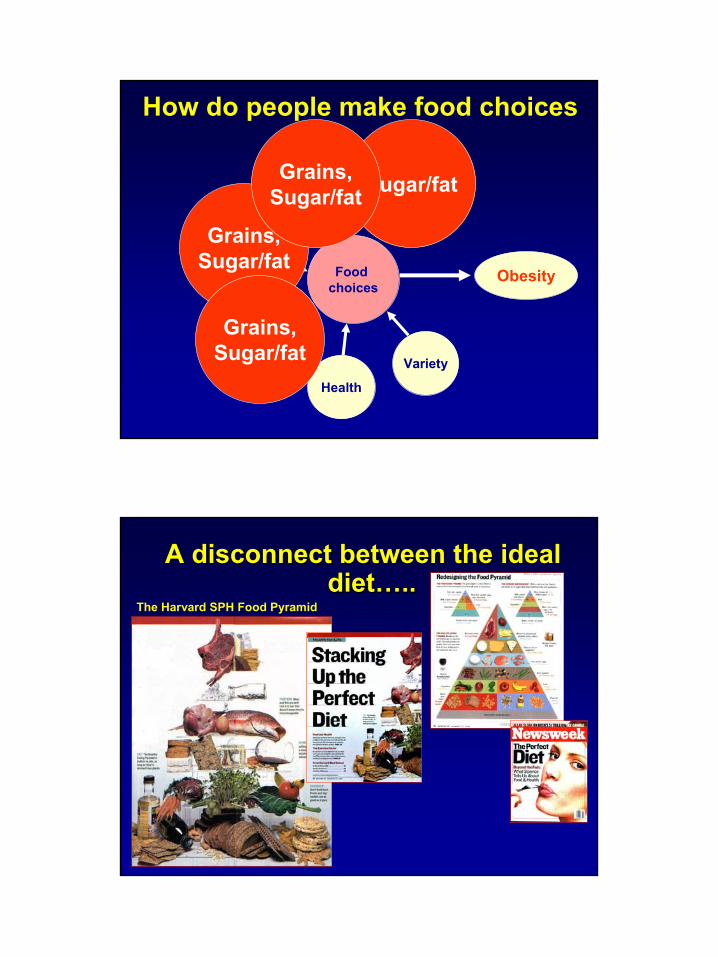
A disconnect between the ideal A disconnect between the ideal diet…..diet…..
The Harvard SPH Food Pyramid
4
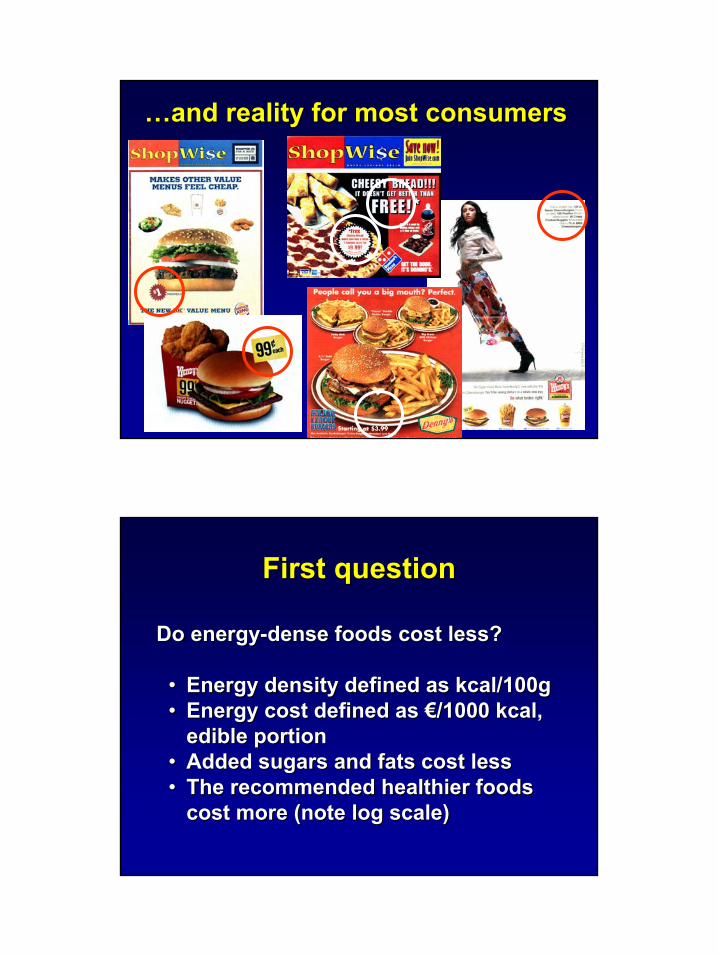
……and reality for most consumersand reality for most consumers
First questionFirst question
Do energyDo energy--dense foods cost less?dense foods cost less?
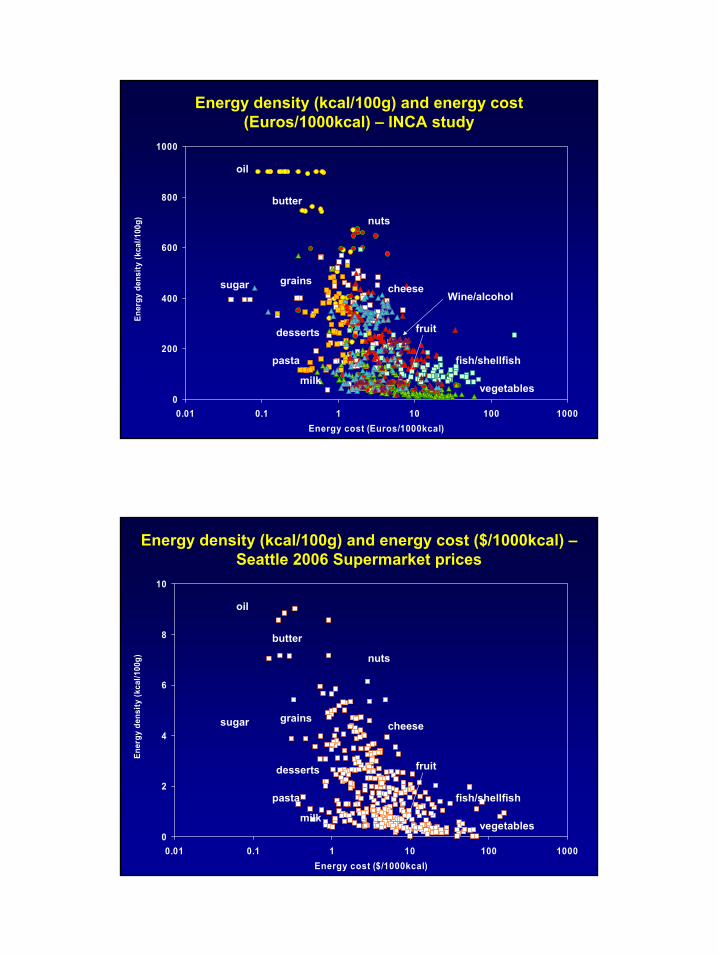
•• Energy density defined as kcal/100gEnergy density defined as kcal/100g•• Energy cost defined as Energy cost defined as €€/1000 kcal, /1000 kcal,
edible portionedible portion•• Added sugars and fats cost lessAdded sugars and fats cost less•• The recommended healthier foods The recommended healthier foods
cost more (note log scale)cost more (note log scale)
5
0
200
400
600
800
1000
0.01 0.1 1 10 100 1000Energy cost (Euros/1000kcal)
Ener
gy d
ensi
ty (k
cal/1
00g)
oil
butter
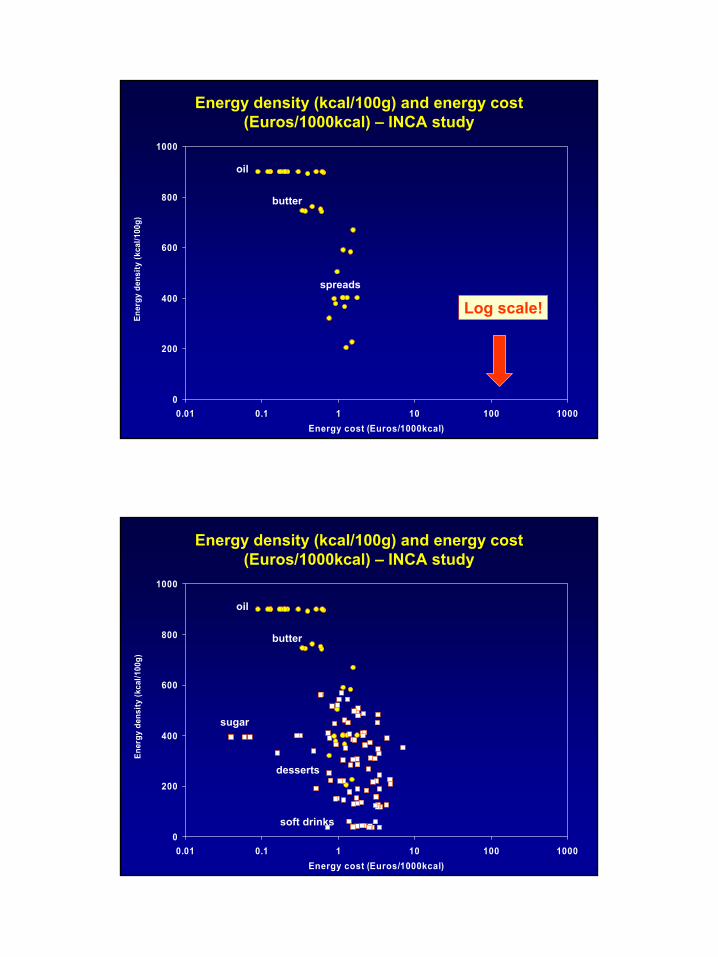
Energy density (kcal/100g) and energy cost (Euros/1000kcal) – INCA study
spreads
Log scale!
0
200
400
600
800
1000
0.01 0.1 1 10 100 1000Energy cost (Euros/1000kcal)
Ener
gy d
ensi
ty (k
cal/1
00g)
oil
butter
sugar
desserts
soft drinks
Energy density (kcal/100g) and energy cost (Euros/1000kcal) – INCA study
6
0
200
400
600
800
1000
0.01 0.1 1 10 100 1000Energy cost (Euros/1000kcal)
Ener
gy d
ensi
ty (k
cal/1
00g)
oil
butter
sugar
desserts
soft drinks
grains
bread
pasta
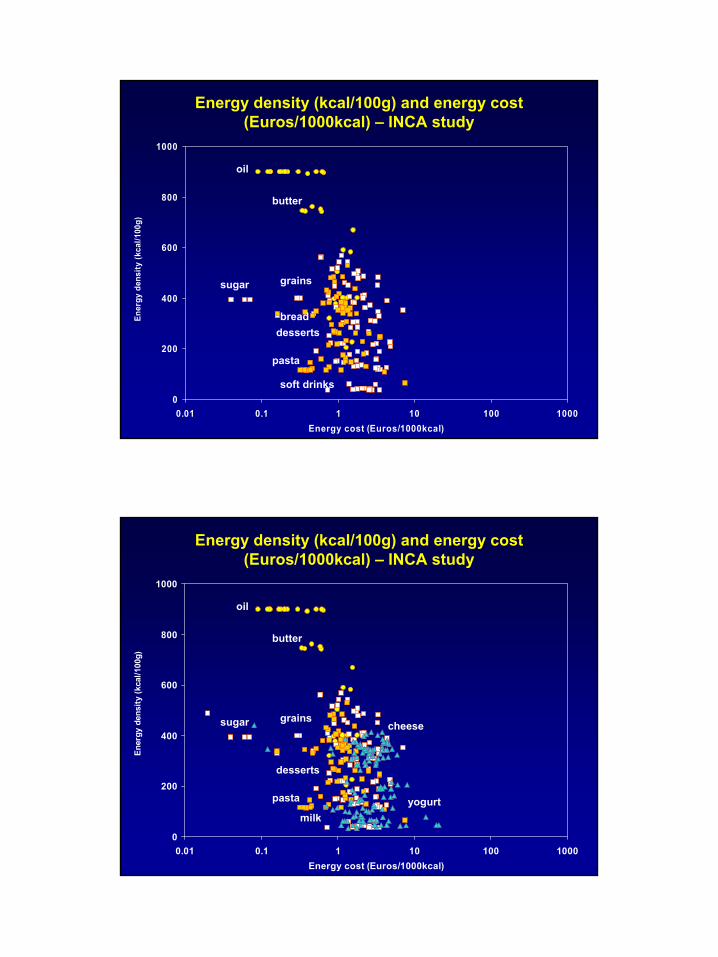
Energy density (kcal/100g) and energy cost (Euros/1000kcal) – INCA study
0
200
400
600
800
1000
0.01 0.1 1 10 100 1000Energy cost (Euros/1000kcal)
Ener
gy d
ensi
ty (k
cal/1
00g)
oil
butter
sugar
desserts
milk
grainscheese
yogurtpasta
Energy density (kcal/100g) and energy cost (Euros/1000kcal) – INCA study
7
0
200
400
600
800
1000
0.01 0.1 1 10 100 1000Energy cost (Euros/1000kcal)
Ener
gy d
ensi
ty (k
cal/1
00g)
oil
butter
sugar
desserts
milk
grainscheese
meat
pasta
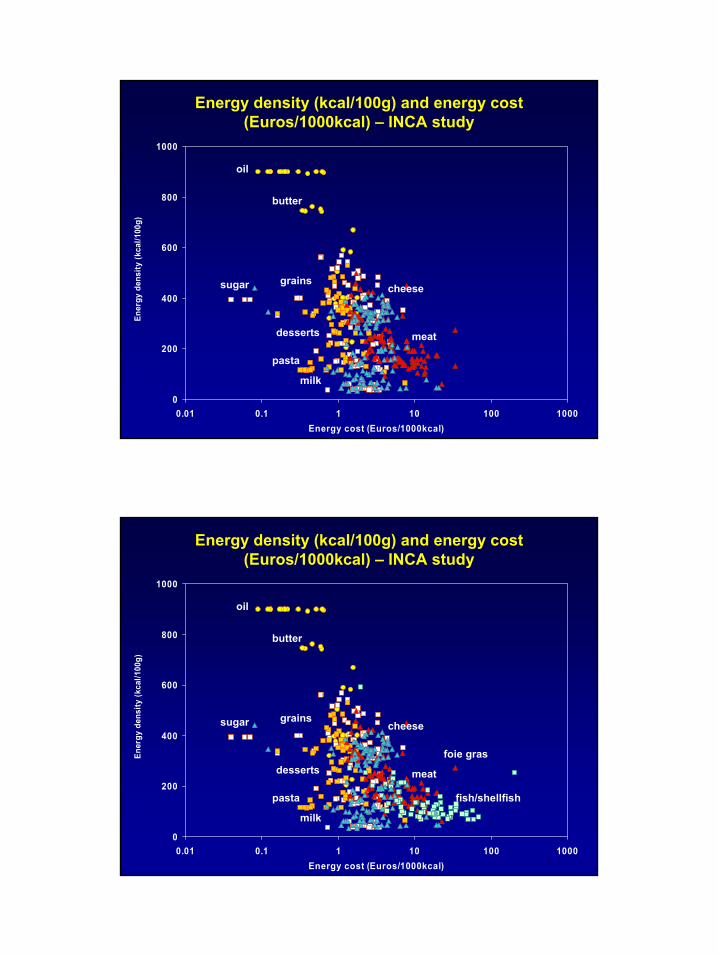
Energy density (kcal/100g) and energy cost (Euros/1000kcal) – INCA study
0
200
400
600
800
1000
0.01 0.1 1 10 100 1000Energy cost (Euros/1000kcal)
Ener
gy d
ensi
ty (k
cal/1
00g)
oil
butter
sugar
desserts
milk
grainscheese
fish/shellfish
foie gras
pasta
meat
Energy density (kcal/100g) and energy cost (Euros/1000kcal) – INCA study

8
0
200
400
600
800
1000
0.01 0.1 1 10 100 1000Energy cost (Euros/1000kcal)
Ener
gy d
ensi
ty (k
cal/1
00g)
oil
butter
sugar
desserts
milk
grainscheese
fish/shellfishpasta
meat
vegetables
Energy density (kcal/100g) and energy cost (Euros/1000kcal) – INCA study
0
200
400
600
800
1000
0.01 0.1 1 10 100 1000Energy cost (Euros/1000kcal)
Ener
gy d
ensi
ty (k
cal/1
00g)
oil
butter
sugar
desserts
milk
grainscheese
fruit
fish/shellfish
vegetables
nuts
pasta
Energy density (kcal/100g) and energy cost (Euros/1000kcal) – INCA study
9
0
200
400
600
800
1000
0.01 0.1 1 10 100 1000Energy cost (Euros/1000kcal)
Ener
gy d
ensi
ty (k
cal/1
00g)
oil
butter
sugar
desserts
milk
grainscheese
fruit
fish/shellfish
vegetables
nuts
pasta
Wine/alcohol
Energy density (kcal/100g) and energy cost (Euros/1000kcal) – INCA study
0
2
4
6
8
10
0.01 0.1 1 10 100 1000Energy cost ($/1000kcal)
Ener
gy d
ensi
ty (k
cal/1
00g)
oil
butter
sugar
desserts
milk
grainscheese
fruit
fish/shellfish
vegetables
nuts
pasta
Energy density (kcal/100g) and energy cost ($/1000kcal) –Seattle 2006 Supermarket prices
10
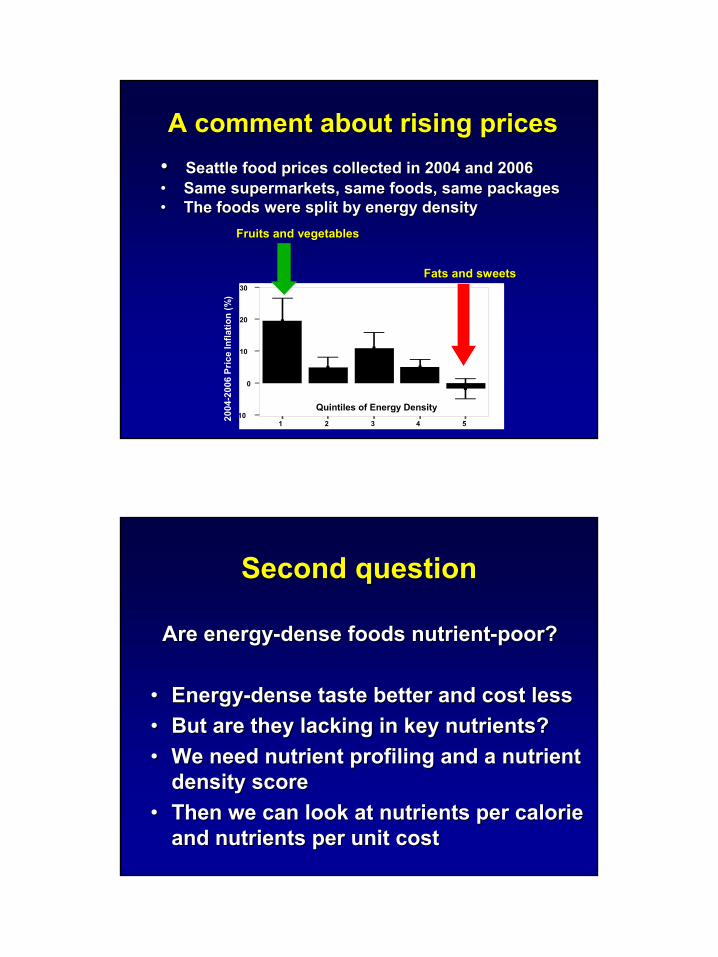
A comment about rising pricesA comment about rising prices•• Seattle food prices collected in 2004 and 2006Seattle food prices collected in 2004 and 2006•• Same supermarkets, same foods, same packagesSame supermarkets, same foods, same packages•• The foods were split by energy densityThe foods were split by energy density
1 2 3 4 510
0
10
20
30
]
]
]
]
]
Fruits and vegetablesFruits and vegetables
Fats and sweetsFats and sweets
2004
-200
6 Pr
ice
Infla
tion
(%)
Quintiles of Energy Density
Second questionSecond question
Are energyAre energy--dense foods nutrientdense foods nutrient--poor?poor?
•• EnergyEnergy--dense taste better and cost lessdense taste better and cost less•• But are they lacking in key nutrients?But are they lacking in key nutrients?•• We need nutrient profiling and a nutrient We need nutrient profiling and a nutrient
density scoredensity score•• Then we can look at nutrients per calorie Then we can look at nutrients per calorie
and nutrients per unit cost and nutrients per unit cost
11
Examples of nutrient profiling:Creating a nutrient density score for foods
• Nutrient Density Score is the ratio between the amount of nutrients in a food and the energy that the food provides
NDS = (NAS/ED) * 100• Nutrient Adequacy Score is based on percent DVs
for N key nutrients as provided by 100 g of food
NAS = (Σ (Nutrienti/DVi) * 100)/N• Nutrient-to-price ratio NPR = NAS/price per 100g
Maillot et al. 2007 (submitted for publication)Maillot et al. 2007 (submitted for publication)
0
100
200
300
400
500
600
700
800
900
0.1 10 1000Nutrient Density Score/100 kcal
Ener
gy D
ensi
ty (k
cal/1
00g)
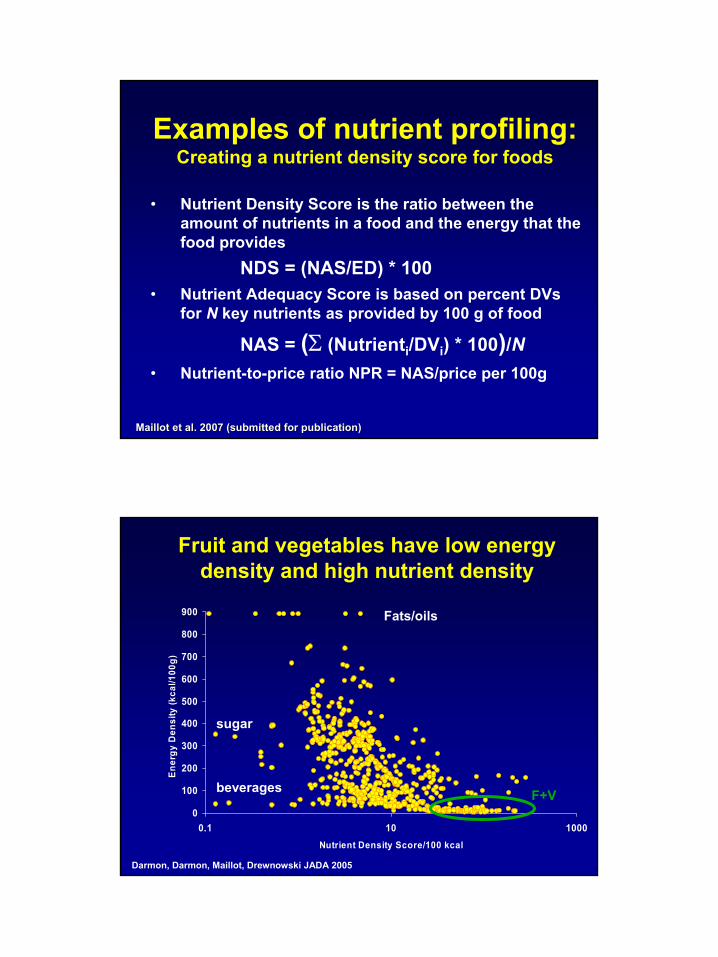
Fruit and vegetables have low energy density and high nutrient density
Fats/oils
Darmon, Darmon, Maillot, Drewnowski JADA 2005
F+V
sugar
beverages
12
0.1
1
10
100
1000
0.01 0.1 1 10
Price (Euros/100g)
Nut
rient
Ade
quac
y Sc
ore/
100g
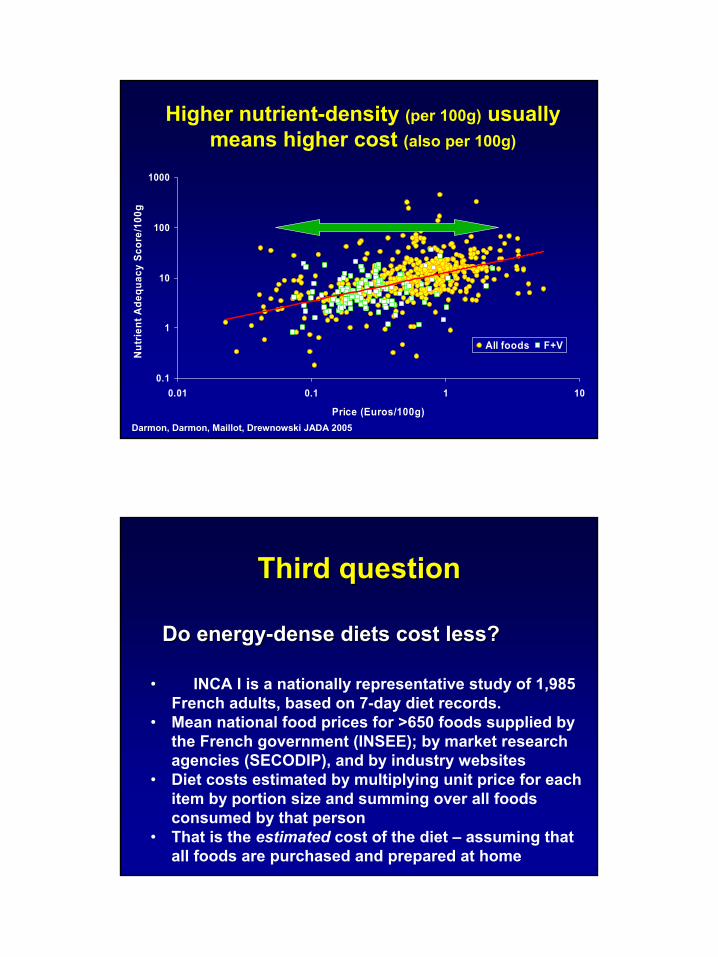
All foods F+V
Higher nutrient-density (per 100g) usually means higher cost (also per 100g)
Darmon, Darmon, Maillot, Drewnowski JADA 2005
Third questionThird question
Do energyDo energy--dense diets cost less?dense diets cost less?
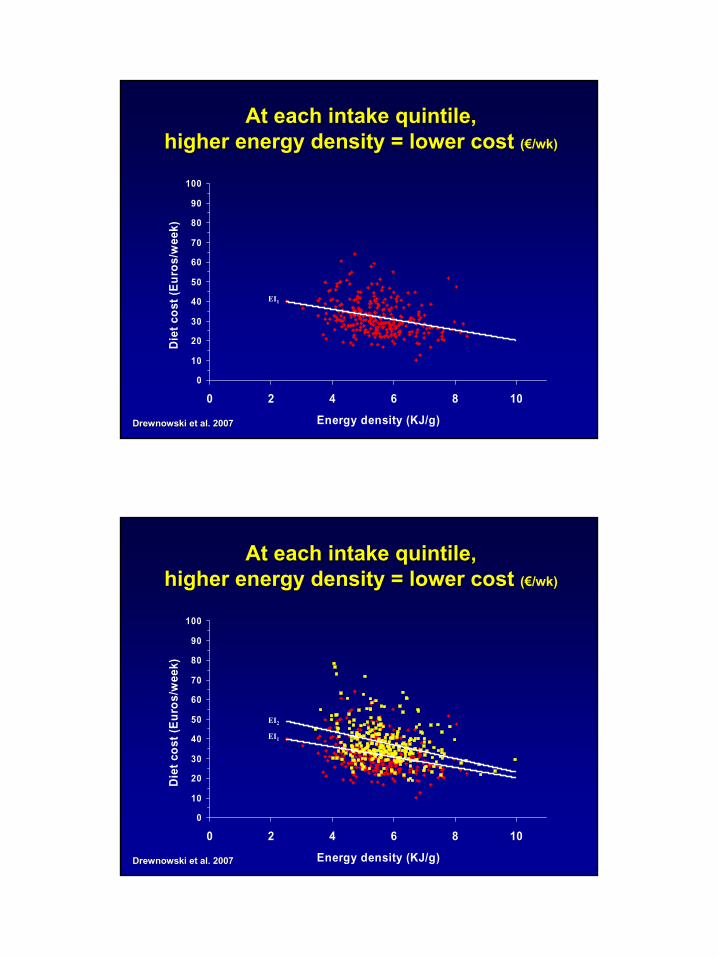
•• INCA I is a nationally representative study of 1,985 French adults, based on 7-day diet records.
• Mean national food prices for >650 foods supplied by the French government (INSEE); by market research agencies (SECODIP), and by industry websites
• Diet costs estimated by multiplying unit price for each item by portion size and summing over all foods consumed by that person
• That is the estimated cost of the diet – assuming that all foods are purchased and prepared at home
13
0
10
20
30
40
50
60
70
80
90
100
0 2 4 6 8 10
Energy density (KJ/g)
Die
t cos
t (Eu
ros/
wee
k)
EI1
At each intake quintile, At each intake quintile, higher energy density = lower cost higher energy density = lower cost ((€€/wk)/wk)
DrewnowskiDrewnowski et al. 2007et al. 2007
0
10
20
30
40
50
60
70
80
90
100
0 2 4 6 8 10
Energy density (KJ/g)
Die
t cos
t (Eu
ros/
wee
k)
EI1
EI2
At each intake quintile, At each intake quintile, higher energy density = lower cost higher energy density = lower cost ((€€/wk)/wk)
DrewnowskiDrewnowski et al. 2007et al. 2007
14
0
10
20
30
40
50
60
70
80
90
100
0 2 4 6 8 10
Energy density (KJ/g)
Die
t cos
t (Eu
ros/
wee
k)
EI1
EI2
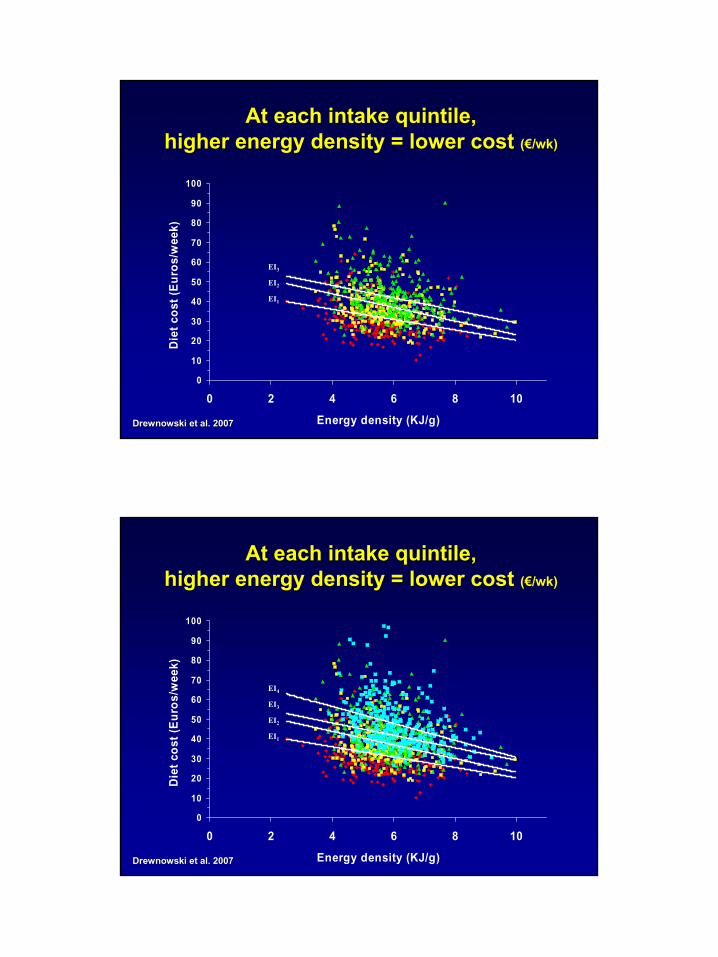
At each intake quintile, At each intake quintile, higher energy density = lower cost higher energy density = lower cost ((€€/wk)/wk)
EI3
DrewnowskiDrewnowski et al. 2007et al. 2007
0
10
20
30
40
50
60
70
80
90
100
0 2 4 6 8 10
Energy density (KJ/g)
Die
t cos
t (Eu
ros/
wee
k)
EI1
EI2
At each intake quintile, At each intake quintile, higher energy density = lower cost higher energy density = lower cost ((€€/wk)/wk)
EI3
EI4
DrewnowskiDrewnowski et al. 2007et al. 2007
15
0
10
20
30
40
50
60
70
80
90
100
0 2 4 6 8 10
Energy density (KJ/g)
Die
t cos
t (Eu
ros/
wee
k)
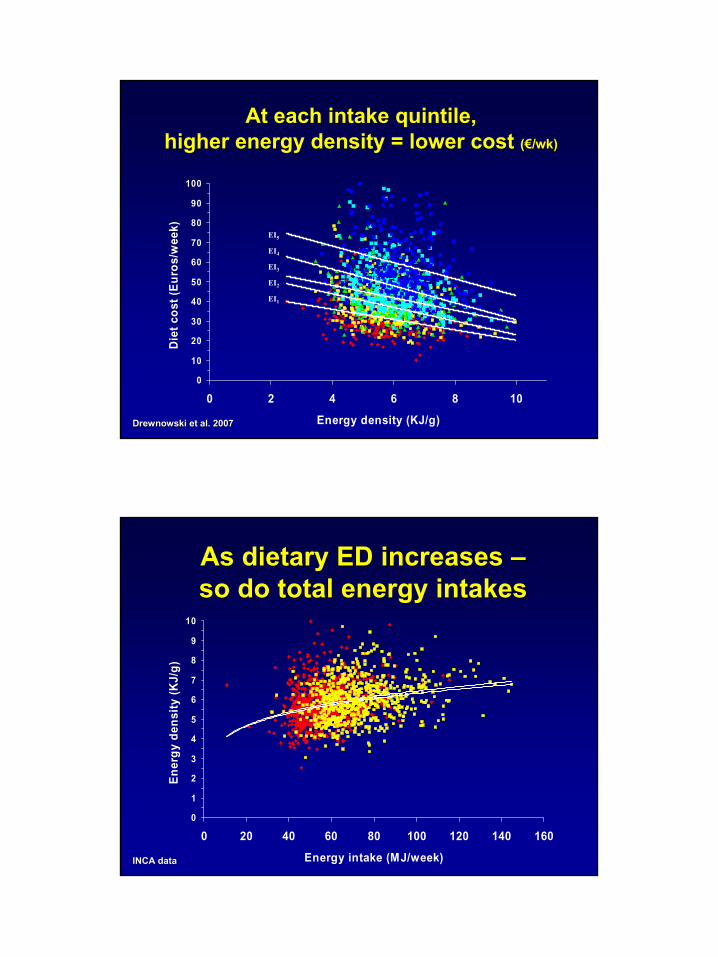
EI1
EI2
At each intake quintile, At each intake quintile, higher energy density = lower cost higher energy density = lower cost ((€€/wk)/wk)
EI3
EI4
EI5
DrewnowskiDrewnowski et al. 2007et al. 2007
0
1
2
3
4
5
6
7
8
9
10
0 20 40 60 80 100 120 140 160
Energy intake (MJ/week)
Ener
gy d
ensi
ty (K
J/g)
As dietary ED increases As dietary ED increases ––so do total energy intakesso do total energy intakes
INCA dataINCA data
16
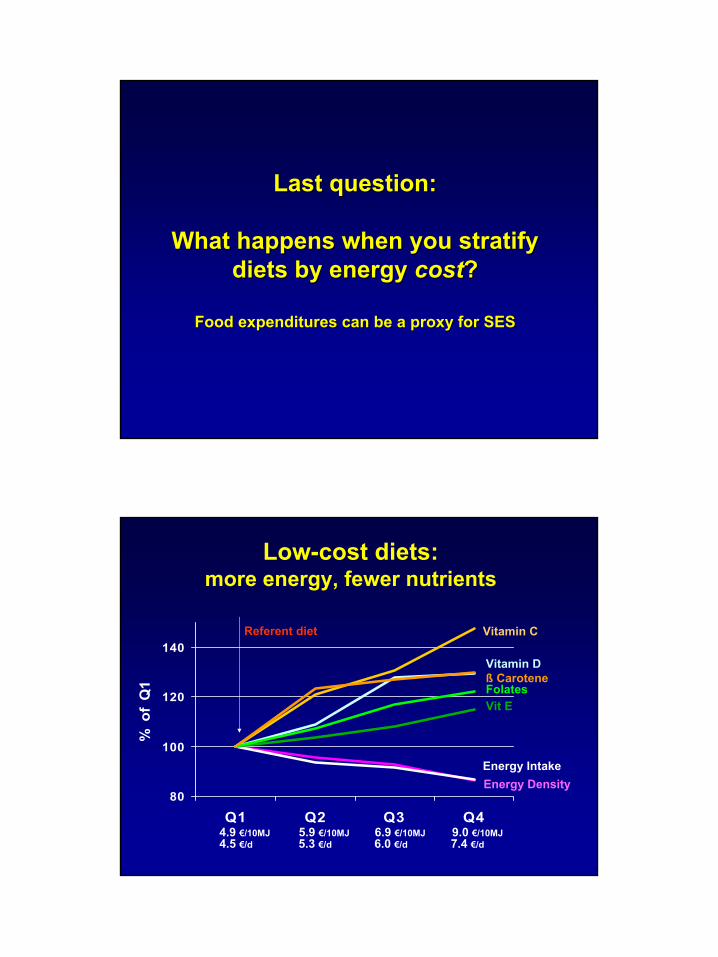
Last question:Last question:
What happens when you stratify What happens when you stratify diets by energy diets by energy costcost??
Food expenditures can be a proxy for SESFood expenditures can be a proxy for SES
80
100
120
140
Q1 Q2 Q3 Q4
% o
f Q
1
Energy Intake
Vitamin C
Vitamin Dß CaroteneFolates
4.9 €/10MJ 5.9 €/10MJ 6.9 €/10MJ 9.0 €/10MJ4.5 €/d 5.3 €/d 6.0 €/d 7.4 €/d
Energy Density
Vit E
Low-cost diets: more energy, fewer nutrients
Referent diet
17
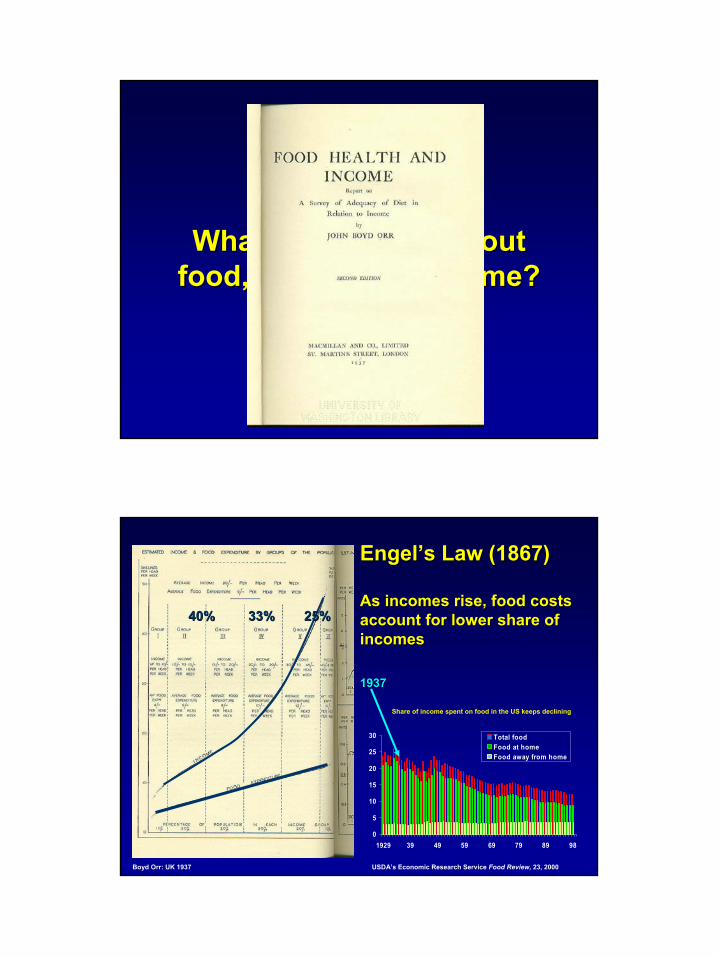
What do we know about What do we know about food, health, and income?food, health, and income?
40%40% 33%33% 25%25%
Engel’s Law (1867) Engel’s Law (1867)
As incomes rise, food costs As incomes rise, food costs account for lower share of account for lower share of incomesincomes
0
5
10
15
20
25
30
1929 39 49 59 69 79 89 98
Total foodFood at homeFood away from home
USDA’s Economic Research Service Food Review, 23, 2000Boyd Orr: UK 1937
Share of income spent on food in the US keeps declining
19371937
18
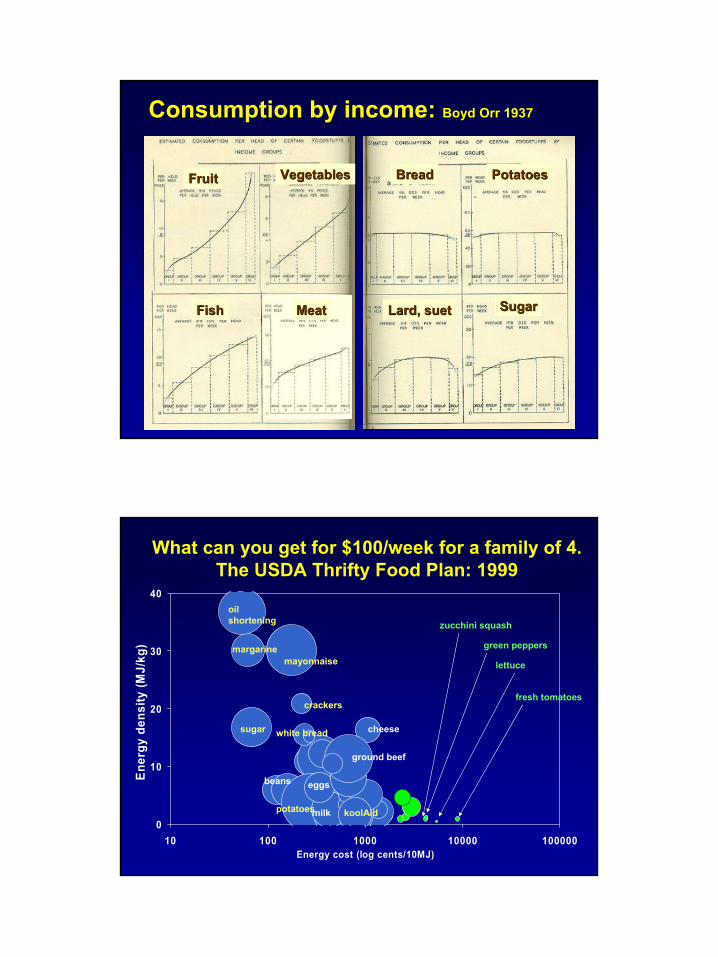
Consumption by income: Consumption by income: Boyd Orr 1937Boyd Orr 1937
FruitFruit
FishFish
VegetablesVegetables PotatoesPotatoes
SugarSugar
BreadBread
Lard, suetLard, suetMeatMeat
0
10
20
30
40
10 100 1000 10000 100000Energy cost (log cents/10MJ)
Ener
gy d
ensi
ty (M
J/kg
)
oilshortening
margarine
sugar cheese
koolAid
beans
mayonnaise lettuce
potatoes
fresh tomatoescrackers
ground beef
white bread
milk
eggs
zucchini squash
green peppers
What can you get for $100/week for a family of 4. The USDA Thrifty Food Plan: 1999
19
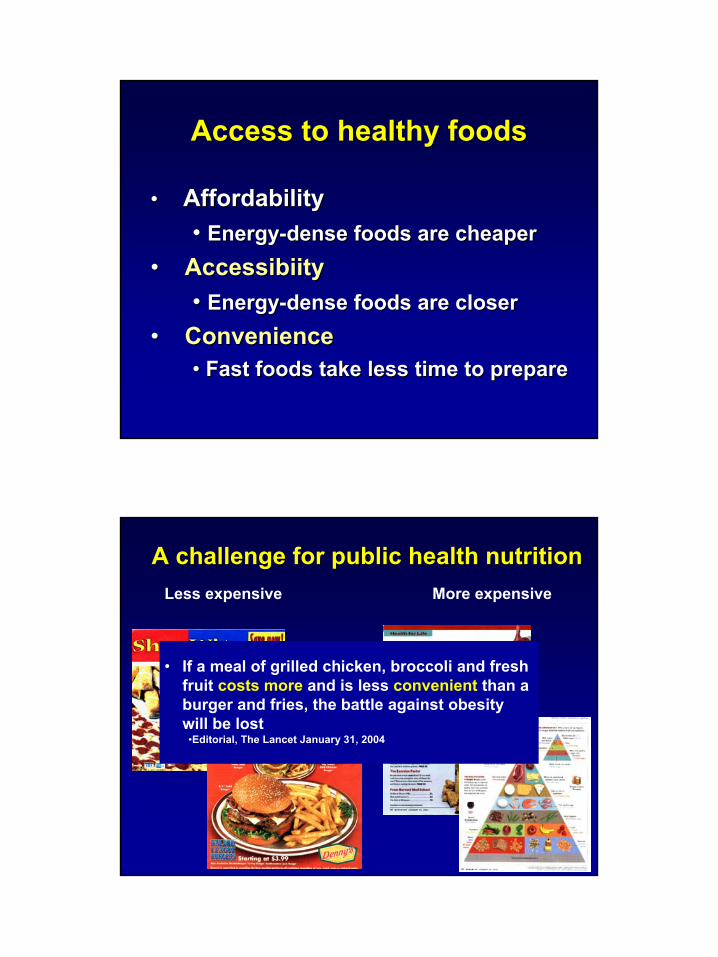
Access to healthy foodsAccess to healthy foods
•• AffordabilityAffordability•• EnergyEnergy--dense foods are cheaperdense foods are cheaper
•• AccessibiityAccessibiity•• EnergyEnergy--dense foods are closerdense foods are closer
•• ConvenienceConvenience•• Fast foods take less time to prepareFast foods take less time to prepare
A challenge for public health nutritionA challenge for public health nutritionLess expensive More expensive
• If a meal of grilled chicken, broccoli and fresh fruit costs more and is less convenient than a burger and fries, the battle against obesity will be lost •Editorial, The Lancet January 31, 2004
20
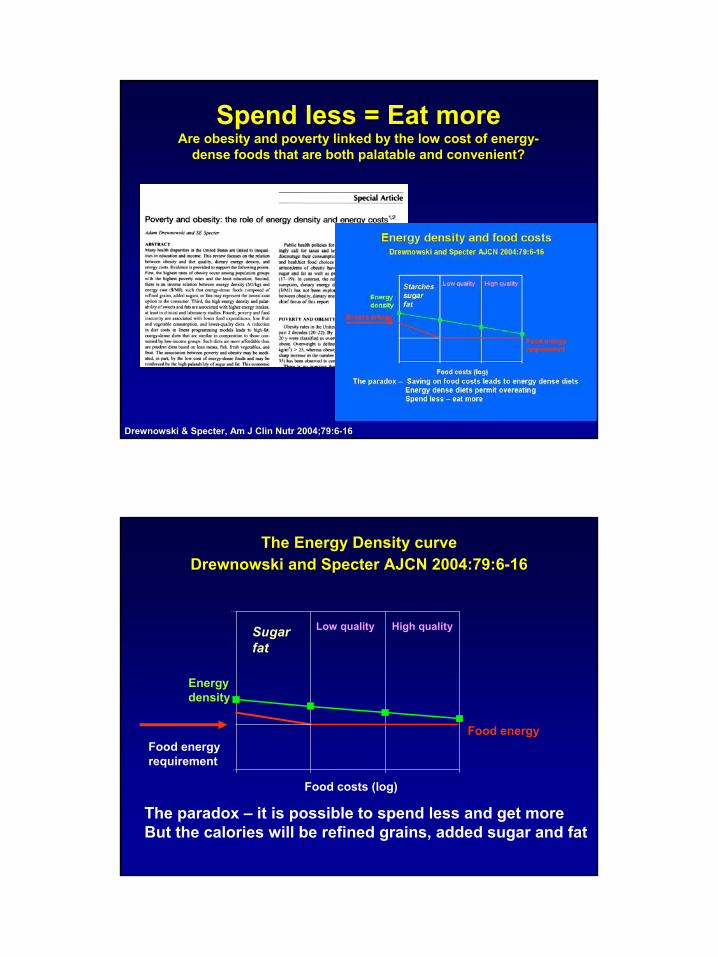
Spend less = Eat moreSpend less = Eat moreAre obesity and poverty linked by the low cost of energyAre obesity and poverty linked by the low cost of energy--
dense foods that are both palatable and convenient? dense foods that are both palatable and convenient?
Drewnowski & Specter, Am J Drewnowski & Specter, Am J ClinClin NutrNutr 2004;79:62004;79:6--1616
The Energy Density curve Drewnowski and Specter AJCN 2004:79:6-16
0
2 5
Food costs (log)
Sugar fat
Energydensity
Food energyrequirement
Food energy
Low quality High quality
The paradox – it is possible to spend less and get moreBut the calories will be refined grains, added sugar and fat
21
Conclusions:Conclusions:
The real cost of obesity lies in the The real cost of obesity lies in the current hierarchy of food prices current hierarchy of food prices and the promotion of low cost and the promotion of low cost
energyenergy--dense foods dense foods
Obesity is an economic issueObesity is an economic issue