Embed Size (px)
Citation preview
The Real Cost of Mining Gold (with Cipher Research)
A Monday Morning Musing from Mickey the Mercenary Geologist
(Data and Analysis Provided by Cipher Research Ltd, Vancouver, B.C.)
February 2, 2015
Since the bull market for gold began in 2003, the world’s major gold mining companies have produced
tens of millions of ounces of gold and have raised (and written-off) many billions of dollars for capital
expenditures and acquisitions.
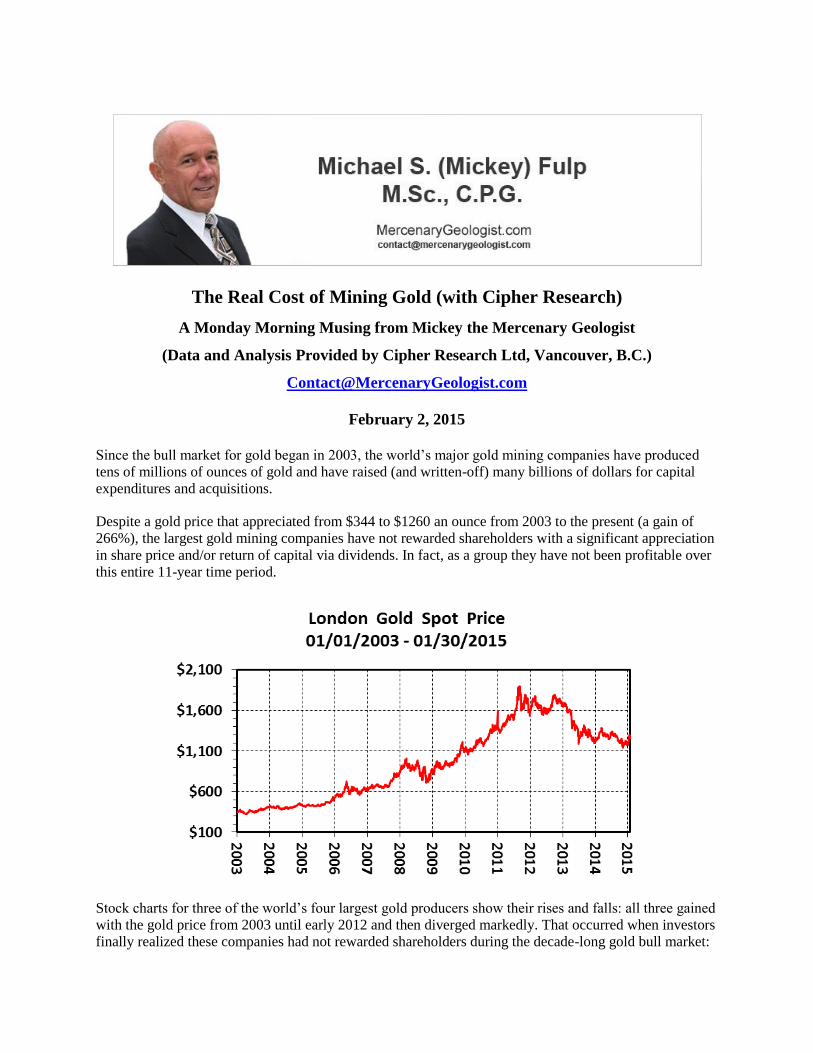
Despite a gold price that appreciated from $344 to $1260 an ounce from 2003 to the present (a gain of
266%), the largest gold mining companies have not rewarded shareholders with a significant appreciation
in share price and/or return of capital via dividends. In fact, as a group they have not been profitable over
this entire 11-year time period.
Stock charts for three of the world’s four largest gold producers show their rises and falls: all three gained
with the gold price from 2003 until early 2012 and then diverged markedly. That occurred when investors
finally realized these companies had not rewarded shareholders during the decade-long gold bull market:

Barrick Gold
Goldcorp
Newmont

The following table compares the appreciation in share price versus the gold price for seven large gold
companies discussed in this musing:
Open Close % Change
Gold Price ($) $344 $1,260 266%
Agnico Eagle (Cdn) $23.02 C$42.84 86%
Barrick (Cdn) $24.35 C$16.25 -33%
Eldorado (Cdn) $2.05 C$6.10 198%
Goldcorp (Cdn) $19.75 C$30.69 55%
Newmont (US) $29.04 $25.15 -13%
Randgold (US) $7.24 $85.26 1078%
Yamana (Cdn) $0.16 C$5.26 3188%
Standard methodologies for measuring and projecting costs are integral in evaluating any company for
possible investment. With falling gold prices since Q4 2011, the major gold miners have suffered a
proliferation of negative earnings and cash flow reports combined with massive write-down of assets.
Their poor performances have called into question the validity of cost reporting measures in the gold
mining industry.
Let’s look briefly into the history of cost reporting in the industry. Since the mid-1990s, gold mining
companies have used an industry-accepted but non-GAAP reporting item called “cash costs” to gauge
their performances. “Cash cost per ounce of gold” was purported to provide transparency into the
economics of gold mining operations. However, it excludes some expenses and capital items that
drastically reduce a company’s bottom line profitability.
In 2013, the industry implemented a new and more-inclusive cost reporting measure called “all-in
sustaining costs”. Despite this attempt to include more expense and capital items, the real costs of mining
gold remain opaque.
As of this writing, there remains no standardized cost reporting in the mining industry. Therefore,
effectively evaluating gold companies for investment purposes is fraught with difficulty given the range
in methods of financial accounting.
In this musing, I use data and analysis provided by Cipher Research Ltd, an independent Vancouver-
based research and analysis company that covers the mining and metals sector of the commodity markets.
Cipher develops proprietary valuation models and investment strategies for its clients.
We will present Cipher’s work that shows widely-used cost reporting standards to be wholly inadequate
for evaluation and investment purposes. Finally, we propose a sound and ready solution to the current
dilemma.
There are currently two non-GAAP cost reporting measures employed by the gold mining industry.
Cash cost is the cost to mine gold-bearing rocks, process the ore, and sell the gold. It factors in
basic mining, processing, transport and refining costs but ignores sustaining capital, general and
administrative (G&A) expenses, and other associated costs. “Cash cost” gives little insight into
the actual all-in cost of a company producing an ounce of gold. It also excludes the “non-cash”
depreciation expense reported in GAAP financial statements, which is a measure of the cost of
sustaining capital.
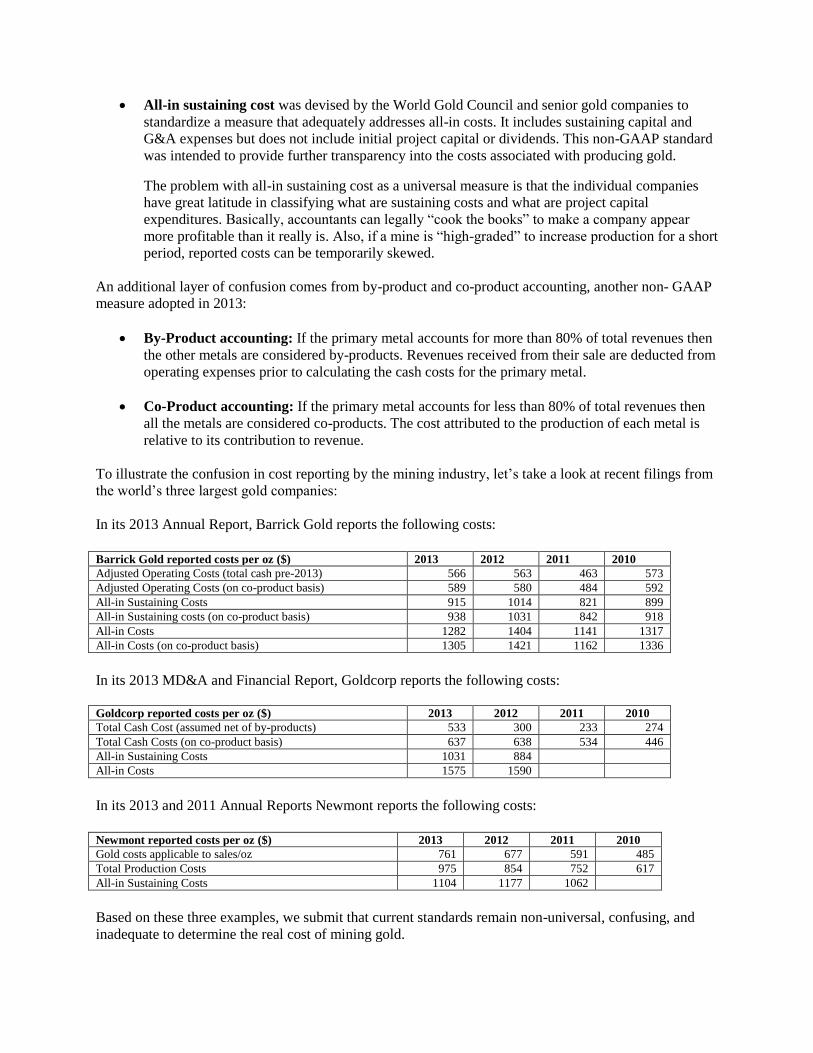
All-in sustaining cost was devised by the World Gold Council and senior gold companies to
standardize a measure that adequately addresses all-in costs. It includes sustaining capital and
G&A expenses but does not include initial project capital or dividends. This non-GAAP standard
was intended to provide further transparency into the costs associated with producing gold.
The problem with all-in sustaining cost as a universal measure is that the individual companies
have great latitude in classifying what are sustaining costs and what are project capital
expenditures. Basically, accountants can legally “cook the books” to make a company appear
more profitable than it really is. Also, if a mine is “high-graded” to increase production for a short
period, reported costs can be temporarily skewed.
An additional layer of confusion comes from by-product and co-product accounting, another non- GAAP
measure adopted in 2013:
By-Product accounting: If the primary metal accounts for more than 80% of total revenues then
the other metals are considered by-products. Revenues received from their sale are deducted from
operating expenses prior to calculating the cash costs for the primary metal.
Co-Product accounting: If the primary metal accounts for less than 80% of total revenues then
all the metals are considered co-products. The cost attributed to the production of each metal is
relative to its contribution to revenue.
To illustrate the confusion in cost reporting by the mining industry, let’s take a look at recent filings from
the world’s three largest gold companies:
In its 2013 Annual Report, Barrick Gold reports the following costs:
Barrick Gold reported costs per oz ($) 2013 2012 2011 2010
Adjusted Operating Costs (total cash pre-2013) 566 563 463 573
Adjusted Operating Costs (on co-product basis) 589 580 484 592
All-in Sustaining Costs 915 1014 821 899
All-in Sustaining costs (on co-product basis) 938 1031 842 918
All-in Costs 1282 1404 1141 1317
All-in Costs (on co-product basis) 1305 1421 1162 1336
In its 2013 MD&A and Financial Report, Goldcorp reports the following costs:
Goldcorp reported costs per oz ($) 2013 2012 2011 2010
Total Cash Cost (assumed net of by-products) 533 300 233 274
Total Cash Costs (on co-product basis) 637 638 534 446
All-in Sustaining Costs 1031 884
All-in Costs 1575 1590
In its 2013 and 2011 Annual Reports Newmont reports the following costs:
Newmont reported costs per oz ($) 2013 2012 2011 2010
Gold costs applicable to sales/oz 761 677 591 485
Total Production Costs 975 854 752 617
All-in Sustaining Costs 1104 1177 1062
Based on these three examples, we submit that current standards remain non-universal, confusing, and
inadequate to determine the real cost of mining gold.

Furthermore, in its 2012 Annual Report, Goldcorp explains its profit margin per ounce of gold with this
graphic:
This figure suggests Goldcorp had a margin of roughly $800 per ounce of gold produced in 2012. Its
production was 2.4 million ounces of gold, equaling $1.92 billion in margin. It in turn reported operating
cash flow of $2.10 billion and net income of $1.75 billion, both in line with the reported margin. This
accounting makes the company appear very healthy.
However during the reporting period, Goldcorp’s actual cash position dropped by $582 million. This
indicates the company spent the $1.92 billion in operating margin plus an additional $582 million.
Where in the world did all this money go?
In fairness, we must point out that the above scenario is not unique to Goldcorp but has also occurred year
after year with other companies in the gold mining industry.
We conclude there is an ongoing industry-wide problem with current cost reporting standards. In order to
fully understand the problem and formulate a resolution, we must follow the cash.
First, note that the Balance Sheet and the Income Statement reflect the accrual basis of accounting. They
are relatively easy to manipulate in order to paint a more favorable picture of a company in the short term.
However, a company’s cash flow statement includes only inflows and outflows of cash over the defined
accounting period. Since this is much harder to manipulate, we want to focus solely on its cash flow
statements to determine actual profitability over a longer term.
These are the three conditions we want to see in the cash flow statements of a healthy gold mining
company year over year:
The primary source of cash is from operations;
Operating cash flow exceeds net income;
Operating cash flow exceeds capital expenditures, indicating the company can finance growth
from internally-generated cash versus borrowed debt and equity raises.
Review of cash flow statements for seven of the world’s largest gold mining companies (Agnico-Eagle,
Barrick Gold, Eldorado Gold, Goldcorp, Newmont Mining, Randgold, and Yamana Gold) shows that
they consistently meet the first two criteria but fail to meet the third.
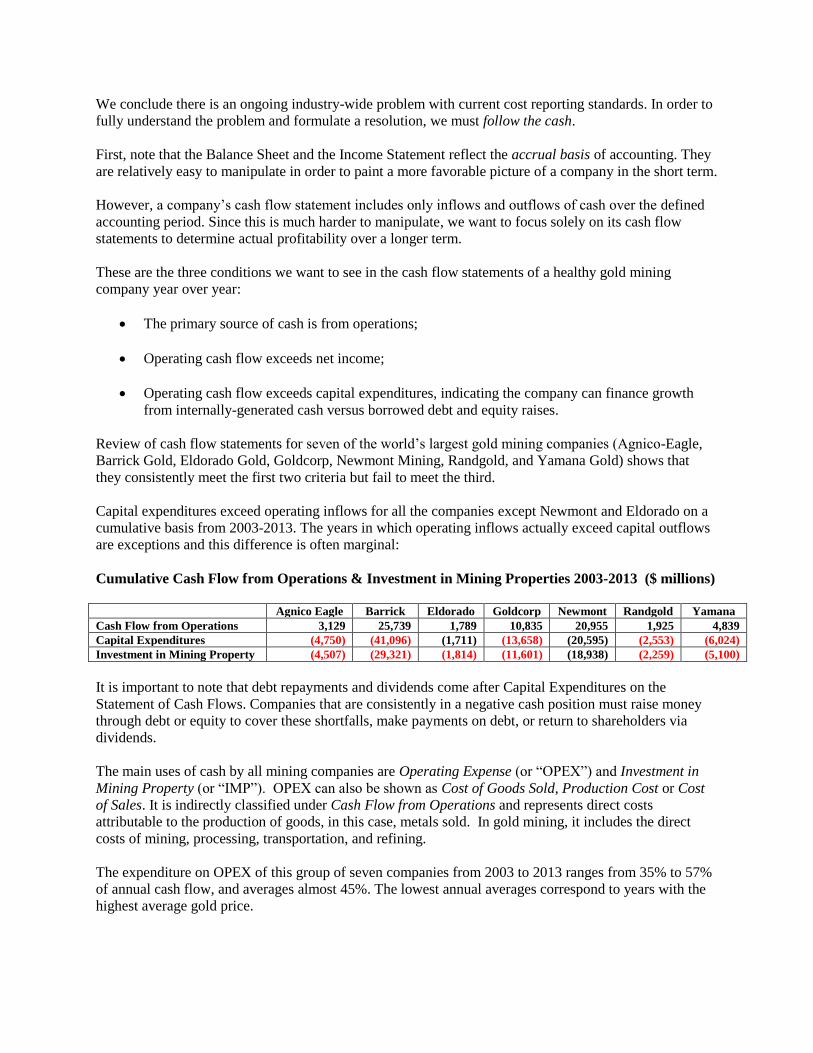
Capital expenditures exceed operating inflows for all the companies except Newmont and Eldorado on a
cumulative basis from 2003-2013. The years in which operating inflows actually exceed capital outflows
are exceptions and this difference is often marginal:
Cumulative Cash Flow from Operations & Investment in Mining Properties 2003-2013 ($ millions)
Agnico Eagle Barrick Eldorado Goldcorp Newmont Randgold Yamana
Cash Flow from Operations 3,129 25,739 1,789 10,835 20,955 1,925 4,839
Capital Expenditures (4,750) (41,096) (1,711) (13,658) (20,595) (2,553) (6,024)
Investment in Mining Property (4,507) (29,321) (1,814) (11,601) (18,938) (2,259) (5,100)
It is important to note that debt repayments and dividends come after Capital Expenditures on the
Statement of Cash Flows. Companies that are consistently in a negative cash position must raise money
through debt or equity to cover these shortfalls, make payments on debt, or return to shareholders via
dividends.
The main uses of cash by all mining companies are Operating Expense (or “OPEX”) and Investment in
Mining Property (or “IMP”). OPEX can also be shown as Cost of Goods Sold, Production Cost or Cost
of Sales. It is indirectly classified under Cash Flow from Operations and represents direct costs
attributable to the production of goods, in this case, metals sold. In gold mining, it includes the direct
costs of mining, processing, transportation, and refining.
The expenditure on OPEX of this group of seven companies from 2003 to 2013 ranges from 35% to 57%
of annual cash flow, and averages almost 45%. The lowest annual averages correspond to years with the
highest average gold price.

The IMP of the group from 2003 to 2013 (with a few outliers removed) ranges from approximately 26%
to 44% of annual cash flow and averages almost 33%. There is no significant correlation of IMP with the
price of gold. Therefore, on average these seven major gold producers used up 78% of their annual cash
flow in OPEX and IMP.
OPEX is relatively easy to understand and interpret. But what exactly is IMP?
Investment in Mining Property or Expenditure on Mining Interest, or Capital Expenditure (IMP) is
classified as an outflow from Investing Activities in the Statement of Cash Flows and increases the value
of Plant, Property and Equipment (PPE) on the Balance Sheet. IMP never makes its way onto the Income
Statement except in the form of non-cash depreciation expense, which most per ounce cost estimates
ignore, or until there is a write down of the PPE.
It is very important to note here that cash spent for acquisition of new assets has its own separate category
in the Statement of Cash Flows and is not included in IMP.
Investing Activities by definition are used for creation of long-term assets, which should generate future
returns by increasing the size of the reserve and resource base or the level of gold production. In other
words, IMP should extend the life of operations and/or increase cash flows from operations. Examples of
IMP include stripping costs, underground development in advance of mining, shaft sinking or deepening,
equipment replacement, and new haul roads.
Cipher’s research shows that Investment in Mining Property is the root of the problem with financial
reporting in the gold mining industry.
Since IMP uses such a significant percentage of revenue for large gold miners, we would expect
substantial increases in the reserve & resource base and production levels over the past 11 years. Here is
data for the three largest companies in Cipher’s study:
Production, Reserves-Resources, IMP, and Acquisitions 2003-2013 (millions)
Company 2013 2012 2011 2010 2009 2008 2007 2006 2005 2004 2003
Barrick Production (oz) 8.9 8.7 9.1 9.0 8.4 8.7 9.1 9.3 5.3 5.2 5.4
R & R (oz) 235.4 258.9 260.5 253.2 233.1 238.4 207.1 182.4 118.6 109.5 110.6
IMP ($) 5,501 6,369 4,973 3,778 2,351 1,749 1,035 1,087 1,104 824 322
Acquisitions ($) 0 37 7,677 813 101 2,174 1,122 208 10,400 0 293
Goldcorp Production (oz) 2.7 2.8 3.4 3.1 2.8 2.8 3.2 2.8 2.0 0.47 0.72
R & R (oz) 112.7 118.9 116.0 106.2 91.1 89.3 92.4 86.5 33.7 7.8 7.8
IMP ($) 2,188 2,544 1,778 768 1,356 1,372 712 475 278 56 75
Acquisitions ($) 0 0 0 1,318 354 740 205 10,587 2,400 0 0
Newmont Production (oz) 5.9 5.9 6.6 7.8 7.9 7.1 7.9 8.3 9.9 7.7 7.1
R & R (oz) 132.3 139.4 140.5 131.6 129.7 118.0 112.6 125.8 121.2 92.4 91.3
IMP ($) 1,900 3,210 2,787 1,402 1,769 1,875 1,670 1,551 1,251 718 505
Acquisitions ($) 13 25 2309 4 1007 325 1043 314 0 (51) (6)
Note: Acquisitions include both cash paid and the value of shares issued.
This table surprisingly shows that IMP has had little to no impact on either the reserve-resource base or
the production levels for gold mining companies since the gold price started rising in 2003.

It is also apparent that significant changes to the reserve-resource base and production levels are largely a
result of acquisitions. In addition, reserves and resources are a function of the gold price and the all-in
costs of producing ore. Therefore, incremental changes to mining companies’ reserve-resource bases
occur annually to reflect what is economic at that particular time.
Newmont Mining’s operational results are particular telling. The company’s production levels have been
in steady decline over the last nine years and its reserve-resource base has been relatively flat.
The main reason is that Newmont made few significant acquisitions over the time period, and those it did
make were failures. For example, it paid $1.0 billion and assumed $0.5 billion in liabilities for Miramar
Mining in 2007 and $2.3 billion for Fronteer Gold in 2011.
Both projects were slated for development but the Hope Bay project was a bust and resulted in a $1.6
billion write-down in 2013. Long Canyon was exorbitantly expensive for the ounces of gold in the ground
and ultimately may not be big enough for the mining giant. Overpaying for acquisitions is a common
theme in the mining industry and the topic of another entire research report.
Newmont spent $18.9 billion on IMP from 2003-2013, or 25% of its total revenue for the period. Yet with
no significant acquisitions, its production continues to fall and its reserves and resources are not growing.
Note however, if Newmont had not spent $3.8 billion on these two failed acquisitions, its cash flow from
operations would have exceeded capital expenditures by over $4.1 billion.
Furthermore, the company has taken on $5.8 billion in debt, issued $2.9 billion in equities, and paid out
$5.2 billion in dividends to shareholders over the period.
Although we have singled out Newmont here, it is just one example of the modus operandi of the major
gold mining companies over the past 11 years.
As stated above, IMP is a significant annual expenditure for each company with an industry average of
33% of cash flow over the past 11 years. Certainly parts of what is reported for IMP are justified as
capital investment expenditures and should be depreciated over their useful lives.
But this is where the creative accounting comes in. Evidence suggests that some of what should be OPEX
is consistently tucked away in IMP instead of being included in the actual costs of producing gold.
Even the most vigilant auditors admit they struggle with drawing lines between operating expenses and
capitalized expenditures. In this regard, mining companies have significant leeway in what their
accountants classify as initial capital, sustaining capital, or operating expense.
Of course, the incentive to appear more profitable is not restricted to the gold mining industry. That said,
the nature of capital-intensive extractive industries, including mining and oil and gas, permits the bean
counters more wiggle room with the numbers.
If costs are capitalized rather that expensed, mining companies appear more profitable in the short term,
and enjoy higher market capitalizations and price multiples. Executives receive larger bonuses and, as
long as the company grows, shareholders and analysts remain content.
However, when expenses are kept routinely low with too many costs capitalized, the scales will
periodically tip too far. The result is large write-downs of assets.
The argument of “short-term pain for long-term gain” is often acceptable to investors because write-
downs affect Net Income for that reporting period but have no direct impact on operations and should
result in higher future earnings.
Analysts justify the huge write-downs by large gold miners as simply risky acquisitions that were done in
the past at higher gold prices.
But is this really the full picture? Let’s review the actions of Barrick and Goldcorp over the past decade.
The following numbers include total cash spent on acquisitions and IMP. Since we are focused on
following the cash, they do not include the value of any shares issued:
Barrick had acquisitions and IMP totaling $41.2 billion, with IMP comprising $29.1 billion of
this investment since 2003.
During the same period Barrick has taken write-downs of $26.5 billion. Note that $19.2 billion of
that has occurred over the past two years.
Barrick produced 87.1 million ounces of gold.
If the write-downs alone were expensed over this period, the costs of production would have been
$305/oz Au-eq higher than the company reported.
Here is the analysis of Goldcorp:
Goldcorp had acquisitions and IMP totaling $15.9 billion since 2003. IMP constituted $11.6
billion of this amount.
During the same period, Goldcorp has taken write-downs of $2.9 billion and is reportedly taking
another $2.7 billion for 2014.
Goldcorp produced 28.8 million ounces of gold.
If these write-downs alone were expensed from 2003 to 2013, the costs of production would
have been $195/oz Au-eq higher than the company reported.
Accrual accounting dictates we match revenues to expenses (the matching principle) in the period when
they occur rather than when they are received. However, let’s ignore accounting principles for a moment
and focus on what has actually occurred.
Companies capitalize significant expenditures year after year as IMP. Then every few years they take
major write-offs to clear out the balance sheet. That effectively hides underperformance in bad years and
then allows future years to ignore those costs.
We submit that gold mining write-downs are more a result of marginal operations than expensive
acquisitions. The earnings that get written-off would not have been earnings if costs were originally
classified as expenses instead of capital items.

How can we develop reliable cost reporting for the gold mining industry that reflects actual return to
shareholders?
It is apparent that either depreciation needs to be increased to more representative levels, thus reducing
annual earnings and periodic massive write-downs, or IMP should be expensed annually.
Note that we have chosen the period from 2003-2013 in order to minimize the anomalies that can occur in
individual years and serve as reference for a longer term investment horizon.
When Cipher includes IMP in determination of cash flows from gold mining operations, we see a very
different picture from what the gold mining companies have been reporting using currently-accepted non-
GAAP measures.
In addition, Cipher’s methodology includes a simple financial measure for the confusing by-product or
co-product accounting. They calculate a total cash cost per ounce of gold equivalent production (oz Au-
eq) by dividing total revenue by the average price of gold over the reporting time. This allows us to
accurately relate any financial item to a standardized unit, which in turn allows for a more appropriate
comparison between gold mining companies and projects.
Here are results utilizing all the methodologies detailed above:
Barrick Gold
Cipher Cash Costs: 2013 2012 2011 2010 2009 2008 2007 2006 2005 2004 2003
OPEX/Oz Au-eq ($) 622 681 538 440 455 424 350 294 227 206 200
Total Cost/Oz Au-eq ($) 1,554 1,776 1,534 1,135 1,531 814 615 493 516 336 342
Avg Gold Price ($) 1,411 1,669 1,572 1,225 972 872 695 603 445 410 363
Goldcorp
Cipher Cash Costs: 2013 2012 2011 2010 2009 2008 2007 2006 2005 2004 2003
OPEX/Oz Au-eq ($) 762 718 598 476 424 420 301 227 151 147 124
Total Cost/Oz Au-eq ($) 1,883 1,826 1,399 901 1,151 1,054 715 491 350 413 338
Avg Gold Price ($) 1,411 1,669 1,572 1,225 972 872 695 603 445 410 363
Newmont Mining
Cipher Cash Costs: 2013 2012 2011 2010 2009 2008 2007 2006 2005 2004 2003
OPEX/oz Au-eq ($) 879 $717 590 447 385 442 375 304 234 220 226
Total Cost/oz Au-eq ($) 1,472 1,811 1,451 998 824 954 822 644 446 477 416
Avg Gold Price ($) 1,411 1,669 1,572 1,225 972 872 695 603 445 410 363
Total Cost = (Revenues - Cash Flow from Operations) + Investment in Mining Properties; Oz Au-eq = Revenue/Avg Gold Price
These tables demonstrably show that three of the world’s four largest gold mining companies have been
profitable on an all-in cost basis for only about half of the 11-year bull market for gold.
We conclude that Cipher’s calculation of Total Cost/oz Au-eq is a more accurate measure of the real cost
of mining gold and is a better way to evaluate gold mining companies for investment purposes.
Classification of costs in mining is challenging due to the nature of operations. Analysis is simplified by
following the cash to determine whether gold companies generate adequate cash flows in order to operate
profitably over a significant period of time.
Or do they have to borrow money in order to survive and pay out dividends?
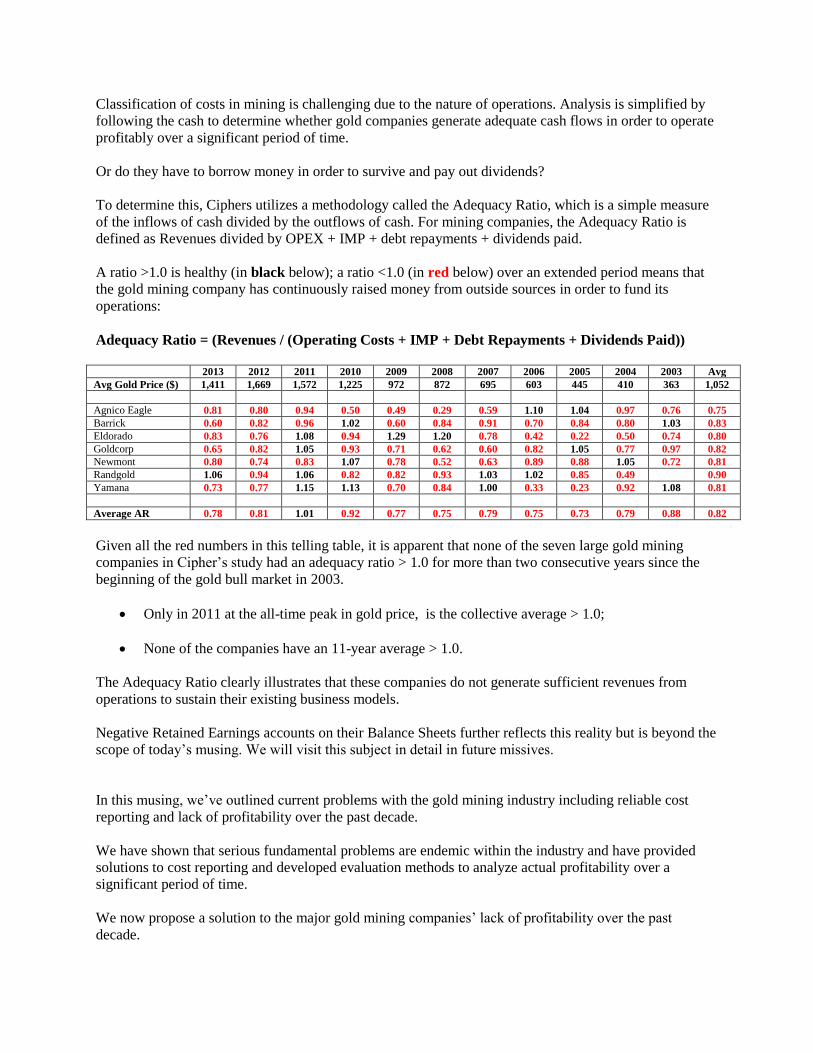
To determine this, Ciphers utilizes a methodology called the Adequacy Ratio, which is a simple measure
of the inflows of cash divided by the outflows of cash. For mining companies, the Adequacy Ratio is
defined as Revenues divided by OPEX + IMP + debt repayments + dividends paid.
A ratio >1.0 is healthy (in black below); a ratio <1.0 (in red below) over an extended period means that
the gold mining company has continuously raised money from outside sources in order to fund its
operations:
Adequacy Ratio = (Revenues / (Operating Costs + IMP + Debt Repayments + Dividends Paid))
2013 2012 2011 2010 2009 2008 2007 2006 2005 2004 2003 Avg
Avg Gold Price ($) 1,411 1,669 1,572 1,225 972 872 695 603 445 410 363 1,052
Agnico Eagle 0.81 0.80 0.94 0.50 0.49 0.29 0.59 1.10 1.04 0.97 0.76 0.75
Barrick 0.60 0.82 0.96 1.02 0.60 0.84 0.91 0.70 0.84 0.80 1.03 0.83
Eldorado 0.83 0.76 1.08 0.94 1.29 1.20 0.78 0.42 0.22 0.50 0.74 0.80
Goldcorp 0.65 0.82 1.05 0.93 0.71 0.62 0.60 0.82 1.05 0.77 0.97 0.82
Newmont 0.80 0.74 0.83 1.07 0.78 0.52 0.63 0.89 0.88 1.05 0.72 0.81
Randgold 1.06 0.94 1.06 0.82 0.82 0.93 1.03 1.02 0.85 0.49 0.90
Yamana 0.73 0.77 1.15 1.13 0.70 0.84 1.00 0.33 0.23 0.92 1.08 0.81
Average AR 0.78 0.81 1.01 0.92 0.77 0.75 0.79 0.75 0.73 0.79 0.88 0.82
Given all the red numbers in this telling table, it is apparent that none of the seven large gold mining
companies in Cipher’s study had an adequacy ratio > 1.0 for more than two consecutive years since the
beginning of the gold bull market in 2003.
Only in 2011 at the all-time peak in gold price, is the collective average > 1.0;
None of the companies have an 11-year average > 1.0.
The Adequacy Ratio clearly illustrates that these companies do not generate sufficient revenues from
operations to sustain their existing business models.
Negative Retained Earnings accounts on their Balance Sheets further reflects this reality but is beyond the
scope of today’s musing. We will visit this subject in detail in future missives.
In this musing, we’ve outlined current problems with the gold mining industry including reliable cost
reporting and lack of profitability over the past decade.
We have shown that serious fundamental problems are endemic within the industry and have provided
solutions to cost reporting and developed evaluation methods to analyze actual profitability over a
significant period of time.
We now propose a solution to the major gold mining companies’ lack of profitability over the past
decade.
Since 2003, the gold miners have tried to conduct business using a flawed model of annual revenue
growth driven by increasing production and replacing their reserve-resource bases. Despite much higher
gold prices for over a decade, declining production, static to dwindling reserves and resources, negative
earnings, and massive write-offs have proven this business model to be an abject failure.
As we have shown, producing more and more ounces at low and lower margins cannot generate sufficient
cash flow to meet the real costs of mining gold.
Mining is a value industry. It is not and it has never been a growth industry.
In order to reach sustainable profitability, gold miners must adopt a core philosophy of producing only
those ounces that return robust cost margins and cease trying to grow production and reserves in order to
placate analysts and investors for the next earnings statement.
Given this new paradigm, gold production would increase when gold prices are higher and decrease when
gold prices are lower. In that scenario and no matter where we are in the commodity price cycle,
companies would remain profitable throughout.
Gold miners must focus on quality of ounces verses quantity of ounces produced.
In our opinion, the gold mining industry must adopt this new business model of high margin returns in
order to reward current shareholders and attract new investors to the sector.
Please note that I will be doing a series of short videos with the principals of Cipher Research to present
their research and analysis on the gold exploration and mining sector and The Real Cost of Mining
Gold, coming soon.
Ciao for now,
Mickey Fulp
Mercenary Geologist
Acknowledgments: I thank Rod Husband and Elena Tanzola of Cipher Research Ltd, Vancouver, B.C.
for confidential access to a white paper that forms the basis of this musing and permission to publish. For
additional information on Cipher’s research and analytical services to the commodity and financial
investment markets, please contact [email protected].
My appreciation also goes to an unnamed British Colombia Chartered Accountant for his vetting of the
methodology applied herein and clarification of some concepts of capital depreciation.
Gwen Preston is the editor of MercenaryGeologist.com.
The Mercenary Geologist Michael S. “Mickey” Fulp is a Certified Professional Geologist with a
B.Sc. Earth Sciences with honor from the University of Tulsa, and M.Sc. Geology from the University of

New Mexico. Mickey has 35 years experience as an exploration geologist and analyst searching for
economic deposits of base and precious metals, industrial minerals, uranium, coal, oil and gas, and water
in North and South America, Europe, and Asia.
Mickey worked for junior explorers, major mining companies, private companies, and investors as a
consulting economic geologist for over 20 years, specializing in geological mapping, property evaluation,
and business development. In addition to Mickey’s professional credentials and experience, he is high-
altitude proficient, and is bilingual in English and Spanish. From 2003 to 2006, he made four outcrop ore
discoveries in Peru, Nevada, Chile, and British Columbia.
Mickey is well-known and highly respected throughout the mining and exploration community due to his
ongoing work as an analyst, writer, and speaker.
Contact: [email protected]
Disclaimer and Notice: I am not a certified financial analyst, broker, or professional qualified to offer
investment advice. Nothing in any report, commentary, this website, interview, and other content
constitutes or can be construed as investment advice or an offer or solicitation or advice to buy or sell
stock or any asset or investment. All of my presentations should be considered an opinion and my
opinions may be based upon information obtained from research of public documents and content
available on the company’s website, regulatory filings, various stock exchange websites, and stock
information services, through discussions with company representatives, agents, other professionals and
investors, and field visits. My opinions are based upon information believed to be accurate and reliable,
but my opinions are not guaranteed or implied to be so. The opinions presented may not be complete or
correct; all information is provided without any legal responsibility or obligation to provide future
updates. I accept no responsibility and no liability, whatsoever, for any direct, indirect, special, punitive,
or consequential damages or loss arising from the use of my opinions or information. The information
contained in a report, commentary, this website, interview, and other content is subject to change without
notice, may become outdated, and may not be updated. A report, commentary, this website, interview,
and other content reflect my personal opinions and views and nothing more. All content of this website is
subject to international copyright protection and no part or portion of this website, report, commentary,
interview, and other content may be altered, reproduced, copied, emailed, faxed, or distributed in any
form without the express written consent of Michael S. (Mickey) Fulp, MercenaryGeologist.com LLC.
Copyright © 2015 Mercenary Geologist.com, LLC. All Rights Reserved.