Embed Size (px)
Citation preview
HAL Id: inria-00471432https://hal.inria.fr/inria-00471432
Submitted on 6 Aug 2010
HAL is a multi-disciplinary open accessarchive for the deposit and dissemination of sci-entific research documents, whether they are pub-lished or not. The documents may come fromteaching and research institutions in France orabroad, or from public or private research centers.
L’archive ouverte pluridisciplinaire HAL, estdestinée au dépôt et à la diffusion de documentsscientifiques de niveau recherche, publiés ou non,émanant des établissements d’enseignement et derecherche français ou étrangers, des laboratoirespublics ou privés.
The readability of Path-Preserving Clusterings ofGraphs
Daniel Archambault, Helen Purchase, Bruno Pinaud
To cite this version:Daniel Archambault, Helen Purchase, Bruno Pinaud. The readability of Path-Preserving Clusteringsof Graphs. Eurovis 2010, 12th annual Eurographics/IEEE Symposium on Visualization, Jun 2010,Bordeaux, France. pp.1173-1182, �10.1111/j.1467-8659.2009.01683.x�. �inria-00471432�
Eurographics/ IEEE-VGTC Symposium on Visualization 2010G. Melançon, T. Munzner, and D. Weiskopf(Guest Editors)
Volume 29 (2010), Number 3
The Readability of Path-Preserving Clusterings of Graphs
Daniel Archambault1,4, Helen C. Purchase2, and Bruno Pinaud1,3
1INRIA Bordeaux Sud-Ouest, France2University of Glasgow, United Kingdom
3CNRS UMR 5800 LaBRI Université de Bordeaux I, France4University College Dublin, Clique Research Cluster, Ireland
Abstract
Graph visualization systems often exploit opaque metanodes to reduce visual clutter and improve the readability
of large graphs. This filtering can be done in a path-preserving way based on attribute values associated with the
nodes of the graph. Despite the extensive use these representations, as far as we know, no formal experimentation
exists to evaluate if they improve the readability of graphs.
In this paper, we present the results of a user study that formally evaluates how such representations affect the
readability of graphs. We also explore the effect of graph size and connectivity in terms of this primary research
question. Overall, for our tasks, we did not find a significant difference when this clustering is used. However, if
the graph is highly connected, these clusterings can improve performance. Also, if the graph is large enough and
can be simplified into a few metanodes, benefits in performance on global tasks are realized. Under these same
conditions, however, performance of local attribute tasks may be reduced.
Categories and Subject Descriptors (according to ACM CCS): H.1.2 [Information Systems]: User/MachineSystems—Human Factors; G.2.2 [Discrete Mathematics]: Graph Theory—Graph Algorithms
1. Introduction
Many visualization systems have exploited metanodes toimprove the readability of graphs. Each metanode placesa subset of the nodes and edges inside an opaque node,hiding these details. Edges connecting two metanodes aremetaedges. Metanodes can be constructed in a path-
preserving [AMA08] manner which ensures that if a pathis visible in the metanode representation, it actually exists inthe underlying graph. In this paper, a path-preserving clus-
tering (PPC) is a flat clustering with opaque metanodes thathide graph details but reflect underlying graph connectivity.
Often, attributes are associated with the nodes or edges ofthe graph and are used to construct metanodes. In this exper-iment, attributes are extrinsic information associated withthe nodes of the graph that has no explicit relationship tothe graph structure. As an example, in a computer network,servers can have a name attribute, but this name does notnecessarily have a relationship to network topology.
Questions where such clusterings may help are common.In a computer networking scenario [CBB00], tasks often in-
volve both attributes and graph topology. Outlying paths toexternal machines can indicate security leaks in a network.Understanding the connectivity between servers before andduring an attack on Internet infrastructure can help a varietyof investigators. Also, the central core of ISPs near the centreof a large network is important for administrators.
Graph visualization systems often recursively place sub-graphs into metanodes, forming a cluster tree or graph hi-
erarchy. Some of this work exploits a pre-existing draw-ing [EF96, SZG∗96, GKN05, vHvW04] while others drawthe graph as the user explores the data [EH00, AvHK06,DGDGL07, AMA08]. Many of these systems use at-tributes [PVP01,Wat06,AMA08]. In our experiment, a PPCcorresponds to a two-level, path-preserving graph hierarchywhere node attribute values define metanodes. Thus, our ex-periment, in part, validates many of these representations.
In this paper, we present a formal user study with the pri-mary research question:
• When do PPCs improve the readability of graphs with at-tribute values associated with the nodes?
c© 2010 The Author(s)Journal compilation c© 2010 The Eurographics Association and Blackwell Publishing Ltd.Published by Blackwell Publishing, 9600 Garsington Road, Oxford OX4 2DQ, UK and350 Main Street, Malden, MA 02148, USA.
D. Archambault, H. C. Purchase, & B. Pinaud / The Readability of Path-Preserving Clusterings of Graphs
In addition, we ask the secondary research questions:
• How does the size of the graph affect these results?• How does graph connectivity affect these results?
Overall, we did not find a significant difference whenPPCs constructed using node attributes were used. However,if the graph is highly connected, PPCs can improve perfor-mance. Also, if the graph is large enough and can be simpli-fied into a few metanodes, benefits in performance on globaltasks are realized. Under these same conditions, however,local attribute tasks may have reduced performance.
2. Related Work
In this work, we test PPCs constructed using node attributevalues. As such, we divide related work into two sections.Section 2.1 presents related areas of graph hierarchy visual-ization. Section 2.2 presents experiments that have examinedgraph readability.
2.1. Graph Hierarchy Visualization
A number of techniques have been proposed to visualize agraph and a superimposed hierarchy. These methods groupsubgraphs recursively into metanodes, forming a hierarchyof coarse graphs. Such techniques can be used to visualize agraph where the nodes have attribute values if nodes of thesame value are placed inside the same metanode.
A number of techniques have been proposed includ-ing: extruding the graph hierarchy into the third dimen-sion [EF96], multi-focal fisheye views where metanodesare expanded and viewed in the context of the entiregraph [SZG∗96], topological fisheye views where abstractversions of the graph are presented at increasing distancesfrom the focus centre [GKN05], and interactively visualiz-ing hierarchies of small world clusterings [vHvW04]. Thesesystems typically draw the entire graph beforehand and ex-ploit this layout to construct a suitable hierarchy. Steer-able techniques draw portions of the graph hierarchy ondemand as the user explores the graph, and a number ofthese approaches have also been suggested in the litera-ture [EH00, AvHK06, DGDGL07, AMA08].
In this experiment, we tested interfaces (like many ofthe above systems) that render the graph hierarchies usingopaque metanodes. However, we only test two-level hierar-chies and only allow the participant to click on a metanodeto reveal its details. This interaction is the most basic andgenerally supported in nearly all of the above described sys-tems.
2.2. Graphs Readability Experiments
Purchase [Pur97] examined how different graph drawingaesthetic criteria affected the readability of graphs. In this
experiment, the author showed that minimizing bends, mini-mizing edge crossings, and maximizing symmetry may af-fect user performance. The experiment provided evidencethat the number of edges that cross the shortest path in agraph drawing or the continuity of a path may also affect thereadability of a graph drawing.
A more recent series of experiments examined other fac-tors influencing graph readability [HEH08]. A first experi-ment found that users tended to prefer well separated clus-ters to delineate groups of nodes and that central nodes weremore important to the group than exterior ones [HHE06].Secondly, users tended to follow links that lead, in an Eu-clidean sense, from a source node towards a target nodewhen following a path [HEH09]. The work of van Ham andRogowitz [vHR08] suggested clusters sometimes were clar-ified by placing a few nodes of the cluster on the boundaryof a convex polygon. Although all of these works studiedthe influence of aesthetic criteria on graph readability, noneof them examined their effect in a PPC context, as we do inthis experiment. However, these results should be consideredwhen drawing all levels of the graph hierarchy.
Schaffer et al. [SZG∗96] studied the readability of a hi-erarchically clustered graph using either a fisheye or zoommethod for revealing details in clusters. The authors foundthat the fisheye method was significantly faster and requiredsignificantly less interaction. However, they did not find asignificant difference in terms of the number of errors madeby the participants. Although the experiment did use a graphhierarchy, it was focused on determining if the fisheye tech-nique influenced performance.
Wattenberg [Wat06] examined roll-up and selection oper-ations on graphs with node attributes. In his technique, thegraph is divided into groups of nodes based on attribute val-ues. Each group is aggregated into a single metanode andthe metanodes are laid out in a grid based on attribute value.Through several pilot studies, the author found evidence thatthe tool could help users spot patterns in attributed graphs.It should be noted however that the pilots were informal andthat the technique is not path-preserving.
3. The Experiment
To test whether depicting PPCs constructed using node at-tribute data help in reading graphs, we performed a withinsubjects experiment. We performed a 2 condition (Path-Preserving Clustering (PPC) vs. No Clustering (NC)) × 6data set × 4 question design. In order to create the six datasets, two large graphs were chosen, one with low connectiv-ity and the other with high connectivity. Small, medium, andlarge subsets of this data were taken.
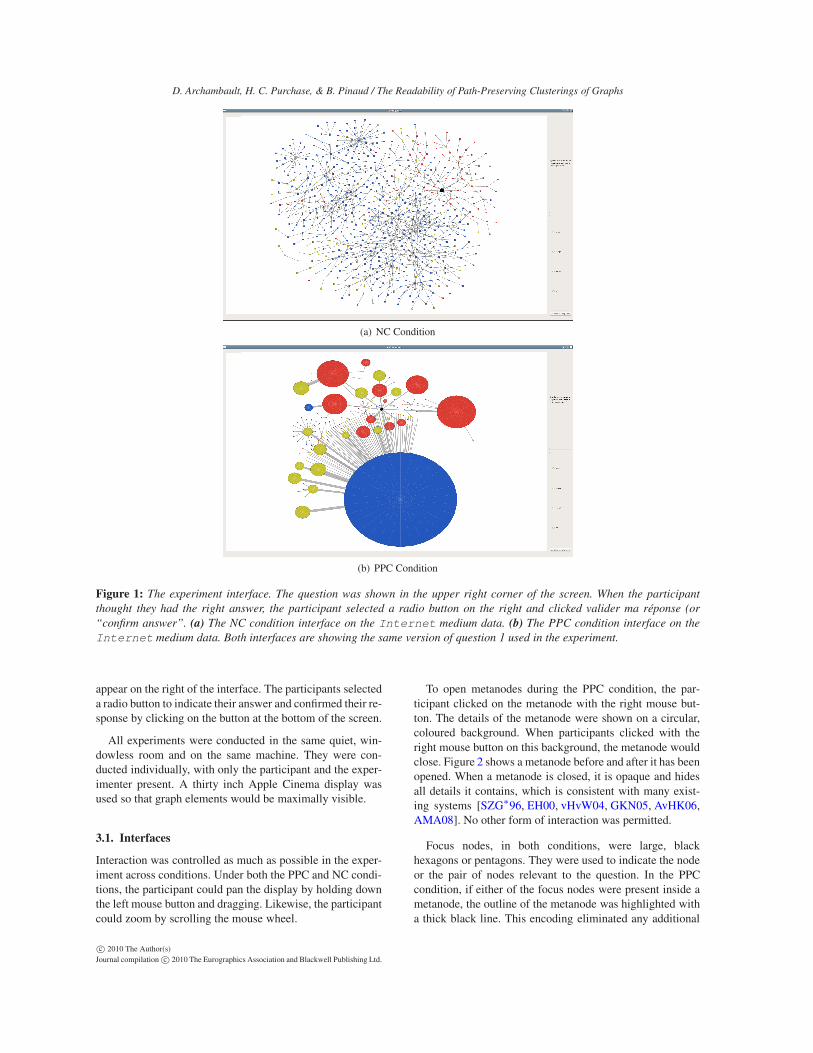
The experiment interface consisted of one of the condi-tions, either PPC or NC, and a question on the right side ofthe screen. The question and condition were visible for theduration of the task. As seen in Figure 1, four radio buttons
c© 2010 The Author(s)Journal compilation c© 2010 The Eurographics Association and Blackwell Publishing Ltd.
D. Archambault, H. C. Purchase, & B. Pinaud / The Readability of Path-Preserving Clusterings of Graphs
(a) NC Condition
(b) PPC Condition
Figure 1: The experiment interface. The question was shown in the upper right corner of the screen. When the participant
thought they had the right answer, the participant selected a radio button on the right and clicked valider ma réponse (or
“confirm answer”. (a) The NC condition interface on the Internet medium data. (b) The PPC condition interface on the
Internet medium data. Both interfaces are showing the same version of question 1 used in the experiment.
appear on the right of the interface. The participants selecteda radio button to indicate their answer and confirmed their re-sponse by clicking on the button at the bottom of the screen.
All experiments were conducted in the same quiet, win-dowless room and on the same machine. They were con-ducted individually, with only the participant and the exper-imenter present. A thirty inch Apple Cinema display wasused so that graph elements would be maximally visible.
3.1. Interfaces
Interaction was controlled as much as possible in the exper-iment across conditions. Under both the PPC and NC condi-tions, the participant could pan the display by holding downthe left mouse button and dragging. Likewise, the participantcould zoom by scrolling the mouse wheel.
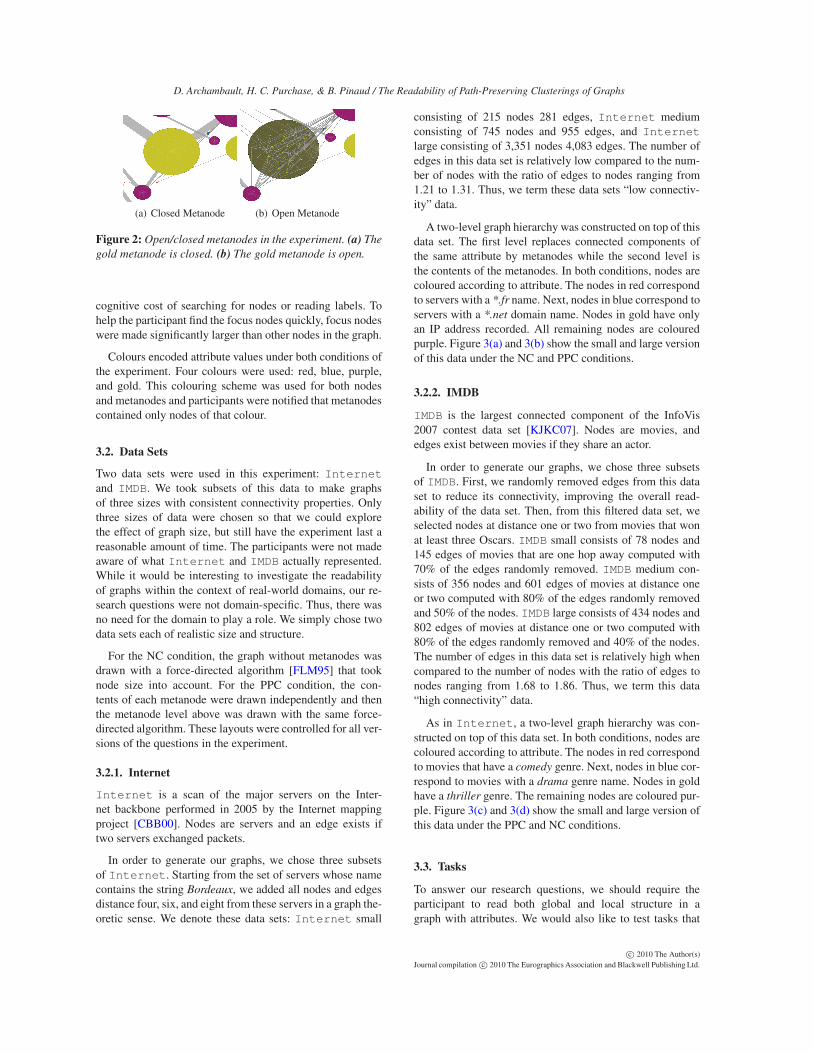
To open metanodes during the PPC condition, the par-ticipant clicked on the metanode with the right mouse but-ton. The details of the metanode were shown on a circular,coloured background. When participants clicked with theright mouse button on this background, the metanode wouldclose. Figure 2 shows a metanode before and after it has beenopened. When a metanode is closed, it is opaque and hidesall details it contains, which is consistent with many exist-ing systems [SZG∗96, EH00, vHvW04, GKN05, AvHK06,AMA08]. No other form of interaction was permitted.
Focus nodes, in both conditions, were large, blackhexagons or pentagons. They were used to indicate the nodeor the pair of nodes relevant to the question. In the PPCcondition, if either of the focus nodes were present inside ametanode, the outline of the metanode was highlighted witha thick black line. This encoding eliminated any additional
c© 2010 The Author(s)Journal compilation c© 2010 The Eurographics Association and Blackwell Publishing Ltd.
D. Archambault, H. C. Purchase, & B. Pinaud / The Readability of Path-Preserving Clusterings of Graphs
(a) Closed Metanode (b) Open Metanode
Figure 2: Open/closed metanodes in the experiment. (a) The
gold metanode is closed. (b) The gold metanode is open.
cognitive cost of searching for nodes or reading labels. Tohelp the participant find the focus nodes quickly, focus nodeswere made significantly larger than other nodes in the graph.
Colours encoded attribute values under both conditions ofthe experiment. Four colours were used: red, blue, purple,and gold. This colouring scheme was used for both nodesand metanodes and participants were notified that metanodescontained only nodes of that colour.
3.2. Data Sets
Two data sets were used in this experiment: Internetand IMDB. We took subsets of this data to make graphsof three sizes with consistent connectivity properties. Onlythree sizes of data were chosen so that we could explorethe effect of graph size, but still have the experiment last areasonable amount of time. The participants were not madeaware of what Internet and IMDB actually represented.While it would be interesting to investigate the readabilityof graphs within the context of real-world domains, our re-search questions were not domain-specific. Thus, there wasno need for the domain to play a role. We simply chose twodata sets each of realistic size and structure.
For the NC condition, the graph without metanodes wasdrawn with a force-directed algorithm [FLM95] that tooknode size into account. For the PPC condition, the con-tents of each metanode were drawn independently and thenthe metanode level above was drawn with the same force-directed algorithm. These layouts were controlled for all ver-sions of the questions in the experiment.
3.2.1. Internet
Internet is a scan of the major servers on the Inter-net backbone performed in 2005 by the Internet mappingproject [CBB00]. Nodes are servers and an edge exists iftwo servers exchanged packets.
In order to generate our graphs, we chose three subsetsof Internet. Starting from the set of servers whose namecontains the string Bordeaux, we added all nodes and edgesdistance four, six, and eight from these servers in a graph the-oretic sense. We denote these data sets: Internet small
consisting of 215 nodes 281 edges, Internet mediumconsisting of 745 nodes and 955 edges, and Internet
large consisting of 3,351 nodes 4,083 edges. The number ofedges in this data set is relatively low compared to the num-ber of nodes with the ratio of edges to nodes ranging from1.21 to 1.31. Thus, we term these data sets “low connectiv-ity” data.
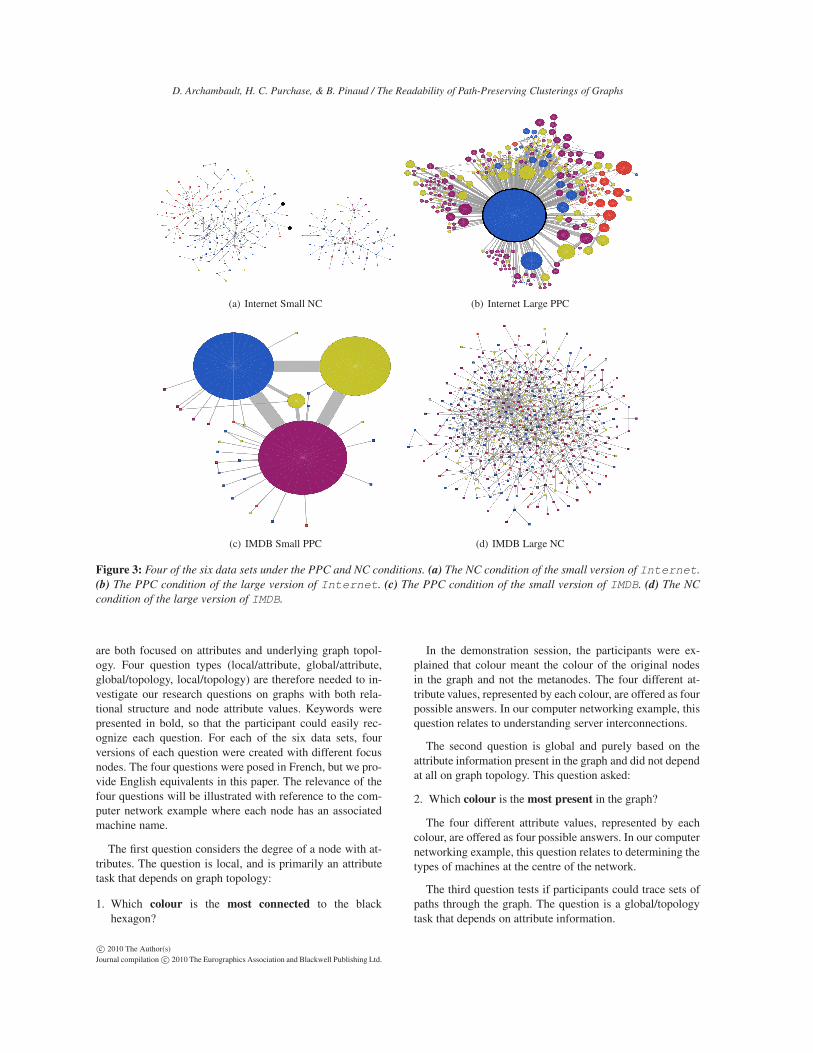
A two-level graph hierarchy was constructed on top of thisdata set. The first level replaces connected components ofthe same attribute by metanodes while the second level isthe contents of the metanodes. In both conditions, nodes arecoloured according to attribute. The nodes in red correspondto servers with a *.fr name. Next, nodes in blue correspond toservers with a *.net domain name. Nodes in gold have onlyan IP address recorded. All remaining nodes are colouredpurple. Figure 3(a) and 3(b) show the small and large versionof this data under the NC and PPC conditions.
3.2.2. IMDB
IMDB is the largest connected component of the InfoVis2007 contest data set [KJKC07]. Nodes are movies, andedges exist between movies if they share an actor.
In order to generate our graphs, we chose three subsetsof IMDB. First, we randomly removed edges from this dataset to reduce its connectivity, improving the overall read-ability of the data set. Then, from this filtered data set, weselected nodes at distance one or two from movies that wonat least three Oscars. IMDB small consists of 78 nodes and145 edges of movies that are one hop away computed with70% of the edges randomly removed. IMDB medium con-sists of 356 nodes and 601 edges of movies at distance oneor two computed with 80% of the edges randomly removedand 50% of the nodes. IMDB large consists of 434 nodes and802 edges of movies at distance one or two computed with80% of the edges randomly removed and 40% of the nodes.The number of edges in this data set is relatively high whencompared to the number of nodes with the ratio of edges tonodes ranging from 1.68 to 1.86. Thus, we term this data“high connectivity” data.
As in Internet, a two-level graph hierarchy was con-structed on top of this data set. In both conditions, nodes arecoloured according to attribute. The nodes in red correspondto movies that have a comedy genre. Next, nodes in blue cor-respond to movies with a drama genre name. Nodes in goldhave a thriller genre. The remaining nodes are coloured pur-ple. Figure 3(c) and 3(d) show the small and large version ofthis data under the PPC and NC conditions.
3.3. Tasks
To answer our research questions, we should require theparticipant to read both global and local structure in agraph with attributes. We would also like to test tasks that
c© 2010 The Author(s)Journal compilation c© 2010 The Eurographics Association and Blackwell Publishing Ltd.
D. Archambault, H. C. Purchase, & B. Pinaud / The Readability of Path-Preserving Clusterings of Graphs
(a) Internet Small NC (b) Internet Large PPC
(c) IMDB Small PPC (d) IMDB Large NC
Figure 3: Four of the six data sets under the PPC and NC conditions. (a) The NC condition of the small version of Internet.
(b) The PPC condition of the large version of Internet. (c) The PPC condition of the small version of IMDB. (d) The NC
condition of the large version of IMDB.
are both focused on attributes and underlying graph topol-ogy. Four question types (local/attribute, global/attribute,global/topology, local/topology) are therefore needed to in-vestigate our research questions on graphs with both rela-tional structure and node attribute values. Keywords werepresented in bold, so that the participant could easily rec-ognize each question. For each of the six data sets, fourversions of each question were created with different focusnodes. The four questions were posed in French, but we pro-vide English equivalents in this paper. The relevance of thefour questions will be illustrated with reference to the com-puter network example where each node has an associatedmachine name.
The first question considers the degree of a node with at-tributes. The question is local, and is primarily an attributetask that depends on graph topology:
1. Which colour is the most connected to the blackhexagon?
In the demonstration session, the participants were ex-plained that colour meant the colour of the original nodesin the graph and not the metanodes. The four different at-tribute values, represented by each colour, are offered as fourpossible answers. In our computer networking example, thisquestion relates to understanding server interconnections.
The second question is global and purely based on theattribute information present in the graph and did not dependat all on graph topology. This question asked:
2. Which colour is the most present in the graph?
The four different attribute values, represented by eachcolour, are offered as four possible answers. In our computernetworking example, this question relates to determining thetypes of machines at the centre of the network.
The third question tests if participants could trace sets ofpaths through the graph. The question is a global/topologytask that depends on attribute information.
c© 2010 The Author(s)Journal compilation c© 2010 The Eurographics Association and Blackwell Publishing Ltd.
D. Archambault, H. C. Purchase, & B. Pinaud / The Readability of Path-Preserving Clusterings of Graphs
3. Which of the following paths is a valid path from thehexagon to the pentagon?
Four sequences of colours are offered as possible answers.The maximum length of a sequence used in the experimentis four. Only one sequence exists as a valid sequence ofcolours from the hexagon to the pentagon. If a sequencecontains multiple nodes of the same colour in a row, forexample red-red-red-blue-blue-red, the multiple instances ofthe same colour were collapsed down to a single instance inthe answers, red-blue-red. Participants were notified of thisproperty at the beginning of the experiment. This questiontests the readability of path-preserving decompositions. Inour computer networking example, this question may helpin finding outlying paths to strange machines in the network.
The final question tests if small cycles of three to fivenodes are readable around a node. The question is local andfocuses on topology but depends on attribute information.
4. Which is a valid cycle that contains the hexagon?
As above, four sequences of colours are offered as possi-ble answers. The maximum length of a sequence used in theexperiment is four. Only one sequence is a valid cycle thatcontains the hexagon. If a sequence contains multiple nodesof the same colour in a row, they were collapsed down to asingle instance in the answers, and participants were madeaware of this property. This question tests the readability ofpath-preserving decompositions. In our computer network-ing example, this question has similar motivations to ques-tion 3, but is more local in nature.
We posed multiple choice questions based on the focusnodes, rather than asking the participants to interact with thegraphs on the screen. Multiple choice questions were prefer-able to participant interaction because questions one and twodid not require identifying specific nodes. Also, questionsthree and four would require clicking on a fewer number ofnodes in the PPC condition, introducing a bias against theNC condition.
3.4. Experimental Design
Before each condition, the interface was demonstrated to theparticipant. These demonstrations allowed the participants toask questions, to find out about the experimental tasks, andto see how the answers could be found. The experimentalprocedure required answering all questions under one condi-tion first followed by all those in the other condition. There-fore, any cognitive shift required to move from one interfaceto another was incurred only once. We counterbalanced be-tween participants by presenting the NC condition first toeven-numbered participants and the PPC condition first toodd-numbered participants. At the end of the experiment,participants were asked to complete a short survey in orderto compile preference data.
There were twenty-four experimental tasks for each con-dition: 6 data sets and 4 questions with no time limit imposed
on the tasks. For each participant, this sequence of twenty-four questions was randomized differently for each condi-tion in order to counter the learning effect. Each set of ques-tions was prefixed with a set of six practice questions. Thesesix questions presented each data set once and each questionat least once to the participant. Participants were not madeaware that these practice questions did not form part of theexperiment. Therefore, thirty questions were answered percondition, giving a total of sixty questions.
We had four versions of questions 1, 3, and 4 on eachdata set at our disposal. As each question on each data setis asked at most twice under one condition, once as a prac-tice question and once during the experiment, we ensuredthat the same version of the question was never asked twiceto the same participant. Versions were randomized so thatsometimes a particular version of a question was a practicequestion and sometimes it was used as experimental data.Question 2 was asked as a practice question and as data forone random data set under each condition.
Both conditions were rendered using the Tulip frame-work [Aub03]. For all four questions, participants respondedby selecting a radio button with the correct answer and com-mitted their answer with a push button at the bottom of theinterface. The radio buttons were labeled with answers asdescribed in section 3.3. Participants typically completed theexperiment between sixty and ninety minutes. Twenty-eightsubjects (21 male, 7 female) participated in the experiment.
4. Results
Our pilot experiments suggested that the size of the graphwas an important factor, and that very large graphs wouldproduce a ceiling effect in the data: in very large graphs, thetasks would be so difficult that few participants would getany of the tasks right, and there would be no variation inthe data. We subsequently reduced the size of the mediumand large data sets of IMDB to the sizes presented in thispaper, because of the difficulty that our pilot subjects hadwith the experiment. We were certain that graph size wouldhave an effect on performance but were not sure to what de-gree. Also, graph connectivity could possibly influence ourresults, but again, we were uncertain to what degree.
Our analysis was performed in three stages. In the firststage, we consider the effect of our conditions, NC and PPC,on an overall and a per question basis. Section 4.1 presentsthese results. Subsequently, we examined the effects of sizeand graph connectivity on an overall and, sometimes, on aper-question basis. Sections 4.2 and 4.3 present these results.
A non-parametric, repeated-measures, exact Wilcoxonsigned rank test was chosen for our analysis because the datacollected was not normally distributed, and we were alwayscomparing only two conditions (NC vs PPC). A standardsignificance level of α = 0.05 was used to determine statisti-cal significance between conditions. When splitting the data
c© 2010 The Author(s)Journal compilation c© 2010 The Eurographics Association and Blackwell Publishing Ltd.
D. Archambault, H. C. Purchase, & B. Pinaud / The Readability of Path-Preserving Clusterings of Graphs
Overall Q1 Q2 Q3 Q4
NC PPC
020
4060
8010
0
41−37 42−41NC PPC
020
4060
8010
0
25−22 29−26NC PPC
020
4060
8010
0
15−14 20−19NC PPC
020
4060
8010
0
72−63 69−68NC PPC
020
4060
8010
0
51−42 50−47
Mean response time (sec.)
NC PPC0.0
0.2
0.4
0.6
0.8
1.0
0.19−0.21 0.15−0.12NC PPC0.
00.
20.
40.
60.
81.
0
0.15−0.17 0.17−0.17NC PPC0.
00.
20.
40.
60.
81.
0
0.21−0.17 0.11−0.083NC PPC0.
00.
20.
40.
60.
81.
0
0.25−0.17 0.23−0.17NC PPC0.
00.
20.
40.
60.
81.
0
0.16−0.17 0.1−0
Mean error rate
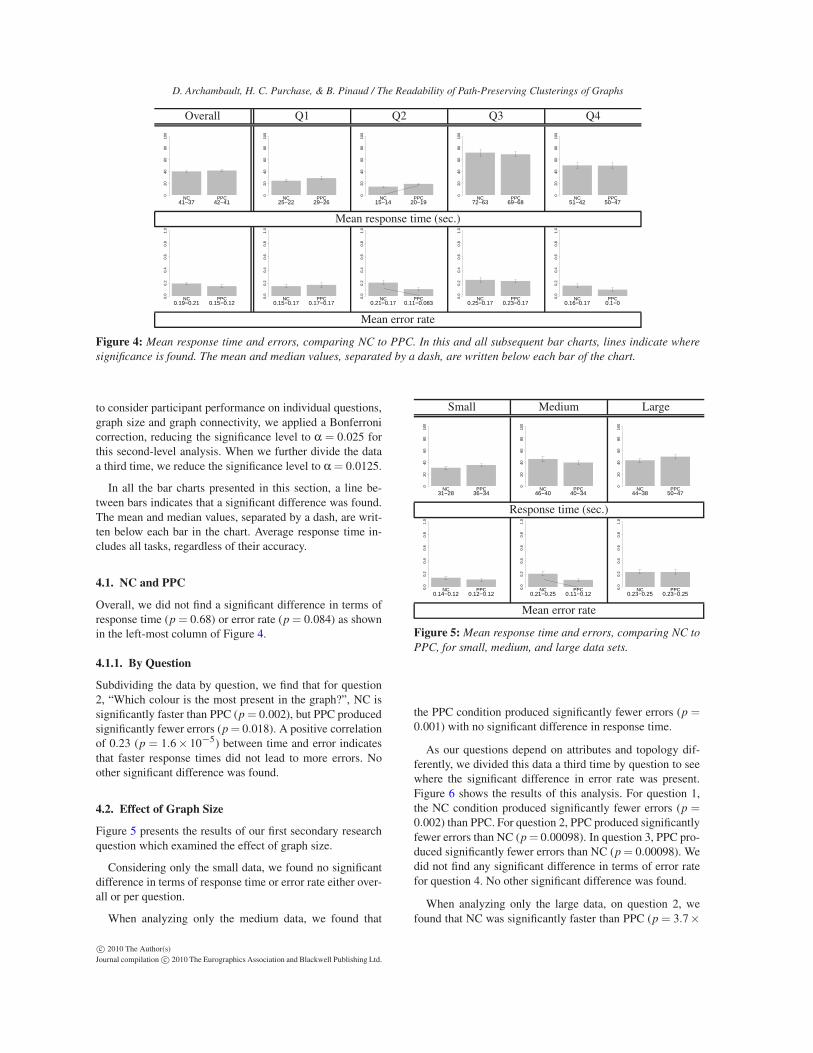
Figure 4: Mean response time and errors, comparing NC to PPC. In this and all subsequent bar charts, lines indicate where
significance is found. The mean and median values, separated by a dash, are written below each bar of the chart.
to consider participant performance on individual questions,graph size and graph connectivity, we applied a Bonferronicorrection, reducing the significance level to α = 0.025 forthis second-level analysis. When we further divide the dataa third time, we reduce the significance level to α = 0.0125.
In all the bar charts presented in this section, a line be-tween bars indicates that a significant difference was found.The mean and median values, separated by a dash, are writ-ten below each bar in the chart. Average response time in-cludes all tasks, regardless of their accuracy.
4.1. NC and PPC
Overall, we did not find a significant difference in terms ofresponse time (p = 0.68) or error rate (p = 0.084) as shownin the left-most column of Figure 4.
4.1.1. By Question
Subdividing the data by question, we find that for question2, “Which colour is the most present in the graph?”, NC issignificantly faster than PPC (p = 0.002), but PPC producedsignificantly fewer errors (p = 0.018). A positive correlationof 0.23 (p = 1.6× 10⁻⁵) between time and error indicatesthat faster response times did not lead to more errors. Noother significant difference was found.
4.2. Effect of Graph Size
Figure 5 presents the results of our first secondary researchquestion which examined the effect of graph size.
Considering only the small data, we found no significantdifference in terms of response time or error rate either over-all or per question.
When analyzing only the medium data, we found that
Small Medium Large
NC PPC
020
4060
8010
0
31−28 36−34NC PPC
020
4060
8010
0
46−40 40−34NC PPC
020
4060
8010
0
44−38 50−47
Response time (sec.)
NC PPC0.0
0.2
0.4
0.6
0.8
1.0
0.14−0.12 0.12−0.12NC PPC0.
00.
20.
40.
60.
81.
0
0.21−0.25 0.11−0.12NC PPC0.
00.
20.
40.
60.
81.
0
0.23−0.25 0.23−0.25
Mean error rate
Figure 5: Mean response time and errors, comparing NC to
PPC, for small, medium, and large data sets.
the PPC condition produced significantly fewer errors (p =
0.001) with no significant difference in response time.
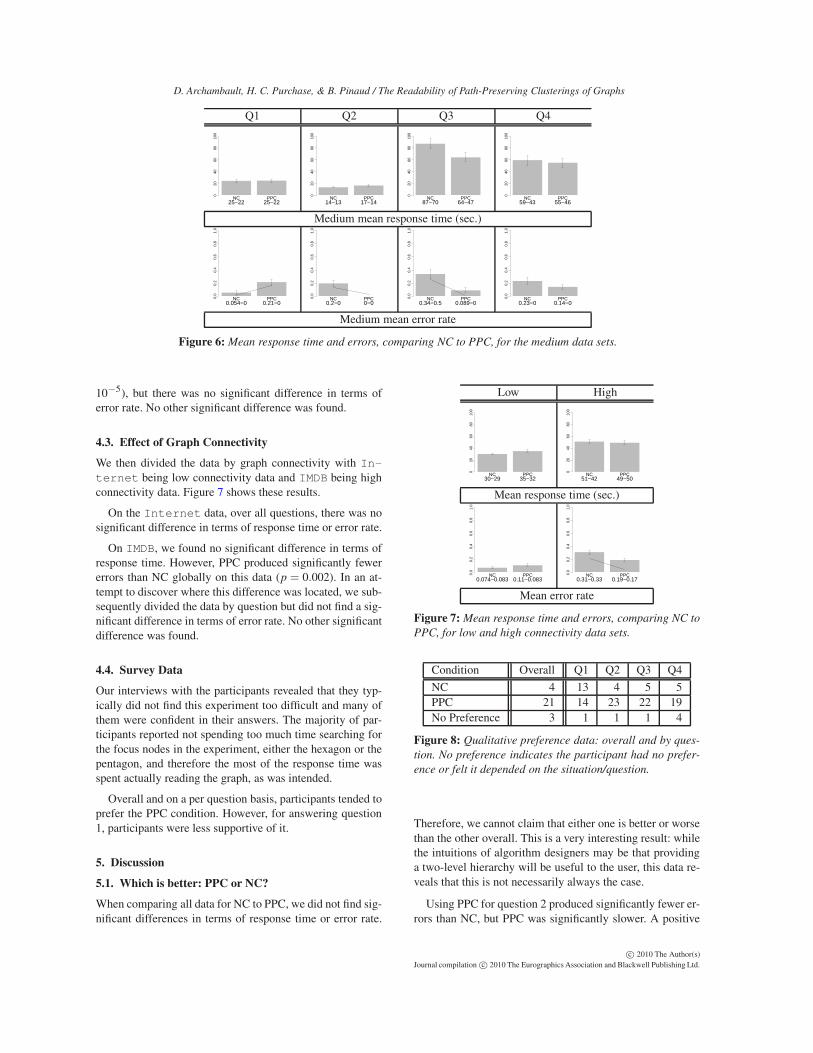
As our questions depend on attributes and topology dif-ferently, we divided this data a third time by question to seewhere the significant difference in error rate was present.Figure 6 shows the results of this analysis. For question 1,the NC condition produced significantly fewer errors (p =
0.002) than PPC. For question 2, PPC produced significantlyfewer errors than NC (p = 0.00098). In question 3, PPC pro-duced significantly fewer errors than NC (p = 0.00098). Wedid not find any significant difference in terms of error ratefor question 4. No other significant difference was found.
When analyzing only the large data, on question 2, wefound that NC was significantly faster than PPC (p = 3.7×
c© 2010 The Author(s)Journal compilation c© 2010 The Eurographics Association and Blackwell Publishing Ltd.
D. Archambault, H. C. Purchase, & B. Pinaud / The Readability of Path-Preserving Clusterings of Graphs
Q1 Q2 Q3 Q4
NC PPC
020
4060
8010
0
25−22 25−22NC PPC
020
4060
8010
0
14−13 17−14NC PPC
020
4060
8010
0
87−70 64−47NC PPC
020
4060
8010
0
59−43 55−46
Medium mean response time (sec.)
NC PPC0.0
0.2
0.4
0.6
0.8
1.0
0.054−0 0.21−0NC PPC0.
00.
20.
40.
60.
81.
0
0.2−0 0−0NC PPC0.
00.
20.
40.
60.
81.
0
0.34−0.5 0.089−0NC PPC0.
00.
20.
40.
60.
81.
0
0.23−0 0.14−0
Medium mean error rate
Figure 6: Mean response time and errors, comparing NC to PPC, for the medium data sets.
10−5), but there was no significant difference in terms oferror rate. No other significant difference was found.
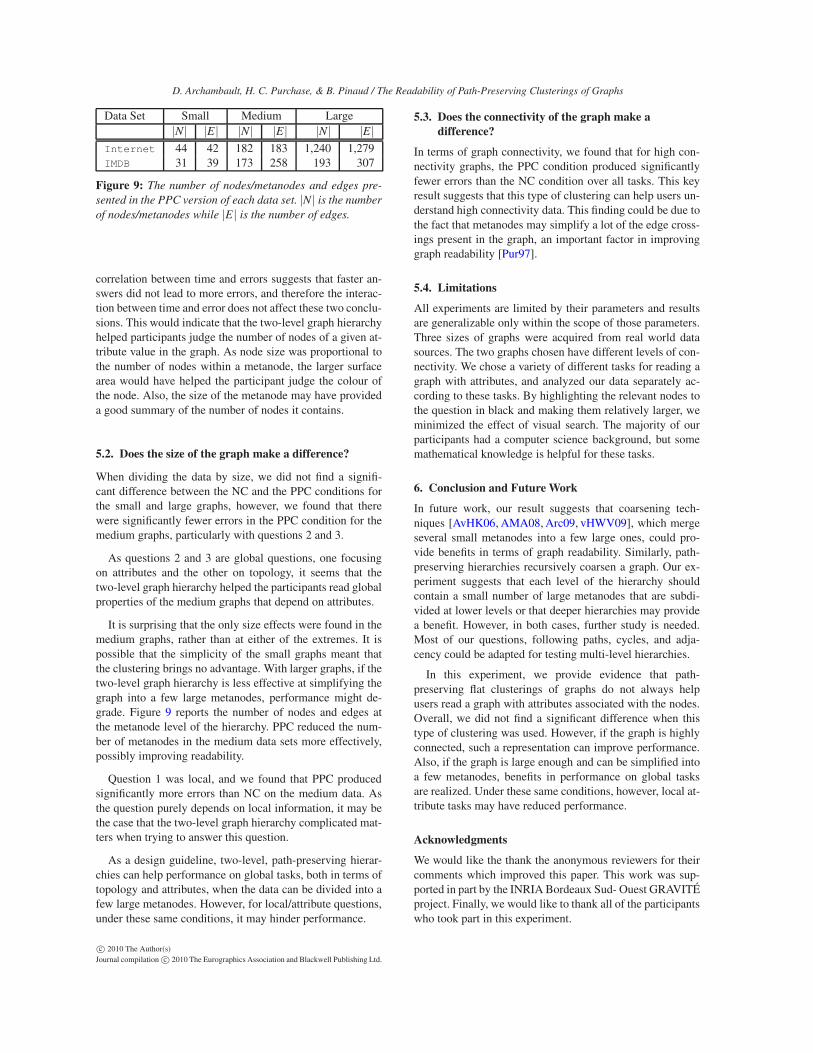
4.3. Effect of Graph Connectivity
We then divided the data by graph connectivity with In-
ternet being low connectivity data and IMDB being highconnectivity data. Figure 7 shows these results.
On the Internet data, over all questions, there was nosignificant difference in terms of response time or error rate.
On IMDB, we found no significant difference in terms ofresponse time. However, PPC produced significantly fewererrors than NC globally on this data (p = 0.002). In an at-tempt to discover where this difference was located, we sub-sequently divided the data by question but did not find a sig-nificant difference in terms of error rate. No other significantdifference was found.
4.4. Survey Data
Our interviews with the participants revealed that they typ-ically did not find this experiment too difficult and many ofthem were confident in their answers. The majority of par-ticipants reported not spending too much time searching forthe focus nodes in the experiment, either the hexagon or thepentagon, and therefore the most of the response time wasspent actually reading the graph, as was intended.
Overall and on a per question basis, participants tended toprefer the PPC condition. However, for answering question1, participants were less supportive of it.
5. Discussion
5.1. Which is better: PPC or NC?
When comparing all data for NC to PPC, we did not find sig-nificant differences in terms of response time or error rate.
Low High
NC PPC0
2040
6080
100
30−29 35−32NC PPC
020
4060
8010
0
51−42 49−50
Mean response time (sec.)
NC PPC0.0
0.2
0.4
0.6
0.8
1.0
0.074−0.083 0.11−0.083NC PPC0.
00.
20.
40.
60.
81.
0
0.31−0.33 0.19−0.17
Mean error rate
Figure 7: Mean response time and errors, comparing NC to
PPC, for low and high connectivity data sets.
Condition Overall Q1 Q2 Q3 Q4
NC 4 13 4 5 5PPC 21 14 23 22 19No Preference 3 1 1 1 4
Figure 8: Qualitative preference data: overall and by ques-
tion. No preference indicates the participant had no prefer-
ence or felt it depended on the situation/question.
Therefore, we cannot claim that either one is better or worsethan the other overall. This is a very interesting result: whilethe intuitions of algorithm designers may be that providinga two-level hierarchy will be useful to the user, this data re-veals that this is not necessarily always the case.
Using PPC for question 2 produced significantly fewer er-rors than NC, but PPC was significantly slower. A positive
c© 2010 The Author(s)Journal compilation c© 2010 The Eurographics Association and Blackwell Publishing Ltd.
D. Archambault, H. C. Purchase, & B. Pinaud / The Readability of Path-Preserving Clusterings of Graphs
Data Set Small Medium Large|N| |E| |N| |E| |N| |E|
Internet 44 42 182 183 1,240 1,279IMDB 31 39 173 258 193 307
Figure 9: The number of nodes/metanodes and edges pre-
sented in the PPC version of each data set. |N| is the number
of nodes/metanodes while |E| is the number of edges.
correlation between time and errors suggests that faster an-swers did not lead to more errors, and therefore the interac-tion between time and error does not affect these two conclu-sions. This would indicate that the two-level graph hierarchyhelped participants judge the number of nodes of a given at-tribute value in the graph. As node size was proportional tothe number of nodes within a metanode, the larger surfacearea would have helped the participant judge the colour ofthe node. Also, the size of the metanode may have provideda good summary of the number of nodes it contains.
5.2. Does the size of the graph make a difference?
When dividing the data by size, we did not find a signifi-cant difference between the NC and the PPC conditions forthe small and large graphs, however, we found that therewere significantly fewer errors in the PPC condition for themedium graphs, particularly with questions 2 and 3.
As questions 2 and 3 are global questions, one focusingon attributes and the other on topology, it seems that thetwo-level graph hierarchy helped the participants read globalproperties of the medium graphs that depend on attributes.
It is surprising that the only size effects were found in themedium graphs, rather than at either of the extremes. It ispossible that the simplicity of the small graphs meant thatthe clustering brings no advantage. With larger graphs, if thetwo-level graph hierarchy is less effective at simplifying thegraph into a few large metanodes, performance might de-grade. Figure 9 reports the number of nodes and edges atthe metanode level of the hierarchy. PPC reduced the num-ber of metanodes in the medium data sets more effectively,possibly improving readability.
Question 1 was local, and we found that PPC producedsignificantly more errors than NC on the medium data. Asthe question purely depends on local information, it may bethe case that the two-level graph hierarchy complicated mat-ters when trying to answer this question.
As a design guideline, two-level, path-preserving hierar-chies can help performance on global tasks, both in terms oftopology and attributes, when the data can be divided into afew large metanodes. However, for local/attribute questions,under these same conditions, it may hinder performance.
5.3. Does the connectivity of the graph make a
difference?
In terms of graph connectivity, we found that for high con-nectivity graphs, the PPC condition produced significantlyfewer errors than the NC condition over all tasks. This keyresult suggests that this type of clustering can help users un-derstand high connectivity data. This finding could be due tothe fact that metanodes may simplify a lot of the edge cross-ings present in the graph, an important factor in improvinggraph readability [Pur97].
5.4. Limitations
All experiments are limited by their parameters and resultsare generalizable only within the scope of those parameters.Three sizes of graphs were acquired from real world datasources. The two graphs chosen have different levels of con-nectivity. We chose a variety of different tasks for reading agraph with attributes, and analyzed our data separately ac-cording to these tasks. By highlighting the relevant nodes tothe question in black and making them relatively larger, weminimized the effect of visual search. The majority of ourparticipants had a computer science background, but somemathematical knowledge is helpful for these tasks.
6. Conclusion and Future Work
In future work, our result suggests that coarsening tech-niques [AvHK06, AMA08, Arc09, vHWV09], which mergeseveral small metanodes into a few large ones, could pro-vide benefits in terms of graph readability. Similarly, path-preserving hierarchies recursively coarsen a graph. Our ex-periment suggests that each level of the hierarchy shouldcontain a small number of large metanodes that are subdi-vided at lower levels or that deeper hierarchies may providea benefit. However, in both cases, further study is needed.Most of our questions, following paths, cycles, and adja-cency could be adapted for testing multi-level hierarchies.
In this experiment, we provide evidence that path-preserving flat clusterings of graphs do not always helpusers read a graph with attributes associated with the nodes.Overall, we did not find a significant difference when thistype of clustering was used. However, if the graph is highlyconnected, such a representation can improve performance.Also, if the graph is large enough and can be simplified intoa few metanodes, benefits in performance on global tasksare realized. Under these same conditions, however, local at-tribute tasks may have reduced performance.
Acknowledgments
We would like the thank the anonymous reviewers for theircomments which improved this paper. This work was sup-ported in part by the INRIA Bordeaux Sud- Ouest GRAVITÉproject. Finally, we would like to thank all of the participantswho took part in this experiment.
c© 2010 The Author(s)Journal compilation c© 2010 The Eurographics Association and Blackwell Publishing Ltd.
D. Archambault, H. C. Purchase, & B. Pinaud / The Readability of Path-Preserving Clusterings of Graphs
References
[AMA08] ARCHAMBAULT D., MUNZNER T., AUBER D.:GrouseFlocks: Steerable exploration of graph hierarchy space.IEEE Trans. on Visualization and Computer Graphics 14, 4(2008), 900–913.
[Arc09] ARCHAMBAULT D.: Structural differences between twographs through hierarchies. In Proc. of Graphics Interface
(2009), pp. 87–94.
[Aub03] AUBER D.: Tulip : A huge graph visualization frame-work. In Graph Drawing Software, Mutzel P., Jünger M., (Eds.),Mathematics and Visualization. Springer-Verlag, 2003, pp. 105–126.
[AvHK06] ABELLO J., VAN HAM F., KRISHNAN N.: ASK-GraphView: A large scale graph visualization system. IEEE
Trans. on Visualization and Computer Graphics (Proc.Vis/InfoVis ’06) 12, 5 (2006), 669–676.
[CBB00] CHESWICK B., BURCH H., BRANIGAN S.: Map-ping and visualizing the Internet. In Proc. USENIX (2000).www.cheswick.com/ches/map.
[DGDGL07] DI GIACOMO E., DIDIMO W., GRILLI L., LIOTTA
G.: Graph visualization techniques for web clustering engines.IEEE Trans. on Visualization and Computer Graphics 13, 2(March/April 2007), 294–304.
[EF96] EADES P., FENG Q.: Multilevel visualization of clusteredgraphs. In Proc. Graph Drawing (GD’96) (1996), vol. 1190 ofLNCS, Springer-Verlag, pp. 101–112.
[EH00] EADES P., HUANG M. L.: Navigating clustered graphsusing force-directed methods. Journal of Graph Algorithms andApplications 4, 3 (2000), 157–181.
[FLM95] FRICK A., LUDWIG A., MEHLDAU H.: A fast adaptivelayout algorithm for undirected graphs. In Proc. Graph Drawing
(GD’94) (1995), vol. 894 of LNCS, pp. 388–403.
[GKN05] GANSNER E., KOREN Y., NORTH S.: Topological fish-eye views for visualizing large graphs. IEEE Trans. on Visualiza-
tion and Computer Graphics 11, 4 (2005), 457–468.
[HEH08] HUANG W., EADES P., HONG S.: Beyond time anderror: a cognitive approach to the evaluation of graph drawings.In BELIV ’08: Proc. of the 2008 conference on BEyond time and
errors (2008), pp. 1–8.
[HEH09] HUANG W., EADES P., HONG S.: A graph readingbehaviour: Geodesic-path tendency. In Proc. of the 2nd Pacific
Visualization Symposium (2009), pp. 137–144.
[HHE06] HUANG W., HONG S., EADES P.: How people read so-ciograms: a questionnaire study. In APVis ’06: Proc. of the 2006
Asia-Pacific Symposium on Information Visualisation (2006),pp. 199–206.
[KJKC07] KOSARA R., JANKUN-KELLY T. J.,CHLAN E. (Eds.):. IEEE InfoVis 2007 Con-test: InfoVis goes to the movies (2007).www.apl.jhu.edu/Misc/Visualization/index.html.
[Pur97] PURCHASE H. C.: Which aesthetic has the greatest effecton human understanding? In Proc. of the 5th International Symp.on Graph Drawing (1997), vol. 1353, Springer-Verlag, pp. 248–261.
[PVP01] PATTISON T., VERNIK R., PHILLIPS M.: Informa-tion visualization using composable layouts and visual sets. InProc. of the 2001 Asia-Pacific Symp. on Information Visualiza-tion (2001), pp. 1–10.
[SZG∗96] SCHAFFER D., ZUO Z., GREENBERG S., BARTRAM
L., DILL J., DUBS S., ROSEMAN M.: Navigating hierarchicallyclustered networks through fisheye and full-zoom methods. ACM
Trans. on Computer-Human Interaction (TOCHI) 3, 2 (1996),162–188.
[vHR08] VAN HAM F., ROGOWITZ B. E.: Perceptual organisa-tion in user-generated graph layouts. IEEE Trans. on Visualiza-tion and Computer Graphics (Proc. Vis/InfoVis ’08) 14, 6 (2008),1333–1339.
[vHvW04] VAN HAM F., VAN WIJK J.: Interactive visualizationof small world graphs. In Proc. IEEE Symp. on Information Vi-sualization (InfoVis’04) (2004), pp. 199–206.
[vHWV09] VAN HAM F., WATTENBERG M., VIEGAS F.: Map-ping text with phrase nets. IEEE Transactions on Visualization
and Computer Graphics 15, 6 (2009), 1169–1176.
[Wat06] WATTENBERG M.: Visual exploration of multivariategraphs. In Proc. of SIGCHI conference on Human Factors in
Computing Systems (2006), pp. 811–819.
c© 2010 The Author(s)Journal compilation c© 2010 The Eurographics Association and Blackwell Publishing Ltd.