Embed Size (px)
Citation preview
Recommendation ITU-R P.453-13 (12/2017)
The radio refractive index: its formula and refractivity data
P Series
Radiowave propagation
ii Rec. ITU-R P.453-13
Foreword
The role of the Radiocommunication Sector is to ensure the rational, equitable, efficient and economical use of the radio-
frequency spectrum by all radiocommunication services, including satellite services, and carry out studies without limit
of frequency range on the basis of which Recommendations are adopted.
The regulatory and policy functions of the Radiocommunication Sector are performed by World and Regional
Radiocommunication Conferences and Radiocommunication Assemblies supported by Study Groups.
Policy on Intellectual Property Right (IPR)
ITU-R policy on IPR is described in the Common Patent Policy for ITU-T/ITU-R/ISO/IEC referenced in Annex 1 of
Resolution ITU-R 1. Forms to be used for the submission of patent statements and licensing declarations by patent holders
are available from http://www.itu.int/ITU-R/go/patents/en where the Guidelines for Implementation of the Common
Patent Policy for ITU-T/ITU-R/ISO/IEC and the ITU-R patent information database can also be found.
Series of ITU-R Recommendations
(Also available online at http://www.itu.int/publ/R-REC/en)
Series Title
BO Satellite delivery
BR Recording for production, archival and play-out; film for television
BS Broadcasting service (sound)
BT Broadcasting service (television)
F Fixed service
M Mobile, radiodetermination, amateur and related satellite services
P Radiowave propagation
RA Radio astronomy
RS Remote sensing systems
S Fixed-satellite service
SA Space applications and meteorology
SF Frequency sharing and coordination between fixed-satellite and fixed service systems
SM Spectrum management
SNG Satellite news gathering
TF Time signals and frequency standards emissions
V Vocabulary and related subjects
Note: This ITU-R Recommendation was approved in English under the procedure detailed in Resolution ITU-R 1.
Electronic Publication
Geneva, 2017
ITU 2017
All rights reserved. No part of this publication may be reproduced, by any means whatsoever, without written permission of ITU.
Rec. ITU-R P.453-13 1
RECOMMENDATION ITU-R P.453-13
The radio refractive index: its formula and refractivity data
(Question ITU-R 201/3)
(1970-1986-1990-1992-1994-1995-1997-1999-2001-2003-2012-2015-2016-2017)
Scope
Recommendation ITU-R P.453 provides methods to estimate the radio refractive index and its behaviour for
locations worldwide; describes both surface and vertical profile characteristics; and provides global maps for
the distribution of refractivity parameters and their statistical variation.
Keywords
Radio refractive index, surface, vertical profile, refractivity parameters, statistical variation
The ITU Radiocommunication Assembly,
considering
a) the necessity of using a single formula for calculation of the index of refraction of the
atmosphere;
b) the need for reference data on refractivity and refractivity gradients all over the world;
c) the necessity to have a mathematical method to express the statistical distribution of
refractivity gradients,
recommends
1 that the atmospheric radio refractive index, n, be computed by means of the formula given in
Annex 1;
2 that refractivity data given on world charts and global numerical maps in Annex 1 should be
used, except if more reliable local data are available;
3 that the statistical distribution of refractivity gradients be computed using the method given
in Annex 1;
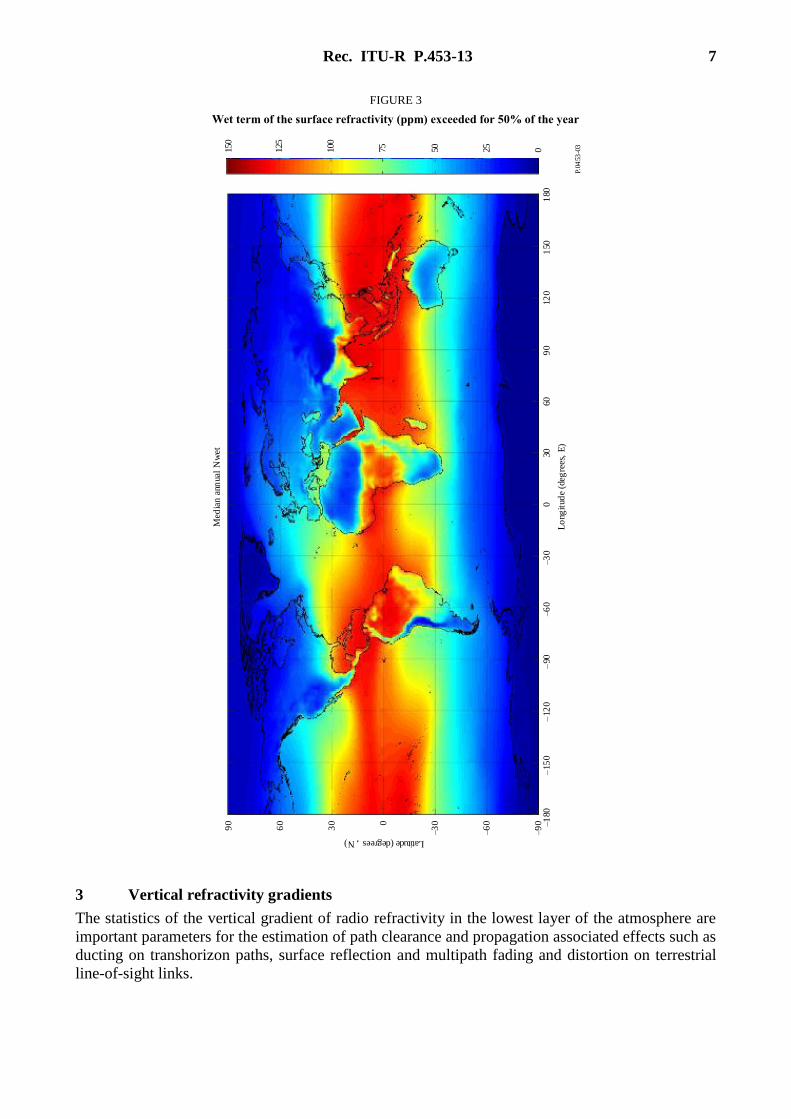
4 that in the absence of local data on temperature and relative humidity, the global numerical
map of the wet term of the surface radio refractivity exceeded for 50% of the year described in
Annex 1, § 2.2 be used (see Fig. 3).
2 Rec. ITU-R P.453-13
Annex 1
1 The formula for the radio refractive index
The atmospheric radio refractive index, n, can be computed by the following formula:
n 1 N 10–6 (1)
where the radio refractivity, N, is:
(N-units) (2)
the dry term of the radio refractivity, Ndry, is:
(3)
and the wet term of the radio refractivity, Nwet, is:
(4)
where:
Pd: dry atmospheric pressure (hPa)
P: total atmospheric pressure (hPa)
e: water vapour pressure (hPa)
T: absolute temperature (K)
and
(5)
Since , equation (2) can be rewritten as:
𝑁 = 77.6𝑃
𝑇− 5.6
𝑒
𝑇+ 3.75 x 10⁵ 𝑒
𝑇2 (6)
Equation (6) may be approximated with reduced accuracy as:
(7)
Equation (7) yields values of N within 0.02 percent of the value obtained from equation (2) for the
temperature range from −50oC to +40oC. For representative profiles of temperature, pressure and
water vapour pressure, see Recommendation ITU-R P.835.
For ready reference, the relationship between water vapour pressure e and relative humidity is given
by:
100
seHe
(8)
with:
2
51075.3726.77T
e
T
e
T
PN d
T
PN d
dry 6.77
2
51075.372T
e
T
eNwet
ePP d
ePPd
T
eP
TN 4810
6.77
Rec. ITU-R P.453-13 3
ct
td
tb
aEFes exp (9)
and:
264 109.50320.02.7101 tPEFwater
264 104.60383.02.2101 tPEFice
where:
𝑡: temperature (oC)
𝑃: total atmospheric pressure (hPa)
H: relative humidity (%)
es: saturation vapour pressure (hPa) at the temperature t (C) and the coefficients a,
b, c and d are:
for water for ice
a 6.1121 a 6.1115
b 18.678 b 23.036
c 257.14 c 279.82
d = 234.5 d = 333.7
(valid between −40 to 50 (valid between −80 to 0
While 𝑃 is defined as the total atmospheric pressure, the dry atmospheric pressure can be used with
insignificant loss of prediction accuracy. Vapour pressure e is obtained from the water vapour density
using the equation:
7.216
Te
hPa (10)
where is given in g/m3. Representative values of are given in Recommendation ITU-R P.836.
2 Surface refractivity and height dependence
2.1 Refractivity as a function of height
It has been found that the long-term mean dependence of the refractive index n upon the height h is
well expressed by an exponential law:
n(h) 1 N0 10–6 exp (–h/h0) (11)
where:
N0: average value of atmospheric refractivity extrapolated to sea level
h0: scale height (km).
N0 and h0 can be determined statistically for different climates. For reference purposes a global mean
of the height profile of refractivity may be defined by:
N0 315
4 Rec. ITU-R P.453-13
h0 7.35 km
These numerical values apply only for terrestrial paths.
This reference profile may be used to compute the value of refractivity Ns at the Earth’s surface from
N0 as follows:
Ns N0 exp (–hs/h0) (12)
where:
hs: height of the Earth’s surface above sea level (km).
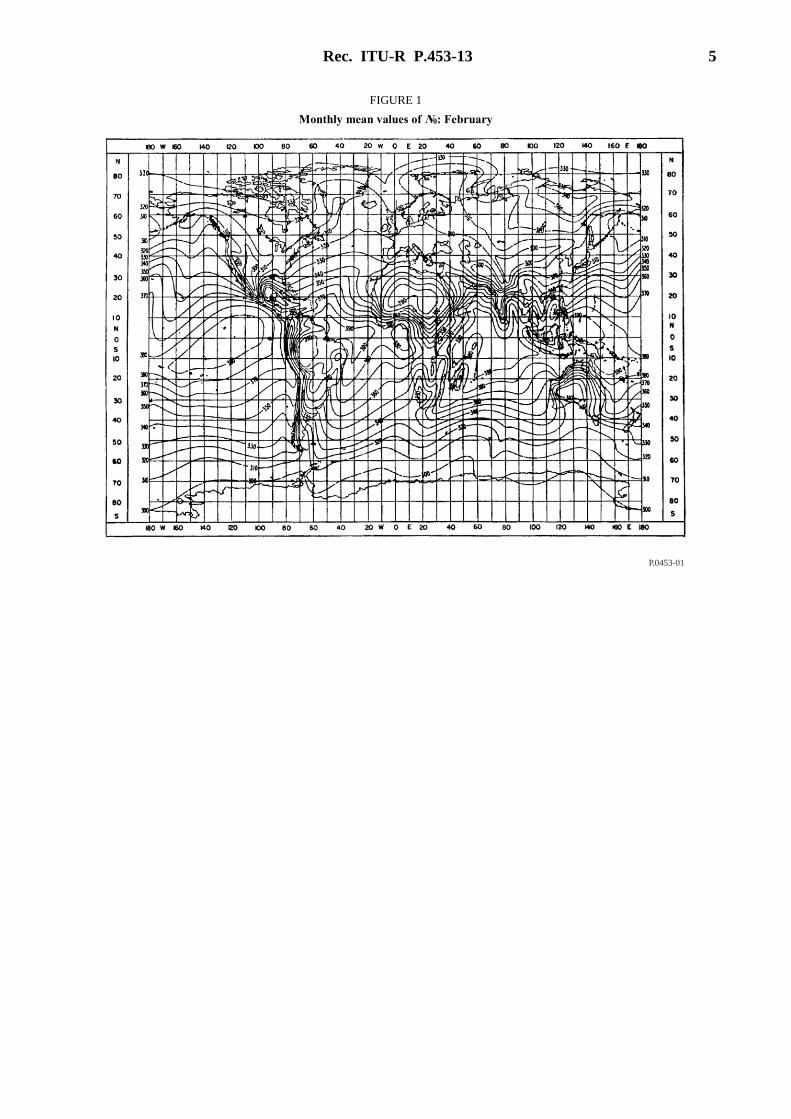
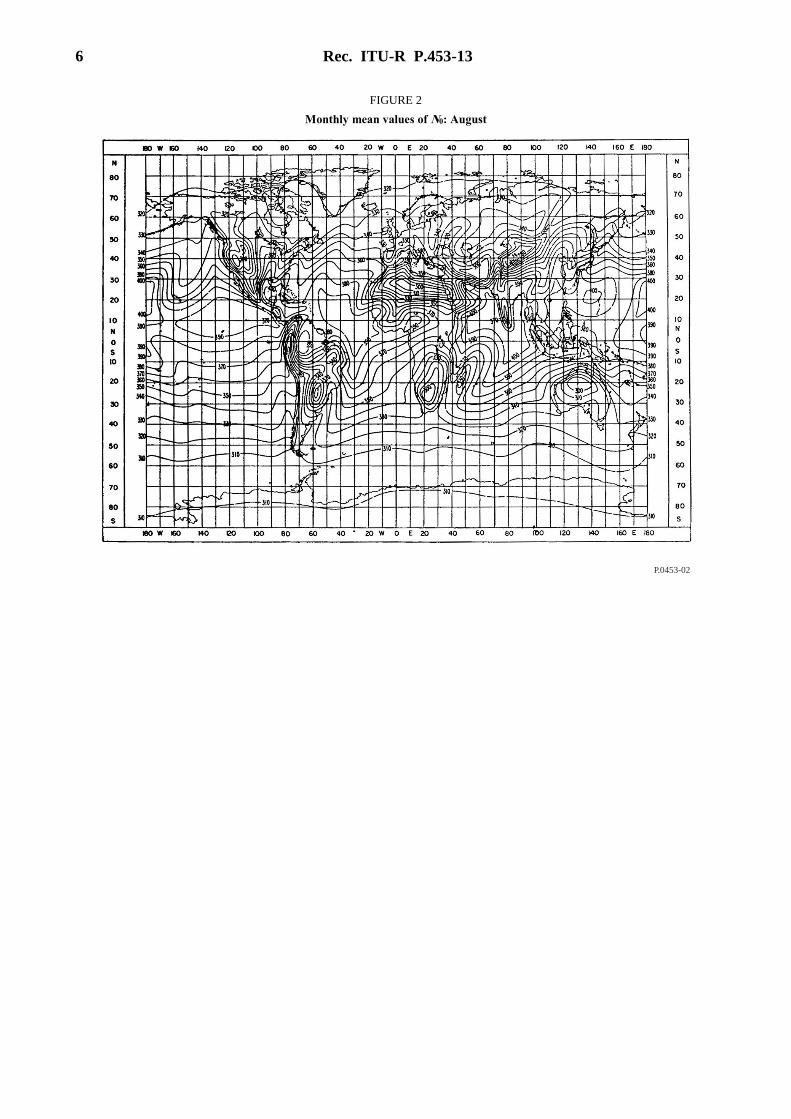
It is to be noted, however, that the contours of Figs 1 and 2 were derived using a value of h0 equal to
9.5 km. Figures 1 and 2 were derived from a 5-year data set (1955-1959) from about 1 000 surface
stations. (Figures 1 and 2 are not available in numerical form.)
For Earth-satellite paths, the refractive index at any height is obtained using equations (1), (2) and (10)
above, together with the appropriate values for the parameters given in Recommendation ITU-R
P.835, Annex 1. The refractive indices thus obtained may then be used for numerical modelling of
ray paths through the atmosphere.
(Note that the exponential profile in equation (12) may also be used for quick and approximate
estimates of refractivity gradient near the Earth’s surface and of the apparent boresight angle, as given
in § 4.3 of Recommendation ITU-R P.834.)
2.2 Wet term of the surface refractivity
The annual and monthly values of the wet term of the surface refractivity, Nwet (ppm), exceeded for
0.1, 0.2, 0.3, 0.5, 1, 2, 3, 5, 10, 20, 30, 50, 60, 70, 80, 90, 95 and 99% respectively of an average year
and an average month are an integral part of this Recommendation. They are available in the form of
digital maps and provided in the Supplement R-Rec. P.453-13-201712-I!!ZIP-E.zip.
The data is from −180° to 180° in longitude and from −90° to 90° in latitude, with a resolution of
0.75º in both latitude and longitude. The wet term of the surface refractivity at any desired location
on the surface of the Earth can be derived by the following interpolation method:
a) determine the two probabilities, pabove and pbelow, above and below the desired probability, p,
from the set: 0.1, 0.2, 0.3, 0.5, 1, 2, 3, 5, 10, 20, 30, 50, 60, 70, 80, 90, 95 and 99%;
b) for the two probabilities, pabove and pbelow, determine the wet term of the surface refractivity,
Nwet1, Nwet2, Nwet3, and, Nwet4 at the four closest grid points;
c) determine the wet term of the surface refractivity, Nwetabove and Nwetbelow, at the probabilities,
pabove and pbelow, by performing a bi-linear interpolation of the four values of the wet term of
the surface refractivity, Nwet1, Nwet2, Nwet3, and, Nwet4 at the four grid points, as described in
Recommendation ITU-R P.1144;
d) determine the wet term of the surface refractivity, Nwet, at the desired probability, p, by
interpolating Nwetabove and Nwetbelow vs. pabove and pbelow to p on a linear Nwet vs. log p scale.
The monthly and annual wet term of the surface refractivity have been derived from 36 years
(1979-2014) of European Centre of Medium-range Weather Forecast (ECMWF) ERA Interim data.
For easy reference, Fig. 3 shows the median value (50%) of the wet term of the surface refractivity
exceeded for the average year.
Rec. ITU-R P.453-13 5
FIGURE 1
Monthly mean values of N0: February
P.0453-01
6 Rec. ITU-R P.453-13
FIGURE 2
Monthly mean values of N0: August
P.0453-02
Rec. ITU-R P.453-13 7
FIGURE 3
Wet term of the surface refractivity (ppm) exceeded for 50% of the year
P.04
53-0
3
–15
0–
09–
06
060
10
21
50–
09–6
0
–0
330 0
60
90
Lo
ngit
ude
(deg
rees
),
E
Latitude (degrees) , N
–108
–1
02
–0
330
90
108
150
125
100
75 50 25 0
Med
ian
ann
ual
Nw
et
3 Vertical refractivity gradients
The statistics of the vertical gradient of radio refractivity in the lowest layer of the atmosphere are
important parameters for the estimation of path clearance and propagation associated effects such as
ducting on transhorizon paths, surface reflection and multipath fading and distortion on terrestrial
line-of-sight links.
8 Rec. ITU-R P.453-13
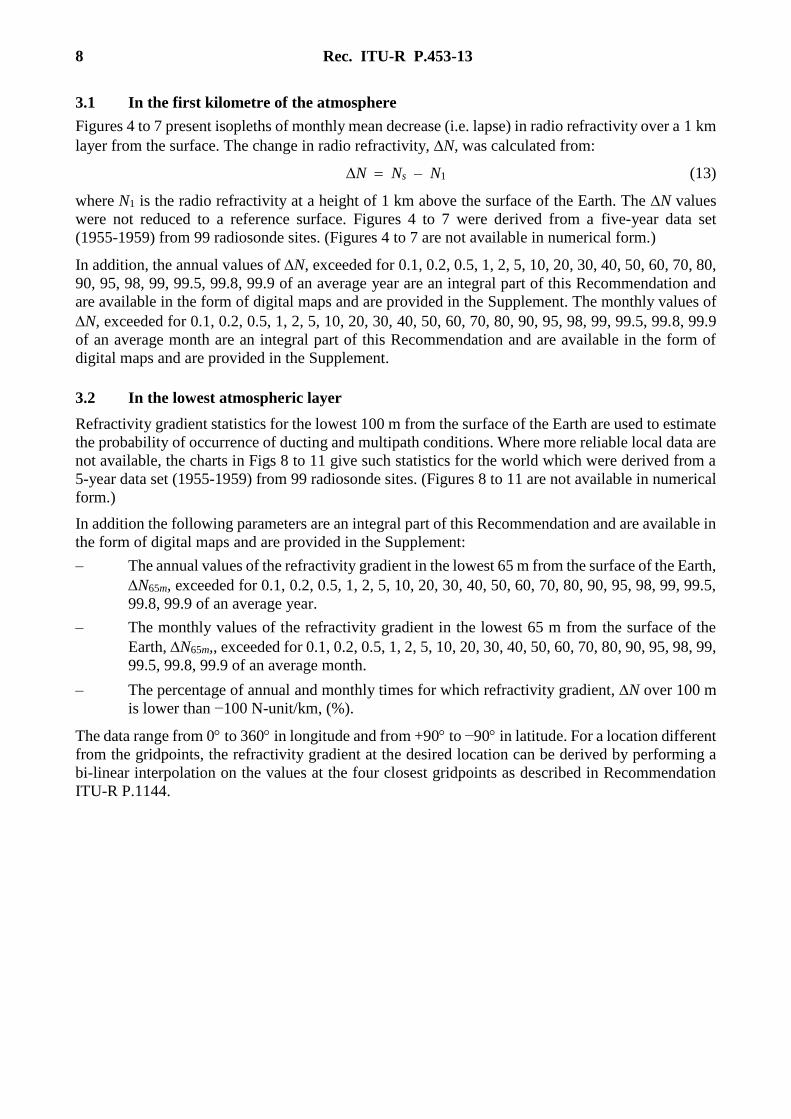
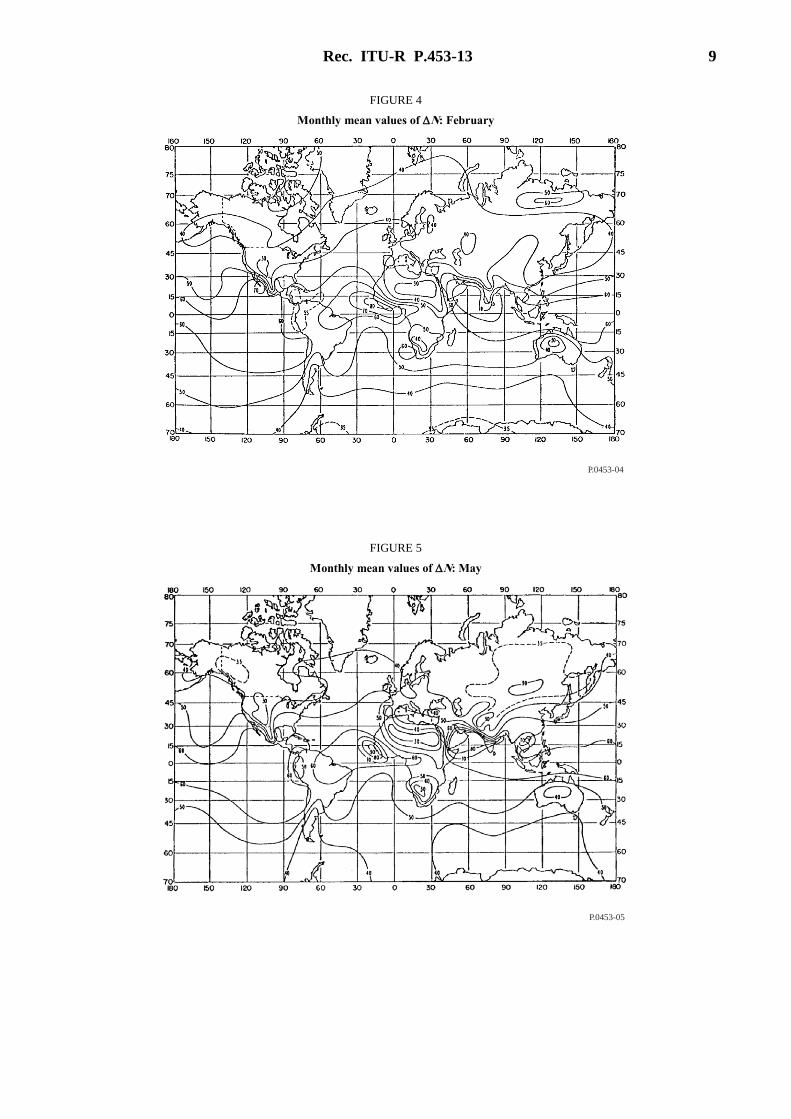
3.1 In the first kilometre of the atmosphere
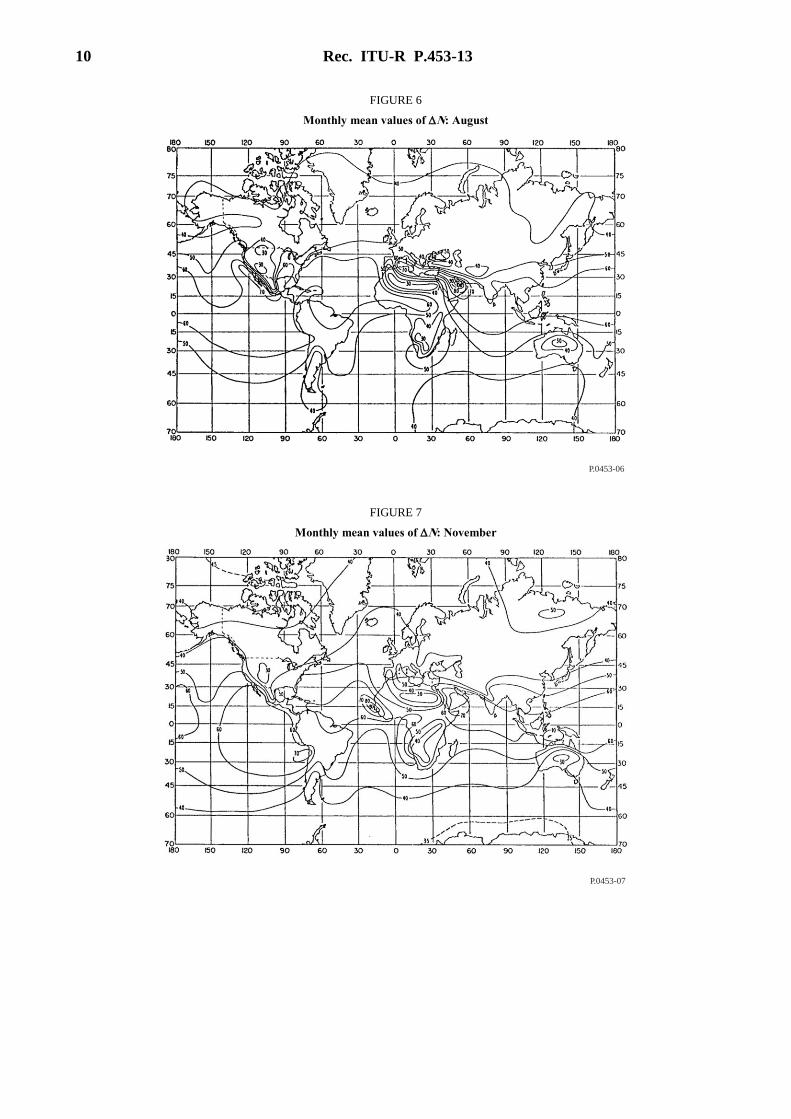
Figures 4 to 7 present isopleths of monthly mean decrease (i.e. lapse) in radio refractivity over a 1 km
layer from the surface. The change in radio refractivity, N, was calculated from:
N Ns – N1 (13)
where N1 is the radio refractivity at a height of 1 km above the surface of the Earth. The N values
were not reduced to a reference surface. Figures 4 to 7 were derived from a five-year data set
(1955-1959) from 99 radiosonde sites. (Figures 4 to 7 are not available in numerical form.)
In addition, the annual values of N, exceeded for 0.1, 0.2, 0.5, 1, 2, 5, 10, 20, 30, 40, 50, 60, 70, 80,
90, 95, 98, 99, 99.5, 99.8, 99.9 of an average year are an integral part of this Recommendation and
are available in the form of digital maps and are provided in the Supplement. The monthly values of
N, exceeded for 0.1, 0.2, 0.5, 1, 2, 5, 10, 20, 30, 40, 50, 60, 70, 80, 90, 95, 98, 99, 99.5, 99.8, 99.9
of an average month are an integral part of this Recommendation and are available in the form of
digital maps and are provided in the Supplement.
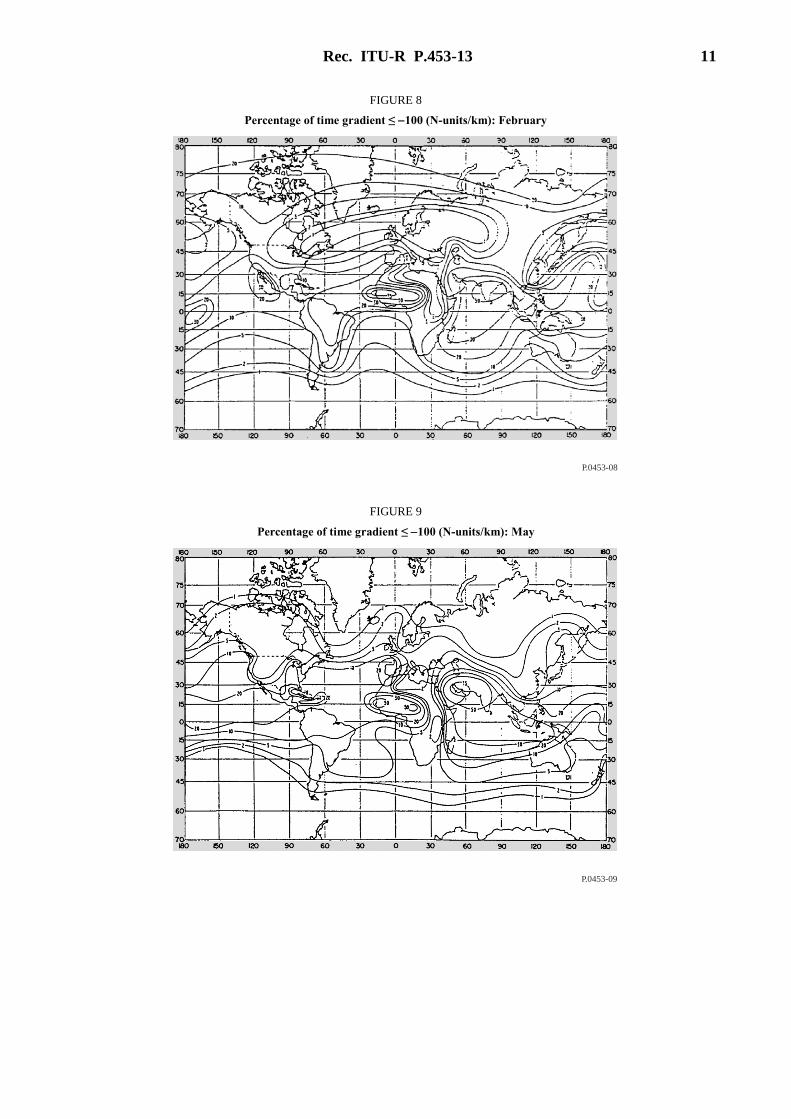
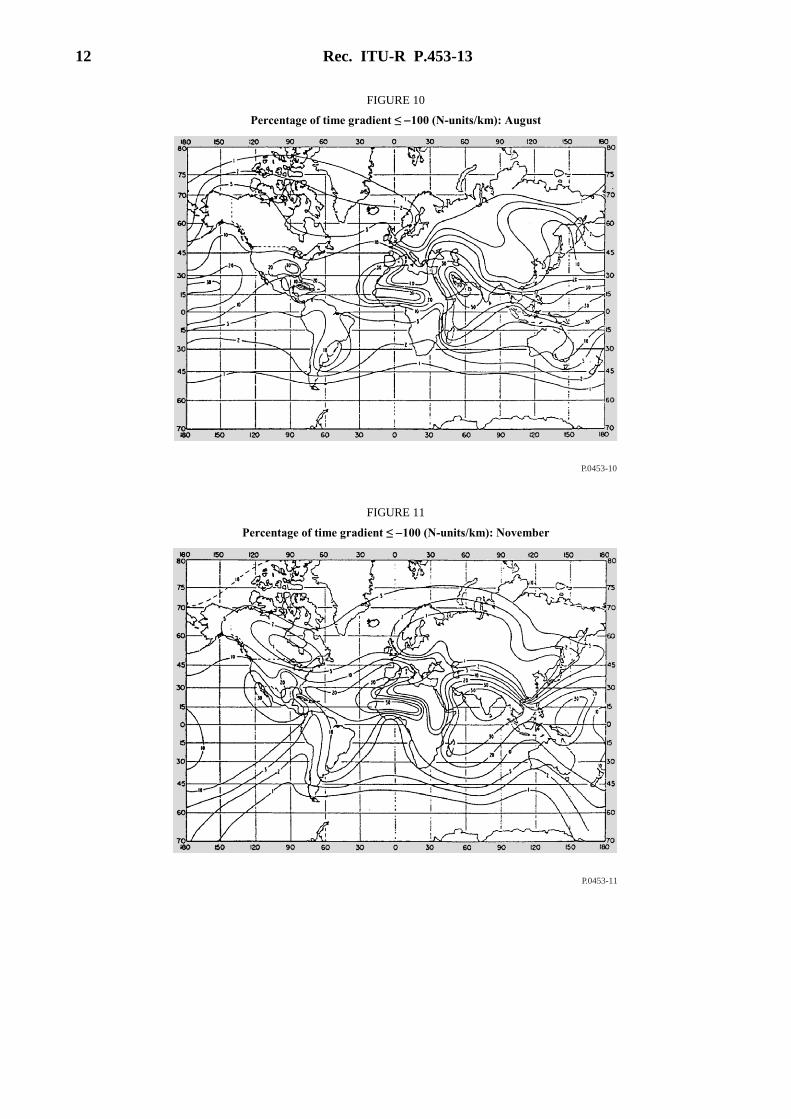
3.2 In the lowest atmospheric layer
Refractivity gradient statistics for the lowest 100 m from the surface of the Earth are used to estimate
the probability of occurrence of ducting and multipath conditions. Where more reliable local data are
not available, the charts in Figs 8 to 11 give such statistics for the world which were derived from a
5-year data set (1955-1959) from 99 radiosonde sites. (Figures 8 to 11 are not available in numerical
form.)
In addition the following parameters are an integral part of this Recommendation and are available in
the form of digital maps and are provided in the Supplement:
– The annual values of the refractivity gradient in the lowest 65 m from the surface of the Earth,
N65m, exceeded for 0.1, 0.2, 0.5, 1, 2, 5, 10, 20, 30, 40, 50, 60, 70, 80, 90, 95, 98, 99, 99.5,
99.8, 99.9 of an average year.
– The monthly values of the refractivity gradient in the lowest 65 m from the surface of the
Earth, N65m,, exceeded for 0.1, 0.2, 0.5, 1, 2, 5, 10, 20, 30, 40, 50, 60, 70, 80, 90, 95, 98, 99,
99.5, 99.8, 99.9 of an average month.
– The percentage of annual and monthly times for which refractivity gradient, N over 100 m
is lower than −100 N-unit/km, (%).
The data range from 0 to 360 in longitude and from +90 to −90 in latitude. For a location different
from the gridpoints, the refractivity gradient at the desired location can be derived by performing a
bi-linear interpolation on the values at the four closest gridpoints as described in Recommendation
ITU-R P.1144.
Rec. ITU-R P.453-13 9
FIGURE 4
Monthly mean values of N: February
P.0453-04
FIGURE 5
Monthly mean values of N: May
P.0453-05
10 Rec. ITU-R P.453-13
FIGURE 6
Monthly mean values of N: August
P.0453-06
FIGURE 7
Monthly mean values of N: November
P.0453-07
Rec. ITU-R P.453-13 11
FIGURE 8
Percentage of time gradient ≤ 100 (N-units/km): February
P.0453-08
FIGURE 9
Percentage of time gradient ≤ 100 (N-units/km): May
P.0453-09
12 Rec. ITU-R P.453-13
FIGURE 10
Percentage of time gradient ≤ 100 (N-units/km): August
P.0453-10
FIGURE 11
Percentage of time gradient ≤ 100 (N-units/km): November
P.0453-11
Rec. ITU-R P.453-13 13
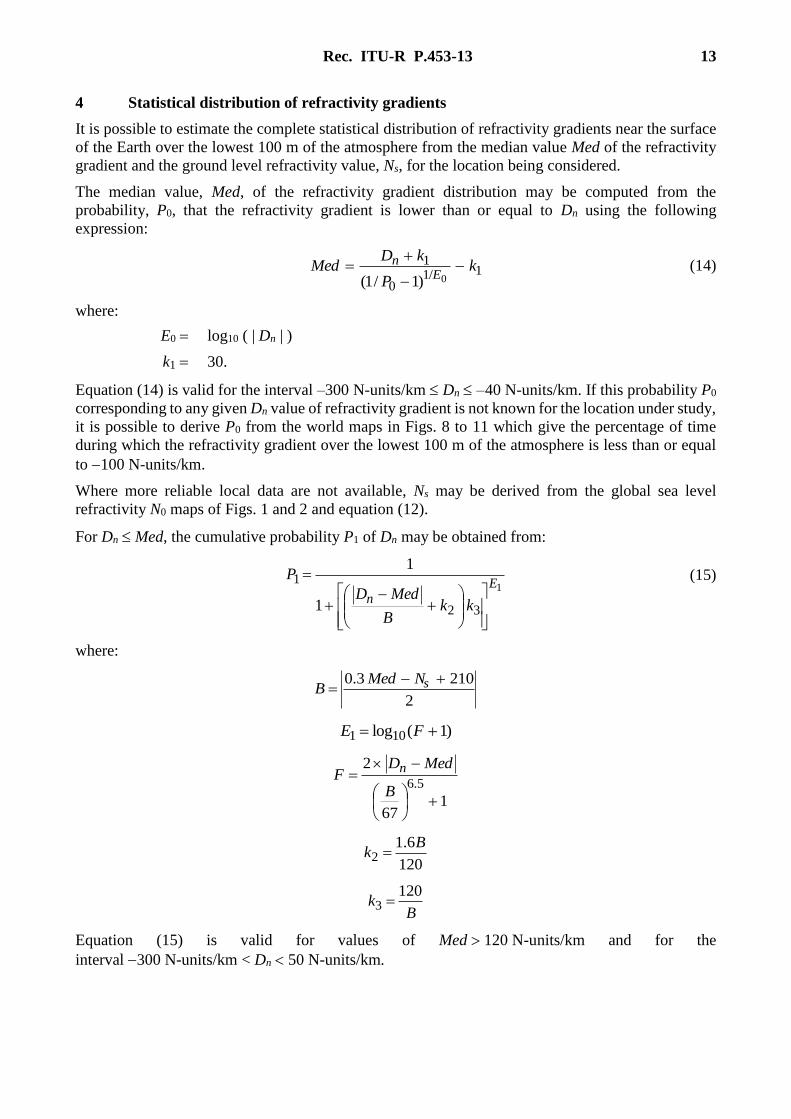
4 Statistical distribution of refractivity gradients
It is possible to estimate the complete statistical distribution of refractivity gradients near the surface
of the Earth over the lowest 100 m of the atmosphere from the median value Med of the refractivity
gradient and the ground level refractivity value, Ns, for the location being considered.
The median value, Med, of the refractivity gradient distribution may be computed from the
probability, P0, that the refractivity gradient is lower than or equal to Dn using the following
expression:
1/10
1
0)1/1(k
P
kDMed
En
(14)
where:
E0 log10 ( | Dn | )
k1 30.
Equation (14) is valid for the interval –300 N-units/km Dn –40 N-units/km. If this probability P0
corresponding to any given Dn value of refractivity gradient is not known for the location under study,
it is possible to derive P0 from the world maps in Figs. 8 to 11 which give the percentage of time
during which the refractivity gradient over the lowest 100 m of the atmosphere is less than or equal
to 100 N-units/km.
Where more reliable local data are not available, Ns may be derived from the global sea level
refractivity N0 maps of Figs. 1 and 2 and equation (12).
For Dn Med, the cumulative probability P1 of Dn may be obtained from:
1
32
1
1
1
E
nkk
B
MedD
P
(15)
where:
2
2103.0 sNMed
B
)1(log101 FE
167
2
5.6
B
MedDF
n
120
6.12
Bk
B
k120
3
Equation (15) is valid for values of Med 120 N-units/km and for the
interval 300 N-units/km < Dn 50 N-units/km.
14 Rec. ITU-R P.453-13
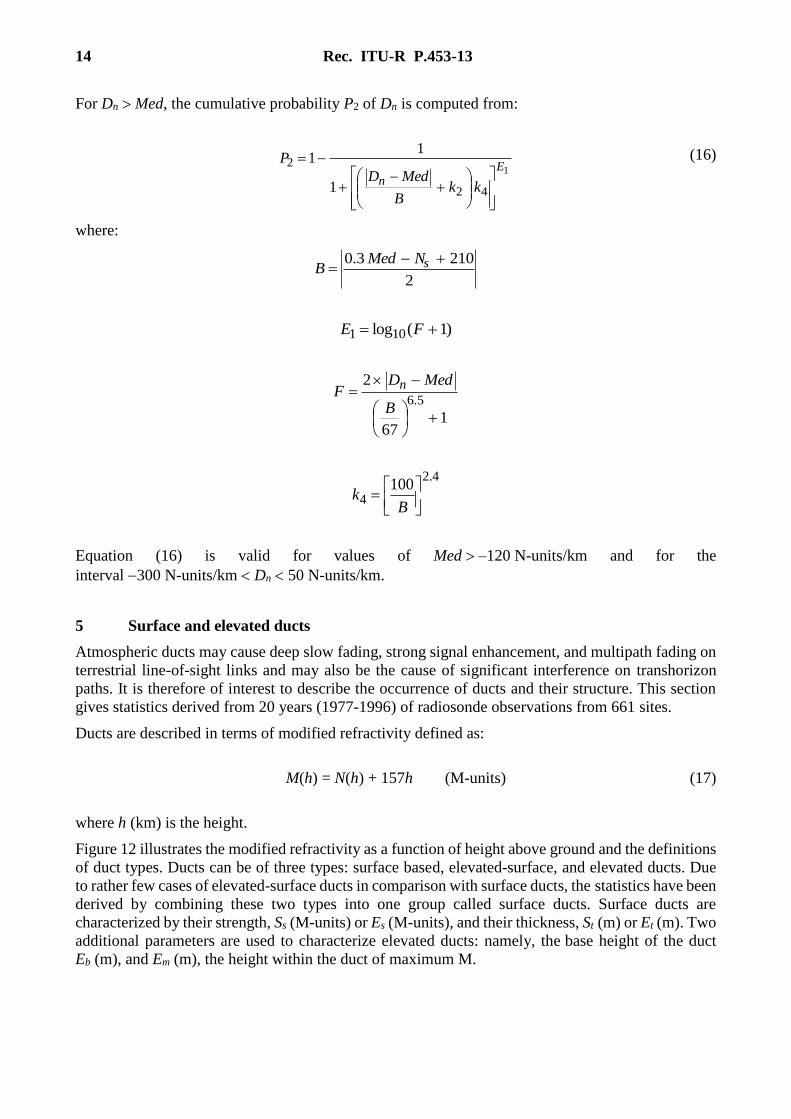
For Dn Med, the cumulative probability P2 of Dn is computed from:
1
42
2
1
11
E
nkk
B
MedD
P
(16)
where:
2
2103.0 sNMed
B
)1(log101 FE
167
2
5.6
B
MedDF
n
4.2
4100
Bk
Equation (16) is valid for values of Med –120 N-units/km and for the
interval 300 N-units/km Dn 50 N-units/km.
5 Surface and elevated ducts
Atmospheric ducts may cause deep slow fading, strong signal enhancement, and multipath fading on
terrestrial line-of-sight links and may also be the cause of significant interference on transhorizon
paths. It is therefore of interest to describe the occurrence of ducts and their structure. This section
gives statistics derived from 20 years (1977-1996) of radiosonde observations from 661 sites.
Ducts are described in terms of modified refractivity defined as:
M(h) = N(h) + 157h (M-units) (17)
where h (km) is the height.
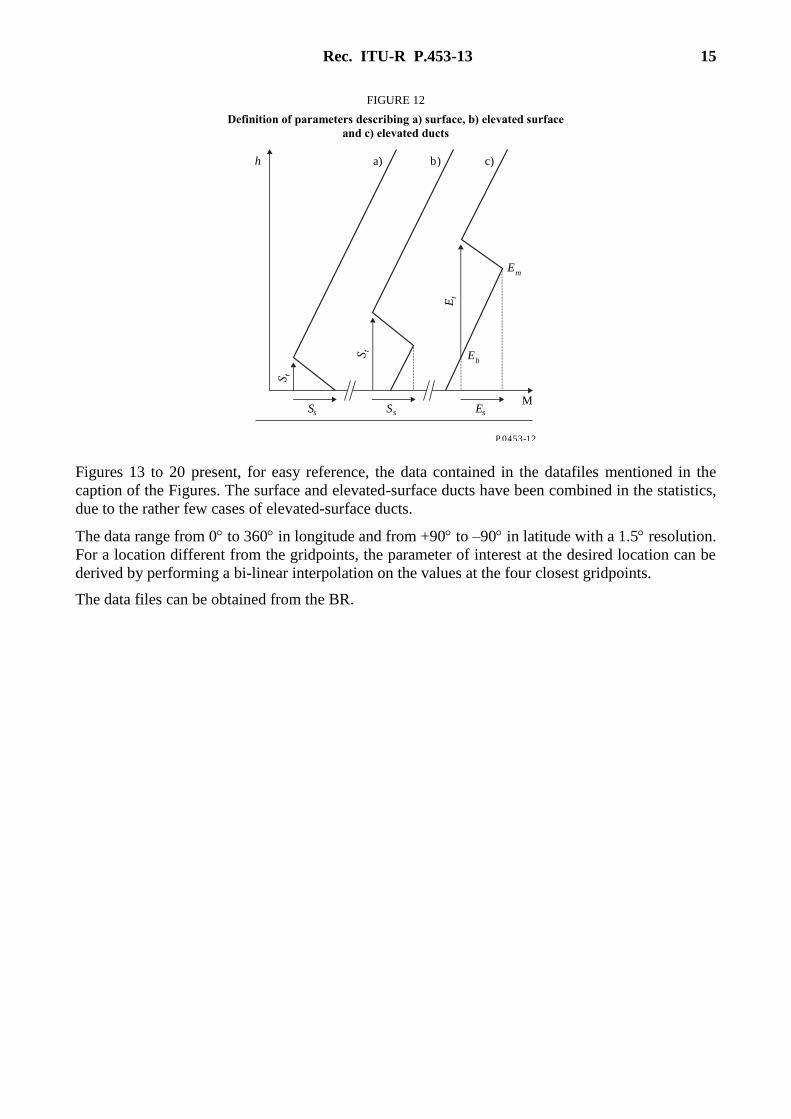
Figure 12 illustrates the modified refractivity as a function of height above ground and the definitions
of duct types. Ducts can be of three types: surface based, elevated-surface, and elevated ducts. Due
to rather few cases of elevated-surface ducts in comparison with surface ducts, the statistics have been
derived by combining these two types into one group called surface ducts. Surface ducts are
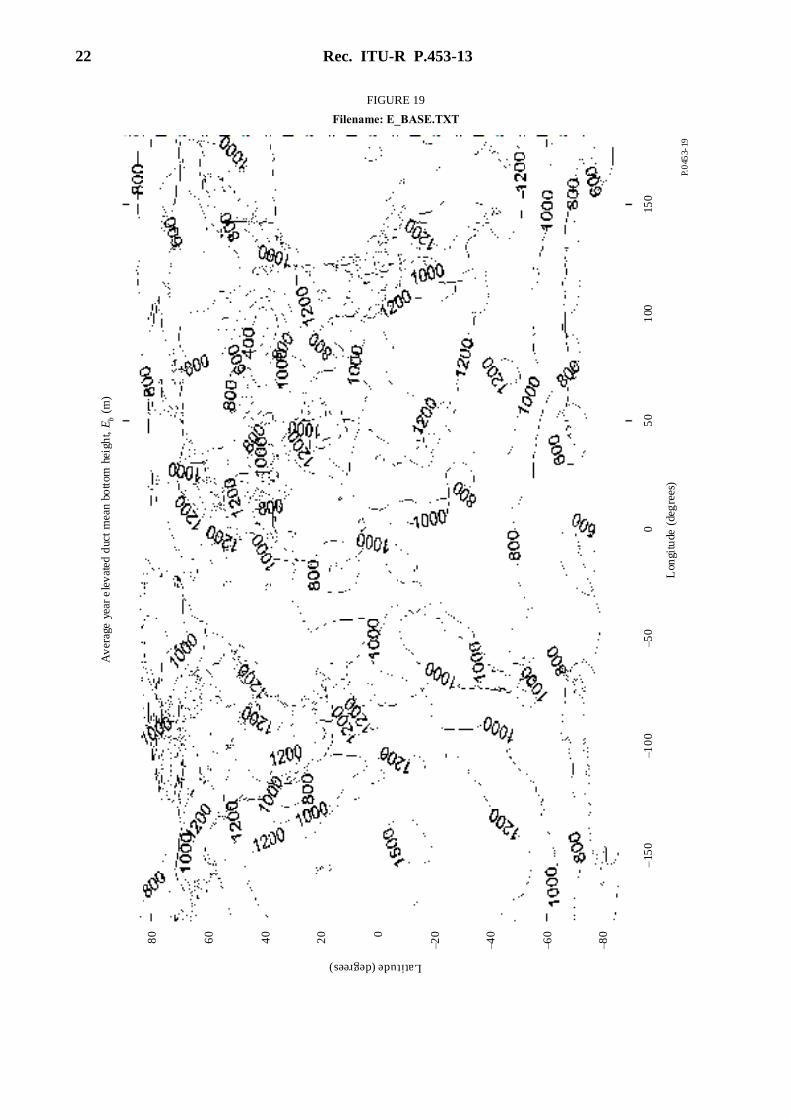
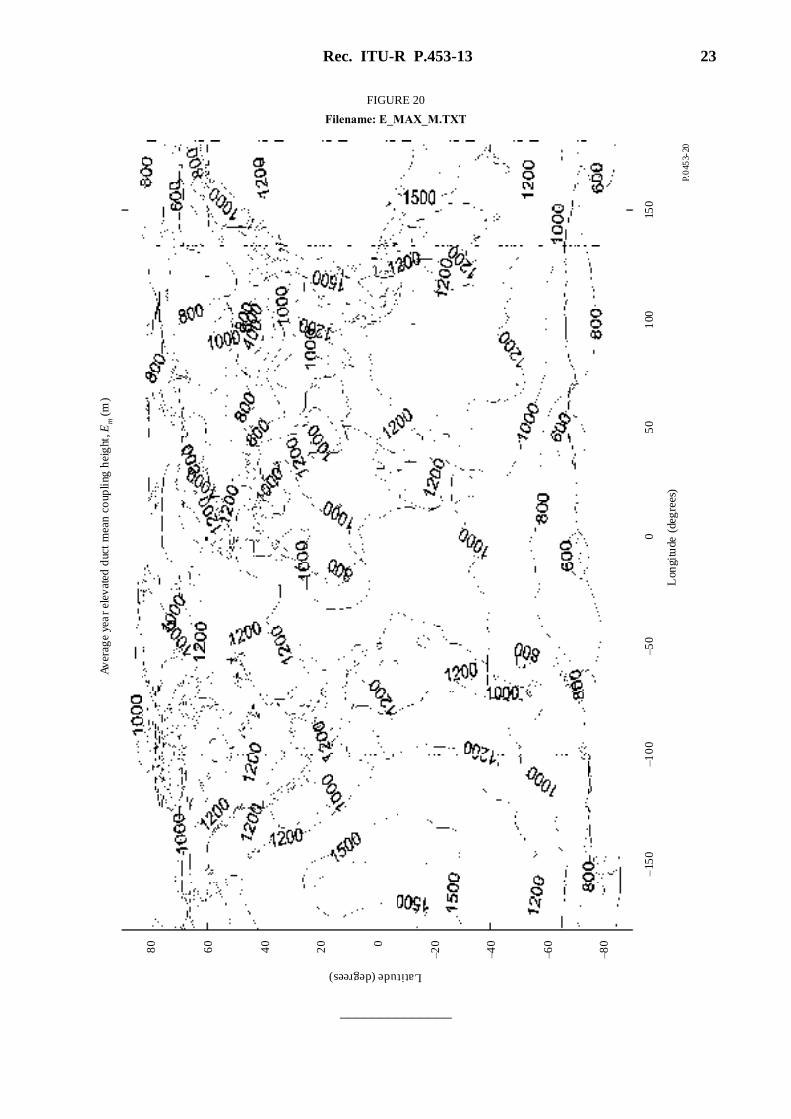
characterized by their strength, Ss (M-units) or Es (M-units), and their thickness, St (m) or Et (m). Two
additional parameters are used to characterize elevated ducts: namely, the base height of the duct
Eb (m), and Em (m), the height within the duct of maximum M.
Rec. ITU-R P.453-13 15
FIGURE 12
Definition of parameters describing a) surface, b) elevated surface
and c) elevated ducts
P.0453-12
h a) b) c)
Ss Ss Es
Eb
Em
M
E
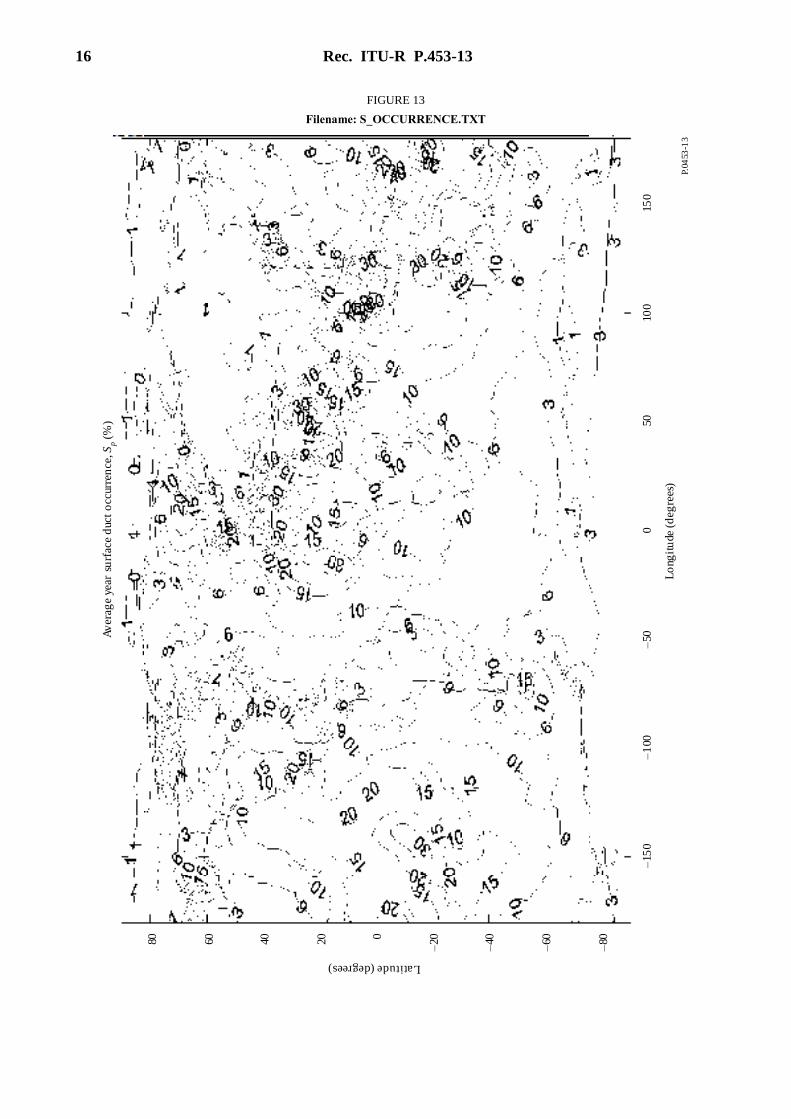
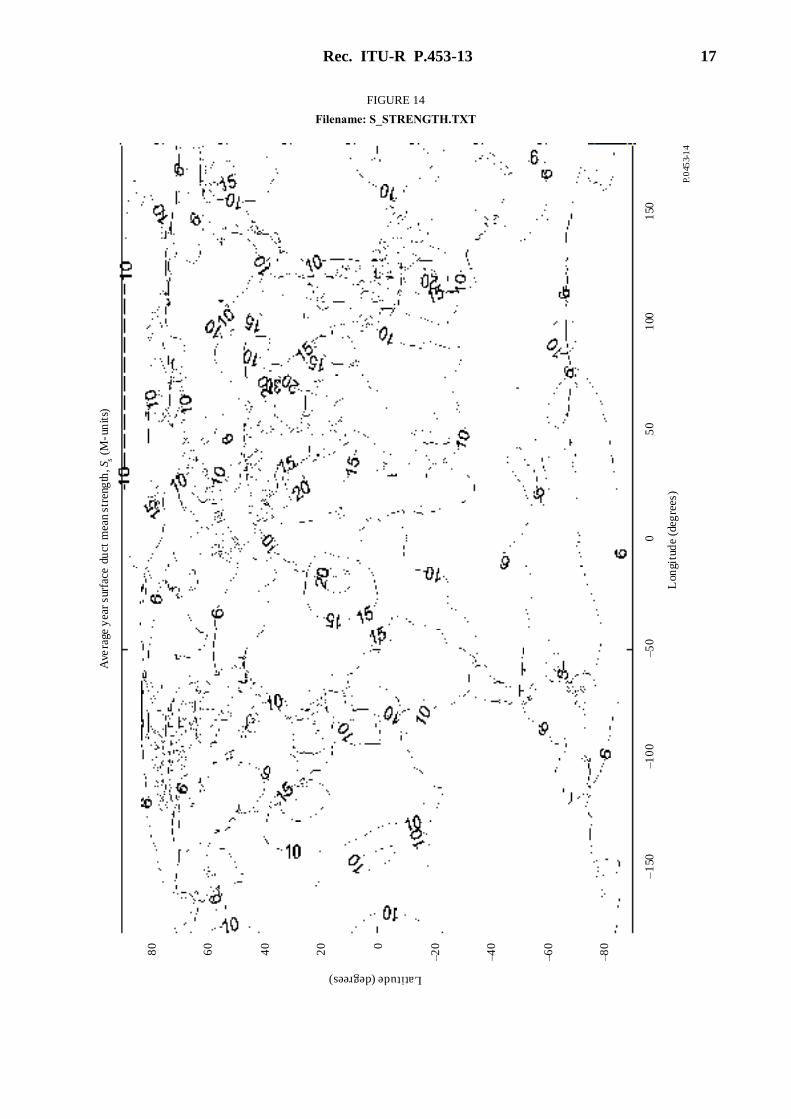
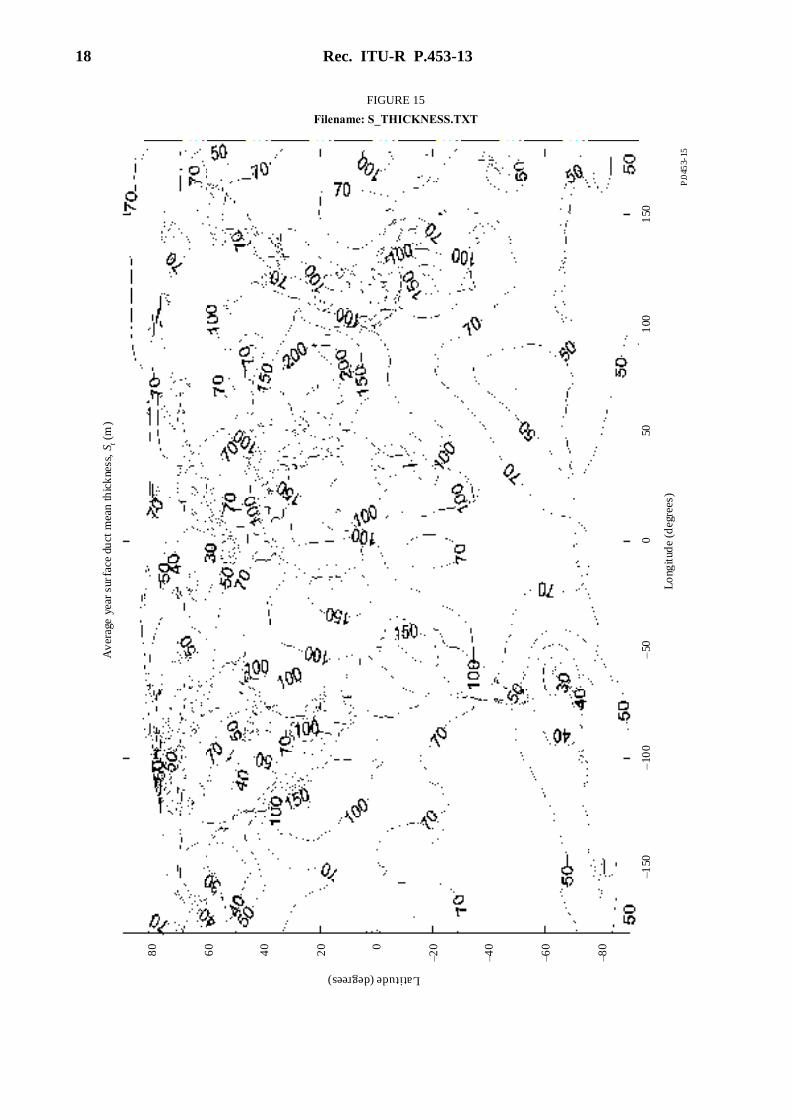
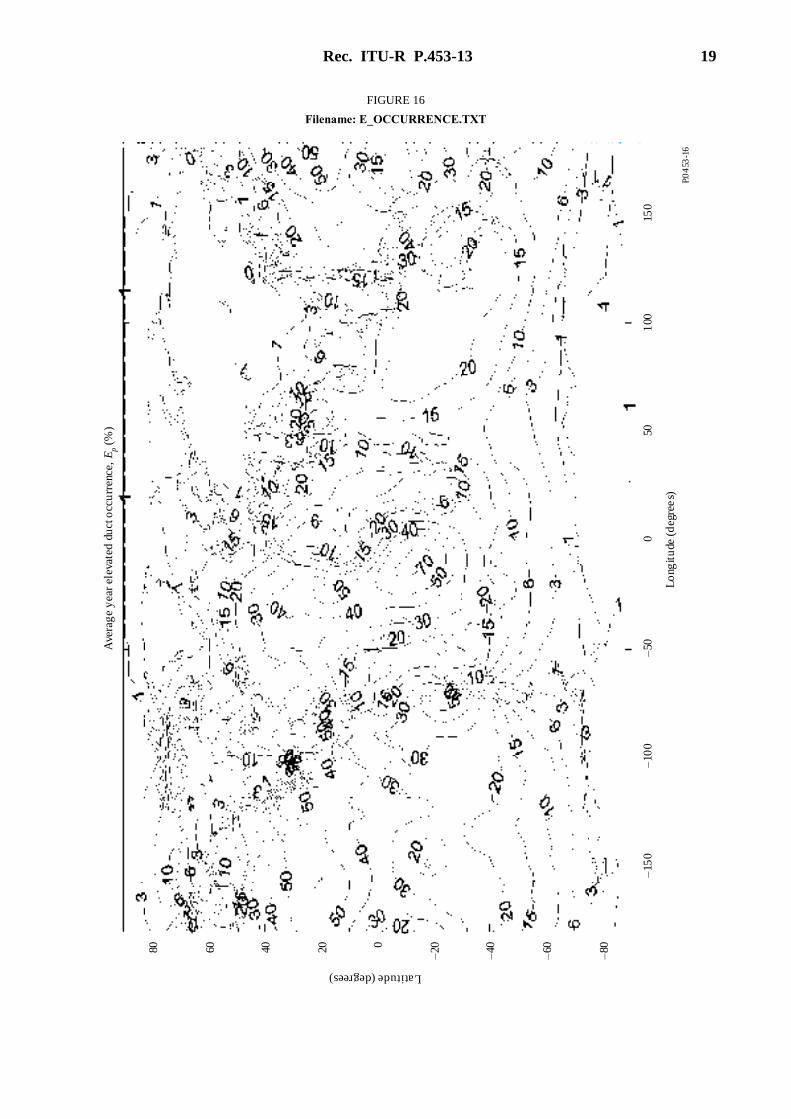
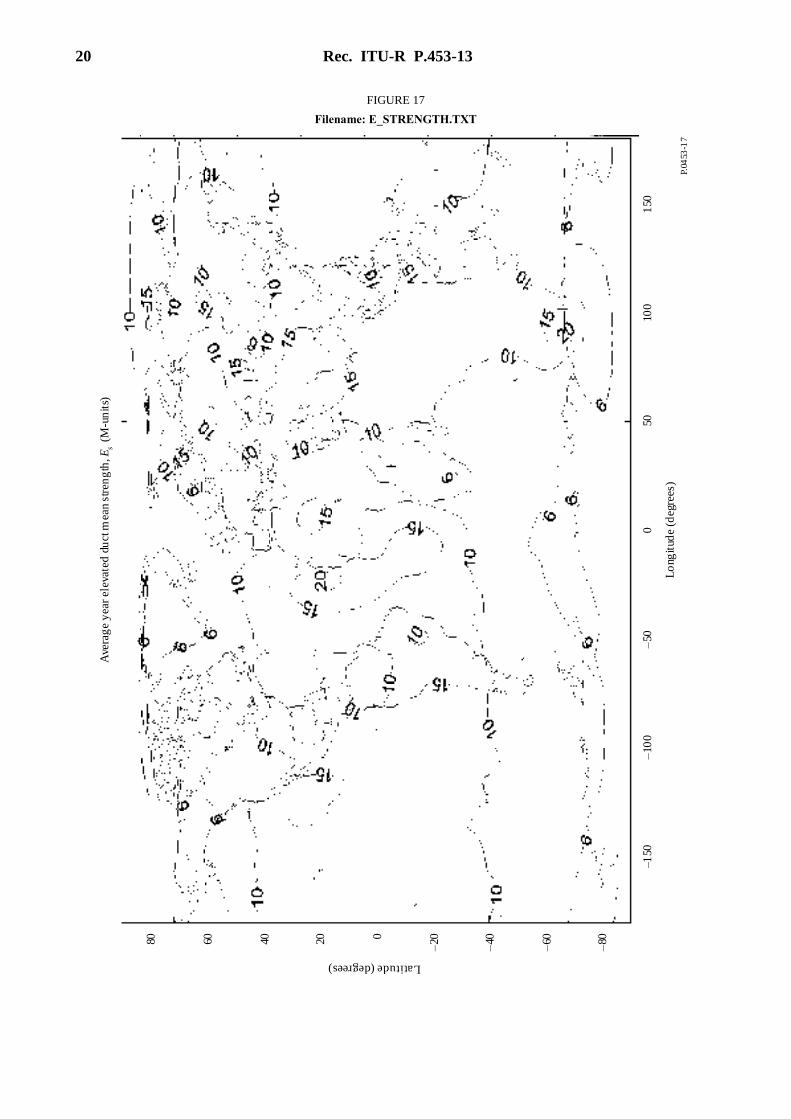
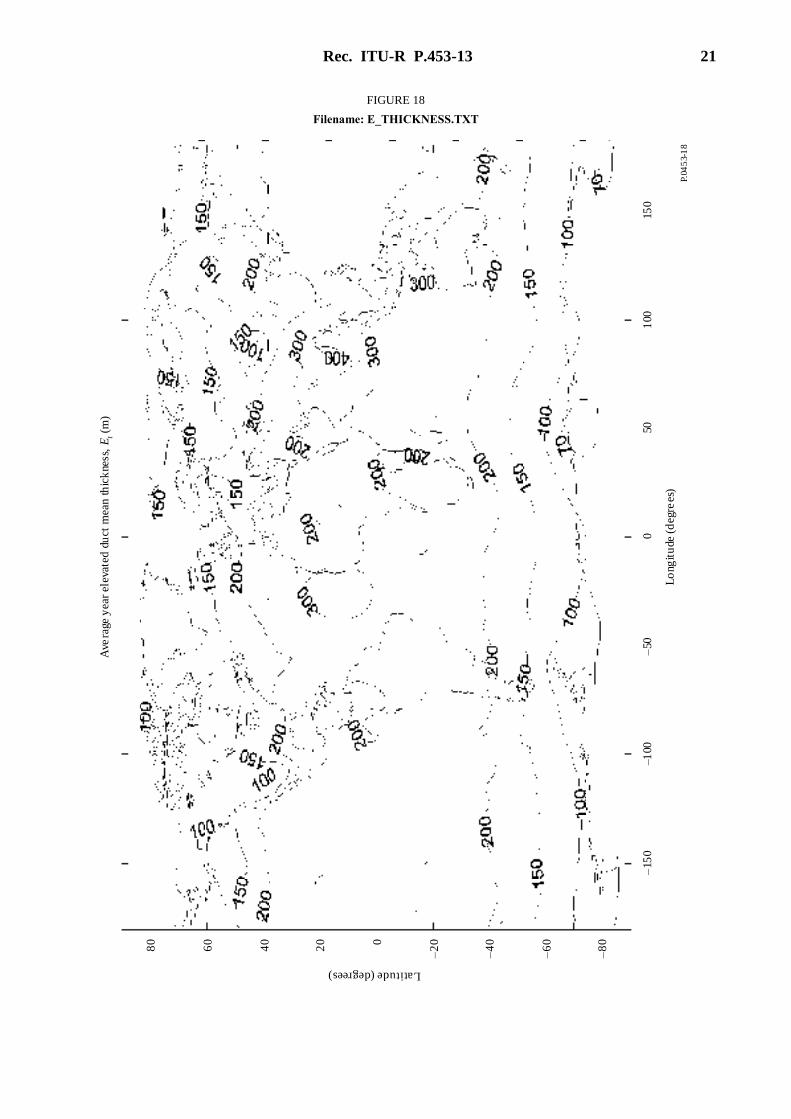
Figures 13 to 20 present, for easy reference, the data contained in the datafiles mentioned in the
caption of the Figures. The surface and elevated-surface ducts have been combined in the statistics,
due to the rather few cases of elevated-surface ducts.
The data range from 0 to 360 in longitude and from +90 to –90 in latitude with a 1.5 resolution.
For a location different from the gridpoints, the parameter of interest at the desired location can be
derived by performing a bi-linear interpolation on the values at the four closest gridpoints.
The data files can be obtained from the BR.
16 Rec. ITU-R P.453-13
FIGURE 13
Filename: S_OCCURRENCE.TXT
P.04
53-
31
–15
0–
100
–50
050
100
150
–80
–60
–40
–20020406080
Lo
ngit
ude
(d
egre
es)
Latitude (degrees)
Av
erag
e ye
ar s
urf
ace
duc
t o
ccur
ren
ce,
(%
)S
p
Rec. ITU-R P.453-13 17
FIGURE 14
Filename: S_STRENGTH.TXT
P.0
453-
41
–1
50–1
00
–50
05
01
001
50
–80
–60
–40
–200
20
40
60
80
Lon
gitu
de
(deg
rees
)
Latitude (degrees)
Ave
rage
yea
r su
rfac
e du
ct m
ean
stre
ngth
, (
M-u
nit
s)S s
18 Rec. ITU-R P.453-13
FIGURE 15
Filename: S_THICKNESS.TXT
P.0
453-
15
–150
–10
0–
500
501
001
50
–80
–60
–40
–200
20
40
60
80
Lo
ngit
ude
(deg
rees
)
Latitude (degrees)
Av
erag
e ye
ar s
urfa
ce d
uct
mea
n th
ick
ness
, (
m)
S t
Rec. ITU-R P.453-13 19
FIGURE 16
Filename: E_OCCURRENCE.TXT
P.0
453
-16
–15
0–
100
–50
050
100
150
–80
–60
–40
–20020406080
Lo
ngit
ude
(d
egre
es)
Latitude (degrees)
Ave
rag
e y
ear
elev
ated
du
ct o
ccu
rren
ce,
(%
)E
p
20 Rec. ITU-R P.453-13
FIGURE 17
Filename: E_STRENGTH.TXT
P.04
53-1
7
–150
–10
0–
500
5010
01
50
–80
–60
–40
–20020406080
Lo
ngit
ude
(deg
rees
)
Latitude (degrees)
Ave
rag
e y
ear
elev
ated
du
ct m
ean
stre
ng
th,
(M-u
nit
s)E
s
Rec. ITU-R P.453-13 21
FIGURE 18
Filename: E_THICKNESS.TXT
P.04
53-
18
–15
0–1
00–
500
501
0015
0
–8
0
–6
0
–4
0
–2
00
20
40
60
80
Lo
ngit
ude
(d
egre
es)
Latitude (degrees)
Ave
rage
yea
r el
evat
ed d
uct
mea
n th
ick
ness
, (
m)
Et
22 Rec. ITU-R P.453-13
FIGURE 19
Filename: E_BASE.TXT
P.0
453-
19
–15
0–1
00
–50
05
01
0015
0
–80
–60
–40
–200
20
40
60
80
Lon
gitu
de (
deg
rees
)
Latitude (degrees)
Av
erag
e ye
ar e
lev
ated
duc
t m
ean
bott
om h
eigh
t,
(m
)E
b
Rec. ITU-R P.453-13 23
FIGURE 20
Filename: E_MAX_M.TXT
P.0
453-
02
–15
0–1
00
–50
05
01
0015
0
–80
–60
–40
–200
20
40
60
80
Lon
gitu
de (
deg
rees
)
Latitude (degrees)
Av
erag
e ye
ar
elev
ated
duc
t m
ean
co
upli
ng h
eig
ht,
(m
)E
m
______________