Embed Size (px)
Citation preview

1
The Radiation Chemistry of Gases at the Interface with Ceramic Oxides
A thesis submitted to the University of Manchester for the degree of Doctor of Philosophy
in the Faculty of Engineering and Physical Sciences
2015
Luke Jones
School of Chemistry Dalton Cumbrian Facility

7161060
1
List of Contents
List of Contents ................................................................................................................ 1
List of Figures ................................................................................................................... 6
List of Tables .................................................................................................................. 14
Abbreviations and Acronyms .......................................................................................... 16
Abstract ......................................................................................................................... 17
Declaration .................................................................................................................... 18
Copyright Statement ...................................................................................................... 19
Acknowledgements ........................................................................................................ 20
The Author ..................................................................................................................... 22
Thesis Structure .............................................................................................................. 23
1 Introduction ............................................................................................................ 25
The Challenge .................................................................................................................................... 25
1.1 Background ........................................................................................................................... 26
1.2 Radiation Chemistry .............................................................................................................. 32
1.2.1 Sources of Radiation ..................................................................................................... 32
1.2.2 Radiation Interactions with Matter .............................................................................. 35
1.2.3 Radiolytic Track Formation ........................................................................................... 44
2 Literature Review .................................................................................................... 47
2.1 𝑃𝑢𝑂2 Storage Canisters ........................................................................................................ 47
2.2 Water Adsorption on 𝑃𝑢𝑂2 .................................................................................................. 50
2.3 Radiolysis of Adsorbed Water ............................................................................................... 51
2.4 Radiolysis of Gases in Contact with 𝑃𝑢𝑂2 ............................................................................. 52
2.5 Radiolysis of 𝐻2 − 𝑂2 in Contact with Other Materials ........................................................ 55
2.6 Radiolysis of Hydrogen and Oxygen ...................................................................................... 56
2.7 Air Radiolysis ......................................................................................................................... 58
Aims and Objectives .......................................................................................................................... 60

7161060
2
3 Experimental ........................................................................................................... 61
3.1 Materials ............................................................................................................................... 61
3.1.1 Gases ............................................................................................................................. 61
3.1.2 Chemicals ...................................................................................................................... 61
3.2 Irradiation Sources ................................................................................................................ 62
3.2.1 Cobalt-60 Source ........................................................................................................... 62
3.2.2 Pelletron Ion Accelerator .............................................................................................. 64
3.3 Analytical Techniques ........................................................................................................... 65
3.3.1 Gas Chromatography (GC) ............................................................................................ 65
3.3.2 Ion Chromatography (IC) ............................................................................................... 66
3.3.3 Surface Area Measurements......................................................................................... 66
3.3.4 Thermogravimetric Analysis (TGA) ............................................................................... 67
3.3.5 Diffuse Reflectance Infra-red Spectroscopy (DRIFT) ..................................................... 67
3.3.6 UV-Vis Spectroscopy ..................................................................................................... 68
3.3.7 Scanning Electron Microscopy (SEM)............................................................................ 68
3.4 Experimental ......................................................................................................................... 69
3.4.1 Mixing of 𝐻2 − 𝑂2 − 𝐴𝑟 Samples ................................................................................. 69
3.4.2 Air Radiolysis ................................................................................................................. 71
3.4.3 Oxide Regeneration ...................................................................................................... 73
3.4.4 Accelerator Experiments ............................................................................................... 73
4 Development of γ-Irradiation Reaction Vessel .......................................................... 76
4.1 Initial Vessel Design .............................................................................................................. 76
4.1.1 GC Configuration and Calibration ................................................................................. 77
4.2 Reaction Vessel Mark II ......................................................................................................... 82
4.2.1 GC Calibration ............................................................................................................... 83
4.3 Reaction Vessel Mark III ........................................................................................................ 86
4.3.1 GC Configuration and Calibration ................................................................................. 86
4.4 Gas Mixing ............................................................................................................................. 92

7161060
3
5 Dosimetry ................................................................................................................ 97
5.1 Background ........................................................................................................................... 97
5.2 Aqueous Dosimetry ............................................................................................................... 99
5.3 Calculation of Absorbed Dose using 60𝐶𝑜 Source ............................................................... 103
5.3.1 Adsorbed Dose in Gaseous Systems ........................................................................... 105
5.3.2 Literature Review of Heterogeneous System Dosimetry ............................................ 107
5.4 Disadvantages of Fricke Dosimetry with Metal Vessels ..................................................... 109
5.5 Gas Phase Dosimetry .......................................................................................................... 110
5.5.1 Gas Phase Dosimetry Literature.................................................................................. 110
5.5.2 Ethylene Dosimetry Results ........................................................................................ 113
5.6 Ion Accelerator Dosimetry .................................................................................................. 114
6 Oxide Powder Characterisation .............................................................................. 118
6.1 Properties of 𝐶𝑒𝑂2 .............................................................................................................. 118
6.1.1 As Received ................................................................................................................. 118
6.1.2 Regenerated 𝐶𝑒𝑂2 Properties .................................................................................... 121
6.1.3 Comparison of ‘As Received’ and Regenerated 𝐶𝑒𝑂2 ................................................ 125
6.2 Properties of 𝑍𝑟𝑂2 .............................................................................................................. 127
6.2.1 As Received ................................................................................................................. 127
6.2.2 Regenerated 𝑍𝑟𝑂2 Properties..................................................................................... 130
6.2.3 Comparison of ‘As Received’ and Regenerated 𝑍𝑟𝑂2 ................................................ 135
6.3 Comparison of Regenerated 𝐶𝑒𝑂2 and 𝑍𝑟𝑂2 ..................................................................... 137
7 𝑯2 – 𝑶2 Radiolysis Results and Discussion .............................................................. 139
7.1 Discussion of 𝐶2𝐻4 Dosimetry in Comparison with Fricke Dosimetry ................................ 139
7.2 Source of Errors in Ethylene Dosimetry .............................................................................. 142
7.3 Mechanism of Ethylene (𝐶2𝐻4) Radiolysis .......................................................................... 146
7.4 𝐻2 Production from Adsorbed Water on Oxide Powders................................................... 149
7.5 Radiolysis of Ethylene in Contact with Oxides .................................................................... 152
7.6 Gamma Radiolysis of 𝐻2 − 𝑂2 − 𝐴𝑟 Gas Mixtures ............................................................. 162

7161060
4
7.6.1 Discussion .................................................................................................................... 168
7.7 Gamma Radiolysis of 𝐻2 − 𝑂2 − 𝐴𝑟 in the Presence of an Oxide Surface ......................... 172
7.8 Comparison of Homogeneous and Heterogeneous Radiolysis ........................................... 177
7.9 Discussion of Pelletron Dosimetry ...................................................................................... 181
7.9.1 Source of Errors in Ethylene Analysis .......................................................................... 183
7.9.2 Source of Errors in Current Measurements ................................................................ 184
7.10 𝐻2 − 𝑂2 − 𝐴𝑟 Radiolysis using an Ion Accelerator ............................................................. 186
7.11 Comparison of γ and 𝐻𝑒2+ Irradiation of Gaseous 𝐻2 − 𝑂2 − 𝐴𝑟 Samples ..................... 187
8 Air Radiolysis Results and Discussion ..................................................................... 191
8.1 Ion Chromatogram Calibration ........................................................................................... 191
8.2 Air Radiolysis ....................................................................................................................... 193
8.3 Air Radiolysis in the Presence of an Oxide Surface ............................................................. 195
8.3.1 Comparison of 𝐶𝑒𝑂2 Data ........................................................................................... 202
8.3.2 Discussion .................................................................................................................... 203
8.3.3 Comparison of 𝑍𝑟𝑂2 Data ........................................................................................... 206
8.4 Explanation of Scatter in 50% and 90% (by volume) 𝑍𝑟𝑂2 Results .................................... 208
8.5 Refinement of Experimental Data in the Presence of an Oxide Surface ............................ 214
8.5.1 Compiled Data ............................................................................................................. 217
8.5.2 Discussion .................................................................................................................... 220
8.6 Oxalate ................................................................................................................................ 224
8.6.1 Oxalate Discussion ...................................................................................................... 227
8.7 Synthetic Air ........................................................................................................................ 232
8.8 Sintered 𝐶𝑒𝑂2 ..................................................................................................................... 234
8.8.1 Oxide Properties ......................................................................................................... 234
8.8.2 Nitrate Production over Sintered 𝐶𝑒𝑂2 ...................................................................... 237
8.8.3 Comparison with Un-sintered 𝐶𝑒𝑂2 Results ............................................................... 238
8.8.4 Discussion .................................................................................................................... 239

7161060
5
9 Final Conclusions ................................................................................................... 244
9.1 𝐻2 − 𝑂2 System .................................................................................................................. 244
9.2 Air Radiolysis System .......................................................................................................... 245
10 Future work ........................................................................................................... 247
10.1 𝐻2 − 𝑂2 − 𝐴𝑟 System ......................................................................................................... 247
10.2 Air Radiolysis System .......................................................................................................... 248
10.3 𝐶2𝐻4 System ....................................................................................................................... 248
10.4 Generic Recommendations ................................................................................................. 249
10.5 Future Work with Accelerated Ions .................................................................................... 251
11 Bibliography .......................................................................................................... 254
Word Count: 51,594

7131060
6
List of Figures
Figure 1.1: 𝑃𝑢𝑂2 surface area as a function of calcination temperature ............................................ 28
Figure 1.2: SEM images of 𝑃𝑢𝑂2 stored at the Sellafield site .............................................................. 29
Figure 1.3: Stainless steel three can system used to package THORP 𝑃𝑢𝑂2 ....................................... 30
Figure 1.4: Comparison of path length and penetration for a β particle .............................................. 36
Figure 1.5: Emission of Bremsstrahlung ............................................................................................... 37
Figure 1.6: Positron annihilation ........................................................................................................... 38
Figure 1.7: Overview of Auger electron emission ................................................................................. 39
Figure 1.8: γ-ray interaction processes and their dependence on photon energy and Z of medium ... 40
Figure 1.9: The photoelectric effect at i) low photon energies and ii) high photon energies ............... 41
Figure 1.10: Compton scattering .......................................................................................................... 41
Figure 1.11: Pair production followed by positron annihilation ........................................................... 43
Figure 1.12: Radiolytic track structure of i) α particle and ii) fast electron .......................................... 45
Figure 2.1: Postulated mechanism of water adsorption onto a 𝑃𝑢𝑂2 surface .................................... 50
Figure 3.1: Foss Therapy Model 812 60𝐶𝑜 Irradiation source ............................................................... 62
Figure 3.2: Decay scheme for cobalt-60 isotopes ................................................................................. 63
Figure 3.3: Schematic of 5 MV Ion accelerator located at DCF ............................................................ 64
Figure 3.4: Bespoke gas mixing manifold system ................................................................................. 70
Figure 3.5: Picture of l-r 1 g, 50% oxide (by volume) and 90% oxide (by volume) for 𝑍𝑟𝑂2 samples ... 71
Figure 3.6: Bespoke glassware for 𝐻𝑒2+ ion radiolysis of 𝐻2 − 𝑂2 − 𝐴𝑟 gaseous mixtures ............... 74
Figure 3.7: Configuration of window assembly through which the beam travels before reaching the
sample ................................................................................................................................. 75
Figure 4.1: Reaction vessel for gamma radiation studies of 𝐻2 − 𝑂2 system ...................................... 76
Figure 4.2: Sample holder for gamma irradiation of 𝐻2 − 𝑂2 system ................................................. 77
Figure 4.3: GC valve configuration for ‘in-line’ analysis i) ‘Load’ position ii) ‘Inject’ position .............. 78
7131060
7
Figure 4.4: Calibration of the gas chromatograph using certified calibration standards in the range
0.1-4% 𝐻2/𝐴𝑟 ..................................................................................................................... 79
Figure 4.5: Gas chromatograms of 2% 𝐻2/𝐴𝑟 and 0.5% 𝐻2/𝐴𝑟 calibration gases .............................. 79
Figure 4.6: Overlain chromatograms of initial trials of 𝐻2 − 𝑂2 radiolysis experiments ..................... 81
Figure 4.7: Mechanical degradation of 𝑃𝑇𝐹𝐸 taps .............................................................................. 82
Figure 4.8: Stainless steel sampling cylinder for 𝐻2 − 𝑂2 gamma irradiation experiments ................ 83
Figure 4.9: Calibration plot for pure 𝐻2 using the direct injection methodology ................................. 84
Figure 4.10: Overlay of gas chromatograms highlighting varying injection volumes of pure 𝐻2 ........ 85
Figure 4.11: Final vessel iteration to investigate radiolysis of 𝐻2 − 𝑂2 systems .................................. 86
Figure 4.12: Final GC valve configuration i) ‘Load’ position ii) ‘Inject’ position .................................... 87
Figure 4.13: Plot of sample loop pressure as a function of time for six repeat injections with vacuum
GC configuration ............................................................................................................... 88
Figure 4.14: GC calibration curve of hydrogen partial pressure as a function of peak area for vacuum
sampling system ............................................................................................................... 89
Figure 4.15: Plot of 𝐻2 peak area as a function of sample loop pressure for a series of samples
containing 5:5:90 𝐻2: 𝑂2: 𝐴𝑟 ............................................................................................ 91
Figure 4.16: Plots of 𝐻2 peak area as a function of sample loop pressure of four different gas mixes i)
2% 𝐻2/𝐴𝑟 calibration gas, ii) pure hydrogen gas, iii) 10:90 𝐻2: 𝐴𝑟 gas mix from manifold
and iv) 5:5:90 𝐻2: 𝑂2: 𝐴𝑟 gas mix from manifold ............................................................. 93
Figure 4.17: Manifold schematic with new mixing cylinder and 𝑃𝑇𝐹𝐸 stirrer bar addition ................ 95
Figure 4.18: Final iteration of manifold design ..................................................................................... 95
Figure 4.19: Mixing efficiency of manifold with mixing cylinder for a three component gas mixture . 96
Figure 5.1: Fricke dosimetry results for the test tube rack array showing i) Unattenuated dose rate
ii) Fully attenuated dose rate (units – Gy min-1) ............................................................... 102
Figure 5.2: γ-ray interaction processes and their dependence on photon energy and Z of medium . 105
Figure 5.3: Results of ethylene dosimetry (units – Gy min-1) .............................................................. 114

7131060
8
Figure 5.4: Plot of current as a function of time for a 15 min irradiation using the ion accelerator
showing the current measured on the 𝑇𝑖 window ............................................................ 116
Figure 6.1: Scanning electron micrograph of 𝐶𝑒𝑂2 (as received) ....................................................... 118
Figure 6.2: EDS spectrum of 𝐶𝑒𝑂2 (as received) ................................................................................. 119
Figure 6.3: BET adsorption (solid trace) - desorption (dashed trace) of 𝐶𝑒𝑂2 (as received) .............. 119
Figure 6.4: DRIFT spectra of 𝐶𝑒𝑂2 (as received) ................................................................................. 120
Figure 6.5: SEM images of regenerated 𝐶𝑒𝑂2 illustrating the macrostructure of the powder (top) and
a large particle (bottom) ................................................................................................... 122
Figure 6.6: BET adsorption (solid trace) – desorption (dashed trace) isotherm for regenerated 𝐶𝑒𝑂2
.......................................................................................................................................... 123
Figure 6.7: Thermogram of regenerated 𝐶𝑒𝑂2 decomposed under 𝑁2 (blue) and static air (red).
Heating rate 10 °C min-1 .................................................................................................... 124
Figure 6.8: DRIFT spectrum of regenerated 𝐶𝑒𝑂2 .............................................................................. 125
Figure 6.9: DRIFT spectra of 𝐶𝑒𝑂2 (as received) and regenerated 𝐶𝑒𝑂2 upto five subsequent
regeneration cycles ........................................................................................................... 126
Figure 6.10: SEM image of 𝑍𝑟𝑂2 (as received) ................................................................................... 127
Figure 6.11: EDS spectrum of 𝑍𝑟𝑂2 (as received) ............................................................................... 128
Figure 6.12: BET adsorption (solid trace) – desorption (dashed trace) isotherm of 𝑍𝑟𝑂2 (as received)
........................................................................................................................................ 128
Figure 6.13: DRIFT spectrum of 𝑍𝑟𝑂2 (as received) ............................................................................ 129
Figure 6.14: SEM images of regenerated 𝑍𝑟𝑂2 illustrating large agglomerated particles ................ 131
Figure 6.15: EDS spectrum of regenerated 𝑍𝑟𝑂2 ................................................................................ 132
Figure 6.16: Thermogram of regenerated 𝑍𝑟𝑂2 decomposed under 𝑁2 (blue) and static air (red).
Heating rate 10 °C min-1 .................................................................................................. 133
Figure 6.17: BET adsorption (solid trace)-desorption (dashed trace) isotherm of regenerated 𝑍𝑟𝑂2 134
Figure 6.18: DRIFT spectrum of regenerated 𝑍𝑟𝑂2 ............................................................................ 135

7131060
9
Figure 6.19: DRIFT spectra of 𝑍𝑟𝑂2 (as received) and regenerated 𝑍𝑟𝑂2 upto four subsequent
regeneration cycles ......................................................................................................... 137
Figure 7.1: Comparison of dose rates obtained by different chemical dosimeters (units Gy min-1)
i) Fricke dosimetry and ii) ethylene dosimetry .................................................................. 140
Figure 7.2: Plot of scatter in each sample of ethylene as a function of the peak area of 𝐻2 in the first
injection ............................................................................................................................. 142
Figure 7.3: Gas chromatogram overlay of three subsequent injections of post irradiated ethylene
highlighting the 𝐻2 signal ................................................................................................. 143
Figure 7.4: Gas chromatogram of two separate ethylene samples irradiated for i) 540 min and
ii) 5760 min ....................................................................................................................... 144
Figure 7.5: Results of ethylene dosimetry at increased pressure (units – Gy min-1) ........................... 146
Figure 7.6: Hydrogen production as a function of absorbed dose from water adsorbed to 𝑍𝑟𝑂2
(primary y-axis) and 𝐶𝑒𝑂2 (secondary y-axis) ................................................................... 150
Figure 7.7: Gas chromatograms showing a comparison of the 𝐻2 signal of irradiated ethylene (𝐶2𝐻4)
(blue trace), 𝐶𝑒𝑂2 in 𝐴𝑟 atmosphere (green trace) and 𝐶𝑒𝑂2 in ethylene (𝐶2𝐻4) (red trace)
irradiated for 9 h in identical radiation fields ................................................................... 153
Figure 7.8: Gas chromatograms showing a comparison of the 𝐻2 signal of irradiated ethylene (𝐶2𝐻4)
(blue trace – secondary y-axis), 𝑍𝑟𝑂2 in 𝐴𝑟 atmosphere (green trace – secondary y-axis)
and 𝑍𝑟𝑂2 in ethylene (𝐶2𝐻4) (red trace – primary y-axis) irradiated for 9 h in identical
radiation fields .................................................................................................................. 154
Figure 7.9: Postulated schematic of ethylene interaction with an oxide surface ............................... 156
Figure 7.10: DRIFT spectra of regenerated 𝐶𝑒𝑂2 pre-irradiation (blue) and post-irradiation (red) in an
ethylene atmosphere ...................................................................................................... 158
Figure 7.11: DRIFT spectra of regenerated 𝑍𝑟𝑂2 pre-irradiation (blue) and post-irradiation (red) in an
ethylene atmosphere ...................................................................................................... 159

7131060
10
Figure 7.12: DRIFT spectra of irradiated 𝐶𝑒𝑂2 in an ethylene atmosphere analysed between
20 – 400 °C ...................................................................................................................... 160
Figure 7.13: DRIFT spectra of irradiated 𝑍𝑟𝑂2 in an ethylene atmosphere analysed between
20 – 400 °C ...................................................................................................................... 161
Figure 7.14: Results of gamma radiolysis of different ratios of 𝐻2 − 𝑂2 − 𝐴𝑟 illustrating 𝐻2 depletion
as a function of absorbed dos ........................................................................................ 163
Figure 7.15: Plot of G(-𝐻2) as a function of absorbed dose for several different ratios of 𝐻2 −
𝑂2 − 𝐴𝑟 gas using gamma radiation using the data in Figure 7.14 .............................. 165
Figure 7.16: 𝑂2 depletion as a function of absorbed dose using gamma radiation of different ratios of
𝐻2 − 𝑂2 − 𝐴𝑟 gas mixtures ........................................................................................... 166
Figure 7.17: Plot of G(-𝑂2) as a function of absorbed dose for several different ratios of 𝐻2 −
𝑂2 − 𝐴𝑟 gas using gamma radiation using the data in Figure 7.16 .............................. 167
Figure 7.18: 𝐻2 consumption as a function of absorbed dose for various 𝐻2 − 𝑂2 − 𝐴𝑟 gas mixtures
in contact with 𝐶𝑒𝑂2 ...................................................................................................... 173
Figure 7.19: Plot of G(-𝐻2) as a function of absorbed dose for several different ratios of 𝐻2 −
𝑂2 − 𝐴𝑟 gas in contact with 𝐶𝑒𝑂2 ................................................................................. 174
Figure 7.20: Plot of 𝐻2 consumption as a function of absorbed dose for the five gaseous systems of
relevance in contact with 𝑍𝑟𝑂2 ...................................................................................... 175
Figure 7.21: G(-𝐻2) as a function of absorbed dose for five gaseous mixtures of 𝐻2 − 𝑂2 − 𝐴𝑟
irradiated in contact with 𝑍𝑟𝑂2 ..................................................................................... 176
Figure 7.22: 𝐻2 consumption as a function of absorbed dose in samples of 5: 5: 90 𝐻2 − 𝑂2 − 𝐴𝑟
concentration in contact with 𝐶𝑒𝑂2 and 𝑍𝑟𝑂2 and in pure gas system only ................. 177
Figure 7.23: 𝐻2 consumption as a function of absorbed dose in samples of 5: 2.5: 92.5 𝐻2 − 𝑂2 − 𝐴𝑟
concentration in contact with 𝐶𝑒𝑂2 and 𝑍𝑟𝑂2 and in pure gas ..................................... 179
Figure 7.24: 𝐻2 consumption as a function of absorbed dose in samples of 2.5: 5: 92.5 𝐻2 − 𝑂2 − 𝐴𝑟
concentration in contact with 𝐶𝑒𝑂2 and 𝑍𝑟𝑂2 and in pure gas ..................................... 180

7131060
11
Figure 7.25: Plot of 𝐻2 production as a function of absorbed dose for ethylene experiments using an
ion accelerator ................................................................................................................ 182
Figure 7.26: Plot of pressure as a function of time for a sample of ethylene irradiated using 5.5 MeV
𝐻𝑒2+ ions. Irradiation time 30 min, 10 nA current on sample ....................................... 183
Figure 7.27: 𝐻2 depletion as a function of absorbed dose for three different mixtures of
𝐻2 − 𝑂2 − 𝐴𝑟 utilising 5.5 MeV 𝐻𝑒2+ accelerated ions ................................................ 186
Figure 7.28: 𝐻2 depletion as a function of absorbed dose for three various mixtures of 𝐻2 − 𝑂2 − 𝐴𝑟
utilising 60𝐶𝑜 γ-rays and 5.5 MeV 𝐻𝑒2+ accelerated ions .............................................. 188
Figure 8.1: Calibration plot of 𝑁𝑂3− peak area as a function of 𝑁𝑎𝑁𝑂3 concentration using ion
chromatography ............................................................................................................... 192
Figure 8.2: Effect of γ radiation dose on nitrate production from laboratory air ............................... 193
Figure 8.3: Effect of γ radiation dose on the production of nitrate in water saturated and unsaturated
laboratory air. Volume of air = 11.9-12.0 cm3 at 35 °C ..................................................... 194
Figure 8.4: Nitrate production as a function of dose for systems containing 1 g of either 𝐶𝑒𝑂2 or 𝑍𝑟𝑂2
powder and water saturated air (no oxide) ...................................................................... 196
Figure 8.5: Nitrate production as a function of absorbed dose for systems containing 50% oxide (by
volume) and for water saturated air (no oxide) ................................................................ 199
Figure 8.6: Nitrate production as a function of dose for systems containing 90% oxide (by volume)
and for water saturated air (no oxide) .............................................................................. 201
Figure 8.7: Nitrate production as a function of absorbed dose for 1 g, 50% and 90% (by volume) 𝐶𝑒𝑂2
systems and for water saturated air (no oxide) ................................................................ 202
Figure 8.8: Nitrate production as a function of absorbed dose for 1 g, 50% and 90% (by volume) 𝐶𝑒𝑂2
systems and for water saturated air (no oxide) up to an absorbed dose of 2.0x10¹⁹ eV .. 203
Figure 8.9: i) Face-centred cubic crystal structure unit cell, and ii) atomic structure of each face in the
unit cell ........................................................................................................................... 205

7131060
12
Figure 8.10: Nitrate production as a function of absorbed dose for 1 g, 50% and 90% (by volume)
𝑍𝑟𝑂2 systems and for water saturated air (no oxide) .................................................... 207
Figure 8.11: Three ion chromatograms of samples containing: i) 1 g, ii) 50% and iii) 90% 𝑍𝑟𝑂2 (by
volume) illustrating the emergence of a second signal at 6.6 min................................. 209
Figure 8.12: Ion chromatogram of 50 μM oxalic acid, 0.1 mM sodium nitrate and a mixed solution of
both ................................................................................................................................ 212
Figure 8.13: Chromatogram of 0.1 mM 𝑁𝑎𝑁𝑂3 and 50 μM oxalic acid mixed solution using eluent
concentration of 14 mM 𝐾𝑂𝐻 ....................................................................................... 213
Figure 8.14: Nitrate production as a function of dose for samples containing 1 g of oxide powder and
for water saturated air (no oxide) .................................................................................. 214
Figure 8.15: Nitrate production as a function of dose for samples containing 50% (by volume) 𝐶𝑒𝑂2
and 𝑍𝑟𝑂2 and from water saturated air (no oxide) ....................................................... 215
Figure 8.16: Nitrate production as a function of dose for samples containing 90% (by volume) 𝐶𝑒𝑂2
and 𝑍𝑟𝑂2 and from water saturated air (no oxide) ....................................................... 216
Figure 8.17: Nitrate production as a function of absorbed dose for 1 g, 50% and 90% (by volume)
𝐶𝑒𝑂2 systems and for water saturated air (no oxide) .................................................... 217
Figure 8.18: Nitrate production as a function of absorbed dose for 1 g, 50% and 90% (by volume)
𝑍𝑟𝑂2 systems and water saturated air (no oxide) ......................................................... 219
Figure 8.19: Pictorial representation of 𝑁𝑂3− bonding modes with metal centres depicting (l-r)
monodentate, bidentate and bridging adsorption modes ............................................. 222
Figure 8.20: Calibration plot of 𝐶2𝑂42− peak area as a function of 𝐻2𝐶2𝑂4 concentration using ion
chromatography ............................................................................................................. 224
Figure 8.21: Plot of oxalate production as a function of absorbed dose for samples containing 1 g,
50% and 90% (by volume) of 𝐶𝑒𝑂2 and from water saturated air (no oxide) ................ 225
Figure 8.22: Plot of oxalate production as a function of absorbed dose for samples containing 1 g,
50% and 90% (by volume) of 𝑍𝑟𝑂2 and from water saturated air (no oxide) ................ 226

7131060
13
Figure 8.23: Thermogravimetric analysis of cerium oxalate under 𝑁2 (blue) and static air (red)
atmospheres. Heating rate 2 °C min-1 ............................................................................. 227
Figure 8.24: Plot of nitrate production as a function of absorbed dose for synthetic air, laboratory air
and water saturated laboratory air. Volume of air =11.9 - 12.0 cm3 at 35 °C ................ 233
Figure 8.25: BET adsorption (solid trace) – desorption (dashed trace) isotherm of 𝐶𝑒𝑂2 sintered at
950 °C for 2 h................................................................................................................... 235
Figure 8.26: i) Scanning electron micrograph and ii) EDS spectra for sintered 𝐶𝑒𝑂2 ......................... 236
Figure 8.27: Nitrate production as a function of absorbed dose for samples containing 1 g, 50% and
90% (by volume) sintered 𝐶𝑒𝑂2 and from water saturated air (no oxide) ..................... 237
Figure 8.28: Compiled data plot of nitrate production as a function of dose for systems containing
1 g, 50% and 90% (by volume) regenerated 𝐶𝑒𝑂2, 1 g, 50% and 90% (by volume) sintered
𝐶𝑒𝑂2 and from water saturated air (no oxide) .............................................................. 238
Figure 8.29: Plot of G(𝑁𝑂3−) as a function of surface area for the three oxide systems utilised in this
research and for reference, the water saturated air (no oxide) yield ............................ 240
Figure 10.1: Sketch of possible reaction vessel to study heterogeneous systems using an ion
accelerator ...................................................................................................................... 252
Figure 10.2: Second possible reaction vessel for heterogeneous system experiments using an ion
accelerator ...................................................................................................................... 253

7131060
14
List of Tables
Table 7-1: Calculated G(-𝐻2) values for several different ratios of 𝐻2 − 𝑂2 − 𝐴𝑟 gas using gamma
radiation ............................................................................................................................ 164
Table 7-2: Calculated G(-𝑂2) values for several different ratios of 𝐻2 − 𝑂2 − 𝐴𝑟 gas using gamma
radiation ............................................................................................................................ 166
Table 7-3: Ionisation energy of the three gas molecules in the initial system .................................... 168
Table 7-4: Calculated G(-𝐻2) in samples containing 5: 5: 90 𝐻2 − 𝑂2 − 𝐴𝑟 (by volume) in the
presence of 𝐶𝑒𝑂2, 𝑍𝑟𝑂2 and in pure gas phase ................................................................ 178
Table 7-5: Calculated G(-𝐻2) values from experiments utilising 5.5 MeV 𝐻𝑒2+ accelerated ions ..... 187
Table 7-6: Calculated G(-𝐻2) values and associated errors for three different mixtures of
𝐻2 − 𝑂2 − 𝐴𝑟 utilising 60𝐶𝑜 γ-rays and 5.5 MeV 𝐻𝑒2+ accelerated ions ........................ 188
Table 8-1: Calculated G(𝑁𝑂3−) values and standard deviation of the gradient for 1 g oxide systems
and water saturated air (no oxide) ................................................................................... 196
Table 8-2: Calculated mass of water in systems containing 1 g 𝐶𝑒𝑂2, 1 g 𝑍𝑟𝑂2 and water saturated
air (no oxide) ..................................................................................................................... 197
Table 8-3: Calculated mass of water in systems containing 50% 𝐶𝑒𝑂2 and 50% 𝑍𝑟𝑂2 (by volume) and
water saturated air (no oxide) .......................................................................................... 198
Table 8-4: Calculated G(𝑁𝑂3−) values and standard deviation of the gradient for experiment with 50%
oxide (by volume) and with water saturated air (no oxide) .............................................. 199
Table 8-5: Calculated mass of water in systems containing 90% 𝐶𝑒𝑂2 and 90% 𝑍𝑟𝑂2 (by volume) and
water saturated air (no oxide) .......................................................................................... 200
Table 8-6: Calculated G(𝑁𝑂3−) values and standard deviation of the gradient for systems with 90%
oxide (by volume) and for water saturated air (no oxide) ................................................ 201
Table 8-7: Calculated G(𝑁𝑂3−) values for the 𝐶𝑒𝑂2 containing systems and for water saturated air
(no oxide) .......................................................................................................................... 202
Table 8-8: Initial yield of nitrate pre-irradiation ................................................................................. 204
Table 8-9: Calculated G(𝑁𝑂3−) values for the system containing 𝑍𝑟𝑂2 and for water saturated air
(no oxide) .......................................................................................................................... 207
Table 8-10: Anions and corresponding retention times (in minutes) present in deionised water ...... 210
Table 8-11: Calculated G(𝑁𝑂3−) values and standard deviation of the gradient for systems with 1 g
oxide and water saturated air (no oxide) ....................................................................... 214
Table 8-12: Calculated G(𝑁𝑂3−) values and standard deviation of the gradient for systems with 50%
oxide (by volume) and water saturated air (no oxide) ................................................... 215

7131060
15
Table 8-13: Calculated G(𝑁𝑂3−) values and standard deviation of the gradient for systems with 90%
oxide (by volume) and water saturated air (no oxide) ................................................... 216
Table 8-14: Calculated G(𝑁𝑂3−) values and standard deviation of the gradient for systems with 1 g,
50% and 90% (by volume) 𝐶𝑒𝑂2 and water saturated air (no oxide) ............................ 218
Table 8-15: Calculated G(𝑁𝑂3−) values and standard deviation of the gradient for systems with 1 g,
50% and 90% (by volume) 𝑍𝑟𝑂2 and water saturated air (no oxide) ............................ 219
Table 8-16: Calculated G(𝑁𝑂3−) values and standard deviation of the gradient for systems containing
1 g, 50% and 90% (by volume) sintered 𝐶𝑒𝑂2 and water saturated air (no oxide) ........ 237
Table 8-17: Comparison between calculated G(𝑁𝑂3−) for samples containing either regenerated 𝐶𝑒𝑂2
or sintered 𝐶𝑒𝑂2 and water saturated air (no oxide) ..................................................... 239

7131060
16
Abbreviations and Acronyms
AGR - Advanced Gas-Cooled Reactor
B.E.T. - Brunauer – Emmett – Teller Theory
DCF - Dalton Cumbrian Facility
DRIFT - Diffuse Reflectance Infrared Fourier Transform Spectroscopy
ECD - Electrochemical Detector
EDS - Energy Dispersive X-ray Spectroscopy
G (±X) - yield of change (units: molecules 100 eV-1)
G.C. - Gas Chromatography
Gray - SI unit of ionising radiation dose (units: J kg-1)
I.C. - Ion Chromatography
LANL - Los Alamos National Laboratory
L.E.T. - Linear Energy Transfer
Magnox - Magnesium Non-Oxidising Fuel
MOX - Mixed Oxide Fuel
NNL - National Nuclear Laboratory
PUREX - Plutonium and Uranium Recovery by Extraction
SEM - Scanning Electron Microscopy
SSA - Specific Surface Area
TCD - Thermal Conductivity Detector
TGA - Thermogravimetric Analysis
THORP - Thermal Oxide Reprocessing Plant
TORVIS - Toroidal Volume Ion Source
UHV - Ultra-high vacuum

7131060
17
Abstract
The University of Manchester Luke Jones
Thesis submitted for the degree of Doctor of Philosophy
The Radiation Chemistry of Gases at the Interface with Ceramic Oxides
October 2015
As of 2011, the UK had 112 tonnes (t) of plutonium dioxide (𝑃𝑢𝑂2) in interim storage at the Sellafield site and this is increasing by approximately 5 t per annum with the continued reprocessing of spent nuclear fuel. 𝑃𝑢𝑂2 is stored in small quantities in a sealed multi-canister system for security and ease of handling. During long term storage, radiolysis of the gas phase and adsorbed species could potentially lead to canister pressurisation and/or failure. It is of great importance to understand the mechanisms occurring in the gas phase and to understand the resulting gas phase composition after decades of storage.
This research investigates the radiation chemistry of two gas phase systems in the presence or absence of inactive 𝑃𝑢𝑂2 surrogate material (namely cerium dioxide (𝐶𝑒𝑂2 ) and zirconium dioxide (𝑍𝑟𝑂2)).
The systems of interest are, firstly, radiolysis of hydrogen (𝐻2), oxygen (𝑂2) and argon gas mixtures utilising both 60𝐶𝑜 gamma rays and 𝐻𝑒2+ accelerated ions. Depletion of 𝐻2 and 𝑂2 has been investigated using gas chromatography. A bespoke manifold has been designed to mix these gases in various ratios, suitable reaction vessels and a subsequent sampling system has been developed to undertake this research. The rate of 𝐻2 depletion is independent of initial 𝐻2 concentration and radiation type. In the presence of an oxide surface, the rate of 𝐻2 depletion is vastly increased when compared to homogeneous studies using 60𝐶𝑜 gamma rays. Depletion is greatest in the presence of 𝑍𝑟𝑂2. In all systems, depletion of 𝐻2 is linear with increasing absorbed dose.
The second system of interest is the radiolysis of moist air utilising 60𝐶𝑜 gamma rays. Formation of nitric acid (𝐻𝑁𝑂3) has been investigated using ion chromatography to determine nitrate (𝑁𝑂3
−) anion production. Nitrate production increases linearly with absorbed dose and is greater in the presence of an oxide powder. The rate of production increases with increasing mass of oxide. Oxalate (𝐶2𝑂4
2−) was produced radiolytically from dimerisation of carbon dioxide and was greatest in the presence of 𝑍𝑟𝑂2. Reducing the specific surface area of 𝐶𝑒𝑂2 reduced the concentration of nitrate formed when compared to higher surface area 𝐶𝑒𝑂2.

7131060
18
Declaration
No portion of the work referred to in the thesis has been submitted in support of an
application for another degree or qualification of this or any other university or other
institute of learning
………………………………………..
Luke Jones November 2015

7131060
19
Copyright Statement
The author of this thesis (including any appendices and/or schedules to this thesis) owns
certain copyright or related rights in it (the “Copyright”) and he has given The University of
Manchester certain rights to use such Copyright, including for administrative purposes.
Copies of this thesis, either in full or in extracts and whether in hard or electronic copy, may
be made only in accordance with the Copyright, Designs and Patents Act 1988 (as amended)
and regulations issued under it or, where appropriate, in accordance with licensing
agreements which the University has from time to time. This page must form part of any
such copies made.
The ownership of certain Copyright, patents, designs, trademarks and other intellectual
property (the “Intellectual Property”) and any reproductions of copyright works in the
thesis, for example graphs and tables (“Reproductions”), which may be described in this
thesis, may not be owned by the author and may be owned by third parties. Such
Intellectual Property and Reproductions cannot and must not be made available for use
without the prior written permission of the owner(s) of the relevant Intellectual Property
and/or Reproductions.
Further information on the conditions under which disclosure, publication and
commercialisation of this thesis, the Copyright and any Intellectual Property and/or
Reproductions described in it may take place is available in the University IP Policy (see
http://documents.manchester.ac.uk/DocuInfo.aspx?DocID=487), in any relevant Thesis
restriction declarations deposited in the University Library, The University Library’s
regulations (see http://www.manchester.ac.uk/library/aboutus/regulations) and in The
University’s policy on Presentation of Theses

7131060
20
Acknowledgements
There are many people I would like to thank for their input throughout the course of this
research.
Firstly, I would like to thank Professor Simon M. Pimblott for selecting me to undertake this
research. I am grateful for his supervision and input and advice with regards to literature
components and experimental suggestions.
Thanks to the EPSRC and Sellafield Sites Ltd. for providing funding for this research.
My gratitude’s go to Martin Jennings from the School of Chemistry and Alastair Bewsher
from the School of Earth, Atmospheric and Environmental Sciences for undertaking
thermogravimetric analysis and ion chromatography troubleshooting respectively.
I would like to acknowledge Dr Sven Koehler for helping me with the design of the bespoke
gas mixing manifold and other bespoke experimental equipment. His insight into surface
and gas phase chemistry was much appreciated. Also for his non-related bicycle knowledge.
Thanks to Paul Cook and Jeff Hobbs (both of Sellafield Sites Ltd.) for their advice and being
useful sources of reference, and for putting this research into context.
I am extremely grateful to both Howard E. Sims and Robin M. Orr (both of National Nuclear
Laboratory) for their pseudo-supervision and source of encouragement throughout this
research. They have both given an almighty amount of time and effort to enhance this
project and ensured momentum was maintained. Howard, for his never-ending knowledge
of radiation chemistry and his in-depth mechanistic discussions and Robin, for his steel
trap-esque data analysis and his help with gas chromatography and experimental advice.
I would like to thank all the staff and researchers at the Dalton Cumbrian Facility for making
it an enjoyable (and sometimes challenging) place to work. In particular I would like to thank
fellow researchers Logan Barr, Gregory Horne and Rhiannon Monckton (the fellow trolls) for
helping me maintain my sanity and providing an atmosphere for my sense of humour to
flourish, to help stave off cabin fever during the first year of this project and finally, for their
scientific discussions on anything radiation related.

7131060
21
My largest thanks go to Jan, Dave and Adam (a.k.a. mum, dad and big brother) for their help
in making the transition from Oldham to West Cumbria as smooth as possible, for always
being at the end of the telephone to offer reassurance and advice and mostly just for being
themselves.
Finally (and by no means least) to my partner Rebecca, for putting up with my occasional
moods and sarcastic nature, for always being there and offering a sympathetic ear to my
random nonsensical rants, for proof-reading all of my reports and for always being able to
put a smile on my face.
Throughout the highs and lows of this research, many people have reassured me with the
phrase ‘it builds character’ and in a way, they have all been right.
“Most people say that it is intellect which makes a great scientist. They are wrong: it is character.”
- Albert Einstein 1879-1955 German-born theoretical physicist

7131060
22
The Author
The author graduated from the University of Manchester in 2011 with an MChem. (Hons)
degree in Chemistry with Industrial Experience. He spent the third year of his degree course
as an industrial placement student at AMEC Power and Process Europe (name has
subsequently changed) based at Birchwood, Warrington as part of the Waste Processing
Technology team. This placement included working on projects for several customers
including Dounreay Site Restoration Limited (DSRL) and Sellafield Sites Ltd. He spent the
final year of his degree undertaking a research project in the Centre for Nanoporous
Materials investigating the synthesis conditions on the crystal morphology of zeolite T.
In September 2011, he joined the Radiation Science research group under the supervision of
Professor Simon Pimblott at the brand new Dalton Cumbrian Facility as a PhD researcher to
investigate the radiation chemistry of gaseous systems at the interface with ceramic oxides.

7131060
23
Thesis Structure
Chapter One outlines the challenge this project hopes to address and gives background
information to put this research into context. It concludes with a basic introduction to
radiation chemistry and how ionising radiation interacts with matter.
Chapter Two reviews the literature relevant to this research. It highlights gaps in the
knowledge base that this research hopes to contribute to. Finally, it outlines the aims and
objectives of this project.
Chapter Three highlights the facilities and experimental equipment utilised to undertake this
research. It details the materials necessary to carry out this project and details the
experimental methods employed to execute this research project.
Chapter Four details the development undertaken in designing a reaction vessel suitable to
implement part of this research. It also details the development in analysis techniques to
complement the evolving reaction vessel.
Chapter Five introduces the concept of dosimetry and the challenges this provides with
regards to this research. Relevant literature is reviewed to provide information on how
these challenges are addressed in other systems and concludes with how dosimetry is
undertaken in the different systems of interest to this research.
Chapter Six details the physical properties of the solid materials utilised throughout the
course of this research.
Chapter Seven details the results pertaining to hydrogen-oxygen radiolysis in homogeneous
and heterogeneous systems. These results are discussed and hypotheses given throughout
the chapter. Finally preliminary results using accelerated ions are detailed and discussed.

7131060
24
Chapter Eight details the results from air radiolysis experiments. These results are analysed
and discussed throughout the chapter.
Chapter Nine pulls together the conclusions drawn from the results detailed in Chapters
Seven and Eight and places these results in the context of the research.
Chapter Ten recommends further experiments that can be undertaken to develop this
research further and answer the questions that have been posed as a result of this research
project.
Chapter Eleven is a bibliography of all the literature sources used throughout this thesis as a
source of information and reference.

Chapter 1 Introduction 7131060
25
1 Introduction
This chapter gives context to this research, to outline the challenges this research hopes to
address and the information it aims to contribute to. It also provides an introduction to
radiation chemistry including sources of radiation and how radiation interacts with matter,
forming radiolytic tracks.
The Challenge
There is currently ~120 t of plutonium dioxide (𝑃𝑢𝑂2) in storage at the Sellafield site inside
sealed metal canisters. Some of this plutonium stockpile has been in storage for several
decades, and will continue to be stored for several more. Whilst in storage, these canisters
are dynamic systems, with the overlying gas phase undergoing irradiation from plutonium as
it radioactively decays. The centre-line temperature of the majority of these canisters can be
several hundred °C. During long term storage, it is possible that some of these canisters may
pressurise and could potentially fail. Due to the quantity and contents of the canisters, it is
difficult to monitor each canister for possible swelling and/ or failure. There is also minimal
knowledge of the composition of the gas phase as a function of time during the long term
storage of this plutonium stockpile.
This research aims to investigate the gas phase radiation chemistry of two gaseous systems
of interest at the interface of a 𝑃𝑢𝑂2 surrogate material.
This research aims to deliver a better mechanistic understanding of the gas phase radiation
chemistry in contact with an oxide powder.
It also hopes to aid the safety case for long term storage of 𝑃𝑢𝑂2.

Chapter 1 Introduction 7131060
26
1.1 Background
The UK currently has the largest stockpile of civil separated plutonium in the world.
Plutonium is a by-product of using uranium metal and uranium oxide (𝑈𝑂2), as fuel in
nuclear reactors. The spent fuel from the reactor contains approximately 96% uranium and
1% plutonium by weight [1], whilst the remainder is made up of highly radioactive fission
products and minor actinides. It is possible to reuse the spent uranium as new reactor fuel,
however, it must be separated from the fission products and minor actinides first. This
recycling is achieved by reprocessing the spent fuel. Recycling of the uranium allows more
energy to be generated without the use of new supplies, leading to a more sustainable
energy source. In addition, separating uranium from the spent fuel, reduces the volume of
waste generated significantly. Separation of the highly radioactive fission products from the
spent fuel allows for them to be treated separately before going to disposal. The plutonium
generated in spent fuel can also be used as a reactor fuel by blending plutonium dioxide
(𝑃𝑢𝑂2) with 𝑈𝑂2 in ratios of 7:93 to create a mixed oxide fuel (MOX). This approach leads to
further energy generation from a single batch of reactor fuel [1].
At present, most nuclear reactors that utilise uranium fuels are allowed a maximum of 33%
loading of MOX fuel in the core due to safety concerns [2]. A different type of nuclear
reactor (termed ‘fast’ reactor) can utilise plutonium on its own as a fuel type, however,
there are no operational commercial ‘fast’ reactors in the world at this moment in time and
construction is unlikely to begin until the 2040s. These facts, along with continued
reprocessing of spent fuel leads to large inventories of 𝑃𝑢𝑂2 stored around the world.
As of 2011, the UK currently had 112 t of civil separated plutonium in storage [3], the
majority of which is stored at the Sellafield site as 𝑃𝑢𝑂2 powder. There are two product

Chapter 1 Introduction 7131060
27
streams at Sellafield by which this powder is formed. Magnox 𝑃𝑢𝑂2 is obtained from spent
fuel from Magnesium non-oxidising (Magnox) reactors which used uranium metal, while
𝑃𝑢𝑂2 product from the THermal Oxide Reprocessing Plant (THORP) is obtained from spent
fuel from Advanced Gas-Cooled (AGR) reactors which use 𝑈𝑂2 as the fuel type.
To separate the uranium and plutonium from the fission products and minor actinides, the
Plutonium and Uranium Recovery by EXtraction (PUREX) process is employed. This process
has been used globally for several decades as a means of reprocessing spent fuel. The spent
fuel is first dissolved in nitric acid (𝐻𝑁𝑂3) before using an organic ligand, tri-butyl phosphate
(𝑇𝐵𝑃) and odourless kerosene (𝑂𝐾) to separate the dissolved species based on their
relative solubility in the organic and aqueous phases [4]. This PUREX process is highly
specific for uranium and plutonium and allows over 99% recovery of these species. Control
of the 𝐻𝑁𝑂3 concentration allows separation of uranium from plutonium due to their
differing redox chemistry. Once separated, each component is put through an individual
purification cycle to generate an oxide material. There are several steps involved in each
purification cycle which will not be covered in detail here. The main process involved in the
plutonium purification cycle is the reaction of the dissolved plutonium species with oxalic
acid (𝐻2𝐶2𝑂4) to form a plutonium oxalate (𝑃𝑢(𝐶2𝑂4)2. 6𝐻2𝑂) precipitate. The oxalate
derivative is then washed and thermally decomposed in an oxygen (𝑂2) environment to
produce the finished oxide product (Reaction 1.1):
3𝑃𝑢(𝐶2𝑂4)2. 6𝐻2𝑂 + 𝑂2 → 3𝑃𝑢𝑂2 + 8𝐶𝑂2 + 4𝐶𝑂 + 8𝐻2𝑂 Reaction 1.1

Chapter 1 Introduction 7131060
28
After the oxalate decomposition step (Reaction 1.1), the oxide powder is calcined at higher
temperatures to remove adsorbed volatiles and moisture. The moisture content is required
to be less than 0.5 wt.% before the product can go into storage, in accordance with the
United States Department of Energy standard [5]. The temperature at which the 𝑃𝑢𝑂2
product is calcined can have an effect on the physical properties of the powder. One such
property is the surface area of the finished product. Figure 1.1 shows how increasing the
calcination temperature reduces the surface area as the powder starts to sinter and loses
any porosity.
Figure 1.1: 𝑃𝑢𝑂2 surface area as a function of calcination temperature (derived from [6])
Higher calcination temperatures remove more of the adsorbed species and reduce the
quantity of residual carbon from the oxalate. In the United States, 𝑃𝑢𝑂2 is calcined in an
oxidising atmosphere at 950 °C for a minimum of two hours before being stored. The trade-
off is that lower surface area reduces the efficiency of potential MOX fuel. There is little
open source information on the calcination conditions used for 𝑃𝑢𝑂2 produced in the UK,
however, the calcination temperature employed is thought to be nearer to 600 °C.
0.0
2.0
4.0
6.0
8.0
10.0
12.0
14.0
400 600 800 1000 1200
B.E
.T. S
urf
ace
Are
a /
m2 g
-1
Calcination temperature / oC

Chapter 1 Introduction 7131060
29
The calcination temperature can also affect the morphology of the resulting 𝑃𝑢𝑂2 grains.
Machuron-Mandard and Madic [6] discovered two distinct morphologies of 𝑃𝑢𝑂2 grains.
One is a smooth grain shape corresponding to a truncated octahedra, which is consistent
with a cubic crystal structure. The second structure is less defined with a rough surface.
With increasing calcination temperature, the quantity of the octahedral grains increases.
However it is dependent on the synthesis procedure. Figure 1.2 shows electron micrographs
of 𝑃𝑢𝑂2 currently in storage in the UK [7, 8].
Figure 1.2: SEM images of 𝑃𝑢𝑂2 stored at the Sellafield site
The image on the left shows the truncated octahedra crystal morphology typical of the
fluorite structured oxides. The image on the right shows a more agglomerated structure
with flat platelet type crystals. The 𝑃𝑢𝑂2 products from the two streams at Sellafield have
both types of crystal morphology.
After calcination, the 𝑃𝑢𝑂2 product is packaged in multi-can containers. In the UK there are
two designs. Magnox 𝑃𝑢𝑂2 is packaged in a screw top aluminium can, placed inside a
polyethylene bag and welded into a stainless steel outer can. The atmosphere inside the can
is a 50:50 mix of argon and air. 𝑃𝑢𝑂2 from the THORP product line is packaged in a stainless
steel three can system with a pure argon atmosphere [7, 9]. Figure 1.3 illustrates the cans

Chapter 1 Introduction 7131060
30
used to package THORP 𝑃𝑢𝑂2 product. Only small quantities (< 1 kg) of 𝑃𝑢𝑂2 are packaged
in each can for ease of handling and to avoid criticality.
Figure 1.3: Stainless steel three can system used to package THORP 𝑃𝑢𝑂2
There has been growing national and international pressure to determine a long term
management strategy for the UK’s plutonium stockpile. At the highest level, there are three
credible options [10]:
long term storage in a time bound manner;
immobilisation and disposal as waste; and
re-use as reactor fuel followed by management of spent fuel and subsequent
disposal.
The default option is long term storage, with the Sellafield site plan suggesting the material
will be stored until the site end point in 2120. The continued storage of plutonium materials
will require new stores and infrastructure to be built at a substantial cost.
Prolonged storage of plutonium, results in the gradual conversion into different isotopes as
the isotopes move along their natural radioactive decay sequence. Plutonium-241 (241𝑃𝑢),
may be present in the stored material, which undergoes β-decay to americium-241 (241𝐴𝑚),

Chapter 1 Introduction 7131060
31
which is an α-emitter and also emits γ-rays. The half-life of 241𝑃𝑢 is fourteen years, therefore
prolonged storage leads to a significant in-growth of 241𝐴𝑚. The presence of this isotope
creates significant challenges in storage of this material and also leads to other options
becoming harder to execute.
There are several options for immobilisation of the plutonium stockpile, these being:
encapsulation in cement, vitrification in glass or immobilisation in a ceramic matrix. There
are concerns, however, about the maturity of the technologies; about the possibility of
extracting the plutonium material at a later date; and about the environmental impact of
disposing of 120 t of plutonium.
Conversion of the stockpile into MOX fuel for use in thermal reactors or conversion to fuel
to be utilised in fast reactors has many advantages, including power generation and good
proliferation resistance. Considerable research and development into the use of plutonium
fuels in next generation reactors such as fast and high temperature reactors [10] is being
undertaken in France, however, this option comes with the substantial financial costs of
building fabrication plants, new reactors, and waste remediation facilities and supporting
infrastructure.
Whichever option is to be selected in the future by the UK government, all require opening
of the multi-can system in Figure 1.3. Whilst in storage, the cans are a dynamic system.
𝑃𝑢𝑂2 and its radioactive daughters undergo decay and generate heat. This environment will
potentially lead to chemistry occurring with the overlying headspace and any adsorbed
species on the oxide surface. A number of processes may occur which could lead to
pressurisation of the cans and possible can failure. Therefore an understanding of the
radiation chemistry of the gas phase in the presence of an oxide surface is of importance.

Chapter 1 Introduction 7131060
32
1.2 Radiation Chemistry
The following section outlines the sources of ionising radiation, how these interact with
matter and, finally, how this interaction leads to radiation induced chemistry.
1.2.1 Sources of Radiation
Radiation is a process by which energetic particles or photons travel through a medium. It is
generally split into two types: ionising and non-ionising. Non-ionising radiation has either no
mechanism to transfer energy to the electrons of the material or insufficient energy to
ionise matter and instead, on interaction with an atom or molecule, may cause excitation
within it leading to processes such as luminescence, dissociation, etc... Examples of non-
ionising radiation include visible light, infra-red and microwaves. This type of radiation is not
utilised in this research. Ionising radiation is radiation that does have enough energy to
ionise a given species. This is mostly done by ejection of an electron out of a valence shell
to produce a positively charged ion and an energetic electron. Ionising radiation can also
lead to excitation when interacting with matter.
Radiation chemistry is the study of chemical and physical effects that are produced when a
material is exposed to high energy, ionising radiation. There are two sources of ionising
radiation, firstly, natural or artificial radioactive isotopes and, secondly, those that rely on a
form of particle accelerator.
Radioactive isotopes: These are unstable elements that undergo decay emitting particles
and/or photons. Radioactive decay is a spontaneous nuclear transformation that is
unaffected by pressure, temperature and chemical form of the decaying species. This allows
radioactive decay to be characterized by the decay period and the mode and energy of the
decay [11].

Chapter 1 Introduction 7131060
33
Half-life: The decay period is expressed as a half-life (symbol 𝑡12). The half life is the time
required for half of the radioactive atoms in a sample to undergo decay. Half-lives can range
from less than a second to 1x10¹⁹ years.
α- decay: An α particle is a helium atom that has been stripped of both electrons and is
denoted by 𝐻𝑒2+24 . Alpha decay is observed naturally for elements heavier than lead and
certain lanthanides. Alpha particles are emitted by nuclei with discrete energies that are
characteristic of the decaying nuclei, meaning different α emitters are easy to distinguish by
alpha spectroscopy. Alpha particles usually have energies in the range of 4-9 MeV, with α-
decay from 239𝑃𝑢 having energy of 5.593 MeV. The energy of α decay is split between the
daughter nuclide and the α particle. The majority of which goes to the lighter α particle.
β- decay: Beta decay is any one of three processes: negatron emission, positron emission and
electron capture. Beta particles are fast moving electrons or positrons that don’t have
discrete energies. Their energy ranges from zero to a maximum energy, (denoted 𝐸𝛽), that is
characteristic of the decaying element. The value of 𝐸𝛽 determines the greatest range the
particle will have in a given medium.
Negatron decay is characteristic of lighter, neutron rich nuclei such as tritium ( 𝐻13 ). At the
atomic level, a neutron is transformed into a proton with the emission of a negatron
(electron).
Positron decay occurs for low and medium mass, neutron poor nuclei. At the atomic level, a
proton is transformed into a neutron with the emission of a positron.
Along with positron and negatron emission, another particle is emitted; this is the neutrino
(symbol ν). It has zero mass and charge, but does have spin and energy. The neutrino is

Chapter 1 Introduction 7131060
34
emitted alongside positron decay and the anti-neutrino (symbol 𝜐) is emitted alongside
negatron decay.
Another process of β decay that does not involve the emission of a negatron or positron is
electron capture. In this intra-molecular transformation process, a proton and an atomic
electron are transformed into a neutron.
γ- decay: Isotopes that undergo gamma decay emit electro-magnetic radiation with energies
ranging between 40 keV to 4 MeV. The electro-magnetic radiation reflects the transition
between energy levels of the same nucleus. Gamma rays either have monoenergetic
energies or a small number of discrete energies that are characteristic of the decaying
nucleus.
Gamma decay occurs alongside other types of radioactive decay (either α or β). When a
parent nucleus undergoes α or β decay, the daughter nuclide may be in an excited state. It
then loses this excess energy by emitting one or several γ-rays.
The second source of ionising radiation employs particle accelerators. These produce a
focused beam of accelerated electrons or positive particles with energies usually ranging
from keV to MeV. The most commonly used positive particles are protons, deuterons and
helium ions, but heavier ions can be produced if needed. More detail of the ion accelerator
at the Dalton Cumbrian Facility (DCF) will be given in Chapter Three.

Chapter 1 Introduction 7131060
35
1.2.2 Radiation Interactions with Matter
α-particles: Alpha particles predominantly lose their energy by inelastic collisions with
electrons of the medium in their path. Some of the kinetic energy of the α particle is
transferred to the electron in an excitation event. However, due to the alpha particles
heavier mass when compared to an electron, only a small fraction of its energy is transferred
to the electron, thus only slight deflection occurs.
The maximum energy transferred from the alpha particle to the electron can be calculated
using the conservation of both energy and momentum and is given by Equation 1.1 [12]:
𝑄𝑚𝑎𝑥 = [4𝑚𝑀
(𝑚+𝑀)2] 𝐸 Equation 1.1
𝐸 = 1
2𝑀𝑉2 Equation 1.2
where 𝑀 and 𝑉 are the mass and velocity of the incident alpha particle and 𝑚 is the mass of
the electron.
Alpha particles only have a small penetration in liquids and solids (a few µm) before losing
the majority of their energy. In addition, as their mass is much larger than the electron there
is little deflection of the alpha particle when it collides with electrons. Its track through a
medium is fairly straight, creating a column of excited and ionised species.
β-particles: Like alpha particles, β particles lose their energy predominantly by inelastic
collisions with electrons. As their mass is equivalent to the electrons of the material, a β
particle can lose all of its energy in a single collision and can be deflected by a large angle. It
is difficult to differentiate between an incoming and the ejected electron, so the maximum
energy transfer in this case is half the kinetic energy of the incident electron. Deflection may

Chapter 1 Introduction 7131060
36
also occur when a β particle passes close to an atomic nucleus. As a result of these
deflections, β particles with the same initial energy can have different ranges in a medium,
however, there will be a maximum distance of penetration. As a consequence of these
deflections, the path length travelled by the β particle will be far greater than the
penetration into a medium (Figure 1.4):
Figure 1.4: Comparison of path length and penetration for a β particle
The relative importance of Bremsstrahlung, inelastic and elastic collisions depends heavily
on the energy of the incident particle and the nature of the absorbing material.
Bremsstrahlung (breaking radiation) occurs when an electron passes close to an atomic
nucleus and is decelerated, thus changing direction. With this change in velocity there is a
decrease in energy of the particle. The lost energy is emitted as an X-ray (Figure 1.5):

Chapter 1 Introduction 7131060
37
Figure 1.5: Emission of Bremsstrahlung
This process is favoured for high energy electrons and high atomic number, (Z), stopping
materials. The emitted X-ray has an energy range from near zero to the energy of the
incident electron and is equal to the energy lost by the particle as it is decelerated. The X-ray
does not produce excitation or ionisation unless it subsequently interacts with the medium.
If the initial electron energy is below 100 keV, then Bremsstrahlung emission is negligible.
Lower energy electrons (such as negatrons) lose their energy predominantly by inelastic
collisions with the medium and may also undergo elastic scattering, where they are
deflected by the Coulomb field of the atomic nucleus. Eventually they will be absorbed by
the medium.
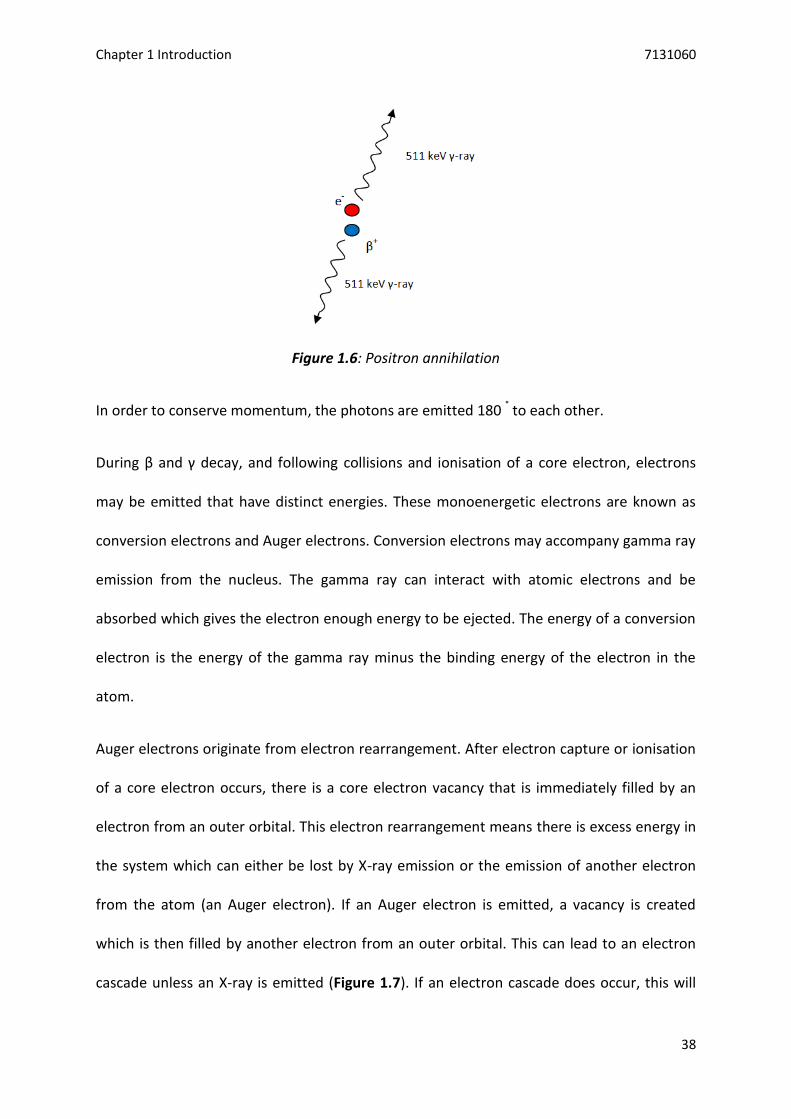
The positron is an antiparticle of an electron and is short lived; undergoing positron
annihilation (Figure 1.6). During annihilation, two electron masses are converted to
electromagnetic radiation. The kinetic energy of the particles is near zero and so the total
energy of the annihilation process is 1.02 MeV. This value is two times the value of the
equivalent electron mass (511 keV):
Chapter 1 Introduction 7131060
38
Figure 1.6: Positron annihilation
In order to conserve momentum, the photons are emitted 180 ° to each other.
During β and γ decay, and following collisions and ionisation of a core electron, electrons
may be emitted that have distinct energies. These monoenergetic electrons are known as
conversion electrons and Auger electrons. Conversion electrons may accompany gamma ray
emission from the nucleus. The gamma ray can interact with atomic electrons and be
absorbed which gives the electron enough energy to be ejected. The energy of a conversion
electron is the energy of the gamma ray minus the binding energy of the electron in the
atom.
Auger electrons originate from electron rearrangement. After electron capture or ionisation
of a core electron occurs, there is a core electron vacancy that is immediately filled by an
electron from an outer orbital. This electron rearrangement means there is excess energy in
the system which can either be lost by X-ray emission or the emission of another electron
from the atom (an Auger electron). If an Auger electron is emitted, a vacancy is created
which is then filled by another electron from an outer orbital. This can lead to an electron
cascade unless an X-ray is emitted (Figure 1.7). If an electron cascade does occur, this will

Chapter 1 Introduction 7131060
39
lead to a highly charged species which will eventually capture electrons from the
surroundings to create a stable species.
Figure 1.7: Overview of Auger electron emission
Electromagnetic Radiation
There are 4 main processes by which γ-rays interact with matter:
coherent (Rayleigh) scattering;
photoelectric effect;
Compton scattering; and
pair production
The latter three are the most important in radiation chemistry and depend greatly on the
photon energy and the atomic number of the stopping material as is shown in Figure 1.8:

Chapter 1 Introduction 7131060
40
Figure 1.8: γ-ray interaction processes and their dependence on photon energy and Z of medium (replicated from [13])
Photons can scatter with little loss of energy when they are absorbed and re-emitted by
atomic electrons; this is coherent scattering and is most likely to take place when the
photons have low energies (< 0.1 MeV) and high atomic number materials. It occurs when
the probability for the photoelectric effect to take place is large. It is often neglected
because the small angle of scatter makes these photons hard to differentiate from the main
beam of photons unless a narrow beam is used.
Photoelectric effect: This is predominant for low energy photons. The process involves the
entire energy of an incident photon (𝐸𝑜) being transferred to a single atomic electron which
is then ejected from the atom with energy (𝐸𝐸) equal to the difference between the incident
energy and the binding energy of the electron in the atom (𝐸𝑆).
At lower photon energies, the electron is ejected close to 90 ° from the incident beam. As
photon energy increases, the ejection angle gets smaller and the electron is ejected in the
same direction as the beam (Figure 1.9):
0
20
40
60
80
100
120
0.01 0.1 1 10 100
Z o
f m
ediu
m
hν / MeV
photoelectric effect
Compton effect
pair production

Chapter 1 Introduction 7131060
41
i) ii)
Figure 1.9: The photoelectric effect at i) low photon energies and ii) high photon energies
Energy and momentum are conserved by recoil of the remaining atom.
Compton scattering: This occurs when a photon is scattered by interaction with an electron.
This interaction leads to the acceleration of the electron and scattering of the photon with
less energy. The energy and momentum of the incident photon is shared between the
scattered photon and the recoiling electron (Figure 1.10):
Figure 1.10: Compton scattering
The more the photon is scattered (i.e. greater θ value), the larger the amount of energy
transferred to the electron. The energy of the recoil electron is equal to the incident photon
energy minus the energy of the scattered photon.
Θ

Chapter 1 Introduction 7131060
42
The energy of the recoiling electron has a range from zero to a maximum which can be
calculated by assuming the photon scatter angle is 180 ° (i.e. photon rebounds off the
electron). The most probable values for 𝐸𝐸 are those near zero or the maximum energies
(maximum energy is favoured if 𝐸𝑜 is high). The direction of the recoil electron follows the
initial incident photon path when more of the energy is transferred from the photon to the
electron.
Pair production: This occurs when a photon is completely absorbed in the vicinity of an
atomic nucleus (or less frequently, an electron). This absorption produces two particles: an
electron and a positron. The energy of the photon is shared between the kinetic energy of
the electron and positron minus the rest energy of the two particles (both equivalent,
therefore both 𝑚𝑒𝑐2). A small almost negligible amount of energy is transferred to the
nucleus. The momentum is shared by the recoiling nucleus and the emitted particles. The
positron is slowed down similar to an electron and eventually undergoes positron
annihilation (Figure 1.6). The overall process is shown in Figure 1.11:

Chapter 1 Introduction 7131060
43
Figure 1.11: Pair production followed by positron annihilation
Pair production can only occur if the incident photon has greater energy than 1.02 MeV (the
rest mass of the two particles).
Another process that occurs with photons is photonuclear reactions. This process requires
very high energy photons which are not utilised as part of this research
Electromagnetic radiation can lose relatively large amounts of its energy in a few
interactions with matter, however, only a fraction of γ-rays are absorbed by the medium
with the rest being transmitted through with the same incident energy. The total linear
attenuation coefficient is given by Equation 1.3:
𝜇 = 𝜏 + 𝜎 + 𝜅 Equation 1.3
where 𝜏, 𝜎 and 𝜅 are the linear attenuation coefficients (in cm-1) for the photoelectric,
Compton and pair production processes respectively. Their values are constant for a given
photon energy and a given stopping material [12].
A further type of radiation that may occur in radioactive systems is neutron radiation. These
are not utilised in this research, therefore are not detailed in this thesis.
Chapter 1 Introduction 7131060
44
1.2.3 Radiolytic Track Formation
When a charged particle or photon interacts with matter, it gives rise to a track of ionised
and excited species. The nature of the species will be identical for a given medium
irrespective of the type of radiation utilised. Different types of radiation lose energy at
different rates. The concentration of the ionised and excited species will differ and the
length of the track will differ. This non-homogeneous concentration profile in turn leads to a
difference in observed chemical effects for differing types of radiation, especially for liquid
and solid media. For example, 𝐻2 production from the radiolysis of an aqueous solution
containing potassium nitrate (𝐾𝑁𝑂3) and nitrous oxide (𝑁𝑂), is two and a half times greater
using 12 MeV 𝐻𝑒2+ ions compared to 60𝐶𝑜 γ-rays [14]. In gaseous media, where the density
is much lower, the effect is less prominent. The formation of ethane (𝐶2𝐻6) from radiolysis
of methane (𝐶𝐻4), is not greatly affected by using either γ-rays from spent fuel elements or
2.8 MeV electron beams [15, 16].
Along with the primary charged particle or photon, ejected electrons (termed secondary
electrons) may also cause ionisation and excitation within the medium. If the secondary
electron has less than 100 eV of energy, then its range will be short and lead to secondary
ionisation events close to the primary track and give rise to a cluster or ‘spur’ of
ionisation/excitation events. If the electrons have energies larger than 100 eV, however,
then their range increases and can lead to extended secondary tracks of ionised/excited
species. Figure 1.12 shows a comparison of track structure from an α particle and a fast
electron. These tracks only persist for a short period of time before dissipating in the
medium.

Chapter 1 Introduction 7131060
45
Figure 1.12: Radiolytic track structure of i) α particle and ii) fast electron
The amount of chemical change a medium undergoes when interacting with ionising
radiation depends both on the total energy of the radiation and the rate at which its energy
is deposited. The first factor will determine the yield of reactive species and the second
factor, their proximity. Linear Energy Transfer (LET) is a term used in radiation chemistry to
parameterise these factors. It is defined as the rate of energy loss by an ionising particle or
photon traversing a medium (Equation 1.4). The most common units are keV µm-1:
𝐿𝐸𝑇 = 𝑑𝐸
𝑑𝑙 Equation 1.4
where 𝑑𝐸 is the change in particle energy and 𝑑𝑙 is the path length of the particle.
Equation 1.4 does not take into consideration the fact that the rate of energy loss decreases
as the particle slows down and loses energy. Furthermore, it does not reflect the fact that
secondary ionisation/excitation events may take place away from the primary track. For a
given energy, photons and high energy electrons have the lowest LET due to the fact they
have a high penetration (𝑑𝑙) but deposit only a small quantity of energy. In contrast, α
i)
ii)

Chapter 1 Introduction 7131060
46
particles and fission fragments have the highest LET as they have low penetration and
deposit the majority of their energy in a single collision.
To denote yields in radiation chemistry, the term G-value is used throughout journals and
texts. It has the following symbol G(±𝑥) and represents the number of molecules of species
𝑥, either lost or produced in the system per 100 eV of energy deposited in the said system.

Chapter 2 Literature Review 7131060
47
2 Literature Review
This chapter gives a review of the work previously undertaken in this area of research. This
review includes the limited data available with respect to plutonium storage canisters and
possible mechanisms occurring inside during storage. Focus is given to one such mechanism;
the radiolysis of adsorbed moisture and subsequent gas phase radiation chemistry. With
respect to storage of plutonium-bearing materials in the UK, attention is given to the
radiolysis of air in the presence of an oxide surface. Finally, this chapter outlines the aims
and objectives this research hopes to achieve and how the knowledge base may be
enhanced.
2.1 𝑷𝒖𝑶𝟐 Storage Canisters
A substantial amount of work has been undertaken by the Los Alamos National Laboratory
(LANL) with regards to hazards associated with long term storage of 𝑃𝑢𝑂2. Eller et al. have
investigated the pressurisation of 𝑃𝑢𝑂2 storage canisters and have hypothesised four
possible mechanisms that could lead to pressurisation [17], these are:
thermal heating;
helium accumulation from radioactive decay;
radiolytic and chemical degradation; and
radiolysis of adsorbed moisture
The centre line temperature in 𝑃𝑢𝑂2 storage canisters can be several hundred °C, this can
lead to pressurisation of the gas phase. Eller et al. used a computer model to predict the
temperature of the gas phase from this centre-line temperature. The model predicted that

Chapter 2 Literature Review 7131060
48
the gas phase would increase in temperature from ambient to 211 °C once 𝑃𝑢𝑂2 had been
added to the canisters. This temperature increase would lead to an increase in pressure
from 14 psi to 23 psi. This mechanism was discounted, as this increase in pressure would be
visible after several weeks of storage.
The α-decay of plutonium could lead to helium accumulation inside the canisters. It was
predicted that the pressure inside the canister would increase by 13 psi over a period of 50
years of storage for a canister containing 5 kg of 𝑃𝑢𝑂2. However, this value is an over-
estimation as helium would be trapped in the solid matrix [18].
Chapter One outlined the finishing process for 𝑃𝑢𝑂2, which involved calcination at high
temperatures, this process would remove any organics from the product. No signs of
corrosion in the canisters further highlight the absence of organics.
The final mechanism discussed was that of radiolysis of adsorbed moisture. Before going
into storage the moisture content is kept below 0.5 wt.%. This quantity is insufficient to
generate significant pressurisation, however, it could lead to the formation of 𝐻2 and 𝑂2 gas
atmospheres.
A fifth mechanism was postulated by Paffett and Bailey [19] which is a pressure pulse from
the deflagration or detonation of a combustible atmosphere. This mechanism ties in with
the radiolysis of moisture outlined by Eller et al.
Mason et al. carried out headspace gas analysis of ten sealed 𝑃𝑢𝑂2 storage canisters that
had come from a range of sources with varying purities and had been stored for various
timescales (1-18 y) [20]. From these analyses, several observations were noted. Even though
the canisters were not airtight, eight of the canisters’ had an internal pressure that was less

Chapter 2 Literature Review 7131060
49
than the atmospheric pressure of the site where they had been stored. Analysis of the gas
phase indicated that the main component was air, with only two samples having significant
concentrations of 𝐻2. The final observation stated that canisters where 𝑂2 was present had
no 𝐻2 present and vice-versa.
Almond et al. performed gas analysis on over thirty containers of plutonium bearing
materials from the Hanford and Rocky Flats sites that had been stored for 4-6 y [21]. They
found that seven of the containers had more than 0.1 mol% 𝐻2 and very little 𝑂2 in the
resulting headspace. The other twenty four containers did not have a sizeable amount of 𝐻2
present although four of these containers had a moisture content of ≥ 0.1%, which is within
the range for anticipated 𝐻2 production.
From these references, it is clear that radiolysis of adsorbed moisture is the main
mechanism of pressurisation inside 𝑃𝑢𝑂2 storage containers. Therefore knowledge of how
this water adsorbs and the mechanisms leading to 𝐻2 and 𝑂2 generation are important.
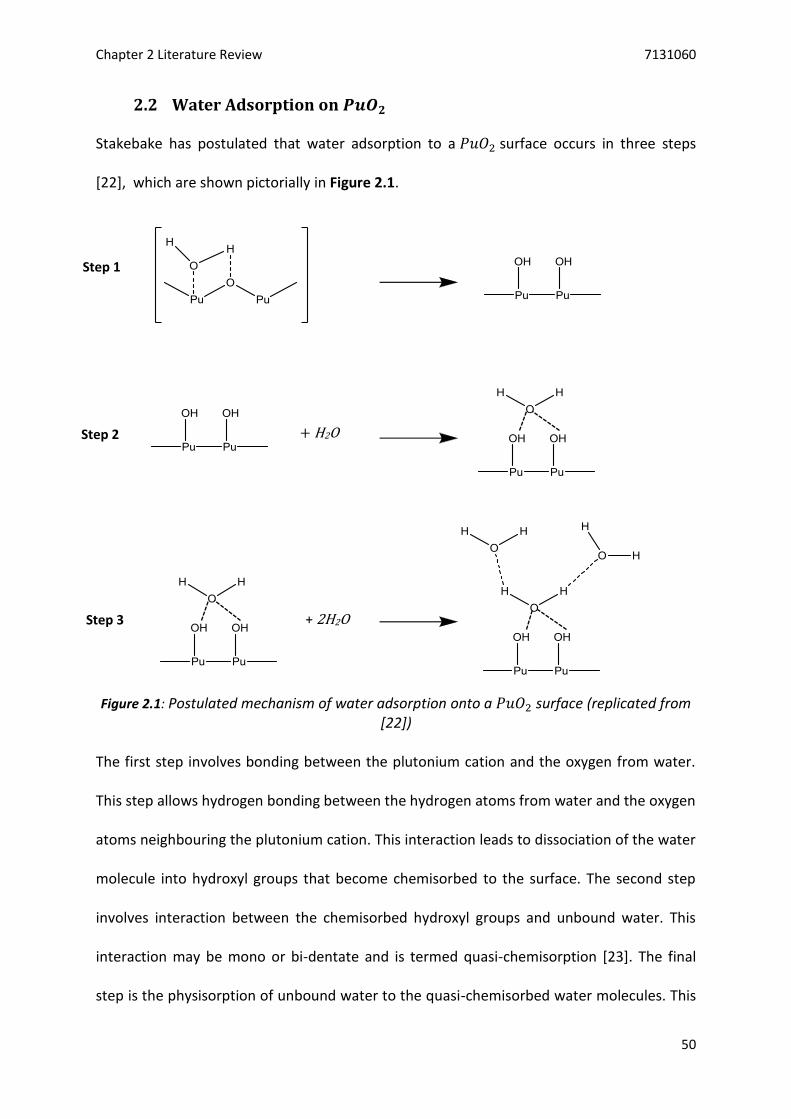
Chapter 2 Literature Review 7131060
50
2.2 Water Adsorption on 𝑷𝒖𝑶𝟐
Stakebake has postulated that water adsorption to a 𝑃𝑢𝑂2 surface occurs in three steps
[22], which are shown pictorially in Figure 2.1.
Figure 2.1: Postulated mechanism of water adsorption onto a 𝑃𝑢𝑂2 surface (replicated from [22])
The first step involves bonding between the plutonium cation and the oxygen from water.
This step allows hydrogen bonding between the hydrogen atoms from water and the oxygen
atoms neighbouring the plutonium cation. This interaction leads to dissociation of the water
molecule into hydroxyl groups that become chemisorbed to the surface. The second step
involves interaction between the chemisorbed hydroxyl groups and unbound water. This
interaction may be mono or bi-dentate and is termed quasi-chemisorption [23]. The final
step is the physisorption of unbound water to the quasi-chemisorbed water molecules. This
+ H2O
+ 2H2O
Step 1
Step 2
Step 3

Chapter 2 Literature Review 7131060
51
final adsorption is very weak as there is no formal bond between the adsorbate and the
surface. It is not known what effect (if any) the oxide surface plays in this final step.
During calcination, it is likely that only the chemisorbed water will remain attached to the
surface, unless very high temperatures are used.
Haschke and Ricketts [23] have determined the mass of this chemisorbed monolayer of
water on 𝑃𝑢𝑂2. They have determined values between 0.21-0.24 mg m-2 depending on the
crystal plane and assuming association of one water molecule to one plutonium atom.
Work by Alexandrov et al. showed that this mechanism was also true for thorium dioxide
(𝑇ℎ𝑂2) and cerium dioxide (𝐶𝑒𝑂2), which are often used as surrogates for 𝑃𝑢𝑂2 and heavy
actinide oxides [24].
From the mechanism outlined above, it is clear, that adsorbed species play a role in the
adsorption of further water molecules. This mechanism follows the BET theory of the
formation of multi-layers on a surface as opposed to the Langmuir theory that assumes
once a monolayer of molecules has been adsorbed there will be no further adsorption to
the surface as all the active sites have been filled.
2.3 Radiolysis of Adsorbed Water
Petrik et al. have investigated the γ-irradiation of adsorbed water on several metal oxides to
determine the quantity of 𝐻2 produced [25]. Their work classified oxides into three groups.
The first group had a lower yield (G-value) of 𝐻2 than radiolysis of liquid water (G(𝐻2) = 0.45
molecules 100 eV-1 [26]). The second group had G(𝐻2) values close to bulk water radiolysis
and the final group have a higher G(𝐻2) value than bulk water. It is postulated that the

Chapter 2 Literature Review 7131060
52
increase in 𝐻2 formation is due to an enhanced energy transfer between the oxide surface
and the adsorbed water. They highlighted a resonance between the band gap of the oxide
and the bond dissociation energy of water (5.15 eV [27]) The band gap is the energy needed
by electrons to move from the highest occupied band (valence band) to the lowest
unoccupied band (conduction band). Metal oxides that had a band gap or approximately
5 eV produced the greatest quantity of 𝐻2.
Aleksandrov et al. highlighted that physisorbed water and surface hydroxyls had a negligible
contribution to 𝐻2 yield during radiolysis of adsorbed water [28]. They found that the
energy adsorbed by the oxide was transferred entirely to the first layer of chemisorbed
water. They determined that the active layer of the oxide involved in the heterogeneous
system was no more than 100 nm thick.
LaVerne and Tandon investigated 𝐻2 production from 𝐶𝑒𝑂2 and 𝑍𝑟𝑂2 using cobalt-60
gamma rays [29] and determined that 𝐻2 yield increased with decreasing numbers of water
monolayers adsorbed to the surface. G(𝐻2) values of 20 and 150 molecules 100 eV-1 were
determined for samples containing 𝐶𝑒𝑂2 and 𝑍𝑟𝑂2, respectively.
2.4 Radiolysis of Gases in Contact with 𝑷𝒖𝑶𝟐
An extensive amount of research has been undertaken on the radiolysis of adsorbed species
(e.g. water, nitrates) on 𝑃𝑢𝑂2 and other oxides. However, there are fewer publications on
gas phase radiolysis or gases as part of a heterogeneous system. A lot of the emphasis is on
post irradiation analysis of gases from either solutions or organics. However, some papers
have tried to rectify this.

Chapter 2 Literature Review 7131060
53
Haschke et al. exposed 𝑃𝑢𝑂2 to a 2:1 𝐻2 − 𝑂2 mixture and measured the pressure as a
function of time [30]. They reported a rapid drop in pressure before eventually (after 72 d)
staying constant. Mass spectrometer data from the gas phase found no water vapour
present even though mixtures of 𝐻2 − 𝑂2 are thermodynamically unstable relative to water.
The results suggested there were two reactions occurring simultaneously. These are the
oxide catalysed recombination of 𝐻2 and 𝑂2 (Reaction 2.1) and the subsequent water
catalysed oxidation of 𝑃𝑢𝑂2 (Reaction 2.2) to form the super-stoichiometric plutonium
dioxide, 𝑃𝑢𝑂2+𝑥:
2𝐻2 + 𝑂2 + 𝑃𝑢𝑂2 → 2𝐻2𝑂 + 𝑃𝑢𝑂2 Reaction 2.1
𝑃𝑢𝑂2 + 𝑂2 + 𝐻2𝑂 → 𝑃𝑢𝑂2+𝑥 + (1 − 𝑥)𝑂2 + 𝐻2𝑂 Reaction 2.2
The conclusion of this work was that 𝑃𝑢𝑂2 is a catalytically active metal that promotes the
formation of 𝑃𝑢𝑂2+𝑥 below 200 °C.
It has been reported by others that 𝐻2 and 𝑂2 are not produced stoichiometrically from the
radiolysis of absorbed water [31]. Headspace analysis from canisters that have been stored
for over twenty years show that 𝑂2 levels are depleted whilst 𝐻2 levels are enriched,
although there is no overpressure. This is further evidence of the formation of the super-
stoichiometric oxide.
Subsequent work by Haschke et al. surmised that the system pressure decreases as 𝑃𝑢𝑂2+𝑥
is formed at a constant rate by Reaction 2.2 [32]. Once 𝑂2 is depleted, formation of 𝐻2 from
the radiolysis of the adsorbed water causes the pressure to increase. Therefore
pressurisation is possible over long periods if there is constant moisture adsorbed on the
oxide surface.

Chapter 2 Literature Review 7131060
54
Morales et al. also concluded that 𝑃𝑢𝑂2 acted as a catalyst for 𝐻2 and 𝑂2 recombination
[33]. Their results showed that stoichiometric amounts of 𝐻2 and 𝑂2 were lost from the gas
phase and the total pressure of the system decreased after the reactants had combined.
Like Haschke, water vapour was not observed in the final gas composition, suggesting that
any water formed is adsorbed to the surface of the oxide. Initially, the active sites on the
𝑃𝑢𝑂2 are free and so can act as a catalyst in the reaction between 𝐻2 and 𝑂2; this is
supported by the initial drop in pressure of the system. Eventually, these sites become
blocked by water molecules and 𝑂𝐻 moieties and so the reaction rate decreases. At
temperatures above 100 °C, there is enough thermal energy for these sites to be
regenerated thus the rate increases. The implication of this mechanism is that the reaction
is driven by surface catalysis and not by radiolytic formation of radicals. The establishment
of a steady state pressure indicates that the rate of recombination of 𝐻2 and 𝑂2 is equal to
the rate of radiolysis of absorbed water.
Several papers have hypothesised about the production of the super-stoichiometric 𝑃𝑢𝑂2+𝑥
from the reaction of 𝑃𝑢𝑂2 with water and 𝐻2 − 𝑂2 mixtures. The mechanisms for this are
not fully understood and the fact that oxidation of 𝑃𝑢𝑂2 in 𝑂2 does not generate 𝑃𝑢𝑂2+𝑥,
only with the presence of water does it occur, makes the mechanism more complex [34].
Korzhavyi et al. have proposed that the lack of observed oxygen by Haschke et al. [30, 32] is
potentially due to the formation of a more stable product than 𝑃𝑢𝑂2+𝑥 , possibly a hydroxide
or peroxide compound of plutonium [34]. However more experimental data is needed.

Chapter 2 Literature Review 7131060
55
2.5 Radiolysis of 𝑯𝟐 − 𝑶𝟐 in Contact with Other Materials
Further papers have looked at the recombination rates of 𝐻2 and 𝑂2 over different
materials in the absence of radiation. Quigley looked at the recombination rates over
several materials including stainless steel, strips of tin and 𝐶𝑒𝑂2 [35]. This was to address
the issue of over-pressurisation in stainless steel canisters relevant to nuclear waste storage.
Experiments carried out at 200 °C and 300 °C highlighted that 𝐶𝑒𝑂2 was by far the most
efficient at removing 𝐻2 and 𝑂2 from the gas phase. Results for stainless steel also showed
that it acts as a catalyst for the recombination. The tin strips however became oxidised and
so were not as efficient in the recombination process.
Katz studied the reaction of 𝐻2 and 𝑂2 in the presence of concrete that incorporated
simulated radioactive waste [36]. Their results revealed concrete that had been prepared at
higher temperatures and pressures (cured for 24 hrs at 100-250 °C below 600 psi) had a
higher recombination rate than the rate of gas production from radiolysis of water in the
system.
From the work already carried out, it is clear that the presence of a surface increases the
rate of 𝐻2 − 𝑂2 recombination. However, different surfaces whether an oxide, cement or
steel all have the same effect; therefore more work on understanding the mechanism of
recombination is needed. Several papers also suggest the formation of the super-
stoichiometric 𝑃𝑢𝑂2+𝑥, however, only in the presence of moisture. Work on other oxides
such as 𝐶𝑒𝑂2, should help to enhance the understanding of its formation.

Chapter 2 Literature Review 7131060
56
2.6 Radiolysis of Hydrogen and Oxygen
A significant quantity of work was undertaken by Lind and co-workers, who investigated the
recombination of 𝐻2 and 𝑂2 using radium powder as a radiation source [37]. Only pressure
was measured and several assumptions were made, including that no steady state was
reached, radium had no catalytic effect on the system and the only reaction occurring is
Reaction 2.1 (𝑀 instead of 𝑃𝑢𝑂2). In earlier work, the 𝑀
𝑁 term was utilised instead of G-
values, where 𝑀 is the number of molecules undergoing change (formed or reacted) and 𝑁
is the number of ion pairs formed. These values can be converted to G- values using
Equation 2.1.
𝐺 = 𝑀
𝑁 100
𝑊 Equation 2.1
where 𝑊, is the mean energy required to form an ion pair. A lot of early works use the value
for air which is 32.5 eV, therefore:
𝐺 = 3𝑀
𝑁 Equation 2.2
Lind et al. calculated G(𝐻2𝑂) values of 11.76 molecules 100 eV-1. Further work investigating
the effect of added water vapour hypothesised that at ambient temperatures, water vapour
condenses on the vessel walls and plays no part in gas phase reactions, but at higher
temperatures, contributes significantly to the ionisation and reaction rates [38]. Work
replacing 𝐻2 with deuterium, 𝐷2, found that the recombination rate was approximately 25-
30% slower in comparison to 𝐻2 − 𝑂2 recombination [39]. The discussion centred around a
lower efficiency in one of the preliminary reaction steps.
Benjamin and Isbin investigated 𝐻2 − 𝑂2 recombination at high temperatures, of interest to
boiling water reactors [40]. They calculated G(-𝐻2) values in the range 3-6 molecules

Chapter 2 Literature Review 7131060
57
100 eV-1 and the rate of recombination was independent of temperature up to 138 °C. They
postulated that the reaction was first order in 𝐻2 concentration, however, this statement
needs further clarification as to whether the effect the concentration has on absorbed dose
has been taken into account. Like Schifflett et al. [38], their data highlights the rate of
recombination is independent of water vapour concentration.
Dautzenberg irradiated mixtures of 𝐻2 − 𝑂2 using gamma radiation and investigated the
effects of pressure, temperature and matrix gases on the reactivity of 𝐻2 − 𝑂2 mixtures
[41]. He found that the G(-𝐻2) value was affected by all these parameters and achieved
values in the range of 5.5-160 molecules 100 eV-1, depending on reaction conditions. Unlike
Benjamin et al. [40], Dautzenberg determined that the rate of recombination was
independent of 𝐻2 − 𝑂2 ratio. Furthermore, he found that pre-treating the reaction vessels
also had an effect. By heat treating the vessels at 500 °C for 24 hrs and then out-gassing
under vacuum at 200 °C for 30 min, he noted that the G(-𝐻2) value decreased. He surmised
that this was due to surface impurities helping the recombination of 𝐻2 − 𝑂2 and so using a
‘clean’ surface decreased the reaction rate. Dautzenberg also proposed that the reaction
occurred by a radical chain scheme.
Summary
From the literature reviewed in the previous sections, it is clear that radiolysis of adsorbed
moisture is the primary mechanism by which 𝑃𝑢𝑂2 storage canisters can pressurise. A lot of
work has been undertaken on this system, and with other materials, however, there is much
debate as to a mechanism for the enhancement of 𝐻2 yields.

Chapter 2 Literature Review 7131060
58
Early work has investigated the gas phase recombination of 𝐻2 − 𝑂2, however there is a
broad range of G(-𝐻2) values quoted in the literature, there are also conflicting results as to
the order of the recombination.
There has been very little published literature on the radiation chemistry of gaseous species
in contact with an oxide surface (𝑃𝑢𝑂2 or otherwise). Hopefully this research will help to
add to this area.
2.7 Air Radiolysis
Chapter One outlined the storage conditions for 𝑃𝑢𝑂2 in the UK. In one of the product
streams, the fill gas is a 50:50 mixture of air and argon. Irradiation of air could lead to
further chemistry occurring in the canisters, therefore an understanding of the radiation
chemistry of air is needed.
Willis et al. have investigated the radiolysis of 𝑁2 − 𝑂2 mixtures utilising electron pulses
[42]. They found ozone, 𝑂3, to be the dominant product. With nitrogen dioxide, 𝑁𝑂2, being
below the limits of detection.
Harteck and Dondes outlined the following reaction mechanism for radiolysis of air [43, 44]:
𝑁2 ⇝ 2𝑁 Reaction 2.3
𝑂2 ⇝ 2𝑂 Reaction 2.4
𝑁 + 𝑂2 → 𝑂 + 𝑁𝑂 Reaction 2.5
2𝑁𝑂 + 𝑂2 → 2𝑁𝑂2 Reaction 2.6

Chapter 2 Literature Review 7131060
59
𝑁 + 𝑁𝑂2 → 2𝑁𝑂 Reaction 2.7
𝑁 + 𝑁𝑂2 → 𝑂 + 𝑁2𝑂 Reaction 2.8
𝑁 + 𝑁𝑂 → 𝑂 + 𝑁2 Reaction 2.9
𝑂 + 𝑂2 + 𝑀 → 𝑂3 Reaction 2.10
From this mechanism, it is clear that the dominant products are 𝑂3, 𝑁2𝑂 and 𝑁𝑂2.
In the presence of moisture, the dominant product is nitric acid (𝐻𝑁𝑂3), (Reactions 2.11
and 2.12) [45, 46].
2𝑁𝑂2 + 𝐻2𝑂 → 𝐻𝑁𝑂3 + 𝐻𝑁𝑂2 Reaction 2.11
2𝐻𝑁𝑂2 → 𝑁𝑂 + 𝑁𝑂2 + 𝐻2𝑂 Reaction 2.12
Kanda et al. measured G(𝐻𝑁𝑂3 ) values of 1.46 molecules 100 eV-1 by irradiating
atmospheric air using a cyclotron radiation source [45]. Jones measured G(𝐻𝑁𝑂3) values of
1.2 molecules 100 eV-1 and found that nitric acid disappeared on exhaustion of water
vapour in the system leading to formation of stoichiometric amounts of 𝑁𝑂2 and water [46].
This reformed water did not lead to further nitric acid formation.
Summary
The radiolysis of air is a well understood system and the dominant products are well known.
In the presence of moisture, nitric acid is the dominant product. Previous sections in this
chapter outlined that water would be present in the 𝑃𝑢𝑂2 storage canisters, therefore the
formation of nitric acid is a concern.
Chapter 2 Literature Review 7131060
60
There has been no attention given to the formation of nitric acid from radiolysis of air in the
presence of an oxide material. This research hopes to address this issue.
Aims and Objectives
In light of the findings of this literature review, the aim of this research project is to study
the gas phase radiation chemistry of two gaseous systems in the presence or absence of a
𝑃𝑢𝑂2 surrogate material. These systems are firstly, mixtures of 𝐻2 − 𝑂2 in an 𝐴𝑟 matrix and
secondly, moist air.
These aims were pursued via the following distinct objectives which are summarised below:
Develop an adequate reaction vessel to investigate the recombination of 𝐻2 and 𝑂2
in homogeneous and heterogeneous systems using a 60𝐶𝑜 γ source
Determine a better mechanistic understanding of the 𝐻2 − 𝑂2 system, and what role
an oxide surface may play in this system
Investigate the radiolysis of air in the presence of a 𝑃𝑢𝑂2 surrogate material and
determine the identity and yield of species produced
Determine the role an oxide surface plays (if any) in the radiation chemistry of air
Investigate both gaseous systems utilising a beam of accelerated 5.5 MeV 𝐻𝑒2+ ions
to simulate the α-decay of 238𝑃𝑢, which is the α emitter with the shortest half-life
(87.7 y) in the storage canisters

Chapter 3 Experimental 7131060
61
3 Experimental
The following chapter outlines the materials necessary to carry out this research and the
irradiation facilities used to perform the work. It also details the experimental techniques
utilised to execute this work. Finally, it details the experimental methodologies employed
during the course of this research.
3.1 Materials
3.1.1 Gases
All gases are supplied by BOC unless otherwise stated. Hydrogen (CP Grade 99.999%),
oxygen (N5.0 99.999%) and argon (Zero grade 99.999%) are utilised for the preparation of
known concentrations of gas mixtures used to carry out part of this research. Synthetic air
(supplied by BOC) is used during this research and is produced by mixing 20% 𝑂2 with 80%
𝑁2. The impurities are certified as < 1 vppm 𝐶𝑂2, < 2 vppm 𝐻2𝑂 and < 0.1 vppm 𝑁𝑂𝑥.
Calibration gases for the gas chromatograph are supplied by Scientific and Technical Gases
in lecture bottle size. Mixtures ranging from 5% 𝐻2 𝐴𝑟⁄ down to 0.1% 𝐻2 𝐴𝑟⁄ are used for
the calibration of the gas chromatograph. Each bottle has an accuracy of ±0.1%.
3.1.2 Chemicals
Cerium oxide (𝐶𝑒𝑂2) is purchased from Alfa Aesar in the form of a 14 µm powder with
99.99% purity; the largest impurity is ≤ 0.1% silicon dioxide (𝑆𝑖𝑂2). Zirconium oxide (𝑍𝑟𝑂2) is
also purchased from Alfa Aesar and has a more crystalline powder form than 𝐶𝑒𝑂2. It is
supplied as 99.978% pure and the largest impurity is certified as 29 ppm of tantalum and
9 ppm of hafnium. Cerium oxalate hydrate (𝐶𝑒2(𝐶2𝑂4)3. 𝑥𝐻2𝑂), which is used for TGA
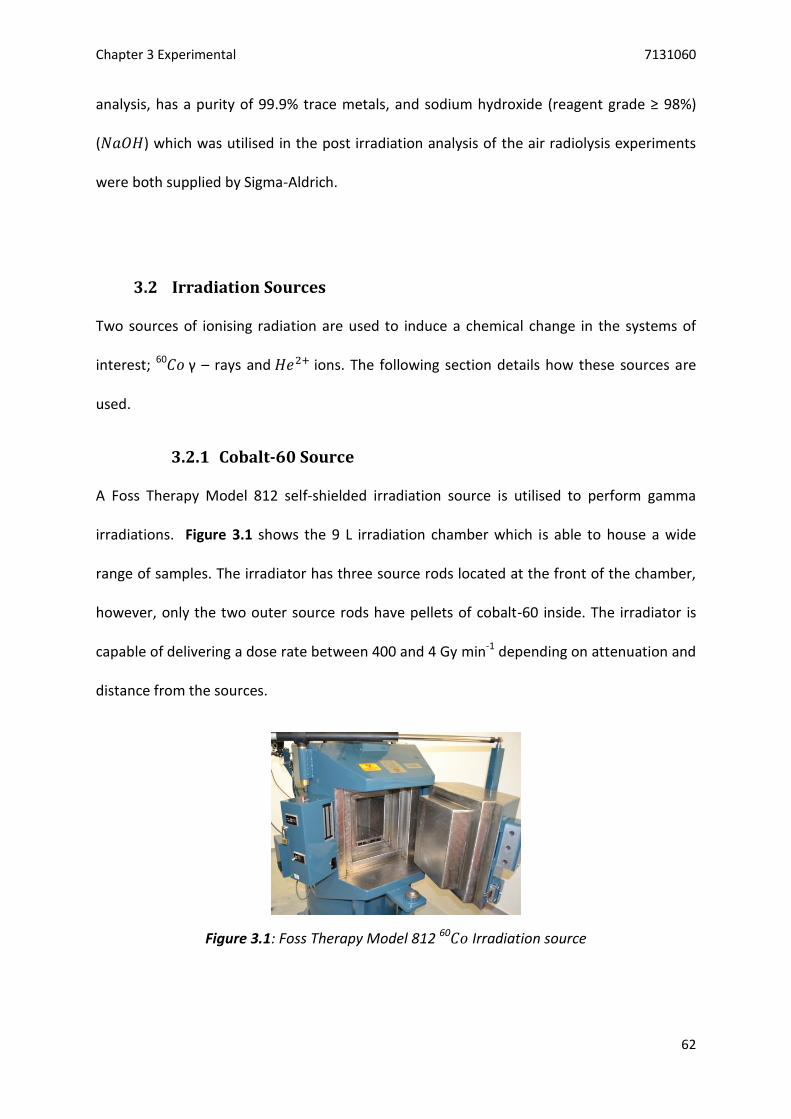
Chapter 3 Experimental 7131060
62
analysis, has a purity of 99.9% trace metals, and sodium hydroxide (reagent grade ≥ 98%)
(𝑁𝑎𝑂𝐻) which was utilised in the post irradiation analysis of the air radiolysis experiments
were both supplied by Sigma-Aldrich.
3.2 Irradiation Sources
Two sources of ionising radiation are used to induce a chemical change in the systems of
interest; 60𝐶𝑜 γ – rays and 𝐻𝑒2+ ions. The following section details how these sources are
used.
3.2.1 Cobalt-60 Source
A Foss Therapy Model 812 self-shielded irradiation source is utilised to perform gamma
irradiations. Figure 3.1 shows the 9 L irradiation chamber which is able to house a wide
range of samples. The irradiator has three source rods located at the front of the chamber,
however, only the two outer source rods have pellets of cobalt-60 inside. The irradiator is
capable of delivering a dose rate between 400 and 4 Gy min-1 depending on attenuation and
distance from the sources.
Figure 3.1: Foss Therapy Model 812 60𝐶𝑜 Irradiation source
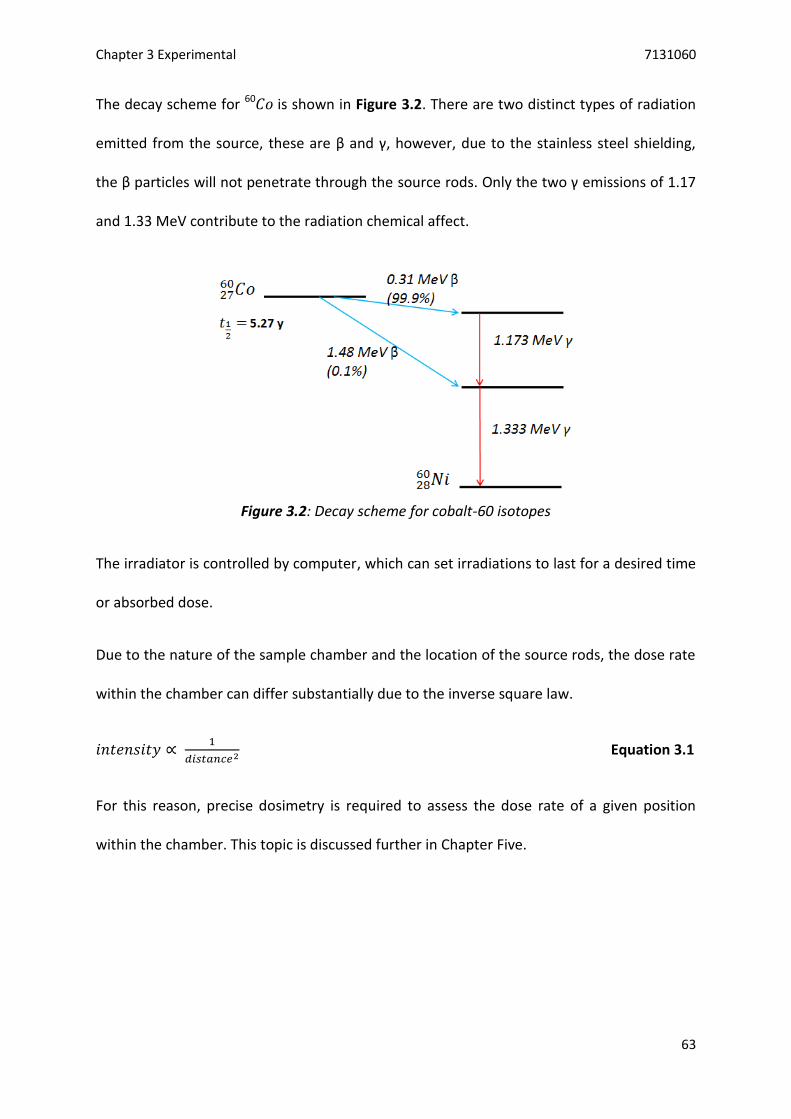
Chapter 3 Experimental 7131060
63
The decay scheme for 60𝐶𝑜 is shown in Figure 3.2. There are two distinct types of radiation
emitted from the source, these are β and γ, however, due to the stainless steel shielding,
the β particles will not penetrate through the source rods. Only the two γ emissions of 1.17
and 1.33 MeV contribute to the radiation chemical affect.
Figure 3.2: Decay scheme for cobalt-60 isotopes
The irradiator is controlled by computer, which can set irradiations to last for a desired time
or absorbed dose.
Due to the nature of the sample chamber and the location of the source rods, the dose rate
within the chamber can differ substantially due to the inverse square law.
𝑖𝑛𝑡𝑒𝑛𝑠𝑖𝑡𝑦 ∝ 1
𝑑𝑖𝑠𝑡𝑎𝑛𝑐𝑒2 Equation 3.1
For this reason, precise dosimetry is required to assess the dose rate of a given position
within the chamber. This topic is discussed further in Chapter Five.

Chapter 3 Experimental 7131060
64
3.2.2 Pelletron Ion Accelerator
An NEC 5 MV tandem ion accelerator is utilised to perform ion irradiation studies on the
gaseous systems relevant to this research. The accelerator is capable of delivering a beam of
positive ions of light charged particles (𝐻+ and 𝐻𝑒2+) up to energies of 10 and 15 MeV
respectively. It is also a source of heavy charged particles of many elements within the
periodic table. Samples are placed at the end of one of the accelerator’s six beam lines
where irradiations and/or analysis can be carried out in-situ. In this research, 𝐻𝑒2+ ions will
be used to simulate the α decay of 𝑃𝑢𝑂2 (specifically plutonium-238). Ions are generated by
feeding 𝐻𝑒 gas into a Toroidal Volume Ion Source (TORVIS). A current is placed over a
filament to ionise the gas and form 𝐻𝑒+ ions. These ions are passed through a rubidium
vapour to add electrons forming 𝐻𝑒− and 𝐻𝑒2−. The negative ions are accelerated to
ground and stripped of electrons to form positive ions which are accelerated from ground,
down the appropriate beam line to the sample. Figure 3.3 shows a schematic layout of the
accelerator. From left to right, the ions are generated at the source, accelerated into the
tank, converted to positive ions and accelerated down one of the beam lines.
Figure 3.3: Schematic of 5 MV Ion accelerator located at DCF

Chapter 3 Experimental 7131060
65
3.3 Analytical Techniques
The two primary analytical techniques utilised in this research are gas chromatography (GC)
and ion chromatography (IC). GC is used to determine the concentrations of 𝐻2 and 𝑂2 in
the gas phase throughout this research. IC is primarily used to determine the concentration
of nitrate (𝑁𝑂3−) anions in air radiolysis experiments, however, other anions can be detected
in parallel. Chromatography is a separation technique reliant on both a stationary phase
that is immobilised on a solid support and a mobile phase that pushes the analyte through
the stationary phase before separating the components of a mixture using a particular
property [47]. Other techniques are applied to study the solid phase during this research,
however, focus will be given to the two primary techniques named above.
3.3.1 Gas Chromatography (GC)
The GC used in this research is an SRI Instruments Multiple gas analyser #1, equipped with a
thermal conductivity detector (TCD) which can be used to detect molecular gaseous species
such as 𝐻2, 𝑂2 and 𝑁2. The detector uses a set of filaments in a Wheatstone bridge
configuration to detect analytes which have a different thermal conductivity to the
reference gas flow. The stationary phase is a 6 ft. long, 1/8 ” diameter packed column of
molecular sieve 13X beads. This column is particularly useful as it acts as a trap for moisture
which would subsequently interfere with the resulting chromatogram. The GC is also
equipped with a 10-port sampling valve which allows for switching between loading and
injecting positions and has a 50 μl sample loop attached. The mobile phase is high purity
argon (99.999% pure), specifically chosen to increase the sensitivity of the instrument
towards 𝐻2 measurements due to the differing thermal conductivities of 𝐴𝑟 and 𝐻2. The
instrument conditions are as follows: the carrier gas flow rate is set at 28 psi, thus allowing

Chapter 3 Experimental 7131060
66
for measurements to be acquired in several minutes; the valve temperature is 60 °C, the
oven temperature which houses the column is set at 80 °C and the detector is at 130 °C.
These conditions allowed for good separation of analytes without shortening the lifespan of
the instrument.
3.3.2 Ion Chromatography (IC)
The IC used in this research is a Thermo-Scientific ICS2100, consisting of an electrochemical
detector (ECD) and a Dionex Ion Pac AS-18 column. The stationary phase is composed of an
ion exchange resin in the form of 4 μm beads which are packed into the column. The mobile
phase is a potassium hydroxide (𝐾𝑂𝐻) eluent which is made from an eluent generator to
tailor the concentration of 𝑂𝐻− to the application. This setup allows for the determination
of inorganic anions and low molecular weight organic acids.
The instrument conditions are: column temperature 30 °C, 𝐾𝑂𝐻 eluent concentration
23 mM with a flow rate of 0.25 ml min-1. The injection volume for each sample is 0.25 μl.
These conditions allowed for analysis times of ten minutes for each sample. For large
numbers of samples, an auto sampler is used to increase efficiency.
3.3.3 Surface Area Measurements
To determine the surface area of the oxide powders of interest, a Tri-Star II surface area and
porosity analyser supplied by Micromeritics is used. It is important to know the specific
surface area (SSA) of the oxide powders as this may help to elucidate any catalytic affect the
surface may have on gas phase radiolysis. In all the experiments, 𝑁2 is used as the adsorbate
gas. Surface area is calculated using the BET theory and the following equation:
𝑆𝐴𝐵𝐸𝑇 = (𝑣𝑚NA𝑠
𝑀𝑉) Equation 3.2

Chapter 3 Experimental 7131060
67
where 𝑣𝑚 is the volume of 1 monolayer of adsorbed gas, NA is Avogadro’s constant, 𝑠 is the
cross sectional area of the gas adsorbate (for 𝑁2 this is 0.162 nm2) and 𝑀𝑉 is the molar
volume of the adsorbate gas [48]. This value is then divided by the sample mass to calculate
the surface area in units of m2 g-1. Sample masses are in the range of 0.5-1 g before being
de-gassed under vacuum at 250 °C overnight. The samples are re-weighed and analysis
performed.
3.3.4 Thermogravimetric Analysis (TGA)
To determine whether there are any organic impurities absorbed on the oxide powders and
to investigate their thermal stabilities, samples were submitted for thermogravimetric
analysis. TGA involves heating a small amount of sample at a set heating rate and measuring
the difference in mass over a required temperature range. To carry out TGA, a small mass of
sample (< 10 mg) is placed inside an aluminium crucible and heated. For samples of 𝐶𝑒𝑂2
and 𝑍𝑟𝑂2, the heating rate employed is 10 °C min-1, heated up to 1000 °C and held for
10 min. A sample of cerium oxalate was also analysed, however, due to the decomposition
of the sample, a heating rate of 2 °C min-1 is employed and the sample is heated to 600 °C.
This temperature ensures the oxalate has decomposed fully. All samples are analysed in
both static air and nitrogen to provide a comparison between oxidative and inert
atmospheres.
3.3.5 Diffuse Reflectance Infra-red Spectroscopy (DRIFT)
A Vertex 70 FT-infra-red spectroscope supplied by Bruker is used to investigate the surface
of the oxide powders with respect to adsorbed organic species. A Praying Mantis diffuse
reflectance accessory is used to increase the spectral output due to the uneven nature of
the sample surface. The accessory has two parabolic mirrors to collect all of the reflected
Chapter 3 Experimental 7131060
68
light off the sample and focus it into the detector. A mercury cadmium telluride (𝐻𝑔𝐶𝑑𝑇𝑒)
detector, which is cooled with liquid nitrogen to improve signal/noise ratio is used. The
resolution is set to 4 cm-1 and 250 scans of each sample are taken.
3.3.6 UV-Vis Spectroscopy
To perform Fricke dosimetry experiments, an Agilent Technologies Cary Series UV-Vis-NIR
spectrophotometer is utilised. Disposable 1 cm path length cuvettes are used to analyse the
solution and three repeats of each sample are taken. An average of these readings is used as
the absorption value compared to a reference blank.
3.3.7 Scanning Electron Microscopy (SEM)
To determine the morphology of the oxide grains, a small quantity of powder is mounted
onto a carbon stub and coated with a fine layer of carbon using a Cressington 208 high
vacuum carbon coater. The samples are loaded into the chamber of a JEOL 6400 scanning
electron microscope. The instrument is equipped with a Princeton Gamma Tech energy
dispersive X-ray spectroscope (EDS) which allows for elemental analysis of the sample to be
investigated. The beam energy used is 15 keV.
Chapter 3 Experimental 7131060
69
3.4 Experimental
The following section outlines how this research is carried out, detailing the equipment
needed to mix various gases together and how the air radiolysis experiments are
accomplished. Finally, details of experiments carried out using the ion accelerator are
explained.
3.4.1 Mixing of 𝑯𝟐 − 𝑶𝟐 − 𝑨𝒓 Samples
A bespoke manifold system has been designed and commissioned to be able to mix 𝐻2, 𝑂2
and argon gas in various concentrations. Figure 3.4 shows a visual image of the manifold
and a schematic drawing showing its design features.

Chapter 3 Experimental 7131060
70
Figure 3.4: Bespoke gas mixing manifold system
The manifold is made from 316 stainless steel with Swagelok © fittings. It consists of a
rotary vane vacuum pump and a Pirani vacuum gauge and is able to evacuate the entire
system to a pressure of < 20 mTorr. Once this pressure is achieved, the vacuum pump is
isolated from the system and the gases can then be mixed by using two independent
pressure gauges to verify the ratios of each gas. Each gas cylinder is fitted with a one-way
check valve to ensure flashbacks cannot occur. The manifold is fitted with ultra-torr ©
fittings which allow gases to be mixed in the reaction vessel directly. Throughout the course
of these experiments, all irradiations will be investigated at atmospheric pressure (1 bar
absolute), this is to simulate the conditions under which the majority of the 𝑃𝑢𝑂2 canisters
are stored.

Chapter 3 Experimental 7131060
71
A specialist reaction vessel had to be developed to perform 𝐻2 − 𝑂2 studies, which involved
several iterations of design. This development will be discussed in Chapter Four.
3.4.2 Air Radiolysis
For this set of experiments, 12 ml sample vials with a butyl rubber crimp cap were
employed. Three quantities of oxide loading were used during the experiments. These were
1 g, 50% oxide (by volume) and 90% oxide (by volume). This can be seen for 𝑍𝑟𝑂2 samples in
Figure 3.5. All masses were within ± 0.01 g of the required quantity.
Figure 3.5: Picture of l-r 1 g, 50% oxide (by volume) and 90% oxide (by volume) for 𝑍𝑟𝑂2 samples
The three loading choices give a wide range of gas to solid ratio. Samples that contain 1 g of
oxide contain over 95% air (by volume) therefore it is expected that these samples will
closely replicate the experiments without any oxide powder present. Samples with 50%
oxide present represent a much larger mass of oxide than the 1 g samples. These samples
should help to confirm if there is a catalytic effect on nitrate formation in the presence of an
oxide surface as there is a lot more oxide surface than is present in 1 g samples for any gas
phase species to adsorb to. Samples with 90% volume of oxide are analogous to the 𝑃𝑢𝑂2

Chapter 3 Experimental 7131060
72
storage cans where the cans are almost full of oxide powder to reduce the number of cans
required.
To perform irradiations, samples are placed inside a test tube rack and irradiated with
standard laboratory air atmospheres. Post irradiation, the samples are injected with 5/7 ml
of 5 mM 𝑁𝑎𝑂𝐻 solution to extract any gaseous nitric acid into solution. Samples containing
1 g of oxide are washed with 5 ml of the base solution and the 50% and 90% samples are
washed with 7 ml of the base solution. These volumes are chosen to ensure firstly, that
there is an excess of base in all the samples and secondly, that all the nitric acid can be
extracted. Due to the ‘sticky’ nature of nitric acid [49] it is important to have enough
solution to wash all of the surfaces in the system. Also there needs to be enough supernate
above the oxide to be able to draw off the solution to be analysed. This is a similar analytical
approach utilised by Kanda et al. [45]. After the samples are washed with the base solution,
they are homogenised and left to settle. After a period of time where two separate layers
have started to form, a portion of the solution is drawn off and filtered through a
polyvinylidene fluoride (𝑃𝑉𝐷𝐹) syringe filter; this is to ensure any fine particulates do not
plug the instrument. The filtered solution is placed inside an IC auto-sampler vial and
analysed using the IC.
Throughout these experiments, disposable needles and syringes are used for transferring
solutions between vials; this is to reduce the chance of contamination between samples.
The 12 ml glass sample vials are only used for one experiment so as to avoid contamination.
When adding the base solution to the irradiated samples, a gas tight 5/10 ml syringe is used
with disposable needles in order to ensure the same volume of 𝑁𝑎𝑂𝐻 solution is injected
into each sample to increase repeatability across the experiment range. Finally, the IC auto-

Chapter 3 Experimental 7131060
73
sampler vials are also disposable to ensure there is no cross-contamination from any
previous samples.
3.4.3 Oxide Regeneration
After analysis of the aqueous phase it is important to ‘regenerate’ the oxide powder to its
unirradiated state for future experiments. This is achieved by filtering the oxide with an
aliquot of 5 mM 𝑁𝑎𝑂𝐻 solution, to wash the surface and remove any adsorbed species. It is
then washed with copious volumes of deionised water to remove any excess sodium cations
from the basic solution before baking the powder in a furnace at 400 °C for 6 h under a static
air atmosphere. This temperature is high enough to remove any organic species that haven’t
been removed by washing and physisorbed water but low enough that it will not change the
crystallographic nature of the powder. The baked powder is then filtered through an
appropriate sized sieve to break up any agglomerated powder.
3.4.4 Accelerator Experiments
Bespoke glassware has been developed to investigate heavy ion radiolysis of the 𝐻2 − 𝑂2 −
𝐴𝑟 system. The glassware has similar features to the glassware used by Schuler et al. [50]
and is presented visually and schematically in Figure 3.6.

Chapter 3 Experimental 7131060
74
Figure 3.6: Bespoke glassware for 𝐻𝑒2+ ion radiolysis of 𝐻2 − 𝑂2 − 𝐴𝑟 gaseous mixtures
The vessel is cylindrical in shape to allow for the ion beam to penetrate into the sample and
to be fully attenuated in the sample, not the glass itself. The vessel is approximately 30 cm
in length to accommodate the greater penetration distance of heavy ions into gaseous
targets. It has a platinum wire that is used to obtain current measurements in the sample
during irradiation. It also contains two Rotaflo taps which allow the cell to be purged with
the required gas mixture and to be connected to the GC for post irradiation analysis. As the
ion beam is only irradiating the sample and the taps are not located inside the radiation
field, radiation resistant materials are not required for their construction. There is a side
port to which a pressure transducer is attached during irradiations to log the pressure
change in the vessel. The end of the vessel is open ended with a ground glass flange, to
which a thin sheet of mica is attached to the flange using an epoxy resin and secured in

Chapter 3 Experimental 7131060
75
place with the ground glass ring. Due to the fragility of the mica window, all experiments are
investigated at atmospheric pressure (1 bar absolute).
All experiments are carried out with 𝐻𝑒2+ ions to simulate α decay from 238𝑃𝑢. Before the
ions hit the sample, the beam has to traverse a series of material windows (Figure 3.7),
therefore a calculation is needed to account for the energy loss of the beam from the
accelerator terminal to the sample. This is achieved by inputting the density of each
window into a program called SRIM (Stopping Range of Ions in Matter) [51]. This software
calculates the final ion energy on the sample from a machine starting energy or the initial
ion energy needed from the machine to generate a certain ion energy on sample.
Calculations were done using the latter parameters. Due to the slight variation in the density
of the mica window in the different reaction vessels, the exact ion energy on sample ranged
from 5.52-5.96 MeV. The currents employed during the series of experiments were 10 and
20 nA and irradiation times ranged from 10-30 mins. This configuration allowed for
equivalent doses as achieved using the 60𝐶𝑜 source in 64 h.
Figure 3.7: Configuration of window assembly through which the beam travels before reaching the sample

Chapter 4 Development of γ-Irradiation Reaction Vessel 7131060
76
4 Development of γ-Irradiation Reaction Vessel
This chapter details the extensive development involved in designing a reaction vessel
suitable to perform γ-irradiations of 𝐻2 − 𝑂2 − 𝐴𝑟 mixtures. The chapter also outlines the
development in sampling and analysis techniques that coincide with the iteration of
reaction vessel development to enhance the sensitivity of the gas chromatograph towards
𝐻2 analysis.
4.1 Initial Vessel Design
The initial reaction vessel utilised to perform 𝐻2 − 𝑂2 irradiations using the 60𝐶𝑜 source is
shown below (Figure 4.1):
Figure 4.1: Reaction vessel for gamma radiation studies of 𝐻2 − 𝑂2 system
The vessel is made of borosilicate glass, with a ‘bulb’ volume of 10 cm3. It has two Rotaflo
taps which are made from polytetrafluoroethylene (𝑃𝑇𝐹𝐸) and are chemically inert and gas
tight. These taps are removable which allows for oxide powder to be installed into the
vessel. The two outlets allow for the vessel to be attached directly to the manifold and to be
attached to the GC for ‘in-line’ analysis.

Chapter 4 Development of γ-Irradiation Reaction Vessel 7131060
77
To perform irradiations, the glass vessels are mounted onto a rail system shown in Figure
4.2.
Figure 4.2: Sample holder for gamma irradiation of 𝐻2 − 𝑂2 system
This allows for vessels to be mounted in a set position thus ensuring a constant dose rate
during irradiation. The sample can be moved closer/further from the radiation sources so
that a range of dose rates can be achieved.
4.1.1 GC Configuration and Calibration
To accommodate this experimental set-up, the sampling valve of the GC had to be
reconfigured to allow the carrier gas to ‘force’ the irradiated gas mixture through to the
detector. Figure 4.3 shows the GC valve set up in i) load position, where the sample is
attached to the GC and ii) inject position as the carrier gas injects the sample into the GC.

Chapter 4 Development of γ-Irradiation Reaction Vessel 7131060
78
Figure 4.3: GC valve configuration for ‘in-line’ analysis i) ‘Load’ position ii) ‘Inject’ position
When a vessel is not attached to the GC, the two outlets are connected together and
flushed with argon gas in order to minimise the volume of air within the system. When a
vessel is attached as shown in Figure 4.3i there is a delay of a couple of seconds between
disconnecting the bridge between the two outlets and attaching the vessel, allowing air to
ingress into the sample loop. The total volume of the sample loop and connections in
comparison with the 10 cm3 volume of the injected sample means that the air impurity will
be less than 1% of the injected sample.
The GC is calibrated using the 𝐻2 calibration gases detailed in Section 3.1.2. This is achieved
by purging the glass bulb with the gas for 60 s before attaching the vessel to the GC for
analysis. Several repeats of each calibration gas are done to increase accuracy (Figure 4.4).
i) ii)

Chapter 4 Development of γ-Irradiation Reaction Vessel 7131060
79
Figure 4.4: Calibration of the gas chromatograph using certified calibration standards in the range 0.1-4% 𝐻2 𝐴𝑟⁄
At lower concentrations of hydrogen (< 1%) there is a linear relationship between the
concentration and the peak area. Above this concentration however, the calibration is non-
linear and there is a higher degree of scatter between repeat samples. The explanation for
this scatter can be seen in Figure 4.5; this is an overlay of two chromatograms, one
containing 2% 𝐻2 𝐴𝑟⁄ , and the second containing 0.5% 𝐻2 𝐴𝑟⁄ .
Figure 4.5: Gas chromatograms of 2% 𝐻2 𝐴𝑟⁄ and 0.5% 𝐻2 𝐴𝑟⁄ calibration gases
The signal present at 10 s is a systematic ‘satellite’ caused by the pressure change in the
system as the sampling valve rotates between ‘load’ and ‘inject’ positions.
0
500
1000
1500
2000
2500
3000
3500
0 0.1 0.2 0.3 0.4 0.5
Pea
k ar
ea /
AU
H2 Volume / cm3
0
100
200
300
400
500
600
700
800
0 25 50 75 100 125 150 175 200 225 250
SIgn
al In
ten
sity
/A
U
Retention time / s
2% H2/Ar
0.5% H2/Ar

Chapter 4 Development of γ-Irradiation Reaction Vessel 7131060
80
In the 0.5% 𝐻2 𝐴𝑟⁄ chromatogram there are two distinct peaks, with retention times of 115
and 165 s, respectively. The first peak is from hydrogen and the second is from oxygen
which is present in small quantities from the sample loop. In the 2% 𝐻2 𝐴𝑟⁄ chromatogram
there are three peaks, however, the first two at retention times of 90 and 135 s, respectively
are overlapping. These two peaks are 𝐻2 and 𝑂2. There is a four-fold difference in hydrogen
concentration between the calibration gases, therefore it is easier to assign the relevant
peak to this gas. The third peak in the 2% 𝐻2 𝐴𝑟⁄ chromatogram is due to nitrogen, again
present in small quantities in the sample loop. Nitrogen may also be present in the 0.5%
𝐻2 𝐴𝑟⁄ chromatogram, however, the program ended before it could reach the detector. Due
to the interference in the first two peaks it is impossible to integrate the peak and attain a
true peak area.
This effect is still as prevalent in irradiated samples that contain higher concentrations of
hydrogen. Figure 4.6 shows the resultant chromatograms from initial trials of 𝐻2 − 𝑂2
radiolysis studies. The gas ratios in the samples are 3.75:2.65:90 𝐻2: 𝑂2: 𝐴𝑟. Samples are
irradiated individually using the same position within the irradiator with doses received
ranging between 1 and 5 kGy. By assuming the dose is absorbed by all of the gas, the
absorbed doses have been calculated to be in the range of 7.07x10¹⁵ and 3.48x10¹⁶ eV.

Chapter 4 Development of γ-Irradiation Reaction Vessel 7131060
81
Figure 4.6: Overlain chromatograms of initial trials of 𝐻2 − 𝑂2 radiolysis experiments
(n.b. - data set superimposed on - data set)
From Figure 4.6 two things become apparent. The first is the issue of separation between
𝐻2 and 𝑂2 signals and the second is that in this absorbed dose range, there is very little
chemistry occurring that is affecting the concentrations of either hydrogen or oxygen.
Before any attempts could be made to increase the separation between 𝐻2 and 𝑂2 signals,
it became apparent that irradiated samples and samples of pure argon had significant levels
of 𝑂2 and 𝑁2 present that are similar to pure air. Further inspection of the vessels showed
that the 𝑃𝑇𝐹𝐸 taps had mechanically degraded (Figure 4.7) which had led to the original
sample being lost. This is a major issue as higher absorbed doses are needed to investigate
the 𝐻2 − 𝑂2 system, however, the current vessel design does not tolerate doses higher than
several 100 kGy. This led to a redesign of the reaction vessel and subsequent sampling
method.
0
200
400
600
800
1000
1200
1400
0 50 100 150 200 250 300
Sign
al In
ten
sity
/ A
U
Retention time / s
7.07x10^15 eV1.41x10^16 eV2.10x10^16 eV2.80x10^16 eV3.48x10^16 eV
H2
O2 N2

Chapter 4 Development of γ-Irradiation Reaction Vessel 7131060
82
Figure 4.7: Mechanical degradation of 𝑃𝑇𝐹𝐸 taps
An initial idea was to replace the 𝑃𝑇𝐹𝐸 taps with borosilicate stopcocks, however, this
would require a grease to lubricate the taps and ensure a good seal. Although radiation
resistant greases are available these would eventually degrade and could be a source of
hydrocarbons such as methane or 𝑂2 into the system.
4.2 Reaction Vessel Mark II
After extensive research, a commercially available metal sampling cylinder was chosen as
the reaction vessel (Figure 4.8). This has the benefit of being pressure tested up to pressures
of 60 bar as well as tolerating a greater temperature range. As the vessel is made of 316
stainless steel there should be no source of foreign gases into the system. Also, with a
commercial product comes greater repeatability between sample vessels with regards to
volumes and thickness. The volume of the metal cylinder is 10 cm3. Due to the geometry of
the vessels, the initial sample holder seen in Figure 4.3 is obsolete. A metal test tube rack
that is affixed to the base plate was developed to accommodate more samples than the
previous design.

Chapter 4 Development of γ-Irradiation Reaction Vessel 7131060
83
Figure 4.8: Stainless steel sampling cylinder for 𝐻2 − 𝑂2 gamma irradiation experiments
4.2.1 GC Calibration
Due to this vessel only having one inlet, the analysis method using the GC was also revised.
After samples have been irradiated, a rubber septa is placed over the outlet and purged
with argon gas. A gas tight sample syringe is then driven through the septa and into the
sample directly. The syringe is then pumped several times to ensure adequate mixing of the
sample and its contents are then injected onto the GC column directly using the separate
injection port.
Figure 4.9 shows the resulting calibration plot using this sampling method. From this figure,
it is evident that there is less scatter in the data and there is a linear response of the
detector up to 1 cm3 of pure 𝐻2.

Chapter 4 Development of γ-Irradiation Reaction Vessel 7131060
84
Figure 4.9: Calibration plot for pure 𝐻2 using the direct injection methodology
In Figure 4.4, a volume of 0.4 cm3 of 𝐻2 produced a peak with an area of approximately
3000 AU. Compared to the injection method, this has decreased to approximately 1200 AU.
This is due to the decrease in the sample volume that is being analysed from 10 cm3 (volume
of glass ‘bulb’) to 1 cm3 (volume of the gas syringe).
Although the volume has been decreased, the resultant chromatograms still show sharp
distinguishable peaks with a Gaussian profile (Figure 4.10). It is noticeable that the quantity
of 𝑂2 and 𝑁2 has decreased significantly with this sampling method. However only with the
1 ml injection volume are there signs of other components in the sample.
y = 3634.4x R² = 0.999
0
500
1000
1500
2000
2500
3000
3500
4000
0 0.2 0.4 0.6 0.8 1
Pea
k ar
ea /
AU
H2 volume / cm3

Chapter 4 Development of γ-Irradiation Reaction Vessel 7131060
85
Figure 4.10: Overlay of gas chromatograms highlighting varying injection volumes of pure 𝐻2
After irradiating these vessels in a pure argon atmosphere, it was discovered that the valves
in Figure 4.8 had a ball and socket joint which was made of ultra-high molecular weight
polyethylene (𝑈𝐻𝑀𝑊𝑃𝐸). Under irradiation conditions, this polymer decomposes and cross
links [52] which leads to the evolution of 𝐻2 gas and thus to interference with post
irradiation analysis of the hydrogen yield.
0
100
200
300
400
500
600
700
800
900
1000
100 150 200 250 300 350 400
Sig
nal
Inte
nsi
ty /
AU
Retention Time / s
0.2 ml
0.4 ml
0.6 ml
0.8 ml
1.0 ml

Chapter 4 Development of γ-Irradiation Reaction Vessel 7131060
86
4.3 Reaction Vessel Mark III
The final iteration of the reaction vessel design is shown in Figure 4.11. This is a bellows
sealed valve which is non-wetted and made entirely of various metal components.
Figure 4.11: Final vessel iteration to investigate radiolysis of 𝐻2 − 𝑂2 systems
4.3.1 GC Configuration and Calibration
To eradicate any air from the system and for increased repeatability, a new analysis system
was developed and commissioned. This system reverted back to using the sample loop and
sampling valve highlighted in Section 4.1.1. The load and inject configurations of the
sampling valve are shown in Figure 4.12.

Chapter 4 Development of γ-Irradiation Reaction Vessel 7131060
87
Figure 4.12: Final GC valve configuration i) ‘Load’ position ii) ‘Inject’ position
This sampling method has a vacuum pump attached to one end of the sample loop, with the
reaction vessel attached to the other side. The pump can evacuate the loop directly to the
valve on the reaction vessel, once a good vacuum has been achieved, the pump is isolated.
The valve on the sample vessel is opened to expand the gas volume into the sample loop,
after which the sample vessel is isolated and the sampling valve rotates to inject the sample
inside the loop onto the column and to the detector. The sample loop has a pressure
transducer attached which can log the pressure throughout the analysis. It has a span of
2.5 bar absolute and an accuracy of ± 2.5 mbar.
This method allows for multiple injections of a single sample as a correlation can be made
between the pressure of the sample in the loop and the resulting peak area, however, due
to dead volume this is not a perfect correlation. Figure 4.13 is a plot of pressure where six
injections are made. Between each injection the sample loop is evacuated to remove the
remnants of the previous sample. At the end of each injection, the pressure increases in the
sampling loop due to the GC valve rotating back to the ‘load’ position which contains carrier
gas at a higher pressure than the sampling loop.
i) ii)

Chapter 4 Development of γ-Irradiation Reaction Vessel 7131060
88
Figure 4.13: Plot of sample loop pressure as a function of time for six repeat injections with vacuum GC configuration
This configuration is calibrated by evacuating the sample vessels using the manifold and
filling the vessels with a calibration gas of known 𝐻2 concentration. Three injections of each
sample are taken and the results shown in Figure 4.14. The partial pressure of hydrogen is
calculated using Equation 4.1.
𝑝𝐻2=
%𝐻2 𝑝𝑙𝑜𝑜𝑝
100 Equation 4.1
where 𝑝𝐻2 is the partial pressure of hydrogen, %𝐻2
is the concentration of hydrogen in the
calibration gas and 𝑝𝑙𝑜𝑜𝑝 is the pressure in the sample loop as the sample is injected into the
GC.
0
200
400
600
800
1000
1200
1400
0 100 200 300 400 500 600 700 800
Pre
ssu
re /
mb
ar
Time / s
1
2
3
4 5
6

Chapter 4 Development of γ-Irradiation Reaction Vessel 7131060
89
Figure 4.14: GC calibration curve of hydrogen partial pressure as a function of peak area for vacuum sampling system
The standard error of the slope is ±0.001. This value is within tolerable limits and reduces
the scatter from the initial sampling design significantly.
The following series of equations are used to retrospectively calculate the number of moles
of hydrogen in the post irradiated sample from the partial pressure of hydrogen in the
sample loop. This value will then be able to determine the number of moles of hydrogen
lost/formed during irradiation by comparison with the initial number of moles in the
sample. Equation 4.2 is used to calculate the partial pressure of hydrogen within the sample
loop
𝑝𝐻2(𝑝𝑙𝑜𝑜𝑝) = 𝑘𝐻2
" 𝐴𝐻2(𝑝𝑙𝑜𝑜𝑝) + 𝑏𝐻2
" Equation 4.2
where 𝑝𝐻2(𝑝𝑙𝑜𝑜𝑝) is the partial pressure of 𝐻2 in the sample loop, 𝑘𝐻2
" and 𝑏𝐻2
" are
calibration constants (from the trend line equation in Figure 4.14) and 𝐴𝐻2(𝑝𝑙𝑜𝑜𝑝) is the
peak area for 𝐻2 from the sample at pressure 𝑝𝑙𝑜𝑜𝑝.
y = 0.142x - 0.027 R² = 0.999
0.0
5.0
10.0
15.0
20.0
25.0
30.0
35.0
40.0
45.0
50.0
0 50 100 150 200 250 300 350
H2 p
arti
al p
ress
ure
in s
amp
le lo
op
/
mb
ar
Peak area / AU
H2 conc. in Ar
5%
2%
1%
0.50%
0.10%

Chapter 4 Development of γ-Irradiation Reaction Vessel 7131060
90
Assuming ideal gas behaviour, the mole fraction of hydrogen will remain constant during the
expansion of the sample from the vessel into the sample loop, giving the following
expression:
𝑝𝐻2
𝑝𝑠𝑎𝑚𝑝𝑙𝑒=
𝑝𝐻2(𝑝𝑙𝑜𝑜𝑝)
𝑝𝑙𝑜𝑜𝑝 Equation 4.3
where 𝑝𝑠𝑎𝑚𝑝𝑙𝑒 is the pressure of the initial sample. The partial pressure of 𝐻2 in the
irradiated sample (𝑝𝐻2) is calculated by substituting Equation 4.2 into Equation 4.3 to give
the following:
𝑝𝐻2=
𝑝𝑠𝑎𝑚𝑝𝑙𝑒
𝑝𝑙𝑜𝑜𝑝 [𝑘𝐻2
" 𝐴𝐻2(𝑝𝑙𝑜𝑜𝑝) + 𝑏𝐻2
" ] Equation 4.4
and the number of moles in the irradiated sample is calculated thus:
𝑛𝐻2=
𝑝𝑠𝑎𝑚𝑝𝑙𝑒
𝑝𝑙𝑜𝑜𝑝 𝑉𝑠𝑎𝑚𝑝𝑙𝑒
R𝑇 [𝑘𝐻2
" 𝐴𝐻2(𝑝𝑙𝑜𝑜𝑝) + 𝑏𝐻2
" ] Equation 4.5
where 𝑉𝑠𝑎𝑚𝑝𝑙𝑒 is the volume of the vessel.
To ensure there is no reaction between the steel vessels and the gaseous sample, processed
blanks are made for each set of experiments. These blanks have the same composition of
gas as the irradiated samples, however, are left on the bench for the same time as the
irradiated samples.
An initial indication of whether the radiation had any effect on the system was to plot the
𝐻2 peak area against the pressure in the sample loop and to compare the translation in
respect to the y-axis of the series with respect to the unirradiated blank. Figure 4.15 is
shown as an example. The R2 values are very consistent, however, as stated previously, the
dead volume leads to a slight offset in correlation.
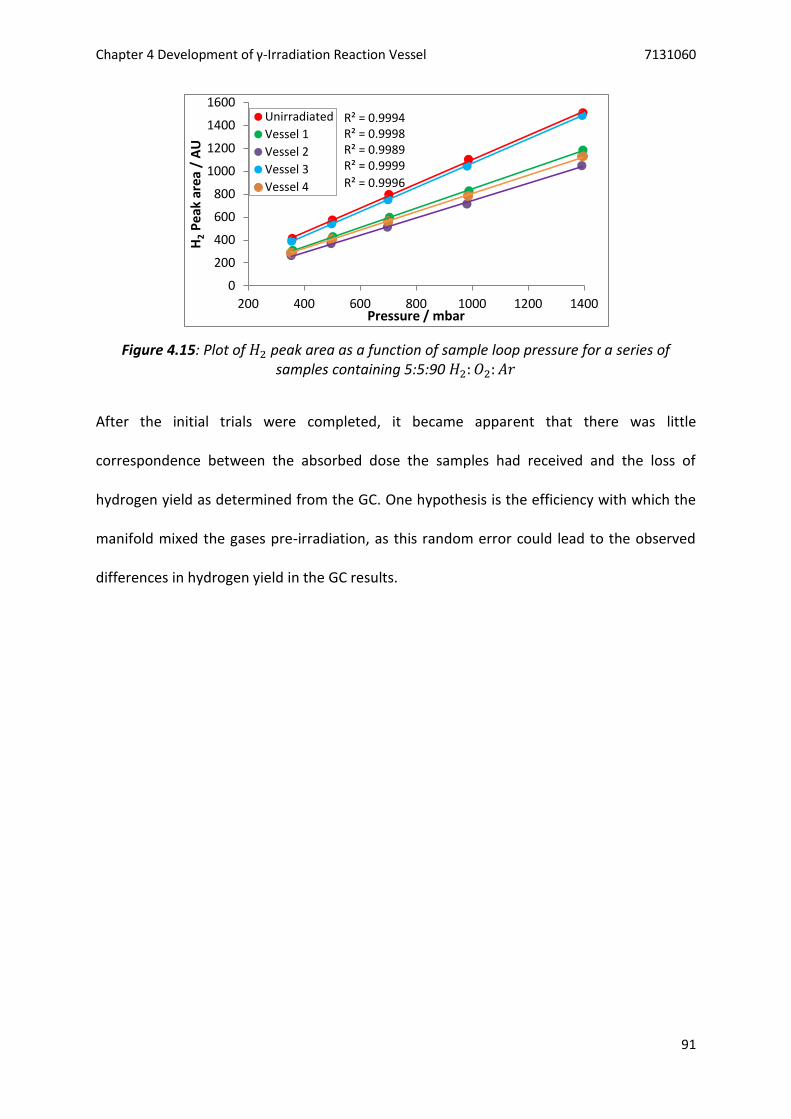
Chapter 4 Development of γ-Irradiation Reaction Vessel 7131060
91
Figure 4.15: Plot of 𝐻2 peak area as a function of sample loop pressure for a series of samples containing 5:5:90 𝐻2: 𝑂2: 𝐴𝑟
After the initial trials were completed, it became apparent that there was little
correspondence between the absorbed dose the samples had received and the loss of
hydrogen yield as determined from the GC. One hypothesis is the efficiency with which the
manifold mixed the gases pre-irradiation, as this random error could lead to the observed
differences in hydrogen yield in the GC results.
R² = 0.9994 R² = 0.9998 R² = 0.9989 R² = 0.9999
R² = 0.9996
0
200
400
600
800
1000
1200
1400
1600
200 400 600 800 1000 1200 1400
H2 P
eak
are
a /
AU
Pressure / mbar
Unirradiated
Vessel 1
Vessel 2
Vessel 3
Vessel 4

Chapter 4 Development of γ-Irradiation Reaction Vessel 7131060
92
4.4 Gas Mixing
To test this hypothesis, four experiments were trialled using different gas mixtures. A
minimum of four vessels were attached to the manifold and evacuated to a pressure below
20 mTorr. The vacuum pump was isolated and the vessels were filled to identical pressures
of the relevant gas mix. The samples were analysed consecutively on the GC. The four gas
mixtures were as follows:
A pre-mixed two component calibration gas of known hydrogen concentration;
A single component gas (in this case hydrogen);
A two component gas mixture of hydrogen and argon mixed within the vessels and
concentration determined by pressure; and
A three component gas mixture of hydrogen, oxygen and argon mixed in the vessels
and concentration determined by pressure.
Figure 4.16 shows the resulting plots of hydrogen peak area as a function of sample loop
pressure for the four gas mixtures.

Chapter 4 Development of γ-Irradiation Reaction Vessel 7131060
93
i)
ii)
iii)
iv)
Figure 4.16: Plots of 𝐻2 peak area as a function of sample loop pressure of four different gas mixes i) 2% 𝐻2/𝐴𝑟 calibration gas, ii) pure hydrogen gas, iii) 10:90 𝐻2: 𝐴𝑟 gas mix from
manifold and iv) 5:5:90 𝐻2: 𝑂2: 𝐴𝑟 gas mix from manifold
40
50
60
70
80
90
100
110
120
350 450 550 650 750
H2 p
eak
area
/ A
U
Pressure / mbar
2%H2/Ar calibration gas
Vessel 1Vessel 2Vessel 3Vessel 4
R.S.D. 0.18
2000
2500
3000
3500
4000
4500
5000
350 450 550 650 750
H2 p
eak
area
/ A
U
Pressure / mbar
Pure H2
Vessel 1
Vessel 2
Vessel 3
Vessel 4
R.S.D. 2.51
0
500
1000
1500
2000
350 450 550 650 750
H2 p
eak
area
/ A
U
Pressure / mbar
10:90 H2 - Ar
Vessel 1 Vessel 2
Vessel 3 Vessel 4R.S.D. 16.45
0
200
400
600
800
1000
1200
350 450 550 650 750
H2 p
eak
area
/ A
U
Pressure / mbar
5:5:90 H2-O2-Ar
Vessel 1 Vessel 2Vessel 3 Vessel 4Vessel 5 Vessel 6
R.S.D. 29.62
n.b. All four data sets
are superimposed
n.b. All four data sets
are superimposed
n.b. Vessel 1 and 3 data
sets are superimposed

Chapter 4 Development of γ-Irradiation Reaction Vessel 7131060
94
From this series of graphs, it is evident that as more components are mixed with the
manifold system, the more scatter in the GC analysis. This can be seen with the values of the
relative standard deviation (RSD), starting at 2.51 for a single component gas and rising to
29.62 for a three component gas mix. It is not a question of number of components as the
calibration gas has the least scatter across a series of samples with a relative standard
deviation of 0.18 despite being a two component mixture. As the gases are mixed in series,
the manifold relies solely on diffusion of the components to mix homogeneously inside the
vessels. The timescales employed in the mixing of the gases (minutes) is not long enough for
displacement of the lighter gases by the denser gases assuming Brownian motion occurs,
therefore an alternative mixing method is needed.
To solve this issue, the gases need to be pre-mixed before being expanded into the vessels
(such as the calibration gases). To achieve this, a large volume mixing cylinder was added to
the manifold, shown schematically in Figure 4.17. The entire manifold is placed under
vacuum and once a good vacuum is achieved (< 20 mTorr), the vessels (red circles) are
isolated from the system. The gases are mixed in series inside the 1 L cylinder. To increase
the mixing speed of the gas mixtures, a 𝑃𝑇𝐹𝐸 coated stirrer bar is placed inside the mixing
cylinder and a magnetic stirrer placed under the cylinder. After approximately 30 mins, the
valve separating the irradiation vessels and the mixing cylinder is opened and the difference
in pressure leads the gas mixture to expand into the vessels. To achieve near atmospheric
pressure in the vessels once the mixture has been expanded, the mixing cylinder has to be
mixed at 1 bar above atmospheric pressure. As the entire manifold is made from 316 steel
there is no issue with pressure build up or leakage.
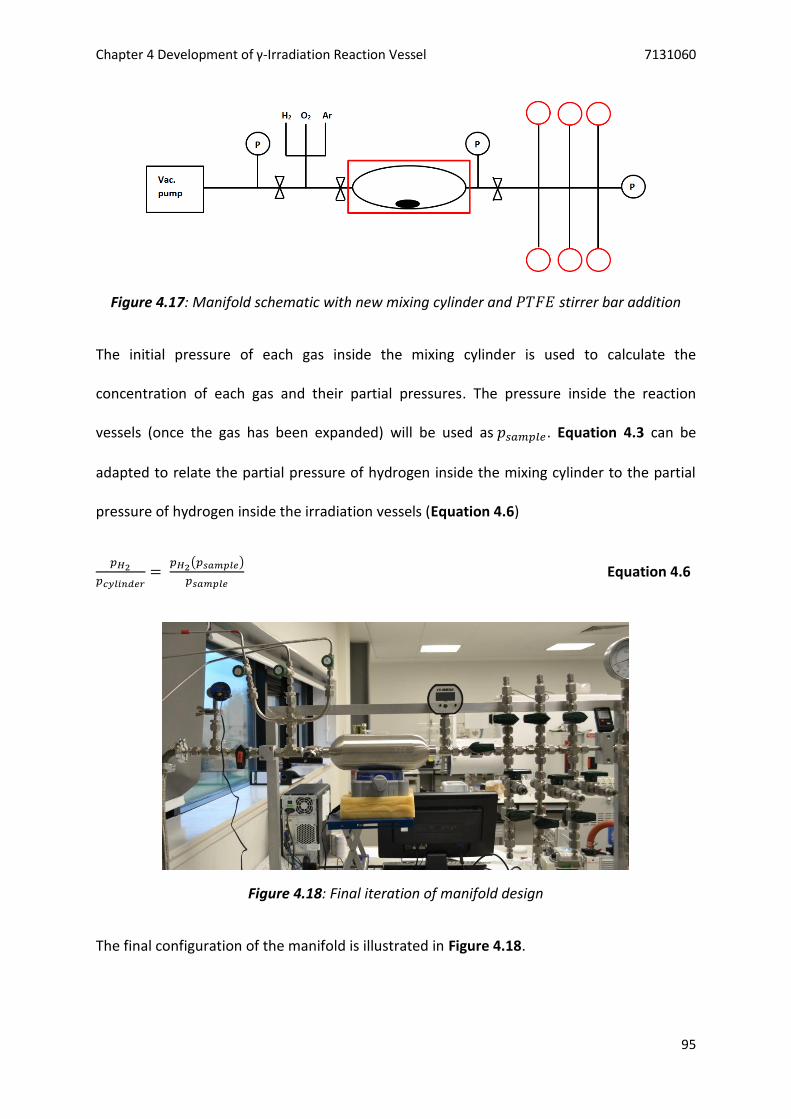
Chapter 4 Development of γ-Irradiation Reaction Vessel 7131060
95
Figure 4.17: Manifold schematic with new mixing cylinder and 𝑃𝑇𝐹𝐸 stirrer bar addition
The initial pressure of each gas inside the mixing cylinder is used to calculate the
concentration of each gas and their partial pressures. The pressure inside the reaction
vessels (once the gas has been expanded) will be used as 𝑝𝑠𝑎𝑚𝑝𝑙𝑒. Equation 4.3 can be
adapted to relate the partial pressure of hydrogen inside the mixing cylinder to the partial
pressure of hydrogen inside the irradiation vessels (Equation 4.6)
𝑝𝐻2
𝑝𝑐𝑦𝑙𝑖𝑛𝑑𝑒𝑟=
𝑝𝐻2(𝑝𝑠𝑎𝑚𝑝𝑙𝑒)
𝑝𝑠𝑎𝑚𝑝𝑙𝑒 Equation 4.6
Figure 4.18: Final iteration of manifold design
The final configuration of the manifold is illustrated in Figure 4.18.

Chapter 4 Development of γ-Irradiation Reaction Vessel 7131060
96
Figure 4.19 highlights a repeat of the experiment seen in Figure 4.16iv where three gaseous
components are mixed and several samples are analysed to ascertain how much scatter
there is between them. This time however, the gases are mixed in the mixing cylinder first
and agitated for 30 mins before being expanded into the vessels.
Figure 4.19: Mixing efficiency of manifold with mixing cylinder for a three component gas mixture (n.b. all four data sets superimposed)
The relative standard deviation has significantly decreased from 29.62 to 1.02; this gives
significant confidence in the mixing ability of the manifold.
Summary
A significant quantity of time and effort has been expended to ensure that all aspects of this
part of the research, from initial gas mixing to sampling and final analysis are as accurate
and repeatable as possible.
50
100
150
200
250
300
350
200 300 400 500 600 700 800 900
H2 p
eak
area
/ A
U
Pressure / mbar
5:5:90 H2:O2:Ar
Vessel 1Vessel 2Vessel 3Vessel 4
R.S.D. 1.02

Chapter 5 Dosimetry 7131060
97
5 Dosimetry
The following chapter outlines what dosimetry is and why it is an important part in radiation
chemistry. It discusses the different types of dosimetry utilised in this research and the
advantages and disadvantages of each one for a particular system of interest. It will also
look at previous literature and how dosimetry is dealt with in similar systems and
circumstances to this research.
5.1 Background
It is important to quantify the amount of energy that is transferred between a radiation field
and an absorbing material and how this energy is distributed in the absorbing system. This
quantification constitutes radiation dosimetry and is termed absorbed dose, which has units
of amount of energy absorbed per unit mass of irradiated material. The SI derived unit of
absorbed dose is the Gray (Gy) (Equation 5.1), however, older sources of literature use the
rad. Conversion between Gray and rad is shown in Equation 5.2.
1 Gy = 1 J kg−1 Equation 5.1
1 Gy = 100 rad Equation 5.2
The amount of energy transferred to a material and its distribution throughout the material
are dependent on many factors; these include the type of radiation (α particles transfer a
larger quantity of energy during collisions than γ- rays and lead to a column-like structure of
ionisation and excitation events), the energy of the emitted radiation (higher energy
radiation will penetrate further into the material) and finally, the composition of the
absorbing material (a solid will absorb more energy than a gaseous material due to the
higher density and greater stopping power of the solid).
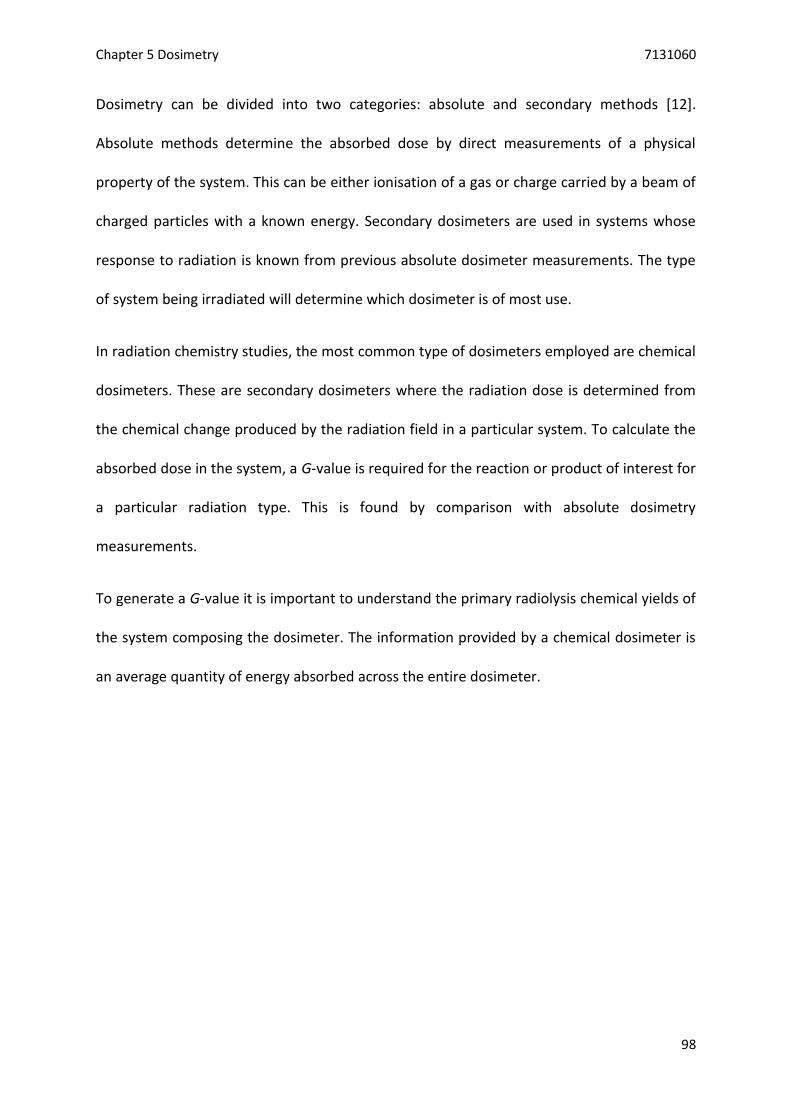
Chapter 5 Dosimetry 7131060
98
Dosimetry can be divided into two categories: absolute and secondary methods [12].
Absolute methods determine the absorbed dose by direct measurements of a physical
property of the system. This can be either ionisation of a gas or charge carried by a beam of
charged particles with a known energy. Secondary dosimeters are used in systems whose
response to radiation is known from previous absolute dosimeter measurements. The type
of system being irradiated will determine which dosimeter is of most use.
In radiation chemistry studies, the most common type of dosimeters employed are chemical
dosimeters. These are secondary dosimeters where the radiation dose is determined from
the chemical change produced by the radiation field in a particular system. To calculate the
absorbed dose in the system, a G-value is required for the reaction or product of interest for
a particular radiation type. This is found by comparison with absolute dosimetry
measurements.
To generate a G-value it is important to understand the primary radiolysis chemical yields of
the system composing the dosimeter. The information provided by a chemical dosimeter is
an average quantity of energy absorbed across the entire dosimeter.

Chapter 5 Dosimetry 7131060
99
5.2 Aqueous Dosimetry
The most widely used chemical dosimeter is that of the Fricke dosimeter [12]. As a result, it
is one of the most mechanistically understood systems. It concerns the redox chemistry of
the ferrous ion (𝐹𝑒2+) and its oxidation to the ferric ion (𝐹𝑒3+) by the products of 𝐻2𝑂
radiolysis. The dosimeter is composed of an aerated aqueous solution of iron (II) sulphate
(𝐹𝑒𝑆𝑂4) and sulphuric acid (𝐻2𝑆𝑂4). The sulphuric acid acts as a proton source which helps
to convert reducing radicals to oxidising radicals and create an oxidising environment, in
turn leading to the oxidation of 𝐹𝑒2+ to 𝐹𝑒3+. The reaction scheme for the radiolysis of the
Fricke dosimeter is outlined in the following reactions:
𝑒𝑎𝑞− + 𝑂2 → 𝑂2
− Reaction 5.1
𝐻+ + 𝑂2− → 𝐻𝑂2
. Reaction 5.2
𝑒𝑎𝑞− + 𝐻𝑎𝑞
+ → 𝐻. Reaction 5.3
𝐻. + 𝑂2 → 𝐻𝑂2. Reaction 5.4
𝐹𝑒2+ + 𝐻. + 𝐻2𝑂 → 𝐹𝑒3+ + 𝐻2 + 𝑂𝐻− Reaction 5.5
𝐹𝑒2+ + 𝑂𝐻. → 𝐹𝑒3+ + 𝑂𝐻− Reaction 5.6
𝐹𝑒2+ + 𝐻2𝑂2 → 𝐹𝑒3+ + 𝑂𝐻. + 𝑂𝐻− Reaction 5.7
𝐹𝑒2+ + 𝐻𝑂2. + 𝐻2𝑂 → 𝐹𝑒3+ + 𝑂𝐻. + 𝑂𝐻− Reaction 5.8
𝐹𝑒3+ + 𝐻. → 𝐹𝑒2+ + 𝐻+ Reaction 5.9
Once irradiated, the resulting solution is analysed using UV-Vis spectrophotometry, as the
𝐹𝑒3+ ion exhibits a characteristic absorption at 304 nm. The absorption value at this
wavelength is subtracted from an unirradiated ‘blank’ value to obtain the true absorption
value. The dose received by the irradiated solution is then determined using Equation 5.3:

Chapter 5 Dosimetry 7131060
100
Absorbed Dose, 𝐷𝐷 = 100 F 𝐴𝑏𝑠
𝜀 𝜌 𝐺(𝐹𝑒3+) 𝐿 Equation 5.3
where 𝐴𝑏𝑠 is the true absorption value at 304 nm for the irradiated Fricke solution, F is the
Faraday constant (9.648x10⁴ C mol-1), ε is the molar extinction coefficient of the 𝐹𝑒3+ ion
(2174 dm3 mol-1 cm-1), ρ is the density of the Fricke solution (1.024 g cm-3), 𝐺(𝐹𝑒3+) is the
radiolytic yield of 𝐹𝑒3+ (15.5 molecules 100 eV-1 for 60𝐶𝑜 gamma rays) and L is the path
length of the light in the measured Fricke solution. Once the absorbed dose is calculated,
the dose rate can be calculated by dividing the absorbed dose by the irradiation time.
The Fricke dosimeter has a linear absorption within the range of 0-400 Gy. Above this dose,
the oxygen dissolved in the solution is exhausted which leads to a reduction in the oxidation
of 𝐹𝑒2+. This oxidation can also occur with light; therefore all solutions must be kept in the
dark.
To make 500 ml of stock Fricke solution, 0.2 g 𝐹𝑒𝑆𝑂4. 𝐻2𝑂 (Fisher chemicals, laboratory
reagent grade) and 11 ml concentrated 𝐻2𝑆𝑂4 (Fluka Analytical, ≥ 97.5%) are combined with
deionised water. This gives a concentration of 1 mM 𝐹𝑒𝑆𝑂4 in 0.4 M 𝐻2𝑆𝑂4 stock solution.
Irradiations are carried out by placing 3 ml of the stock solution into a vial that is
representative of the reaction vessel to be used in the research. This is irradiated for a short
period of time and the resulting solution is pipetted into a cuvette and analysed at 304 nm
in the UV-Vis spectrophotometer. All experiments use a test tube rack configuration for
irradiations, therefore dosimetry was carried out for each position within this rack. Both
60𝐶𝑜 source rods were used and no attenuation was in place due to the fact that this
configuration gave the highest dose rates achievable. To ascertain the relative dose rate of
each individual position in the rack, two different irradiation times and three repeats of

Chapter 5 Dosimetry 7131060
101
each time were carried out. This reduced the random error of transferring the stock solution
between the irradiation vessel and the cuvette to a minimum. To replicate multiple samples
being irradiated at once, empty vessels were placed in front of the irradiated solution to
investigate the attenuation of the reaction vessels. Figure 5.1 shows the results for the 4x6
rack showing i) the unattenuated dose rate and ii) fully attenuated dose rates.

Chapter 5 Dosimetry 7131060
102
i)
ii)
Figure 5.1: Fricke dosimetry results for the test tube rack array showing i) Unattenuated dose rate ii) Fully attenuated dose rate (units – Gy min-1) (correct as of 10th February 2015)
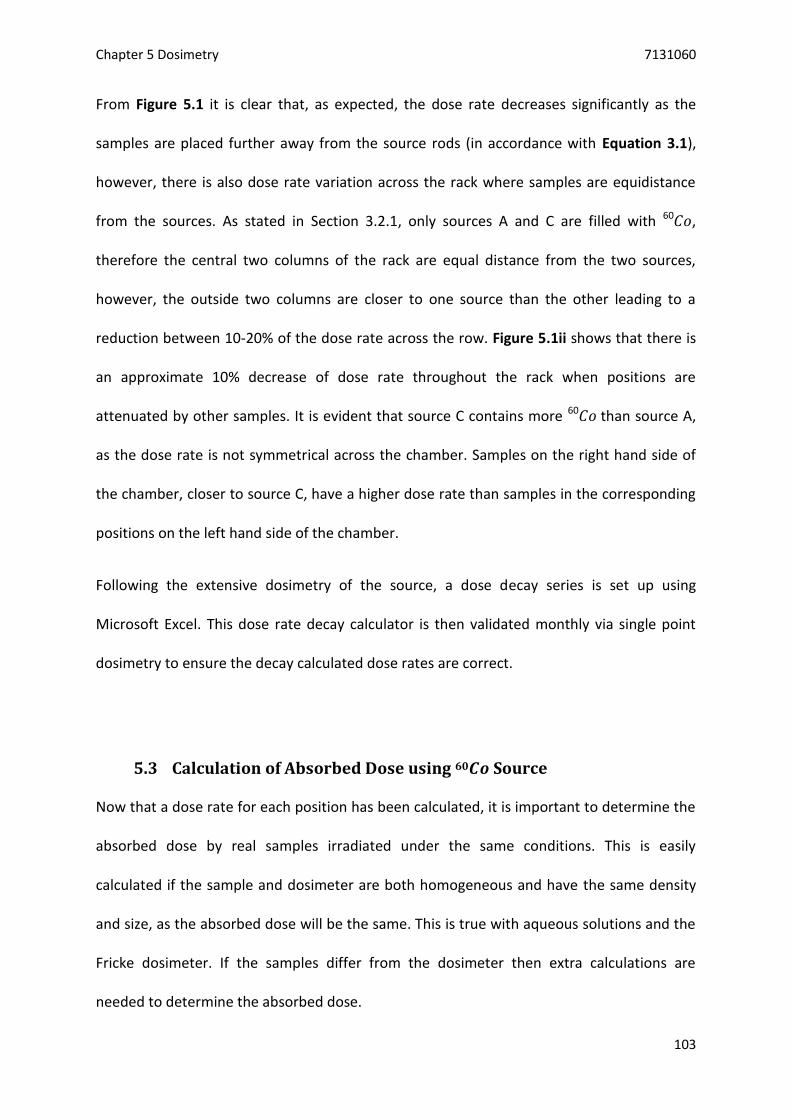
Chapter 5 Dosimetry 7131060
103
From Figure 5.1 it is clear that, as expected, the dose rate decreases significantly as the
samples are placed further away from the source rods (in accordance with Equation 3.1),
however, there is also dose rate variation across the rack where samples are equidistance
from the sources. As stated in Section 3.2.1, only sources A and C are filled with 60𝐶𝑜,
therefore the central two columns of the rack are equal distance from the two sources,
however, the outside two columns are closer to one source than the other leading to a
reduction between 10-20% of the dose rate across the row. Figure 5.1ii shows that there is
an approximate 10% decrease of dose rate throughout the rack when positions are
attenuated by other samples. It is evident that source C contains more 60𝐶𝑜 than source A,
as the dose rate is not symmetrical across the chamber. Samples on the right hand side of
the chamber, closer to source C, have a higher dose rate than samples in the corresponding
positions on the left hand side of the chamber.
Following the extensive dosimetry of the source, a dose decay series is set up using
Microsoft Excel. This dose rate decay calculator is then validated monthly via single point
dosimetry to ensure the decay calculated dose rates are correct.
5.3 Calculation of Absorbed Dose using 60𝑪𝒐 Source
Now that a dose rate for each position has been calculated, it is important to determine the
absorbed dose by real samples irradiated under the same conditions. This is easily
calculated if the sample and dosimeter are both homogeneous and have the same density
and size, as the absorbed dose will be the same. This is true with aqueous solutions and the
Fricke dosimeter. If the samples differ from the dosimeter then extra calculations are
needed to determine the absorbed dose.

Chapter 5 Dosimetry 7131060
104
Equation 5.3 shows how absorbed dose, 𝐷𝐷, is related to the radiochemical yield of product
formed by irradiation (in this case 𝐺(𝐹𝑒3+) for Fricke dosimeter). The absorbed dose in a
sample 𝐷𝑆 is related to absorbed dose in the dosimeter by Equation 5.4:
𝐺(𝑃)𝑠 = 𝐺(𝑃′)𝐷 [𝑃]𝑆
[𝑃′]𝐷 𝜌𝐷
𝜌𝑆 𝐷𝐷
𝐷𝑆 Equation 5.4
where 𝐺(𝑃′)𝐷 is the radiochemical yield of product 𝑃′ formed in the dosimeter, [𝑃]𝑆 and
[𝑃′]𝐷 are the measured yields of 𝑃 and 𝑃′ (moles per unit volume) in the sample and
dosimeter when exposed to the same radiation field, 𝜌𝐷 and 𝜌𝑆 are the densities of the
sample and dosimeter and 𝐷𝐷
𝐷𝑆 is the ratio of absorbed dose per unit mass in the sample and
dosimeter. The absorbed dose in the sample and dosimeter are related by the following
equation:
𝐷𝑆 = 𝐷𝐷 (
𝜇𝑒𝑛𝜌
)𝑆
(𝜇𝑒𝑛
𝜌)
𝐷
Equation 5.5
where (𝜇𝑒𝑛
𝜌)
𝑆 and (
𝜇𝑒𝑛
𝜌)
𝐷 are the mass energy absorption coefficients for the sample and
dosimeter respectively.
From the 60𝐶𝑜 decay scheme seen in Figure 3.2, the energies of photons emitted by the
source are 1.17 and 1.33 MeV and from Figure 1.8 (replicated in Figure 5.2) it is seen that
these energies lie in the region where Compton scattering is the dominant process of γ – ray
absorption.
(molecules 100 eV-1)

Chapter 5 Dosimetry 7131060
105
Figure 5.2: γ-ray interaction processes and their dependence on photon energy and Z of medium (replicated from [13])
Therefore Equation 5.5 can be simplified to the following:
𝐷𝑆 = 𝐷𝐷 (𝑍 𝐴⁄ )𝑆
(𝑍 𝐴⁄ )𝐷 Equation 5.6
where 𝑍 𝐴⁄ is the ratio of atomic number to atomic weight for an element.
This simplification is incorporated because Compton absorption is proportional to the
number of electrons in the medium and not to the way in which they are bound in the
atoms. As the number of electrons per unit mass of material is proportional to 𝑍 𝐴⁄ , it does
not require knowledge of mass energy absorption coefficients.
5.3.1 Adsorbed Dose in Gaseous Systems
For a mixture such as the systems of interest in this research, a mean value (𝑍 𝐴⁄̅̅ ̅̅ ̅̅ ), is
calculated using Equation 5.7.
𝑍 𝐴⁄̅̅ ̅̅ ̅̅ = 𝛴 [𝑤𝑖 (𝑍
𝐴)
𝑖] Equation 5.7
𝑤𝑖 is the weight fraction of element i in the medium. Equation 5.6 then becomes:
0
20
40
60
80
100
120
0.01 0.1 1 10 100
Z o
f m
ediu
m
hν / MeV
Photoelectric effect
Compton effect
Pair production

Chapter 5 Dosimetry 7131060
106
𝐷𝑆 = 𝐷𝐷 (𝑍 𝐴⁄̅̅ ̅̅ ̅̅ )
𝑆
(𝑍 𝐴⁄̅̅ ̅̅ ̅̅ )𝐷
Equation 5.8
The Fricke dosimeter has the following weight percentages: 10.84% 𝐻2, 87.91% 𝑂2 and
1.25% sulphur, therefore (𝑍 𝐴⁄ )̅̅ ̅̅ ̅̅ ̅̅𝐷 is calculated thus:
(𝑍 𝐴⁄ )̅̅ ̅̅ ̅̅ ̅̅𝐷 = [0.108 x (
2
2.016)] + [0.88 x (
16
31.998)] + [0.012 x (
16
32.06)]
= 0.5532
A gas mixture with partial pressures of 5:5:90 𝐻2: 𝑂2: 𝐴𝑟 has the following weight
percentages (in a 10 cm3 reaction vessel at 1 bar absolute), 0.27% 𝐻2, 4.25% 𝑂2 and 95.48%
𝐴𝑟, therefore (𝑍 𝐴⁄ )̅̅ ̅̅ ̅̅ ̅̅𝑆 is calculated thus:
(𝑍 𝐴⁄ )̅̅ ̅̅ ̅̅ ̅̅𝑆 = [0.0027 x (
2
2.016)] + [0.0425 x (
16
31.998)] + [0.9548 x (
18
39.948)]
= 0.4541
Equation 5.8 then becomes:
𝐷𝑆 = 𝐷𝐷 0.8209 Equation 5.9
Assuming that both sample and dosimeter are of the same size (volume), exposed to the
same irradiation field and irradiated in the same vessels, then a gaseous mix of 5:5:90
𝐻2: 𝑂2: 𝐴𝑟 will receive 82% of the equivalent absorbed dose of the Fricke dosimeter.
For samples that contain an oxide powder, only the dose absorbed by the gas is considered.
This is because the species formed/reacted that are of interest are gaseous species that
originate from the gas phase. The presence of an oxide powder may lead to catalytic or

Chapter 5 Dosimetry 7131060
107
steric effects but it is unknown whether it plays a part in the radiation chemistry reaction
mechanism.
5.3.2 Literature Review of Heterogeneous System Dosimetry
There are several different approaches when dealing with the dosimetry of heterogeneous
systems in the literature. In a paper by Nilsson and Jonsson, investigating the γ – ray induced
dissolution of 𝑈𝑂2 pellets in 10 mM hydrogen carbonate (𝐻𝐶𝑂3−) solutions, the dose rate is
just that determined by Fricke dosimetry without any subsequent correction [53].
Experiments carried out by Petrik et al. [25] which investigated the gamma radiolysis of
water on the surface of a variety of metal oxide surfaces, stated that the absorbed dose rate
is determined by the Fricke dosimeter only, without subsequent correction. In a paper by
Stone [54] investigating the radiolysis of cyclohexane in a xenon matrix, Fricke dosimetry
was used to determine the dose rate of the gamma source, however, for the higher Z
materials of interest, an ion chamber with walls composed of graphite was used to
determine the energy absorbed by the cyclohexane and the results extrapolated to
ascertain a weighting factor for the dose absorbed by the xenon. The same approach was
used by Sagert and Robinson [55] when investigating nitrous oxide (𝑁2𝑂), adsorbed to silica
gel and 𝑍𝑟𝑂2. The dose rate of the source was determined by Fricke dosimetry and an ion
chamber with walls composed of 𝑍𝑟𝑂2 was utilised to investigate the equivalent dose
absorbed by the 𝑍𝑟𝑂2. There was no reference made to how the energy absorbed by 𝑁2𝑂
was calculated, however it was found that 𝑍𝑟𝑂2 absorbs 10% more energy than the Fricke
solution when exposed to the same radiation field. This value has been used in subsequent
papers by LaVerne and Tandon [29, 56] which investigated the hydrogen formation from
radiolysis of adsorbed water on several metal oxide powders. The energy absorbed by the
Chapter 5 Dosimetry 7131060
108
adsorbed water was calculated directly from Fricke measurements. A 10% weighting factor
was added to this energy to determine the energy absorbed by the metal oxides. They
plotted their results as a function of dose absorbed by the water alone and also as a
function of total energy absorbed by the entire system (oxide and water).
From these various references it is clear that there is not a clearly outlined methodology for
determining the absorbed dose in a heterogeneous system. In most cases, the dose
absorbed by the phase of interest (usually an adsorbed organic species) is calculated as that
absorbed by the equivalent Fricke measurement whilst dose absorbed by the solid metal
oxide phase is neglected. In other references however, a weighting factor is added to the
absorbed dose calculated by the Fricke dosimeter for higher Z materials.
In this research, only the energy absorbed by the gas phase will be utilised to determine G-
values for the systems of interest. The dose rate from the gamma irradiation source will be
determined by Fricke dosimetry and these values corrected for the difference in sample
density, using Equation 5.9 for the energy absorbed by 𝐻2: 𝑂2: 𝐴𝑟 gas mixtures and
Equation 5.10 to estimate the dose absorbed by air.
𝐷𝑆 = 𝐷𝐷 0.9022 Equation 5.10
assuming air has the following weight percentage, 75.56% 𝑁2, 23.15% 𝑂2 and 1.29% 𝐴𝑟 and
thus (𝑍 𝐴⁄ )̅̅ ̅̅ ̅̅ ̅̅𝑆 = 0.4992.

Chapter 5 Dosimetry 7131060
109
5.4 Disadvantages of Fricke Dosimetry with Metal Vessels
As stated previously, dosimetry using a Fricke solution is investigated by filling an
appropriate reaction vessel with an aliquot of the solution. In this research there are two
distinct reaction vessels. These are the glass headspace vials shown in Figure 3.5 pertaining
to the air radiolysis experiments and the metal sample cylinders seen in Figure 4.11 to
investigate the radiolysis of 𝐻2 − 𝑂2 gas mixtures. Borosilicate glass is very chemically
resistant to dilute acidic solutions therefore no issues arise from irradiating Fricke solutions
in these reaction vessels. However, sulphuric acid does react with most metals to liberate
hydrogen gas and a salt of the metal, thus even at these low concentrations (0.4 M), there
may be an etching effect on the steel. It is important to quantify the affect the steel has on
attenuating the radiation field, therefore the dose rates attained from Fricke in glass vials
cannot be extrapolated for steel vessels. A different type of chemical dosimeter will
consequently be needed to investigate the dose absorbed by 𝐻2 − 𝑂2 gas mixtures.
There are several other materials that are used for dosimetry in radiation chemistry.
Another commonly used chemical dosimeter is that of ceric sulphate which investigates the
reduction of ceric ions (𝐶𝑒4+) to cerrous ions (𝐶𝑒3+). This suffers the same problem as
Fricke dosimetry in that it is a 0.4 M acid solution. There are also solid state dosimeters such
as polymethylmethacrylate ( 𝑃𝑀𝑀𝐴 ), which degrades under irradiation and forms
chromophores which can be measured spectrophotometrically. This will not react with the
steel vessels and is available from a commercial company which therefore increases
repeatability across several measurements. A disadvantage of this type of dosimeter is that
the 1 cm strips of 𝑃𝑀𝑀𝐴 are ready made to be able to fit into a UV-Vis spectrophotometer.
These dimensions do not allow the strips to be placed in the sample cylinders without
Chapter 5 Dosimetry 7131060
110
cutting them down to an appropriate size. This reduces the repeatability of each strip as the
dimensions will change between samples and also the certified calibration for each batch
may not be fit for purpose. Another disadvantage is that the density between 𝑃𝑀𝑀𝐴 and
gaseous samples is greater than that of gaseous samples and Fricke solutions, therefore
more corrections are needed to ascertain the absorbed dose by the gas phase.
5.5 Gas Phase Dosimetry
It was decided to use a gas phase dosimeter in order to negate the need for any density
corrections. The two most commonly used gas phase dosimeters are 𝑁2𝑂 and ethylene
(𝐶2𝐻4). Both systems are well investigated and understood and use gas chromatography to
measure the yield of 𝑁2 and 𝐻2 respectively and determine the energy absorbed by the
system. The following section analyses the literature to review the work that has been
undertaken for these gaseous dosimeter systems.
5.5.1 Gas Phase Dosimetry Literature
As stated in Figure 5.2, the main energy deposition process for solid and liquid samples of
low Z numbers is Compton scattering where the energy absorbed can be calculated from a
secondary dosimeter. In gaseous samples however, there is very little direct absorption of
gamma radiation and most of the absorbed energy comes from secondary electrons
generated by the gamma radiation interacting with the vessel walls [57]. Therefore, the
sample vessel geometry and nature of the wall materials is of importance for gas phase
dosimetry.

Chapter 5 Dosimetry 7131060
111
Johnson [58] irradiated 𝑁2𝑂 with a 60𝐶𝑜 gamma source and calculated a G(𝑁2) value of
12.8 ± 0.4 molecules 100 eV-1. They used two parallel methods to determine the energy
absorbed in the system; these were ionisation current measurements and the Fricke
dosimeter. Corrections were applied to these measurements to determine the dose
absorbed by 𝑁2𝑂, before determining the dose rate from ionisation current measurements
by applying the following equation (5.11):
𝐷𝑅 = 𝐽 𝑊𝑁2𝑂 Equation 5.11
where 𝐽 is the number of ion pairs formed per minute and 𝑊𝑁2𝑂 is the mean energy
required to produce an ion pair in eV.
Determination of the energy absorbed by 𝑁2𝑂 as a function of the Fricke dosimetry has
been calculated using Equation 5.12.
𝐷𝑁2𝑂 = 𝐷𝐷 𝑍𝑁2𝑂𝑆𝑁2𝑂
𝑍𝐷𝑆𝑊 Equation 5.12
where 𝐷𝐷 is the dose absorbed by the Fricke dosimeter, 𝑍𝑁2𝑂 and 𝑍𝐷 are the number of
electrons cm-1 for 𝑁2𝑂 gas and the Fricke dosimeter respectively and 𝑆𝑁2𝑂 and 𝑆𝑊 are the
stopping powers per electron in 𝑁2𝑂 and the vessel wall respectively. This equation has
several uncertainties however, and the author disregarded this calculation and relied solely
on ionisation current measurements.
McLaren [59] replicated part of this work and attained G(𝑁2) values of 9.03 ± 0.1 molecules
100 eV-1 by using ionisation measurements to determine dose rates. They attribute the
difference in yield determined by Johnson to leaks of air into the system during
experiments. These errors limit the accuracy of the dosimeter to 10%.

Chapter 5 Dosimetry 7131060
112
Jankovsky [60] compared the use of 𝑁2𝑂 and ethylene for gas phase dosimetry and found
that the yield of G(𝑁2) from 𝑁2𝑂 value varied between 9.03 and 12.8 molecules 100 eV-1 of
energy absorbed using 60𝐶𝑜 as the radiation source. This data has a relative standard
deviation of 0.1. This scatter is attributed to leaks in the system and also to the unavoidable
difficulties in determining small 𝑁2 yields from irradiation cells with ≤ 100 cm3 volume.
Studies using ethylene found yields of hydrogen varied between 1.2-1.36 molecules 100 eV-1
energy absorbed for 60𝐶𝑜 gamma rays. The relative standard deviation for this data is 0.04.
Therefore their conclusions are that ethylene is the better system to determine gas phase
dosimetry when small reaction volumes are utilised.
Ethylene gas has also been used in mixed radiation fields to determine absorbed dose [61,
62]. Ikezoe et al. determined the yield of 𝐻2 from ethylene radiolysis to be 1.3 molecules
100 eV-1 for both 60𝐶𝑜 gamma rays and reactor radiation which was a mix of neutrons and
gamma rays [61]. A similar study by Srinivasan et al. determined the yield of 𝐻2 to be 1.2
molecules 100 eV-1 in a reactor radiation field [62].
Summary
From this literature selection it is evident that ethylene is the more suitable option for a gas
phase dosimeter. This is due to the amount of scatter in the G(𝑁2) yields which arises from
air ingress into the system and also the limits of detection required for low volumes of
sample analysis. As stated in Section 3.3.1, the current gas chromatogram configuration is
optimised for the detection of 𝐻2 down to very low concentrations (~100 ppm) which
indicates that the configuration is more suited to detect the radiolysis products from

Chapter 5 Dosimetry 7131060
113
ethylene than that of 𝑁2𝑂. Another factor is the vacuum pump employed in the GC analysis
system does not evacuate the sample loop to absolute vacuum, only to approximately 1% of
atmospheric pressure. This means it is almost impossible to remove 𝑁2 from the sample
loop entirely without further considerations, so that yields of 𝑁2 from 𝑁2𝑂 radiolysis could
not be determined accurately.
5.5.2 Ethylene Dosimetry Results
To ascertain the dose rate inside the steel cylinders, the cylinders are attached to the
manifold outlined in Section 3.4.1 and evacuated to a pressure of < 20 mTorr. The ethylene
calibration gas is fed into the cylinders until atmospheric pressure is achieved inside the
vessels before the samples are placed inside the test tube rack array and irradiated for
several hours. Once irradiated, the samples are analysed using the GC, following the same
procedure as outlined in Section 4.3.3. Following analysis, the vessels are washed with
methanol and baked at 250 °C for several hours in order to ensure any polymeric products
that may condense onto the vessel walls are removed before the vessels are used again.
Due to the steric constraints inside the irradiation chamber and the high doses required,
only the front row of the test tube rack has been tested (Figure 5.3). For the calculation of
the absorbed dose, the value of G(𝐻2) = 1.36 molecules 100 eV-1 was utilised [59] and a
value of 28.05 g mol-1 to represent the molecular weight of ethylene was used to calculate
the mass of ethylene irradiated.
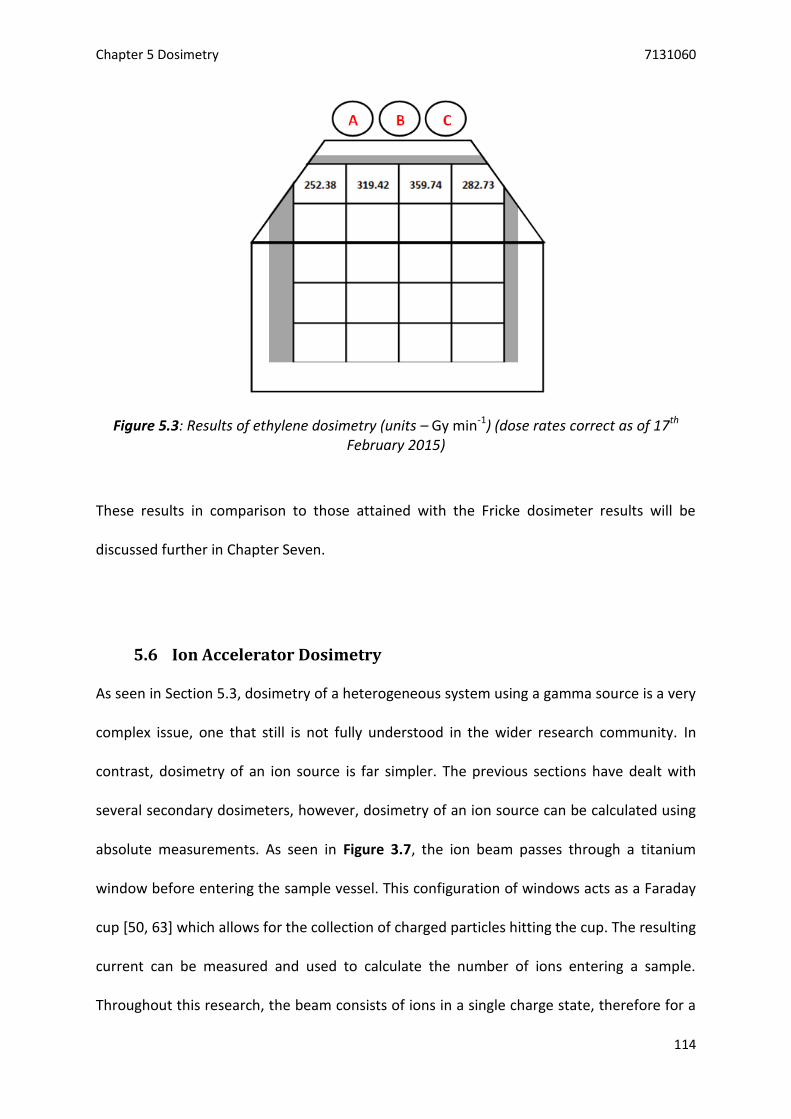
Chapter 5 Dosimetry 7131060
114
Figure 5.3: Results of ethylene dosimetry (units – Gy min-1) (dose rates correct as of 17th February 2015)
These results in comparison to those attained with the Fricke dosimeter results will be
discussed further in Chapter Seven.
5.6 Ion Accelerator Dosimetry
As seen in Section 5.3, dosimetry of a heterogeneous system using a gamma source is a very
complex issue, one that still is not fully understood in the wider research community. In
contrast, dosimetry of an ion source is far simpler. The previous sections have dealt with
several secondary dosimeters, however, dosimetry of an ion source can be calculated using
absolute measurements. As seen in Figure 3.7, the ion beam passes through a titanium
window before entering the sample vessel. This configuration of windows acts as a Faraday
cup [50, 63] which allows for the collection of charged particles hitting the cup. The resulting
current can be measured and used to calculate the number of ions entering a sample.
Throughout this research, the beam consists of ions in a single charge state, therefore for a

Chapter 5 Dosimetry 7131060
115
continuous beam, Equation 5.13 can be used to determine the number of ions 𝑁
penetrating the sample.
𝑁 = 𝐼.𝑡
e Equation 5.13
where 𝐼 is the measured electric current (in amperes), 𝑡 is the irradiation time (in seconds)
and e is the elementary charge (in Coulombs). This value is used to calculate the absorbed
dose 𝐷, in the sample using Equation 5.14:
𝐷 = 𝑁𝐸
𝑛 Equation 5.14
where 𝐸 is the incident energy of each ion (in MeV) and 𝑛 is the ion charge state. All
experiments using the ion accelerator utilise a beam of 𝐻𝑒2+ ions, therefore 𝑛 is 2.
This method is the most commonly used for ion accelerator dosimetry [12, 64].
The electric current is measured by a pico-ammeter that is connected at several points
along the beam line.

Chapter 5 Dosimetry 7131060
116
Figure 5.4: Plot of current as a function of time for a 15 min irradiation using the ion accelerator showing the current measured on the 𝑇𝑖 window
Figure 5.4 shows the resulting current profile of a 15 min irradiation using a current of
20 nA. The current put on the 𝑇𝑖 window is very stable and only drops once during the
irradiation.
Summary
This chapter outlines the difficulties in calculating the absorbed dose in the systems of
interest to this research. In previous literature sources, there are many methods to
determine this dose, however, there is not a unified concept which is agreed upon. In this
research there are three systems of interest:
γ-radiolysis of air in contact with a metal oxide powder;
γ-radiolysis of 𝐻2: 𝑂2: 𝐴𝑟 mixtures in contact with metal oxide powders; and
radiolysis of 𝐻2: 𝑂2: 𝐴𝑟 mixtures using an accelerated ion beam
-5.0E-09
0.0E+00
5.0E-09
1.0E-08
1.5E-08
2.0E-08
2.5E-08
3 8 13 18 23
Ti w
ind
ow
cu
rren
t /
Am
ps
Time / min

Chapter 5 Dosimetry 7131060
117
Each system has different requirements with regards to how absorbed dose is calculated.
Dosimetry of the gamma source has been carried out with secondary chemical dosimeters,
due to their simplicity and adaptability. In the first system of interest, only the dose
absorbed by the air will be used to calculate G-values. This is achieved by the Fricke
dosimeter multiplied by a weighting factor (Equation 5.10) due to the difference in sample
density.
The dose absorbed by the 𝐻2: 𝑂2: 𝐴𝑟 mixtures will solely be used to determine loss of
reactants in the second system. Due to the nature of the sample vessels, ethylene gas is
used as the chemical dosimeter. The dose rates utilised are shown in Figure 5.3 which are
corrected for decay of the 60𝐶𝑜 source.
Experiments that use an ion accelerator as the radiation source, absolute dosimetry from
currents measurements collected during each experiment will be used to calculate the dose
received by the sample.

Chapter 6 Oxide Powder Characterisation 7131060
118
6 Oxide Powder Characterisation
This chapter outlines the physical properties of the two oxide powders utilised in this
research. Each oxide is characterised as received and after undergoing the regeneration
process outlined in Section 3.4.3. Finally, a comparison is made between the properties of
𝐶𝑒𝑂2 and 𝑍𝑟𝑂2. If the oxide powders have any catalytic effects on the gas phase chemistry,
then it is important to determine their physical properties.
6.1 Properties of 𝑪𝒆𝑶𝟐
6.1.1 As Received
To ascertain the purity and morphology of the 𝐶𝑒𝑂2 (as received), SEM and EDS analysis
were undertaken.
Figure 6.1: Scanning electron micrograph of 𝐶𝑒𝑂2 (as received)
Figure 6.1 illustrates the powder morphology of 𝐶𝑒𝑂2 using an SEM. It is clear from this
image that there is not a dominant morphology within the powder. There are well defined

Chapter 6 Oxide Powder Characterisation 7131060
119
edges along with irregular shaped grains and the average particle has faces with surface
area of approximately 3 µm2.
The EDS spectrum for the, as received 𝐶𝑒𝑂2 is shown in Figure 6.2. The carbon signal arises
from the carbon stub. Silicon is the largest impurity present, as stated in Section 3.1.2.
Figure 6.2: EDS spectrum of 𝐶𝑒𝑂2 (as received)
The BET adsorption-desorption isotherm is shown in Figure 6.3.
Figure 6.3: BET adsorption (solid trace) - desorption (dashed trace) of 𝐶𝑒𝑂2 (as received)
0.0
5.0
10.0
15.0
20.0
25.0
0 0.2 0.4 0.6 0.8 1
Qu
anti
ty a
dso
rbed
/ c
m3 g
-1
Relative pressure / (P/Po)

Chapter 6 Oxide Powder Characterisation 7131060
120
The isotherm in Figure 6.3 is a type three isotherm [65]. This indicates that adsorbate
molecules have a higher affinity for themselves rather than the surface of the sample [48].
When the relative pressure nears 1, the adsorbate molecules finally adhere to the surface in
large quantities. It is clear from the desorption isotherm (dashed trace) that there is
hysteresis in the isotherm, indicating the sample has a mesoporous nature [48].
The calculated BET surface area is 6.33 ± 0.02 m2 g-1.
The DRIFT spectra of the 𝐶𝑒𝑂2 (as received) is highlighted in Figure 6.4.
Figure 6.4: DRIFT spectra of 𝐶𝑒𝑂2 (as received)
The broad band at approximately 3500 cm-1 is the stretching mode of 𝑂 − 𝐻 and arises from
the adsorbed water on the oxide surface [66]. The water is present as water of
crystallisation or intra-molecular bound water. The sharp inverse band at 2300 cm-1 is due to
the asymmetrical stretching band of 𝐶𝑂2 present in the atmosphere and is used as a
0.0
0.2
0.4
0.6
0.8
1.0
1.2
1.4
1.6
1.8
2.0
2.2
5001000150020002500300035004000
Ref
lect
ance
/ %
Wavenumber / cm-1
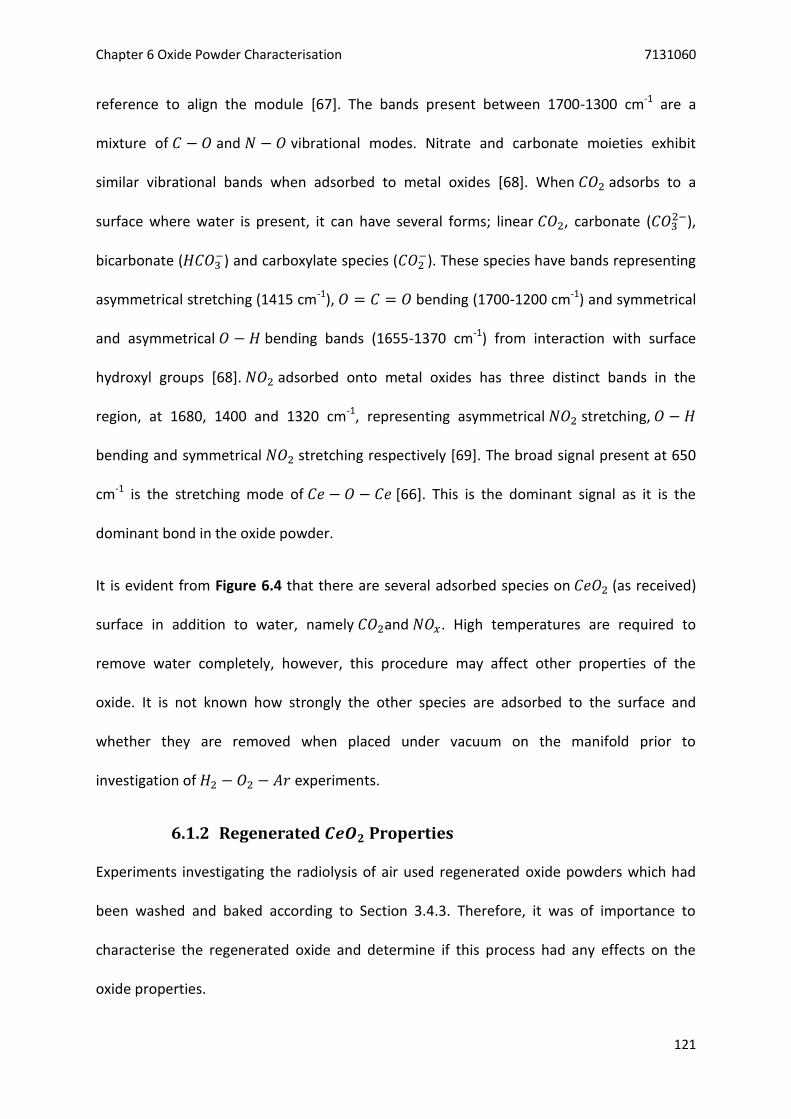
Chapter 6 Oxide Powder Characterisation 7131060
121
reference to align the module [67]. The bands present between 1700-1300 cm-1 are a
mixture of 𝐶 − 𝑂 and 𝑁 − 𝑂 vibrational modes. Nitrate and carbonate moieties exhibit
similar vibrational bands when adsorbed to metal oxides [68]. When 𝐶𝑂2 adsorbs to a
surface where water is present, it can have several forms; linear 𝐶𝑂2, carbonate (𝐶𝑂32−),
bicarbonate (𝐻𝐶𝑂3−) and carboxylate species (𝐶𝑂2
−). These species have bands representing
asymmetrical stretching (1415 cm-1), 𝑂 = 𝐶 = 𝑂 bending (1700-1200 cm-1) and symmetrical
and asymmetrical 𝑂 − 𝐻 bending bands (1655-1370 cm-1) from interaction with surface
hydroxyl groups [68]. 𝑁𝑂2 adsorbed onto metal oxides has three distinct bands in the
region, at 1680, 1400 and 1320 cm-1, representing asymmetrical 𝑁𝑂2 stretching, 𝑂 − 𝐻
bending and symmetrical 𝑁𝑂2 stretching respectively [69]. The broad signal present at 650
cm-1 is the stretching mode of 𝐶𝑒 − 𝑂 − 𝐶𝑒 [66]. This is the dominant signal as it is the
dominant bond in the oxide powder.
It is evident from Figure 6.4 that there are several adsorbed species on 𝐶𝑒𝑂2 (as received)
surface in addition to water, namely 𝐶𝑂2and 𝑁𝑂𝑥. High temperatures are required to
remove water completely, however, this procedure may affect other properties of the
oxide. It is not known how strongly the other species are adsorbed to the surface and
whether they are removed when placed under vacuum on the manifold prior to
investigation of 𝐻2 − 𝑂2 − 𝐴𝑟 experiments.
6.1.2 Regenerated 𝑪𝒆𝑶𝟐 Properties
Experiments investigating the radiolysis of air used regenerated oxide powders which had
been washed and baked according to Section 3.4.3. Therefore, it was of importance to
characterise the regenerated oxide and determine if this process had any effects on the
oxide properties.

Chapter 6 Oxide Powder Characterisation 7131060
122
Section 3.4.2 outlined the methodology employed to investigate the radiolysis of air over an
oxide surface. To determine the quantity of oxide powder needed to produce the 50% and
90% (by volume) oxide samples, the bulk density of the powder was required. This
parameter was determined by filling a known volume with oxide and recording its weight.
The bulk density of regenerated 𝐶𝑒𝑂2 was calculated as 1.424 ± 0.005 g cm-3. This value is
much lower than the crystal density of 𝐶𝑒𝑂2 which is 7.215 g cm-3, arising from the inability
of the powder to pack as tightly as a single crystal.
Figure 6.5: SEM images of regenerated 𝐶𝑒𝑂2 illustrating the macrostructure of the powder (top) and a large particle (bottom)

Chapter 6 Oxide Powder Characterisation 7131060
123
Figure 6.5 illustrates two electron micrographs from the regenerated oxide. There is no
dominant morphology within the sample with well-defined edges and irregular shaped
grains being dominant.
Changes in the surface area of the powder are significant as this may affect the catalytic
properties (if any) of the oxide in determining the gas phase radiation chemistry. Figure 6.6
illustrates the adsorption-desorption isotherm for regenerated 𝐶𝑒𝑂2. The BET surface area
for the regenerated 𝐶𝑒𝑂2 is 7.42 ± 0.02 m2 g-1.
Figure 6.6: BET adsorption (solid trace) – desorption (dashed trace) isotherm for regenerated 𝐶𝑒𝑂2
The isotherm in Figure 6.6 is identical in shape to the isotherm generated from 𝐶𝑒𝑂2 (as
received).
0.0
2.0
4.0
6.0
8.0
10.0
12.0
14.0
16.0
18.0
20.0
0 0.2 0.4 0.6 0.8 1
Qu
anti
ty a
dso
rbe
d /
cm
3 g
-1
Relative pressure / (P/Po)

Chapter 6 Oxide Powder Characterisation 7131060
124
Figure 6.7 illustrates the results from thermogravimetric analysis of regenerated 𝐶𝑒𝑂2
decomposed under static air and 𝑁2 up to 1000 °C:
Figure 6.7: Thermogram of regenerated 𝐶𝑒𝑂2 decomposed under 𝑁2 (blue) and static air (red). Heating rate 10 °C min-1
It is clear from this figure, that there are no impurities or vast quantity of adsorbed species
on regenerated 𝐶𝑒𝑂2, with the mass change being ± 0.5% from the initial mass.
Figure 6.8 shows the DRIFT spectra measured for regenerated 𝐶𝑒𝑂2. It highlights the nature
of any adsorbed species on the oxide surface:
98.0
98.5
99.0
99.5
100.0
100.5
101.0
101.5
102.0
0 100 200 300 400 500 600 700 800 900 1000
Mas
s /
%
Temperature / oC
N2
Air

Chapter 6 Oxide Powder Characterisation 7131060
125
Figure 6.8: DRIFT spectrum of regenerated 𝐶𝑒𝑂2
All of the absorption bands present in Figure 6.8 have previously been assigned in Figure
6.4.
6.1.3 Comparison of ‘As Received’ and Regenerated 𝑪𝒆𝑶𝟐
It is noticeable when comparing SEM images in Figures 6.1 and 6.5 that larger agglomerated
particles are present in the regenerated 𝐶𝑒𝑂2 that were not observed in the oxide before
washing and baking. The surface area of the faces has increased from 3 to 300 µm2. This
increase is likely to be an effect of heating the oxide and causing grains to combine and
agglomerate.
Although the particle size has increased in the regenerated oxide, the BET surface area
remained within 10% of the 𝐶𝑒𝑂2 (as received) after five subsequent regeneration cycles.
0.0
0.2
0.4
0.6
0.8
1.0
1.2
1.4
1.6
1.8
2.0
5001000150020002500300035004000
Re
fle
ctan
ce /
%
Wavenumber / cm-1

Chapter 6 Oxide Powder Characterisation 7131060
126
The bulk density of the regenerated oxide is within 1% of the 𝐶𝑒𝑂2 (as received),
highlighting that the regeneration process has little effect on the oxide properties.
There was very little difference between the DRIFT spectra of 𝐶𝑒𝑂2 (as received) and
regenerated 𝐶𝑒𝑂2 (Figures 6.4 and 6.8). Both spectra had identical absorption bands
indicating that the regeneration cycle outlined in Section 3.4.3 has no effect on the
concentration or identity of adsorbed species on 𝐶𝑒𝑂2. Figure 6.9 highlights DRIFT spectra
of an identical sample of 𝐶𝑒𝑂2 (as received) that has undergone five subsequent
regeneration cycles. A sample was taken after each cycle and anaylsed.
Figure 6.9: DRIFT spectra of 𝐶𝑒𝑂2 (as received) and regenerated 𝐶𝑒𝑂2 up to five subsequent regeneration cycles
0.0
0.2
0.4
0.6
0.8
1.0
1.2
1.4
1.6
1.8
2.0
5001000150020002500300035004000
Re
fle
ctan
ce /
%
Wavenumber / cm-1
As received Regen. 1
Regen. 2 Regen. 3
Regen. 4 Regen. 5

Chapter 6 Oxide Powder Characterisation 7131060
127
It is clear from Figure 6.9, that the regeneration process has no effect on the oxide powder
as no new bands are detected. Absorption bands present in 𝐶𝑒𝑂2 (as received) have not
diminished after consecutive washing and baking.
6.2 Properties of 𝒁𝒓𝑶𝟐
6.2.1 As Received
To ascertain the purity and morphology of the as received 𝑍𝑟𝑂2, SEM and EDS analysis were
undertaken.
Figure 6.10: SEM image of 𝑍𝑟𝑂2 (as received)
An SEM image of ‘as received’ 𝑍𝑟𝑂2 is shown in Figure 6.10. The 𝑍𝑟𝑂2 particles have a
defined rod like structure, and range in size from 10 to 40 µm in length.

Chapter 6 Oxide Powder Characterisation 7131060
128
The EDS spectrum of 𝑍𝑟𝑂2 is shown in Figure 6.11. It indicates that there are no major
impurities in the powder, with zirconium and oxygen being the only detectable elements in
the sample, apart from the carbon stub.
Figure 6.11: EDS spectrum of 𝑍𝑟𝑂2 (as received)
Figure 6.12 highlights the adsorption-desorption isotherm for 𝑍𝑟𝑂2 (as received). The
calculated BET surface area for this powder was 2.02 ± 0.04 m2 g-1.
Figure 6.12: BET adsorption (solid trace) – desorption (dashed trace) isotherm of 𝑍𝑟𝑂2 (as received)
0.0
1.0
2.0
3.0
4.0
5.0
6.0
7.0
0 0.2 0.4 0.6 0.8 1
Qu
anti
ty a
dso
rbed
/ c
m3 g
-1
Relative pressure / (P/Po)

Chapter 6 Oxide Powder Characterisation 7131060
129
Like the adsorption isotherms highlighted for 𝐶𝑒𝑂2 (Figures 6.3 and 6.6), this isotherm is
also type three. The features of which, were discussed after Figure 6.3.
The DRIFT spectra of 𝑍𝑟𝑂2 (as received) is highlighted in Figure 6.13.
Figure 6.13: DRIFT spectrum of 𝑍𝑟𝑂2 (as received)
The broad band at approximately 3500 cm-1 is the stretching mode of 𝑂 − 𝐻 and arises from
the adsorbed water on the oxide surface [66]. The water is present as water of
crystallisation or intra-molecular bound water. The band present between 1700-1400 cm-1 is
a mixture of 𝐶 − 𝑂 and 𝑁 − 𝑂 vibrational modes. Nitrate and carbonate moieties exhibit
similar vibrational bands when adsorbed to metal oxides [68]. When 𝐶𝑂2 adsorbs to a
surface where water is present, it can have several forms; linear 𝐶𝑂2, carbonate (𝐶𝑂32−),
0
0.2
0.4
0.6
0.8
1
1.2
5001000150020002500300035004000
Re
fle
ctan
ce /
%
Wavenumber / cm-1

Chapter 6 Oxide Powder Characterisation 7131060
130
bicarbonate (𝐻𝐶𝑂3−) and carboxylate species (𝐶𝑂2
−). These species have bands representing
asymmetrical stretching (1415 cm-1), 𝑂 = 𝐶 = 𝑂 bending (1700-1200 cm-1) and symmetrical
and asymmetrical 𝑂 − 𝐻 bending bands (1655-1370 cm-1) from interaction with surface
hydroxyl groups [68]. 𝑁𝑂2 adsorbed onto metal oxides has three distinct bands in the
region, at 1680, 1400 and 1320 cm-1, representing asymmetrical 𝑁𝑂2 stretching, 𝑂 − 𝐻
bending and symmetrical 𝑁𝑂2 stretching respectively [69]. All of these bands are visible in
Figure 6.13, however, some are stronger than others.
6.2.2 Regenerated 𝒁𝒓𝑶𝟐 Properties
As with 𝐶𝑒𝑂2 , it is important to characterise the regenerated oxide powder and to
determine if the regeneration process changes any of the oxide properties. The bulk density
of regenerated 𝑍𝑟𝑂2 has been calculated as 2.059 ± 0.007 g cm-3, which is approximately
35% of the crystal density (5.68 g cm-3) for the reasons explained in Section 6.1.2 for 𝐶𝑒𝑂2.
Figure 6.14 illustrates the morphologies of particles of regenerated 𝑍𝑟𝑂2:

Chapter 6 Oxide Powder Characterisation 7131060
131
Figure 6.14: SEM images of regenerated 𝑍𝑟𝑂2 illustrating large agglomerated particles
The dominant morphology of regenerated 𝑍𝑟𝑂2 is large agglomerated particles with well-
defined faces.

Chapter 6 Oxide Powder Characterisation 7131060
132
Figure 6.15: EDS spectrum of regenerated 𝑍𝑟𝑂2
Figure 6.15 shows the EDS spectrum of the regenerated 𝑍𝑟𝑂2. The most distinguishing
feature of Figure 6.15 is the presence of sodium in the regenerated 𝑍𝑟𝑂2. This impurity is
attributable to the regeneration process, where the oxide is washed with an aliquot of
5 mM 𝑁𝑎𝑂𝐻 to remove any adsorbed organics from the surface. The powder is washed
with copious amounts of deionised water to remove any excess sodium, however, it is clear
that 𝑍𝑟𝑂2 has a large affinity for sodium cations which are likely to adsorb onto the oxide
surface.
The thermogravimetric analysis results of regenerated 𝑍𝑟𝑂2 decomposed under static air
and 𝑁2 are displayed in Figure 6.16:

Chapter 6 Oxide Powder Characterisation 7131060
133
Figure 6.16: Thermogram of regenerated 𝑍𝑟𝑂2 decomposed under 𝑁2 (blue) and static air (red). Heating rate 10 °C min-1
As seen in Figure 6.7, there are no large impurities or adsorbed species in samples of
regenerated 𝑍𝑟𝑂2. The mass difference is within ± 0.5%.
Figure 6.17 is the adsorption-desorption isotherm for regenerated 𝑍𝑟𝑂2. The resulting BET
surface area was 2.24 ± 0.02 m2 g-1.
99.0
99.2
99.4
99.6
99.8
100.0
100.2
100.4
100.6
100.8
101.0
0 200 400 600 800 1000
Mas
s /
%
Temperature / oC
N2
Air

Chapter 6 Oxide Powder Characterisation 7131060
134
Figure 6.17: BET adsorption (solid trace)-desorption (dashed trace) isotherm of regenerated 𝑍𝑟𝑂2
The isotherm depicted in Figure 6.17 is of type three. There is a hysteresis loop in the
isotherm, indicating the sample has a mesoporous nature.
The DRIFT spectra for regenerated 𝑍𝑟𝑂2 is depicted in Figure 6.18.
0.0
1.0
2.0
3.0
4.0
5.0
6.0
7.0
8.0
9.0
0 0.2 0.4 0.6 0.8 1
Qu
anti
ty a
dso
rbed
/ c
m3
g-1
Relative pressure / (P/Po)

Chapter 6 Oxide Powder Characterisation 7131060
135
Figure 6.18: DRIFT spectrum of regenerated 𝑍𝑟𝑂2
The absorption bands present in Figure 6.18 have all been identified and assigned in Figure
6.13 for 𝑍𝑟𝑂2 (as received).
6.2.3 Comparison of ‘As Received’ and Regenerated 𝒁𝒓𝑶𝟐
Comparing Figure 6.10 and Figure 6.14, the regenerated 𝑍𝑟𝑂2 has larger particle sizes than
the fresh oxide powder. The rod-like morphology is still present in regenerated 𝑍𝑟𝑂2,
however, larger agglomerated particles have been observed. These agglomerated particles
have faces with surface areas of at least 400 µm2 which is an order of magnitude above the
particles observed in Figure 6.10. Although the particles of the regenerated oxide are an
order of magnitude larger than 𝑍𝑟𝑂2 (as received), they still have defined faces and appear
to be agglomerations of smaller particles.
0.0
0.2
0.4
0.6
0.8
1.0
1.2
5001000150020002500300035004000
Ref
lect
ance
/ %
Wavenumber / cm-1

Chapter 6 Oxide Powder Characterisation 7131060
136
The largest difference between the ‘as received’ and regenerated 𝑍𝑟𝑂2 is highlighted in the
EDS spectra (Figures 6.11 and 6.15). The regeneration process has led to sodium being
retained by the oxide.
The bulk density value for the regenerated oxide is within 1% of the 𝑍𝑟𝑂2 (as received).
The surface area of 𝑍𝑟𝑂2 has not been altered too greatly by the regeneration process.
𝑍𝑟𝑂2 (as received) had a surface area of 2.02 ± 0.04 m2 g-1, this had changed to 2.24 ± 0.02
m2 g-1 after four regeneration cycles. There was no direct increase or decrease in surface
area after subsequent regeneration cycles indicating that the change in macro particle size
and the uptake of sodium onto the oxide surface has no effect on these properties.
There is very little difference between the DRIFT spectra of 𝑍𝑟𝑂2 (as received) and
regenerated 𝑍𝑟𝑂2 (Figures 6.13 and 6.18). To highlight the effect (if any) of the
regeneration cycle has on the adsorbed species on 𝑍𝑟𝑂2, Figure 6.19 highlights the DRIFT
spectra of a sample of 𝑍𝑟𝑂2 (as received) that has undergone four subsequent
regeneration cycles, with a sample taken after each cycle and analysed.

Chapter 6 Oxide Powder Characterisation 7131060
137
Figure 6.19: DRIFT spectra of 𝑍𝑟𝑂2 (as received) and regenerated 𝑍𝑟𝑂2 up to four subsequent regeneration cycles
This figure highlights that the regeneration process has no effect on the concentration or
identity of adsorbed species on 𝑍𝑟𝑂2.
6.3 Comparison of Regenerated 𝑪𝒆𝑶𝟐 and 𝒁𝒓𝑶𝟐
The major effect of the regeneration process outlined in Section 3.4.3 is the formation of
large agglomerated particles. This occurs with both 𝐶𝑒𝑂2 and 𝑍𝑟𝑂2 and leads to particles
with well-defined faces of surface area 300 μm2 and 400 μm2, respectively. The
regeneration process also leads to sodium uptake in 𝑍𝑟𝑂2 but not in 𝐶𝑒𝑂2. This uptake does
0.0
0.2
0.4
0.6
0.8
1.0
1.2
5001000150020002500300035004000
Re
fle
ctan
ce /
%
Wavenumber / cm-1
As received
Regen. 1
Regen. 2
Regen. 3
Regen. 4

Chapter 6 Oxide Powder Characterisation 7131060
138
not affect the surface area of 𝑍𝑟𝑂2. The BET surface area is three times greater for 𝐶𝑒𝑂2
(7.42 m2 g-1) than 𝑍𝑟𝑂2 (2.24 m2 g-1) highlighted by the quantity of 𝑁2 adsorbed; 18 cm3 g-1
for 𝐶𝑒𝑂2 compared to 8 cm3 g-1 with 𝑍𝑟𝑂2. This reflects the larger surface area and more
porous nature of 𝐶𝑒𝑂2.
𝑍𝑟𝑂2 has a slightly higher bulk density than 𝐶𝑒𝑂2 (2.06 g cm-3 compared to 1.42 g cm-3)
which means a larger mass of 𝑍𝑟𝑂2 is required for air radiolysis experiments containing 50
and 90% (by volume) of oxide.
The thermograms of both 𝐶𝑒𝑂2 and 𝑍𝑟𝑂2 highlighted that both oxides were of high purity
with little or no adsorbed organic species present.
The DRIFT spectra of regenerated 𝐶𝑒𝑂2 and 𝑍𝑟𝑂2 highlight that 𝐻2𝑂, 𝐶𝑂2 and 𝑁𝑂𝑥 are
present as adsorbed species on both oxides. These bands were also present in the ‘as
received’ powders, therefore are not due to regenerating the oxide powders. There are
more adsorption bands present in the regenerated 𝐶𝑒𝑂2 spectrum (Figure 6.8) than in the
regenerated 𝑍𝑟𝑂2 spectrum (Figure 6.18) highlighting the fact that the adsorption is more
dominant for 𝐶𝑒𝑂2 than 𝑍𝑟𝑂2.

Chapter 7 𝐻2 - 𝑂2 Radiolysis Results and Discussion 7131060
139
7 𝑯2 – 𝑶2 Radiolysis Results and Discussion
The following chapter details the results of radiolysis of 𝐻2-𝑂2 gas mixtures in an argon
matrix in the presence or absence of an oxide surface. The initial focus of this chapter is
discussion of the radiolysis of ethylene results outlined in Chapter Five in comparison to
those results attained using the Fricke dosimeter. The chapter discusses the sources of error
in the experimental configuration and the mechanism of ethylene radiolysis. Finally the
chapter outlines preliminary trials of 𝐻2 - 𝑂2 gas radiolysis using an ion accelerator as the
radiation source and discusses the use of ethylene as a chemical dosimeter compared to
absolute current measurements for accelerator dosimetry. The relevance of these results
are discussed and interpreted throughout the chapter with a final conclusion given at the
end.
7.1 Discussion of 𝑪𝟐𝑯𝟒 Dosimetry in Comparison with Fricke
Dosimetry
Comparison of the ethylene dosimetry results in Figure 5.3 against those attained using the
Fricke dosimeter seen in Figure 5.1 (both reproduced in Figure 7.1) illustrates that there is a
good agreement between the calculated dose rates of the two dosimeters.

Chapter 7 𝐻2 - 𝑂2 Radiolysis Results and Discussion 7131060
140
i)
ii)
Figure 7.1: Comparison of dose rates obtained by different chemical dosimeters (units Gy min-1) i) Fricke dosimetry and ii) ethylene dosimetry (dose rates correct as of 17th February
2015)
It is clear from Figure 7.1 that there is very good agreement between the two dosimeter
systems utilised. The small difference in dose rate can be attributed to the different vessels
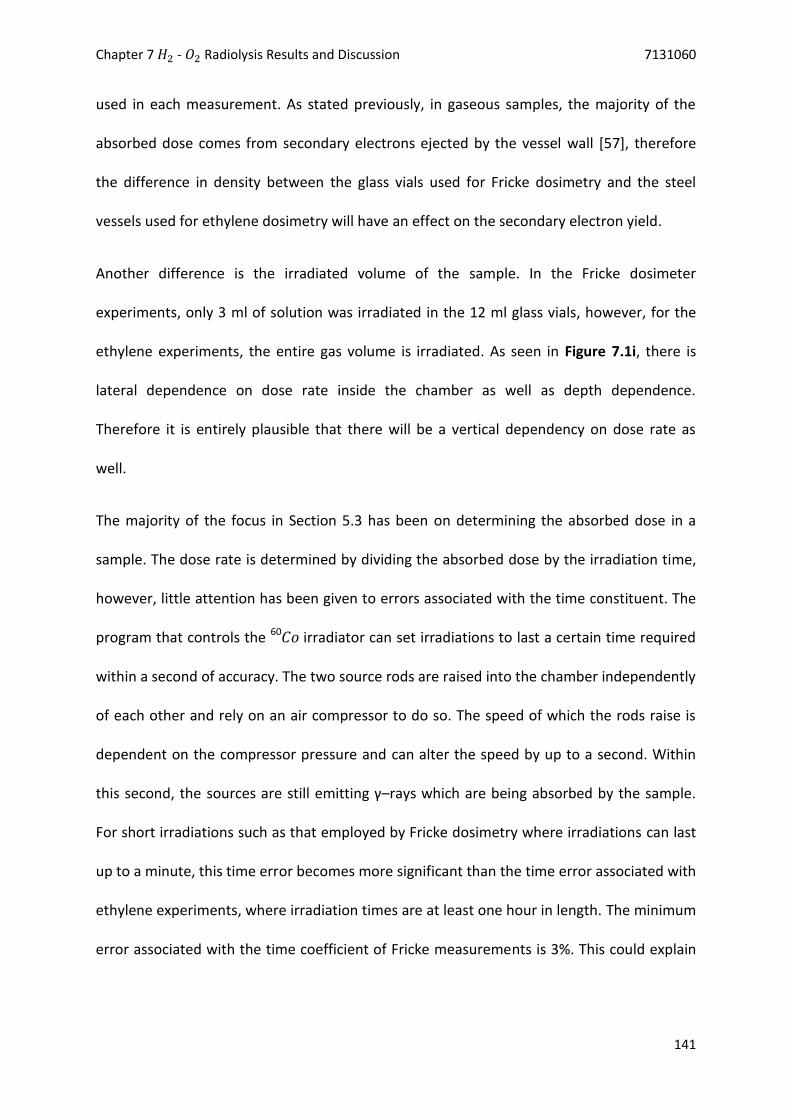
Chapter 7 𝐻2 - 𝑂2 Radiolysis Results and Discussion 7131060
141
used in each measurement. As stated previously, in gaseous samples, the majority of the
absorbed dose comes from secondary electrons ejected by the vessel wall [57], therefore
the difference in density between the glass vials used for Fricke dosimetry and the steel
vessels used for ethylene dosimetry will have an effect on the secondary electron yield.
Another difference is the irradiated volume of the sample. In the Fricke dosimeter
experiments, only 3 ml of solution was irradiated in the 12 ml glass vials, however, for the
ethylene experiments, the entire gas volume is irradiated. As seen in Figure 7.1i, there is
lateral dependence on dose rate inside the chamber as well as depth dependence.
Therefore it is entirely plausible that there will be a vertical dependency on dose rate as
well.
The majority of the focus in Section 5.3 has been on determining the absorbed dose in a
sample. The dose rate is determined by dividing the absorbed dose by the irradiation time,
however, little attention has been given to errors associated with the time constituent. The
program that controls the 60𝐶𝑜 irradiator can set irradiations to last a certain time required
within a second of accuracy. The two source rods are raised into the chamber independently
of each other and rely on an air compressor to do so. The speed of which the rods raise is
dependent on the compressor pressure and can alter the speed by up to a second. Within
this second, the sources are still emitting γ–rays which are being absorbed by the sample.
For short irradiations such as that employed by Fricke dosimetry where irradiations can last
up to a minute, this time error becomes more significant than the time error associated with
ethylene experiments, where irradiation times are at least one hour in length. The minimum
error associated with the time coefficient of Fricke measurements is 3%. This could explain

Chapter 7 𝐻2 - 𝑂2 Radiolysis Results and Discussion 7131060
142
why the dose rates did not unilaterally increase or decrease between the dosimeters as the
source rods may have risen slower during one dosimeter experiment and not the other.
7.2 Source of Errors in Ethylene Dosimetry
After collating several results from ethylene radiolysis experiments, it became apparent that
there was disagreement in several samples across the multiple injections with respect to 𝐻2
concentration in the GC sample loop. Figure 7.2 is a plot of the scatter in each sample
against the peak area of 𝐻2 from the first injection of that sample for three different
irradiation times.
Figure 7.2: Plot of scatter in each sample of ethylene as a function of the peak area of 𝐻2 in the first injection
From this figure, two observations can be made. Firstly, after the first injection of the
sample, if the 𝐻2 peak area is less than 10 AU, there is a higher disagreement between the
pressure in the sample loop and the peak area of 𝐻2 for subsequent injections. The scatter
0.0
2.0
4.0
6.0
8.0
10.0
12.0
14.0
0.00 10.00 20.00 30.00 40.00 50.00 60.00
RSD
of
resu
lts
fro
m r
un
/ %
H2 peak area from first injection / AU
540 min
3900 min
5760 min

Chapter 7 𝐻2 - 𝑂2 Radiolysis Results and Discussion 7131060
143
varies between 1-13%. When the initial 𝐻2 peak area is at least double this figure, the
scatter is always less than 2%. This trend could infer that the lower detection limit of the GC
detector is being reached as there is a larger error in smaller signals. Figure 7.3 is an overlay
of three chromatograms from three subsequent injections of a post irradiated ethylene
sample (irradiated for 540 min).
Figure 7.3: Gas chromatogram overlay of three subsequent injections of post irradiated ethylene highlighting the 𝐻2 signal
With subsequent injections, the baseline becomes less stable as the signal to noise ratio
increases. This effect is highlighted further in Figure 7.4, which shows the chromatogram
profile of the 𝐻2 signal for the first injection of two different samples:
-1000
-500
0
500
1000
1500
2000
2500
3000
3500
4000
20 25 30 35 40 45 50 55 60
Sign
al In
ten
sity
/ A
U
Retention time / s
1st injection
2nd injection
3rd injection

Chapter 7 𝐻2 - 𝑂2 Radiolysis Results and Discussion 7131060
144
i)
ii)
Figure 7.4: Gas chromatogram of two separate ethylene samples irradiated for i) 540 min and ii) 5760 min
The red bands in Figure 7.4 are the bounding limits of the noise in the chromatogram. As
can be seen in Figure 7.4i, a larger percentage of the 𝐻2 signal is within this noise limit
compared to the 𝐻2 signal in 7.4ii. With subsequent injections, as the signal gets smaller, a
greater portion will lie within the noise limit. The sample represented by Figure 7.4i had
12.4% scatter across all three injections as the signal to noise ratio decreased. The sample
-500
0
500
1000
1500
2000
2500
3000
20 25 30 35 40 45 50 55 60
Sign
al In
ten
sity
/ A
U
Retention time / s
-1000
2000
5000
8000
11000
14000
17000
20 25 30 35 40 45 50 55 60
Sign
al In
ten
sity
/A
U
Retention time / s

Chapter 7 𝐻2 - 𝑂2 Radiolysis Results and Discussion 7131060
145
represented by Figure 7.4ii had 0.7% scatter across all three injections as the signal
outweighed the noise limits of the instruments.
The second observation that can be made from Figure 7.2 is that longer irradiation times
lead to larger 𝐻2 peak areas for the first injection. This is to be expected as the sample is in
the radiation field for longer therefore more of the ethylene will undergo radiolysis.
As there is no back reaction to reform ethylene, a steady state will not be reached in the
system.
To ascertain more accurate and reproducible results for the ethylene dosimeter, a larger
quantity of hydrogen needs to be measured to reduce the interference from the signal/
noise ratio of the GC. This can be attained by two methods. The first is to irradiate the
samples for longer periods of time to ensure a greater percentage of ethylene undergoes
radiolysis. This is not feasible however, due to scheduling conflicts with the irradiation
source and also the linear range of the dosimeter. As mentioned in Section 4.1, the Fricke
dosimeter has a linear oxidation rate between 0-400 Gy; the ethylene dosimeter has a linear
range of 𝐻2 formation between 5-200 kGy [12]. For the central two positions in the rack,
any irradiation time over 11 h leads to the dosimeter being out of range and the value of
G(𝐻2) = 1.36 is obsolete. To circumvent the issue of shorter irradiation times to increase 𝐻2
production a second method is employed. Previously, all samples have been irradiated at
atmospheric pressure (1 bar); therefore by increasing the pressure inside the sample vessel
there is a larger number of ethylene molecules that can undergo radiolysis. The results of
experiments at higher pressures are shown in Figure 7.5:

Chapter 7 𝐻2 - 𝑂2 Radiolysis Results and Discussion 7131060
146
Figure 7.5: Results of ethylene dosimetry at increased pressure (units – Gy min-1) (dose rates correct as of 24th February 2015)
These dose rates are put into the same decay series spreadsheet as the Fricke results to
determine the dose rate on a given date. These dose rates are used to determine the
absorbed dose by a particular sample during the course of 𝐻2 − 𝑂2 − 𝐴𝑟 radiolysis
experiments. This decay series is then validated once a month with single point dosimetry.
7.3 Mechanism of Ethylene (𝑪𝟐𝑯𝟒) Radiolysis
It is important to understand the mechanism of ethylene radiolysis and what factors may
affect the yield of 𝐻2 produced with it being used as dosimeter for 𝐻2 - 𝑂2 radiolysis
experiments.
Work has been carried out to investigate the decomposition products in the radiolysis of
ethylene. It is understood that the primary products are 𝐻2, acetylene (𝐶2𝐻2), and higher
molecular weight polymeric products [61]. It is widely agreed that 𝐻2 is formed from direct
molecular elimination processes (Reaction 7.1 and 7.2):
𝐶2𝐻4 ⇝ 𝐶2𝐻2 + 𝐻2 Reaction 7.1

Chapter 7 𝐻2 - 𝑂2 Radiolysis Results and Discussion 7131060
147
𝐶2𝐻4 ⇝ 𝐶𝐻2𝐶 + 𝐻2 Reaction 7.2
The hydrogen atoms can be eliminated from separate carbon atoms (Reaction 7.1) or both
can come from a single carbon atom (Reaction 7.2) [13]. However, both hydrogen atoms are
eliminated from a single ethylene molecule. This has been investigated with isotopic
experiments where 50:50 mixtures of 𝐶2𝐻4 and 𝐶2𝐷4 have been irradiated [70]. Mass
spectroscopic data showed that 95% of the decomposition product was either 𝐻2 or 𝐷2
with only 5.2% being 𝐻𝐷. The yield of 𝐶𝐻𝐶𝐷 was also very low, which suggested that the
methylene species (𝐶𝐻2 or 𝐶𝐷2), was not involved in the production of acetylene. The
product in Reaction 7.2 (𝐶𝐻2𝐶) can rearrange to form acetylene 𝐶2𝐻2 [71] which accounts
for roughly 10% of the ethylene reacted. The remaining 90% undergoes condensation
reactions to form higher molecular weight products [70]. The formation of 𝐻2 by molecular
elimination has also been observed in the photolysis of ethylene gas using a xenon lamp
source [72].
Alongside Reactions 7.1 and 7.2, the radiolysis of ethylene can produce a primary excitation
process which leads to hydrogen atom formation (Reactions 7.3 and 7.4) [73]:
𝐶2𝐻4 ⇝ 𝐶2𝐻4∗ → 𝐶2𝐻2 + 2𝐻∙ Reaction 7.3
⇝ 𝐶2𝐻4∗ → 𝐶2𝐻3
∙ + 𝐻∙ Reaction 7.4
The hydrogen atom yield has been calculated as G(𝐻∙) = 6.8. This atomic species reacts very
rapidly with ethylene to form the ethyl radical (𝐶2𝐻5. ), (Reaction 7.5) [62, 74, 75]:
𝐻∙ + 𝐶2𝐻4 → 𝐶2𝐻5∙ Reaction 7.5
The ethyl radical can undergo recombination and disproportionation reactions with other
radical species such as the vinyl (𝐶2𝐻3∙ ), and methyl (𝐶𝐻3
∙ ), to form the higher molecular

Chapter 7 𝐻2 - 𝑂2 Radiolysis Results and Discussion 7131060
148
weight polymeric and unsaturated hydrocarbon products. It can also react with the
hydrogen atom to form ethane (Reaction 7.6):
𝐻∙ + 𝐶2𝐻5∙ → 𝐶2𝐻6 Reaction 7.6
This reaction (7.6) has been shown to occur via radical recombination by Yang et al. [75]
who added nitric oxide (𝑁𝑂), to the system to act as a radical scavenger. Their results
showed firstly, that with addition of 𝑁𝑂, ethane was not formed and secondly, that the
yields of 𝐻2 and 𝐶2𝐻2 were not affected by the addition of 𝑁𝑂 to the system. This suggests
that the recombination of hydrogen atoms to form 𝐻2 does not occur.
Alongside excitation reactions, formation of fragmented ions can occur [74]:
𝐶2𝐻4 ⇝ 𝐶2𝐻2+ + 2𝐻∙ + 𝑒− Reaction 7.7
The ethyl cation can then react with ethylene as seen in Reaction 7.8.
𝐶2𝐻2+ + 𝐶2𝐻4 → 𝐶3𝐻5
+ + 𝐶𝐻3∙ Reaction 7.8
These products can then go on to form higher molecular weight species.
From this reaction scheme it can be seen that ethylene radiolysis is well understood and the
majority of products are gaseous hydrocarbon species. Due to their size, these products will
not interfere with 𝐻2 analysis as they will not get through the packed column of the GC.

Chapter 7 𝐻2 - 𝑂2 Radiolysis Results and Discussion 7131060
149
7.4 𝑯𝟐 Production from Adsorbed Water on Oxide Powders
Before experiments were undertaken investigating the radiation chemistry of 𝐻2 − 𝑂2 − 𝐴𝑟
gas mixtures in contact with an oxide surface, it was important to determine the quantity of
𝐻2 produced from adsorbed water radiolysis and whether this concentration affects the
measurements of 𝐻2 initially added to the system.
The metal vessels in Figure 4.11 were filled with the relevant oxide to capacity using the
bulk density calculated in Chapter Six. The vessels were assembled and attached to the gas
mixing manifold (Figure 4.18). The samples were placed under vacuum to remove the
headspace and any physisorbed species on the oxide surface. After approximately 30 min
under vacuum, the vessels were filled with argon to atmospheric pressure (1 bar absolute)
and irradiated for different periods of time. Only the dose absorbed by the adsorbed water
was considered. To determine this value, the mass of water adsorbed onto the oxide
powder needed to be determined. It is assumed that 1 monolayer of water will be adsorbed
onto the oxide due to the relative humidity of the laboratory and the vacuum pump
removing any physisorbed species. Haschke and Ricketts have determined the mass of one
water monolayer as 0.21 mg m-2 adsorbed onto 𝑃𝑢𝑂2 powder [23]. Due to the similarities in
crystal structure, lattice parameters and surface area, this value is a good approximation for
the mass of one water monolayer adsorbed onto 𝐶𝑒𝑂2 and 𝑍𝑟𝑂2. Knowledge of the SSA and
mass of oxide powder in each sample allows for the mass of water in each sample to be
determined and therefore, the absorbed dose. The results of these experiments are shown
in Figure 7.6.

Chapter 7 𝐻2 - 𝑂2 Radiolysis Results and Discussion 7131060
150
Figure 7.6: Hydrogen production as a function of absorbed dose1 from water adsorbed to 𝑍𝑟𝑂2 (primary y-axis) and 𝐶𝑒𝑂2 (secondary y-axis)
There are two distinct features from the results shown in Figure 7.6. Firstly, the yield of 𝐻2
from water adsorbed onto 𝐶𝑒𝑂2 is at least an order of magnitude below the yield from
𝑍𝑟𝑂2 and has to be plotted on a second axis. One possible hypothesis is; there is more
water adsorbed onto 𝑍𝑟𝑂2 than 𝐶𝑒𝑂2, therefore more 𝐻2 can be produced by radiolysis.
Using the value of Haschke and Ricketts of 0.21 mg m-2 for the mass of one monolayer [23]
and the surface area of each oxide determined in Chapter Six; the surface area present in
each sample is 90 and 45 m2 for 𝐶𝑒𝑂2 and 𝑍𝑟𝑂2, respectively. From these values, the mass
of water adsorbed can be determined and assuming 𝐻2 formation from water radiolysis
occurs via Reaction 7.9; then the maximum number of 𝐻2 molecules that could be formed is
6.3x10²⁰ and 3.15x10²⁰ molecules in samples containing 𝐶𝑒𝑂2 and 𝑍𝑟𝑂2, respectively.
2𝐻2𝑂𝑎𝑑𝑠 ⇝ 2𝐻2 (𝑔) + 𝑂2 (𝑔) Reaction 7.9
1 Throughout this Chapter, in all plots of species production/depletion as a function of absorbed dose, the absorbed dose
axis has been plotted in units of 100 eV so that G-values for the species in question can be determined from the gradient of the trend line of the data.
0.0
5.0
10.0
15.0
20.0
25.0
30.0
35.0
40.0
45.0
50.0
0.0
500.0
1000.0
1500.0
2000.0
2500.0
0.0 10.0 20.0 30.0 40.0 50.0 60.0 70.0 80.0 90.0
H2 p
rod
uct
ion
/ (
x10
16)
mo
lec.
H2 p
rod
uct
ion
/ (
x10
16)
mo
lec.
Absorbed Dose / (x1016) 100 eV
ZrO2
CeO2

Chapter 7 𝐻2 - 𝑂2 Radiolysis Results and Discussion 7131060
151
From these values it is clear that there is sufficient water in 1 monolayer to produce the
quantity of 𝐻2 that has been measured with the reaction efficiency calculated as 0.03 and
6.35% for adsorbed water radiolysis on 𝐶𝑒𝑂2 and 𝑍𝑟𝑂2, respectively.
The explanation for greater 𝐻2 production from 𝑍𝑟𝑂2 than 𝐶𝑒𝑂2 is due to an increase in
energy transfer from the oxide to the adsorbed species. This has been investigated by
LaVerne and Tandon [29] who found 𝑍𝑟𝑂2 produced five times more 𝐻2 than 𝐶𝑒𝑂2 for the
same quantity of adsorbed water using 60𝐶𝑜 γ-rays. Petrik et al. have attributed this
phenomena partly to the resonance between the band gap of 𝑍𝑟𝑂2 (5.0 eV) [76] and the
bond dissociation energy of water (𝐻𝑂 − 𝐻) (5.15 eV) [27]. The band of 𝐶𝑒𝑂2 is in the range
3.1-3.5 eV [77]. Therefore, not enough energy can be transferred from 𝐶𝑒𝑂2 to adsorbed
water to enhance the formation of 𝐻2. However, LaVerne et al. [29] state that other metal
oxides with a band gap inside this range does not increase the yield of 𝐻2. Chelnokov et al
[78] investigated the electron transfer at the interface between liquid water and several
metal oxides with band gaps ranging between 3.3-9.0 eV under the influence of ionising
radiation. They found that the interaction between the radiation field and the oxide
nanoparticles produces secondary electrons with enough energy to transfer across to the
water independent of oxide band gap. This electron transfer led to increased yields of
solvated electrons (𝑒𝑎𝑞− ), across all oxides normalised to that of pure water. Other
explanations such as exciton formation and water adsorption form have also been given. It
is widely agreed that an energy transfer mechanism is responsible for these results,
however, no conclusions as to the nature of this mechanism has received widespread
acceptance.

Chapter 7 𝐻2 - 𝑂2 Radiolysis Results and Discussion 7131060
152
The second feature of Figure 7.6 is the scattered nature of 𝐻2 yields from water adsorbed to
𝑍𝑟𝑂2. There appears to be a positive correlation between absorbed dose and production of
𝐻2 from 𝑍𝑟𝑂2, however, there is a large variance in the quantity of 𝐻2. It is possible that
there are differing quantities of 𝐻2𝑂 adsorbed across all the samples. The oxides were not
treated beforehand, therefore, removal of adsorbed water was reliant solely on the vacuum
pump. This parameter may become important, however, for this research it is important to
qualify the amount of 𝐻2 that can be produced from adsorbed water radiolysis.
It is important to note that 𝑂2 is not detected (or below the limits of detection of the gas
chromatograph) in samples of either 𝐶𝑒𝑂2 or 𝑍𝑟𝑂2. This effect has been highlighted by
other researchers investigating radiolysis of adsorbed water on metal oxide surfaces
[25, 29]. This has led to debate as to the location of 𝑂2. One hypothesis is that 𝑂2 oxidises
the metal oxide, leading to the formation of the super-stoichiometric 𝑀𝑂2+𝑥 product [79]. A
second hypothesis is the formation of interstitial hydroxyl groups leading to a product with
chemical formula 𝑀𝑂2(𝑂𝐻) [80]. This has not been studied further as the primary concern
is 𝐻2 formation.
7.5 Radiolysis of Ethylene in Contact with Oxides
To help elucidate a better understanding of dosimetry in heterogeneous systems, and the
dose received by the overlying gas phase in contact with an oxide powder, ethylene gas was
added to sample vessels which contained either 𝐶𝑒𝑂2 or 𝑍𝑟𝑂2. The vessels were filled to
capacity with the relevant oxide and sealed for the duration of experiments investigating
ethylene radiolysis. The mass of each oxide was noted to determine the volume occupied by
oxide. The volume of ethylene was calculated by subtracting the volume of oxide (using the

Chapter 7 𝐻2 - 𝑂2 Radiolysis Results and Discussion 7131060
153
crystal density) from the reaction vessel volume. The corrected volume of ethylene was
used to determine the mass of ethylene and the absorbed dose.
Figure 7.7 shows the resulting chromatograms for a sample containing pure ethylene
(𝐶2𝐻4), a vessel containing 𝐶𝑒𝑂2 in an argon atmosphere and a vessel containing 𝐶𝑒𝑂2 in an
𝐶2𝐻4 atmosphere. The vessel volume was identical in all three samples and the mass of
𝐶𝑒𝑂2 in the two heterogeneous systems was the same. All three samples were irradiated at
the same pressure for an identical time period in the same position in the test tube array.
Figure 7.7: Gas chromatograms showing a comparison of the 𝐻2 signal of irradiated ethylene (𝐶2𝐻4) (blue trace), 𝐶𝑒𝑂2 in 𝐴𝑟 atmosphere (green trace) and 𝐶𝑒𝑂2 in ethylene
(𝐶2𝐻4) (red trace) irradiated for 9 h in identical radiation fields
In the figure above, the chromatograms are taken from the first injection of each sample,
where the quantity of 𝐻2 is at its greatest. Each chromatogram has been normalised to the
same sample loop pressure (that of ethylene (blue trace)) so that the variables between
samples remains at a minimum.
Section 7.4 highlighted the presence of adsorbed water on 𝐶𝑒𝑂2 which can lead to small
quantities of 𝐻2 being produced. The efficiency of the reaction is not great and only a small
0.0
5.0
10.0
15.0
20.0
25.0
30 35 40 45 50
Sign
al In
ten
sity
/ A
U
Retention time / seconds
CeO2 - C2H4
CeO2 - Ar
C2H4

Chapter 7 𝐻2 - 𝑂2 Radiolysis Results and Discussion 7131060
154
proportion of the adsorbed water is radiolysed. This is evident from Figure 7.7 where the
yield of 𝐻2 from adsorbed water is approximately half the yield of 𝐻2 from pure ethylene
radiolysis. Figure 7.7 also highlights that the 𝐻2 generated from ethylene radiolysed in
contact with 𝐶𝑒𝑂2 (red trace) is greater than the sum of 𝐻2 generated from pure ethylene
radiolysis and adsorbed water radiolysis.
Figure 7.8 is the parallel study using 𝑍𝑟𝑂2 as the oxide surface.
Figure 7.8: Gas chromatograms showing a comparison of the 𝐻2 signal of irradiated ethylene (𝐶2𝐻4) (blue trace – secondary y-axis), 𝑍𝑟𝑂2 in 𝐴𝑟 atmosphere (green trace –
secondary y-axis) and 𝑍𝑟𝑂2 in ethylene (𝐶2𝐻4) (red trace – primary y-axis) irradiated for 9 h in identical radiation fields
The chromatograms in Figure 7.8 have been normalised to the same sample loop pressure
(that of ethylene (blue trace)) for the reason mentioned previously.
In Figures 7.7 and 7.8, the chromatogram from ethylene (blue trace) is the same sample.
This allows a comparison to be made between 𝐶𝑒𝑂2 and 𝑍𝑟𝑂2 samples under identical
conditions. As seen in Section 7.4, the yield of 𝐻2 from adsorbed water on 𝑍𝑟𝑂2 is at least
0.0
5.0
10.0
15.0
20.0
25.0
30.0
35.0
40.0
45.0
50.0
0.0
400.0
800.0
1,200.0
1,600.0
2,000.0
2,400.0
30 35 40 45 50 55Si
gnal
Inte
nsi
ty /
AU
Sign
al In
ten
sity
/ A
U
Retention time / seconds
ZrO2 - C2H4
ZrO2 - Ar
C2H4

Chapter 7 𝐻2 - 𝑂2 Radiolysis Results and Discussion 7131060
155
five times greater than a parallel 𝐶𝑒𝑂2 sample in Figure 7.7. The stand-out feature of Figure
7.8, is the chromatogram of 𝑍𝑟𝑂2 − 𝐶2𝐻4 (red trace), which is plotted on the primary
vertical axis whereas the chromatograms of irradiated 𝑍𝑟𝑂2 in an argon atmosphere and
𝐶2𝐻4 gas only are plotted on the secondary vertical axis. From the scale of these axes, it is
noted that the yield of 𝐻2 from ethylene is almost 450 times greater in the presence of
𝑍𝑟𝑂2 than with no oxide present. In concurrence with 𝐶𝑒𝑂2 results, this yield is greater than
the sum of ethylene radiolysis and adsorbed water radiolysis.
The increase in 𝐻2 production from adsorbed water on 𝑍𝑟𝑂2 in comparison to 𝐶𝑒𝑂2 is partly
attributed to the resonance between the band gap of 𝑍𝑟𝑂2 and the bond dissociation of
water as discussed earlier. The bond dissociation energy of ethylene (𝐶𝐻2𝐶𝐻 − 𝐻) is
4.81 eV [27]. This value is below the band gap of 𝑍𝑟𝑂2, therefore energy transfer is likely to
occur. The bond dissociation energy of ethylene is greater than the band gap of 𝐶𝑒𝑂2,
therefore there may be another mechanism occurring alongside energy transfer which leads
to the increase in ethylene decomposition in the presence of an oxide surface. This other
mechanism may occur in adsorbed water radiolysis discussed previously [25, 29]; however,
there is no chemical change to the inert gas phase that is measureable.
It is evident from Figure 7.6 that the oxide powders have water adsorbed onto the surface,
however, it is not clear as to the extent of water coverage and also the extent of
physisorbed vs. chemisorbed water. Any interaction between ethylene and the oxide
surface is likely to be through physisorption (Figure 7.9).

Chapter 7 𝐻2 - 𝑂2 Radiolysis Results and Discussion 7131060
156
Figure 7.9: Postulated schematic of ethylene interaction with an oxide surface
This enhancement of ethylene decomposition may be due to a catalytic mechanism rather
than radiolytic. Studies have shown that doped metal oxides (in particular 𝐶𝑒𝑂2 and 𝑍𝑟𝑂2)
are useful in many hydrocarbon reactions [81] including ethylene dimerisation (Reaction
7.10):
2 𝐶2𝐻4 → 𝐶4𝐻6 + 𝐻2 Reaction 7.10
This reaction may lead to enhanced 𝐻2 yields that are falsely attributed to radiolysis. This
hypothesis was tested by filling several sample vessels with either 𝐶𝑒𝑂2 or 𝑍𝑟𝑂2, evacuating
the gas phase and replacing with ethylene gas. The samples were then left in a water bath at
50 °C for 10 h in order to simulate conditions inside the 60𝐶𝑜 irradiator. After this period, the
samples were analysed using the GC. The resulting chromatograms had no 𝐻2 present, with
any quantities, below the limits of detection. Pressure measurements of the samples in the
water bath showed no change in pressure other than to be expected for temperature
fluctuation. This indicates that there is no significant adsorption of ethylene onto the oxide
surface or catalytic reactions occurring (which would lead to a pressure decrease) and the

Chapter 7 𝐻2 - 𝑂2 Radiolysis Results and Discussion 7131060
157
gas chromatography results confirm there is no 𝐻2 being produced. Therefore the effect
seen in Figures 7.7 and 7.8 is a radiation driven process.
As the oxide is in powder form, there will be cavities inside the powder which the ethylene
will occupy. This may lead to cavity ionisation. This is a theory postulated by Gray [82],
where the ionisation in a gas cavity inside a medium is related to the energy absorbed by
the surrounding medium. The Bragg-Gray cavity theory is expressed quantitatively in
Equation 7.1:
𝐸𝜈 = 𝐽𝜈 𝑊𝜌 Equation 7.1
where 𝐸𝜈 is the energy absorbed by the medium, 𝐽𝜈 is the ionisation produced in the cavity,
𝑊 is the average energy lost by secondary electrons per ion pair formed in the gas and 𝜌 is
the ratio of the stopping powers of the medium and the gas. This theory neglects the
existence of high energy secondary electrons which has led to discrepancies in experimental
results of ionisation measurements taken in air filled cavities from that predicted by
Equation 7.1 [83, 84]. These studies also found that the discrepancy increased with
increasing wall Z number. From this, it would be expected that the dose received by the gas
inside a cavity within 𝐶𝑒𝑂2 to be higher than the dose received by the same gas in a 𝑍𝑟𝑂2
cavity. The results, however, do not support this claim as the yield of 𝐻2 is greater from
𝑍𝑟𝑂2 samples than 𝐶𝑒𝑂2 samples.
It is evident in heterogeneous systems that there is energy transfer between the oxide
powder and the gas phase, however, a definitive mechanism is not forthcoming and there is
no definitive value of how much the oxide surface contributes to the absorbed dose by the
gas phase.

Chapter 7 𝐻2 - 𝑂2 Radiolysis Results and Discussion 7131060
158
Figure 7.10 highlights the DRIFT spectra of regenerated 𝐶𝑒𝑂2 before and after irradiation
under an ethylene atmosphere.
Figure 7.10: DRIFT spectra of regenerated 𝐶𝑒𝑂2 pre-irradiation (blue) and post-irradiation (red) in an ethylene atmosphere
The main difference in the spectra highlighted in Figure 7.10 is the emergence of a group of
bands between 3000-3800 cm-1. These bands have been assigned as 𝐶 − 𝐻 stretches [66].
The emergence of these absorption bands indicates adsorption of ethylene radiolysis
products onto the oxide surface.
Figure 7.11 is the comparative spectra for 𝑍𝑟𝑂2.
0.0
0.2
0.4
0.6
0.8
1.0
1.2
1.4
1.6
1.8
2.0
2.2
5001000150020002500300035004000
Re
fle
ctan
ce /
%
Wavenumber / cm-1
Pre-irradiationPost-irradiation

Chapter 7 𝐻2 - 𝑂2 Radiolysis Results and Discussion 7131060
159
Figure 7.11: DRIFT spectra of regenerated 𝑍𝑟𝑂2 pre-irradiation (blue) and post-irradiation (red) in an ethylene atmosphere
As seen in Figure 7.10, absorption bands associated with 𝐶 − 𝐻 stretches are present in the post
irradiated sample indicating adsorption of ethylene radiolysis products.
At the conclusion of these experiments, the oxide powders were baked in a furnace at
400 °C under static air for 12 h. This temperature ensured the removal of any organic
contaminants on the surface of each oxide without changing the physical properties of the
oxide outlined in Chapter Six. Figures 7.12 and 7.13 depict DRIFT spectra up to 400 °C for
the post irradiated 𝐶𝑒𝑂2 and 𝑍𝑟𝑂2, respectively.
0.0
0.2
0.4
0.6
0.8
1.0
1.2
5001000150020002500300035004000
Re
fle
ctan
ce /
%
Wavenumber /cm-1
Pre-irradiation
Post-irradiation

Chapter 7 𝐻2 - 𝑂2 Radiolysis Results and Discussion 7131060
160
Figure 7.12: DRIFT spectra of irradiated 𝐶𝑒𝑂2 in an ethylene atmosphere analysed between 20 – 400 °C
0.0
2.0
4.0
6.0
8.0
10.0
12.0
14.0
16.0
18.0
5001000150020002500300035004000
Re
fle
ctan
ce /
%
Wavenumber / cm-1
20 degC
60 degC
120 degC
250 degC
400 degC

Chapter 7 𝐻2 - 𝑂2 Radiolysis Results and Discussion 7131060
161
Figure 7.13: DRIFT spectra of irradiated 𝑍𝑟𝑂2 in an ethylene atmosphere analysed between 20 – 400 °C
It is clear from the previous two figures (7.12 and 7.13), that the temperature employed is
high enough to decompose and remove any organic species that are adsorbed onto the
oxide surfaces. This is seen by the diminishing adsorption band between 3000-2800 cm-1. At
higher temperatures, adsorbed water is driven off the surface as well; however, this will be
re-adsorbed as the temperature decreases as the baking of the oxides is carried out under
static air conditions. At 400 °C, the adsorption band identified as 𝐶𝑂2 increases, this is more
prominent for 𝑍𝑟𝑂2 samples. This is due to hydrocarbon species decomposing in air to form
𝐶𝑂2 and water vapour.
0.0
5.0
10.0
15.0
20.0
25.0
5001000150020002500300035004000
Re
fle
ctan
ce /
%
Wavenumber / cm-1
20 degC
60 degC
120 degC
250 degC
400 degC

Chapter 7 𝐻2 - 𝑂2 Radiolysis Results and Discussion 7131060
162
After the oxides have been baked, the 𝐶𝑂2 band is reduced to atmospheric levels. Before
the oxides are re-used in further experiments, they are evacuated under vacuum on the
manifold system, which will remove any physisorbed species.
7.6 Gamma Radiolysis of 𝑯𝟐 − 𝑶𝟐 − 𝑨𝒓 Gas Mixtures
The following section outlines the results from pure gas phase radiolysis of five different
mixtures of 𝐻2 − 𝑂2 − 𝐴𝑟 , irradiated using 60𝐶𝑜 γ-rays. In all of the samples, argon
constitutes at least 90% (by volume) of the sample. The five ratios utilised in this project
were:
𝐻2 rich atmospheres (stoichiometry 10 : 1 : 89 𝐻2 − 𝑂2 − 𝐴𝑟 (by volume));
𝑂2 rich atmospheres (stoichiometry 1 : 10 : 89 𝐻2 − 𝑂2 − 𝐴𝑟 (by volume));
Equal volumes of 𝐻2 and 𝑂2 (stoichiometry 5 : 5 : 90 𝐻2 − 𝑂2 − 𝐴𝑟 (by
volume));
Water stoichiometry of 𝐻2 and 𝑂2 (stoichiometry 5 : 2.5 : 92.5 𝐻2 − 𝑂2 −
𝐴𝑟 (by volume)); and
𝑂2 excess atmospheres (stoichiometry 2.5 : 5 : 92.5 𝐻2 − 𝑂2 − 𝐴𝑟 (by
volume))
Throughout this chapter each ratio has an assigned colour, which is maintained throughout
the figures.
Figure 7.14 shows the results of 𝐻2 depletion as a function of dose for the five systems
outlined above.

Chapter 7 𝐻2 - 𝑂2 Radiolysis Results and Discussion 7131060
163
Figure 7.14: Results of gamma radiolysis of different ratios of 𝐻2 − 𝑂2 − 𝐴𝑟2 illustrating 𝐻2 depletion as a function of absorbed dose (n.b. trend line for 01:10 data set obscured by
2.5:5 trend line)
The green data points circled in red are anomalous results due to complete depletion of 𝐻2
from the gas phase. This most likely occurred at a lower dose, which would bring the points
closer to the entire data set. These points have been omitted from the G(-𝐻2) calculations.
Table 7-1 outlines the G(-𝐻2) values calculated from each trend line of the relevant data set.
Error calculations are within one standard deviation.
2 For clarity, only the 𝐻2 : 𝑂2 ratio is shown in the legend of each figure
0.0
10.0
20.0
30.0
40.0
50.0
60.0
70.0
80.0
0.0 20.0 40.0 60.0 80.0 100.0 120.0 140.0 160.0 180.0
H2 d
eple
tio
n /
(x1
01
7)
mo
lec.
Absorbed Dose / (x1016) 100 eV
10:01
05:02.5
05:05
2.5:5
01:10
H2: O2 (%)

Chapter 7 𝐻2 - 𝑂2 Radiolysis Results and Discussion 7131060
164
System (𝑯𝟐 − 𝑶𝟐 − 𝑨𝒓 (by volume))
G(-𝑯𝟐) / molecules 100 eV
-1 Error (𝝈𝒔𝒍𝒐𝒑𝒆)
10 : 1 : 89 3.56 ± 0.67
5 : 2.5 : 92.5 4.66 ± 0.37
5 : 5 : 90 4.68 ± 0.13
2.5 : 5 : 92.5 3.81 ± 0.12
1 : 10 : 89 3.60 ± 1.58
Table 7-1: Calculated G(-𝐻2) values for several different ratios of 𝐻2 − 𝑂2 − 𝐴𝑟 gas using gamma radiation
The system that contains 10: 1: 89 𝐻2 − 𝑂2 − 𝐴𝑟 is the only system where complete
depletion of 𝐻2 cannot occur due to lack of available 𝑂2 to form water. The other four
systems can be compared. The G(-𝐻2) values in Table 7-1 increase with increasing 𝐻2
concentration from 3.60 to 4.66 molecules 100 eV-1 which suggests a first order relationship.
However, this statement is difficult to clarify as the concentration of 𝑂2 changes in the
system as well. Also the associated error with samples containing 1: 10: 89 𝐻2 − 𝑂2 − 𝐴𝑟 is
large in comparison to the other errors in Table 7-1. Another hypothesis is that the system is
zero order with 𝐻2 depletion being independent of starting 𝐻2 concentration.
The order of the rate of recombination of 𝐻2 − 𝑂2 is still debated in literature sources, with
both zero and first order kinetics highlighted and discussed [40, 41].
Figure 7.15 is a plot of the G(-𝐻2) value for each individual point in Figure 7.14.

Chapter 7 𝐻2 - 𝑂2 Radiolysis Results and Discussion 7131060
165
Figure 7.15: Plot of G(-𝐻2) as a function of absorbed dose for several different ratios of 𝐻2 − 𝑂2 − 𝐴𝑟 gas using gamma radiation using the data in Figure 7.14
At low absorbed doses, the G(-𝐻2) scatter is much larger due to the formula used to
calculate G-values (molecules lost or formed per 100 eV of energy absorbed). At low doses,
this calculation is the division of two numbers of similar magnitudes; if the rate of
formation/ consumption is constant, then at higher doses, the denominator becomes a
much larger number than the number of molecules formed/ consumed.
From Figure 7.15, it is clear that the G(-𝐻2) values for all five gaseous systems lies in the
range of 2-6 molecules of 𝐻2 consumed per 100 eV of energy absorbed. This range is in
good agreement with Dautzenberg’s earlier work [41].
The corresponding 𝑂2 depletion data is plotted in Figures 7.16 and 7.17. The G(-𝑂2) values
for each system is tabulated in Table 7-2. As highlighted in Chapter Four, the GC
0.0
2.0
4.0
6.0
8.0
10.0
12.0
14.0
16.0
18.0
20.0
0.0 20.0 40.0 60.0 80.0 100.0 120.0 140.0 160.0 180.0
G(-
H2 )
Absorbed Dose / (x1016) 100 eV
10:01
05:02.5
05:05
2.5:5
01:10
H2: O2 (%)

Chapter 7 𝐻2 - 𝑂2 Radiolysis Results and Discussion 7131060
166
configuration utilised in this research is less sensitive to 𝑂2 than 𝐻2, however, in the
concentration range used, this effect should be nullified.
System (𝑯𝟐 − 𝑶𝟐 − 𝑨𝒓 (by volume))
G(-𝑶𝟐) / molecules 100 eV
-1 Error (𝝈𝒔𝒍𝒐𝒑𝒆)
10 : 1 : 89 2.44 ± 0.19
5 : 2.5 : 92.5 3.89 ± 0.28
5 : 5 : 90 4.27 ± 0.65
2.5 : 5 : 92.5 1.87 ± 0.28
1 : 10 : 89 2.55 ± 0.09
Table 7-2: Calculated G(-𝑂2) values for several different ratios of 𝐻2 − 𝑂2 − 𝐴𝑟 gas using gamma radiation
Figure 7.16: 𝑂2 depletion as a function of absorbed dose using gamma radiation of different ratios of 𝐻2 − 𝑂2 − 𝐴𝑟 gas mixtures
-40.0
-20.0
0.0
20.0
40.0
60.0
80.0
100.0
120.0
0.0 20.0 40.0 60.0 80.0 100.0 120.0 140.0 160.0 180.0
O2 d
eple
tio
n /
(x1
01
7)
mo
lec.
Absorbed Dose / (x1016) 100 eV
10:01
05:02.5
05:05
2.5:5
01:10
H2: O2 (%)

Chapter 7 𝐻2 - 𝑂2 Radiolysis Results and Discussion 7131060
167
Although 𝑂2 is present in percent concentrations, there is a lot more scatter in these results
compared to the corresponding 𝐻2 data in Figure 7.14 which in turn leads to larger
associated errors. This is likely to be as a result of the dead volume inside the gas
chromatograph and the inability of the vacuum pump to achieve a high vacuum. Despite
this, 𝑂2 consumption appears to be zero order with respect to initial 𝑂2 concentration.
Figure 7.17: Plot of G(-𝑂2) as a function of absorbed dose for several different ratios of 𝐻2 − 𝑂2 − 𝐴𝑟 gas using gamma radiation using the data in Figure 7.16
Assuming that 𝐻2 and 𝑂2 recombines to form water via Reaction 7.11, then it would be
expected that the G(-𝐻2) values would be twice the order of G(-𝑂2) values. The average
ratio between G(-𝐻2) values in Table 7-1 and the G(-𝑂2) values in Table 7-2 is 1.44. As this
value is greater than 1, it can be assumed that hydrogen peroxide (𝐻2𝑂2) is not the final
stable product. Therefore, it is likely that there are other stable products that can be formed
during irradiation alongside water.
0.0
2.0
4.0
6.0
8.0
10.0
12.0
14.0
16.0
18.0
20.0
0.0 20.0 40.0 60.0 80.0 100.0 120.0 140.0 160.0 180.0
G(-
O2 )
Absorbed Dose / (x1016) 100 eV
10:01
05:02.5
05:05
2.5:5
01:10
H2: O2 (%)

Chapter 7 𝐻2 - 𝑂2 Radiolysis Results and Discussion 7131060
168
2𝐻2 + 𝑂2 → 2𝐻2𝑂 Reaction 7.11
7.6.1 Discussion
To understand the reaction order of the results, a mechanistic understanding of the system
is needed.
The initial step of this system is the ionisation and excitation of each component (Reactions
7.12-14).
𝐴𝑟 ⇝ 𝐴𝑟+ + 𝑒− → 𝐴𝑟∗ Reaction 7.12
𝐻2 ⇝ 𝐻2+ + 𝑒− → 𝐻2
∗ Reaction 7.13
𝑂2 ⇝ 𝑂2+ + 𝑒− → 𝑂2
∗ Reaction 7.14
Charge transfer between the initial ionised species is important to determine the
concentration of radical species. Table 7-3 gives the ionisation energies of each ground-
state gas molecule [85].
Gas Molecule Ionisation Energy / eV
𝐴𝑟 15.76
𝐻2 15.43
𝑂2 12.07
Table 7-3: Ionisation energy of the three gas molecules in the initial system
From this table it is clear that 𝐴𝑟 can ionise both 𝐻2 and 𝑂2 (Reactions 7.15 and 7.16), and
𝐻2 can ionise 𝑂2 (Reaction 7.17).

Chapter 7 𝐻2 - 𝑂2 Radiolysis Results and Discussion 7131060
169
𝐴𝑟+ + 𝐻2 → 𝐴𝑟 + 𝐻2+ σ = 1.13x10⁻¹⁵ cm2 [86] Reaction 7.15
𝐴𝑟+ + 𝑂2 → 𝐴𝑟 + 𝑂2+ σ = 8.0x10⁻¹⁵ cm2 [87] Reaction 7.16
𝐻2+ + 𝑂2 → 𝐻2 + 𝑂2
+ σ = 3.43x10⁻¹⁶ cm2 [88] Reaction 7.17
The reaction cross-sections of Reactions 7.15 - 7.17 are highlighted above. This leads to 𝑂2+
being the dominant species after initial ionisation. The ionised states of 𝐻2 and 𝑂2 will
undergo geminate recombination and dissociation (Reactions 7.18 and 7.19), 𝐻2∗ will
dissociate into 𝐻 atoms and 𝑂2∗ dissociates primarily into a singlet (1D) and a triplet (3P) state
𝑂 atoms [89] which have different reaction rates with different species.
𝐻2∗ → 2𝐻 Reaction 7.18
𝑂2∗ → 𝑂(1D) + 𝑂(3P) Reaction 7.19
The atomic species produced in Reactions 7.18 and 7.19 then react further and lead to
consumption of 𝐻2 and 𝑂2. As 𝑂(1D) and 𝑂(3P) are the dominant products of the initial
ionisation, their reaction rates with 𝐻2 and 𝑂2 will be important to understanding the
mechanism occurring in the gas phase. These reaction rates3 have been determined and are
outlined in the following reactions:
𝑂(1D)+ 𝐻2 → 𝑂𝐻 + 𝐻 k= 2.87x10⁻¹⁰ cm3 molecule-1 sec-1 [90] Reaction 7.20
𝑂(3P)+𝐻2 → 𝑂𝐻 + 𝐻 k= 9.08x10⁻¹⁸ cm3 molecule-1 sec-1 [91] Reaction 7.21
𝑂 + 𝑂2 + 𝑀 → 𝑂3 + 𝑀 k= 5.8x10⁻³⁴ cm6 molecule-2 sec-1 [92] Reaction 7.22
Reactions 7.20 and 7.21 highlight the different reaction rates of the singlet and triplet states
of 𝑂 and Reaction 7.22 highlights the competing reaction with 𝑂2 requires a third body
3 Throughout this chapter, reaction rate coefficients are given at 300K

Chapter 7 𝐻2 - 𝑂2 Radiolysis Results and Discussion 7131060
170
(𝑀=𝑂2/𝑁2/𝐴𝑟/𝐻𝑒). If 𝐴𝑟 is assumed to be the third body, the concentration is 2.188x10¹⁹
molecules cm-3 (assuming 0.9 bar partial pressure and ambient temperature). This
concentration can be used to turn the third order rate constant into a pseudo-second order
rate constant with a value of k= 1.27x10⁻¹⁴ cm3 molecule-1 sec-1. Reaction 7.22 is faster in
comparison to Reaction 7.21, but not as fast as the singlet oxygen reaction with 𝐻2
(Reaction 7.20).
Hydrogen atoms formed in Reaction 7.18 will also react with 𝐻2 and 𝑂2 in competition with
Reactions 7.20-22:
𝐻 + 𝑂2 → 𝑂 + 𝑂𝐻 k= 4.25x10⁻¹³ cm3 molecule-1 sec-1 [93] Reaction 7.23
𝐻 + 𝐻2 → 𝐻2 + 𝐻 k= 1.96x10⁻³² cm3 molecule-1 sec-1 [94] Reaction 7.24
Recombination of 𝑂 and 𝐻 atoms to form 𝑂2 and 𝐻2 molecules both require a third body.
The reaction rates are 4.82x10⁻³³ cm6 molecule-2 sec-1 and 1.3x10⁻³² cm6 molecule-2 sec-1
[95, 96] respectively. The pseudo-second order reaction rates are k= 1.05x10⁻¹³
cm3 molecule-1 sec-1 and k= 2.84x10⁻¹³ cm3 molecule-1 sec-1, respectively.
The 𝑂𝐻 formed in Reactions 7.20, 7.21 and 7.23 will then react with molecular and atomic
species as outlined below:
𝑂𝐻 + 𝐻2 → 𝐻2𝑂 + 𝐻 k= 6.96x10⁻¹⁵ cm3 molecule-1 sec-1 [97] Reaction 7.25
𝑂𝐻 + 𝑂(3P)→ 𝑂2 + 𝐻 k= 2.92x10⁻¹¹ cm3 molecule-1 sec-1 [98] Reaction 7.26
Reactions of 𝑂𝐻 with 𝑂2 and 𝐻 require high temperatures to occur.

Chapter 7 𝐻2 - 𝑂2 Radiolysis Results and Discussion 7131060
171
Reaction 7.23 can also form 𝐻𝑂2 but requires a third body. The rate constant for this
reaction is 2.2x10⁻³² cm6 molecule-2 sec-1 [99]. The pseudo-second order rate constant is very
fast however, with a value of k= 4.81x10⁻¹³ cm3 molecule-1 sec-1.
𝐻𝑂2 is a very stable species and can undergo recombination to form hydrogen peroxide
(Reaction 7.27). Hydrogen peroxide can then react with 𝑂𝐻 to form water (Reaction 7.28).
2𝐻𝑂2 → 𝐻2𝑂2 + 𝑂2 k= 6.89x10⁻¹³ cm3 molecule-1 sec-1 [100] Reaction 7.27
𝐻2𝑂2 + 𝑂𝐻 → 𝐻2𝑂 + 𝐻𝑂2 k= 1.91x10⁻¹² cm3 molecule-1 sec-1 [101] Reaction 7.28
The reaction mechanism outlined above leads to the formation of water, which is fairly
unreactive to other species, as high temperatures are needed for reactions to occur with
atomic hydrogen and oxygen, and reaction with 𝑂𝐻 leads to hydrogen exchange (Reaction
7.29). Water will however, undergo radiolysis leading to 𝑂𝐻 and 𝐻 formation. These species
can then feed back into the mechanism outlined above.
𝑂𝐻 + 𝐻2𝑂 → 𝐻2𝑂 + 𝑂𝐻 k= 2.2x10⁻¹⁶ cm3 molecule-1 sec-1 [102] Reaction 7.29
The fastest reaction outlined above is the singlet oxygen atom with 𝐻2 (Reaction 7.20),
therefore in systems where 𝑂2 is in excess, consumption of 𝐻2 should be at its greatest. This
is not the case however, suggesting that other reactions may dominate. There are very few
reactions that lead to 𝐻2 being reformed, as 𝐻 atom recombination requires a third body,
therefore the probability of the reaction taking place is lower. It is possible that in excess 𝑂2
conditions, Reaction 7.22 is increased, as the concentration of 𝑀 will be at its greatest.
The mechanism outlined above is only at a primitive stage, ionic reactions have not been
included and will play a role in the overall radiation chemistry of the system. Further

Chapter 7 𝐻2 - 𝑂2 Radiolysis Results and Discussion 7131060
172
fundamental experiments are required to elucidate a better understanding of the
mechanism.
It should also be noted, that in Figure 7.14, in the absorbed dose range investigated, 𝐻2
continues to be consumed. There are no plateaus in any of the data sets which would lead
to the suggestion of a steady state being reached between recombination and radiolysis
(Reaction 7.30). Therefore, in the system studied in this research, the rate of 𝐻2 and 𝑂2
recombination is greater than the rate of water vapour radiolysis.
2𝐻2 + 𝑂2 ⇌ 2𝐻2𝑂 Reaction 7.30
7.7 Gamma Radiolysis of 𝑯𝟐 − 𝑶𝟐 − 𝑨𝒓 in the Presence of an Oxide
Surface
The following section outlines results of 𝐻2 − 𝑂2 − 𝐴𝑟 radiolysis in the presence of 𝐶𝑒𝑂2
and 𝑍𝑟𝑂2. In all experiments detailed herein, the metal reaction vessels are filled to capacity
with the relevant oxide material. The mass and bulk density of the relevant oxide is used to
determine the remaining gas volume and therefore, the starting concentrations of each
gaseous component. Only the dose absorbed by the gas volume is used to calculate G(-𝐻2)
values.
Figure 7.18 highlights the consumption of 𝐻2 in the five gaseous mixtures of interest in
contact with 𝐶𝑒𝑂2.

Chapter 7 𝐻2 - 𝑂2 Radiolysis Results and Discussion 7131060
173
Figure 7.18: 𝐻2 consumption as a function of absorbed dose for various 𝐻2 − 𝑂2 − 𝐴𝑟 gas mixtures in contact with 𝐶𝑒𝑂2
At low doses, Figure 7.18 highlights that there is more 𝐻2 in the gas phase than was added
initially. It is presumed that this ‘excess’ 𝐻2 is from adsorbed water radiolysis as highlighted
in Figure 7.6. The maximum yield of 𝐻2 produced from radiolysis of adsorbed water on
𝐶𝑒𝑂2 measured in Figure 7.6 was 0.33 µmol. This yield was attained after 7.0x10¹⁹ eV had
been absorbed by the water. In Figure 7.18, the maximum yield measured was 88.0 nmol
after 1.21x10¹⁸ eV had been absorbed. These two values are approximately proportional
with dose. However, as the absorbed dose increases, 𝐻2 is not produced in any significant
quantities, it is only consumed.
After initial excitation, any energy transfer from the oxide must interact with adsorbed
species before gaseous species. Therefore the rate of water radiolysis is initially faster than
the rate of recombination. As the adsorbed water is radiolysed, it increases the
-10.0
0.0
10.0
20.0
30.0
40.0
50.0
60.0
70.0
80.0
90.0
100.0
0.0 5.0 10.0 15.0 20.0 25.0 30.0
H2 d
eple
tio
n /
(x1
01
7)
mo
lec.
Absorbed Dose / (x1016) 100 eV
10:0105:02.505:052.5:501:10
H2 : O2 (%)

Chapter 7 𝐻2 - 𝑂2 Radiolysis Results and Discussion 7131060
174
concentrations of 𝑂𝐻 and 𝐻, therefore, the rates of Reactions 7.23, 7.35 and 7.26 will
increase, leading to 𝐻2 and 𝑂2 consumption.
The comparative plot of G(-𝐻2) values for the data presented in Figure 7.18 is shown in
Figure 7.19.
Figure 7.19: Plot of G(-𝐻2) as a function of absorbed dose for several different ratios of 𝐻2 − 𝑂2 − 𝐴𝑟 gas in contact with 𝐶𝑒𝑂2
It is clear from this figure that the increased rate of 𝐻2 consumption leads to much larger
G(-𝐻2) values in this system than in pure gas phase radiolysis (Figure 7.15). However, like
gas phase data presented in Figure 7.15, there is greater variation at lower absorbed doses.
Due to the scatter present in the 𝑂2 consumption data in Figure 7.16 from pure gas-phase
experiments, the corresponding data for samples containing 𝐶𝑒𝑂2 are not shown in this
thesis.
-50.0
0.0
50.0
100.0
150.0
200.0
250.0
300.0
0.0 5.0 10.0 15.0 20.0 25.0 30.0
G (
-H2)
Absorbed Dose / (x1016) 100 eV
10:01
05:02.5
05:05
2.5:5
01:10
H2 : O2 (%)

Chapter 7 𝐻2 - 𝑂2 Radiolysis Results and Discussion 7131060
175
Figure 7.20 illustrates the consumption of 𝐻2 as a function of absorbed dose to the five
gaseous systems of interest in contact with 𝑍𝑟𝑂2.
Figure 7.20: Plot of 𝐻2 consumption as a function of absorbed dose for the five gaseous systems of relevance in contact with 𝑍𝑟𝑂2
As highlighted previously in Figure 7.18, at low absorbed doses, the concentration of 𝐻2
initially increases in Figure 7.20, due to the radiolysis of adsorbed water on the oxide
powder. The maximum yield of 𝐻2 measured in Figure 7.20 is 2.0 µmol at 2.0x10¹⁸ eV
absorbed dose. This yield is an order of magnitude above the corresponding yield measured
for the same absorbed dose in Figure 7.6 (0.58 µmol). This may not be a ‘real’ effect, as
these are two separate samples, with slight differences in 𝑍𝑟𝑂2 mass. This will lead to
differences in calculation of the dose absorbed by each sample.
-20.0
-10.0
0.0
10.0
20.0
30.0
40.0
50.0
60.0
70.0
80.0
90.0
100.0
0.0 2.0 4.0 6.0 8.0 10.0 12.0 14.0 16.0 18.0 20.0
H2 d
eple
tio
n /
(x1
01
7)
mo
lec.
Absorbed dose / (x1016) 100 eV
10:01
05:02.5
05:05
2.5:5
01:10
H2 : O2 (%)

Chapter 7 𝐻2 - 𝑂2 Radiolysis Results and Discussion 7131060
176
The ‘excess’ 𝐻2 measured in Figure 7.20, is over an order of magnitude greater than the
‘excess’ 𝐻2 measured in Figure 7.18. This further highlights the increase in energy transfer
from 𝑍𝑟𝑂2 to adsorbed water than is seen in the corresponding 𝐶𝑒𝑂2 system.
After the initial increase in 𝐻2, at higher absorbed doses, 𝐻2 is then consumed in all five
gaseous systems of interest.
Figure 7.21 highlights the G(-𝐻2) yield for the five gaseous systems in contact with 𝑍𝑟𝑂2.
Figure 7.21: G(-𝐻2) as a function of absorbed dose for five gaseous mixtures of 𝐻2 − 𝑂2 −𝐴𝑟 irradiated in contact with 𝑍𝑟𝑂2
The G(-𝐻2) values are two orders of magnitude greater than measured in the gaseous
system. This wide range of G(-𝐻2) values is unlikely to be an effect of the scatter that was
highlighted in Figure 7.15, but is hypothesised to be evidence of a chain reaction.
-100.0
0.0
100.0
200.0
300.0
400.0
500.0
0.0 5.0 10.0 15.0 20.0
G (
-H2)
Absorbed dose / (x1016) 100 eV
10:01
05:02.5
05:05
2.5:5
01:10
H2 : O2 (%)

Chapter 7 𝐻2 - 𝑂2 Radiolysis Results and Discussion 7131060
177
7.8 Comparison of Homogeneous and Heterogeneous Radiolysis
In comparing the scale of the x-axes in Figures 7.14, 7.18 and 7.20, it is evident that, the rate
of consumption of 𝐻2 is vastly increased in the presence of an oxide surface. More data has
been collected on systems containing the following 𝐻2 − 𝑂2 − 𝐴𝑟 concentrations: 5: 5: 90,
5: 2.5: 92.5 and 2.5: 5: 92.5. Therefore, these systems will be compared.
Figure 7.22 compares the consumption of 𝐻2 for systems containing equal concentration of
𝐻2 and 𝑂2 in pure gas and in contact with 𝑍𝑟𝑂2 and 𝐶𝑒𝑂2.
Figure 7.22: 𝐻2 consumption as a function of absorbed dose in samples of 5: 5: 90 𝐻2 − 𝑂2 − 𝐴𝑟 concentration in contact with 𝐶𝑒𝑂2 and 𝑍𝑟𝑂2 and in pure gas system only
The calculated G(-𝐻2) values from this graph with associated errors are tabulated in Table
7-4:
0.0
10.0
20.0
30.0
40.0
50.0
60.0
70.0
80.0
90.0
100.0
0.0 20.0 40.0 60.0 80.0 100.0 120.0 140.0 160.0 180.0
H2 d
ep
leti
on
/ (
x10
17)
mo
lec.
Absorbed Dose / (x1016) 100 eV
Gas only
CeO2
ZrO2

Chapter 7 𝐻2 - 𝑂2 Radiolysis Results and Discussion 7131060
178
System G(-𝑯𝟐) / molecules 100 eV
-1 Error (𝝈𝒔𝒍𝒐𝒑𝒆)
Gas Only 4.68 ± 0.13
𝐶𝑒𝑂2 35.07 ± 2.18
𝑍𝑟𝑂2 48.27 ± 6.48
Table 7-4: Calculated G(-𝐻2) in samples containing 5: 5: 90 𝐻2 − 𝑂2 − 𝐴𝑟 (by volume) in the presence of 𝐶𝑒𝑂2, 𝑍𝑟𝑂2 and in pure gas phase
The G(-𝐻2) values in Table 7-4, emphasise the effect the presence of an oxide powder on
the recombination of 𝐻2 and 𝑂2.
A possible hypothesis is that radiolysis of adsorbed water on the oxide surface leads to an
increase in 𝐻2 in the gas phase and increases the ratio of 𝐻2 to 𝑂2 closer to the favourable
water stoichiometry (2:1). This stoichiometry leads to the favourable formation of water in
the system (Reaction 7.31). Radiolysis of adsorbed water on 𝑍𝑟𝑂2 contributes more 𝐻2 than
adsorbed water on 𝐶𝑒𝑂2, therefore, the rate of consumption of 𝐻2 is greatly increased.
𝐻2 + 𝑂2 + 𝑥𝐻2 → (1 + 𝑥)𝐻2𝑂 (𝑥 ≤ 1) Reaction 7.31
Figure 7.23 illustrates the rate of 𝐻2 consumption in samples containing 5: 2.5: 92.5
𝐻2 − 𝑂2 − 𝐴𝑟 (by volume) in contact with 𝐶𝑒𝑂2, 𝑍𝑟𝑂2 and in pure gas.

Chapter 7 𝐻2 - 𝑂2 Radiolysis Results and Discussion 7131060
179
Figure 7.23: 𝐻2 consumption as a function of absorbed dose in samples of 5: 2.5: 92.5 𝐻2 − 𝑂2 − 𝐴𝑟 concentration in contact with 𝐶𝑒𝑂2 and 𝑍𝑟𝑂2 and in pure gas
This figure further highlights how the presence of an oxide surface increases the rate of
consumption of 𝐻2. It is evident from this figure, that in both systems containing an oxide,
𝐻2 is produced at low doses. This was not evident in Figure 7.22. Investigation of the gas
stoichiometries may lead to an explanation. The initial gas concentration is set at water
stoichiometry (2:1), therefore ‘excess’ 𝐻2 from adsorbed water radiolysis, will lead to excess
𝐻2 in the gas phase (Reaction 7.32), which is measured at low doses.
2𝐻2 + 𝑂2 + 𝑥𝐻2 → 2𝐻2𝑂 + 𝑥𝐻2 Reaction 7.32
At higher doses, the ‘excess’ 𝐻2 may adsorb to the oxide surface (more likely as 𝐻 than 𝐻2)
and react with hydroxyl groups on the surface, leading to adsorbed water formation.
-20.0
-10.0
0.0
10.0
20.0
30.0
40.0
50.0
60.0
70.0
80.0
0.0 20.0 40.0 60.0 80.0 100.0 120.0
H2 d
eple
tio
n /
(x1
01
7)
mo
lec.
Absorbed Dose / (x1016) 100 eV
Gas only
CeO2
ZrO2

Chapter 7 𝐻2 - 𝑂2 Radiolysis Results and Discussion 7131060
180
The compiled results for 𝐻2 depletion from samples with 2.5: 5: 92.5 𝐻2 − 𝑂2 − 𝐴𝑟 gas
compositions are shown in Figure 7.24.
Figure 7.24: 𝐻2 consumption as a function of absorbed dose in samples of 2.5: 5: 92.5 𝐻2 − 𝑂2 − 𝐴𝑟 concentration in contact with 𝐶𝑒𝑂2 and 𝑍𝑟𝑂2 and in pure gas
In this figure, ‘excess’ 𝐻2 is only measured in samples that contains 𝑍𝑟𝑂2. The maximum
yield of 𝐻2 is approximately 0.8 µmol, in comparison to 2.1 µmol measured in the
corresponding sample in Figure 7.23. In this system, 𝑂2 is initially in excess, therefore any
𝐻2 formed from adsorbed water radiolysis, will enhance the rate of recombination. This is
highlighted by the fact that, ‘excess’ 𝐻2 is not measured in samples containing 𝐶𝑒𝑂2 and the
yield measured from 𝑍𝑟𝑂2 containing samples is an order of magnitude below what is
expected. The overall reaction in this system is shown in Reaction 7.33.
𝐻2 + 2𝑂2 + 𝑥𝐻2 → (1 + 𝑥)𝐻2𝑂 (𝑥 ≤ 3) Reaction 7.33
-10.0
0.0
10.0
20.0
30.0
40.0
50.0
60.0
70.0
80.0
0.0 20.0 40.0 60.0 80.0 100.0 120.0 140.0
H2 d
eple
tio
n /
(x1
01
7)
mo
lec.
Absorbed Dose / (x1016) 100 eV
Gas only
CeO2
ZrO2

Chapter 7 𝐻2 - 𝑂2 Radiolysis Results and Discussion 7131060
181
Summary
From the figures presented in Section 7.8, it is clear that the presence of an oxide powder,
greatly increases the rate of 𝐻2 consumption in mixtures of 𝐻2 − 𝑂2 − 𝐴𝑟 gas, in
comparison to homogeneous studies. It is not yet clear however, if this is due to a catalytic
effect from the oxide powder, whether the presence of adsorbed water enhances the gas
phase radiation chemistry or whether other physical properties of the oxides have an effect.
7.9 Discussion of Pelletron Dosimetry
Section 5.6 outlined the methodology used to determine the dose absorbed by a sample
using an accelerated ion source. To enhance the validity of the absolute current
measurements, several experiments were carried out irradiating a chemical dosimeter in
order to make direct comparison between the two systems utilised. The chemical
dosimeters discussed in Sections 5.2 and 5.5 have been investigated using ion accelerators
[64, 103]. Due to the geometry of the reaction vessel and the nature of the radiation field,
the Fricke dosimeter is an unsuitable candidate. The solution is not agitated during
irradiation and the ion beam will only penetrate a few tens of μm, which will lead to
significant errors in determining the dose by the entire solution. Only mixtures of
𝐻2 − 𝑂2 − 𝐴𝑟 gas will be studied using the ion accelerator therefore ethylene gas was
chosen as the appropriate choice for a chemical dosimeter. The benefits of using ethylene
gas instead of 𝑁2𝑂 have been discussed previously for use with gamma radiation. Another
disadvantage of using 𝑁2𝑂 with accelerated ions is the potential to form activated nitrogen
isotopes. The formation of 13𝑁, which is a β emitter with half-life of ten minutes may lead to

Chapter 7 𝐻2 - 𝑂2 Radiolysis Results and Discussion 7131060
182
errors in analysis due to the elapsed time in post irradiation analysis whilst this isotope
decays to safe background levels.
Ethylene radiolysis using a beam of accelerated ions was carried out following the method
outlined in Section 3.4.4. The GC has been adapted to accept glass vessels instead of the
steel sample vessels utilised in γ radiation studies. The glass vessels have a larger volume
than the corresponding metal cylinders which leads to a smaller change in pressure during
subsequent injections on the GC; this ensures the fragile mica window is not subjected to
large pressure differences.
The results of the ethylene trials are shown in Figure 7.25.
Figure 7.25: Plot of 𝐻2 production as a function of absorbed dose for ethylene experiments using an ion accelerator
In Figure 7.25, the absorbed dose has been calculated by integrating the current profile of
each experiment. The calculated G-value for 𝐻2 formation is 1.39 ± 0.02 molecules 100 eV-1.
0.0
10.0
20.0
30.0
40.0
50.0
60.0
0.0 5.0 10.0 15.0 20.0 25.0 30.0 35.0 40.0
H2 p
rod
uct
ion
/ (
x10
17)
mo
lec.
Absorbed Dose / (x1017) 100 eV
G(H2)= 1.39 ± 0.02
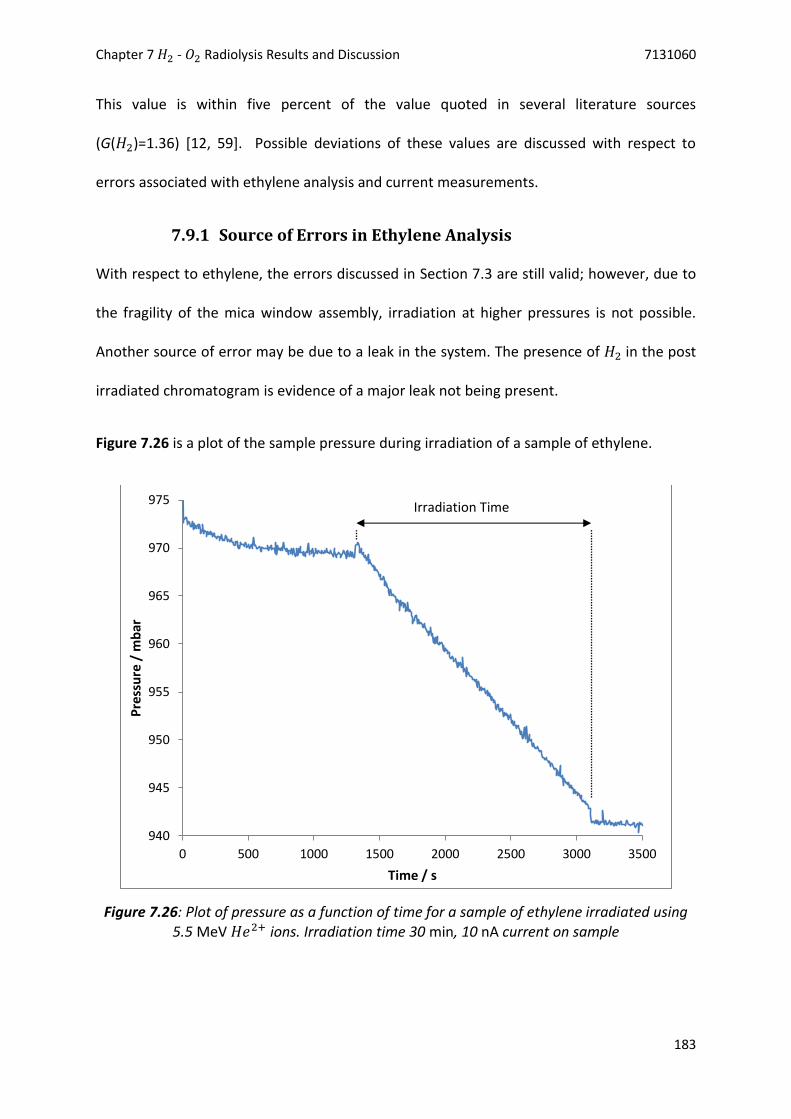
Chapter 7 𝐻2 - 𝑂2 Radiolysis Results and Discussion 7131060
183
This value is within five percent of the value quoted in several literature sources
(G(𝐻2)=1.36) [12, 59]. Possible deviations of these values are discussed with respect to
errors associated with ethylene analysis and current measurements.
7.9.1 Source of Errors in Ethylene Analysis
With respect to ethylene, the errors discussed in Section 7.3 are still valid; however, due to
the fragility of the mica window assembly, irradiation at higher pressures is not possible.
Another source of error may be due to a leak in the system. The presence of 𝐻2 in the post
irradiated chromatogram is evidence of a major leak not being present.
Figure 7.26 is a plot of the sample pressure during irradiation of a sample of ethylene.
Figure 7.26: Plot of pressure as a function of time for a sample of ethylene irradiated using 5.5 MeV 𝐻𝑒2+ ions. Irradiation time 30 min, 10 nA current on sample
940
945
950
955
960
965
970
975
0 500 1000 1500 2000 2500 3000 3500
Pre
ssu
re /
mb
ar
Time / s
Irradiation Time

Chapter 7 𝐻2 - 𝑂2 Radiolysis Results and Discussion 7131060
184
This figure shows pressure increases inside the sample vessel as the ion beam was
accelerated into the sample. The pressure decreases by the same quantity when the beam
was stopped. The pressure decreased at a rate of 0.93 mbar min-1 during the fifteen minutes
the beam was irradiating the sample. This 2.89% decrease was attributed to radiolysis of the
ethylene. Higher molecular weight polymeric products will condense onto the vessel walls
leading to a decrease in the pressure as will the reaction of ethylene molecules. The stability
of the sample pressure outside of the window of irradiation suggests there is not a leak in
the vessel.
Anderson and Best [103] have studied the ethylene dosimeter using a cyclotron accelerator.
They irradiated samples at approximately 530 mbar and utilised substantially higher dose
rates than in this research. They found the yield of 𝐻2 produced was linear up to absorbed
doses of 3x10²⁰ eV with varying dose rates, ion energy and type.
7.9.2 Source of Errors in Current Measurements
A possible source of error in the current measurements is due to ‘crosstalk’. A small
percentage of ions, when hitting the mica window may be rebounded back onto the 𝑇𝑖
window which leads to some ions being counted more than once. This phenomenon is a
larger problem when more dense materials are placed after the 𝑇𝑖 window assembly. It has
been shown that the current on the 𝑇𝑖 window is greater when a steel slide is placed after
the window compared to a quartz slide. Mica is less dense than these materials and is
placed further away from the 𝑇𝑖 window due to the glass collar. As the ions will have a
lower energy after rebounding off the mica window and traversing across to the 𝑇𝑖 window,
the dose enhancement will be negligible.

Chapter 7 𝐻2 - 𝑂2 Radiolysis Results and Discussion 7131060
185
It is possible that electrons can be ejected from the mica window when the ion beam
traverses the window. Any electrons that are ejected from the window towards the 𝑇𝑖
window will cancel the charge of the positive ions. The probability of this happening is very
small as the majority of electrons will be ejected in the direction of the beam and into the
sample.
Summary
Experiments utilising ethylene as a secondary dosimeter show there is excellent agreement
between the absorbed dose calculated using ethylene dosimetry and absolute current
measurements, with the calculated G-value being within 5% of the literature value. This has
validated the use of the absolute current measurements to determine the absorbed dose in
samples of 𝐻2 − 𝑂2 − 𝐴𝑟 gas.

Chapter 7 𝐻2 - 𝑂2 Radiolysis Results and Discussion 7131060
186
7.10 𝑯𝟐 − 𝑶𝟐 − 𝑨𝒓 Radiolysis using an Ion Accelerator
Due to operational and time constraints, a revised experiment set was investigated using
accelerated ions. As a result of the complexity of the source and the system of interest, only
gaseous samples were irradiated and only three different compositions. These were:
Equal volumes of 𝐻2 and 𝑂2 (stoichiometry 5 : 5 : 90 𝐻2 − 𝑂2 − 𝐴𝑟 (by
volume));
Water stoichiometry of 𝐻2 and 𝑂2 (stoichiometry 5 : 2.5 : 92.5 𝐻2 − 𝑂2 −
𝐴𝑟 (by volume)); and
𝑂2 excess atmospheres (stoichiometry 2.5 : 5 : 92.5 𝐻2 − 𝑂2 − 𝐴𝑟 (by
volume))
The results of these experiments are outlined in Figure 7.27 and Table 7-5.
Figure 7.27: 𝐻2 depletion as a function of absorbed dose for three different mixtures of 𝐻2 − 𝑂2 − 𝐴𝑟 utilising 5.5 MeV 𝐻𝑒2+ accelerated ions
0.0
0.5
1.0
1.5
2.0
2.5
3.0
3.5
4.0
4.5
0.0 1.0 2.0 3.0 4.0 5.0 6.0 7.0 8.0
H2 d
eple
tio
n /
(x1
01
9)
mo
lec.
Absorbed Dose / (x1018) 100 eV
05:2.5
05:05
2.5:5
H2 : O2 (%)

Chapter 7 𝐻2 - 𝑂2 Radiolysis Results and Discussion 7131060
187
System (𝑯𝟐 − 𝑶𝟐 − 𝑨𝒓 (by volume))
G(-𝑯𝟐) / molecules 100 eV
-1 Error (𝝈𝒔𝒍𝒐𝒑𝒆)
5 : 2.5 : 92.5 5.04 ± 0.72
5 : 5 : 90 4.76 ± 0.61
2.5 : 5 : 92.5 5.38 ± 0.46
Table 7-5: Calculated G(-𝐻2) values from experiments utilising 5.5 MeV 𝐻𝑒2+ accelerated ions
The errors associated with this data are larger than the corresponding errors for data
collected with the 60𝐶𝑜 source. This is due to a smaller sample set.
In Figure 7.27, 𝐻2 is being depleted linearly with absorbed dose. The G-values calculated for
these data sets indicate the depletion of 𝐻2 is independent of initial 𝐻2 concentration.
7.11 Comparison of γ and 𝑯𝒆𝟐+ Irradiation of Gaseous 𝑯𝟐 − 𝑶𝟐 − 𝑨𝒓
Samples
It is possible to compare the results of 𝐻2 − 𝑂2 − 𝐴𝑟 radiolysis using both 60𝐶𝑜 gamma rays
and 𝐻𝑒2+ accelerated ions, as there should be no linear energy transfer (LET) effect in
gaseous samples, due to the low density of the systems.
Figure 7.28 combines the results of 𝐻2 depletion as a function of absorbed dose using
gamma rays (Figure 7.14) and accelerated 𝐻𝑒2+ ions (Figure 7.27) for the three gaseous
mixtures investigated using both sources and the calculated G-values are shown in Table
7-6.

Chapter 7 𝐻2 - 𝑂2 Radiolysis Results and Discussion 7131060
188
Figure 7.28: 𝐻2 depletion as a function of absorbed dose for three various mixtures of 𝐻2 − 𝑂2 − 𝐴𝑟 utilising 60𝐶𝑜 γ-rays and 5.5 MeV 𝐻𝑒2+ accelerated ions
System
(𝑯𝟐 − 𝑶𝟐 − 𝑨𝒓
(by volume))
60𝑪𝒐 γ-rays 5.5MeV 𝑯𝒆𝟐+ accelerated Ions
G(-𝑯𝟐) / molecules 100 eV
-1 Error (𝝈𝒔𝒍𝒐𝒑𝒆) G(-𝑯𝟐) /
molecules 100 eV-1
Error (𝝈𝒔𝒍𝒐𝒑𝒆)
5 : 2.5 : 92.5 4.66 ± 0.37 5.04 ± 0.72
5 : 5 : 90 4.68 ± 0.13 4.76 ± 0.61
2.5 : 5 : 92.5 3.81 ± 0.12 5.38 ± 0.46
Table 7-6: Calculated G(-𝐻2) values and associated errors for three different mixtures of 𝐻2 − 𝑂2 − 𝐴𝑟 utilising 60𝐶𝑜 γ-rays and 5.5 MeV 𝐻𝑒2+ accelerated ions
0.0
50.0
100.0
150.0
200.0
250.0
300.0
350.0
400.0
450.0
0.0 100.0 200.0 300.0 400.0 500.0 600.0 700.0 800.0
H2 d
eple
tio
n /
(x1
01
7)
mo
lec.
Absorbed Dose / (x1016) 100 eV
5:2.5 gamma 5:2.5 He2+
5:5 gamma 5:5 He2+
2.5:5 gamma 2.5:5 He2+

Chapter 7 𝐻2 - 𝑂2 Radiolysis Results and Discussion 7131060
189
The G-values in Table 7-6, are very close, however, the error associated with the accelerated
ion data is significantly higher. Sections 7.3 and 7.9 discussed the potential sources of errors
with the dosimetry systems used in each set of measurements and Chapter Four dealt with
the errors associated with GC analysis.
This data confirms there is no radiation type effect and therefore no LET effect as to be
expected in gaseous systems.
The primary radiation sources utilised (60𝐶𝑜 γ-rays and 5.5 MeV 𝐻𝑒2+ accelerated ions)
leads to different radiation fields in the samples. Inside the 60𝐶𝑜 source, the entire sample is
within the radiation field, however, only part of the sample is in the primary radiation field
when accelerated ions are used. This effect is negated by the secondary electron radiation
field. In gaseous systems the majority of the absorbed dose is from interactions of the
secondary electrons with the gas, not the primary radiation [57]. These secondary electrons
can have ranges in the order of metres, therefore all of the sample can still be irradiated.
Conclusions
60𝑪𝒐 Studies
The use of ethylene (𝐶2𝐻4), as a gas-phase dosimeter for 60𝐶𝑜 γ-rays provides results in
good agreement with the more commonly used Fricke dosimeter. This allows for a good
approximation of the dose absorbed by the gas phase studied in this chapter. The detection
limits of the GC leads to higher irradiation pressures being required to attain repeatable
results.
Adsorbed water on both 𝐶𝑒𝑂2 and 𝑍𝑟𝑂2 leads to 𝐻2 formation during irradiations. The
quantity of 𝐻2 produced is five times greater in the presence of 𝑍𝑟𝑂2 than 𝐶𝑒𝑂2, in good
agreement with literature [25, 29], an explanation of this, is the resonance of the oxide

Chapter 7 𝐻2 - 𝑂2 Radiolysis Results and Discussion 7131060
190
band gap with the bond dissociation energy of water. The approximation of one monolayer
of adsorbed water is valid, with the quantities of 𝐻2 measured.
A similar effect is seen with radiolysis of ethylene in contact with an oxide surface. The yield
of 𝐻2 is greater than the sum of radiolysis of ethylene alone and 𝐻2 produced from
adsorbed water radiolysis. The bond dissociation energy of ethylene is 4.81 eV, which is low
enough for energy transfer from 𝑍𝑟𝑂2 to enhance decomposition.
The gamma radiolysis of 𝐻2 − 𝑂2 − 𝐴𝑟 gas mixtures follows zero order kinetics with regards
to 𝐻2 depletion. This is in agreement with literature data [41], however, a complete
explanation is not forthcoming. The presence of an oxide surface greatly enhances depletion
of 𝐻2 from the gas phase. At low doses, there is an ‘excess’ of 𝐻2 due to the radiolysis of
adsorbed water having a faster rate than recombination of 𝐻2 and 𝑂2, at higher doses,
however, recombination dominates. A steady state between the two processes is not
reached.
𝑯𝒆𝟐+ Studies
The use of ethylene gas as a dosimeter for ion accelerator experiments provides good
validation of the absolute current measurements. The G(𝐻2) value of 1.39 is within 5% of
literature values.
Experiments utilising accelerated 𝐻𝑒2+ ions confirm there is no LET effect in samples of
𝐻2 − 𝑂2 − 𝐴𝑟. These experiments also highlight that no steady state is reached between
the recombination of 𝐻2 − 𝑂2 and the radiolysis of water vapour at higher absorbed doses
than achieved with 60𝐶𝑜 γ-rays.

Chapter 8 Air Radiolysis Results and Discussion 7131060
191
8 Air Radiolysis Results and Discussion
The following chapter details the results from radiolysis of air experiments in the
presence/absence of a particular oxide surface. The experimental details were outlined in
Chapter Three (all experiments undertaken in 12.0 cm3 glass vials, with the temperature
inside the 60𝐶𝑜 irradiator being approximately 35 °C). The results are interpreted and their
relevance discussed throughout.
This chapter details the results from radiolysis of air measurements and their significance.
This is followed by initial results with samples containing an oxide surface. During these
results, an interference from another species was identified and resolved. New data from air
radiolysis experiments in the presence of an oxide surface are presented and discussed
followed by results and discussion of the interfering species. A final conclusion of the results
presented in this chapter is given at the end.
8.1 Ion Chromatogram Calibration
During the course of air radiolysis experiments, the primary product ion of interest is the
nitrate anion (𝑁𝑂3−). To determine the detection limit of the ion chromatograph and its
linearity, calibration solutions of sodium nitrate (𝑁𝑎𝑁𝑂3) with known concentrations were
injected into the ion chromatograph. Two injections of each standard were taken to ensure
there were no instrument anomalies. The calibration results are shown in Figure 8.1:

Chapter 8 Air Radiolysis Results and Discussion 7131060
192
Figure 8.1: Calibration plot of 𝑁𝑂3− peak area as a function of 𝑁𝑎𝑁𝑂3 concentration using
ion chromatography
The ion chromatograph has a linear response to 𝑁𝑂3− in the range of 0.05-1 mmol L-1. The
standard deviation of the slope (σ) is 0.99. To validate the performance of the detector,
fortnightly calibrations using fresh 𝑁𝑎𝑁𝑂3 solutions were carried out.
y = 49.279x R² = 0.9968
0.0
10.0
20.0
30.0
40.0
50.0
60.0
0 0.2 0.4 0.6 0.8 1 1.2
Pea
k ar
ea /
AU
[NaNO3] / mM
Chapter 8 Air Radiolysis Results and Discussion 7131060
193
8.2 Air Radiolysis
To determine the baseline yield of nitrate without an oxide present, the glass vials shown in
Figure 3.5 were sealed and irradiated. The results are shown in Figure 8.2:
Figure 8.2: Effect of γ radiation dose4 on nitrate production from laboratory air Volume of sample = 12.0 cm3 at 35 °C
Initially there is a linear relationship between the dose absorbed by the gas and the
production of 𝑁𝑂3−. This initial production has been plotted on the graph (black dashed line)
and gives an initial yield, G(𝑁𝑂3−), value of 1.39 ± 0.04 ions 100 eV-1. As seen in Chapter Two,
this yield is within the value quoted in the literature [45, 46]. Above an absorbed dose of
6x10¹⁹ eV, the measured production of 𝑁𝑂3− drops off from the initial rate of formation and
starts to plateau with increasing dose. This decreased production suggests that a steady
state has been reached for this system, in which the amount of 𝑁𝑂3− is 1 µmol.
4 Throughout this Chapter, in all plots of species production as a function of absorbed dose, the absorbed dose
axis has been plotted in units of 100 eV so that G-values for the species in question can be determined from the gradient of the trend line of the data.
0.0
20.0
40.0
60.0
80.0
100.0
120.0
0.0 20.0 40.0 60.0 80.0 100.0 120.0 140.0
Nit
rate
pro
du
ctio
n /
(x1
01
6)
mo
lec.
Dose to air / (x1016) 100 eV 1
G(NO3-)=1.39

Chapter 8 Air Radiolysis Results and Discussion 7131060
194
A plausible explanation for the levelling of the 𝑁𝑂3− production is the depletion of a reactant
that leads to the formation of nitric acid. This reactant is likely to be water vapour as
outlined by Jones [46]. To assess this hypothesis, 100 µl of liquid water was added to the
vials and irradiations were performed under the same conditions. Figure 8.3 shows the
results:
Figure 8.3: Effect of γ radiation dose on the production of nitrate in water saturated and unsaturated laboratory air. Volume of air = 11.9-12.0 cm3 at 35 °C
When water is added to the system, the initial rate of 𝑁𝑂3− formation seen in Figure 8.2 is
extended to higher doses and shows no sign of levelling off. The G-value for 𝑁𝑂3− formation
in the water saturated system is 1.17 ± 0.06 ions 100 eV-1.
If the concentration of water is the factor limiting the production of nitric acid in air
radiolysis, it is important to quantify the amount of water vapour present in the initial
system. The relative humidity in the laboratory where the samples are prepared is
approximately 40% with an average temperature of 25 °C. These conditions give a saturated
0.0
20.0
40.0
60.0
80.0
100.0
120.0
0.0 20.0 40.0 60.0 80.0 100.0 120.0 140.0
Nit
rate
yie
ld /
(x1
01
6)
mo
lec.
Dose to air / (x1016) 100 eV
Lab. Air
Air (H2O added)
G(NO3-) = 1.17

Chapter 8 Air Radiolysis Results and Discussion 7131060
195
vapour density of 23 g m-3 of water. Using Equation 8.1, the actual vapour density in the
room is calculated as 9.2 g m-3:
𝑅. 𝐻. = 𝑎𝑐𝑡𝑢𝑎𝑙 𝑣𝑎𝑝𝑜𝑢𝑟 𝑑𝑒𝑛𝑠𝑖𝑡𝑦
𝑠𝑎𝑡𝑢𝑟𝑎𝑡𝑒𝑑 𝑣𝑎𝑝𝑜𝑢𝑟 𝑑𝑒𝑛𝑠𝑖𝑡𝑦 x 100% Equation 8.1
The glass vials in Figure 3.5 have a crimped volume of 12 cm3. Therefore the quantity of
water in the initial vial is 3.69x10¹⁸ molecules. Assuming that each water molecule can react
with 𝑁2 and 𝑂2 to form 2 molecules of nitric acid (𝐻𝑁𝑂3) (Reaction 8.1), the maximum yield
of nitrate theoretically attainable is 12.26 µmol.
2𝐻2𝑂 + 𝑁2 + 2𝑂2 → 4𝐻𝑁𝑂3 Reaction 8.1
This value exceeds the maximum yield achieved in Figure 8.2 (1 µmol) by approximately
90%, suggesting that there is another mechanism occurring that leads to the removal of
water vapour from the system. Chapter Seven discussed this topic in more detail with the
likely mechanism being water vapour radiolysis, forming 𝐻2 and 𝑂2 gas.
In the subsequent data plots, the water saturated air results will be plotted to represent the
system in the absence of an oxide. This is to show the trend of nitrate formation assuming
an excess of water vapour was present.
8.3 Air Radiolysis in the Presence of an Oxide Surface
In the following section, results are given for the systems containing an oxide powder.
Dosimetry of this system was detailed in Section 5.3, with a weighting factor applied to
Fricke dosimeter results to correct for the difference in density of the dosimeter solution
and air. The volume of gas irradiated is calculated by subtracting the volume of oxide (using

Chapter 8 Air Radiolysis Results and Discussion 7131060
196
the crystal density and the mass) from the total volume. The actual volume of gas inside the
vial is used to determine the dose absorbed of the gas.
Figure 8.4 shows the results of the system containing 1 g of an oxide powder. In this system,
the majority of the volume is still occupied by the gas phase (~95%) therefore the surface
should not have a profound effect on the nitrate yield.
Figure 8.4: Nitrate production as a function of dose for systems containing 1 g of either 𝐶𝑒𝑂2 or 𝑍𝑟𝑂2 powder and water saturated air (no oxide)
The G-values of nitrate formation calculated from the gradient of each data set is given in
the following table:
System G(𝑵𝑶𝟑−) /
molecules 100 eV-1 Error (𝝈𝒔𝒍𝒐𝒑𝒆)5
No oxide 1.17 ± 0.06
1 g 𝐶𝑒𝑂2 1.96 ± 0.03
1 g 𝑍𝑟𝑂2 2.10 ± 0.04
Table 8-1: Calculated G(𝑁𝑂3−) values and standard deviation of the gradient for 1 g oxide
systems and water saturated air (no oxide)
5 Throughout this Chapter, errors are calculated within one standard deviation.
0.0
20.0
40.0
60.0
80.0
100.0
120.0
140.0
160.0
0.0 10.0 20.0 30.0 40.0 50.0 60.0 70.0 80.0 90.0
Nit
rate
pro
du
ctio
n /
(x1
01
6)
mo
lec.
Dose to air / (x1016) 100 eV
No Oxide
CeO2
ZrO2

Chapter 8 Air Radiolysis Results and Discussion 7131060
197
From this table, it is clear that in the presence of an oxide surface, the yield of nitrate
formation increases by 60 and 80% with 𝐶𝑒𝑂2 and 𝑍𝑟𝑂2, respectively. Furthermore, this
increased rate of formation remains constant up to absorbed doses of 7x10¹⁹ eV. This trend
suggests that there is more water in the irradiated system in the presence of an oxide than
is present in laboratory air alone. The water is most likely to be adsorbed to the oxide
surface.
Table 8-2 highlights the water available in the system, either in the headspace or adsorbed
onto the oxide powder. Several assumptions have been made in these calculations. Firstly,
only one monolayer of water is adsorbed onto the oxide. The mass of this monolayer has
been calculated as 0.21 mg m-2 for 𝑃𝑢𝑂2 [23], this value should not differ greatly for 𝐶𝑒𝑂2
or 𝑍𝑟𝑂2. Secondly, the vapour density of the air is 9.2 g m-3 with 40% relative humidity. The
surface area of each oxide was determined in Chapter Six.
System Surface Area / m2
Oxide Volume6 /
cm3
Mass of water on oxide /
mg
Mass of water in
headspace / µg
Total mass of water in
system / mg
Water Saturated air
(no oxide)
- - - (0.1 mg of
liquid water)
110.40 0.18
1 g 𝐶𝑒𝑂2 7.42 0.14 1.56 109.11 1.67
1 g 𝑍𝑟𝑂2 2.24 0.18 0.47 108.74 0.58
Table 8-2: Calculated mass of water in systems containing 1 g 𝐶𝑒𝑂2, 1 g 𝑍𝑟𝑂2 and water saturated air (no oxide)
Clearly the mass of water adsorbed on the oxide surface far outweighs the mass of water in
the gas phase, and it is unlikely that water depletion will occur in experiments on samples
containing the oxide powder.
6 Using crystal density values of: 7.215 and 5.68 g cm
-3 for 𝐶𝑒𝑂2and 𝑍𝑟𝑂2, respectively

Chapter 8 Air Radiolysis Results and Discussion 7131060
198
The following paragraph details the results from experiments on a system with 50% oxide
(by volume). As explained in Section 3.4.2 and determined in Chapter Six, the bulk density of
each oxide was used to calculate the mass needed to fill the glass vials to approximately half
the volume. The mass of oxide required was 6 and 11 g for 𝐶𝑒𝑂2 and 𝑍𝑟𝑂2, respectively.
Table 8-3 highlights the calculated water available in the system for both oxides.
System Surface Area / m2
Oxide Volume /
cm3
Mass of water on oxide /
mg
Mass of water in
headspace / µg
Total mass of water in
system / mg
Water Saturated air
(no oxide)
- - - (0.1 mg of
liquid water)
110.40 0.18
50% 𝐶𝑒𝑂2 (by volume)
(~6 g)
44.5 0.83 9.35 102.76 9.45
50% 𝑍𝑟𝑂2 (by volume)
(~11 g)
24.6 1.94 5.17 92.55 5.26
Table 8-3: Calculated mass of water in systems containing 50% 𝐶𝑒𝑂2 and 50% 𝑍𝑟𝑂2 (by volume) and water saturated air (no oxide)
The results are shown in Figure 8.5 and Table 8-4:

Chapter 8 Air Radiolysis Results and Discussion 7131060
199
Figure 8.5: Nitrate production as a function of absorbed dose for systems containing 50% oxide (by volume) and for water saturated air (no oxide)
System G(𝑵𝑶𝟑−) /
molecules 100 eV-1 Error (𝝈𝒔𝒍𝒐𝒑𝒆)
No oxide 1.17 ± 0.06
50% 𝐶𝑒𝑂2 (~6 g) 2.96 ± 0.09
50% 𝑍𝑟𝑂2 (~11 g) 3.55 ± 0.11
50% 𝑍𝑟𝑂2 (2) (~11 g) 4.77 ± 1.30
Table 8-4: Calculated G(𝑁𝑂3−) values and standard deviation of the gradient for experiment
with 50% oxide (by volume) and with water saturated air (no oxide)
The most prominent feature of Figure 8.5 is that at low absorbed doses (< 1x10¹⁹ eV) there
is a discrepancy in the 𝑍𝑟𝑂2 system which leads to some samples (orange data) producing
almost double the yield of nitrate. The orange data set represents a separate experiment
run in comparison to the green data set. The data represented by the orange markers has a
higher degree of scatter and standard deviation. The explanation for this will be discussed in
the following section.
0.0
50.0
100.0
150.0
200.0
250.0
300.0
350.0
400.0
450.0
0.0 20.0 40.0 60.0 80.0 100.0 120.0
Nit
rate
yie
ld /
(x1
01
6)
mo
lec.
Dose to air / (x1016) 100 eV
No Oxide
CeO2 (~6 g)
ZrO2 (~11 g)
ZrO2 (2) (~11 g)

Chapter 8 Air Radiolysis Results and Discussion 7131060
200
As seen in the 1 g data set, the presence of an oxide surface greatly enhances the formation
of nitric acid. The yield of 𝑁𝑂3− is two and a half times greater with 50% 𝐶𝑒𝑂2 present and
three times greater with 𝑍𝑟𝑂2 present. The yield is greater with 𝑍𝑟𝑂2 present than 𝐶𝑒𝑂2, as
seen with the 1 g data set. This difference is not simply due to an increase in surface area
and a possible increase in catalytic sites on the powder, as there is three times more surface
area in the 𝐶𝑒𝑂2 system than in the 𝑍𝑟𝑂2 system.
The oxide masses used in experiments with 90% oxide (by volume) are 12 g of 𝐶𝑒𝑂2 and 20
g of 𝑍𝑟𝑂2. Table 8-5 highlights the calculated water available in each system.
System Surface Area / m2
Oxide Volume /
cm3
Mass of water on oxide /
mg
Mass of water in
headspace / µg
Total mass of water in
system / mg
Water Saturated air
(no oxide)
- - - (0.1 mg of
liquid water)
110.40 0.18
90% 𝐶𝑒𝑂2 (by volume)
(~12 g)
89.0 1.66 18.7 95.13 18.80
90% 𝑍𝑟𝑂2 (by volume)
(~20 g)
44.8 3.52 9.41 78.02 9.49
Table 8-5: Calculated mass of water in systems containing 90% 𝐶𝑒𝑂2 and 90% 𝑍𝑟𝑂2 (by volume) and water saturated air (no oxide)
Figure 8.6 and Table 8-6 show the results from experiments with 90% oxide present (by
volume).

Chapter 8 Air Radiolysis Results and Discussion 7131060
201
Figure 8.6: Nitrate production as a function of dose for systems containing 90% oxide (by volume) and for water saturated air (no oxide)
System G(𝑵𝑶𝟑−) / molecules 100 eV-1
Error (𝝈𝒔𝒍𝒐𝒑𝒆)
No oxide 1.17 ± 0.06
90% 𝐶𝑒𝑂2 (~12 g) 4.54 ± 0.72
90% 𝑍𝑟𝑂2 (~20 g) -20.55 ± 11.54
90% 𝑍𝑟𝑂2 (~20 g) manipulated (orange line)
19.78 ± 3.57
Table 8-6: Calculated G(𝑁𝑂3−) values and standard deviation of the gradient for systems with
90% oxide (by volume) and for water saturated air (no oxide)
At low absorbed doses, there is a large amount of scatter in the 𝑍𝑟𝑂2 system. This scatter
was also apparent in the 50% system (Figure 8.5). The size of the possible error in the yields
obtained for the 𝐶𝑒𝑂2 system has also increased from the 50% system. This increase will be
discussed in the next section. The presence of the two 𝑍𝑟𝑂2 data points with yields of
nitrate above 1.8x10¹⁶ molecules (3 µmol) (highlighted in red circles) complicates the data
analysis and leads to apparently negative yield of nitrate calculated. By removing these
points, the G(𝑁𝑂3−) yield is 19.78 molecules 100 eV-1 and the standard deviation of the slope
0.0
50.0
100.0
150.0
200.0
250.0
300.0
0.0 10.0 20.0 30.0 40.0 50.0 60.0 70.0 80.0
Nit
rate
yie
ld /
(x1
01
6)
mo
lec.
Dose to air / (x1016) 100 eV
No Oxide
CeO2 (~12 g)
ZrO2 (~20 g)

Chapter 8 Air Radiolysis Results and Discussion 7131060
202
is 3.57. This slope is highlighted in orange in Figure 8.6. This data manipulation greatly
reduces the scatter in the results; however, the G-value calculated is much larger than that
measured in the previous 𝑍𝑟𝑂2 data sets. The large increase was not seen between the 1 g
and 50% sample systems, therefore this may not be a real effect.
8.3.1 Comparison of 𝑪𝒆𝑶𝟐 Data
Figure 8.7 and Table 8-7 compares γ-radiation results for the 𝐶𝑒𝑂2 system and displays how
nitrate formation is affected by the presence of 𝐶𝑒𝑂2.
Figure 8.7: Nitrate production as a function of absorbed dose for 1 g, 50% and 90% (by
volume) 𝐶𝑒𝑂2 systems and for water saturated air (no oxide)
System G(𝑵𝑶𝟑−) /
molecules 100 eV-1 Error (𝝈𝒔𝒍𝒐𝒑𝒆) Surface Area /
m2
No oxide 1.17 ± 0.06 N/A
1 g 𝐶𝑒𝑂2 1.96 ± 0.03 7.42
50% 𝐶𝑒𝑂2 (~6 g) 2.96 ± 0.09 44.5
90% 𝐶𝑒𝑂2 (~12 g) 4.54 ± 0.72 89.0
Table 8-7: Calculated G(𝑁𝑂3−) values for the 𝐶𝑒𝑂2 containing systems and for water
saturated air (no oxide)
0.0
50.0
100.0
150.0
200.0
250.0
300.0
350.0
400.0
450.0
0.0 20.0 40.0 60.0 80.0 100.0 120.0
Nit
rate
yie
ld /
(x1
01
6)
mo
lec.
Dose to air / (x1016) 100 eV
No Oxide
1 g
50% (~6 g)
90% (~12 g)
Increasing oxide
surface area

Chapter 8 Air Radiolysis Results and Discussion 7131060
203
It is clear from this table that the yield of nitrate is affected by the presence of 𝐶𝑒𝑂2 in the
system. The yield rises with increasing quantity of oxide, however, the rate of increase, does
not correspond to the increase in volume or surface area. In the systems containing 50% (by
volume) 𝐶𝑒𝑂2, there is a six fold increase in mass and surface area compared to samples
containing 1 g 𝐶𝑒𝑂2, yet the yield of nitrate only increases by 50%; this trend is seen in
systems with 50% and 90% (by volume) 𝐶𝑒𝑂2 where the mass and surface area are doubled
but the nitrate yield only increases by 50%. This trend will be discussed later in the chapter.
8.3.2 Discussion
An interesting feature of Figure 8.7 is that none of the trend lines for the yield of nitrate
appear to go through zero. At low absorbed doses (< 1x10¹⁹ eV), there is an initial off-set
between the yield of nitrate and the mass of oxide present. This is shown more clearly in
Figure 8.8:
Figure 8.8: Nitrate production as a function of absorbed dose for 1 g, 50% and 90% (by volume) 𝐶𝑒𝑂2 systems and for water saturated air (no oxide) up to an absorbed dose of
2.0x10¹⁹ eV
0.0
10.0
20.0
30.0
40.0
50.0
60.0
70.0
80.0
90.0
100.0
0.0 2.0 4.0 6.0 8.0 10.0 12.0 14.0 16.0 18.0 20.0
Nit
rate
yie
ld /
(x1
01
6)
mo
lec.
Dose to air / (x1016) 100 eV
No Oxide
1 g
50% (~6 g)
90% (~12 g)

Chapter 8 Air Radiolysis Results and Discussion 7131060
204
Extrapolation of the trend lines to zero absorbed dose generates the following nitrate yields
(Table 8-8):
System Inferred Quantity of Nitrate at zero absorbed dose /
µmol
No oxide 0.17 ± 0.04
1 g 𝐶𝑒𝑂2 0.14 ± 0.01
50% 𝐶𝑒𝑂2 (~6 g) 0.50 ± 0.06
90% 𝐶𝑒𝑂2 (~12 g) 0.35 ± 0.23
Table 8-8: Initial yield of nitrate pre-irradiation
It is evident from the above data that there appears to be significantly more nitrate present
in the higher loading systems than in the 1 g and the water saturated air system. This initial
yield could be due to a fast reaction of some description that leads to the oxide surface
becoming saturated with nitrate or another species. Once the surface is covered with a layer
of nitrate, the rate of the reaction decreases and leads to the yields calculated in Table 8-8.
Another explanation is the presence of a contaminant, either in the oxide powder or the
𝑁𝑎𝑂𝐻 solution used in the analysis of samples.
Cerium and zirconium dioxide both have fluorite crystal structures which are built around a
face centred cube unit cell (Figure 8.9i) with 𝐶𝑒4+/𝑍𝑟4+ located at the octahedrally
coordinated lattice points and 𝑂2− located at the tetragonal interstitials.

Chapter 8 Air Radiolysis Results and Discussion 7131060
205
i) ii)
Figure 8.9: i) Face-centred cubic crystal structure unit cell7, and ii) atomic structure of each face in the unit cell [104]
The unit cell contains four atoms with each face having one atom. From the lattice
parameter, the area of each surface atom can be determined (Figure 8.9ii). This allows for
the determination of the total number of surface atoms in the solid which can act as
adsorption sites for gas phase molecules. The lattice parameter of 𝐶𝑒𝑂2 is 5.4 Å [105] and
the lattice parameter of 𝑍𝑟𝑂2 is 5.27 Å [106]. Using this lattice parameter, the cross-
sectional area of each atom is 1.14x10⁻¹⁹ m2. Assuming one gas phase molecule can adsorb
to each surface atom, the surface coverage of one monolayer will be 8.78x10¹⁸ molecules
m-2. This value is reasonable as the corresponding value for 𝑇𝑖𝑂2 is 5.2x10¹⁸ molecules m-2
[107].
As the surface area of each oxide is known, the number of molecules that can adsorb to the
surface and form one monolayer will be approximately 1.61x10¹⁹ molecules g-1 for 𝐶𝑒𝑂2 and
5.0x10¹⁸ molecules g-1 for 𝑍𝑟𝑂2. If the gas phase molecule in question requires two surface
atoms to adsorb to the surface (bridging mode), the calculated number of adsorbed
molecules will be reduced by a factor of two.
7 Tetragonal interstitials not included for clarity

Chapter 8 Air Radiolysis Results and Discussion 7131060
206
From Figure 8.8 and Table 8-8, it is clear that the initial yield of nitrate in the 50% (by
volume) system is 0.5 µmol. This is equal to 3.0x10¹⁷ molecules, which is two orders of
magnitude below the calculated value for the number of molecules needed to form one
monolayer on 𝐶𝑒𝑂2, assuming one nitrate molecule can adsorb to one surface atom.
Therefore, allowing for differences in the lattice parameter and the number of surface sites
needed for a nitrate molecule to adsorb to, the off-set seen in Figure 8.8 is not due to
surface saturation.
An alternative explanation is that a quantity of nitrate is already adsorbed onto the 𝐶𝑒𝑂2
surface before experiments begin. As explained in Section 3.4.3, the oxide powders are
regenerated after analysis by washing with water and baking for several hours. It is possible
that these conditions do not fully remove adsorbed nitrate from the surface before further
experiments are undertaken. DRIFT spectra of the regenerated oxides were shown in
Chapter Six, the spectra of both 𝐶𝑒𝑂2 and 𝑍𝑟𝑂2 highlighted the presence of 𝑁𝑂𝑥 moieties
on the oxide surface which could potentially oxidise and enhance the yield of nitrate. This
will be discussed in more detail in the following section.
8.3.3 Comparison of 𝒁𝒓𝑶𝟐 Data
Figure 8.10 and Table 8-9 highlights the corresponding compiled data for 𝑍𝑟𝑂2.

Chapter 8 Air Radiolysis Results and Discussion 7131060
207
Figure 8.10: Nitrate production as a function of absorbed dose for 1 g, 50% and 90% (by volume) 𝑍𝑟𝑂2 systems and for water saturated air (no oxide)
System G(𝑵𝑶𝟑−) /
molecules 100 eV-1 Error (𝝈𝒔𝒍𝒐𝒑𝒆) Surface Area /
m2
No oxide 1.17 ± 0.06 N/A
1 g 𝑍𝑟𝑂2 2.10 ± 0.04 2.24
50% 𝑍𝑟𝑂2 (~11 g) (green data)
3.55 ± 0.11 24.6
50% 𝑍𝑟𝑂2 (2) (~11 g) (orange data)
4.77 ± 1.30 24.6
90% 𝑍𝑟𝑂2 (~20 g) (manipulated)
19.78 ± 3.57 44.8
Table 8-9: Calculated G(𝑁𝑂3−) values for the system containing 𝑍𝑟𝑂2 and for water
saturated air (no oxide)
As seen with the 𝐶𝑒𝑂2 data, the production of nitrate increases with increasing mass of
𝑍𝑟𝑂2. For qualitative interpretation, the increase in scatter at higher loadings of oxide is a
concern and therefore only limited conclusions can be drawn from the data set given in
Table 8-9.
0.0
20.0
40.0
60.0
80.0
100.0
120.0
140.0
0.0 10.0 20.0 30.0 40.0 50.0 60.0 70.0 80.0 90.0
Nit
rate
yie
ld /
(x1
01
6)
mo
lec.
Dose to air / (x1016) 100 eV
No Oxide1 g50% (~11 g)50% (2) (~11 g)90% (~20 g)

Chapter 8 Air Radiolysis Results and Discussion 7131060
208
8.4 Explanation of Scatter in 50% and 90% (by volume) 𝒁𝒓𝑶𝟐 Results
The concentration of nitrate is determined by the integrated peak area of the ion
chromatogram signal relative to the calibration plot. Ascertaining the true peak area for the
nitrate signal for the samples containing 50 and 90% (by volume) of 𝑍𝑟𝑂2 proved
challenging. Figure 8.11 shows typical chromatograms measured with post irradiated
analysis of samples containing various loadings of 𝑍𝑟𝑂2:

Chapter 8 Air Radiolysis Results and Discussion 7131060
209
i)
ii)
iii)
Figure 8.11: Three ion chromatograms of samples containing: i) 1 g, ii) 50% and iii) 90% 𝑍𝑟𝑂2 (by volume) illustrating the emergence of a second signal at 6.6 min
0.0
10.0
20.0
30.0
40.0
50.0
60.0
70.0
3 4 5 6 7 8 9
Co
nd
uct
ivit
y /
µS
Retention time / min
Nitrate
-1.0
1.0
3.0
5.0
7.0
9.0
11.0
13.0
3 4 5 6 7 8 9
Co
nd
uct
ivit
y /
µS
Retention time / min
Nitrate
-2.0
3.0
8.0
13.0
18.0
23.0
28.0
3 4 5 6 7 8 9
Co
nd
uct
ivit
y /
µS
Retention time / min
Nitrate
1 g
50%
90%

Chapter 8 Air Radiolysis Results and Discussion 7131060
210
In the chromatograms shown in Figure 8.11, the signal representing nitrate has been
labelled. It has a retention time of approximately 7 min. The four signals present in the
chromatograms that have retention less than 6 min have been assigned and tabulated in
Table 8-10.
Anion Retention Time / min
Carbonate (𝐶𝑂32−) 3.55
Chloride (𝐶𝑙−) 4.45
Bicarbonate (𝐻𝐶𝑂3−) 5.10
Sulphate (𝑆𝑂42−) 5.95
Table 8-10: Anions and corresponding retention times (in minutes) present in deionised water
These anions are present in the deionised water used to prepare the 5 mM 𝑁𝑎𝑂𝐻 solution.
Due to the basic nature of the solution, carbon dioxide (𝐶𝑂2) from the atmosphere dissolves
in the solution and hydrolyses to form both carbonate and bicarbonate anions. These two
anions are indistinguishable using the current instrument configuration, therefore the
signals with retention times of 3.55 and 5.10 min can be labelled as carbonate or
bicarbonate. The concentration of these anions does not increase with absorbed dose in the
system, therefore they are not a product of radiolysis. The chloride signal does increase,
however, with increasing mass of oxide. Therefore it is likely that chloride is present as a
contaminant counter ion in the oxide lattice and will not significantly affect the chemistry of
the system.
In the chromatogram shown in Figure 8.11i, the signal produced by nitrate has an
asymmetric non-Gaussian profile. The asymmetry could be due to the response of the

Chapter 8 Air Radiolysis Results and Discussion 7131060
211
detector or interference from another signal. Figure 8.11ii shows the emergence of a
second signal at 6.6 min. The profile of the nitrate signal is now more symmetrical, however,
the second signal appears as a ‘shoulder’ on the nitrate peak. In the final chromatogram
(Figure 8.11iii), the second signal has a much larger concentration and has started to split
from the nitrate signal, however, the two signals are not fully resolved and still overlap. The
close proximity of the two peaks makes integration of a single peak difficult and
assumptions of true peak profiles will lead to errors in the subsequent nitrate yield
calculation. Both of the signals discussed here, with retention between 6.5 and 7 min do not
appear in unirradiated blanks, therefore both anions are formed from radiolytic processes.
The second 𝑍𝑟𝑂2 data set plotted in Figure 8.5 (orange data points) all had chromatogram
profiles similar to that shown in Figure 8.11ii. The integrated peak area used in the
subsequent nitrate calculation was the sum of the nitrate signal and the shoulder. The
instrument software is unable to differentiate the presence of two signals. The consequence
is an increased area which leads to overestimation of the nitrate concentration in the
solution and the radiolytic yield of nitrate formation.
It is of importance to separate and identify this second signal to ensure that a true nitrate
yield can be calculated. Several inorganic anions such as phosphate (𝑃𝑂43−) and simple
organic anions based around carbon, nitrogen and oxygen moieties including nitrite (𝑁𝑂2−)
and cyanate (𝐶𝑁𝑂−) have been analysed to determine the identity of this second signal.
After intensive investigation, the second signal was identified as oxalate (𝐶2𝑂42−). Figure
8.12 shows the ion chromatogram peak profile of 50 μM oxalic acid (𝐻2𝐶2𝑂4), 0.1 mM
sodium nitrate and a mixed solution of both compounds.

Chapter 8 Air Radiolysis Results and Discussion 7131060
212
Figure 8.12: Ion chromatogram of 50 μM oxalic acid, 0.1 mM sodium nitrate and a mixed solution of both
The signal profile of the sample containing both oxalate and nitrate anions is identical to the
signal profile seen in Figure 8.11iii. It is clear from this figure that, with the current
instrument configuration, the retention of oxalate and nitrate are very similar and lead to
interference between the two signals.
To separate these anions, several of the instrument conditions were changed, including flow
rate, column temperature and eluent concentration. Altering the flow rate and column
temperature led to longer elution times, however, the peaks were still poorly separated.
Lowering the eluent concentration was found to have the desired effect of separating the
oxalate and nitrate peaks whilst increasing the elution time of both. Figure 8.13 illustrates
the chromatogram of the mixed solution containing both compounds seen in Figure 8.12,
however, the 𝐾𝑂𝐻 eluent concentration has been lowered from 23 mM to 14 mM.
0.0
5.0
10.0
15.0
20.0
25.0
30.0
5.5 5.7 5.9 6.1 6.3 6.5 6.7 6.9 7.1 7.3 7.5
Co
nd
uct
ivit
y /
µS
Retention time / min
0.1 mM NaNO3
0.05 mM H2C2O4
0.1 mM NaNO3 / 0.05 mM H2C2O4

Chapter 8 Air Radiolysis Results and Discussion 7131060
213
Figure 8.13: Chromatogram of 0.1 mM 𝑁𝑎𝑁𝑂3 and 50 μM oxalic acid mixed solution using eluent concentration of 14 mM 𝐾𝑂𝐻
The nitrate anion now elutes at approximately 8.9 min and oxalate elutes at 11.5 min. If the
eluent concentration is decreased below 14 mM then the signal from sulphate starts to
interfere with nitrate. The signal from sulphate can be seen in Figure 8.13 at a retention
time of 7.95 min.
0.0
5.0
10.0
15.0
20.0
25.0
6 7 8 9 10 11 12 13 14
Co
nd
uct
ivit
y /
µS
Retention Time / min
0.1 mM NaNO3 / 0.05 mM H2C2O4
Nitrate
Oxalate
Sulphate

Chapter 8 Air Radiolysis Results and Discussion 7131060
214
8.5 Refinement of Experimental Data in the Presence of an Oxide
Surface
The following section details new nitrate production data that has been collected after the
identification of the oxalate interference had been resolved.
Figure 8.14 and Table 8-11 detail the refined data for the system containing 1 g of oxide:
Figure 8.14: Nitrate production as a function of dose for samples containing 1 g of oxide powder and for water saturated air (no oxide)
System G(𝑵𝑶𝟑−) /
molecules 100 eV-1 Error (𝝈𝒔𝒍𝒐𝒑𝒆)
No oxide 1.17 ± 0.06
1 g 𝐶𝑒𝑂2 2.07 ± 0.07
1 g 𝑍𝑟𝑂2 1.48 ± 0.04
Table 8-11: Calculated G(𝑁𝑂3−) values and standard deviation of the gradient for systems
with 1 g oxide and water saturated air (no oxide)
Figure 8.14 illustrates that the presence of the oxide still has an effect on the formation of
nitrate in the radiolysis of air. The yield of nitrate in the system containing 𝐶𝑒𝑂2 is almost
double the yield from radiolysis of air alone, whilst the yield in the 𝑍𝑟𝑂2 system is 25%
greater than in humid air.
0.0
50.0
100.0
150.0
200.0
250.0
300.0
0.0 50.0 100.0 150.0 200.0
Nit
rate
pro
du
ctio
n /
(x1
01
6)
mo
lec.
Dose to air / (x1016) 100 eV
No OxideCeO2ZrO2

Chapter 8 Air Radiolysis Results and Discussion 7131060
215
Figure 8.15 and Table 8-12 outline the results of nitrate formation yields for the systems
containing 50% oxide (by volume). The masses and surface areas are the same as outlined in
Table 8-3.
Figure 8.15: Nitrate production as a function of dose for samples containing 50% (by volume) 𝐶𝑒𝑂2 and 𝑍𝑟𝑂2 and from water saturated air (no oxide)
System G(𝑵𝑶𝟑−) /
molecules 100 eV-1
Error (𝝈𝒔𝒍𝒐𝒑𝒆)
No oxide 1.17 ± 0.06
50% 𝐶𝑒𝑂2 (~6 g) 2.48 ± 0.02
50% 𝑍𝑟𝑂2 (~11 g) 2.13 ± 0.11
Table 8-12: Calculated G(𝑁𝑂3−) values and standard deviation of the gradient for systems
with 50% oxide (by volume) and water saturated air (no oxide)
It is clear from Table 8-12 that the yields of nitrate in the presence of an oxide surface are
greater than when no oxide is present. Now that the interference from oxalate has been
removed, the nitrate yields are considerably reduced from the original apparent values
shown in Table 8-4. This reduction is greater in 𝑍𝑟𝑂2 systems, with the yield decreasing by
40% compared to less than 20% for samples containing 𝐶𝑒𝑂2 from the original value,
0.0
50.0
100.0
150.0
200.0
250.0
0.0 20.0 40.0 60.0 80.0 100.0
Nit
rate
pro
du
ctio
n /
(x1
01
6)
mo
lec.
Dose to air / (x1016) 100 eV
No Oxide
CeO2
ZrO2

Chapter 8 Air Radiolysis Results and Discussion 7131060
216
suggesting that the interference from oxalate was far greater in 𝑍𝑟𝑂2 containing samples
than in 𝐶𝑒𝑂2 samples.
Figure 8.16 and Table 8-13 are the new refined data sets for systems containing 90% (by
volume) of oxide. The respective masses and surface areas are identical to values outlined in
Table 8-5.
Figure 8.16: Nitrate production as a function of dose for samples containing 90% (by volume) 𝐶𝑒𝑂2 and 𝑍𝑟𝑂2 and from water saturated air (no oxide)
System G(𝑵𝑶𝟑−) /
molecules 100 eV-1
Error (𝝈𝒔𝒍𝒐𝒑𝒆)
No oxide 1.17 ± 0.06
90% 𝐶𝑒𝑂2 (~12 g) 3.19 ± 0.09
90% 𝑍𝑟𝑂2 (~20 g) 6.50 ± 0.19
Table 8-13: Calculated G(𝑁𝑂3−) values and standard deviation of the gradient for systems
with 90% oxide (by volume) and water saturated air (no oxide)
When the oxide volume is significantly larger than the volume of the gas phase, the yield of
nitrate produced is vastly increased. The G(𝑁𝑂3−) values calculated are greater than the
0.0
50.0
100.0
150.0
200.0
250.0
300.0
350.0
400.0
0.0 20.0 40.0 60.0 80.0 100.0 120.0
Nit
rate
pro
du
ctio
n /
(x1
01
6)
mo
lec.
Dose to air / (x1016) 100 eV
No Oxide
CeO2
ZrO2

Chapter 8 Air Radiolysis Results and Discussion 7131060
217
values calculated for the 50% oxide (by volume) system. In the 90% 𝑍𝑟𝑂2 system, the nitrate
yield is six times greater than that measured for air radiolysis and is greater than the yield
calculated for the corresponding 𝐶𝑒𝑂2 system.
8.5.1 Compiled Data
To illustrate the yield of nitrate produced as a function of absorbed dose for the differing
oxide quantities present in the samples, Figure 8.17 is the compiled data set for samples
containing 𝐶𝑒𝑂2 and water saturated air. Table 8-14 lists the calculated G(𝑁𝑂3−) yields and
the standard deviation of each set of data points.
Figure 8.17: Nitrate production as a function of absorbed dose for 1 g, 50% and 90% (by volume) 𝐶𝑒𝑂2 systems and for water saturated air (no oxide)
0.0
50.0
100.0
150.0
200.0
250.0
300.0
350.0
400.0
0.0 20.0 40.0 60.0 80.0 100.0 120.0
Nit
rate
yie
ld /
(x1
01
6)
mo
lec.
Dose to Air / (x1016) 100 eV
No Oxide
1 g
50% (~6 g)
90% (~12 g)
Increasing oxide
surface area

Chapter 8 Air Radiolysis Results and Discussion 7131060
218
System G(𝑵𝑶𝟑−) /
molecules 100 eV-1 Error
(𝝈𝒔𝒍𝒐𝒑𝒆) Surface Area /
m2
No oxide 1.17 ± 0.06 N/A
1 g 𝐶𝑒𝑂2 2.07 ± 0.07 7.42
50% 𝐶𝑒𝑂2 (~6 g) 2.48 ± 0.02 44.5
90% 𝐶𝑒𝑂2 (~12 g) 3.19 ± 0.09 89.0
Table 8-14: Calculated G(𝑁𝑂3−) values and standard deviation of the gradient for systems
with 1 g, 50% and 90% (by volume) 𝐶𝑒𝑂2 and water saturated air (no oxide)
It is clear from Figure 8.17 that the initial ‘off-step’ in 𝑁𝑂3− concentration seen in Figure 8.8
has now been removed as a result of the oxalate interference being separated. It is also
evident that the presence of an oxide surface increases the yield of 𝑁𝑂3−. The largest
difference is seen with 1 g 𝐶𝑒𝑂2 in comparison with saturated air results where the yield of
𝑁𝑂3− has almost doubled with the oxide present. This increase in nitrate production is due
to the presence of the oxide, however, it is not simply a surface area effect as this increase
in 𝑁𝑂3− yield is not linear with the higher loading of oxide data sets.
Figure 8.18 illustrates the compiled data for samples containing 𝑍𝑟𝑂2 and water saturated
air. The calculated G(𝑁𝑂3−) yields are detailed in Table 8-15.
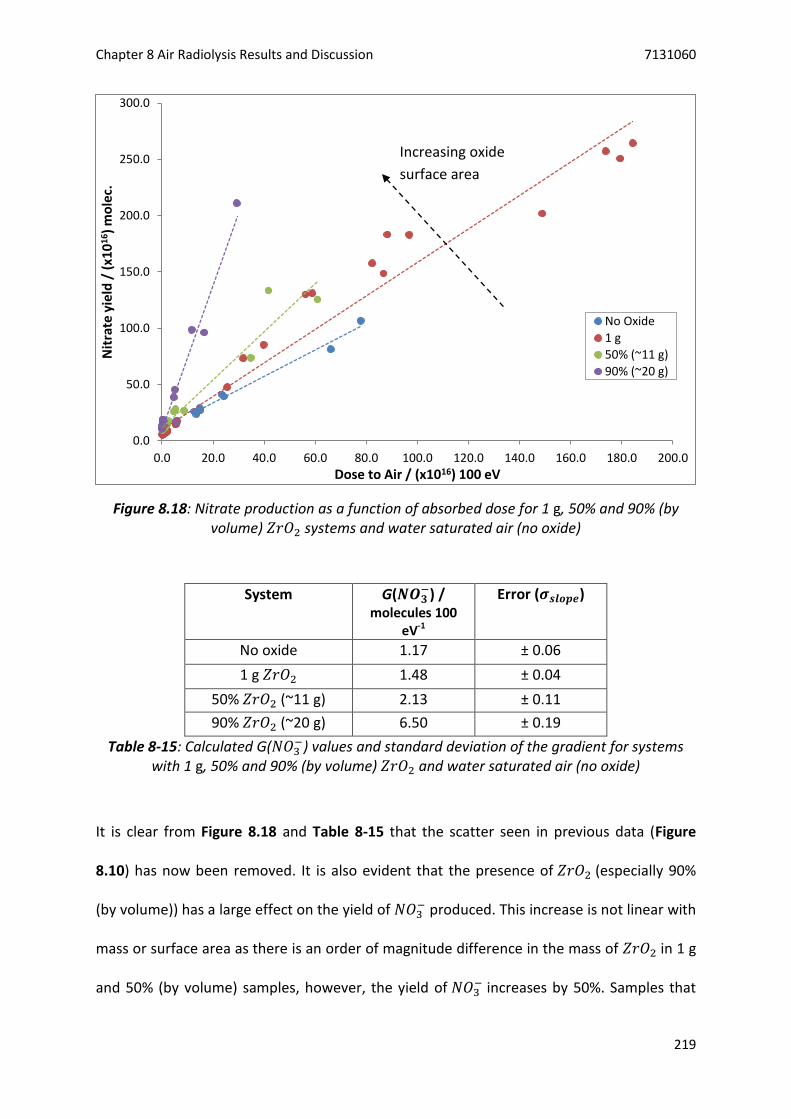
Chapter 8 Air Radiolysis Results and Discussion 7131060
219
Figure 8.18: Nitrate production as a function of absorbed dose for 1 g, 50% and 90% (by volume) 𝑍𝑟𝑂2 systems and water saturated air (no oxide)
System G(𝑵𝑶𝟑−) /
molecules 100 eV-1
Error (𝝈𝒔𝒍𝒐𝒑𝒆)
No oxide 1.17 ± 0.06
1 g 𝑍𝑟𝑂2 1.48 ± 0.04
50% 𝑍𝑟𝑂2 (~11 g) 2.13 ± 0.11
90% 𝑍𝑟𝑂2 (~20 g) 6.50 ± 0.19
Table 8-15: Calculated G(𝑁𝑂3−) values and standard deviation of the gradient for systems
with 1 g, 50% and 90% (by volume) 𝑍𝑟𝑂2 and water saturated air (no oxide)
It is clear from Figure 8.18 and Table 8-15 that the scatter seen in previous data (Figure
8.10) has now been removed. It is also evident that the presence of 𝑍𝑟𝑂2 (especially 90%
(by volume)) has a large effect on the yield of 𝑁𝑂3− produced. This increase is not linear with
mass or surface area as there is an order of magnitude difference in the mass of 𝑍𝑟𝑂2 in 1 g
and 50% (by volume) samples, however, the yield of 𝑁𝑂3− increases by 50%. Samples that
0.0
50.0
100.0
150.0
200.0
250.0
300.0
0.0 20.0 40.0 60.0 80.0 100.0 120.0 140.0 160.0 180.0 200.0
Nit
rate
yie
ld /
(x1
01
6)
mo
lec.
Dose to Air / (x1016) 100 eV
No Oxide
1 g
50% (~11 g)
90% (~20 g)
Increasing oxide
surface area
Chapter 8 Air Radiolysis Results and Discussion 7131060
220
contain 1 g and 50% (by volume) of 𝑍𝑟𝑂2 have a lower yield of 𝑁𝑂3− than the corresponding
𝐶𝑒𝑂2 samples.
8.5.2 Discussion
Section 2.7 outlined the mechanism for radiolysis of dry air and water saturated air. These
systems are well understood, with the stable products of dry air radiolysis being ozone (𝑂3),
nitrous oxide (𝑁2𝑂) and nitrogen dioxide (𝑁𝑂2) [108]. In the presence of water, the major
stable product is nitric acid (𝐻𝑁𝑂3). Nitric acid is formed from 𝑁𝑂2 reacting with water
radiolysis products such as hydroxyl radicals (Reaction 8.2) and oxygen atoms (Reaction 8.3)
as well as with water itself (Reaction 8.4) [109, 110].
𝑁𝑂2 + 𝐻𝑂. → 𝐻𝑁𝑂3 Reaction 8.2
𝑁𝑂2 + 𝑂 + 𝑀 → 𝑁𝑂3. + 𝑀 Reaction 8.3
2𝑁𝑂2 + 𝐻2𝑂 → 𝐻𝑁𝑂2 + 𝐻𝑁𝑂3 Reaction 8.4
In Reaction 8.4, nitrous acid (𝐻𝑁𝑂2) is also produced which will be discussed later. The
nitrate radical formed in Reaction 8.3 can react with 𝑁𝑂2 to form dinitrogen pentoxide
(𝑁2𝑂5) (Reaction 8.5) [111] which can further react to form nitric acid (Reaction 8.6):
𝑁𝑂3. + 𝑁𝑂2 → 𝑁2𝑂5 Reaction 8.5
𝑁2𝑂5 + 𝐻2𝑂 → 2𝐻𝑁𝑂3 Reaction 8.6
The mechanism outlined above leads to the nitrate yield of 1.17 molecules 100 eV-1 of
absorbed dose seen in the saturated air samples. In the presence of an oxide powder
(independent of quantity) this yield is much higher and is closer to the limiting yield of G(𝑁)
[42] which has a value of approximately 6 atoms 100 eV-1. The lower yield in saturated

Chapter 8 Air Radiolysis Results and Discussion 7131060
221
laboratory air radiolysis is due to the fast reaction of nitrogen atoms with 𝑁𝑂2 and 𝑁𝑂
(Reactions 8.7 and 8.8), which lead to the reformation of 𝑁2:
𝑁 + 𝑁𝑂2 → 2𝑁𝑂 Reaction 8.7
𝑁 + 𝑁𝑂 → 𝑂 + 𝑁2 Reaction 8.8
These reactions have rate constants of 5.9x10⁻¹² cm3 molecule-1 s-1 and 2.2x10⁻¹¹ cm3
molecule-1 s-1 respectively.
When an oxide is present, Reaction 8.7 is inhibited, allowing higher yields of nitrate to be
produced. The most plausible explanation is that 𝑁𝑂2 is adsorbed to the oxide surface and
undergoes reactions including Reactions 8.2-8.4 to produce nitric acid.
The oxidation of 𝑁𝑂2 on an oxide surface has been investigated by Rodriguez et al. [112]
who investigated the reaction of 𝑁𝑂2 with stoichiometric 𝐶𝑒𝑂2 and with partially reduced
ceria ( 𝐶𝑒𝑂2−𝑥 ) from an environmental catalysis perspective. At room temperature,
adsorbed nitrate was the only major product found on pure 𝐶𝑒𝑂2 with a mixture of 𝑁, 𝑁𝑂
and 𝑁𝑂3 co-existing on the surface of partially reduced ceria.
The phenomenon is also known to occur with other oxide materials. Nanayakkara et al. have
studied the reactivity of several atmospheric gases with 𝑇𝑖𝑂2 and found that 96% of 𝑁𝑂2
reacts with surface hydroxyl groups to form bridged, mono and bidentate nitrate [113]. The
overall reaction is given in Reaction 8.9 and the bridging modes are illustrated in Figure
8.19. This is confirmed in other work by Hadjiivanov et al. [114].
3𝑁𝑂2 (𝑔) + 2𝑂𝐻− → 2𝑁𝑂3 (𝑎𝑑𝑠)− + 𝑁𝑂(𝑔) + 𝐻2𝑂(𝑎𝑑𝑠) Reaction 8.9

Chapter 8 Air Radiolysis Results and Discussion 7131060
222
Figure 8.19: Pictorial representation of 𝑁𝑂3− bonding modes with metal centres depicting
(l-r) monodentate, bidentate and bridging adsorption modes
Haubrich et al. have proposed an alternative mechanism for 𝑁𝑂3− formation on a rutile
(𝑇𝑖𝑂2) surface, which involves the disproportionation of adsorbed 𝑁𝑂2 (Reaction 8.10)
[115]:
2𝑁𝑂2 (𝑎𝑑𝑠) → 𝑁𝑂3 (𝑎𝑑𝑠)− + 𝑁𝑂(𝑔𝑎𝑠) Reaction 8.10
The 𝑁𝑂 species will initially be adsorbed to the surface but will quickly desorb to the gas
phase due to the weak adsorption [116].
Chromia (𝐶𝑟2𝑂3) is another oxide where 𝑁𝑂2 adsorption leads to the formation of 𝑁𝑂3− on
the surface [117].
All of these systems mentioned above used ultra-high vacuum (UHV) conditions and studied
the adsorption and oxidation of 𝑁𝑂2 using infra-red spectroscopy. Radiation, in any form
was not utilised as part of the research.
Harteck and Dondes studied the decomposition of 𝑁𝑂 and 𝑁𝑂2 using fission fragments
from uranium-235 [43]. They postulated that 𝑁2, 𝑁2𝑂 and 𝑂2 were the stable species,
however, analysis was carried out by pressure measurements alone. Nitrogen dioxide
decomposition was an order of magnitude slower than 𝑁𝑂 decomposition and they did not
see any surface effects. The main reason for this negative result is the small quantity of
oxide powder utilised in the research (5 mg).

Chapter 8 Air Radiolysis Results and Discussion 7131060
223
Another possible explanation for the increased yields of 𝑁𝑂3− in the presence of an oxide
powder is that of energy transfer from the oxide to the gas phase. This phenomenon was
discussed in detail in Section 2.3 with respect to water radiolysis on an oxide surface. One
explanation for the enhancement of 𝐻2 yield from adsorbed water radiolysis was due to the
similarities in the band gap of certain metal oxides and the bond dissociation energy of
water (5.15 eV) [25]. The band gaps of 𝑍𝑟𝑂2 and 𝐶𝑒𝑂2 are 5.0 eV [76] and 3.1-3.5 eV
[77, 118], respectively. The ionisation potentials of 𝑁2 and 𝑂2 are 15.58 and 12.07 eV,
respectively [85]. The bond dissociation energies of 𝑁 ≡ 𝑁 and 𝑂 = 𝑂 are 9.79 and 5.15 eV,
respectively [27]. Therefore there is not enough ‘excitation energy’ available to be
transferred from either metal oxide utilised in this research to directly ionise or dissociate
𝑁2. It is also unlikely that 𝑁2 will adsorb to the oxide surface.
From the explanation outlined above, initial ionisation of 𝑁2 and 𝑂2 occurs in the gas phase.
The surface will only have an effect on subsequently formed species, which will be
molecular, radical or ionic in character.
In all of the experiments investigated in this chapter, nitrite (𝑁𝑂2−) is not present in any of
the post-irradiated chromatograms. Reaction 8.4 outlined the formation of nitrous acid
(𝐻𝑁𝑂2) in the reaction mechanism, however, this isn’t present in the final system. Work by
Saliba et al. have found that adsorbed nitrous acid undergoes decomposition on silica
surfaces [119], as shown in Reaction 8.11:
2𝐻𝑁𝑂2 (𝑎𝑑𝑠) → 𝑁𝑂 + 𝑁𝑂2 + 𝐻2𝑂(𝑎𝑑𝑠) Reaction 8.11
Nitrite can also be oxidised on the surface by 𝑂𝐻. to form nitric acid.
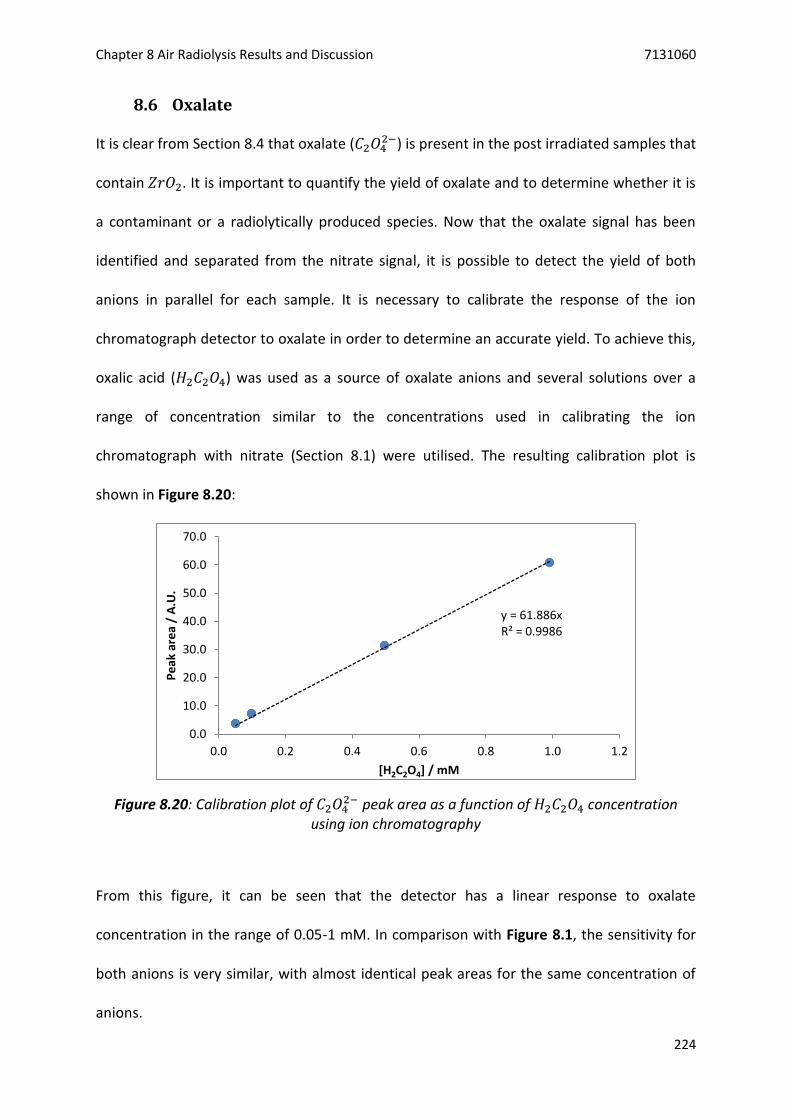
Chapter 8 Air Radiolysis Results and Discussion 7131060
224
8.6 Oxalate
It is clear from Section 8.4 that oxalate (𝐶2𝑂42−) is present in the post irradiated samples that
contain 𝑍𝑟𝑂2. It is important to quantify the yield of oxalate and to determine whether it is
a contaminant or a radiolytically produced species. Now that the oxalate signal has been
identified and separated from the nitrate signal, it is possible to detect the yield of both
anions in parallel for each sample. It is necessary to calibrate the response of the ion
chromatograph detector to oxalate in order to determine an accurate yield. To achieve this,
oxalic acid (𝐻2𝐶2𝑂4) was used as a source of oxalate anions and several solutions over a
range of concentration similar to the concentrations used in calibrating the ion
chromatograph with nitrate (Section 8.1) were utilised. The resulting calibration plot is
shown in Figure 8.20:
Figure 8.20: Calibration plot of 𝐶2𝑂42− peak area as a function of 𝐻2𝐶2𝑂4 concentration
using ion chromatography
From this figure, it can be seen that the detector has a linear response to oxalate
concentration in the range of 0.05-1 mM. In comparison with Figure 8.1, the sensitivity for
both anions is very similar, with almost identical peak areas for the same concentration of
anions.
y = 61.886x R² = 0.9986
0.0
10.0
20.0
30.0
40.0
50.0
60.0
70.0
0.0 0.2 0.4 0.6 0.8 1.0 1.2
Pe
ak a
rea
/ A
.U.
[H2C2O4] / mM

Chapter 8 Air Radiolysis Results and Discussion 7131060
225
Figure 8.21 is the compiled data set for oxalate yields in the system containing 𝐶𝑒𝑂2:
Figure 8.21: Plot of oxalate production as a function of absorbed dose for samples containing 1 g, 50% and 90% (by volume) of 𝐶𝑒𝑂2 and from water saturated air (no oxide)
From this plot, there appears to be a lot of scatter in the sample sets containing 50% and
90% 𝐶𝑒𝑂2 when compared to samples of water saturated air and 1 g 𝐶𝑒𝑂2. However, the
maximum yield of oxalate detected is 66.4 nmol in the system containing 90% 𝐶𝑒𝑂2; this
yield is an order of magnitude below the yield of nitrate for the corresponding system.
Therefore the scatter in Figure 8.21 is an effect of the detection limits of the ion
chromatograph. Samples without 𝐶𝑒𝑂2 appear to have the least scatter. The G-value for this
data set has been calculated as G(𝐶2𝑂42−) = 0.03 molecules 100 eV-1.
Figure 8.22 shows the calculated oxalate yields in samples containing 𝑍𝑟𝑂2 and pure air:
0.0
1.0
2.0
3.0
4.0
5.0
6.0
7.0
8.0
9.0
10.0
0.0 20.0 40.0 60.0 80.0 100.0 120.0 140.0
Oxa
late
yie
ld /
(x1
01
6)
mo
lec.
Dose to Air / (x1016) 100 eV
No Oxide
1 g
50% (~6 g)
90% (~12 g)

Chapter 8 Air Radiolysis Results and Discussion 7131060
226
Figure 8.22: Plot of oxalate production as a function of absorbed dose for samples containing 1 g, 50% and 90% (by volume) of 𝑍𝑟𝑂2 and from water saturated air (no oxide)
It is clear from comparing Figures 8.21 and 8.22 that the yield of oxalate is much higher in
samples containing 𝑍𝑟𝑂2 than in the corresponding 𝐶𝑒𝑂2 samples. The yield is up to five
times greater in 90% 𝑍𝑟𝑂2 (0.41 µmol) than in 90% 𝐶𝑒𝑂2 (66.4 nmol). This large yield of
oxalate led to the large scatter seen in 𝑍𝑟𝑂2 samples at low doses (Figure 8.10).
0.0
5.0
10.0
15.0
20.0
25.0
30.0
0.0 20.0 40.0 60.0 80.0 100.0 120.0 140.0 160.0 180.0 200.0
Oxa
late
yie
ld /
(x1
01
6)
mo
lec.
Dose to Air / (x1016) 100 eV
No Oxide
1 g
50% (~11 g)
90% (~20 g)

Chapter 8 Air Radiolysis Results and Discussion 7131060
227
8.6.1 Oxalate Discussion
It is of importance to understand the source of the oxalate, whether it is an impurity from
the oxide or from the gas phase. Once the source has been identified, the mechanism of its
formation can be discussed.
Both 𝑍𝑟𝑂2 and 𝐶𝑒𝑂2 are produced commercially by calcination of zirconium and cerium
containing compounds. One such compound is the oxalate. This is also true of 𝑃𝑢𝑂2, as
outlined in Chapter One. To determine whether oxalate is present in the starting oxide,
thermogravimetric analysis of cerium oxalate (𝐶𝑒2𝐼𝐼𝐼(𝐶2𝑂4)3. 𝑥𝐻2𝑂) was investigated to
determine the thermal stability of the oxalate group. Figure 8.23 shows the thermograms of
𝐶𝑒2𝐼𝐼𝐼(𝐶2𝑂4)3. 𝑥𝐻2𝑂 decomposed under both air and 𝑁2:
Figure 8.23: Thermogravimetric analysis of cerium oxalate under 𝑁2 (blue) and static air (red) atmospheres. Heating rate 2 °C min-1
This figure highlights that there are three distinct mass changing events as the oxalate is
heated. The first step occurs between 35-130 °C, with this initial step being due to the water
of crystallisation being driven off. This step occurs at the same temperature, independent of
45.0
50.0
55.0
60.0
65.0
70.0
75.0
80.0
85.0
90.0
95.0
100.0
0.0 100.0 200.0 300.0 400.0 500.0 600.0
Mas
s /
%
Temperature / oC
N2
Air
Step 1
Step 2
Step 3

Chapter 8 Air Radiolysis Results and Discussion 7131060
228
flow gas, thus showing that this dehydration step is thermally driven rather than reaction
with the gas. This mass difference is approximately 15% therefore the number of water
molecules bound to the compound can be calculated as 5.4. The second step occurs
between 130-180 °C in both atmospheres and represents a mass change of approximately
3%. Due to the nature of the mass change, this step is assumed to be further dehydration of
the solid with loss of strongly bound water. The final mass change event is dependent on
flow gas used. In an air flow, this step occurs at 220 °C and at 350 °C under an 𝑁2 flow. This
step corresponds to the decomposition of the oxalate group.
During the decomposition of cerium oxalate into cerium oxide, cerium is oxidised from 𝐶𝑒𝐼𝐼𝐼
to 𝐶𝑒𝐼𝑉; in an inert atmosphere there is nothing to oxidise the oxalate until it becomes
unstable and undergoes self-decomposition, whereas in oxidising atmospheres such as 𝑂2
or air, this oxidation occurs much quicker. This can be seen by the difference in the
temperature onset of the final step. The oxygen in the air starts to decompose the oxalate
130 °C below the temperature at which this starts to occur under 𝑁2. The steps outlined
above (dehydration followed by decomposition) have been investigated and confirmed by
other groups [120, 121]. The decomposition of cerium oxalate occurs in two distinct steps in
an air atmosphere, independent of heating rate employed [121, 122] suggesting that this
step is thermodynamically controlled. However, in a recent paper, De Almeida et al.
discovered under an argon flow, that an intermediate decomposition step occurred which
led to an oxy-carbonate intermediate with the chemical formula 𝐶𝑒2𝑂2𝐶𝑂3 [120]. This step
is not present however, in Figure 8.23 or at least not resolved.
After the heating program was completed, the sample decomposed in an air atmosphere
had 50% of the initial mass. Under 𝑁2, this value was 55.4%. The difference in final mass is
Chapter 8 Air Radiolysis Results and Discussion 7131060
229
due to the incomplete decomposition of the oxalate group and residual carbon in the
sample decomposed under 𝑁2.
In Section 3.4.3, the regeneration of the oxide powders between subsequent experiments
was outlined. The powders are baked at 400 °C for six hours under a static air atmosphere.
From Figure 8.23 it is clear that this temperature is sufficient to ensure complete
decomposition of any oxalate impurity. Therefore the source of the oxalate discovered in
the ion chromatograms is not an impurity from the solid.
The only other source of carbon during the experiments is carbon dioxide (𝐶𝑂2) in the air.
The DRIFT spectra in Chapter Six of the regenerated oxides (Figures 6.8 and 6.18) identified
the presence of 𝐶𝑂2 compounds adsorbed onto the surfaces of both oxide materials. These
figures only gave qualitative information, therefore the concentrations of 𝐶𝑂2 present in the
pre-irradiated samples is unknown, however, a maximum concentration can be calculated in
the gas phase. The concentration of 𝐶𝑂2 in the atmosphere is approximately 400 ppm. In
the 12 ml sample vials used in this experiment, that is equal to 0.11 mmol of 𝐶𝑂2. Assuming
that two 𝐶𝑂2 molecules will dimerise to form one oxalate molecule, the maximum
theoretical yield of oxalate is 54.5 µmol in pure air. Samples that contain 90% (by volume) of
oxide could generate a maximum yield of 47.0 µmol for 𝐶𝑒𝑂2 containing samples and 10.8
µmol for 𝑍𝑟𝑂2 containing samples. These maximum yields are far greater than the
measured yields of oxalate in Figures 8.21 and 8.22. The efficiency of the reaction assuming
simple dimerisation is 0.14% in the presence of 𝐶𝑒𝑂2 and 3.84% in the presence of 𝑍𝑟𝑂2.
These figures are based on the gas phase concentration of 𝐶𝑂2 and do not include any 𝐶𝑂2
adsorbed onto the oxide surface.

Chapter 8 Air Radiolysis Results and Discussion 7131060
230
Carbon dioxide is very radiation stable with less than 0.1% undergoing decomposition in gas
phase studies alone. Initially, it was postulated by Hirschfelder and Taylor that this was due
to the back reaction with ozone [123] (Reaction 8.12)
𝐶𝑂 + 𝑂3 → 𝐶𝑂2 + 𝑂2 Reaction 8.12
This reaction is exothermic, however, it has a rate coefficient of k ≤ 4x10-25 cm3 molecule-1
sec-1 at ambient temperature [124], therefore would be very slow. Work by Harteck and
Dondes [125] outlined the following reaction mechanism for 𝐶𝑂2 radiolysis:
Initial ionisation 𝐶𝑂2 ⇝ 𝐶𝑂 + 𝑂 Reaction 8.13
⇝ 𝐶 + 2𝑂 Reaction 8.14
Reaction 8.13 has a G-value of 8 molecule 100 eV-1 and is the more favoured primary
reaction of 𝐶𝑂2 irradiation. The reaction continues thus:
𝐶𝑂 + 𝐶 + 𝑀 → 𝐶2𝑂 + 𝑀 Reaction 8.15
𝐶2𝑂 + 𝐶𝑂 + 𝑀 → 𝐶3𝑂2 + 𝑀 Reaction 8.16
𝑂 + 𝑂2 + 𝑀 → 𝑂3 + 𝑀 Reaction 8.17
𝐶3𝑂2 + 𝑂 (or 𝑂3) → 𝐶2𝑂 + 𝐶𝑂2(+𝑂2) Reaction 8.18
𝐶𝑂 + 𝑂 + 𝑀 → 𝐶𝑂2 + 𝑀 Reaction 8.19
The 𝑂2 in Reaction 8.17 is formed by the recombination of oxygen atoms from Reaction
8.14. Dicarbon monoxide (𝐶2𝑂), acts as a catalyst in Reaction 8.19 before eventually
diffusing to the walls with carbon suboxide (𝐶3𝑂2), and forming polymerised products.
Chapter 8 Air Radiolysis Results and Discussion 7131060
231
As 𝐶𝑂2 is the only source of carbon in the experimental configuration, another mechanism
must be occurring to hinder the reformation of 𝐶𝑂2, as the yields of oxalate are greater than
from 0.1% 𝐶𝑂2 decomposition.
An explanation is given by Harteck and Dondes [125] where they found that a small quantity
of 𝑁𝑂2 prevented the reformation of 𝐶𝑂2 by reaction with radicals. As outlined in Section
8.5.1, 𝑁𝑂2 will be present in the system due to radiolysis of 𝑁2 and 𝑂2. The reactions of 𝑁𝑂2
in the system are shown below:
𝑂 + 𝑁𝑂2 → 𝑁𝑂 + 𝑂2 Reaction 8.20
𝐶 + 𝑁𝑂2 → 𝑁𝑂 + 𝐶𝑂 Reaction 8.21
2𝑁𝑂 + 𝑂2 → 2𝑁𝑂2 Reaction 8.22
Reaction with oxygen atoms (8.20) inhibits both Reactions 8.18 and 8.19, both of which lead
to the reformation of 𝐶𝑂2, and reaction with carbon atoms (8.21) leads to a lower yield of
𝐶2𝑂 which is the catalyst in Reaction 8.19. With 𝑁𝑂2 present, G(−𝐶𝑂2) = 8 molecules
100 eV-1.
The mechanism outlined above will be occurring in the saturated air experiments. The G-
value for oxalate formation in this system is G(𝐶2𝑂42−) = 0.03 molecules 100 eV-1 based on
dose absorbed by the air. It is clear from Figures 8.21 and 8.22 that the yield of oxalate in
samples with an oxide present are much greater, therefore a mechanism involving the
surface that inhibits the reformation of 𝐶𝑂2 must be occurring. It is postulated that 𝐶𝑂2
adsorbs onto the oxide prior to irradiation and then is reduced on the oxide surface during
irradiation forming 𝐶𝑂2−. If there are two reduced molecules in close proximity, these will
undergo dimerisation to form the oxalate (Reaction 8.23).

Chapter 8 Air Radiolysis Results and Discussion 7131060
232
2𝐶𝑂2− + 𝑀 → 𝐶2𝑂4
2− + 𝑀 Reaction 8.23
Carbon dioxide adsorption onto metal oxide surfaces has been investigated by
Baltrusaitis et al. for several nanoparticle surfaces [68]. They studied 𝐶𝑂2 adsorption to iron
(III) oxide (𝐹𝑒2𝑂3), aluminium oxide (𝐴𝑙2𝑂3) and titanium dioxide (𝑇𝑖𝑂2) in the presence and
absence of water vapour. They found that 𝐶𝑂2 readily reacts with surface hydroxyls to form
bicarbonate species (𝐻𝐶𝑂3−). Carbon dioxide will also react to form monodentate and
bidentate carbonate species (𝐶𝑂32−). Carboxylate (𝐶𝑂2
−) is also present on the surface of
𝑇𝑖𝑂2. All of these species were formed under dry conditions. When co-adsorbed water was
present, they found that the carbonate species became solvated and the surface hydroxyl
groups became protonated. This occurs when no radiation is present, therefore in the
presence of ionising radiation, reduction of 𝐶𝑂2 is likely to be increased, leading to a higher
concentration of 𝐶𝑂2− on the oxide surface and therefore a higher concentration of oxalate
formation.
8.7 Synthetic Air
In an effort to remove 𝐶𝑂2 from the system, a series of samples were out-gassed with
synthetic air. Synthetic air is produced by mixing 20% 𝑂2 with 80% 𝑁2, the impurities are
certified as < 1 vppm 𝐶𝑂2, < 2 vppm 𝐻2𝑂 and < 1 vppm 𝑁𝑂𝑥. This was achieved by inserting
a needle through the septa of the vial and flowing gas through the sample for several
minutes. Figure 8.24 highlights the nitrate yield results of pure synthetic air radiolysis
compared to laboratory air and water saturated lab air:

Chapter 8 Air Radiolysis Results and Discussion 7131060
233
Figure 8.24: Plot of nitrate production as a function of absorbed dose for synthetic air, laboratory air and water saturated laboratory air. Volume of air =11.9 - 12.0 cm3 at 35 °C
In theory, there should be no nitrate produced in the radiolysis of synthetic air, because as
previously discussed in Section 2.7, radiolysis of dry air, results in the steady state
concentrations of ozone (𝑂3), nitrous oxide (𝑁2𝑂) and nitrogen dioxide (𝑁𝑂2) [108]. Figure
8.24 clearly shows that nitrate is produced and in the same yields as normal lab air,
therefore it can be hypothesised that water is present in the system, either as water vapour
that hasn’t been fully removed or as silanol groups on the glass surface of the vials.
As seen in previous results, there is a large quantity of water present in the systems
containing an oxide powder as adsorbed water. Therefore, the yield of nitrate did not
change when samples containing an oxide were irradiated in a synthetic air atmosphere.
The oxalate yield in samples containing 𝐶𝑒𝑂2 that were irradiated in synthetic air did not
differ from the yields seen in Figure 8.21. This yield was very small in laboratory air,
therefore it is likely that a small quantity of 𝐶𝑂2 remains adsorbed to the oxide surface even
after out-gassing with synthetic air, which can be irradiated to form the oxalate species. It is
0.00
20.00
40.00
60.00
80.00
100.00
120.00
0.00 20.00 40.00 60.00 80.00 100.00 120.00 140.00
Nit
rate
pro
du
ctio
n /
(x1
01
6)
mo
lec.
Dose to air / (x1016) 100 eV
Lab. AirAir (H2O added)Synthetic air

Chapter 8 Air Radiolysis Results and Discussion 7131060
234
likely that the out gassing method used was not adequate enough to displace adsorbed
species on the oxide.
Samples containing 𝑍𝑟𝑂2 that were irradiated in synthetic air had a markedly reduced yield
of oxalate after subsequent analysis. The yields were similar to comparative samples of
𝐶𝑒𝑂2. The explanation of this is likely to be inadequate removal of adsorbed species.
8.8 Sintered 𝑪𝒆𝑶𝟐
In all previous experiments, the same batch of 𝐶𝑒𝑂2 and 𝑍𝑟𝑂2 has been used. These oxides
have a disparity in surface area of approximately three. To investigate the effect of surface
area on the radiolysis of air, a sample of 𝐶𝑒𝑂2 was sintered at 950 °C under static air for two
hours using a heating rate of 10 °C min-1. The following section outlines the sintered oxide
properties and subsequent experimental results.
8.8.1 Oxide Properties
Figure 8.25 represents the BET adsorption isotherm for the sintered oxide product. The
surface area was calculated as 2.20 m2 g-1. This is a decrease of 70% and is approximately
the same surface area as the 𝑍𝑟𝑂2 samples used in previous experiments.

Chapter 8 Air Radiolysis Results and Discussion 7131060
235
Figure 8.25: BET adsorption (solid trace) – desorption (dashed trace) isotherm of 𝐶𝑒𝑂2 sintered at 950 °C for 2 h
As seen in Figures 6.3 and 6.6, the adsorption-desorption isotherm for sintered 𝐶𝑒𝑂2 is of
type three [65]. The isotherm also has hysteresis, indicating that the oxide still has a porous
structure, however, the size of this loop has decreased indicating the loss of porosity. The
quantity of nitrogen adsorbed has reduced by 60% indicating the decrease in the BET
surface area.
After sintering, the bulk density has increased from 1.44 to 2.23 g cm-3. This is an increase of
approximately 55% and is to be expected as the porous structure becomes annealed at
higher temperatures. The increase in bulk density leads to increase masses of oxide needed
for 50% and 90% (by volume) samples. The mass of sintered 𝐶𝑒𝑂2 required is 13.5 g for 50%
volume samples and 24 g for 90% volume samples.
SEM and EDS data for sintered 𝐶𝑒𝑂2 are shown in Figure 8.26:
0.0
1.0
2.0
3.0
4.0
5.0
6.0
7.0
8.0
0 0.2 0.4 0.6 0.8 1
Qu
anti
ty a
dso
rbed
/ c
m3
g-1
Relative pressure / (P/Po)

Chapter 8 Air Radiolysis Results and Discussion 7131060
236
i)
ii)
Figure 8.26: i) Scanning electron micrograph and ii) EDS spectra for sintered 𝐶𝑒𝑂2
From the SEM image, it is clear that there is no dominant crystal morphology, this was
evident in the un-sintered 𝐶𝑒𝑂2 (Figure 6.1). The average particle size has not changed
drastically in Figure 8.26i, with an average area of 5 µm2. The EDS data shows that there is
no change in the elemental make-up of the oxide, with cerium and oxygen, the major
constituents, and silicon and carbon present as an impurity and from the carbon stub
respectively.

Chapter 8 Air Radiolysis Results and Discussion 7131060
237
8.8.2 Nitrate Production over Sintered 𝑪𝒆𝑶𝟐
Figure 8.27 and Table 8-16 outlines the compiled results for nitrate yield as a function of
absorbed dose for the sintered 𝐶𝑒𝑂2 system.
Figure 8.27: Nitrate production as a function of absorbed dose for samples containing 1 g, 50% and 90% (by volume) sintered 𝐶𝑒𝑂2 and from water saturated air (no oxide)
System G(𝑵𝑶𝟑−) /
molecules 100 eV-1 Error (𝝈𝒔𝒍𝒐𝒑𝒆)
No oxide 1.17 ± 0.06
1 g sintered 𝐶𝑒𝑂2 1.21 ± 0.07
50% sintered 𝐶𝑒𝑂2
(~13.5 g)
2.35 ± 0.17
90% sintered 𝐶𝑒𝑂2
(~24 g)
2.59 ± 0.22
Table 8-16: Calculated G(𝑁𝑂3−) values and standard deviation of the gradient for systems
containing 1 g, 50% and 90% (by volume) sintered 𝐶𝑒𝑂2 and water saturated air (no oxide)
0.0
20.0
40.0
60.0
80.0
100.0
120.0
0.0 10.0 20.0 30.0 40.0 50.0 60.0 70.0 80.0 90.0
Nit
rate
yie
ld /
(x1
01
6)
mo
lec
Dose to Air / (x1016) 100 eV
No Oxide
1 g
50% (~13.5 g)
90% (~24 g)

Chapter 8 Air Radiolysis Results and Discussion 7131060
238
It is clear from Table 8-16 that the yield of nitrate increases with growing mass of sintered
𝐶𝑒𝑂2 which is in agreement with un-sintered 𝐶𝑒𝑂2 (Table 8-14). However, this increase is
not directly related to the mass of 𝐶𝑒𝑂2 present in the sample. The mass of 𝐶𝑒𝑂2 in the 50%
and 90% samples is over double the quantity of 𝐶𝑒𝑂2 present in the un-sintered samples,
however, the yield has not doubled. This suggests that the formation of nitrate is not purely
a mass driven process.
8.8.3 Comparison with Un-sintered 𝑪𝒆𝑶𝟐 Results
Figure 8.28 outlines the comparative results for samples containing either regenerated or
sintered 𝐶𝑒𝑂2 and Table 8-17 details the respective masses, surface areas and nitrate yields
for the regenerated and sintered 𝐶𝑒𝑂2 samples.
Figure 8.28: Compiled data plot of nitrate production as a function of dose for systems containing 1 g, 50% and 90% (by volume) regenerated 𝐶𝑒𝑂2, 1 g, 50% and 90% (by volume)
sintered 𝐶𝑒𝑂2 and from water saturated air (no oxide)
0.0
50.0
100.0
150.0
200.0
250.0
300.0
350.0
400.0
0.0 20.0 40.0 60.0 80.0 100.0 120.0
Nit
rate
yie
ld /
(x1
01
6)
mo
lec
Dose to Air / (x1016) 100 eV
1 g 1 g sin
50% (~6 g) 50% sin (~13.5 g)
90% (~12 g) 90% sin (~24 g)
No Oxide

Chapter 8 Air Radiolysis Results and Discussion 7131060
239
Regenerated 𝑪𝒆𝑶𝟐 Sintered 𝑪𝒆𝑶𝟐
System Mass
/ g
Surface
Area / m2
G(𝑵𝑶𝟑−) /
molecules
100 eV-1
Error
(𝝈𝒔𝒍𝒐𝒑𝒆)
Mass
/ g
Surface
Area / m2
G(𝑵𝑶𝟑−) /
molecules
100 eV-1
Error
(𝝈𝒔𝒍𝒐𝒑𝒆)
No
Oxide
- - 1.17 ± 0.06 - - 1.17 ± 0.06
1 g 1 7.42 2.07 ± 0.07 1 2.2 1.21 ± 0.07
50% ~6 44.5 2.48 ± 0.02 ~13.5 29.7 2.35 ± 0.17
90% ~12 89.0 3.19 ± 0.09 ~24 52.8 2.59 ± 0.22
Table 8-17: Comparison between calculated G(𝑁𝑂3−) for samples containing either
regenerated 𝐶𝑒𝑂2 or sintered 𝐶𝑒𝑂2 and water saturated air (no oxide)
An initial observation is that the yield of nitrate is greater in samples containing regenerated
𝐶𝑒𝑂2 than the corresponding sintered 𝐶𝑒𝑂2 samples, however, this observation does not
account for the difference in surface area available in the system.
8.8.4 Discussion
As discussed in Section 8.5.2, the higher yields of nitrate observed in oxide containing
systems is hypothesised to be due to the adsorption of 𝑁𝑂2 which inhibits the back reaction
with nitrogen atoms (Reactions 8.7 and 8.8). To determine whether a decrease in the area
of surface available for 𝑁𝑂2 to adsorb to, reduces the yield of nitrate produced, Figure 8.29
is a plot of G(𝑁𝑂3−) as a function of surface area for the three types of oxide used in this
research:

Chapter 8 Air Radiolysis Results and Discussion 7131060
240
Figure 8.29: Plot of G(𝑁𝑂3−) as a function of surface area for the three oxide systems utilised
in this research and for reference, the water saturated air (no oxide) yield
It is clear from this figure that the difference in G(𝑁𝑂3−) values seen in Table 8-17 correlates
with an increase in surface area present in the system. Figure 8.29 highlights that there is a
linear relationship between surface area and yield of nitrate formed in samples containing
𝐶𝑒𝑂2 of differing surface areas. When there is little surface available for adsorption of 𝑁𝑂2,
as in 1 g samples of low SSA oxides, the yield of nitrate is comparable to that of water
saturated air. In these systems, the oxide equates to less than 5% of the total volume.
Therefore, the majority of the chemistry will occur in the gas phase and the surface will only
play a role when reactive species in the gas phase have diffused to the surface.
The mean free path can be used as an approximation for the distance travelled by a species
before interacting with another species. Equation 8.2 can be used to determine this value:
𝐿 = (𝜎𝑛)−1 Equation 8.2
0.00
1.00
2.00
3.00
4.00
5.00
6.00
7.00
0.0 20.0 40.0 60.0 80.0 100.0
G(N
O3
- )
Surface area / m2
H2O sat. air
Regenerated CeO2
Sintered CeO2
ZrO2

Chapter 8 Air Radiolysis Results and Discussion 7131060
241
where 𝐿 is the mean free path (in metres), 𝜎 is the collision cross-section (in m2) and 𝑛 is the
number of molecules (per m3).
The mean free path of an 𝑁2 molecule is approximately 6.6x10⁻⁸ m in air at 1 atmosphere of
pressure and 20 °C [126]. The collisional cross section value is very similar for 𝑂2 therefore
the mean free path will not differ dramatically. In the samples containing 1 g of oxide, there
is approximately 2.5 cm of headspace above the powder; from this mean free path, it is
evident that the majority of species generated in the gas phase will have reacted before
reaching the surface. Species within this distance from the surface will adsorb to the surface
and inhibit the back reaction with other gas phase species. This is why the G(𝑁𝑂3−) for 1 g
systems are slightly above the value for saturated air samples. In samples with higher
loading of oxides, the distance needed to travel by a gas phase species before encountering
a surface is greatly reduced, therefore adsorption of 𝑁𝑂2 will be greater, leading to the
higher yields of nitrate reported throughout this chapter.
𝑍𝑟𝑂2 initially follows the trend in Figure 8.29, however, samples containing 90% oxide have
a much higher yield than would be expected. As explained in Section 8.5.2, the band gap of
𝑍𝑟𝑂2 is too low to directly ionise 𝑁2 or 𝑂2, however, it will greatly increase the radiolysis of
adsorbed water and the species generated from this (as seen in Chapter Seven). This higher
concentration of water radiolysis species (namely 𝑂𝐻. and 𝐻 atoms) will increase the yield
of nitrate produced (Reaction 8.2).

Chapter 8 Air Radiolysis Results and Discussion 7131060
242
Conclusions
The radiolysis of pure air reaches a maximum nitrate yield of 83 μmol L-1 due to the
exhaustion of water vapour in the system. The G-value for nitrate formation is 1.39
molecules 100 eV-1 absorbed energy.
In the presence of an oxide powder, the yield of nitrate greatly increases due to the surface
acting as a sink for 𝑁𝑂2 which inhibits the back reaction with 𝑁 atoms to reform 𝑁2. The
yield of nitrate increases proportionally to the quantity of surface area available in the
sample. However, this trend is not followed by samples containing 90% (by volume) of
𝑍𝑟𝑂2, which produces significantly higher yields of nitrate with a G(𝑁𝑂3−) = 6.5 molecules
100 eV-1. This value is close to the limiting yield of G(𝑁) = 6 atoms 100 eV-1. This large
increase in nitrate formation is due to the higher concentration of 𝑂𝐻∙ from the radiolysis of
adsorbed water on the 𝑍𝑟𝑂2 surface. This species enhances nitrate formation in the
following reaction:
𝑁𝑂2 + 𝐻𝑂. → 𝐻𝑁𝑂3 Reaction 8.2
Reducing the surface area of 𝐶𝑒𝑂2 from 7.42 to 2.2 m2 g-1 in turn reduces the yield of nitrate
formed due to the relationship between nitrate formation and the surface area present in
the system.
Carbon dioxide (𝐶𝑂2) in the atmosphere gets reduced on the oxide surface and undergoes
dimerisation to form oxalate (𝐶2𝑂42−). The yields are far greater in the presence of 𝑍𝑟𝑂2
than corresponding 𝐶𝑒𝑂2 samples. The yield of oxalate, however, is an order of magnitude
below the yield of nitrate formation in corresponding samples. There is very little oxalate
formed in pure air samples due to the reaction outlined below:

Chapter 8 Air Radiolysis Results and Discussion 7131060
243
𝐶𝑂 + 𝑂 + 𝑀 → 𝐶𝑂2 + 𝑀 Reaction 8.19
Irradiating samples in synthetic air atmospheres removes a large quantity of 𝐶𝑂2 from the
gas phase and the yields of oxalate in 𝑍𝑟𝑂2 samples are reduced to the level of 𝐶𝑒𝑂2
samples. Due to 𝐶𝑂2 adsorbed to the oxide surface prior to irradiation, there is still oxalate
present in the post-irradiated samples.
Irradiating in synthetic air atmospheres had no effect on the nitrate yield as the water
adsorbed onto the oxide powder far outweighs the quantity of water vapour in the
headspace (Tables 8-2, 8-3 and 8-5) and, in pure air samples, the silanol (𝑆𝑖 − 𝑂 − 𝐻)
groups on the glass vials lead to nitric acid formation.
In all the systems investigated in this chapter, nitrite (𝑁𝑂2−) is absent from the post-
irradiated chromatogram. This is due to the decomposition of nitrous acid on the surface as
outlined below:
2𝐻𝑁𝑂2 (𝑎𝑑𝑠) → 𝑁𝑂 + 𝑁𝑂2 + 𝐻2𝑂(𝑎𝑑𝑠) Reaction 8.11

Chapter 9 Final Conclusions 7131060
244
9 Final Conclusions
This chapter pulls together the conclusions drawn from 𝐻2 − 𝑂2 − 𝐴𝑟 radiolysis studies in
the presence or absence of an oxide surface using γ-rays and 𝐻𝑒2+ accelerated ions that
were discussed in Chapter Seven and the results of air radiolysis in the presence or absence
of an oxide surface using γ-rays discussed in Chapter Eight.
9.1 𝑯𝟐 − 𝑶𝟐 System
The development of a suitable reaction vessel to investigate the radiation chemistry of
𝐻2 − 𝑂2 − 𝐴𝑟 gas mixtures has been achieved, after several iterations of design. With these
iterations, development of the analysis technique was needed.
60𝑪𝒐 Studies
In homogeneous systems, the recombination of 𝐻2 − 𝑂2 appears to be independent of
concentration of either gas. The G(-𝐻2) values in the range of 3.5-4.7 molecules 100 eV-1
were calculated, which is in good agreement with literature. The corresponding G(-𝑂2)
values are within the range of 1.8-4.2 molecules 100 eV-1. The average ratio of G(-𝐻2) to
G(-𝑂2) is 1.44. As this value is greater than one, it suggests that hydrogen peroxide (𝐻2𝑂2) is
not the stable product in this system.
Addition of an oxide surface greatly increased the rate of recombination. At low doses, 𝐻2
from radiolysis of adsorbed water is detected, however, this is soon depleted. It is not
known at this time whether, the effect of the oxide surface is catalytic, radiolytic or simply
as a surface for species to be adsorbed onto.
Chapter 9 Final Conclusions 7131060
245
In all of these systems, a steady state is not reached, therefore the rate of recombination is
greater than the rate of water vapour radiolysis.
𝑯𝒆𝟐+Studies
Development of an adequate reaction vessel to investigate the recombination of 𝐻2 − 𝑂2
using accelerated ions as a radiation source has been completed and preliminary
experiments have been undertaken.
Ethylene gas has been utilised as a secondary dosimeter to validate the absolute current
measurements. The results are within 5% of literature values, instilling confidence in the
absorbed dose calculations for this system.
In the results attained so far irradiating mixtures of 𝐻2 − 𝑂2 − 𝐴𝑟 gas, 𝐻2 continues to be
depleted with absorbed dose and no steady state is reached between 𝐻2 − 𝑂2
recombination and radiolysis of water vapour. The G(-𝐻2) values calculated for this data lie
in the range of 4.7-5.4 molecules 100 eV-1, in good agreement with 60𝐶𝑜 γ-ray studies.
Preliminary results highlight the absence of a linear energy transfer (LET) effect between
60𝐶𝑜 γ-rays and accelerated 𝐻𝑒2+ ions, as is to be expected with gaseous systems.
9.2 Air Radiolysis System
The presence of an oxide surface, greatly increases the yield of nitric acid in the radiolysis of
air system. G(𝐻𝑁𝑂3) values increase from 1.17 molecules 100 eV-1 in moist air, to
3.19 molecules 100 eV-1 in the presence of 𝐶𝑒𝑂2 and 6.5 molecules 100 eV-1 in the
presence of 𝑍𝑟𝑂2. It is hypothesised, that this increase is due to the surface acting as a sink
for 𝑁𝑂2 and thus preventing the back reaction to 𝑁2 (Reactions 8.7 and 8.8).
Chapter 9 Final Conclusions 7131060
246
The presence of an oxide surface also leads to the formation of oxalate (𝐶2𝑂42−), from the
dimerisation of 𝐶𝑂2 in the air.
Decreasing the surface area of 𝐶𝑒𝑂2 leads to a reduction of nitric acid formation in
proportion to higher surface area 𝐶𝑒𝑂2.
Conclusion
In canisters of 𝑃𝑢𝑂2, it is likely that both of these systems may be occurring simultaneously.
It is not known what effect, one system may have on the other. The presence of the 𝑃𝑢𝑂2
leads to a very complex system with redox chemistry occurring on the surface, as well as
energy transfer from the solid to adsorbed species and gaseous species.
Hopefully this research has added to the knowledge gap that was outlined in Chapter Two,
however, more work is needed to achieve a complete understanding of the mechanism
occurring inside 𝑃𝑢𝑂2 storage canisters.

Chapter 10 Future Work 7131060
247
10 Future work
While the research chapters of this thesis have gone some way in exploring the radiation
chemistry of gaseous systems in contact with an oxide surface, there are still many areas in
which this research could be developed further. These are discussed below in the context of
specific experiments and general research directions.
10.1 𝑯𝟐 − 𝑶𝟐 − 𝑨𝒓 System
To further elucidate the reaction mechanism of 𝐻2 − 𝑂2 recombination, a kinetic model of
elementary reactions could be developed. Foy and Joyce have tried to model the chemistry
occurring inside 𝑃𝑢𝑂2 canisters, however, this work is very preliminary and is not extensive
[127]. Modelling of a compiled reaction scheme taken from the extensive photochemistry
literature may help to explain the zero order nature of the gas phase radiolysis results
presented in Section 7.6. Once good agreement has been reached with this gas phase
chemistry model, a surface can then be added to incorporate the chemistry occurring at an
oxide surface such as in 𝑃𝑢𝑂2 canisters. Development of this model would require
significant effort as rate constants for many of the important three-body reactions are yet to
be determined.
Section 8.8 detailed results of air radiolysis experiments using sintered 𝐶𝑒𝑂2. This study was
performed to determine the effect of SSA on the radiation chemistry of moist air. A similar
experiment was not performed to investigate 𝐻2 − 𝑂2 recombination, and it is therefore,
not clear if the difference in results for 𝐶𝑒𝑂2 and 𝑍𝑟𝑂2, presented in Section 7.7, is due to
SSA effects or chemical differences. Experiments with particles of the same oxides of

Chapter 10 Future Work 7131060
248
differing surface areas should be investigated to determine the effect of SSA on 𝐻2 − 𝑂2
recombination.
10.2 Air Radiolysis System
Figure 8.29 highlighted an increase in the radiolytic production of 𝑁𝑂3−, with an increase of
surface area. In this research the surface area of the two oxides of interest were in the
range of 2-8 m2 g-1, this surface area is analogous to 𝑃𝑢𝑂2 currently in storage. To
determine the extent of this trend, 𝐶𝑒𝑂2 and 𝑍𝑟𝑂2 with higher surface areas (100’s m2 g-1)
such as nano-particles should be investigated.
10.3 𝑪𝟐𝑯𝟒 System
By chance, it has been shown in this research, that decomposition of ethylene is enhanced
in the presence of an oxide surface with a 450 fold increase in 𝐻2 production in the
presence of 𝑍𝑟𝑂2 than in pure ethylene. Further research is required to elucidate a
mechanism for this phenomenon and to what extent SSA, oxide band gap and quantity of
adsorbed water may have on this system.
This experiment was initially performed to help determine the dose adsorbed by the gas
phase in contact with an oxide surface, however, it has suggested another topic of research
interest.
Chapter One outlined the packaging criteria for 𝑃𝑢𝑂2 from the two product streams at the
Sellafield site. Magnox 𝑃𝑢𝑂2 product is packaged in an aluminium can and placed inside a
polyethylene ( 𝑃𝐸 ) bag. During long term storage these bags have thermally and

Chapter 10 Future Work 7131060
249
radiolytically degraded, leading to the formation of 𝐻2, small gaseous hydrocarbons and
unsaturated polymeric hydrocarbons. Other gaseous hydrocarbons, for example, ethane
and butene should be investigated to assess the decomposition of hydrocarbons in the
presence of an oxide surface and how this may contribute to 𝐻2 concentration in the ullage
space.
Alongside gaseous hydrocarbons, powdered 𝑃𝐸 could be mixed in various ratios with an
oxide powder and irradiated. This experiment would help to determine if the physical form
of the hydrocarbon has an effect on decomposition.
10.4 Generic Recommendations
The following recommendations are not specific for either of the gaseous system
investigated in this project.
In this research, surrogates of 𝑃𝑢𝑂2 have been used to investigate the gas phase radiation
chemistry occurring in the presence of an oxide surface. Although 𝐶𝑒𝑂2 and 𝑍𝑟𝑂2 have
been used extensively as 𝑃𝑢𝑂2 surrogates, there may be better alternatives. Thorium
dioxide (𝑇ℎ𝑂2) and uranium dioxide (𝑈𝑂2) both have the same fluorite structure as 𝑃𝑢𝑂2
and as actinide oxides may bear a closer resemblance to 𝑃𝑢𝑂2 than either 𝐶𝑒𝑂2 or 𝑍𝑟𝑂2.
Both of these oxides are radioactive and like 𝑃𝑢𝑂2 are α-emitters. This would simulate
𝑃𝑢𝑂2 canisters better as they are internal radiation sources with alpha decay energies
similar to plutonium (4-4.6 MeV for thorium and uranium isotopes in comparison to 5.2-5.6
MeV for plutonium isotopes).

Chapter 10 Future Work 7131060
250
The final stage of this research programme would be to undertake studies with 𝑃𝑢𝑂2. Using
surrogate oxides gives a good knowledge basis for potential reaction mechanisms inside the
storage canisters, but this approach will never be able to fully simulate the real system. It is
possible to replicate the physical properties of 𝑃𝑢𝑂2 (SSA, crystal structure, adsorbed
species); however, it is impossible to simulate the damage (and impurities) induced by
radioactive decay. 𝑃𝑢𝑂2 may have a large quantity of defects in the crystal lattice which
may affect the gas phase chemistry which cannot be replicated in a facile way.
The use of the three actinide oxides detailed above requires specialist facilities with regards
to handling and safeguards. All this work could not be undertaken at the DCF due to
environmental licensing and current infrastructure. Some of this work would have to be
undertaken at NNL’s Central Laboratory located at the Sellafield site.
Throughout this research, the effects of adsorbed species (in particular water) have been
highlighted as having an effect on the gas phase radiation chemistry. To determine the full
extent of this effect it is necessary to investigate a ‘clean’ surface where the identity and
quantity of adsorbates is known. This may be achieved by utilising a single crystal or thin
film of the relevant oxide. UHV conditions would be needed to undertake this research to
maintain the surface properties of the oxide. Similar work has been undertaken with, for
instance, titanium dioxide thin films [128] using low energy electrons as the radiation
source. Experiments utilising energetic electrons and accelerated ions as the radiation
sources are also feasible. In addition, it would also be possible to use an internal radiation
source such as the actinide dioxides described above.

Chapter 10 Future Work 7131060
251
10.5 Future Work with Accelerated Ions
Section 7.9 outlined experiments utilising ethylene gas as a validation method for the
absolute current measurements. Good agreement was achieved with both systems for a
range of currents and absorbed doses. The low density of ethylene should allow for several
ion types to be investigated with reasonable penetration into the sample. This will help to
determine if 𝐻2 production from ethylene radiolysis is dependent on ion type.
As described in Section 7.10, investigations with the ion accelerator are at a preliminary
stage, however, there is good agreement with corresponding 60𝐶𝑜 data to suggest there is
no LET effect. More data and using different ion types should further cement this
hypothesis.
In the research presented in this thesis; only gaseous systems have been investigated using
the ion accelerator. Experiments of 𝐻2 − 𝑂2 − 𝐴𝑟 gas in the presence of an oxide surface
using an ion accelerator will help to create a better simulation of the 𝑃𝑢𝑂2 canisters.
However, there are several difficulties to overcome with this experiment as the penetration
of the beam will be greatly reduced from several centimetres to several microns. The
majority of the beam will be absorbed by (the first few microns of) the oxide powder; this
small portion of oxide will be heated by the beam as oxides are poor thermal conductors
and this could lead to the oxide surface becoming annealed. Due to this fact, external
cooling of the sample may be needed and/ or agitation of the sample may have to be
considered.
The short range of the incoming ions in the solid may lead to very negligible energy being
deposited into the gas phase, therefore, making comparison with gamma studies presented
in this thesis may be difficult to attain.

Chapter 10 Future Work 7131060
252
Any solutions to this issue would require the reaction vessel in Figure 3.6 to be redesigned
as the ion beam would not penetrate very far into the vessel and radiation chemistry would
only likely occur in the first few millimetres of the sample. One solution is highlighted in
Figure 10.1. In this figure, the ion beam is stopped entirely in the gas phase, therefore there
would be no energy transferred from the oxide to the gas phase and the solid would act
simply as a sink for gaseous species.
Figure 10.1: Sketch of possible reaction vessel to study heterogeneous systems using an ion accelerator
An issue with this design is in keeping the oxide powder in position during irradiations. As
the powder would not play any part in the radiation chemistry mechanism, this design is a
poor simulation of the 𝑃𝑢𝑂2 canister system.
A second reaction vessel design is illustrated in Figure 10.2. In this design, the ion beam is
absorbed by both gas and solid phase allowing for potential energy transfer to take place.
This would simulate the 𝑃𝑢𝑂2 canister system better; however, the issue of oxide annealing
would still occur at the interface with the mica window.

Chapter 10 Future Work 7131060
253
Figure 10.2: Second possible reaction vessel for heterogeneous system experiments using an ion accelerator
This vessel would require secure placement and further beam diagnostics to help determine
the energy partitioning between the two phases.
This reaction vessel could be utilised in investigations of oxide powders in air atmospheres
as well as 𝐻2 − 𝑂2 − 𝐴𝑟 studies.

Chapter 11 Bibliography 7131060
254
11 Bibliography
1. Sharrad, C.A., L.M. Harwood, and F.R. Livens, Chapter 2 Nuclear Fuel Cycles: Interfaces with
the Environment, in Nuclear Power and the Environment. 2011, The Royal Society of
Chemistry. p. 40-56.
2. Various, Plutonium Separation in Nuclear Power Programs, 2015.
3. Management of the UK's plutonium stocks: a consultation on the long-term management of
UK owned separated civil plutonium, 2011, Department of Energy and Climate Change. p. 12-
13.
4. Herbst, R.S., P. Baron, and M. Nilsson, 6 - Standard and advanced separation: PUREX
processes for nuclear fuel reprocessing, in Advanced Separation Techniques for Nuclear Fuel
Reprocessing and Radioactive Waste Treatment. 2011, Woodhead Publishing. p. 141-175.
5. Stabilization, Packaging, and Storage of Plutonium-Bearing Materials, D.o. Energy, Editor
2012.
6. Machuron-Mandard, X. and C. Madic, Plutonium dioxide particle properties as a function of
calcination temperature. Journal of Alloys and Compounds, 1996. 235(2): p. 216-224.
7. Cook, P., H.E. Sims, and D. Woodhead, Safe and Secure Storage of Plutonium Dioxide in the
United Kingdom. Actinide Research Quarterly, 2013(2): p. 20-25.
8. Orr, R.M., H.E. Sims, and R.J. Taylor, A review of plutonium oxalate decomposition reactions
and effects of decomposition temperature on the surface area of the plutonium dioxide
product. Journal of Nuclear Materials, 2015. 465: p. 756-773.
9. Sims, H.E., et al., Hydrogen yields from water on the surface of plutonium dioxide. Journal of
Nuclear Materials, 2013. 437(1-3): p. 359-364.
10. Gilchrist, P., Plutonium: Credible Options Analysis (Gate A), N.D. Authority, Editor 2010.
11. Choppin, G.R., J.O. Liljenzin, and J. Rydberg, Chapter 4 - Unstable Nuclei and Radioactive
Decay, in Radiochemistry and Nuclear Chemistry (Third Edition). 2002, Butterworth-
Heinemann: Woburn. p. 58-93.
12. Spinks, J.W.T. and R.J. Woods, An Introduction to Radiation Chemistry. 3rd ed. 1964: John
Wiley & Sons.
13. Choppin, G.R., J.O. Liljenzin, and J. Rydberg, Chapter 6 - Absorption of Nuclear Radiation, in
Radiochemistry and Nuclear Chemistry (Third Edition). 2002, Butterworth-Heinemann:
Woburn. p. 123-165.
14. Appleby, A. and H.A. Schwarz, Radical and molecular yields in water irradiated by gamma-
rays and heavy ions. The Journal of Physical Chemistry, 1969. 73(6): p. 1937-1941.

Chapter 11 Bibliography 7131060
255
15. Yang, K. and P.J. Manno, The Role of Free Radical Processes in the γ-Radiolysis of Methane,
Ethane and Propane. Journal of the American Chemical Society, 1959. 81(14): p. 3507-3510.
16. Hauser, W.P., Radiolysis of Methane-C14 1. The Journal of Physical Chemistry, 1964. 68(6): p.
1576-1579.
17. Eller, P.G., R.E. Mason, and D.R. Horrell, 1999, Los Alamos Technical Report.
18. Ronchi, C. and J.P. Hiernaut, Helium diffusion in uranium and plutonium oxides. Journal of
Nuclear Materials, 2004. 325(1): p. 1-12.
19. Paffett, M. and G. Bailey, Gas Generation from Actinide Oxide Marterials, 1999: Los Alamos
Technical Report. p. 3-9.
20. Mason, R., T. Allen, and L. Morales, Gas Pressurization from Calcined Plutonium Oxides,
1999.
21. Almond, P.M., R.R. Livingston, and L.E. Traver, Gas Analyses from Headspace of Plutonium
Bearing Materials Containers, 2010: Savannah River National Laboratory.
22. Stakebake, J.L., Thermal desorption study of the surface interactions between water and
plutonium dioxide. The Journal of Physical Chemistry, 1973. 77(5): p. 581-586.
23. Haschke, J.M. and T.E. Ricketts, Adsorption of water on plutonium dioxide. Journal of Alloys
and Compounds, 1997. 252(1–2): p. 148-156.
24. Alexandrov, V., et al., Actinide Dioxides in Water: Interactions at the Interface. Journal of
Physical Chemistry Letters, 2011. 2(24): p. 3130-3134.
25. Petrik, N.G., A.B. Alexandrov, and A.I. Vall, Interfacial energy transfer during gamma
radiolysis of water on the surface of ZrO2 and some other oxides. Journal of Physical
Chemistry B, 2001. 105(25): p. 5935-5944.
26. Pastina, B., J.A. LaVerne, and S.M. Pimblott, Dependence of molecular hydrogen formation in
water on scavengers of the precursor to the hydrated electron. Journal of Physical Chemistry
A, 1999. 103(29): p. 5841-5846.
27. Luo, Y.R., Bond Dissociation Energies, in Handbook of Chemistry and Physics. 2009, CRC
Press. p. 9.64-9.69.
28. Aleksandrov, A.B., et al., Radiolysis of Adsorbed Substances on Oxide Surfaces. Zhurnal
Fizicheskoi Khimii, 1991. 65(6): p. 1604-1608.
29. LaVerne, J.A. and L. Tandon, H2 Production in the Radiolysis of Water on CeO2 and ZrO2. The
Journal of Physical Chemistry B, 2002. 106(2): p. 380-386.
30. Haschke, J.M., T.H. Allen, and L.A. Morales, Reactions of plutonium dioxide with water and
hydrogen-oxygen mixtures: Mechanisms for corrosion of uranium and plutonium. Journal of
Alloys and Compounds, 2001. 314(1-2): p. 78-91.

Chapter 11 Bibliography 7131060
256
31. Lloyd, J.A., Literature search on hydrogen/oxygen recombination and generation in
plutonium storage environments, 1999.
32. Haschke, J.M. and T.H. Allen, Interactions of Plutonium Dioxide with Water and Oxygen-
Hydrogen Mixtures, 1999.
33. Morales, L.A., Preliminary report on the recombination rates of hydrogen and oxygen over
pure and impure plutonium oxides, 1998.
34. Korzhavyi, P.A., et al., Oxidation of plutonium dioxide. Nature Materials, 2004. 3(4): p. 225-
228.
35. Quigley, G.P., Hydrogen/Oxygen Recombination Rates in 3013-Type Environments: An
Interim Report on the Rate of Loss of Hydrogen in Dry Air from Cell Containing Non-Radiolytic
Samples, 1998.
36. Katz, S., The Reaction of Hydrogen and Oxygen in the Presence of Concrete Incorporating
Simulated Radioactive Waste, 1979.
37. Lind, S.C., Chemical action produced by radium emanation I The combination of hydrogen
and oxygen. Journal of the American Chemical Society, 1919. 41: p. 531-551.
38. Schiflett, C.H. and S.C. Lind, The temperature coefficient of the rate of combination of
hydrogen and oxygen under alpha radiation. Journal of Physical Chemistry, 1934. 38(3): p.
327-337.
39. Lind, S.C. and C.H. Schiflett, Chemical action produced by alpha particles: The combination of
deuterium and oxygen. Journal of the American Chemical Society, 1935. 57(1): p. 1051-1052.
40. Benjamin, B.M. and H.S. Isbin, Recombination of Hydrogen and Oxygen in Presence of Water
Vapour under Influence of Radiation. Energia Nucleare, 1966. 13(4): p. 165-172.
41. Dautzenberg, D., Gamma-radiolysis of Hydrogen Oxygen Mixtures 1 Influences of
Temperature, Vessel Wall, Pressure and Added Gases (N2, AR, H2) on the Reactivity of
H2/O2-Mixtures. Radiation Physics and Chemistry, 1989. 33(1): p. 61-67.
42. Willis, C., A.W. Boyd, and M.J. Young, Radiolysis of air and nitrogen–oxygen mixtures with
intense electron pulses: determination of a mechanism by comparison of measured and
computed yields. Canadian Journal of Chemistry, 1970. 48(10): p. 1515-1525.
43. Harteck, P. and S. Dondes, Decomposition of Nitric Oxide and Nitrogen Dioxide by the Impact
of Fission Fragments of Uranium-235. The Journal of Chemical Physics, 1957. 27(2): p. 546-
551.
44. Harteck, P. and S. Dondes, The Kinetic Radiation Equilibrium of Air. The Journal of Physical
Chemistry, 1959. 63(6): p. 956-961.
Chapter 11 Bibliography 7131060
257
45. Kanda, Y., et al., Measurement of radiolytic yield of nitric acid in air. Radiation Physics and
Chemistry, 2005. 74(5): p. 338-340.
46. Jones, A.R., Radiation Induced Reactions in the N2-O2-H2O System. Radiation Research,
1959. 10(6): p. 655-663.
47. Rouessac, F. and A. Rouessac, Chemical Analysis - Modern Instrumentation Methods and
Techniques. 1994: John Wiley & Sons Ltd.
48. Webb, P.A. and C. Orr, Analytical Methods in Fine Particle Technology. 1997: Micromeritics
Instrument Corporation.
49. Finlayson-Pitts, B.J. and J.N. Pitts Jr, Chapter 7 - Chemistry of Inorganic Nitrogen Compounds,
in Chemistry of the Upper and Lower Atmosphere. 2000, Academic Press. p. 264-293.
50. Schuler, R.H. and A.O. Allen, Absolute Measurement of Cyclotron Beam Currents for
Radiation-Chemical Studies. Review of Scientific Instruments, 1955. 26(12): p. 1128-1130.
51. Ziegler, J.F. SRIM (Stopping Range of Ions in Matter). Available from: www.srim.org.
52. Charlesby, A., The Effects of Ionising Radiation on Polymers, in Irradiation Effects on
Polymers. 1991, Elsevier Science Publishers. p. 55-57.
53. Nilsson, S. and M. Jonsson, H2O2 and radiation induced dissolution of UO2 and SIMFUEL
pellets. Journal of Nuclear Materials, 2011. 410(1–3): p. 89-93.
54. Stone, J.A., Radiolysis of cyclohexane in a xenon matrix at 77 °K. Canadian Journal of
Chemistry, 1968. 46(8): p. 1267-1277.
55. Sagert, N.H. and R.W. Robinson, Radiolysis in the adsorbed state. II. N2O adsorbed on silica
gel and zirconia. Canadian Journal of Chemistry, 1968. 46(12): p. 2075-2080.
56. LaVerne, J.A. and L. Tandon, H2 Production in the Radiolysis of Water on UO2 and Other
Oxides. The Journal of Physical Chemistry B, 2003. 107(49): p. 13623-13628.
57. Armstrong, D.A., The Radiation Chemistry of Gases, in Radiation Chemistry Principles and
Applications. 1987, VCH Publishers inc. p. 263-319.
58. Johnson, G.R.A., The nitrous oxide radiation dosimeter. Journal of Inorganic and Nuclear
Chemistry, 1962. 24(5): p. 461-468.
59. McLaren, K.G., Gas phase dosimetry based on nitrogen yield from nitrous oxide. The
International Journal of Applied Radiation and Isotopes, 1974. 25(2): p. 87-93.
60. Janovsky, I., Use of Nitrous-Oxide and Ethylene for Gas-phase Dosimetry. International
Journal for Radiation Physics and Chemistry, 1976. 8(3): p. 396-397.
61. Ikezoe, Y., S. Sato, and A. Danno, Chemical Dosimeters for Mixed Radiations in a Nuclear
Reactor. Journal of Nuclear Science and Technology, 1971. 8(7): p. 394-399.

Chapter 11 Bibliography 7131060
258
62. Srinivas.S and W.E. Smith, Ethylene as a Dosimeter at high Pressures, Temperatures and
Dose Rates. International Journal of Applied Radiation and Isotopes, 1966. 17(11-1): p. 643-
647.
63. Leay, L., et al., Development of irradiation capabilities to address the challenges of the
nuclear industry. Nuclear Instruments and Methods in Physics Research Section B: Beam
Interactions with Materials and Atoms, 2015. 343(0): p. 62-69.
64. LaVerne, J.A. and R.H. Schuler, Radiation chemical studies with heavy ions: oxidation of
ferrous ion in the Fricke dosimeter. The Journal of Physical Chemistry, 1987. 91(22): p. 5770-
5776.
65. Brunauer, S., et al., On a Theory of the van der Waals Adsorption of Gases. Journal of the
American Chemical Society, 1940. 62(7): p. 1723-1732.
66. Socrates, G., Infrared and Raman Characteristic Group Frequencies. Third Edition ed. 2001:
John Wiley and Sons Ltd.
67. Busca, G. and V. Lorenzelli, Infrared spectroscopic identification of species arising from
reactive adsorption of carbon oxides on metal oxide surfaces. Materials Chemistry, 1982.
7(1): p. 89-126.
68. Baltrusaitis, J., et al., Carbon dioxide adsorption on oxide nanoparticle surfaces. Chemical
Engineering Journal, 2011. 170(2–3): p. 471-481.
69. Goodman, A.L., E.T. Bernard, and V.H. Grassian, Spectroscopic study of nitric acid and water
adsorption on oxide particles: Enhanced nitric acid uptake kinetics in the presence of
adsorbed water. Journal of Physical Chemistry A, 2001. 105(26): p. 6443-6457.
70. Sauer, M.C. and L.M. Dorfman, The Radiolysis of Ethylene: Details of the Formation of
Decomposition Products. The Journal of Physical Chemistry, 1962. 66(2): p. 322-325.
71. Ausloos, P. and R. Gorden, Hydrogen Formation in the γ Radiolysis of Ethylene. The Journal of
Chemical Physics, 1962. 36(1): p. 5-9.
72. Sauer, M.C. and L.M. Dorfman, Molecular Detachment Processes in the Vacuum uv Photolysis
of Gaseous Hydrocarbons. I. Ethylene. II. Butane. The Journal of Chemical Physics, 1961.
35(2): p. 497-502.
73. Meisels, G.G. and T.J. Sworski, Radiolysis of Ethylene. I. Yield of Hydrogen Atoms and
Formation of Saturated Hydrocarbons1. The Journal of Physical Chemistry, 1965. 69(3): p.
815-821.
74. Meisels, G.G., Radiolysis of Ethylene. II. Primary Free Radicals and Their Reactions1. Journal
of the American Chemical Society, 1965. 87(5): p. 950-957.

Chapter 11 Bibliography 7131060
259
75. Yang, K. and P.J. Manno, Gamma Radiolysis of Ethylene. Journal of Physical Chemistry, 1959.
63(5): p. 752-753.
76. Emeline, A., et al., Spectroscopic and photoluminescence studies of a wide band gap
insulating material: Powdered and colloidal ZrO2 sols. Langmuir, 1998. 14(18): p. 5011-5022.
77. Ren, Y., et al., Elastic properties and electronic structure of transition metal atoms in CeO2
solid solution: First principle studies. Computational Materials Science, 2015. 98: p. 459-465.
78. Chelnokov, E., et al., Electron Transfer at Oxide/Water Interfaces Induced by Ionizing
Radiation. Journal of Physical Chemistry C, 2014. 118(15): p. 7865-7873.
79. Haschke, J.M., T.H. Allen, and L.A. Morales, Reaction of plutonium dioxide with water:
Formation and properties of PuO2+x. Science, 2000. 287(5451): p. 285-287.
80. Penneman, R.A. and M.T. Paffett, An alternative structure of Pu4O9 ("PuO2.25")
incorporating interstitial hydroxyl rather than oxide. Journal of Solid State Chemistry, 2005.
178(2): p. 563-566.
81. Il Pae, Y., D.C. Shin, and J.R. Sohn, CeO2-Promoted highly active catalyst, NiSO4/CeO2-ZrO2
for ethylene dimerization. Bulletin of the Korean Chemical Society, 2006. 27(12): p. 1989-
1996.
82. Gray, L.H., An Ionization Method for the Absolute Measurement of Gamma Ray Energy.
Proceedings of the Royal Society of London A: Mathematical, Physical and Engineering
Sciences, 1936. 156(889): p. 578-596.
83. Attix, F.H., L.D. Vergne, and V.H. Ritz, Cavity Ionisation as a Function of Wall Material.
Journal of Research of the National Bureau of Standards, 1958. 60(3): p. 235-243.
84. Spencer, L.V. and F.H. Attix, A Theory of Cavity Ionization. Radiation Research, 1955. 3(3): p.
239-254.
85. Lias, S.G., Ionization Energies of Gas-Phase Molecules, in Handbook of Chemistry and Physics.
2009, CRC Press. p. 10.206-10.221.
86. Phelps, A.V., Collisions of H+, H2(+), H3(+), ARH+, H-, H, and H2 with AR and of AR+ and ARH+
with H2 for Energies from 0.1 EV to 10 KEV. Journal of Physical and Chemical Reference Data,
1992. 21(4): p. 883-897.
87. Kobayashi, N., Low Energy Ion-Netural Reactions. III. Ar++NO, Kr++NO, Ar++O2, Kr++O2 and
Ar++CO. Journal of the Physical Society of Japan, 1974. 36(1): p. 259-266.
88. Hasan, A.T., Single electron capture in slow collisions of H2+ ions with H2, O2 and N2
diatomic molecules. International Journal of Mass Spectrometry, 2005. 247(1–3): p. 81-84.
89. Willis, C. and A.W. Boyd, Excitation in the radiation chemistry of inorganic gases.
International Journal for Radiation Physics and Chemistry, 1976. 8(1–2): p. 71-111.

Chapter 11 Bibliography 7131060
260
90. Tully, J.C., Reactions of O(1D) with atmospheric molecules. The Journal of Chemical Physics,
1975. 62(5): p. 1893-1898.
91. Presser, N. and R.J. Gordon, The kinetic isotope effect in the reaction of O(3P) with H2, D2,
and HD. The Journal of Chemical Physics, 1985. 82(3): p. 1291-1297.
92. Lin, C.L. and M.T. Leu, Temperature and third-body dependence of the rate constant for the
reaction O + O2 + M → O3 + M. International Journal of Chemical Kinetics, 1982. 14(4): p.
417-434.
93. Kurzius, S.C. and M. Boudart, Kinetics of the branching step in the hydrogen-oxygen reaction.
Combustion and Flame, 1968. 12(5): p. 477-491.
94. Schulz, W.R. and D.J. Le Roy, Kinetics of the Reaction H+pH2 = oH2+H. The Journal of
Chemical Physics, 1965. 42(11): p. 3869-3873.
95. Campbell, I.M. and C.N. Gray, Rate constants for O(3P) recombination and association with
N(4S). Chemical Physics Letters, 1973. 18(4): p. 607-609.
96. Larkin, F.S. and B.A. Thrush, Recombination of hydrogen atoms in the presence of
atmospheric gases. Discussions of the Faraday Society, 1964. 37(0): p. 112-117.
97. Orkin, V.L., et al., Rate constant for the reaction of OH with H2 between 200 and 480 K.
Journal of Physical Chemistry A, 2006. 110(21): p. 6978-6985.
98. Lewis, R.S. and R.T. Watson, Temperature dependence of the reaction O(3P) + OH(2II) = O2 +
H. The Journal of Physical Chemistry, 1980. 84(26): p. 3495-3503.
99. Michael, J.V., et al., Rate Constants For H + O2 + M → HO2 + M in Seven Bath Gases. The
Journal of Physical Chemistry A, 2002. 106(21): p. 5297-5313.
100. Dobis, O. and S.W. Benson, Reaction of the ethyl radical with oxygen at millitorr pressures at
243-368 K and a study of the Cl + HO2, ethyl + HO2, and HO2 + HO2 reactions. Journal of the
American Chemical Society, 1993. 115(19): p. 8798-8809.
101. Vaghjiani, G.L., A.R. Ravishankara, and N. Cohen, Reactions of hydroxyl and hydroxyl-d with
hydrogen peroxide and hydrogen peroxide-d2. The Journal of Physical Chemistry, 1989.
93(23): p. 7833-7837.
102. Dubey, M.K., et al., Isotope specific kinetics of hydroxyl radical (OH) with water (H2O):
Testing models of reactivity and atmospheric fractionation. Journal of Physical Chemistry A,
1997. 101(8): p. 1494-1500.
103. Anderson, A.R. and J.V.F. Best, Use of Ethylene as a Gas Phase Dosimeter for Accelerator
Radiation. Nature, 1967. 216(5115): p. 576-577.
104. Housecroft, C.E. and A.G. Sharpe, Structures and Energetics of Metallic and Ionic Solids, in
Inorganic Chemistry. 2008, Pearson Education Limited. p. 164-171.

Chapter 11 Bibliography 7131060
261
105. Rodriguez, J.A., et al., Properties of CeO2 and Ce1-xZrxO2 Nanoparticles: X-ray Absorption
Near-Edge Spectroscopy, Density Functional, and Time-Resolved X-ray Diffraction Studies.
The Journal of Physical Chemistry B, 2003. 107(15): p. 3535-3543.
106. Teufer, G., The crystal structure of tetragonal ZrO2. Acta Crystallographica, 1962. 15(11): p.
1187.
107. Lane, C.D., et al., Site-dependent electron-stimulated reactions in water films on TiO2(110).
The Journal of Chemical Physics, 2007. 127(22): p. 224706.
108. Reed, D.T. and R.A. Van Konynenburg, Effect of ionizing radiation on moist air systems, 1987.
109. Karasawa, H., et al., Radiation Induced Decomposition of Nitrogen. Radiation Physics and
Chemistry, 1991. 37(2): p. 193-197.
110. Tokunaga, O., et al., Radiation Treatment of Exhaust Gases 4 Oxidation of NO in Moist
Mixtures of O2 and N2. Radiation Physics and Chemistry, 1978. 11(3): p. 117-122.
111. Morris, E.D. and H. Niki, Reaction of dinitrogen pentoxide with water. The Journal of Physical
Chemistry, 1973. 77(16): p. 1929-1932.
112. Rodriguez, J.A., et al., Chemistry of NO2 on CeO2 and MgO: Experimental and theoretical
studies on the formation of NO3. Journal of Chemical Physics, 2000. 112(22): p. 9929-9939.
113. Nanayakkara, C.E., W.A. Larish, and V.H. Grassian, Titanium Dioxide Nanoparticle Surface
Reactivity with Atmospheric Gases, CO2, SO2, and NO2: Roles of Surface Hydroxyl Groups
and Adsorbed Water in the Formation and Stability of Adsorbed Products. The Journal of
Physical Chemistry C, 2014. 118(40): p. 23011-23021.
114. Hadjiivanov, K., et al., Infrared spectroscopy study of the species arising during nitrogen
dioxide adsorption on titania (anatase). Langmuir, 1994. 10(2): p. 464-471.
115. Haubrich, J., et al., In Situ Ambient Pressure Studies of the Chemistry of NO2 and Water on
Rutile TiO2(110). Langmuir, 2010. 26(4): p. 2445-2451.
116. Sorescu, D.C., C.N. Rusu, and J.T. Yates, Adsorption of NO on the TiO2(110) surface: An
experimental and theoretical study. Journal of Physical Chemistry B, 2000. 104(18): p. 4408-
4417.
117. Hadjiivanov, K.I., D.G. Klissurski, and V.P. Bushev, IR spectroscopic study of NO2 adsorption
on chromia. Journal of the Chemical Society, Faraday Transactions, 1995. 91(1): p. 149-153.
118. Ansari, S.A., et al., Band gap engineering of CeO2 nanostructure using an electrochemically
active biofilm for visible light applications. Rsc Advances, 2014. 4(32): p. 16782-16791.
119. Saliba, N.A., H. Yang, and B.J. Finlayson-Pitts, Reaction of Gaseous Nitric Oxide with Nitric
Acid on Silica Surfaces in the Presence of Water at Room Temperature. The Journal of
Physical Chemistry A, 2001. 105(45): p. 10339-10346.

Chapter 11 Bibliography 7131060
262
120. De Almeida, L., et al., Insights into the Thermal Decomposition of Lanthanide(III) and
Actinide(III) Oxalates – from Neodymium and Cerium to Plutonium. European Journal of
Inorganic Chemistry, 2012. 2012(31): p. 4986-4999.
121. Altaş, Y. and H. Tel, Structural and thermal investigations on cerium oxalate and derived
oxide powders for the preparation of (Th,Ce)O2 pellets. Journal of Nuclear Materials, 2001.
298(3): p. 316-320.
122. Moosath, S.S., J. Abraham, and T.V. Swaminathan, Thermal Decomposition of Rare Earth
Metal Oxalates 4 Oxalates of Cerium and Thorium. Zeitschrift Fur Anorganische Und
Allgemeine Chemie, 1963. 324(1-2): p. 103-105.
123. Hirschfelder, J.O. and H.S. Taylor, The Alpha-Particle Reactions in Carbon Monoxide, Oxygen
and Carbon Dioxide Systems. The Journal of Chemical Physics, 1938. 6(12): p. 783-790.
124. Arin, L.M. and P. Warneck, Reaction of ozone with carbon monoxide. The Journal of Physical
Chemistry, 1972. 76(11): p. 1514-1516.
125. Harteck, P. and S. Dondes, Decomposition of Carbon Dioxide by Ionizing Radiation. Part I. The
Journal of Chemical Physics, 1955. 23(5): p. 902-908.
126. Jennings, S.G., The mean free path in air. Journal of Aerosol Science, 1988. 19(2): p. 159-166.
127. Foy, B.R. and S.A. Joyce, Gas-phase Radiolysis in Plutonium Dioxide Powder, 2008, Los
Alamos National Laboratory.
128. Lane, C.D., et al., Electron-stimulated oxidation of thin water films adsorbed on TiO2(110).
Journal of Physical Chemistry C, 2007. 111(44): p. 16319-16329.