Embed Size (px)
Citation preview
Grigg - 111
acceptance of diverse groups. Several measures of racist attitudes exist, but many concentrate on anti-African atti-
tudes and are validated only for US populations. Given differences in context and cultur-al milieu between the US and Australia (Pedersen, Beven, Walker, & Griffiths, 2004), several Australian measures have been developed. However, these generally focus on one group (e.g., Indigenous Australians; Pedersen, et al., 2004) and/or have not been empirically developed and appropriately validated (e.g., Dunn & Geeraert, 2003). For youth as for adults, the available instruments are limited. There is hence a dearth of de-velopmentally appropriate tools for accurately measuring racism across groups in Aus-tralia. As no Australian instrument has been developed utilising advanced psychometric analyses such as Item Response Theory (IRT), nor appropriately validated across racial or age groups, the accurate evaluation of interventions is inhibited. No scale currently exists capable of objectively evaluating the levels of general racist attitudes in individu-als or groups in an Australian context, and hence, the effectiveness of racism-reduction programs cannot be assessed quantitatively. The work detailed within this chapter aimed to address this gap.
Development of RACESThe research we describe here explored racism as experienced by Australians from
diverse backgrounds. Using an accepted scientific process of scale development (DeVel-lis, 2012), an explicit measure of racial, ethnic, cultural, and religious acceptance – the Australian Racism, Acceptance, and Cultural-Ethnocentrism Scale (RACES) – was de-veloped and validated with children, adolescents, and adults with an overarching goal for the measure to be appropriate for evaluating the effectiveness of anti-racism and pro-di-versity initiatives implemented in Australian schools and throughout the community.
Contemporary understandings of racism stemming from cognitive psychology offer an important distinction between implicit and explicit attitudes, with implicit attitudes proposed to reflect ‘true’ attitudes; to lack conscious awareness; to be unable to be di-rectly perceived; to be unintentionally and automatically activated by the presence of an attitude object; and therefore require indirect measurement via specialised tools (Dovi-dio, 2001; Greenwald, McGhee, & Schwartz, 1998). However, for our purposes, the de-velopment of a measure of explicit racist attitudes was considered better suited for com-munity use and so of greater utility to evaluate anti-racism and pro-diversity initiatives. In the initial stages of the research, we used in-depth semi-structured interviews and focus groups to explore conceptualisations of racism, and in conjunction with the con-ceptual literature, used this data to develop the preliminary items. Secondary stages ex-amined the underlying latent factor structure of the measure across multiple age groups. Final stages validated the psychometric properties of the novel scale in Victorian pri-mary school children and adolescents and adults from the Australian community. Ethics
The Racism, Acceptance, and Cultural-Ethnocentrism Scale (RACES): Measuring Racism in Australia
Kaine GriggMonash University
Lenore MandersonUniversity of the Witwatersr, Monash University
AbstractNo existing scale has been designed for, and validated in, the Australian context which can objectively evaluate the levels of general racist attitudes in Australian individuals or groups. Existing Australian measures of racist attitudes focus on single groups or have not been validated across the lifespan. Without suitable instruments, rac-ism reduction programs implemented in Australia cannot be appropriately evaluated and so cannot be judged to be making a meaningful difference to the attitudes of the participants. To address the need for a general mea-sure of racial, ethnic, cultural, and religious acceptance, an Australian scale was developed and validated for use with children, adolescents, and adults. The Racism, Acceptance, and Cultural-Ethnocentrism Scale (RACES) is a 34-item self-report instrument measuring explicit racist attitudes, consisting of three interdependent subscales (Accepting Attitudes – 12 items; Racist Attitudes – 8 items; Ethnocentric Attitudes – 4 items) and a 10-item measure of social desirability. The current chapter summarises the mixed methods approach to the development and evaluation of the novel scale, and reports on the reliability and validity data for children, adolescents, and adults from diverse racial, ethnic, cultural, and religious backgrounds around Australia. The results of examina-tions of psychometric properties, including latent structure, internal consistency, test-retest reliability, conver-gent validity, discriminant validity, and predictive validity, are discussed. Utilised analytical techniques include qualitative thematic analysis of interviews and focus groups, unidimensional and multidimensional Rasch (Item Response Theory) analyses, and various Classical Test Theory analyses.
IntroductionAustralians live in a country with unprecedented racial, ethnic, cultural, religious,
and linguistic diversity, an artefact of its establishment post 1788 upon a platform of immigration and, from the last decades of the 20th century, policies of multicultural-ism. A by-product of this diversity has been increasing reports of racist attitudes and incidents, as evidenced by longitudinal multi-state survey data (Dunn, Forrest, Pe-Pua, Hynes, & Maeder-Han, 2009).
Globally, racism research has grown substantially over the past decade, consistently showing positive associations with an array of negative mental health outcomes. Per-ceived racism has pervasive negative physical and psychological effects in various mi-nority racial and Indigenous groups (Chou, Asnaani, & Hofmann, 2012; Harrell, Hall, & Taliaferro, 2003; Paradies, 2006; Pascoe & Richman, 2009; Williams, Neighbors, & Jackson, 2008). Most of this research has been conducted with victims, with less ad-dressing the factors that produce racism or exploring questions related to low levels of
Grigg - 112
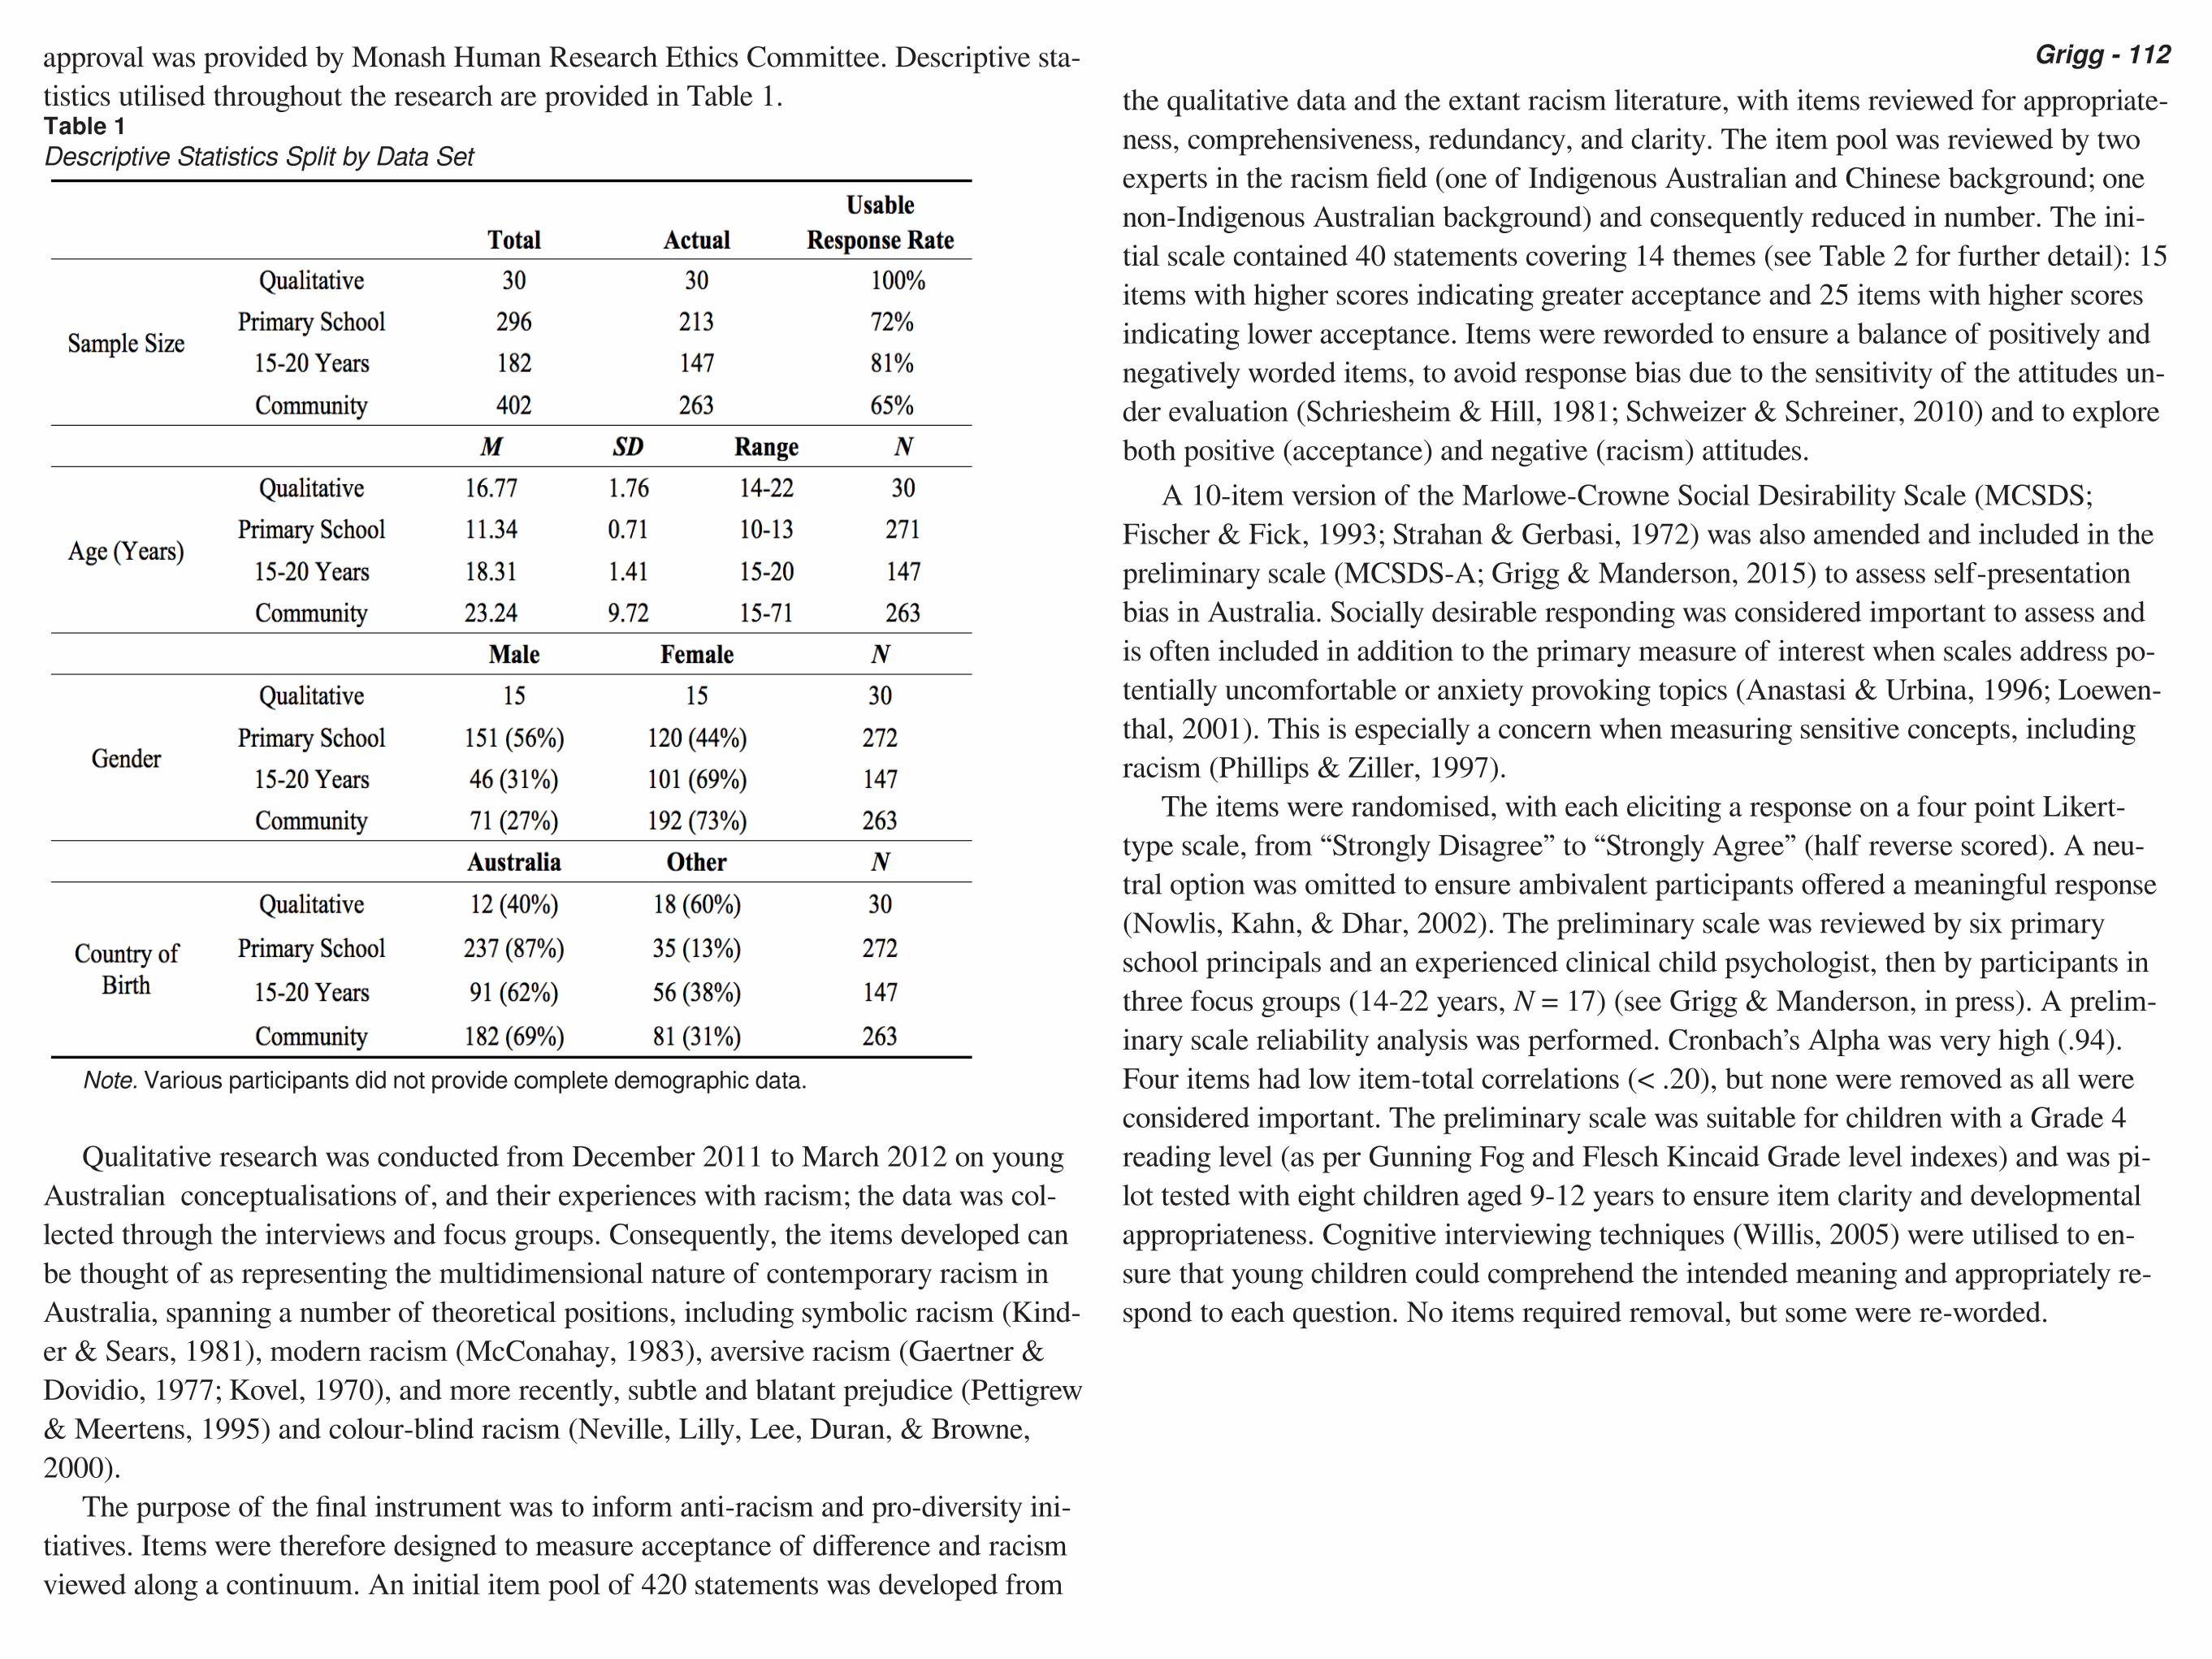
the qualitative data and the extant racism literature, with items reviewed for appropriate-ness, comprehensiveness, redundancy, and clarity. The item pool was reviewed by two experts in the racism field (one of Indigenous Australian and Chinese background; one non-Indigenous Australian background) and consequently reduced in number. The ini-tial scale contained 40 statements covering 14 themes (see Table 2 for further detail): 15 items with higher scores indicating greater acceptance and 25 items with higher scores indicating lower acceptance. Items were reworded to ensure a balance of positively and negatively worded items, to avoid response bias due to the sensitivity of the attitudes un-der evaluation (Schriesheim & Hill, 1981; Schweizer & Schreiner, 2010) and to explore both positive (acceptance) and negative (racism) attitudes.
A 10-item version of the Marlowe-Crowne Social Desirability Scale (MCSDS; Fischer & Fick, 1993; Strahan & Gerbasi, 1972) was also amended and included in the preliminary scale (MCSDS-A; Grigg & Manderson, 2015) to assess self-presentation bias in Australia. Socially desirable responding was considered important to assess and is often included in addition to the primary measure of interest when scales address po-tentially uncomfortable or anxiety provoking topics (Anastasi & Urbina, 1996; Loewen-thal, 2001). This is especially a concern when measuring sensitive concepts, including racism (Phillips & Ziller, 1997).
The items were randomised, with each eliciting a response on a four point Likert-type scale, from “Strongly Disagree” to “Strongly Agree” (half reverse scored). A neu-tral option was omitted to ensure ambivalent participants offered a meaningful response (Nowlis, Kahn, & Dhar, 2002). The preliminary scale was reviewed by six primary school principals and an experienced clinical child psychologist, then by participants in three focus groups (14-22 years, N = 17) (see Grigg & Manderson, in press). A prelim-inary scale reliability analysis was performed. Cronbach’s Alpha was very high (.94). Four items had low item-total correlations (< .20), but none were removed as all were considered important. The preliminary scale was suitable for children with a Grade 4 reading level (as per Gunning Fog and Flesch Kincaid Grade level indexes) and was pi-lot tested with eight children aged 9-12 years to ensure item clarity and developmental appropriateness. Cognitive interviewing techniques (Willis, 2005) were utilised to en-sure that young children could comprehend the intended meaning and appropriately re-spond to each question. No items required removal, but some were re-worded.
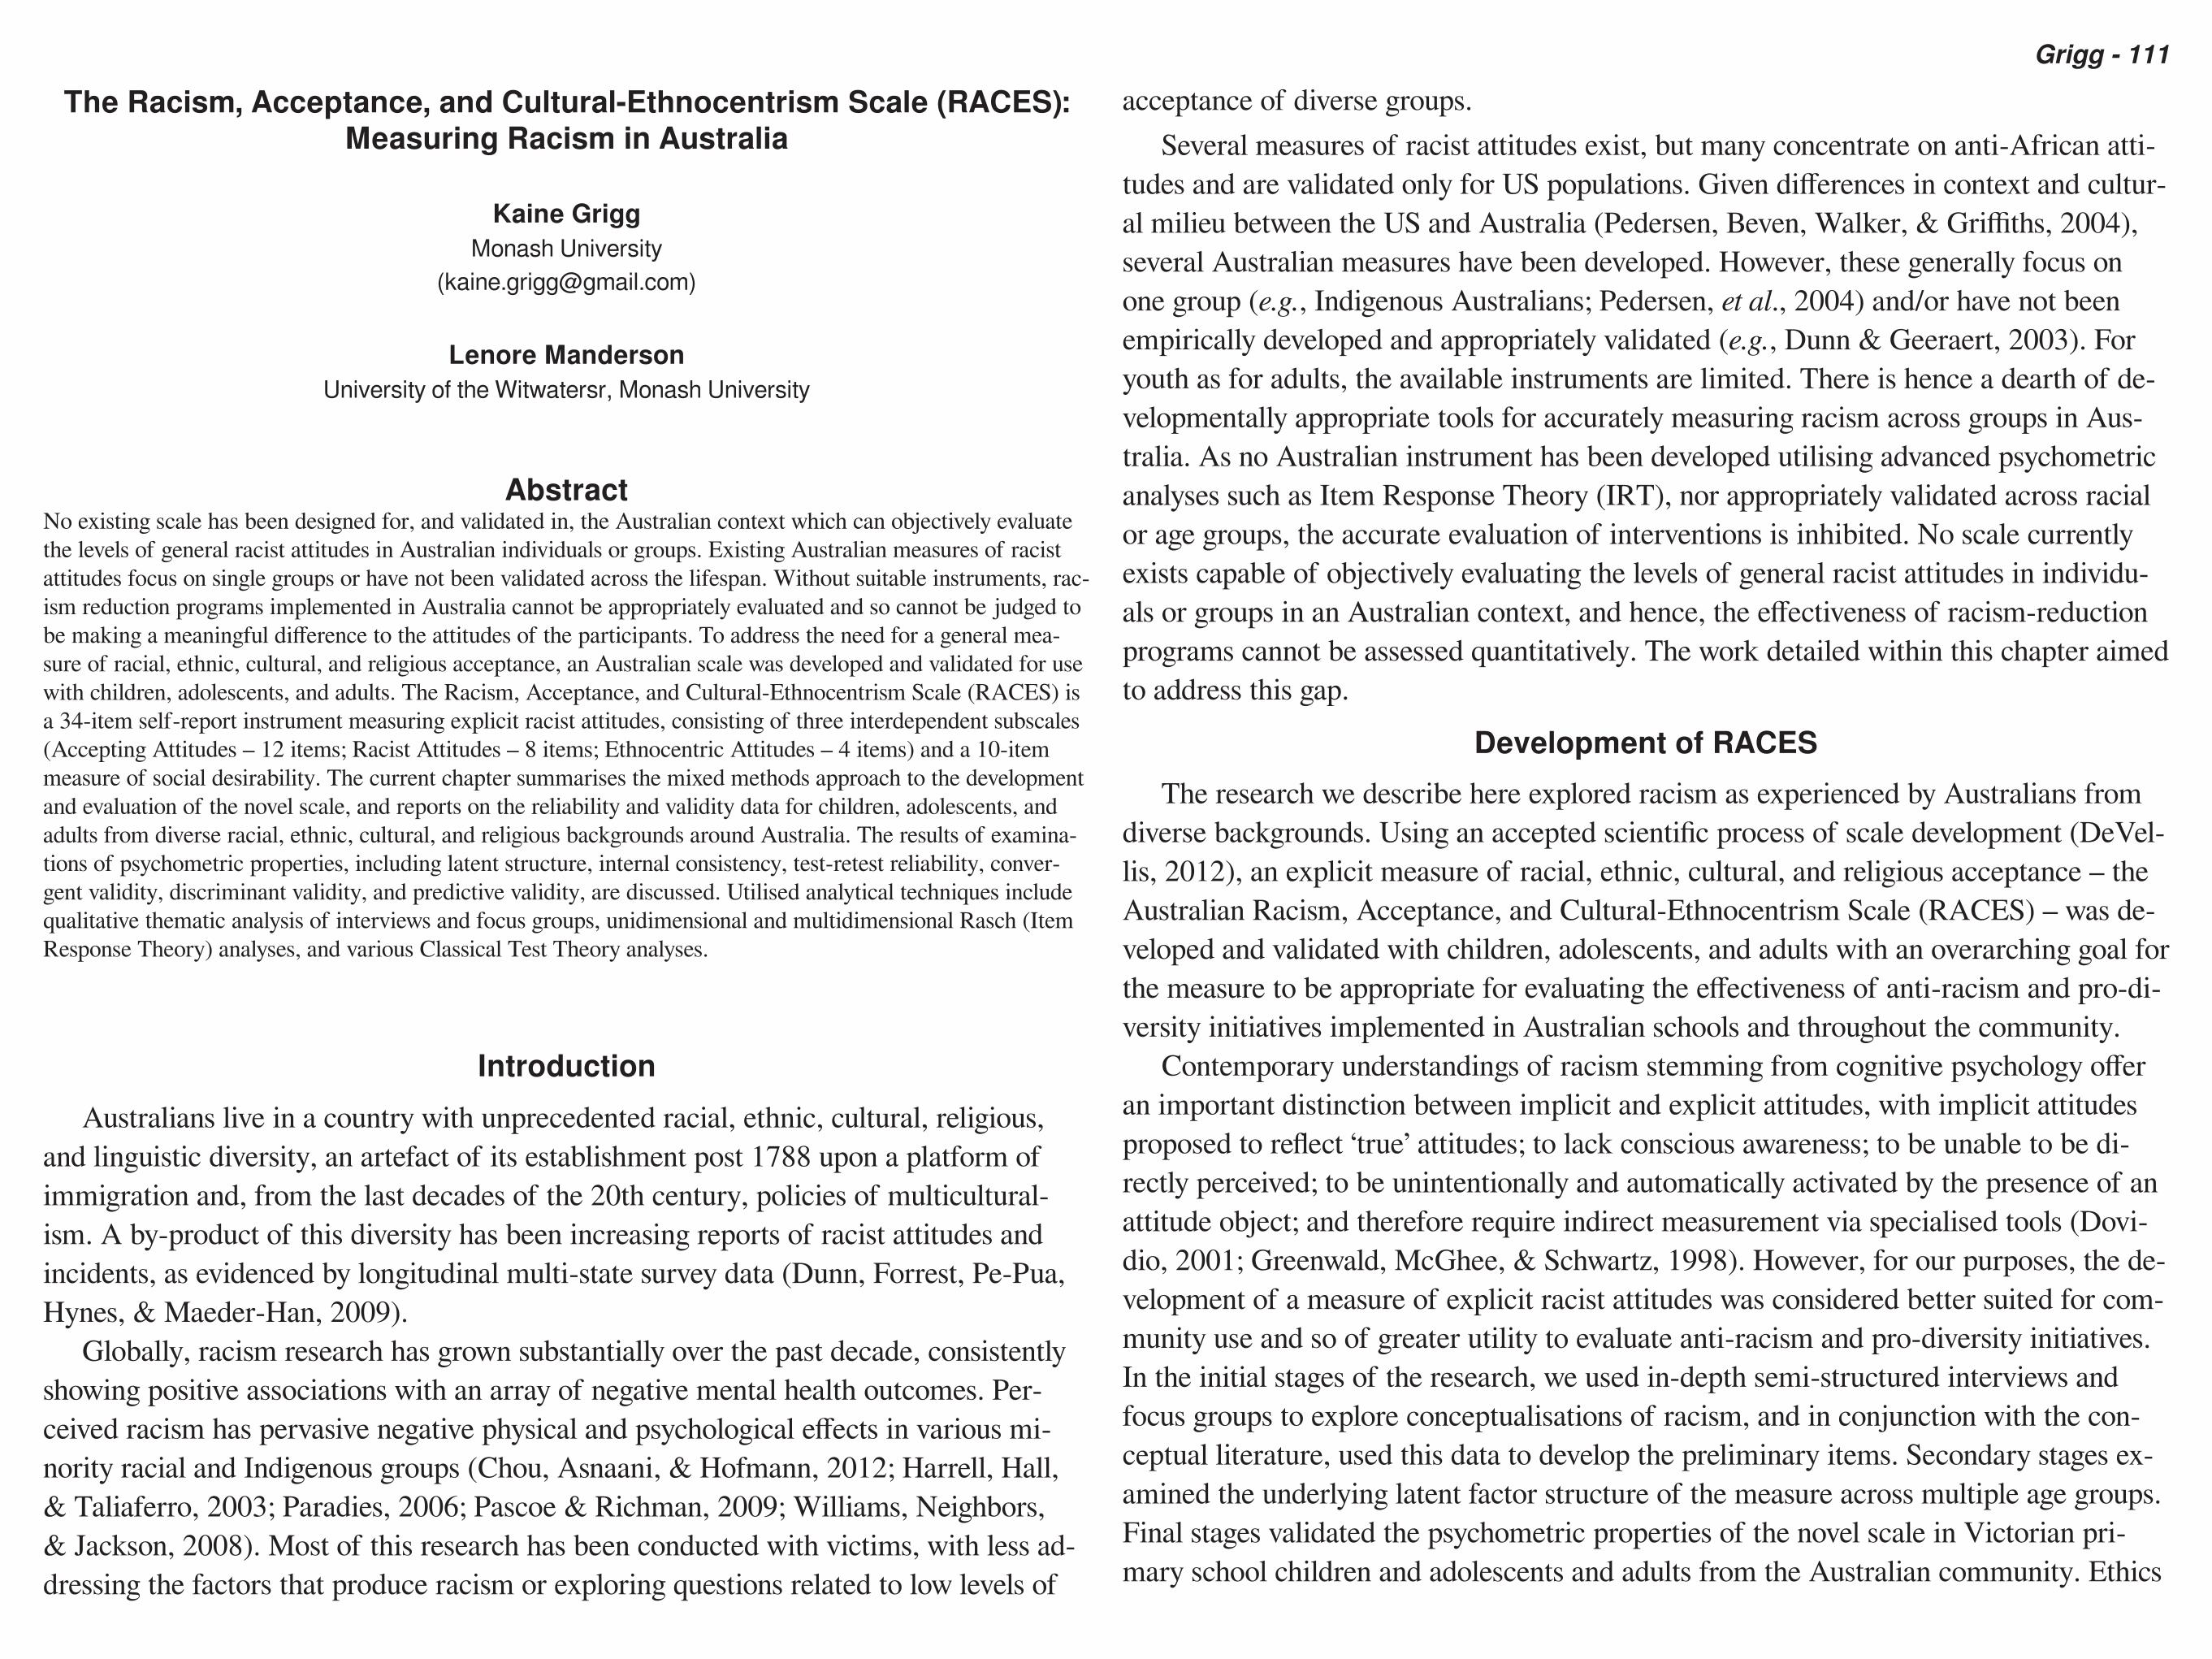
approval was provided by Monash Human Research Ethics Committee. Descriptive sta-tistics utilised throughout the research are provided in Table 1.Table 1Descriptive Statistics Split by Data Set
Note. Various participants did not provide complete demographic data.
Qualitative research was conducted from December 2011 to March 2012 on young Australian conceptualisations of, and their experiences with racism; the data was col-lected through the interviews and focus groups. Consequently, the items developed can be thought of as representing the multidimensional nature of contemporary racism in Australia, spanning a number of theoretical positions, including symbolic racism (Kind-er & Sears, 1981), modern racism (McConahay, 1983), aversive racism (Gaertner & Dovidio, 1977; Kovel, 1970), and more recently, subtle and blatant prejudice (Pettigrew & Meertens, 1995) and colour-blind racism (Neville, Lilly, Lee, Duran, & Browne, 2000).
The purpose of the final instrument was to inform anti-racism and pro-diversity ini-tiatives. Items were therefore designed to measure acceptance of difference and racism viewed along a continuum. An initial item pool of 420 statements was developed from
Grigg - 113
402 community individuals aged 15 years or older, recruited nationally via newspaper, radio, and online advertising. Responses were retrieved from an online survey database; four additional hard copy surveys were entered after online data collection ceased. Be-cause the data set for adults 21+ years failed to meet minimum statistical assumptions, only results for young people 15-20 years and Community data sets are presented.Principal Components Analysis
Data were examined using PCA to produce an initial empirical summary (Tabach-nick & Fidell, 2007). Oblimin rotation was performed with the Primary School data set to estimate the number of components, absence of multicollinearity, and factorabil-ity of the correlation matrices. Eleven components with initial Eigenvalues above one were extracted. None were internally consistent or well defined by the variables (highest Squared Multiple Correlation .24). Conversely, Communality values were adequate: the smallest was .53, above recommended minimum of .40 (Costello & Osborne, 2005). Sampling adequacy was acceptable: the Kaiser-Meyer-Olkin measure was .83, above recommended minimum of .60 (Tabachnick & Fidell, 2007), and Bartlett’s Test of Sphericity was significant (p<.001). Given these indicators, PCA appeared suitable with all 40 items. Inspection of the Scree Plot indicated the existence of between one to five components. Each of the first four factors explained more than 5% of the variance, con-sidered to be a cut off for useful factors (Polit & Beck, 2003), with explained variance of 20.90%, 8.91%, 6.13%, and 5.04% respectively.Exploratory Factor Analysis
An EFA was considered appropriate to perform additional analyses (Tabachnick & Fidell, 2007) and was conducted with each of one, two, three, and four factors. Solutions were examined using Oblimin rotations of the factor loading matrix. All cross-loading items above .32 and items with factor loadings less than .32 were removed (Tabachnick & Fidell, 2007). Items with Communalities below .20 were removed, rath-er than below .40, to enable CFA to confirm the underlying factor structure and Rasch analysis to re-confirm the underlying latent structure and additionally to remove incon-sistent items. The one factor solution appeared to be a poor fit, accounting for 19.03% of the variance after extraction. The two factor solution initially accounted for 26.27% (19.20% and 7.07%) and the final solution (17 and 7 items) 34.91% (26.57% and 8.35%) of variance. The three factor solution initially accounted for 30.99% (19.31%, 7.18%, and 4.50%) and the final solution (15, 8, and 4 items) 37.30% (24.16%, 7.82, and 5.33%) of variance. The four factor solution initially accounted for 34.65% (19.38%, 7.26%, 4.56, and 3.46%) and the final solution (15, 9, 6, and 4 items) 37.66% (20.65%, 7.99%, 5.06%, and 4.05%) of variance.
The three factor solution was preferred because of (1) variance added from the two to three factor solution, (2) minimal variance added from the three to four factor solu-
Table 2Preliminary Scale Item Theme Labels and Content
Refinement of RACESPrincipal Components Analyses (PCA), Exploratory Factor Analyses (EFA), and
Confirmatory Factor Analyses (CFA) were utilised to refine the initial 40-item RAC-ES drawing upon the Primary School, 15-20 years, and Community data sets outlined in Table 1. Primary school participants were 296 students enrolled in years five or six at six primary schools in a growth corridor in southeast Melbourne, Australia, recruited via participation in a pro-diversity and anti-racism initiative. Community participants were
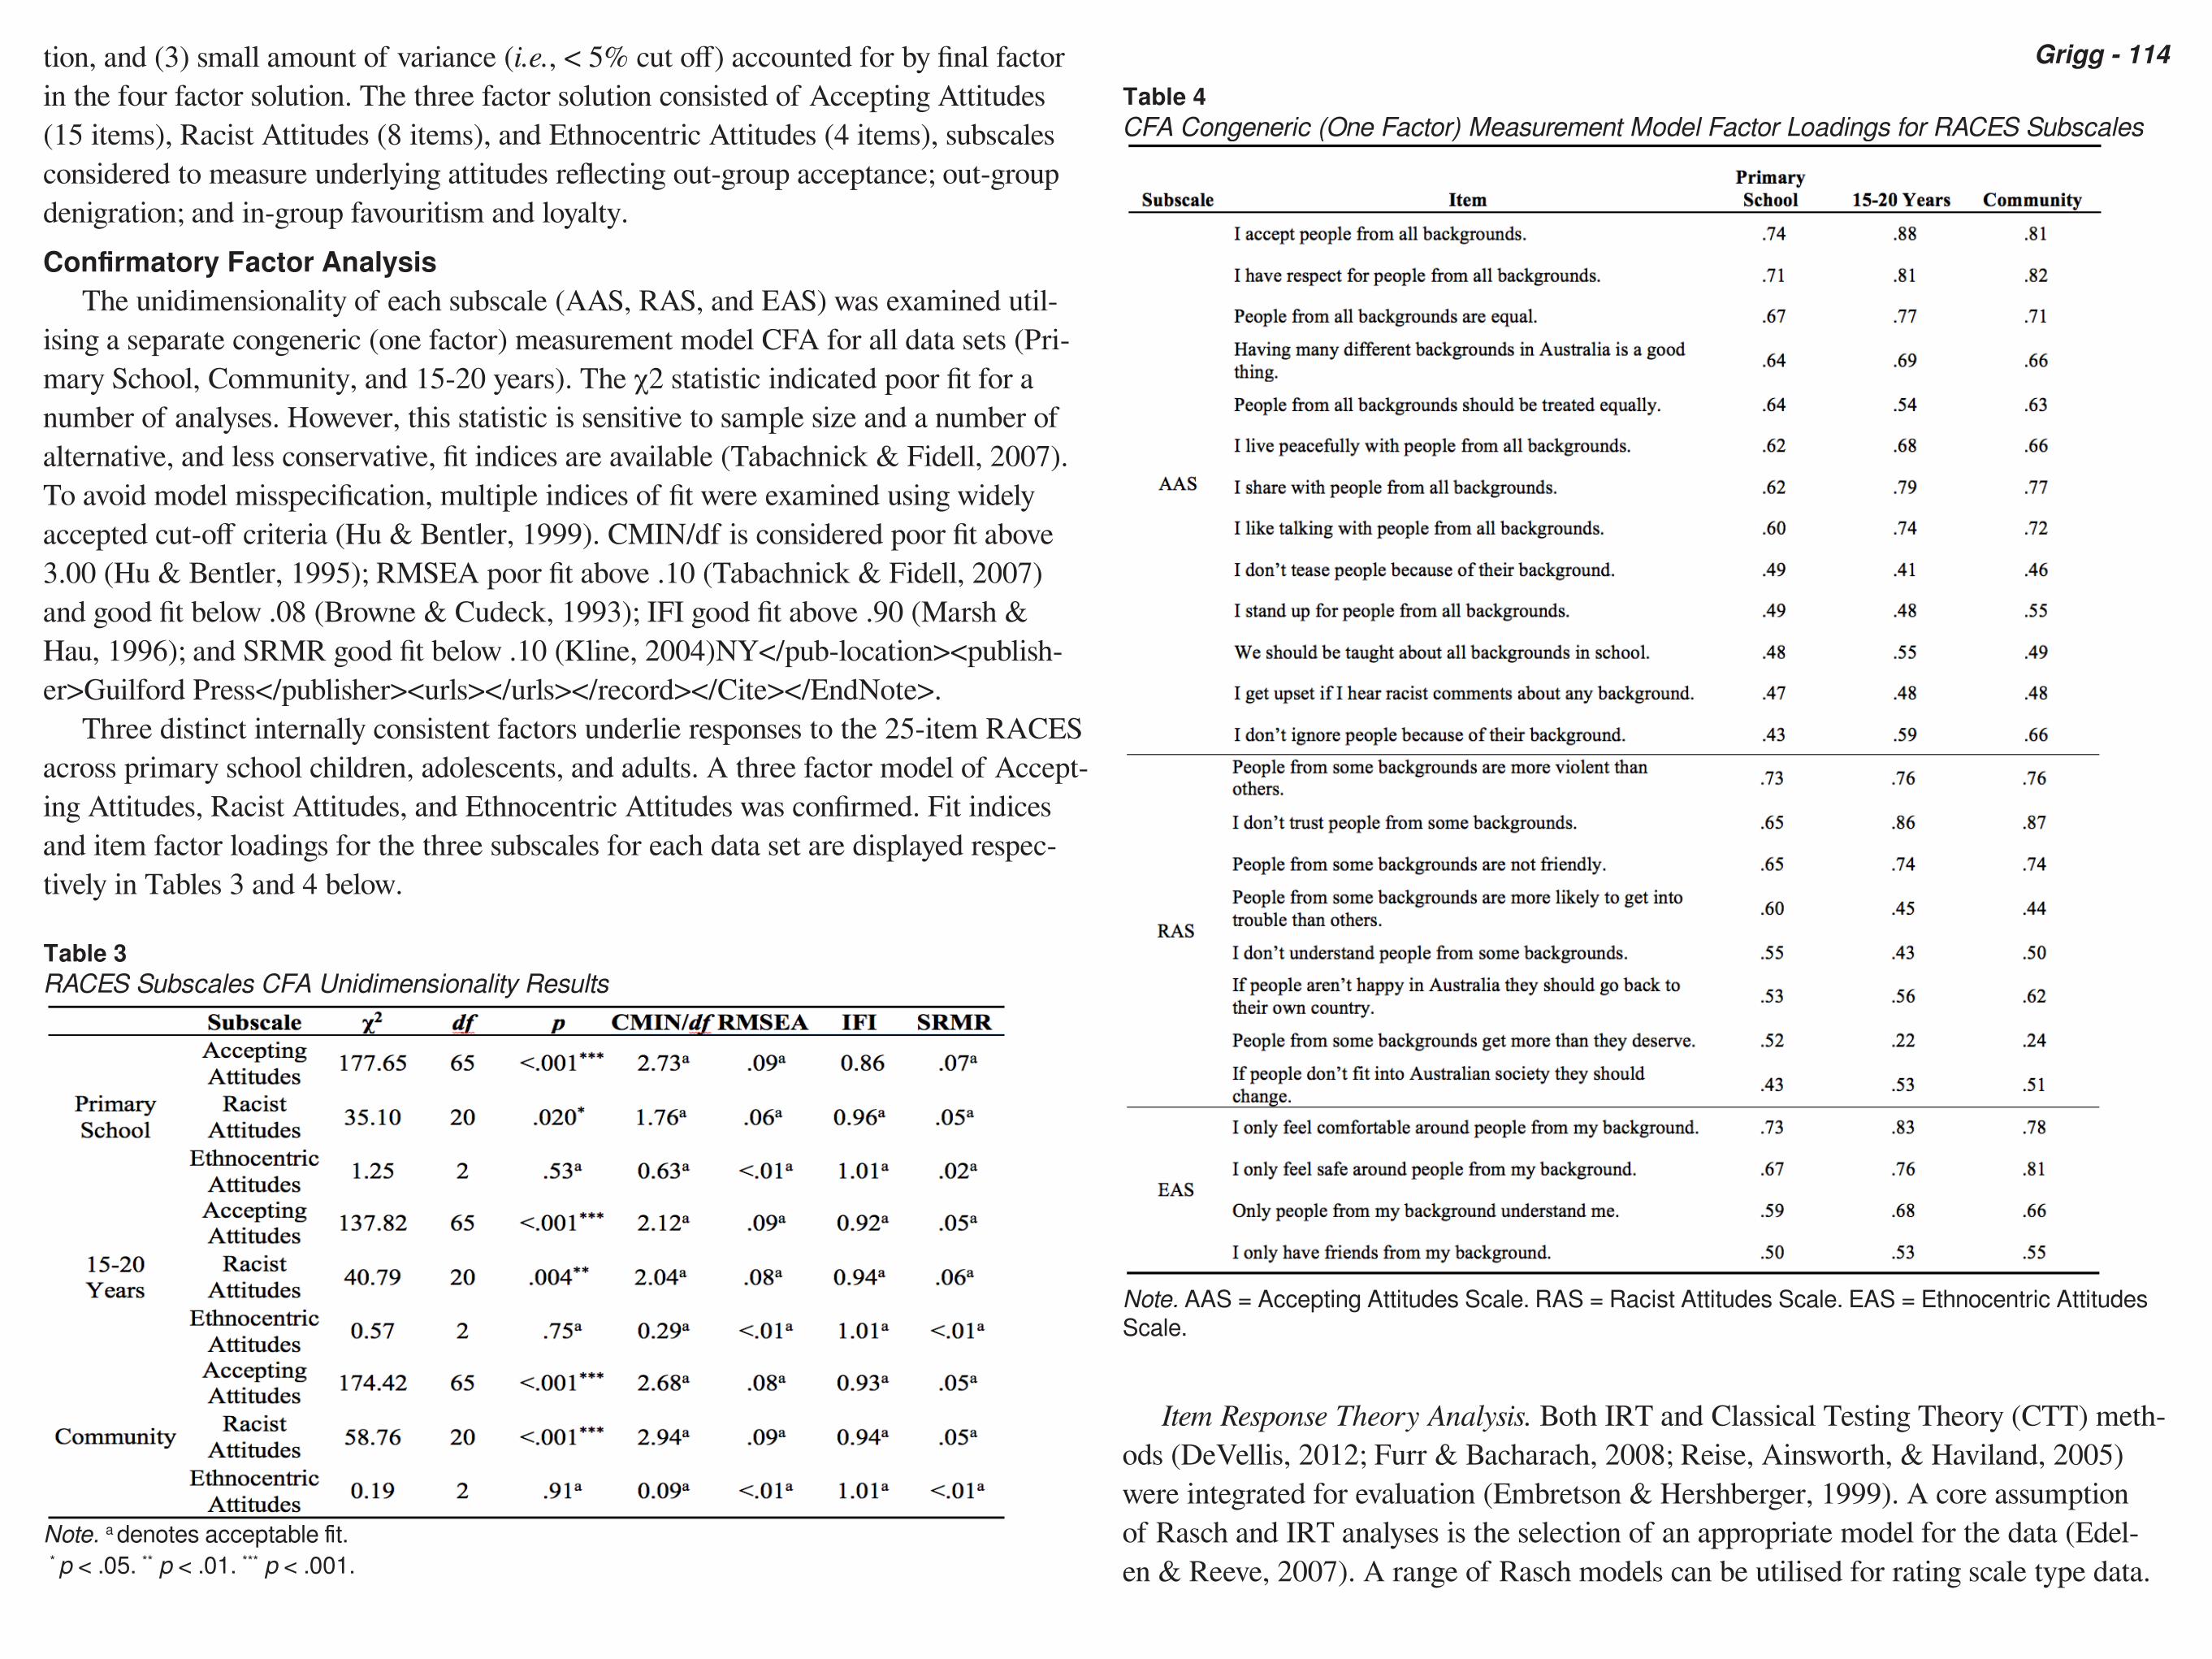
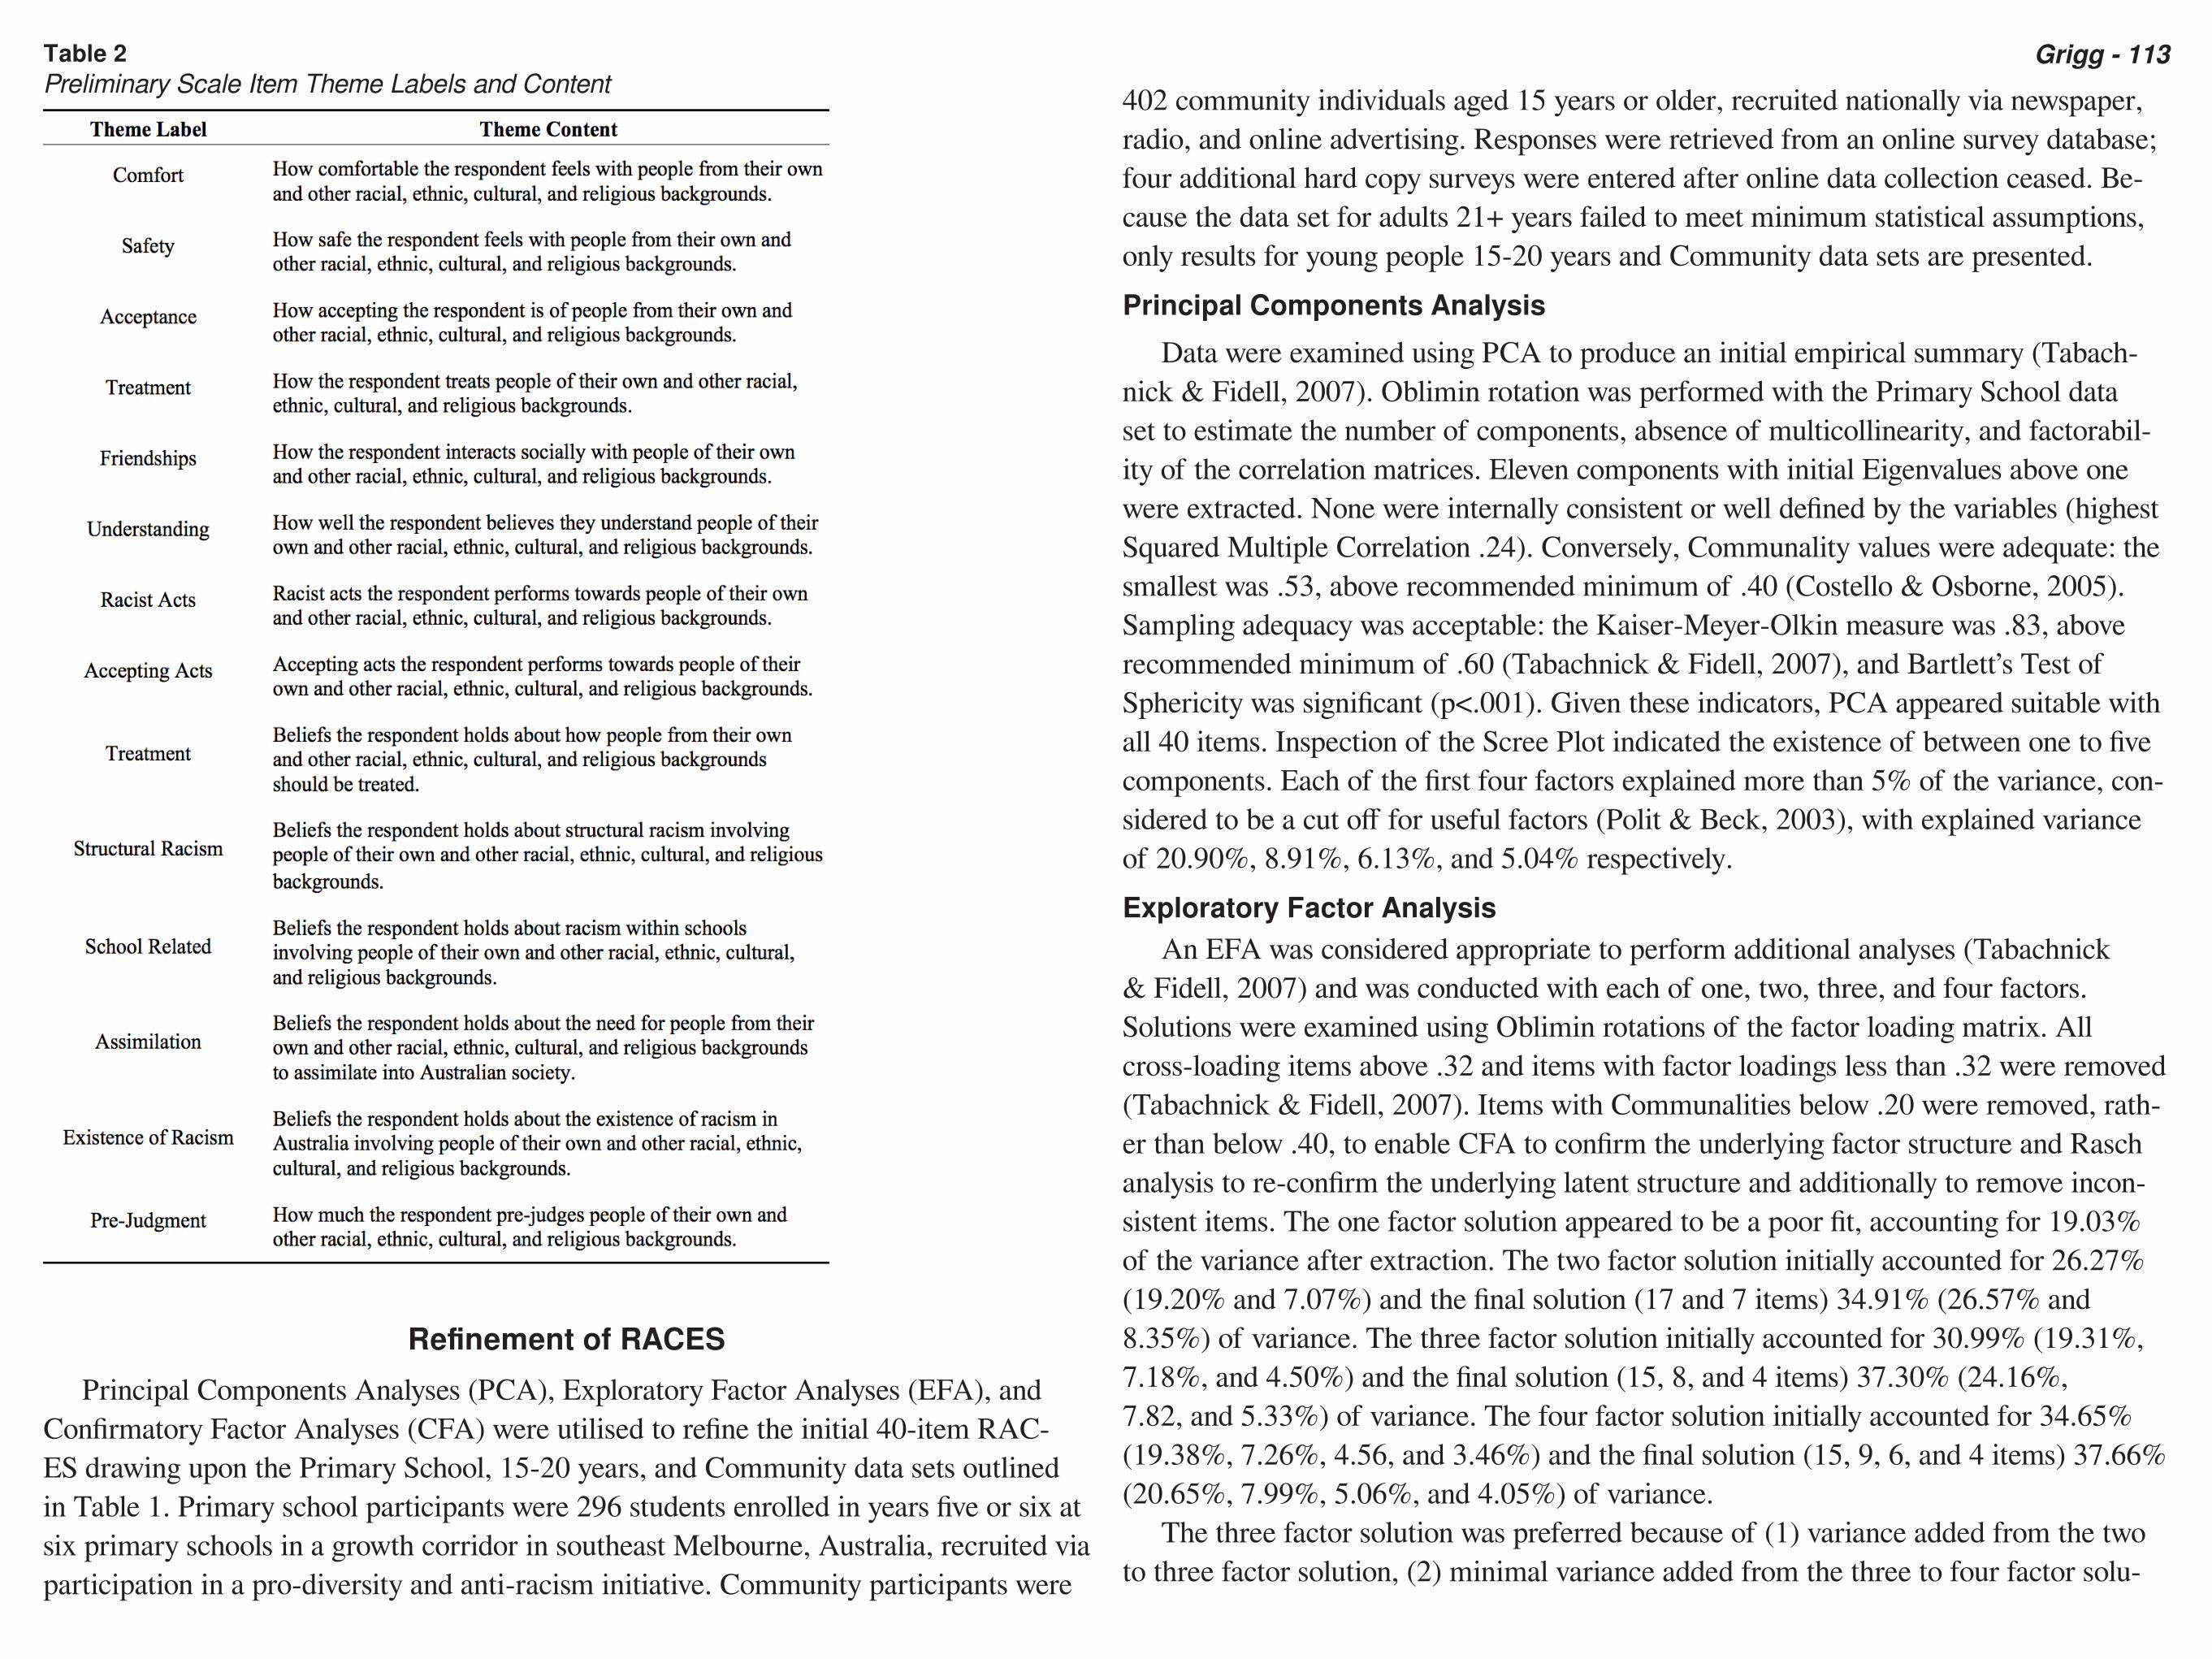
Grigg - 114Table 4CFA Congeneric (One Factor) Measurement Model Factor Loadings for RACES Subscales
Note. AAS = Accepting Attitudes Scale. RAS = Racist Attitudes Scale. EAS = Ethnocentric Attitudes Scale.
Item Response Theory Analysis. Both IRT and Classical Testing Theory (CTT) meth-ods (DeVellis, 2012; Furr & Bacharach, 2008; Reise, Ainsworth, & Haviland, 2005) were integrated for evaluation (Embretson & Hershberger, 1999). A core assumption of Rasch and IRT analyses is the selection of an appropriate model for the data (Edel-en & Reeve, 2007). A range of Rasch models can be utilised for rating scale type data.
tion, and (3) small amount of variance (i.e., < 5% cut off) accounted for by final factor in the four factor solution. The three factor solution consisted of Accepting Attitudes (15 items), Racist Attitudes (8 items), and Ethnocentric Attitudes (4 items), subscales considered to measure underlying attitudes reflecting out-group acceptance; out-group denigration; and in-group favouritism and loyalty.Confirmatory Factor Analysis
The unidimensionality of each subscale (AAS, RAS, and EAS) was examined util-ising a separate congeneric (one factor) measurement model CFA for all data sets (Pri-mary School, Community, and 15-20 years). The χ2 statistic indicated poor fit for a number of analyses. However, this statistic is sensitive to sample size and a number of alternative, and less conservative, fit indices are available (Tabachnick & Fidell, 2007). To avoid model misspecification, multiple indices of fit were examined using widely accepted cut-off criteria (Hu & Bentler, 1999). CMIN/df is considered poor fit above 3.00 (Hu & Bentler, 1995); RMSEA poor fit above .10 (Tabachnick & Fidell, 2007) and good fit below .08 (Browne & Cudeck, 1993); IFI good fit above .90 (Marsh & Hau, 1996); and SRMR good fit below .10 (Kline, 2004)NY</pub-location><publish-er>Guilford Press</publisher><urls></urls></record></Cite></EndNote>.
Three distinct internally consistent factors underlie responses to the 25-item RACES across primary school children, adolescents, and adults. A three factor model of Accept-ing Attitudes, Racist Attitudes, and Ethnocentric Attitudes was confirmed. Fit indices and item factor loadings for the three subscales for each data set are displayed respec-tively in Tables 3 and 4 below.
Table 3RACES Subscales CFA Unidimensionality Results
Note. a denotes acceptable fit. * p < .05. ** p < .01. *** p < .001.
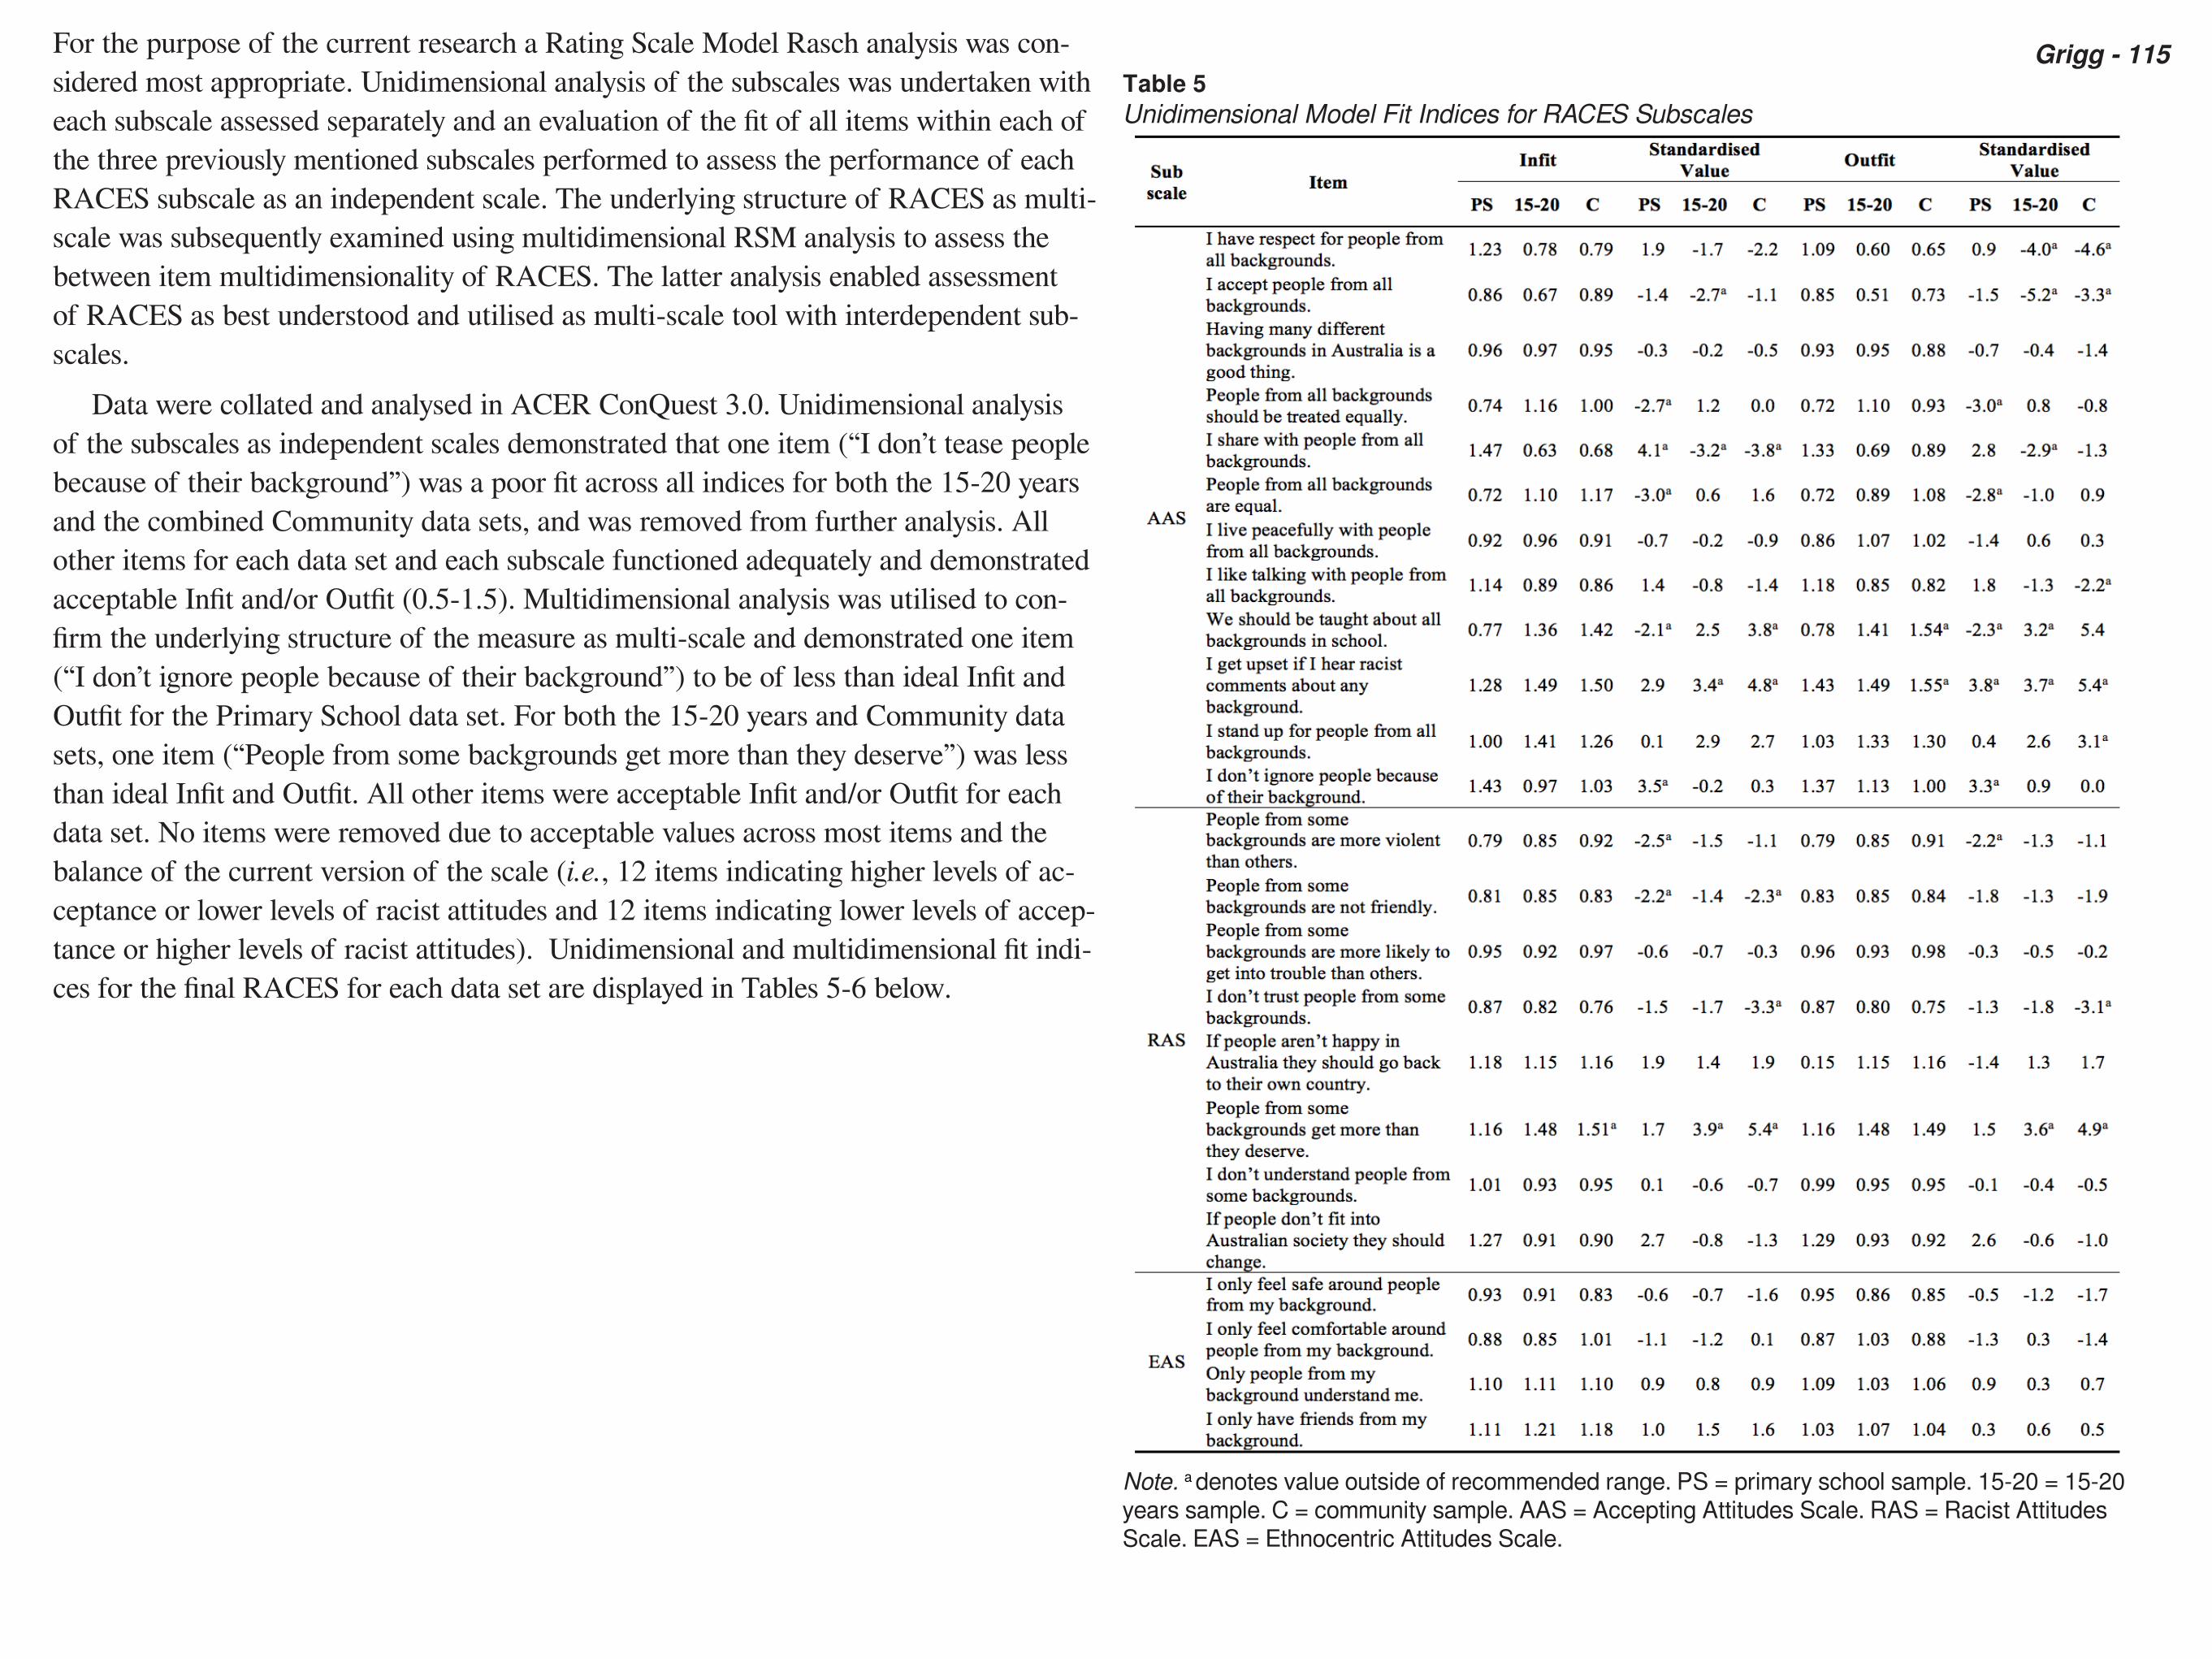
Grigg - 115Table 5Unidimensional Model Fit Indices for RACES Subscales
Note. a denotes value outside of recommended range. PS = primary school sample. 15-20 = 15-20 years sample. C = community sample. AAS = Accepting Attitudes Scale. RAS = Racist Attitudes Scale. EAS = Ethnocentric Attitudes Scale.
For the purpose of the current research a Rating Scale Model Rasch analysis was con-sidered most appropriate. Unidimensional analysis of the subscales was undertaken with each subscale assessed separately and an evaluation of the fit of all items within each of the three previously mentioned subscales performed to assess the performance of each RACES subscale as an independent scale. The underlying structure of RACES as multi-scale was subsequently examined using multidimensional RSM analysis to assess the between item multidimensionality of RACES. The latter analysis enabled assessment of RACES as best understood and utilised as multi-scale tool with interdependent sub-scales.
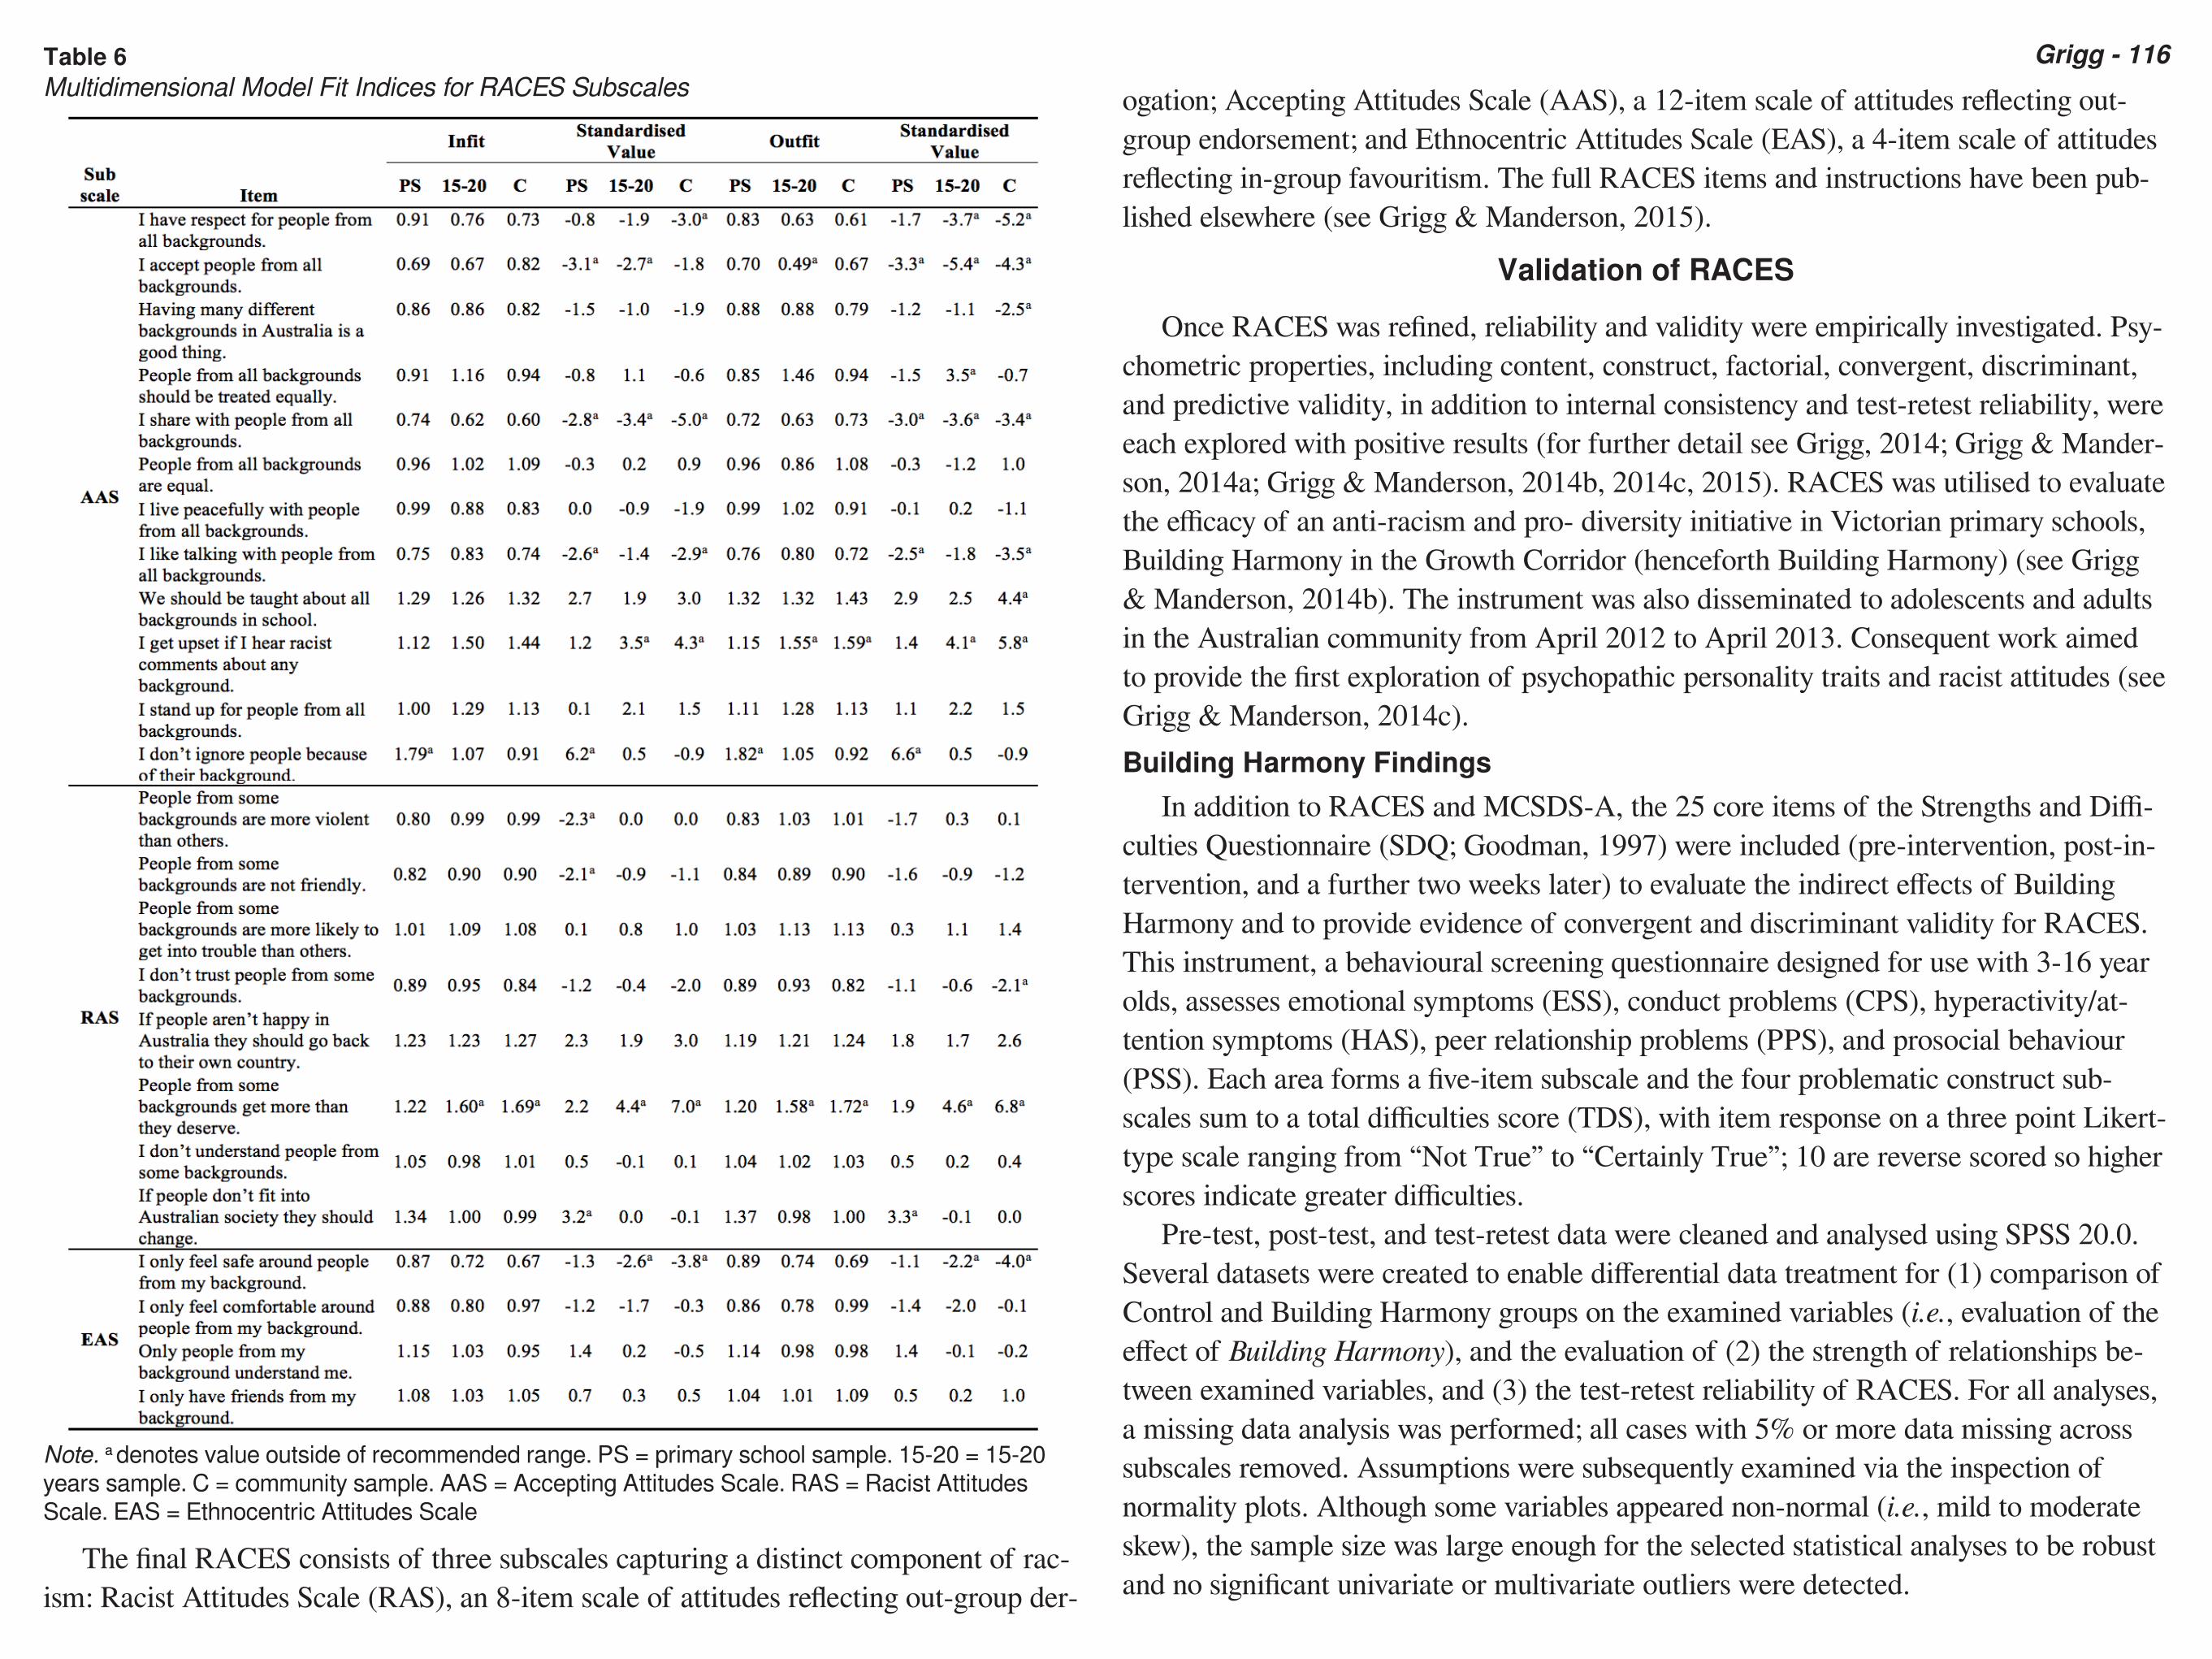
Data were collated and analysed in ACER ConQuest 3.0. Unidimensional analysis of the subscales as independent scales demonstrated that one item (“I don’t tease people because of their background”) was a poor fit across all indices for both the 15-20 years and the combined Community data sets, and was removed from further analysis. All other items for each data set and each subscale functioned adequately and demonstrated acceptable Infit and/or Outfit (0.5-1.5). Multidimensional analysis was utilised to con-firm the underlying structure of the measure as multi-scale and demonstrated one item (“I don’t ignore people because of their background”) to be of less than ideal Infit and Outfit for the Primary School data set. For both the 15-20 years and Community data sets, one item (“People from some backgrounds get more than they deserve”) was less than ideal Infit and Outfit. All other items were acceptable Infit and/or Outfit for each data set. No items were removed due to acceptable values across most items and the balance of the current version of the scale (i.e., 12 items indicating higher levels of ac-ceptance or lower levels of racist attitudes and 12 items indicating lower levels of accep-tance or higher levels of racist attitudes). Unidimensional and multidimensional fit indi-ces for the final RACES for each data set are displayed in Tables 5-6 below.
Grigg - 116
ogation; Accepting Attitudes Scale (AAS), a 12-item scale of attitudes reflecting out-group endorsement; and Ethnocentric Attitudes Scale (EAS), a 4-item scale of attitudes reflecting in-group favouritism. The full RACES items and instructions have been pub-lished elsewhere (see Grigg & Manderson, 2015).
Validation of RACES
Once RACES was refined, reliability and validity were empirically investigated. Psy-chometric properties, including content, construct, factorial, convergent, discriminant, and predictive validity, in addition to internal consistency and test-retest reliability, were each explored with positive results (for further detail see Grigg, 2014; Grigg & Mander-son, 2014a; Grigg & Manderson, 2014b, 2014c, 2015). RACES was utilised to evaluate the efficacy of an anti-racism and pro- diversity initiative in Victorian primary schools, Building Harmony in the Growth Corridor (henceforth Building Harmony) (see Grigg & Manderson, 2014b). The instrument was also disseminated to adolescents and adults in the Australian community from April 2012 to April 2013. Consequent work aimed to provide the first exploration of psychopathic personality traits and racist attitudes (see Grigg & Manderson, 2014c).Building Harmony Findings
In addition to RACES and MCSDS-A, the 25 core items of the Strengths and Diffi-culties Questionnaire (SDQ; Goodman, 1997) were included (pre-intervention, post-in-tervention, and a further two weeks later) to evaluate the indirect effects of Building Harmony and to provide evidence of convergent and discriminant validity for RACES. This instrument, a behavioural screening questionnaire designed for use with 3-16 year olds, assesses emotional symptoms (ESS), conduct problems (CPS), hyperactivity/at-tention symptoms (HAS), peer relationship problems (PPS), and prosocial behaviour (PSS). Each area forms a five-item subscale and the four problematic construct sub-scales sum to a total difficulties score (TDS), with item response on a three point Likert-type scale ranging from “Not True” to “Certainly True”; 10 are reverse scored so higher scores indicate greater difficulties.
Pre-test, post-test, and test-retest data were cleaned and analysed using SPSS 20.0. Several datasets were created to enable differential data treatment for (1) comparison of Control and Building Harmony groups on the examined variables (i.e., evaluation of the effect of Building Harmony), and the evaluation of (2) the strength of relationships be-tween examined variables, and (3) the test-retest reliability of RACES. For all analyses, a missing data analysis was performed; all cases with 5% or more data missing across subscales removed. Assumptions were subsequently examined via the inspection of normality plots. Although some variables appeared non-normal (i.e., mild to moderate skew), the sample size was large enough for the selected statistical analyses to be robust and no significant univariate or multivariate outliers were detected.
Table 6Multidimensional Model Fit Indices for RACES Subscales
Note. a denotes value outside of recommended range. PS = primary school sample. 15-20 = 15-20 years sample. C = community sample. AAS = Accepting Attitudes Scale. RAS = Racist Attitudes Scale. EAS = Ethnocentric Attitudes Scale
The final RACES consists of three subscales capturing a distinct component of rac-ism: Racist Attitudes Scale (RAS), an 8-item scale of attitudes reflecting out-group der-

Grigg - 117
ships between RACES and undesirable variables were expected. The inconsistent rela-tionship between the EAS and MCSDSA may be due to the limited length of the sub-scale (i.e., four items), and the lack of a significant relationship with the ESS and CPS to the inconsistent findings reported above. Overall however, the correlation findings support the construct, convergent, and discriminant validity of the RACES total scale, RACES subscales, and the MCSDS-A, with most relationships consistent and in the ex-pected direction.
Eleven paired-samples t-tests and Pearson correlations were conducted to assess the stability of RACES, SDQ, and MCSDS-A total scales and subscales (tabular results available upon request). The t-test results indicate that RACES and MCSDS-A total scales and subscales were of acceptable stability, as indicated by the lack of a statistical-ly significant difference between post- and test-retest scores. The correlation results sug-gest that RACES and MCSDS-A total scales were of acceptable stability (correlations above .70) (Nunnally, 1978). However, the EAS was of less than desirable stability, re-inforcing the importance of utilising the three RACES subscales interdependently, rath-er than as independent subscales.Community Sample Findings
In addition to RACES and MCSDS-A, the Dunn and Geeraert (2003) Racism Sur-vey (DG), a 10-item instrument designed to measure explicit racist attitudes in Austra-lia, was administered. Items were again responded to on a four point Likert-type scale with half reverse scored so higher scores indicate higher levels of racist attitudes. Al-though not validated through empirical research, this was the only other existing Aus-tralian measure of racist attitudes not specific to a single group and it has been utilised nationwide (Dunn, 2008). The Minnesota Temperament Inventory (MTI; Loney, Tay-lor, Butler, & Iacono, 2007), a 19-item research-based measure of adolescent and adult psychopathic personality traits, was also utilised. The instrument measures lack of em-pathy and remorse, shallow emotions, egocentricity, and deceptiveness, and can be con-sidered a pure measure of psychopathic personality traits. Items are responded to on a four point Likert-type scale ranging from “This is not at all true of me” to “This is very true of me”; higher scores on all items indicate higher levels of psychopathic traits. Only the 13 meaningful items, as suggested by Loney et al. (2007) and utilised in subsequent research (e.g., Neumann, Wampler, Taylor, Blonigen, & Iacono, 2011)2011, were used in this study.
SPSS 20.0 was utilised to clean and analyse the data. A missing data analysis was performed and all cases with 5% or more data missing across subscales were removed. Separate regression analyses for each of the alternate scales (RACES, MCSDS-A, DG, and MTI) were used to deal with remaining missing data. Data were then recombined into a single data set to maximise the sample size for analysis. Assumptions were exam-ined via the inspection of normality plots; although some variables appeared non-nor-
A series of 2x2 ANOVAs with Group (Building Harmony Group and Control Group) and Assessment (Pre-Test and Post-Test) were conducted to assess the effect of the intervention on RACES, SDQ, and MCSDS-A total scale and subscale scores (tabular results available upon request). Due to the significant increase in MCSDS-A scores for the Control Group from pre- to post-test, a series of 2x2 ANCOVAs were conducted with the same factors as above and with MCSDS-A as a covariate to assess the effect of the intervention on RACES and SDQ total scale and subscale scores whilst controlling for the effect of socially desirable responding (tabular results published else-where; Grigg & Manderson, 2014b).
While some effects were trivial, others entered the moderate to large range, with lower bound 95% CIs in the small to moderate range (Cohen, 1988). If focus is targeted only upon the non-trivial effects, significant meaning can be drawn from the data. Re-sults provide tenuous efficacy evidence for the Building Harmony initiative in enhancing racial attitudes and social, emotional, and behavioural strengths in maintaining levels of racial, ethnic, cultural, and religious acceptance (see Table 7 for pre-test correlation re-sults; other assessment period correlation results available upon request). Conversely, across groups and assessment periods, there was a significant negative relationship with the TDS, HAS, and CPS, an inconsistent relationship between the overall RACES and the PPS, and no significant relationship between the overall RACES and the ESS across either group or assessment period.
Table 7Correlation Analyses for Pre-Test Data
Note. RACES = Racism, Acceptance, and Cultural-Ethnocentrism Scale; AAS = Accepting Atti-tudes Scale; RAS = Racist Attitudes Scale; EAS = Ethnocentric Attitudes Scale; PSS = SDQ Proso-cial Scale; HAS = SDQ Hyperactivity Scale; ESS = SDQ Emotional Symptoms Scale; CPS = SDQ Conduct Problems Scale; PPS = SDQ Peer Problems Scale; TDS = SDQ Total Difficulties score; MCSDS-A = Marlowe Crowne Social Desirability Scale Australian; BH = Building Harmony Group; CG = Control Group; TS = Total Sample.* p < .05. ** p < .01. *** p < .001.
Positive relationships between RACES and desirable variables and negative relation-
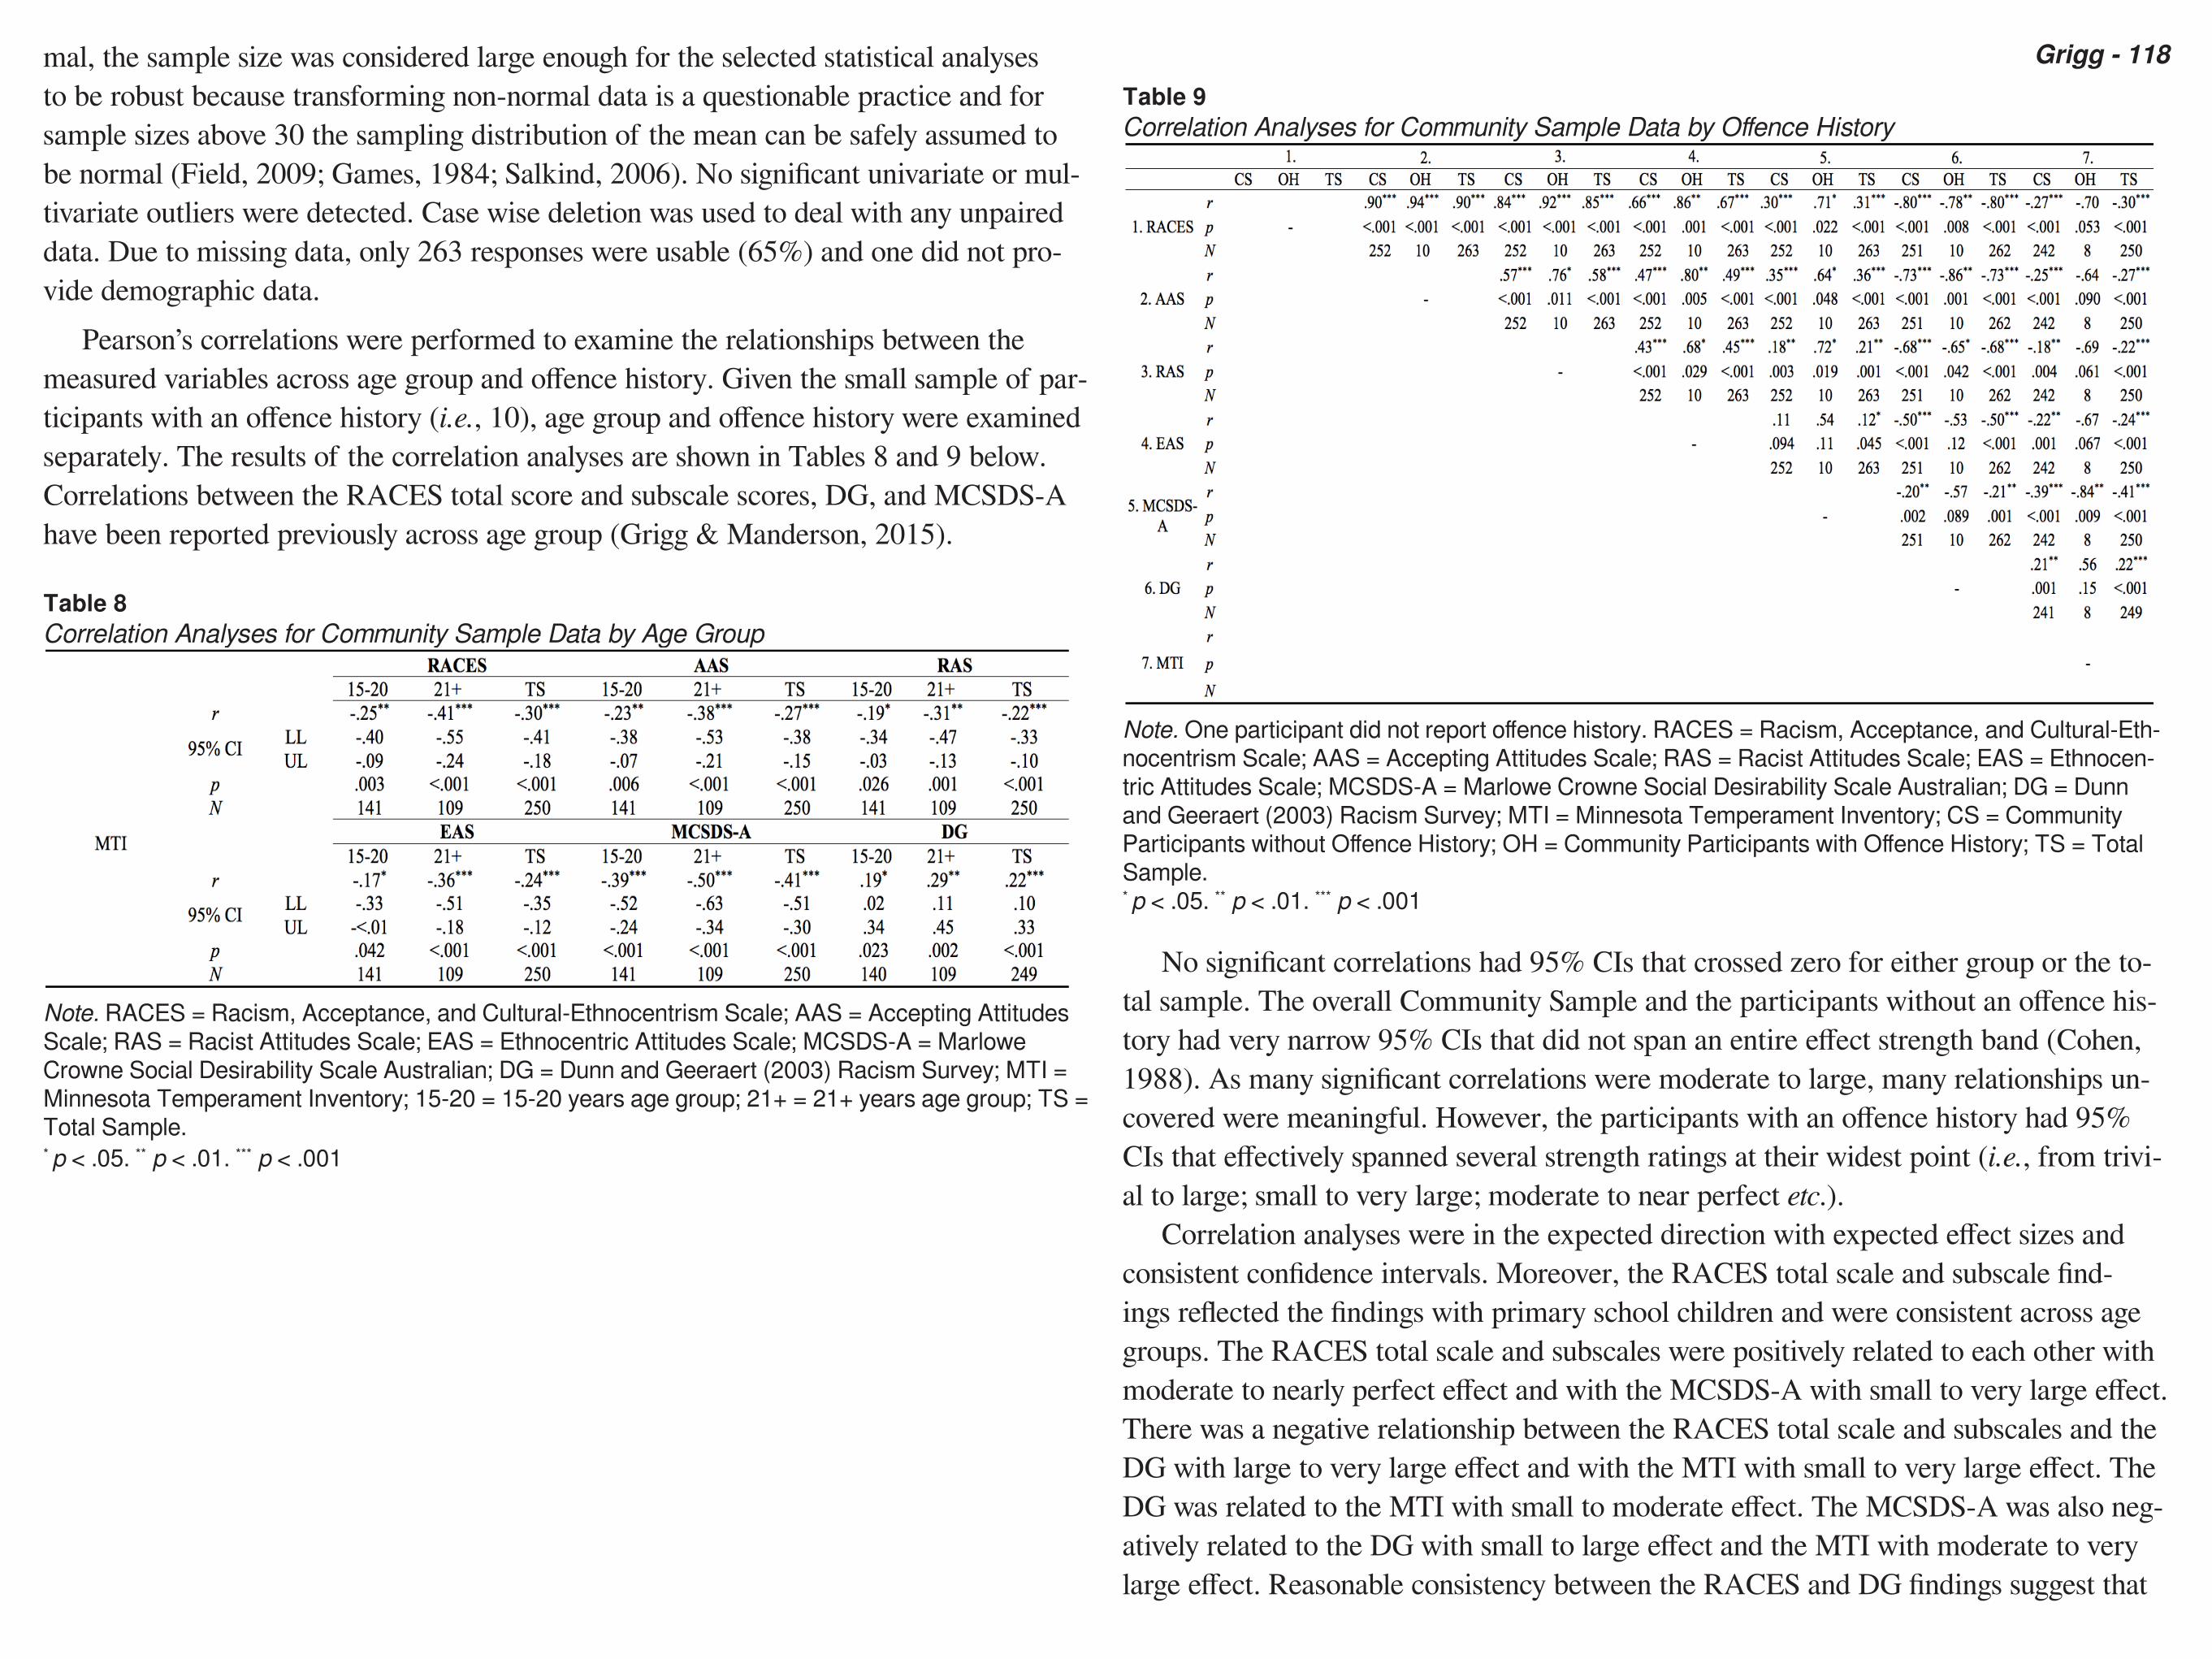
Grigg - 118Table 9Correlation Analyses for Community Sample Data by Offence History
Note. One participant did not report offence history. RACES = Racism, Acceptance, and Cultural-Eth-nocentrism Scale; AAS = Accepting Attitudes Scale; RAS = Racist Attitudes Scale; EAS = Ethnocen-tric Attitudes Scale; MCSDS-A = Marlowe Crowne Social Desirability Scale Australian; DG = Dunn and Geeraert (2003) Racism Survey; MTI = Minnesota Temperament Inventory; CS = Community Participants without Offence History; OH = Community Participants with Offence History; TS = Total Sample.* p < .05. ** p < .01. *** p < .001
No significant correlations had 95% CIs that crossed zero for either group or the to-tal sample. The overall Community Sample and the participants without an offence his-tory had very narrow 95% CIs that did not span an entire effect strength band (Cohen, 1988). As many significant correlations were moderate to large, many relationships un-covered were meaningful. However, the participants with an offence history had 95% CIs that effectively spanned several strength ratings at their widest point (i.e., from trivi-al to large; small to very large; moderate to near perfect etc.).
Correlation analyses were in the expected direction with expected effect sizes and consistent confidence intervals. Moreover, the RACES total scale and subscale find-ings reflected the findings with primary school children and were consistent across age groups. The RACES total scale and subscales were positively related to each other with moderate to nearly perfect effect and with the MCSDS-A with small to very large effect. There was a negative relationship between the RACES total scale and subscales and the DG with large to very large effect and with the MTI with small to very large effect. The DG was related to the MTI with small to moderate effect. The MCSDS-A was also neg-atively related to the DG with small to large effect and the MTI with moderate to very large effect. Reasonable consistency between the RACES and DG findings suggest that
mal, the sample size was considered large enough for the selected statistical analyses to be robust because transforming non-normal data is a questionable practice and for sample sizes above 30 the sampling distribution of the mean can be safely assumed to be normal (Field, 2009; Games, 1984; Salkind, 2006). No significant univariate or mul-tivariate outliers were detected. Case wise deletion was used to deal with any unpaired data. Due to missing data, only 263 responses were usable (65%) and one did not pro-vide demographic data.
Pearson’s correlations were performed to examine the relationships between the measured variables across age group and offence history. Given the small sample of par-ticipants with an offence history (i.e., 10), age group and offence history were examined separately. The results of the correlation analyses are shown in Tables 8 and 9 below. Correlations between the RACES total score and subscale scores, DG, and MCSDS-A have been reported previously across age group (Grigg & Manderson, 2015).
Table 8Correlation Analyses for Community Sample Data by Age Group
Note. RACES = Racism, Acceptance, and Cultural-Ethnocentrism Scale; AAS = Accepting Attitudes Scale; RAS = Racist Attitudes Scale; EAS = Ethnocentric Attitudes Scale; MCSDS-A = Marlowe Crowne Social Desirability Scale Australian; DG = Dunn and Geeraert (2003) Racism Survey; MTI = Minnesota Temperament Inventory; 15-20 = 15-20 years age group; 21+ = 21+ years age group; TS = Total Sample.* p < .05. ** p < .01. *** p < .001
Grigg - 119
other tools developed solely for either children or adults. By utilising multiple samples of diverse racial, ethnic, cultural, religious and socioeconomic demographics in the val-idation process, the generalisability of RACES was enhanced, again distinct to many measures which rely on major-ity group convenience sampling. Finally, the measure was assessed and refined using both CTT and IRT, giving greater confidence in its factori-al and construct validity, contrasting again with most other scales which rely solely on CTT.
Overall, the final measure is a robust and empirically constructed and validated in-stru-ment. Strong validity evidence suggests that the tool is appropriate for dissemina-tion to the sci-entific community and for utilisation in schools and municipalities around Australia. RACES can be utilised to evaluate the effectiveness of racism-reduction and pro-diversity programs by assessing the racial, ethnic, cultural, and reli-gious acceptance of individuals prior to, and af-ter, implementation of intervention strategies. The evalua-tion of such programs would provide a strong evidence base for initiatives, ensuring that more focused and valuable rac-ism-reduction programs can be implemented and com-munity levels of racism within Austral-ia may be subsequently reduced. RACES would be especially useful in initiatives designed to address racism in schools, due to its devel-op-ment stages being undertaken with youth.
The instrument is the first Australian meas-ure of general racist attitudes towards all racial, ethnic, cultural, and religious groups to be em-pirically validated across the lifes-pan. Due to its advantages over existing tools, numerous uses are conceivable. RAC-ES can be utilised to: a) evaluate the relationship between racism and other variables, b) track changes in racist atti-tudes over time, c) compare the racist attitudes of two groups, and d) evaluate the effect of an-ti-racism or pro-diversity initiatives.
Limitations and Future ResearchDespite the promising results, some limita-tions need to be acknowledged. Although
a na-tion-wide sample was sought, the final sample was predominantly in Victoria, lim-iting the generalisability of the results. Minimum sample sizes for factor analysis and other analyses were met, but data from larger samples would en-hance confidence in the results. Strong con-sistency was found across age groups, but results were based on an unbalanced overall scale (i.e., 12, 8, and 4 items), which may bias findings utilising the total scale score. Future research therefore is needed to confirm the psychometric prop-erties of the new measure in other contexts and populations prior to its wide dissemina-tion.
ConclusionRacism is a significant challenge in contem-porary Australia. In response, various
interven-tions have aimed to reduce racism and increase acceptance of diversity, but re-searchers are una-ble to determine their effectiveness and efficacy because standardised,
greater levels of psychopathic traits are related to lower levels of acceptance and higher levels of racist attitudes. The consistency of the MCSDS-A findings across both mea-sures of racist attitudes and the MTI indicate that each of the three instruments utilised may be impacted by socially desirable re-sponding.
Research SummaryThe overarching aim of this project was to develop and validate an attitudinal mea-
sure of racial, ethnic, cultural, and religious acceptance for use as a proxy to quantify racist attitudes. The end goal was to develop an instrument to be employed in commu-nity-wide anti-racism and pro-diversity initiatives, to assist in evaluating and improving the effectiveness of such enter-prises, and so to contribute to programs to re-duce rac-ism and increase acceptance of differ-ence throughout Australia.
The study results demonstrated the robust re-liability and validity of RACES as a measure of racist attitudes in the Australian context, con-firming the utility of the in-strument’s thorough construction process and robust empirical eval-uation. It is strongly supported due to its thor-ough construction process, as based on recom-mended scale development guidelines. The scale underwent vigorous empirical evaluation, which es-tablished its robustness, verification of con-tent, factorial, construct, convergent, and dis-criminant validity, and internal consistency and test-retest reliability.
The outcomes of PCA, EFA, CFA, and Rasch analyses provide compelling sup-port for the overall factorial and construct validity of the 24-item RACES across pri-mary school children, adolescents, and adults. Additional CTT anal-yses further sup-port the reliability and validity of the tool. Results indicate that the RACES is a reliable three-dimensional scale of Accepting Attitudes (12 items), Racist Attitudes (8 items), and Ethnocentric Attitudes (4 items), each a valid scale independently, but more useful when utilised interdependently. RACES demonstrated expected relationships with so-cial, emotional, and behavioural strengths and difficulties, so-cially desirable responding, psychopathic per-sonality traits, and an existing survey of racist attitudes; was able to discriminate between two distinct groups; and was shown to be internally consistent and temporally stable. The final in-strument also included a 10-item shortened Australian adaptation of the Marlowe-Crowne Social Desirability Scale (MCSDS-A) to assess so-cially desirable responding, which was both reliable and valid.
The instrument has various clear strengths and advantages over existing tools. The item content was based on a literature review and qualitative data on lived experiences of racism. This development phase ensured that the items reflected understandings and conceptualisations from real people, in contrast with other measures that draw on sec-ondary data, or derive from pre-existing instruments. The final scale utilises an in-built social desirability measure, enabling the evaluation of participant responses and moni-toring of bias. Most tools fail to in-clude similar methodological checks, so the re-sults of various prior studies may not reflect the true attitudes of participants. RACES has also proven reliable and valid across children, ado-lescents, and adults, in contrast with
Grigg - 120
Field, A. (2009). Discovering statistics using SPSS. Thou-sand Oaks, CA: SAGE.Fischer, D. G., & Fick, C. (1993). Measuring social desirabil-ity: Short forms of the Marlowe-
Crowne Social Desirability Scale. Educational and Psychological Measurement, 53(2), 417-424. doi: 10.1177/0013164493053002011
Furr, R. M., & Bacharach, V. R. (2008). Psychometrics: An introduction. Thousand Oaks, CA: SAGE.Gaertner, S. L., & Dovidio, J. F. (1977). The subtlety of White racism, arousal, and helping behavior. Journal
of Personality and Social Psychology, 35(10), 691-707. doi: 10.1037//0022-3514.35.10.691Games, P. (1984). Data transformations, power, and skew: A rebuttal to Levine and Dunlap. Psychological
Bulletin, 95(2), 345-347. Goodman, R. (1997). The Strengths and Difficulties Ques-tionnaire: A research note. Journal of Child
Psychology and Psychiatry, 38, 581-586. doi: 10.1111/j.1469-7610.1997.tb01545.xGreenwald, A. G., McGhee, D., & Schwartz, J. (1998). Measuring individual differences in implicit cognition:
An implicit association test. Journal of Personality and Social Psychology, 74(6), 1464-1480. Grigg, K. (2014). Development and validation of the Aus-tralian Racism, Acceptance, and Cultural-
Ethnocentrism Scale (RACES): Measuring racism in Australia (Doctoral dissertation). Retrieved from http://arrow.monash.edu.au/vital/access/manager/Repository/monash:130948
Grigg, K., & Manderson, L. (2014a). The Australian Racism, Acceptance, and Cultural-Ethnocentrism Scale (RACES): Item Response Theory findings. Manuscript submitted for publication.
Grigg, K., & Manderson, L. (2014b). Building Harmony: Measuring and reducing racism in Australian schools. The Australian Community Psychologist, 26(2), 68-89.
Grigg, K., & Manderson, L. (2014c). Is there a relationship between psychopathic traits and racism? Current Psychology, Advanced online publication. doi: 10.1007/s12144-014-9283-9
Grigg, K., & Manderson, L. (2015). Developing the Austral-ian Racism, Acceptance, and Cultural-Ethnocentrism Scale (RACES). The Australian Developmental and Educational Psychologist, Advanced online publication. doi: 10.1017/edp.2015.7
Grigg, K., & Manderson, L. (in press). “Just a joke”: Young Australian understandings of racism. International Journal of Intercultural Relations.
Harrell, J., Hall, S., & Taliaferro, J. (2003). Physiological re-sponses to racism and discrimination: An assessment of the evidence. American Journal of Public Health, 93(2), 243-248. Retrieved from http://ajph.aphapublications.org/
Hu, L.-T., & Bentler, P. M. (1995). Evaluating model fit. In R. H. Hoyle (Ed.), Structural equation modeling: Concepts, issues, and applications. Thousand Oaks, CA: SAGE.
Hu, L.-T., & Bentler, P. M. (1999). Cutoff criteria for fit in-dexes in covariance structure analysis: Conventional criteria versus new alternatives. Structural Equation Modeling: A Multidisciplinary Journal, 6(1), 1-55. doi: 10.1080/10705519909540118
Kinder, D. R., & Sears, D. O. (1981). Prejudice and politics: Symbolic racism versus racial threats to the good life. Journal of Personality and Social Psychology, 40(3), 414-431. doi: 10.1037//0022-3514.40.3.414
Kline, R. B. (2004). Principles and practices of structural equation modeling (2nd ed.). New York, NY: Guilford Press.
Kovel, J. (1970). White racism: A psychohistory. New York, NY: Pantheon Books.Loewenthal, K. M. (2001). An introduction to psychological tests and scales (2nd ed.). London, U.K.: Psychology
Press.Loney, B. R., Taylor, J., Butler, M. A., & Iacono, W. G. (2007). Adolescent psychopathy features: 6-Year
temporal stability and the prediction of externalizing symptoms dur-ing the transition to adulthood. Aggressive Behavior, 33(3), 242-252. doi: 10.1002/ab.20184
Marsh, H. W., & Hau, K. T. (1996). Assessing goodness of fit: Is parsimony always desirable? The Journal of Experi-mental Education, 64, 364-390. Retrieved from http://www.jstor.org/stable/20152499
appropriately developed, and robustly validated measures of racism do not exist. The surveys presently utilised in Aus-tralia derive from US scales, are specific to sin-gle ra-cial or age groups, or have not undergone rigorous validation. Current instruments are therefore problematic for addressing racism in Australia. The present project aspired to address this issue to inform developmentally targeted racism-reduction programs. As indicated above, it was crucial to identify what community indi-viduals believed char-acterise racism. This led to the development of a preliminary survey, in-strument re-finement, and empirical validation. Multiple methods and various samples con-firmed the robust nature of scale and its relia-bility and validity for children, adolescents, and adults throughout Australia. Although confir-mation of psychometric properties is re-quired in additional samples, it is hoped that RACES can be employed to assist with the evaluation, and consequent targeted improvement, of innovative racism reduction and pro-diversity interventions for populations across the lifespan. Such ap-praisal would provide a strong evidence base for initiatives to accordingly reduce community levels of racism throughout Australia.Author note
The research on which this chapter is based was conducted as a component of the degree of Doctor of Psy-chology in Clinical Psychology (Specialising in Forensic Psychology) at Monash University. Kaine Grigg would like to acknowledge Professor James Ogloff and members of Windermere Child and Family Services for their general support throughout the research.
ReferencesAnastasi, A., & Urbina, S. (1996). Psychological testing (7th ed.). Upper Saddle River, NJ: Prentice Hall.Browne, M. W., & Cudeck, R. (1993). Alternative ways of assessing model fit. In K. A. Bollen & J. S. Long
(Eds.), Testing structural equation models (pp. 136-162). Newbury Park, CA: SAGE.Chou, T., Asnaani, A., & Hofmann, S. G. (2012). Perception of racial discrimination and psychopathology
across three U.S. ethnic minority groups. Cultural Diversity and Ethnic Minority Psychology, 18(1), 74-81. Cohen, J. (1988). Statistical power analysis for the behav-ioral sciences. (2nd ed.). New York, NY: Lawrence
Erl-baum Associates.Costello, A. B., & Osborne, J. W. (2005). Best practices in exploratory factor analysis: Four recommendations
for get-ting the most from your analysis. Practical Assessment, Research & Evaluation, 10(7), 1-9. DeVellis, R. (2012). Scale development: Theory and appli-cations (3rd ed.). Thousand Oaks, CA: SAGE.Dovidio, J. F. (2001). On the nature of contemporary preju-dice: The third wave. Journal of Social Issues,
57(4), 829-849. Dunn, K. M. (2008). Racism and intolerance: A geographic perspective. Paper presented at the Roundtable
Meeting: On Human Rights and Race Relations, Sydney. Dunn, K. M., Forrest, J., Pe-Pua, R., Hynes, M., & Maeder-Han, K. (2009). Cities of race hatred? The spheres
of racism and anti-racism in contemporary Australian cities. Cosmopolitan Civil Societies: An Interdisciplinary Journal, 1(1), 1-14.
Dunn, K. M., & Geeraert, P. (2003). The geography of “race” and racisms. GeoDate, 16(3), 1-6. Retrieved from www.edassist.com.au
Edelen, M. O., & Reeve, B. B. (2007). Applying item re-sponse theory (IRT) modeling to questionnaire development, evaluation, and refinement. Quality of Life Research, 16, 5-18. doi: 10.1007/s11136-007-9198-0
Embretson, S. E., & Hershberger, S. L. (1999). The new rules of measurement. Hillsdale, NJ: Lawrence Erlbaum Associ-ates.
Grigg - 121McConahay, J. B. (1983). Modern racism and modern dis-crimination: The effects of race, racial attitudes, and con-text on simulated hiring decisions. Personality and Social Psychology Bulletin, 9(4), 551-558. doi: 10.1177/0146167283094004
Neumann, C., Wampler, M., Taylor, J., Blonigen, D. M., & Iacono, W. G. (2011). Stability and invariance of psycho-pathic traits from late adolescence to young adulthood. Journal of Research in Personality, 45(2), 145-152. doi: 10.1016/j.jrp.2010.12.003
Neville, H. A., Lilly, R. L., Lee, R. M., Duran, G., & Browne, L. (2000). Construction and initial validation of the Col-or-Blind Racial Attitudes Scale (CoBRAS). Journal of Counseling Psychology, 47(1), 59-70. doi: 10.1037//0022-0167.47.1.59
Nowlis, S. M., Kahn, B. E., & Dhar, R. (2002). Coping with ambivalence: The effect of removing a neutral option on consumer attitude and preference judgments. Journal of Consumer Research, 29, 319-334. doi: 10.1086/344431
Nunnally, J. C. (1978). Psychometric theory (2nd ed.). New York, NY: McGraw Hill.Paradies, Y. C. (2006). A systematic review of empirical re-search on self-reported racism and health.
International Journal of Epidemiology, 35, 888-901. doi: 10.1093/ije/dyl056Pascoe, E. A., & Richman, L. S. (2009). Perceived discrimi-nation and health: A meta-analytic review.
Psychological Bulletin, 135, 531-554. doi: 10.1037/a0016059.Pedersen, A., Beven, J., Walker, I., & Griffiths, B. (2004). Attitudes toward Indigenous Australians: The role
of empa-thy and guilt. Journal of Community & Applied Social Psychology, 14(4), 233-249. doi: 10.1002/casp.771
Pettigrew, T. F., & Meertens, R. W. (1995). Subtle and bla-tant prejudice in Western Europe. European Journal of So-cial Psychology, 25(1), 57-75. doi: 10.1002/ejsp.2420250106
Phillips, S. T., & Ziller, R. C. (1997). Toward a theory and measure of the nature of nonprejudice. Journal of Person-ality and Social Psychology, 72, 420-434. doi: 10.1037/0022-3514.72.2.420
Polit, D., & Beck, C. T. (2003). Nursing research: Princi-ples and methods (7th ed.). Philadelphia, PA: Lippincott Williams & Wilkins.
Reise, S. P., Ainsworth, A. T., & Haviland, M. G. (2005). Item Response Theory: Fundamentals, applications, and promise in psychological research. Current Directions in Psychological Science, 14(2), 95-101. doi: 10.1111/j.0963-7214.2005.00342.x
Salkind, N. (2006). Exploring research (6th ed.). London, U.K.: Pearson Prentice Hall.Schriesheim, C. A., & Hill, K. D. (1981). Controlling acqui-escence response bias by item reversals: The
effect on ques-tionnaire validity. Educational and Psychological Meas-urement, 41, 1101-1114. doi: 10.1177/001316448104100420
Schweizer, K., & Schreiner, M. (2010). Avoiding the effect of item wording by means of bipolar instead of unipolar items: An application to social optimism. European Journal of Personality, 24(2), 137-150. doi: 10.1002/per.748
Strahan, R., & Gerbasi, K. C. (1972). Short, homogeneous versions of the Marlow-Crowne Social Desirability Scale. Journal of Clinical Psychology, 28(2), 191-193.
Tabachnick, B. G., & Fidell, L. S. (2007). Using multivariate statistics (5th ed.). Boston, MA: Allyn & Bacon.Williams, D. R., Neighbors, H. W., & Jackson, J. S. (2008). Racial/ethnic discrimination and health: Findings
from community studies. American Journal of Public Health, 98(2), 29-37. Retrieved from http://ajph.aphapublications.org/
Willis, G. B. (2005). Cognitive interviewing: A tool for im-proving questionnaire design. Thousand Oaks, CA: SAG